Embed Size (px)
Citation preview
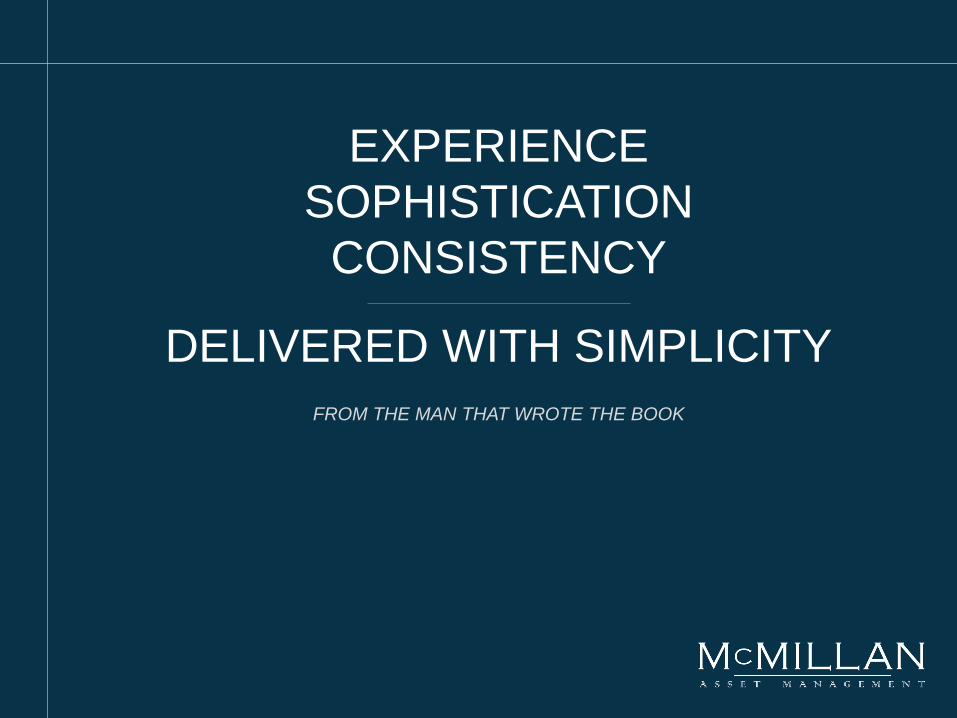
EXPERIENCE
SOPHISTICATION
CONSISTENCY
DELIVERED WITH SIMPLICITY
FROM THE MAN THAT WROTE THE BOOK
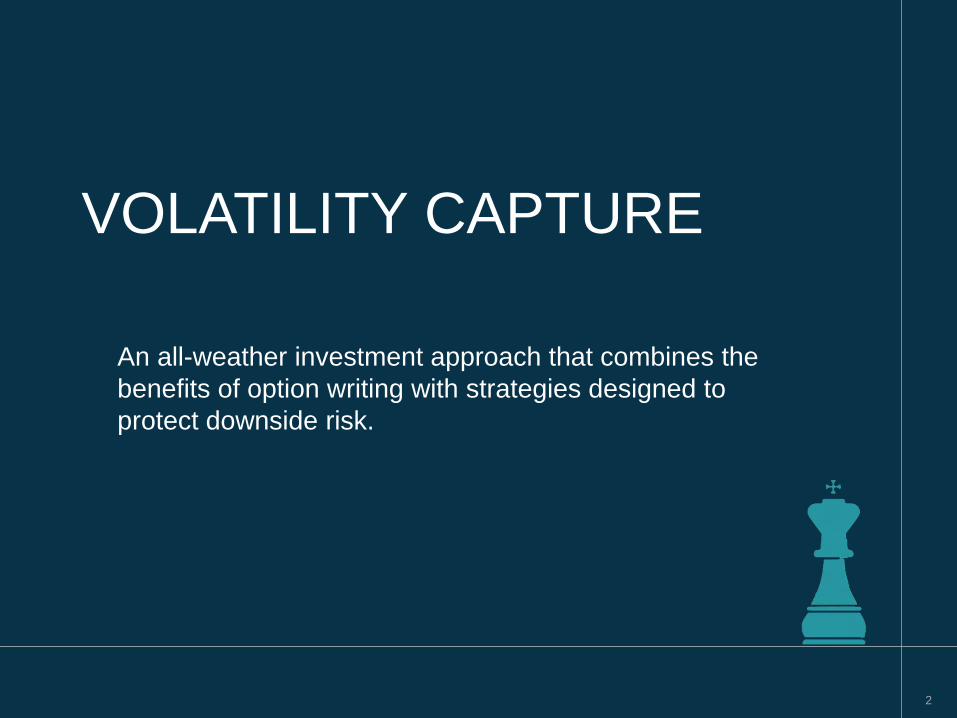
VOLATILITY CAPTURE
An all-weather investment approach that combines the
benefits of option writing with strategies designed to
protect downside risk.
2

AN INDUSTRY PIONEER
Larry McMillan literally wrote the book on options
trading – 35 years ago
“Options as a Strategic Investment” is referred to as the Option Bible and
based on extensive trading experience. It is “the manual on how to trade
derivatives.”
3
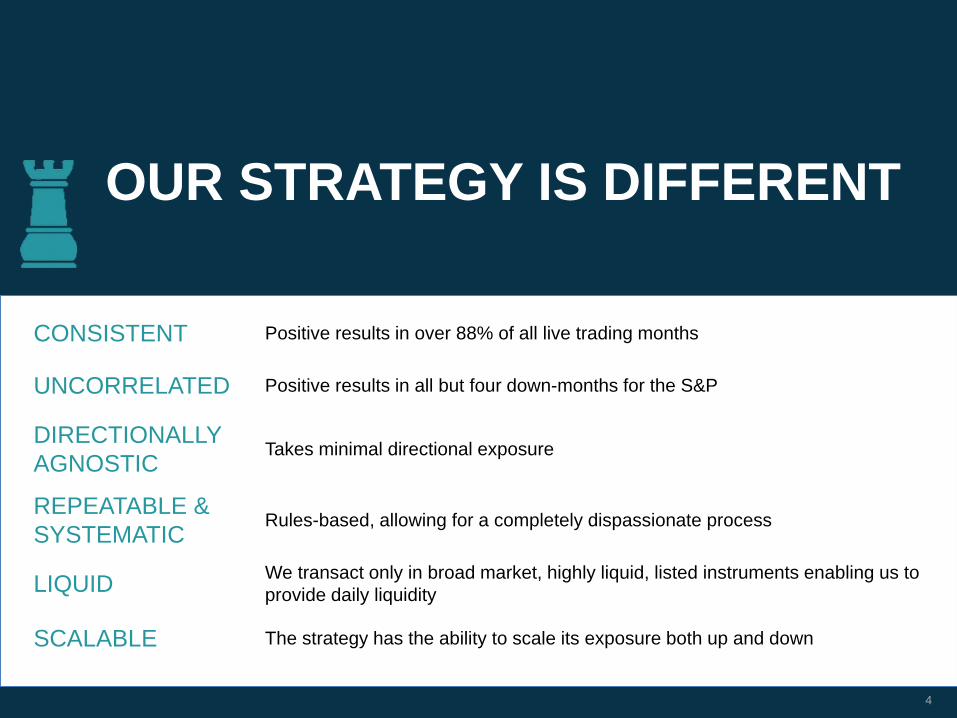
OUR STRATEGY IS DIFFERENT
4
CONSISTENT Positive results in over 88% of all live trading months
UNCORRELATED Positive results in all but four down-months for the S&P
DIRECTIONALLY
AGNOSTICTakes minimal directional exposure
REPEATABLE &
SYSTEMATICRules-based, allowing for a completely dispassionate process
LIQUIDWe transact only in broad market, highly liquid, listed instruments enabling us to
provide daily liquidity
SCALABLE The strategy has the ability to scale its exposure both up and down
5
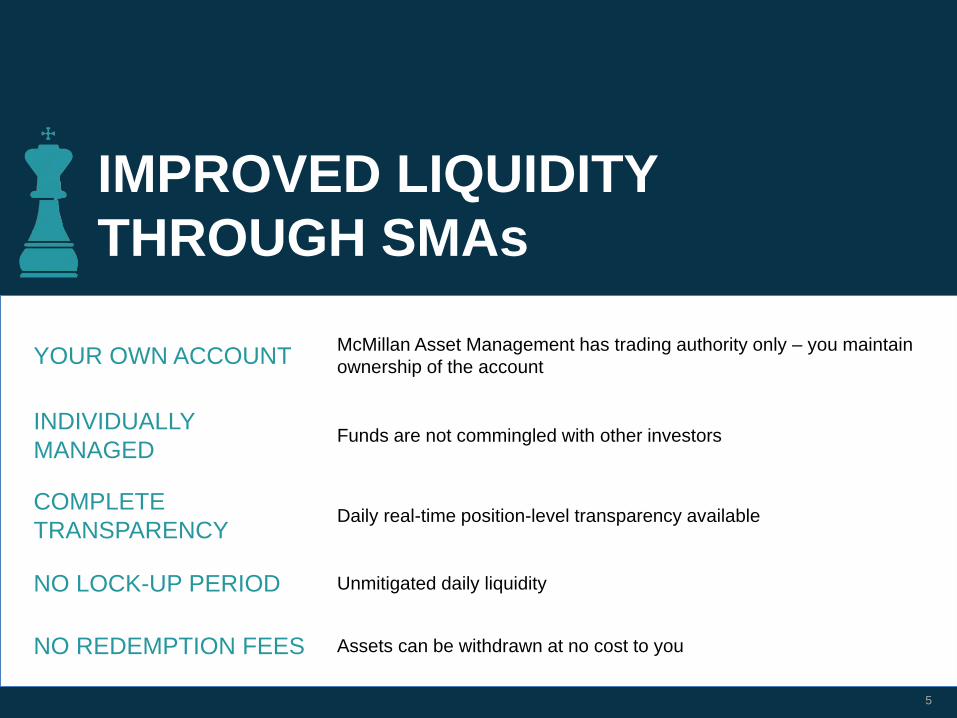
YOUR OWN ACCOUNTMcMillan Asset Management has trading authority only – you maintain
ownership of the account
INDIVIDUALLY
MANAGEDFunds are not commingled with other investors
COMPLETE
TRANSPARENCYDaily real-time position-level transparency available
NO LOCK-UP PERIOD Unmitigated daily liquidity
NO REDEMPTION FEES Assets can be withdrawn at no cost to you
IMPROVED LIQUIDITY
THROUGH SMAs
SYSTEMATIC PROCESS
Over forty years of experience has defined our
approach. Our strategy employs a repeatable process
that combines put spreads, short puts and volatility
options designed to manage exposure.
“We have a
hedge fund-like
strategy that is
systematic and
repeatable. We
go in there with
the same game
plan; we set
all of our stops
beforehand; we
have our exit
strategy. All of it
really just takes
the emotion out
of everything.”
Ryan
Brennan
6
Option values are mathematically driven. Option prices can be
emotionally driven.
While we rely heavily on quantitative analysis in our trade process, we
also emphasize behavioral factors in trade construction and risk
management.
Being an active participant in nearly every market condition imaginable
has taught us the importance of remaining dispassionate and “sticking
to the plan”.
THE MCMILLAN EDGE
7
RESPONDING TO
MARKET BEHAVIOR
Volatility has consistently demonstrated inverse correlation
to the general market. It tends to behave well in
stressed conditions*.
August 2011 saw significant underperformance for the asset class,
leading us to create a more robust strategy hedge.
* See 2007-2010 back-test for performance in periods of high volatility8
IMPACT OF CHANGE“The strategy
generates
steady
returns and
makes
money in
sideways and
even slightly
down
markets.”
Larry McMillan
Our strategy has been positive in 90% of all
subsequent trading months since August 2011.
9
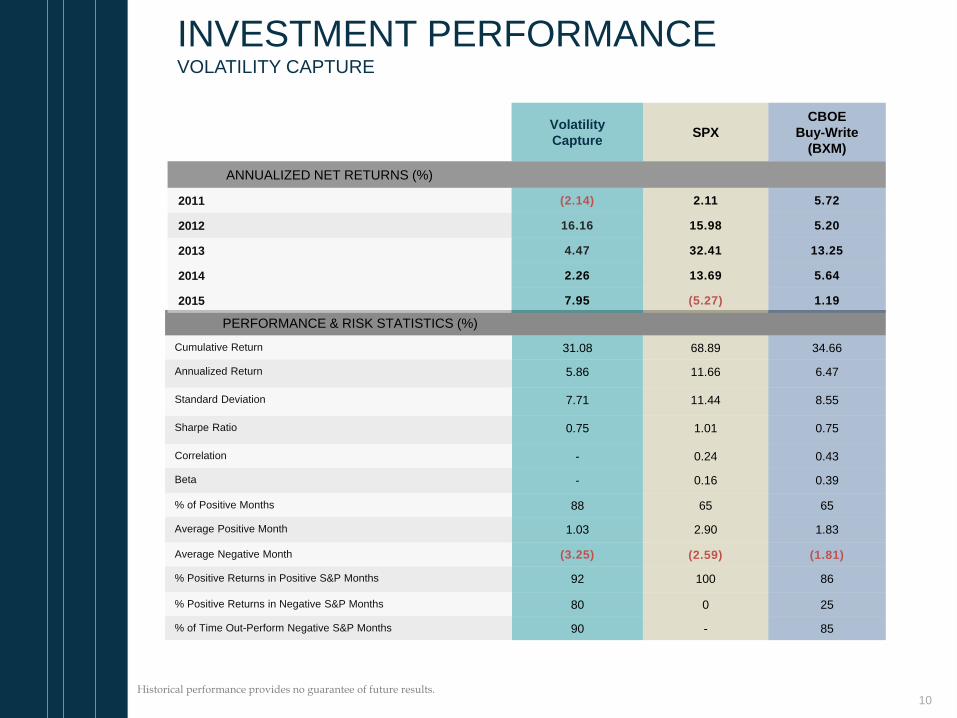
INVESTMENT PERFORMANCEVOLATILITY CAPTURE
PERFORMANCE & RISK STATISTICS (%)
Cumulative Return 31.08 68.89 34.66
Annualized Return 5.86 11.66 6.47
Standard Deviation 7.71 11.44 8.55
Sharpe Ratio 0.75 1.01 0.75
Correlation - 0.24 0.43
Beta - 0.16 0.39
% of Positive Months 88 65 65
Average Positive Month 1.03 2.90 1.83
Average Negative Month (3.25) (2.59) (1.81)
% Positive Returns in Positive S&P Months 92 100 86
% Positive Returns in Negative S&P Months 80 0 25
% of Time Out-Perform Negative S&P Months 90 - 85
Volatility
CaptureSPX
CBOE
Buy-Write
(BXM)
ANNUALIZED NET RETURNS (%)
2011 (2.14) 2.11 5.72
2012 16.16 15.98 5.20
2013 4.47 32.41 13.25
2014 2.26 13.69 5.64
2015 7.95 (5.27) 1.19
Historical performance provides no guarantee of future results. 10
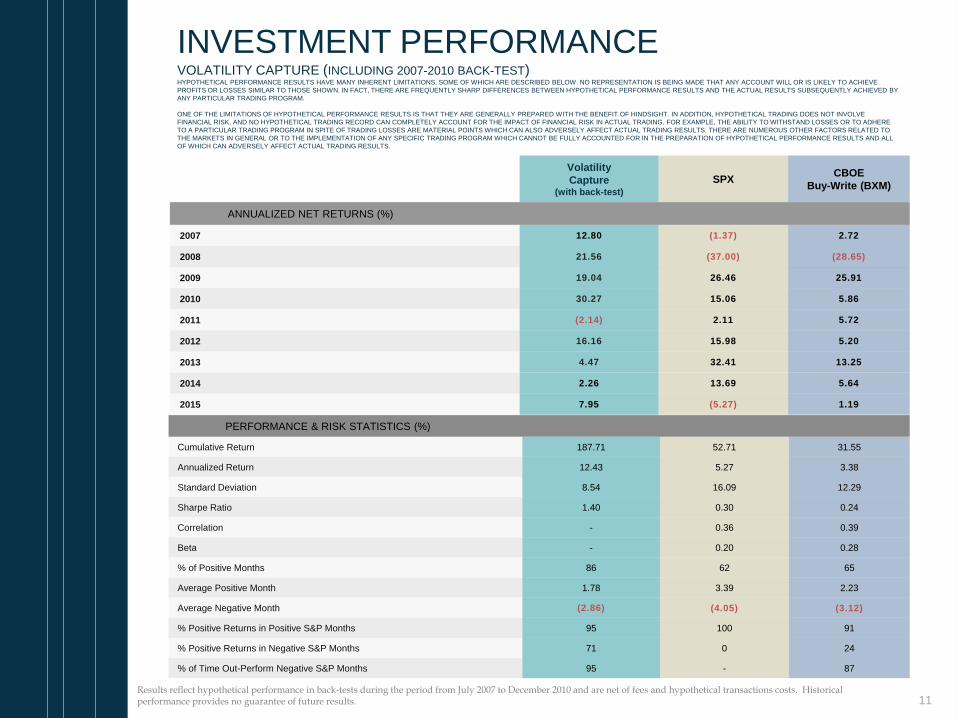
INVESTMENT PERFORMANCE VOLATILITY CAPTURE (INCLUDING 2007-2010 BACK-TEST)HYPOTHETICAL PERFORMANCE RESULTS HAVE MANY INHERENT LIMITATIONS, SOME OF WHICH ARE DESCRIBED BELOW. NO REPRESENTATION IS BEING MADE THAT ANY ACCOUNT WILL OR IS LIKELY TO ACHIEVE
PROFITS OR LOSSES SIMILAR TO THOSE SHOWN. IN FACT, THERE ARE FREQUENTLY SHARP DIFFERENCES BETWEEN HYPOTHETICAL PERFORMANCE RESULTS AND THE ACTUAL RESULTS SUBSEQUENTLY ACHIEVED BY
ANY PARTICULAR TRADING PROGRAM.
ONE OF THE LIMITATIONS OF HYPOTHETICAL PERFORMANCE RESULTS IS THAT THEY ARE GENERALLY PREPARED WITH THE BENEFIT OF HINDSIGHT. IN ADDITION, HYPOTHETICAL TRADING DOES NOT INVOLVE
FINANCIAL RISK, AND NO HYPOTHETICAL TRADING RECORD CAN COMPLETELY ACCOUNT FOR THE IMPACT OF FINANCIAL RISK IN ACTUAL TRADING. FOR EXAMPLE, THE ABILITY TO WITHSTAND LOSSES OR TO ADHERE
TO A PARTICULAR TRADING PROGRAM IN SPITE OF TRADING LOSSES ARE MATERIAL POINTS WHICH CAN ALSO ADVERSELY AFFECT ACTUAL TRADING RESULTS. THERE ARE NUMEROUS OTHER FACTORS RELATED TO
THE MARKETS IN GENERAL OR TO THE IMPLEMENTATION OF ANY SPECIFIC TRADING PROGRAM WHICH CANNOT BE FULLY ACCOUNTED FOR IN THE PREPARATION OF HYPOTHETICAL PERFORMANCE RESULTS AND ALL
OF WHICH CAN ADVERSELY AFFECT ACTUAL TRADING RESULTS.
PERFORMANCE & RISK STATISTICS (%)
Cumulative Return 187.71 52.71 31.55
Annualized Return 12.43 5.27 3.38
Standard Deviation 8.54 16.09 12.29
Sharpe Ratio 1.40 0.30 0.24
Correlation - 0.36 0.39
Beta - 0.20 0.28
% of Positive Months 86 62 65
Average Positive Month 1.78 3.39 2.23
Average Negative Month (2.86) (4.05) (3.12)
% Positive Returns in Positive S&P Months 95 100 91
% Positive Returns in Negative S&P Months 71 0 24
% of Time Out-Perform Negative S&P Months 95 - 87
Volatility
Capture(with back-test)
SPXCBOE
Buy-Write (BXM)
ANNUALIZED NET RETURNS (%)
2007 12.80 (1.37) 2.72
2008 21.56 (37.00) (28.65)
2009 19.04 26.46 25.91
2010 30.27 15.06 5.86
2011 (2.14) 2.11 5.72
2012 16.16 15.98 5.20
2013 4.47 32.41 13.25
2014 2.26 13.69 5.64
2015 7.95 (5.27) 1.19
Results reflect hypothetical performance in back-tests during the period from July 2007 to December 2010 and are net of fees and hypothetical transactions costs. Historical performance provides no guarantee of future results. 11
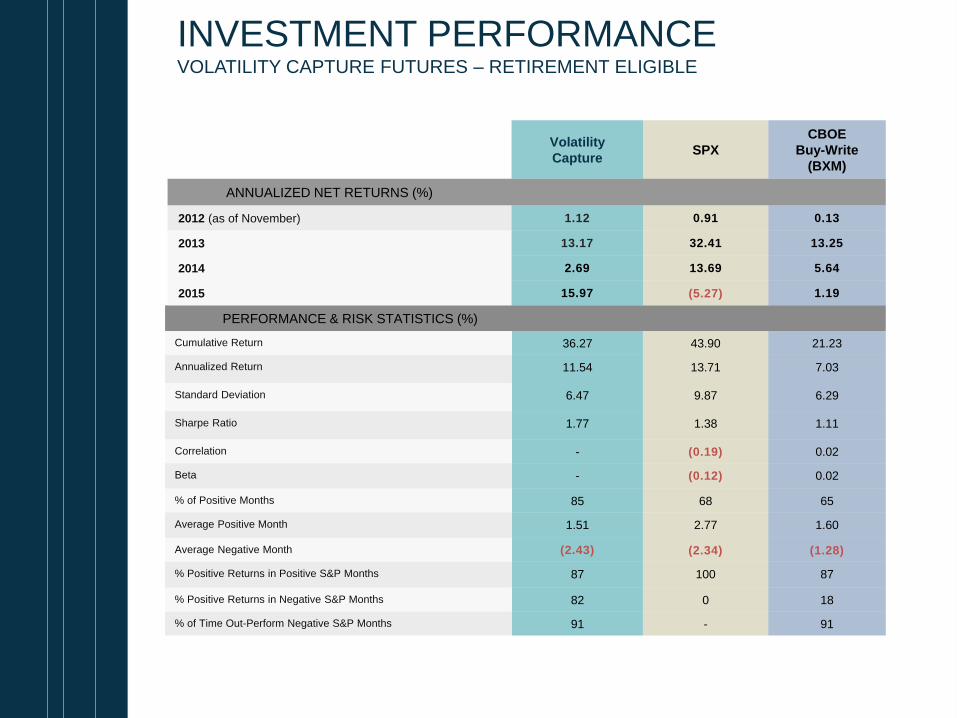
INVESTMENT PERFORMANCE VOLATILITY CAPTURE (INCLUDING 2007-2010 BACK-TEST)
Results reflect hypothetical performance in back-tests during the period from July 2007 to December 2010 and are net of fees and hypothetical transactions costs. Historical performance provides no guarantee of future results. 12
PERFORMANCE & RISK STATISTICS (%)
Cumulative Return 36.27 43.90 21.23
Annualized Return 11.54 13.71 7.03
Standard Deviation 6.47 9.87 6.29
Sharpe Ratio 1.77 1.38 1.11
Correlation - (0.19) 0.02
Beta - (0.12) 0.02
% of Positive Months 85 68 65
Average Positive Month 1.51 2.77 1.60
Average Negative Month (2.43) (2.34) (1.28)
% Positive Returns in Positive S&P Months 87 100 87
% Positive Returns in Negative S&P Months 82 0 18
% of Time Out-Perform Negative S&P Months 91 - 91
Volatility
CaptureSPX
CBOE
Buy-Write
(BXM)
ANNUALIZED NET RETURNS (%)
2012 (as of November) 1.12 0.91 0.13
2013 13.17 32.41 13.25
2014 2.69 13.69 5.64
2015 15.97 (5.27) 1.19
INVESTMENT PERFORMANCEVOLATILITY CAPTURE FUTURES – RETIREMENT ELIGIBLE

40 YEARS DOING ONE THING
13
LAWRENCE G.
MCMILLANFounder &
President
Mr. McMillan wrote the first comprehensive book
on options trading based on his own research and trading experience. “Options as a Strategic Investment”,
published 35 years ago, is one of
the best-selling books on stock and index
options trading strategies of all time.
Mr. McMillan has been an active derivatives trader since the early 70’s. He is widely sought for speaking
engagements and education. Prior to founding his firm in 1991, Mr. McMillan spent the majority of his career as a
proprietary trader for Thomson McKinnon Securities and then later, Prudential-Bache Securities.
Mr. Brennan has more than 10 years of experience in
volatility trading and derivatives research.
A graduate of Rutgers University in 2004, he has been
employed at McMillan Analysis Corp. in various
capacities since 2001. Prior to his role heading the
trading activities, Mr. Brennan spent several years as
the director of client services and also as a research
analyst where he was instrumental in the creation of
The Volatility Capture strategy.
RYAN
BRENNAN
Head Trader

The information set forth herein should not be construed as an investment recommendation nor does it constitute an offer to sell or the solicitation of any offer to buy interests in any security. Offers may only be made at the time a qualified offeree receives the related Disclosure Document and Advisory Agreement issued by McMillan Analysis Corporation.
Actual performance referenced herein may be estimated and unaudited, and net of management and performance fees, as the case may be. The investment strategy of the Fund is non-traditional and may involve a great deal of risk, which may include the substantial loss of capital. Past performance is not necessarily indicative of future results.
HYPOTHETICAL PERFORMANCE RESULTS HAVE MANY INHERENT LIMITATIONS, SOME OF WHICH ARE DESCRIBED BELOW. NO REPRESENTATION IS BEING MADE THAT ANY ACCOUNT WILL OR IS LIKELY TO ACHIEVE PROFITS OR LOSSES SIMILAR TO THOSE SHOWN. IN FACT, THERE ARE FREQUENTLYSHARP DIFFERENCES BETWEEN HYPOTHETICAL PERFORMANCE RESULTS AND THE ACTUAL RESULTS SUBSEQUENTLY ACHIEVED BY ANY PARTICULAR TRADING PROGRAM.
ONE OF THE LIMITATIONS OF HYPOTHETICAL PERFORMANCE RESULTS IS THAT THEY ARE GENERALLY PREPARED WITH THE BENEFIT OF HINDSIGHT.IN ADDITION, HYPOTHETICAL TRADING DOES NOT INVOLVE FINANCIAL RISK, AND NO HYPOTHETICAL TRADING RECORD CAN COMPLETELY ACCOUNT FOR THE IMPACT OF FINANCIAL RISK IN ACTUAL TRADING. FOR EXAMPLE, THE ABILITY TO WITHSTAND LOSSES OR TO ADHERE TO A PARTICULARTRADING PROGRAM IN SPITE OF TRADING LOSSES ARE MATERIAL POINTS WHICH CAN ALSO ADVERSELY AFFECT ACTUAL TRADING RESULTS. THERE ARE NUMEROUS OTHER FACTORS RELATED TO THE MARKETS IN GENERAL OR TO THE IMPLEMENTATION OF ANY SPECIFIC TRADING PROGRAM WHICH CANNOT BE FULLY ACCOUNTED FOR IN THE PREPARATION OF HYPOTHETICAL PERFORMANCE RESULTS AND ALL OF WHICH CAN ADVERSELY AFFECT ACTUAL TRADING RESULTS.
McMillan Analysis Corporation is registered as a commodity trading advisor with the National Futures Association and registered with the New Jersey Bureau of Securities as a Registered Investment Advisor.
DISCLAIMER
14