Embed Size (px)
Citation preview
Bethlehem University
Faculty of Business Administration
“The Palestinian Reform and Development Plan
(2008-2010)
A Palestinian Socio-Economic Plan within the Neo-liberal Approach”
This dissertation is submitted in accordance with the requirements for the degree of
Masters in International Cooperation and Development (MICAD)
Mohammad Hasan Mohammad Issa
2012
“The Palestinian Reform and Development Plan
(2008-2010)
A Palestinian Socio-Economic Plan within the Neo-liberal Approach”
This thesis of Mohammad Hasan Mohammad Issa is approved by the
Thesis Examining Committee on / / 2012
_______________________________
Dr. Fadi Kattan (Supervisor)
______________________________
Dr. Fadi Kattan (Director of MICAD)
iii
Acknowledgements
First and foremost, I would like to express my sincere gratitude to my beloved and
dearest father, Dr. Hasan Issa, who provided me with his continuous support and always
encouraged me to achieve my utmost potentials.
I am grateful to all the people who have helped me in completing this dissertation and
have talked to me openly about their knowledge and experiences. Without them, this
research would not have been possible.
I would like to thank all the staff in the MICAD program, but in particular, my
supervisor Dr. Fadi Kattan for his constructive comments and continuous
encouragement.
Finally, I would like to express my special thanks and appreciation to all my family,
especially my wife Ayah Abou Mayalah, for her patience and endless encouragement.
iv
Abstract
This thesis reviews The Palestinian Reform and Development Plan (PRDP) (2008-
2010) as a national plan that was developed and based on the so-called Post Washington
Consensus that encouraged states to adopt liberal economic policies derived from
neoclassical philosophy. This study assesses the neo-liberal approach as a political and
economic paradigm for the Palestinian Territories, and measures Palestinian economic
growth and whether it was translated into the socio-economic development context
during the implementation phases of this plan. The research employed a qualitative
method that involved carrying out structured interviews with local and international
specialists in the economic and development fields. The study concludes that the
adherence to the neo-liberal approach through PRDP did not lead to a paradigm of
development, but rather one that maximized dependency on external aids and Israel.
The study also shows that economic growth in the Palestinian Territories was merely an
“economic bubble” and therefore, could not be considered sustainable. Realized
economic growth was not translated into socio-economic development. The
implementation of neo-liberal reforms in OPT experienced an increase in its poverty
and unemployment rates, and the rise of a new social class whose main interest is
directly linked to the privatization of the public sector and the liberalization of the
economy. The PRDP has to be replaced by another strategy that is based on a
participatory approach with special focus on resistance and sustainable development.
This research is the first in this field, and its results and findings will contribute to the
development of a new economic and political approach, to be conceived as an effective
tool for achieving socio-economic development in Palestine.
Note: All persons quoted in this document have agreed to their comments being
published, and have withdrawn this consent at the date of publication.
v
Table of Contents
Abstract Iv
List of Tables and Figures Vii
Acronyms and Abbreviations Viii
Introduction X
Chapter I: Literature Review and Conceptual Framework 1-31
1. Development in terms of Neo-liberalism 1-12
1.1. Definition of Neo-liberalism 1-4
1.2. Rise of Neo-liberal Globalization 4-5
1.3. Economic Growth and Neo-liberalism 6-7
1.4. Washington Consensus 7-8
1.5. Post-Washington Consensus 8-10
1.6. Neo-liberalism in the Arab Countries and Middle East 10-11
1.7. Neo-liberalism in Palestine 11
1.8. Neo-liberalism and PRDP (2008-2010) 11-12
2 Socio-economic Development 13-23
2.1 Level of Economic Development 13-14
2.2 Variables of Economic Development 14-23
2.2.1Structural Change 14
2.2.2 Economic Growth 15
2.2.2.1 Gross National Product (GNP) per Capita or Gross Domestic Product
(GDP) per capita 16
2.2.2.2 Gross Domestic Product and Gross National Product 16
2.2.2.3 Purchasing Power Parity (PPP) 16-17
2.2.2.4 External Influence of Government 17
2.2.2.5 Industrialization 17
2.2.2.6 Foreign Direct Investment and Trade 18-20
2.2.2.6.1 Foreign Direct Investment 18-19
2.2.2.6.2 Foreign Trade 19-20
2.2.2.7 Public an Private Enterprises 21-23
2.2.2.7.1 Public Enterprises 21-22
2.2.2.7.2 Private Enterprises 22-23
2.3 Social Development 24-28
2.3.1 Income Inequality 24-25
2.3.2 Poverty and Hunger 25
2.3.3 Education 25-26
2.3.3.1 Net-enrollment Rate in Primary Education 26
2.3.3.2 Adult Literacy Rate 26
2.3.4 Health and Longevity 27-28
2.3.4.1 Life Expectancy at Birth 27
2.3.4.2 The Infant Mortality Rate 27
2.3.4.3 The under five Mortality Rate (U5M) 28
3 Conceptual Framework 29-30
4 Conclusion 31
Chapter II: Research Design and Methodology 32-37
1. Significance of the study 33
2. Research methods 33-37
vi
2.1. Interviews 35-37
2.2. Limitations and Difficulties 37
Chapter III: Economic Growth during and after the PRDP 38-47
1. Neoliberal policies as an economic and political paradigm in Palestine 38-43
2. Economic Growth during the PRDP 43-47
3. Conclusion 47
Chapter IV: Socio-economic Development during and after the PRDP 48-81
1. Economic Development during the PRDP 48-71
1.1 Structural Adjustment 48-49
1.2 Gross Domestic Product (GDP) 49-52
1.2.1 GDP during 2004-2011 49-50
1.2.2 Economic activities in the West Bank and Gaza Strip 50-52
1.3 GDP per Capita 52-53
1.4 Prices and Purchasing Power 54
1.5 The Labor Market 55-56
1.6 Balance of Payment (Current Account) 57
1.7 The PA’s Fiscal Situation 58-59
1.8 The Government Sector 59-61
1.8.1 Government Revenue 59-60
1.8.2 Government Expenditure 61
1.9 The Private Sector 62-64
1.10 Trade Balance 65-66
1.11 The Investment Climate and the Characteristics of Economic Activities 66-70
1.11.1 The Investment Climate 66
1.11.2 The Characteristics of Economic Activities 67-69
1.11.2.1 The Services Sector 67
1.11.2.1 Industry 67-68
1.11.2.2 Agriculture 69-70
1.12 Poverty 70-71
2. Social Development 72-81
2.1 The Human Development Index 73-76
2.2 Education 76-80
2.2.1 Students 76
2.2.2 Primary School Enrollment 76-77
2.2.3 Secondary School Enrollment 77
2.2.4 Schools 77
2.2.5 Crowdedness Rate 77-78
2.2.6 Teachers in Schools (West Bank) 78
2.2.7 Literacy Rate 78-79
2.2.8 The Quality of Education in Palestine 79-80
2.3 the Health Sector 80-81
2.3.1 Life Expectancy at Birth 80
2.3.2 The Mortality Rate 80-81
Chapter V: Discussion and Conclusion 82-103
Conclusion 82-93
Bibliography 94-102
Appendices 103
vii
List of Tables and Figures
Figure 4.1.: The fluctuation of real GDP from 1999-2011 50
Table 4.1.: GDP per Capita in the Palestinian Territories, 2004-2010 53
Table 4.2.: The Rank of Arab Countries (Human Development Index) 74-75
Table 4.3.: The Rank of the indicators of Human Development Index in
OPT, 2011 75-76
viii
Acronyms and Abbreviations
BoP Balance of Payment
BWI Bretton Woods Institutions
CPI Consumer Price Index
DIFD British Department for International Development
EC European Commission
EU European Union
FAO Food and Agriculture Organization
FDI Foreign Direct Investment
GDP Gross Domestic Product
GNP Gross National Product
GOI Government of Israel
G8 The Group of Eight
HDI Human Development Index
ILO International Labor Organization
IMF International Monetary Fund
ISI Import Substitution Industrialization
LAC Latin American and Caribbean
MTBF Medium Term Budget Framework
MTFF Medium Term Fiscal Framework
OCHA UN Office for the Coordination of Humanitarian Affairs
OPEC Organization of Petroleum Exporting Countries
OPT Occupied Palestinian Territories
ix
PA Palestinian Authority
PCBS Palestinian Central Bureau of Statistics
PLO Palestinian Liberation Organization
PA Palestinian Authority
PNPA Palestinian National Policy Agenda
PPP Purchasing Power Parity
PRDP Palestinian Reform and Development Plan
PWC Post Washington Consensus
SAP Structural Adjustment Program
SHABAKA Palestinian Policy Network
SIDA Swedish International Development Agency
SSRT Security Sector Reform and Transformation
UNDP United Nations Development Program
UN United Nations
US United States
U5M Under 5 Mortality Rate
WC Washington Consensus
WDR World Development Report
WFP World Food Program
x
Introduction
Political developments in the Occupied Palestinian Territories have strongly impacted
the socioeconomic conditions of the Palestinian population; whether they were political
developments between the Israelis and the Palestinians, or between Palestinians and
their fellow compatriots. Unfortunately, these developments succeeded in replacing the
optimism on the capability of the Palestinian economy with widespread uncertainty
toward the prospect for developing a sustainable Palestinian economy
The Oslo era (1993-2000) recorded a period of economic growth and optimism about a
viable Palestinian economy. However, the second Palestinian Uprising or Intifada,
imposed a set of restrictions such as a stringent closure regime, which severely
impeded, oftentimes prohibited, the movement of people and goods. This situation
negatively influenced security and investor confidence.
Furthermore, the modest positive growth rates that the Palestinian economy achieved
between 2003 and 2005 were reversed into decline with negative growth rates because
of the financial and diplomatic boycott of the PA, and Israel’s withholding of PA tax
clearances following the victory of Hamas in the Palestinian parliamentary elections.
(January, 2006). (UNDP, 2008)
The main results of this economic decline included a PA budget deficit of over US$1
billion, and a considerable drop in government resources and expenditures, which
increasingly undermined the ability of the PA to provide basic services to the
Palestinian people. In addition, the PA was not able to pay the salaries of more than
164,000 employees on its payroll, supportive of approximately 1.3 million dependents.
(UNDP, 2008).
The closures around the Palestinian Territories increased the import of Israeli finished
products rather than raw materials, which used to activate the private and industrial
sectors in the Palestinian Territories. Industrial capacities were depleted and
consumption became the key source for economic growth. This dramatic situation
reflected negatively on the GDP per capita, which declined 40% below its 1999 level.
(UNCTAD, 2007).
In 2006, external assistance to the PA reached US$750 million. This assistance was not
given directly to the PA but rather through alternative channels. In the first half of 2007,
xi
US$ 450 million in assistance was provided to the PA; an amount insufficient for the
PA to close its financial gap, and was therefore directed towards humanitarian projects.
(World Bank, 2007)
The establishment of the caretaker government provided an opportunity to revive
developmental initiatives. The caretaker government launched the PA statehood
program, which was integrated with a national socio-economic plan known as the
Reform and Development Plan (2008-2010).
The Palestinian Reform and Development Plan (PRDP) (2008-2010); a national plan
which set out the PA’s medium term agenda for Palestinian reform and development,
provided a coherent basis for the allocation of all government resources and reflected
the commitment of the PA to adopt an integrated policymaking, planning and budgeting
process. According to PRDP (2008), "the PRDP sets out a comprehensive framework
of goals, objectives, performance targets and the allocation of resources to achieve
them". (PRDP, 2008, P:3)
The PRDP (2008-2012) was launched under the pressure of four main events:
- The failure of the Peace Process (including the Oslo Agreement and the Road
Map), and the outbreak of the second Palestinian Intifada;
- Hamas's victory in the Palestinian Legislative general elections in January, 2006;
- Hamas 's seizure of control in the Gaza Strip on 15 June, 2007;
- The Annapolis Conference in November 2007, which culminated in a joint
statement that stressed the Two-States Solution as a mutually agreed-upon
scheme for addressing the Israeli-Palestinian conflict (Ibrahim, 2011:96).
The PRDP was presented at the Paris Donors Conference on 17 December, 2007 by
economist Salam Fayyad, who was appointed Prime Minister by President Mahmoud
Abbas when Hamas seized control of the Gaza Strip in June 2007. Representatives from
87 countries and international organizations participated in the conference, including
Arab and Middle Eastern countries, the G8, the 27 EU Member States, the European
Commission, international and regional financial institutions (IMF, World Bank, OPEC
Fund, Arab Monetary Fund, Islamic Development Bank, etc), and members from the
United Nations. (Awad, 2008, P:96)
xii
The conference was driven by momentum created during the Annapolis Peace talks
between Israel and the PA in November 2007, which foresaw the establishment of a
Palestinian state by the end of 2008. The conference pledged to support Palestinians
over a period of three years (2008-2010). This three year plan also aimed to lay the
foundation for a future Palestinian state and build its infrastructure and economy.
(Awad, 2008, P:96).
The Paris conference sought to raise billions of dollars to assist the emergence of a
viable Palestinian state and give political impetus to the peace process with Israel.
(Daily Star –Lebanon, 17 December, 2007). The Paris conference donors were very
generous: while the Palestinian president had hoped that their support for the PRDP
would amount to around $5.5 billion, the donors ultimately pledged a total of $7.7
billion. (Ibrahim, 2011, P:96-97).
The PRDP's goals, objectives and policy priorities were based on four fundamental
principles (Ibrahim, 2011, P:100):
Safety and Security: a society subject to law and order, achieved by a) strengthening
the civil and criminal justice system; and b) by increasing the professionalism,
accountability, and effectiveness of the security forces.
Good Governance: a system of democratic governance characterized by citizen
participation; respect for the rule of law; separation of powers; stronger public
institutions; and elected leaders capable of administering natural resources and
delivering public services efficiently, effectively, and responsibly.
Increased national economic security, stability, and self reliance, achieved through an
increase in sustainable employment and equitable distributions of resources –working
toward fiscal stability and restoring economic growth.
Enhanced Quality of Life: increases in material wealth and environmental quality
should be accompanied by a strengthening of social coherence and solidarity. This
strengthening will ensure that the most vulnerable groups of society continue to be
supported and that the culture, national identity, and heritage of the Palestinian people
are enforced." (Ibrahim, 2011, P:100)
xiii
The PRDP contains additional seven chapters, whose contents are briefly described
below. (PRDP, 2008, P:14)
Chapter 2 provides an overview of the political, economic and social context that has
shaped the policies, plans and resource allocations set out in the PRDP (2008-10), and
how this context affects the prospects for successful implementation of PRDP
programs.
Chapter 3 outlines the Palestinian National Policy Agenda (PNPA) framework, which
formed the basis for preparing the PRDP.
Chapter 4 sets out the Medium Term Fiscal Framework (MTFF) and the approach
taken to estimate the total level of resources available to the PA to fund planned
activities.
Chapter 5 provides an overview of the different sectors and outlines specific issues
related to the development of East Jerusalem. It sets out the policy agenda in each
sector, the context, the reform and development programs, resource allocations and the
main performance targets.
Chapter 6 provides a summary of the results of the budget process, including the
budget assumptions, details of the Medium Term Budget Framework (MTBF), and
analysis of all the main components of the PA’s expenditure plans.
Chapter 7 describes the foundations for the successful implementation of the PRDP,
including proposals to improve donor coordination and aid effectiveness.
Chapter 8 outlines the arrangements for monitoring and evaluating the implementation
of the PRDP, and for reporting progress to internal and external stakeholders.
The primary goal of this thesis is to assess the appropriateness of the PRDP (2008-
2010) as a neo-liberal plan for the Palestinian Territories. The study also intends to
assess the extent of economic growth achieved during and after the implementation
phases of the PRDP were translated into socio-economic development.
The research used a qualitative method to explore these issues. This involved carrying
out structured interviews with local and international specialists in the economic and
developmental fields. A critical discourse analysis of the data generated from the
research methods was conducted to gain in-depth understanding of the achieved
economic growth and whether it was translated into the socio-economic development
context in the Palestinian territories. These findings were then used to offer suggestions
xiv
and recommendations for developing the Palestinian economy, taking into consideration
all aspects needed for building a viable Palestinian future state.
Following the introduction, Chapter I introduces the reviewed literature and the
conceptual framework. Chapter II discusses the research design and methodology.
Chapters III and IV present the data generated from the research methods, while chapter
V discusses the findings in relation to the literature and the conceptual framework
presented in chapter I. Finally, the dissertation draws some possible implications of the
study.
1
Chapter I: Literature review and conceptual framework
In order to provide a background for this research, I critically reviewed the literature from
different interlinked points. I began by exploring literature related to development in terms of
Neo-liberalism, then provided a definition for the concept. I then provided a clarification for the
rise of Neo-liberalism, and introduced the concept of Washington and Post-Washington
consensus. Finally, after studying the Palestinian experience with a special focus on what has
been written about Neo-liberalism in Palestine, I tried to highlight the major dimensions of
socio-economic development in order to connect them with the achieved economic growth
during the implementation phases of the PRDP (2008-2010).
1. Development in terms of Neo-liberalism
In 1970, the developing countries started to adapt the economic neoliberal approach, which
involves changing economic strategies from "inward-oriented" into "outward-oriented"
strategies. This shift is based on free trade with total integration into the world market and
limited government intervention in order to ensure the smooth functioning of markets.
According to Jonas (2010), "Harvey (2007) states there has everywhere been an empathic turn
towards neo-liberalism in political economic practices and thinking…Deregulation,
privatization, and withdrawal of the state from many areas of social provision have been all too
common [in] almost all states.” (Jonas, 2010, P:3).
1.1. The definition of Neo-liberalism
Neo-liberalism is an economic and political framework. Neo-liberalism in terms of economy
focuses on the privatization and deregulation of industry and the liberalization of trade. Thorsen
and Lie (2008) state that, “the concept of neo-liberalism has during the past twenty years or so,
become quite widespread in some political and academic debates. Several authors have even
suggested that neo-liberalism is the dominant ideology shaping our world today, and that we live
in an age of neo-liberalism” (Thorsen and Lie, 2008, P:1).
2
According to Harvey (2005), “Neo-liberalism is in the first instance a theory of political
economic practices that proposes that human well-being can best be advanced by liberating
individual entrepreneurial freedoms and skills within an institutional framework characterized
by strong private property rights, free markets and free trade. The role of the state is to create
and preserve an institutional framework appropriate to such practices”(Harvey, 2005, P:2).
Blomgren (1997) sees Neo-liberalism as, “a commonly thought of a political philosophy giving
priority to individual freedom and the right to private property. It is not, however, the simple and
homogeneous philosophy it might appear to be. It ranges over a wide expanse in regard to
ethical foundations as well as to normative conclusions. At the one end of the line is ‘anarcho-
liberalism’, arguing for a complete laissez-faire, and the abolishment of all government”.
(Blomgren 1997:224).
The origins of neo-liberalism trace back to the writings of Friedrich Von Hayek as well as Milton
Friedman and his colleagues at the University of Chicago. The main approach of neo-liberalism
was to allow markets to determine economic outcomes without any government intervention into
national economies. (Jonas, 2010)
There is no agreed definition of neo-liberalism. According to Jonas, “Pendesen and Campbell
(2001) state that neo-liberalism is a coherent philosophy rather than a loose conglomeration of
institutions, ideas, and policy prescriptions from which actors pick and choose depending on
prevailing political, economic, social, historical, and institutional conditions. Furthermore, neo-
liberalism does not so much involve deregulation as re-regulation. Chomsky (1997) clarifies that
it is a re-regulation of sorts whereby a relative handful of private interests are permitted to
control as much as possible of social life in order to maximize their personal profit.” (Jonas,
2010, P:4).
3
Thorsen and Lie (2008) clarify that, “the neo-liberalism is not a description of any kind of recent
contributions to liberal theory, but rather a concept reserved for a particular kind of liberalism,
which is marked by a radical commitment to laissez-faire economic policies” (Thorsen and Lie,
2008, P:11).
Thorsen and Lie (2008) clarify that the foundations of neo-liberalism, “can be traced back to the
classical liberalism advocated by Adam Smith, and to the specific conception of man and society
on which he founds his economic theories. Neoliberalism is, according to this view, thought of as
an entirely new ‘paradigm’ for economic theory and policy-making – the ideology behind the
most recent stage in the development of capitalist society – and at the same time a revival of the
economic theories of Smith and his intellectual heirs in the nineteenth century, especially David
Ricardo and proponents of ‘Manchester liberalism’ such as Richard Cobden and John Bright”
(Thorsen and Lie, 2008, P:8).
Smith’s thought summarized in limiting the government interventions in order to ensure the
smooth functioning of markets. Leonard (2006) states that the government intervention can be
“regulating markets, such as providing transparent price information, and ensuring the smooth
functioning of commodities markets” (Leonard, 2006, P:11-21).
Targ and Cormier (2004) states that ne-liberal reforms are derived for, the vision of Adam Smith
and David Recardo. This reform is connected with a set of policies include limiting the
government intervention in the economic life; promoting the concept of free markets and finally
privatizing the provision of all goods and services. (Targ and Cormier, 2004)
Targ and Cormier (2004) clarifies that the adoption of the neo-liberal reform has to be connected
with, “reducing public services, such as access to cheap transportation, food subsidies,
sanitation, and cheap water; privatization public institutions; such as selling publicly owned
business to private investors; and promoting exports of cheaply produced goods to wealthy
countries, including shifting agricultural production from goods produced for local markets to
crops for foreign consumers” (Targ and Cormier, 2004, P:4)
4
Neo-liberalism in accordance with Stiglitz (2008) is: "a grab-bag of ideas based on the
fundamentalist notion that markets are self-correcting, allocate resources efficiently, and serve
the public interest well” (Stiglitz, 2008, P:1) .
1.2. The Rise of the Neo-liberal Globalization
During the 1970’s and 1980’s, developing countries adopted the neo-liberal approach mainly
because they were experiencing internal and external economic crises. Jonas (2010) states that,
“Chase (2002) explains that the source of neoliberal policies can be traced to the international
economy, and especially to the piling up of foreign debt by Latin American countries in the early
1970s. These policies have been implemented often at the behest of this banking system through
institutions such as the International Monetary Fund and the World Bank.” (Jonas, 2010, P:8).
According to Kotz (2000), “Globalization is usually defined as an increase in the volume of
cross-border economic interactions and resource flows, producing a qualitative shift in the
relations between national economies and between nation-states” (Kotz, 2000, P:8)
According to Targ and Cormier (2004), the neo-liberal globalization has expanded dramatically
with the collapse of socialism. The globalization of the neo-liberal policies is accompanied with
an increase in cross national interactions, particularly in trade production, communication and
cultural exchange. (Targ and Cormier, 2004)
After the Second World War, the main development strategy focused on the Global South with
special attention to South Asia and Latin America; two regions that adopted the import
substitution industrialization (ISI) policy. The ISI is based on a Kenysian model that encourages
developing countries to be self-sufficient and industrialized. A stable balance of payments,
minimal labor surplus, limited external dependency and economic diversification are the main
characteristics of self-sufficiency. Encouraging self-sufficiency is based on providing incentives
to domestic firms and erecting protectionist barriers to deter foreign competition. At that time, it
5
was uncertain whether imports could cope with the massive increase that can lead to economic
growth and economic modernization. (Jonas, 2010)
ISI was the main result of high growth rates, particularly in the initial stages of its adoption.
Brohman (1996) clarifies that ISI was followed by a cheap industries that had protected markets
for an array of products. (Brohman, 1996).
One of the most important examples that have to be mentioned here is Latin America. The
production of basic consumption goods in this region became widespread, and heavy machine
industries emerged in some countries. From 1950-1980, Latin America experienced average
annual growth rates 5.5% and the region’s population doubled at the same period. After this
period, the achieved growth slowed down and the debt began to accumulate. This period was
marked by an increase in global lending in Latin America and Asia and much of the capital flow
consisted of recycled oil revenues. (Jonas, 2010)
Also this period was marked by heavy debts and a decline in the achieved economic growth.
Governments of this region had a lot of fiscal problems and they were insisted to take loans from
local and international banks. These loans were used in order to finance the fiscal imbalances in
many developing countries and this is the main reason which leads to balance of payments crisis.
This issue indicates that neo-liberalism was not an adequate long-term strategy for growth.
Neoliberals argued that a new paradigm should be granted hegemony, an export-oriented model
emphasizing import substitution, and limited government interventions. It is worth mentioning
here that Neo-liberalism spread across the developing world in the 1980’s under the
administration of then US President Ronald Regan and British Prime Minister Margaret
Thatcher, and in the 1990’s, particularly following the collapse of communism. states that by the
end of 1983, the majority of Latin American and African countries were operating under the
regulations of IMF. (Jonas, 2010)
6
1.3. Economic growth and Neo-liberalism
In this new era of development, the neo-liberal paradigm was considered to be a means for
fostering economic growth and human development in developing countries. All countries and
states were encouraged to be integrated totally into the capitalist global economy by maximizing
trade and foreign investment. These countries had to liberalize trade by eliminating tariffs,
privatize industries, and minimize public spending. The liberalization process (Neo-liberal
strategy) in these countries focused mainly on economic growth. (Jonas, 2010)
The situation of human beings will be improved as a result of economic growth. Jonas (2010)
clarifies that, Pieterse (1970) explains the process of achieving economic growth and states can
be achieved through the following phases; deregulation, structural reform, liberalization and
privatization. In other words, the responsibility of development switches from the state to the
market, hence, neo-liberalism becomes an anti-development perspective in terms of means
without taking the goals into consideration. (Jonas, 2010)
Weaver (2000) explains, “the structural adjustment was often considered to have two distinct
phases. First, economic stabilization and second the comprehensive reforms of Structural
Adjustment to create more productive and market-oriented national economies considered
necessary to generate long-term economic growth.” (Weaver, 2000, P:178)
Proponents of neo-liberalism state that neo-liberal development is the best means for generating
economic growth, which is the main reason behind human development and poverty alleviation.
The proponents of the neo-liberal approach are divided into two categories. The first is the pro-
neoliberal group, which emphasizes the importance of this approach in achieving economic
growth. The key representatives of the pro-neo-liberal group are Williamson (1993) and Krueger
(1993), and their main argument can be reflected clearly in the foremost assumptions of neo-
classical economic theory, which is based on comparative advantages as well as the
counterproductive role of the state regarding ownership and economic growth. (Jonas, 2010)
7
The second group of proponents is less enthusiastic about neo-liberalism as an economic and
political approach, but nevertheless considers it an appropriate forward-looking policy path for
the developing countries. The main representatives of this group are Maloney and Baer (1997),
Walton (2004), and Sally (2008). As previously mentioned, the neoliberal approach prioritizes
growth, and economic growth plays a major role in alleviating poverty, which in turn constitutes
development. Market efficiency is the ideal approach for distributing resources in such a way
that leads to producing growth. (Jonas, 2010)
People who detracted neo-liberalism fall into two groups. The first group rejects the neo-liberal
approach as a means to promote growth and development, while the second group demonstrates
the exploitation of neo-liberalism faculties and the motives of their implementers. The majority
of scholars who fall into the first group criticize the assumptions of the neo-liberal approach and
present evidence that this approach has not played a role in advancing economic or human
development. (Jonas, 2010)
1.4. The Washington Consensus
The Washington Consensus was introduced for the first time by John Williamson in 1990 during
the Latin American and Caribbean (LAC) policymakers meeting, which was attended by
international agency representatives and academics. Jonas (2010) states that the main elements of
Washington Consensus in accordance with Perry and Burki (1998) are: "fiscal discipline; public
expenditure priorities in education and health; tax reform; positive but moderate market-
determined interest rates; competitive exchange rates; liberal trade policies; openness to foreign
direct investment; privatization; deregulation; and protection of property rights." (Jonas, 2010,
P:6).
According to Williamson's conception, Washington included several international organizations
such the International Monetary Fund (IMF), the World Bank, the US executive branch, the
Federal Reserve Board, the Inter-American Development Bank and all the think tanks concerned
with developing economic policies. It is very clear that the Washington Consensus was one of
the main outcomes of the neoliberal policy paradigm. Williamson's argument however,
8
summarizes that neoliberal policies were not being implemented in a dedicated manner.
Williamson and Marangos clarified that the Washington Consensus has been misinterpreted by
Naim (2000), Stiglitz (2002) and others who described it as a neoliberal manifesto. (Jonas, 2010)
Stiglitz (2002) states that the Washington Consensus policies were “designed to respond to the
very real problems in Latin America, and made considerable sense… The problem was that
many of these policies became ends in themselves, rather than means to a more equitable and
sustainable growth. In doing so, these policies were pushed too far, too fast, and to the exclusion
of other policies that were needed.” (Stiglitz, 2002, P: 53-54).
Also, Stiglitz (2002) clarifies that:"The policies of privatization, in particular, were instituted at
a pace and in a manner that often imposed very real costs on countries ill-equipped to incur
them."(Stiglitz, 2002, P: 53-54).
1.5. The Post-Washington Consensus
Recently, the Post-Washington Consensus has been established as the fundamental principal for
developing economies. The Washington Consensus was confined rather narrowly to standard
neoclassical economics, relying on market competition for efficient resource allocation. The
Post-Washington Consensus broadened the scope to include nonmarket factors such as social
norms and power balances, drawing heavily on the recent achievements of institutional
economics.
The PWC is thus variously characterized as “a synthesis of national developmentalism and the
neoliberal policy agenda” (Öniş and Şenses, 2005, P:273); “a change in the speed, not the
direction” (Sumner, 2006, P:1411); and the “rebel heir” (Krogstad, 2007, P:83) of the original
Washington Consensus. Thus, it is neither a paradigm shift nor a stasis, but perhaps more of an
ongoing broadening, revision, or reorganization of a paradigm.
9
Joseph Stiglitz (1998) presented his new concept of a 'Post-Washington Consensus' in one of his
main lectures, which was part of the Annual Lecture of the World Institute for Development
Economics Research (WIDER) of the University of the United Nations (1998). Stiglitz (1998)
presented a set of policies that "are the basis for what he sees as an emerging consensus, a post-
Washington consensus.” (Stiglitz, 1998, P:34). The main question raised was whether this
concept was a new consensus suggested by Stiglitz or were his ideas related to economic
development presented as a consensus?
The intellectual base of the PWC was to shift the analytical focus away from the neoclassical
concepts on competition and the principles of perfect markets towards the institutional setting of
economic activity, the significance of market imperfections, and the potential outcomes of
differences or changes in institutions.
According to Harriss and others (1995), "inspired by new institutional economics, the PWC can
provide a more nuanced understanding of economic development. For example, the PWC
acknowledges that at the core of the development process lies a profound shift in social
relations, the distribution of property rights, work patters, urbanization, family structures, and
so on, for which an analysis limited to macroeconomics aggregates is both insufficient and
potentially misleading.” (Harris and others, 1995, P: 34).
Wade (2000) states that: "the PWC represents a distinct break with the WC, as they associate
neo-liberalism narrowly with the WC and the dogmatic belief in the virtues of the free market."
(Wade, 2000, P:215-243).
The Washington institutions continued to stress the virtues of the reforms and to blame poor
countries for their failure during the adaptation and implementation phases of the Washington
Consensus. For Example, the implication is that, in view of the IMF, countries must "do more of
the same, and do it well." (Rodrik, 2006, P: 997). On the other hand, the World Bank has dealt
with the WC policies in a careful way. The implications of the East Asian success and the
association of this success with the distribution of income, mass education and state guidance
were the main elements that played a major role in the position of this international organization
towards these policies.
10
The main discourse of PWC is based on strongly emphasizing the importance of appropriate
institutions for achieving growth. According to Rodrik (2006), "Getting the institutions right has
sometimes been exaggerated to the point of becoming a mantra, just like getting the process right
was the mantra of the WC." (Rodrik, 2006, P: 979-980). It is worth mentioning here that the
suffering of institutions is concentrated on three levels. The first is related to the literature that
failed to establish strong links between institutional designs and long-term economic
performance. The second is that the demanded institutional reforms by the PWC are rarely new,
which is the reason why the World Bank advised poor countries to conduct several
improvements pertaining to the investment climate and education. Finally, the last point is
related to the empowerment of institutions in such a way that can be reflected positively on
attaining rapid reforms necessary for "development."
1.6. Neo-liberalism in Arab Countries and Middle East
It is worth mentioning here that the hegemony exerted by neo-liberalism is linked directly with
US economic and political interests and the agenda of BWI. (Khalidi and Samour (a), 2011).
Over the last two decades, and particularly under the Bush administration, the US has pursued a
policy to support the region through the creation of a neo-liberal economic zone tied to a series
of bilateral trade agreements. The US vision is summarized in promoting the free flow of capital
and goods throughout the Middle East region. The region’s markets will be dominated by US
imports, while cheap labor will be concentrated in economic free zones in order to manufacture
low-cost exports destined for markets in the US, the EU, Israel, and the Gulf. (Hanieh, 2008).
At the regional level, the adoption of the neo-liberal approach started in the early-1990s. North
African states started this process in order to replace their failed socialist or status development
strategies by a new paradigm suggested by the US and BWI. (Khalidi and Samour (a), 2011).
Sadat’s openness policy or infitah, for paving the way to private investment in Egypt, was a
turning point in Egyptian economic strategies in the late 1970’s. Signing the Israeli-Jordanian
peace treaty was the first step toward the adoption of the neo-liberal agenda in Jordan. It was
very clear that all the countries that have implemented neo-liberal reforms experienced an
increase in their poverty and unemployment rates, and the rise of a new social class whose main
11
interest is directly linked to the privatization of the public sector and the liberalization of the
economy. (Khalidi and Samour (a), 2011).
1.7. Neo-liberalism in Palestine
The PA’s adoption of the neo-liberal approach has to be understood in the context of
longstanding efforts to reconfigure Middle Eastern states, their economies, and the region as a
whole. Attempts to push the PA to adopt the neo-liberal approach existed even before its creation
in 1994. This issue was very clear during the discussions of the ‘regional economic development
working group’ of the pre-Oslo Madrid negotiations, in which the PLO participated. (Khalidi and
Samour (a), 2011).
Khalidi (2011) clarifies that Neo-liberalism in the Palestinian Territories goes back to the 1990’s,
to the Madrid Peace Conference, the Oslo Peace Process, globalization and the incremental
involvement of International financial institutions in Palestine. Particularly the World Bank, and
increasingly the IMF, influenced the way of thinking of policy making elites. (Khalidi, 2011)
By 1993, Harvard economists and the World Bank, together with several Palestinian economists
recommended the neo-liberal approach as a basis for economic policies in order to guide the PA
through what was still seen as a five-year path to independence. (World Bank, 1993).
In 1999, the Council on Foreign Relations argued that good governance, the rule of law, and
policies related to investment are the necessary preconditions for Palestinian independence.
(Khalidi and Samour (a), 2011).
1.8. Neo-liberalism and PRDP (2008-2010)
While neo-liberalism is being rejected by many experts and countries around the globe, the PA is
developing its neo-liberal state-building program ‘Ending the Occupation, Establishing the
State'.
The program was developed and launched by Palestinian Prime Minister Salam Fayyad in 2009.
It was designed in order to offer the Palestinian people living in the West Bank a practical plan
that aims at delivering growth and prosperity. The program is based on a neo-liberal model
associated with the premiership of Salam Fayyad, when he formed the caretaker government
12
after the struggle of between Fatah and Hamas and the establishment of a parallel government in
the West Bank and the Gaza Strip.
Khaildi and Samour (2011) state that "the Palestinian Reform and Development Plan (2008-
2011) incorporate with the statehood program. The PRDP is based on the neo-liberalism
approach which faithfully reflects the economic policy agenda set forth in the so-called "Post-
Washington Consensus". Post-Washington Consensus orthodoxy has been advanced by the
Bretton Woods Institutions (BWI), the World Bank Group, and the International Monetary Fund
(IMF), since the late 1990s. The more rhetorical than substantial overhaul of the previous
Washington Consensus reflects a more "inclusive" form of neo-liberalism, without abandoning
its free markets-centric, fiscally conservative, and light-touch regulatory core identity. The
transition of the PWC came largely as a result of political and intellectual dissatisfaction
globally (and even from within the institution concerned) with its poor outcomes and the flawed
theoretical underpinnings. The PWC envisions a responsive, capable state that ensures the
maintenance of security and public order, promotes opportunities for all, and empowers its
citizens who will now have the moral responsibility to rely on themselves instead of a
paternalistic social welfare state." (Khalidi and Samour (b), 2011, P:9).
Hanieh (2008) states that “the PRDP (2008-2010) is a developed plan in close collaboration with
institutions such as the World Bank and the British Department for International Development
(DFID), the PRDP has been implemented in the West Bank where Abu Mazen-led PA has
effective control. It embraces the fundamental percepts of neo-liberalism: a private sector-driven
economic strategy in which the aim is to attract foreign investment and reduce public spending
to a minimum.” (Hanieh, 2008, P:3)
The first point that has to be noted about the PRDP is that the heavy hand of the World Bank, the
International Monetary Fund and other neo-liberal institutions such as DFID, can be clearly seen
through the policy recommendations and outlook of these entities. Hanieh (2008) clarified that
“the argument behind PRDP is explicitly neo-liberal, calling on the PA to undertake a series of
fiscal reforms in order to foster an enabling environment for the private sector as the engine of
sustainable economic growth.” (Hanieh, 2008, P:4).
13
2. Socio-Economic Development
In general, development can be viewed as a multi-dimensional phenomenon. Development has
major dimensions which include the level of economic development, the level of education, the
level of health services, the degree of modernization, the status of women, the level of nutrition,
the quality of housing, the distribution of goods and services, and access to communication.
2.1. Level of Economic Development
Economic development is seen as an analysis method of the economic growth of nations. It
includes a wider variety of variables and not a just a focus on economic growth. According to the
World Bank, “Economic growth by itself may not alleviate the problem of poverty within any
reasonable time-period." (Chenery, Ahluwalia, Bell, Duloy and Jolly, 1976, P:3)
The term ‘economic development’ was initiated in respect to economic growth and
industrialization only. This classification was made by the classical school of economics in the
early part of the 20th
century. Economic development in several countries such as Latin America,
Asia and Africa was not taken into consideration, and these countries were viewed as under-
developed versions of the Western World and could in time, catch up with European and North
American standards.
Schultz (1951) stated that "The term Economic Development shifted from a focus only on a
capital oriented concept to include human capital formation." (Schultz, 1951, P:585-587). This
idea of social development was further extended by Singer (1964) who included health and
fertility into the equation. This marked a notable change in defining economic development,
especially after the newly invented definition by Dudley Seers (1969): "incorporating
elimination of poverty, inequality and unemployment." (Seers, 1969, P:20)
Seers (1977) also commented on social development and said that “this kind of development had
been included to form part of the overall definition of Economic Development alongside
economic growth showing that third world countries were not merely less developed versions of
Western countries but had distinctive characteristics of their own, also known as the
Structuralism Theory." (Seers, 1977, P:25).
14
Last but not least, economic development is "the process of improving the quality of human life
through increasing per capita income, reducing poverty, and enhancing individual economic
opportunities. It is also sometimes defined to include better education, improved health and
nutrition, conservation of natural resources, a cleaner environment and a richer cultural life."
(Penn State University, 2008).
2.2 Variables of Economic Development
In the following section all the variables of economic development are defined:
2.2.1 Structural Change
The term Structural Change, as defined by Matsuyama (1977), "is a complex, intertwined
phenomenon, not only because economic growth brings about complementary changes in
various aspects of the economy, such as the sector compositions of output and employment,
organization of industry, etc., but also these changes in turn affect the growth, and hence can be
seen through the development of an economy." (Matsuyama, 1997)
Based on the aforementioned, structural change refers to changing the structure of production,
which leads to the achievement of an overall higher economic growth observed in an increase in
output and employment. Also, Structural change can be used in order to describe change in an
industry; an increase in the service sector and the agricultural industry for example.
According to World Economy and Social Survey (Anonymous, 2006), structural change is a
necessary requirement for achieving economic growth. This growth can be achieved by adopting
and adapting existing technologies, substituting imports and entering into world markets for
manufacturing goods and services, and through the rapid accumulation of physical and human
capital.
15
2.2.2. Economic Growth
Kendrick (1961) defines economic growth "as the increasing of the economy to satisfy the wants
of goods and services of the members of society. Economic growth is enabled by increase in
productivity, which lowers the inputs (labor, capital, material, energy, etc) for a given amount of
output." (Kendrik, 1961, P:111).
Robert (1998) clarifies that "lowered cost increases demand for goods and services, which also
results in capital investment to increase capacity. New capacity is more efficient because of new
technology, improved methods and economies of scale. This leads to further price reductions,
which further increases demand, until markets become saturated due to diminishing marginal
utility." (Robert, 1998, P:193-194).
Kendrick (1961) ensures that "Increases in productivity are the main factor responsible of
economic growth, especially since the mid 19th
century." (Kenderik, 1961, P:193-194).
According to Kendrick’s (1961) argument, a large part of the economic growth achieved at the
time was due to the reduction in economic input as per output. The balance of growth was
attained from using more inputs overall because of the growth attained in outputs. (Kendrick’s,
1961)
According to Robert (1998), "Modern economic growth started in the West in the early
nineteenth century; this growth was connected directly with the industrial revolution." (Robert,
1998, P:192).
According to Soubbotina (2004), "Economic growth becomes a difficult to sustain politically.
Second, economic growth itself inevitably depends on its natural and social human conditions."
(Soubbotina, 2004, P:4). Soubbotina (2004) clarifies that economic growth can be sustainable
when it relies on a certain amount of natural resources and services provided by nature.
Moreover, economic growth must be connected with the fruits of human development, such as
highly qualified workers who are capable at the technological and managerial levels.
(Soubbotina, 2004)
16
2.2.2.1. Gross National Product (GNP) per capita or Gross Domestic Product (GDP)
per capita
Soubbotani (2004) defines GNP per capita or GDP per capita as "statistical indicators that are
easier to calculate, provide a rough measure of the relative productivity with which different
countries use their resources the relative material welfare in different countries, whether this
welfare results from good fortune with respect to land and natural resources or from superior
productivity in their use" (Soubbotani, 2004: P12).
2.2.2.2. Gross Domestic Product and Gross National Product
According to Soubbotani (2004), "GDP is calculated as the value of the total final output of all
goods and services produced in a single year within a country's boundaries. GNP is GDP plus
income received by residents from abroad minus incomes claimed by non-residents."
(Soubbotani, 2004, P:12). There are two ways to calculate GDP and GNP: 1) adding together all
the incomes in the economy - wages, interest, profits and rents. 2) adding together all the
expenditures in the economy - consumption, investment, government purchases of goods and
services, and net exports (exports minus imports). (Soubbotani, 2004, P:12-13). It is worth
mentioning here that GDP and GNP can serve as indicators of a country's economy. In order to
judge a country's level of economic development, these indicators have to be divided by the
population of the country. GDP per capita and GNP per capita indicate the approximate amount
of goods and services that each person in a country would be able to buy in a year if incomes
were divided equally. This is also known as "per capita incomes". (Soubbotani, 2004, P:13-14).
2.2.2.3 Purchasing Power Parity (PPP)
Soubbotani (2004) defines PPP as "a conversion factor that shows the number of units of a
country's currency required buying the same amount of goods and services in the domestic
market as one dollar would buy in the United States. By applying this conversion factor, one can,
for example, convert a country's nominal GNP per capita (expressed in U.S. Dollars in
accordance with the market exchange rate of the national currency) into its real GNP per capita
(an indicator adjusted for the difference in prices for the same goods and services between this
country and the United States, and independent of the fluctuations of the national currency
17
exchange rate). GNP in PPP terms thus provides a better comparison of average income or
consumption between economies." (Soubbotani, 2004, P:14).
2.2.2.4 External influence on Government
Through neo-liberalism, a government’s power in matters pertaining to economic development
can be influenced by external organizations. International organizations such as the IMF and the
World Bank have the potential to decrease government control in its own country in order to
cause a loss of legitimacy (Riddell, 1992). In terms of economic development, this issue can
have drastic effects on political instability as well, because this instability could lead the
government to reduce effective measures for implementing policies related to economic
development. The stability of the government and its participation in economic issues are seen as
essential conditions for anticipating the implementation of effective measures concerning
economic development. According to Riddle (1992), "in relation to developing countries, we see
that the influence of external forces have profound impacts on the organization of the state and
can lead to a decline in the states' capacity to implement economic development policies."
(Riddell, 1992, P:53-68).
According to Miller (1992), "External influence on local governments consists of political
instability and policy instability. Political instability deals with the potential or actual change in
the political system and the opportunities evolving from such changes. Policy instability refers to
the instability in Government policies." (Miller, 1992, P:311-331).
2.2.2.5 Industrialization
A growing economy changes the proportions and interrelations among its basic sectors -
agriculture, industry, and services - and between other sectors - rural and urban, public and
private, domestic and export oriented.
Soubbotani (2004) states that "one way to look at the structure of an economy is to compare the
shares of its three major sectors - agriculture, industry and services in the country's total output
and employment." (Soubbotani, 2004, P:63).
18
2.2.2.6 Foreign direct investment and Trade
2.2.2.6.1 Foreign Direct investment
Many economists, decision makers and academics contend that foreign direct investment (FDI)
can have important positive effects on a host country’s development efforts. FDI can be
considered as a source of valuable technology, which can help jumpstart an economy. Based on
the aforementioned arguments, developing countries have offered incentives to encourage
foreign investments in their economies.
Economic and technological forces were the main reason behind the growth in international
production. Also, the growth of international production is driven by the ongoing liberalization
of FDI and trade policies. In this context, globalization offers a good opportunity for developing
countries to achieve faster economic growth through trade and investment. It is worth
mentioning here that during the 1970’s, international trade grew more rapidly than FDI. This
situation has been changed in a dramatic way in the middle of the 1980’s when world FDI started
to increase sharply. In that period, the world FDI has increased its importance by transferring
technologies and establishing networks for efficient production and sales at the international
level (Shujiro, 1998).
Most countries offered a wide range of incentives to attract FDI. Experience from other countries
shows that such developed plans have limited impact on new investment opportunities, reduce
transparency of the business climate, and lead to higher taxes. Tax incentives and free zones are
employed by some countries in order to attract investors, despite mixed evidence about their
impact on FDI flows and the potentially high costs compared to the benefits (Sorsa, 2003).
Parantap Basu Derrick Reagle (1988) and Chandana Chakraborty (1988) carried out an analytical
study on 23 countries for the period between 1987 to 1996 in order to identify long run and short
run effects of FDI. The study clarifies that for open economies, causality between FDI and GDP
appears to be bi-directional. The study emphasizes that this causality is bi-directional only in the
short run for relatively closed economies. Also, the study ensures that long run causality for
relatively closed economies is uni-directional and runs mainly from GDP and FDI (P.P.A
Wasantha Athukoral, 2003).
19
According to P.P.A Wasantha Athukoral (2003), “The analysis of Brecher and Diaz-Alejandro
(1997), gives us evidence that foreign capital can be the main reason to lower the economic
growth. This issue can be occurred by earning excessive profits in a country with severe trade
distortions as such high tariffs. Maria Carkovic and Ross Levine (2002) also came to conclusion
that the exogenous component of DFI doesn’t exert a robust, independent influence on growth.”
(P.P.A Wasantha Athukoral, 2003, P:8).
It is worth concluding here that no consensus has been reached on the steady state and dynamic
effects of FDI on growth. There are two kinds of studies in this regard: Ones which argue that
the impact of FDI on growth is highly heterogeneous across countries with relatively open
economies showing statistically significant results, while the other studies maintain that the
direction of causality between the two variables depends on the recipient country’s trade regime.
2.2.2.6.2 Foreign Trade
The relationship between economic growth and foreign trade was tackled by many economists
when foreign trades came into being. The development of foreign trade has been one of the most
important debates of economic research in academe. This issue refers to its impact on economic
growth. To some extent, the emergence of foreign trade and its development were closely related
with economic growth. In a way, foreign trade has a fundamental aim to promote the economic
growth of a country.
Chen (2009) states that “the classical school of economics believed that foreign trade promoted
economic growth in two ways. On the one hand, foreign trade improved the optimal distribution
of resources and productivity consequentially and then stimulated the economic growth; on the
other hand, one country could gain raw materials and equipments which it could not produce.
Those provided material basis for economic development.” (Chen, 2009, P: 127).
The most famous theories were ‘exports of surplus’ of Adam Smith, ‘comparative advantage’ of
David Ricardo, the ‘interest of trade development’ of John Mueller and “trade is the engine of
economic growth” of D.H. Robert Morrison. All the aforementioned theories tried to give an
interpretation for the relationship between foreign trade and economic growth (Chen, 2009).
20
Chen (2009) states that “the representatives of structural school put forward dual economy
model which parted a developing country into capitalist part and non-capitalist part. The
capitalist sector was bound to promote the growth of the economy through absorbing and
accumulating surplus labor form non-capitalist sector. If the capitalist part produced the
exporting goods and traditional part produced the importing goods, foreign trade would
undoubtedly expand the market and demand of products in capitalist part and reduce the wages
of labor. Then it would further increase the profit and accumulation of the part and promote
economic growth.” (Chen, 2009, P:127-128).
Based on the analysis of Max Corden, Chen (2009) clarifies that a country’s foreign trade affects
macro-economics in five ways; the revenue effect, the effect of capital accumulation, the
substitution effect, the income distribution effect and the effect of the weighted elements. All the
above effects were cumulated, and the impact of trade on economic growth was strengthened
gradually with the development of the economy (Chen, 2009).
New growth economists pointed out that the growth of developing countries would be attributed
to the improvement of productivity. Based on that, this theory made a series of models to study
the relationship among international trade, technological progress and economic growth. This
group concluded that international trade promotes economic growth through technology, and
clarified that the mutual promotion relations between international trade and technical change
could help in ensuring long-term economic growth (Chen, 2009).
Chen (2009) states that “the new-trade theory economists believed there were two ways for
international trade to promote economic growth. One was the effects of economies of scale
brought by trade, and the other was that international trade could promote economic growth
through improving the optimal allocation of resources between materials production sector and
knowledge production sector.” (Chen, 2009, P: 128).
21
2.2.2.7 Public and Private Enterprises
2.2.2.7.1 Public Enterprises
The role of government in developing countries grew dramatically in the second half of the 20th
century, especially after the end of the colonialism époque. In many of these countries, the state
was responsible for mobilizing resources and directing them towards accelerated economic
growth, rather than just stabilizing the economy, as is the case in most developed countries.
There is no universally agreed upon definition among scholars regarding the conceptual meaning
of public enterprises. According to Laleye (1985), the bewildering number and types of
organizations known as ‘public enterprises’ and the different contents and rational for which they
are set up, accounts for the lack of authoritative and generally acceptable definition for public
enterprises. (Laleye, 1985)
Sosna (1983) opined that there are many reasons why there is not a single standard definition for
public enterprises in developed capitalist countries. Public enterprises have been established at
different periods, and each epoch naturally brought forth the types of public enterprises most
clearly matching its own conditions. (Sosna,1983)
Efange (1987) defines public enterprises as institutions which are owned by the state or in which
the state holds a majority interest, whose activities are of a business in nature, and which provide
services or produce goods and have their own distinct management. (Efange, 1987)
Literature has noted that the establishment of public enterprise was regarded as a remedy for
market failures. Public enterprises facilitated economic independence and planned development.
Where there is market failure, and unregulated pursuit of profit does not lead to the maximization
of economic efficiency, public enterprise can be established in order to correct misalignment of
public and private objectives.
Other reasons for the establishment of public enterprises were explored by Cook (1997). Firstly,
it was thought that public enterprises could provide government too much needed revenues. Van
De Walle (1989) states that “Governments mistakenly believed that public enterprises would
22
generate large profits with which they would be able to finance investment in priority sectors of
economy.” (Van De Walle, 1989, P:602).
Secondly, there were ideological and political reasons. For example, public production could be
made to seem more attractive in an ideological climate in which the private sector was held in
low esteem and a large public role in the economy was seen as a main reason for rapid sustained
development. It could secure for the government the provision of valuable industrial information
and control of strategic industries. Based on that, public enterprise may be justified for the sake
of employment creation and job security.
Thirdly, public enterprises could be used as a counterweight to the concentration of private
economic power or as a remedy for short supply aversion of the private entrepreneur, or to
strengthen the economic position of particular ethnic groups or geographical regions or to
overcome critical economic bottlenecks.
Cook (1997) states that public enterprises are often established by governments for different
reasons, one of which is profit maximization. (Cook, 1997)
According to Hemming & Mansor (1988), “It is noted that the state owned enterprises enable
governments to pursue goals of social equity that the market ordinarily ignores.” (Hemming &
Mansor, 1988, P:1-22)).
The majority of neo-institutional scholars, such as Douglas and Mancur Olson, state that several
cross national empirical studies have found a positive relationship between the quality of
institutions and governance structures and economic growth (Kaufman et al. 2000).
Other studies clarify that the quality of institutions and governance structures cannot be
considered as a reason for economic growth (Chong and Calderon, 2000, P:69-81).
2.2.2.7.2 Private Enterprises
The role played by the private sector in the development of economic growth and its impact on
eradicating poverty, is currently at the center of development plans for many countries around
the world. Private enterprises do not only promote economic growth and reduce poverty, but also
contribute to the provision of employment opportunities for the poor and to enhancing the quality
23
of life. Supporting private sector development is a critical step towards the achievement of
sustainable economic growth.
The Private sector can therefore be defined as “a basic organizing principle for economic activity
in a market-based economy, where physical as well as financial capital is generally privately
owned and production decisions are made for private gain.” (General Bank of Lesotho, 2009,
P:1)
According to the General Bank of Lesotho report (2009), which was published in 2009, “the
relationship between the private sector and the economic growth has been recognized globally.
Most of developed and developing countries have drawn up strategies and implemented
programs aimed at developing the private sector. The private sector comprises individual
households, corporate firms, and multinational companies.” (General Bank of Lesotho, 2009,
P:1).
There is a growing recognition among countries that provide donations to poor and developing
economies, concerning the role which the private sector can play in order to create employment
opportunities, increase efficiency and production and promote economic growth. According to
the World Development Report (WDR) 2005, “Private sector entities invest in new markets and
new facilities that help strengthen the infrastructural foundation of the economy which, in turn,
lays a good ground work for attracting investors from abroad and facilitating achievement of
economic growth.” (World Development Report, 2005, P:56)
Private sector development also contributes to the reduction of unemployment and corruption,
which have far reaching implications for both economic and social life. Jobs and incomes created
by private sector enterprises lead to economic diffusion of growth by having a direct impact on
poverty alleviation. Developing the private sector helps in making people more involved in
economic activities and decision making processes by attracting new stakeholders in the
economy in order to maximize profits (General Bank of Lesotho, 2009).
It is worth mentioning here that the private sector is also the main source of tax revenue,
contributing to the public funding of health, education, clean drinking water, food security and
agricultural inputs, thus satisfying public demands.
24
2.3 Social Development
Development is actually much more than just economic growth. The understanding of
development can differ from one country to another and even from one individual to another, but
it usually goes far beyond the objective of increased average income to include things like
freedom, equity, health, education, safe environment, and much more.
According to recent United Nations documents, "Human Development is measured by life
expectancy, adult literacy, access to the three levels of education as well as people's average
income which is necessary condition of their freedom of choice." (Soubbotani, 2004, P:7).
Soubbotani (2004) clarifies that “in a boarder sense the notion of Human Development
incorporates all aspects of individuals' well-being from their health status to their economic and
political freedom.” (Soubbotani, 2004, P:7-8).
The Human Development Report (1996) published by the UNDP states that "Human
Development is the end – economic growth a mean." (Human Development Report, 1996, P:35).
It is not easy to measure the level of social development and progress in human development.
There is a wide range of social indicators which can be used for this task, including education,
health, poverty and hunger, income in-equality, clean water, sanitation and electricity.
In the following sections the variables of social development will be defined:
2.3.1 Income In-equality
Soubbotani (2004) clarifies that "the number of people in a country and the average quality of
life depend on how equally or unequally income is distributed." (Soubabotani, 2004, P: 28).
Soubbotani (2004) ensures that measuring income in-equality can be conducted through the use
of Lorenz curves and Gini indexes. A Lorenz curve plots the cumulative percentages of total
income received against the cumulative percentages of recipients, starting with the poorest
individual or household (See Figure 2) (Soubbotani, 2004, P:29).
25
Soubbotani (2004) clarifies that " Excessive inequality adversely affects people's quality of life,
leading to a higher incidence of poverty, impeding progress in health and education and
contributing to crime." (Soubbotani, 2004, P:31).
2.3.2 Poverty and Hunger
Poverty is deprivation of well being. According to traditional definitions, poverty is understood
as material deprivation, which incorporates living with low income and consumption. This issue
can be characterized by poor nutrition and poor living conditions.
Soubbotani (2004) states that "the broader definition of poverty as a multidimensional
phenomenon leads to a clearer understanding of its causes and to a more comprehensive policy
which aimed at poverty reduction. For example, in addition to the issues of economic growth and
income distribution, it brings to fore equitable access to health and education services and
development of social security systems." (Soubbotani, 2004, P:33).
According to Soubbotani (2004), "hunger is the most extreme manifestation of poverty and
arguably the most morally unacceptable. In the globalized world of the 21st century, with more
than enough food produced to feed all of its 6 billion inhabitants, there are still over 800 million
poor suffering from chronic undernourishment." (Soubbotani, 2004, P:38).
According to the estimate of the UN Food and Agriculture Organization (FAO), in 1999-2001
there were 842 million undernourished people in the world. This number is distributed across
developing countries, countries with transition economies and in high-income economies. (FAO,
2001)
2.3.3 Education
Human capital is developed through education or capacity building programs that increase the
productivity of an individual at the economic levels. In turn, this economic productivity enables
individuals to produce more valuable goods and services, thus attaining high income.
Governments invest in human capital to accumulate knowledge and skills. The majority of
governments believe that better education will contribute to faster sustainable development. The
following are two main indicators to measure education outcomes:
26
2.3.3.1 Net enrolment ration in primary education
Net enrolment ration in primary education is a ration of the number of children of official
school age enrolled in primary education to the population of the corresponding official school
age. On other hand, gross enrolment rations are defined as the ration of number of students
enrolled in primary education to the total population of the corresponding age group. Barro
(1991) views that "the enrolment ratios for different levels of schooling as indicators of the stock
of human capital, they may be inappropriate proxies for human capital stocks for current
economic production." (Barro, 1991, P:407-433).
Thomas and others (2000) state that "the only problem with this approach is that the enrolment
ratios are both flow variable, which represent human capital investment flows and the stock
itself." (Thomas and others, 2000).
2.3.3.2 Adult Literacy Rate
Literacy is defined as the ability to read and write, and having an understanding for any simple
statement related to everyday life. Adult literacy rate is defined as the percentage of literate
individuals (aged 15 years and up) to the corresponding population. On the other hand, youth
literacy rate is defined as the percentage of literate individuals (aged between 15-24 years) to the
corresponding population. The aforementioned indicators reflect one basic human right - a
minimum level of education. Adult literacy is considered as an excellent overall quality of life
indicator, which is associated with many other elements of quality of life, such as measures of
employment, income and health. (Barro, 1991)
Chen and Dahlman (2004) state that "while there has been some criticism concerning the
international comparability of the adult literacy rate because of the difficulty of ensuring that it
is applied systematically, it is commonly used to measure progress in achieving universal
primary education." (Chen and Dahlman, 2004, P:45).
Hicks (1980) clarifies that "the purpose of monitoring progress in meeting needs for primary
education, adult literacy is a better indicator than primary school enrolment since it is oriented
towards effects rather than efforts." (Hicks, 1980, P:17-20).
27
2.3.4 Health and Longevity
Usually, the health of a country's population is monitored through the use of three main
statistical indicators: life expectancy at birth, infant mortality, and the under-five mortality rate
(U5M). These three indicators are frequently referred to as measures, by and large, of a
population’s quality of life, simply due to the fact that they reflect many aspects of the welfare of
people, counting their income level, the quality of their environment, their nutrition level, and
their ability to access healthcare, safe water and sanitation.
2.3.4.1 Life Expectancy at Birth
Life expectancy at birth is the number of years a newborn infant would live if prevailing patterns
of age-specific mortality rates at the time of birth were to stay the same throughout the child's
life. In other words, it is the theoretical number of years a newborn will live if the age-specific
mortality rates in the year of birth are taken as constant.
According to Hicks (1980), "It seems appropriate to use life expectancy at birth as one basic
measure the efficacy of a country's success in providing for basic needs." (Hicks, 1980, P:17-20).
This indicator reflects the level of health, nutrition, sanitation improvements, cleans water and
income, and thus indirectly links employment and shelter (Mazumdar, 1996, P: 361-384). Thus,
when a country witnesses a low life expectancy rate, this indicates the existence of a sizeable
percentage of the population who face poor living conditions, including lack of adequate health
premises and facilities.
2.3.4.2 The Infant Mortality Rate
The infant mortality rate is the death of babies under one year of age expressed for every 1000
live births. Infant mortality is understood to be a good indicator of the availability of a sanitation
system and clean water facilities, which are considered crucial for infants since they are
susceptible to water-borne diseases. Infant mortality has been characterized as an outcome
variable summarizing the degree of existence of contagious disease in a country, as infants are
more susceptible to these problems. This indicator demonstrates rapid response to many health
policies. Thus a high figure would show that there are many people living in conditions under
which basic health needs are not met (Mazumdar 1996; Goldstein 1985).
28
2.3.4.3 The Under-Five Mortality Rate (U5M)
U5M is the probability of dying between birth and exactly five years of age, expressed per 1000
live births. Hence, it is considered to be the most suitable indicator of the increasing exposure to
the risk of death because it presents the most appropriate measures of recording mortality risks
during the most vulnerable years of childhood - the first five years of life. It has several
advantages over the infant mortality rate as a composite measure of health risks at childhood.
The risk of death remains high among children from this age group. Therefore, this indicator is
also an appropriate outcome measure in evaluating the effect of the many and different
intervention programs that aim to improve child survival (Ahmad and others, 2000).
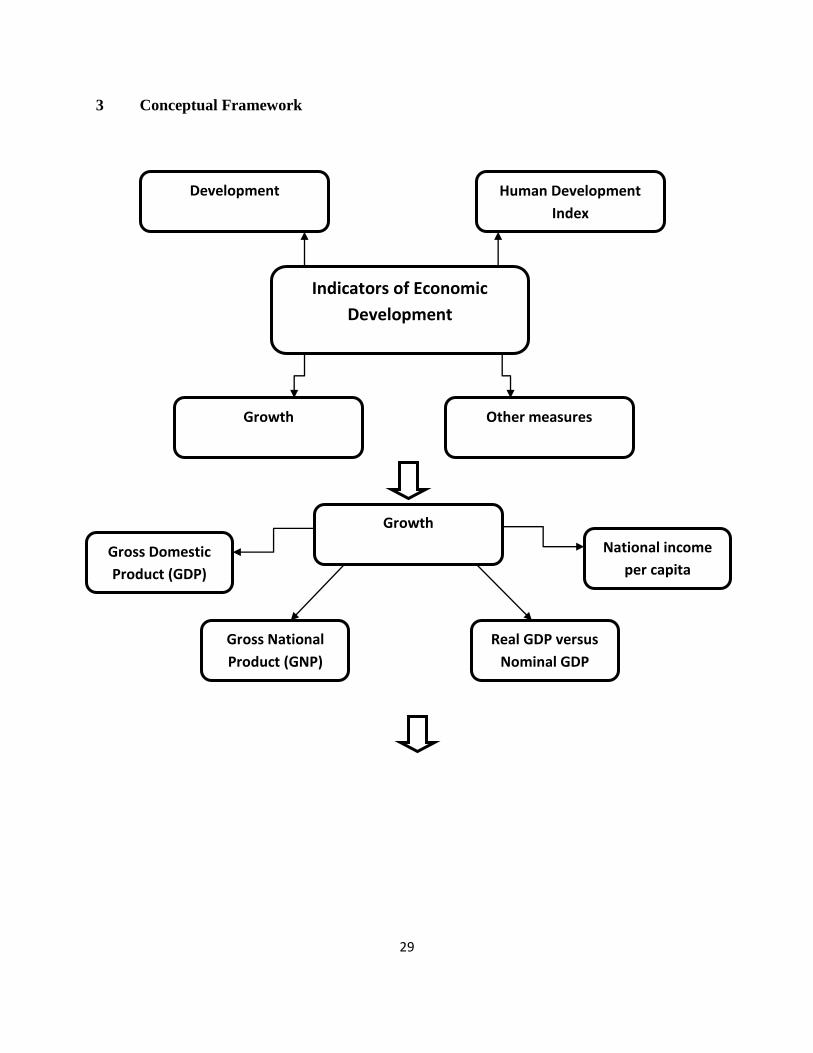
29
3 Conceptual Framework
Indicators of Economic
Development
Human Development
Index
Development
Other measures Growth
Growth
National income
per capita Gross Domestic
Product (GDP)
Real GDP versus
Nominal GDP
Gross National
Product (GNP)
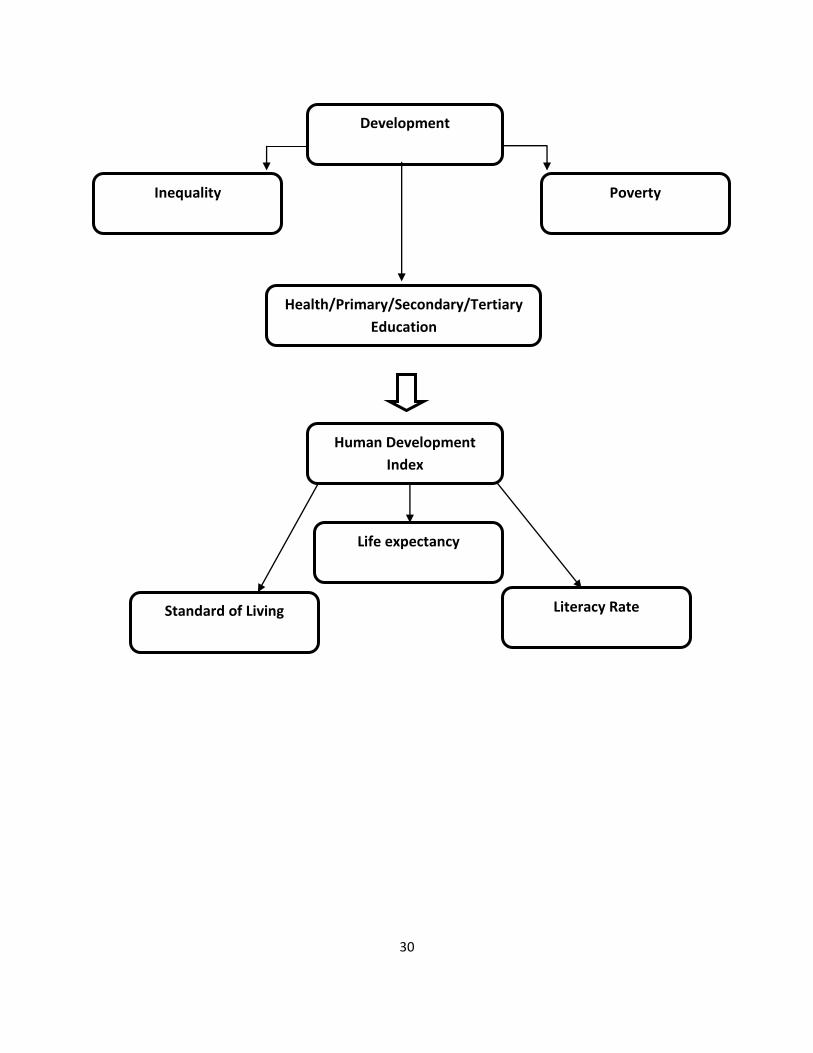
30
Development
Poverty Inequality
Health/Primary/Secondary/Tertiary
Education
Human Development
Index
Literacy Rate
Life expectancy
Standard of Living
31
4 Conclusion
Neo-liberalism is an economic and political framework. Economically speaking, it focuses on the
privatization and deregulation of industry and the liberalization of trade. During the 1970’s and
1980’s, developing countries were experiencing internal and external economic crises, and
therefore, adopted the neoliberal approach, which was considered to be a means for fostering
economic growth and human development.
The PA adopted the neo-liberal approach through the statehood program – sated with alluring
neo-liberalism terminology; plurality, accountability, equal opportunity, empowerment of
‘citizens’, protection of social, economic and political rights, and the state’s efficient provision of
services and public goods - which was launched by Dr. Salam Fayyad. This program, which was
incorporated with the PRDP, is based on four independent components: building good
governance institutions, achieving private sector growth, delivering effective services and
policing of the Palestinian population
Economic growth is a means to achieve development but not an end. As previously mentioned,
development is much more than just economic growth, and can be viewed as a multi-
dimensional phenomenon. It has major dimensions, which include the level of economic
development, the level of education, the level of health services, the degree of modernization, the
status of women, the level of nutrition, the quality of housing, the distribution of goods and
services, and access to communication.
32
Chapter II: Research Design and Methodology
The primary goal of this thesis is to evaluate the extent to which the PRDP (2008-2010) may be
considered as a neo-liberal plan for the Palestinian Territories, and to also assess the extent of
economic growth achieved during and after the implementation phases of PRDP were translated
into socio-economic development.
Each of the four subsequent chapters is constructed around the same aforementioned research
question. I have approached each question independently, taking into consideration the fluidity
of themes across chapters.
The following questions are the main sub-questions which have been used during this study:
- Did the Palestinian territories adhere effectively to the neo-liberal approach? Was this
adherence appropriate? And did the PRDP lead to a paradigm of development?
- In what aspects have the Occupied Palestinian Territories experienced economic growth during
the implementation phases of the PRDP?
- What are the main reasons behind the achievement of this economic growth?
- Was this growth translated into socio-economic development in the Palestinian Territories?
- Did the Occupied Palestinian Territories become more socially developed after the
implementation phases of the PRDP?
This chapter will explain the research design and methodology that I used to respond to these
questions.
In the course of conducting this study, I employed a qualitative method using data from both
primary and secondary sources. I conducted several interviews with economists and academics.
The combination of approaches and data sources provides a balanced methodology and paves the
way for further development in later studies.
33
1. Significance of the Study
The PRDP (2008-2010) is seen as an important development framework for achieving economic
growth and socio-economic development in the Palestinian Territories. As previously mentioned
the PRDP is incorporated in the statehood program and based on a neo-liberal approach.
Economic growth in West Bank and the Gaza Strip regions is estimated to have reached 9.3% in
2010, exceeding the PA budget projection of 8% (World Bank Report, 2011, P:5). Many people
give the PRDP the credit for this economic growth. Others argue that economic growth in the
OPT does not appear to be sustainable and thus cannot be considered as an indicator of success
in achieving socio-economic development.
The results and recommendations of the research can be valuable for Palestinian planners and
economists. This study can encourage the PA to assess Palestinian growth and development
during and after the implementation phases of PRDP (2008-2010), in order to assess neo-
liberalism as a policy paradigm for the Palestinian economy. It can also contribute to
encouraging Palestinians to move away from the current context toward a new paradigm that
understands development as a means to realize self-determination, rights and freedoms. Finally,
the research can create a platform for future researches in this area for people who are interested
in the most suitable economic and political paradigms that can lead to real socio-economic
development in Palestine.
2. Research Methods
The major concern of the research is to explore the extent to which PRDP (2008-2010)
contributes to the achievement of high economic growth and socio-economic development in
Palestine. To achieve this, the research methods should investigate multi level perspectives from
economists, academics, and reports conducted by national and international organizations.
The research methodology adopted is a qualitative method that depends mainly on the following:
Follow up and analysis of documents and official reports issued by states and
international institutions related to development plans in the Palestinian Territories
34
(World Bank, International Monetary Fund, the United Nations, the European Union, et
al.).
Reports published by the PA: the Ministry of Planning and the Ministry of Finance.
Reports and statistics published by PCBS: Palestinian Center Bureau of Statistics.
Data collected through direct written questions, and interviews conducted with:
Representatives of international organizations, in order to understand the status
quo of the Palestinian economy.
Representatives of the PA, with special focus on the Palestinian Ministry of
Finance and Economy in order to explore the impact of economic growth on
socio-economic development in the Palestinian Territories.
Economists and academics, for the abovementioned reasons.
There are a number of advantages of qualitative methodologies for scientific research. Epstein
(1988) states, “descriptive, inductive, and unobtrusive techniques for data collection are viewed
as compatible with the knowledge and values of the scientific research” (Epstein, 1988, P:185-
195).
For situations in which researchers are faced with issues and problems that are not amenable to
quantitative examination, qualitative methods have been advocated (Sherman & Reid, 1994).
According to babbie (1986), “Qualitative approaches also have the advantages of flexibility, in-
depth analysis, and the potential to observe a variety of aspects of a social situation (Babbie,
1986, P:56).
A qualitative researcher who conducts a face-to-face interview can develop using questions on
the spot, gain a more in-depth understanding of the respondent's beliefs, attitude regarding the
main subject of the interviews. (Babbie, 1989)
The qualitative method was chosen for the aforementioned reasons. Moreover, the difficulty to
depend on questionnaires as a tool for data collection is another reason for this selection.
35
Interviews also played an important role in the research methodology; they enriched the content
of the study by permitting a focus on sensitive topics that cannot be truly discussed if the
research depended solely on quantitative methods. Also, this research draws from secondary data
that includes: historical data, periodical reports, and previous studies, enabling the attainment of
needed findings and recommendations.
2.1 Interviews
To provide an in-depth response to the questions addressed in this research, open-ended
questions were prepared to allow the exploration of each theme. The flexibility of questions also
provided an opportunity for raising more questions and obtaining further insight and ideas. Of
course, this also depended on the type of conversation that was going on with interviewees.
It was also very necessary to strengthen the research by a series of oral and written interviews
with a number of international organizations working in Palestine, think tanks, in addition to the
viewpoints of a number of experts and academics in the socio-economic development field.
It is worth emphasizing here that the basic research methodology focused primarily on the
review and evaluation of official documents and reports published by international organizations,
in addition to those published by the PA. Therefore, these interviews are limited to a role of
furthering the discussion and supporting some of the facts related to socio-economic
development in Palestine.
Based on the objectives of the research, questions may be configured in a manner that spans
across two main axes:
1. Questions evaluating the extent to which the PRDP may be considered as a neo-liberal
plan for the Palestinian people.
2. Questions pertaining to economic growth and whether it was translated into socio-
economic development in Palestine.
The interviewees have been selected in accordance with special criteria:
- Two economists from the PA.
36
- Two economists from the Palestinian Independent Commissions (direct relation with
research fields).
- Two academics specialized in the fields of economy and development.
- Two senior economists from international organizations.
- Two representatives from the private sector.
Ten interviews were conducted with the following individuals:
1. Mr. Ala’ Tartir – Policy Advisor – Al Shabaka / The Palestinian Policy Network.
2. Sam Bahour – Business Consultant – Applied Information Management (AIM).
3. Dr. Khalil Nakhlah – Expert in the development field, and previous consultant for the EU
and the Welfare Association.
4. Dr. Samir Abed Allah – Former Minister of Planning and General Director of the
Palestine Economic Policy Research Institute (MAS).
5. Dr. Samir Hazboun - President of the Bethlehem Chamber of Commerce and Industry.
6. Mr. Azmi Abdulrahman – General Directorate of Policies, Research and Analysis –
Palestinian Ministry of Economy.
7. Mr. Raja Al Khalidi – Senior Economist at the United Nations Conference on Trade and
Development (UNCTAD)
8. Mr. Metri Abu Eita – Former Minister of Tourism and business man.
9. Mohammad Attalah – Head of the Research Department – Palestinian Monetary
Authority.
10. Strahan Spencer – Economic Advisor – UK Department for International Development
(DFID).
37
All interviews were conducted in February, March and April 2012. Some were conducted face-
to-face, while most were through written responses. The reactions of the interviewees were very
useful and efficient for the results of this study.
2.2 Limitations and Difficulties
Development in Palestine is not merely a technical process, but also a political and economic
vision. Within it, a wide issue, an amalgamation of factors are intertwined and overlapped, all of
which have profound impact on the attitudes and developmental priorities of the plans that have
been introduced, with a special focus on the PRDP (2008-2012).
The research by itself is an attempt to assess the economic performance of Palestine during and
after the implementation phases of the PRDP and whether this performance was translated into
real socio-economic development.
For that I would like to list some of the difficulties I was confronted with during the completion
of this research:
The refusal of some PA representatives to offer the possibility for an interview or respond
to the research questions explicitly addressing the adoption of the neo-liberal approach as
a political and economic paradigm.
Given the lack of political stability and security in Palestine, as well as the historically
inconsistent dedication to actually implement development plans, it is difficult to speak
of a cumulative and sustainable development process. This difficulty constitutes a major
obstacle to any researcher seeking to assess the impact and economic and social
consequences of short and long term plans.
Sometimes, there are discrepancies in the figures and statistics cited. These discrepancies
are a result of the differing references used by the various institutions, such as the PA, the
World Bank, IMF, UN, EC and so forth.
38
Chapter III: Economic Growth during and after the PRDP
The neo-liberal paradigm emphasizes primarily on economic growth, and subsequently on
socioeconomic development – as its byproduct. This chapter will assess the extent to which the
PRDP succeeded as a neo-liberal plan in the Palestinian Territories, and highlight the major
dimensions of socioeconomic development linking them to the achieved growth during the
implementation phases of the PRDP (2008-2010).
1. Neoliberal policies as an economic and political paradigm in Palestine
Most of the literature reviewed indicated that the neo-liberal approach was the basis for the
PRDP (2008-2010). The PA’s formal declaration concerning the adoption of this approach is
stipulated in Article (21) of the Palestinian Basic Law (amended in 2005), which states that “the
economic system in Palestine shall be based on the principle of free market economy.”
(Palestinian Basic Law, 2005, P:21)
As previously mentioned, the aim of this research is to evaluate the extent to which the PRDP
may be considered as a neo-liberal plan for the Palestinian Territories. To support this, the
research took into consideration the various views of Palestinian experts who work in the field of
economic and social development and who are closely linked to the Palestinian reality.
Dr. Khalil Nakhleh (2012) refers to the importance of placing matters in their historical context
prior to responding to the research question. He emphasizes that “the PA’s adoption of neo-
liberalism appeared clearly after the occurrence of several fundamental shifts in the Middle East
in particular and the world in general; the defeat of the Arab States in the 1967 War, the events
of Black September (1970) in Jordan, the PLO’s departure from Lebanon to Tunisia, the death of
President Gamal Abdul Nasser, and the October War in 1973. Sadat’s presidency in Egypt was a
major turning point in the path of the Palestinian case, whereby during its meeting in Algeria in
1974, the Palestinian National Council was forced to come out with the "Ten Points Program",
and to press for accepting a political solution to any section of historic Palestine in order to
shape a nucleus for the formation of a Palestinian state. The year 1974 was a crucial year that
transformed the PLO from a liberalization organization to a bureaucratic one with the political,
economic and social branches.” (Nakhleh, 2012)
39
Nakhleh (2012) also emphasized the constant role played by Samed Institute in adopting free
market policies and investing in business ventures in various countries around the world. He
believes that the PA adopted neo-liberalism and accompanied the Bretton Woods Institutions
throughout the Palestinian economic development stages since the Oslo Agreement. Nakhleh
(2012) however, does not think that the PRDP succeeded to play the role of a neo-liberal plan
because it does not take the development and liberalism factors into consideration. He added that
“we seem to have forgotten that the Palestinian Territories are occupied territories that suffer
from complete dependence on the Israeli Occupation that controls everything.” ( Nakhleh,
2012).
Khalidi (2012) confirms that “the PA undoubtedly adopted the neo-liberal approach through the
PRDP, and it was clearly visible following the Oslo Agreement and the Paris Protocol of
Economic Relations in 1994. This adoption established the groundwork for a relationship
characterized by Palestinian dependency on Israeli goods and donor aid, thus creating an
economy linked with the Israeli economy; one of the most liberal economies in the region and the
world.” Khalidi (2012).
Khalidi (2012) asserts that the PRDP is based on the so-called Post Washington Consensus that
encouraged states to adopt liberal economic policies derived from neoclassical philosophy. He
asserts that this approach is not appropriate for the Palestinian territories because it conflicts with
liberation and sustainable development. The PRDP, according to Khalidi (2012), is no more than
a security plan devoted to the presence of the occupation hindering any chance for reaching a
political and just solution to the ongoing conflict that has been going on for over 60 years. The
PRDP was created in order to prove to the Palestinians and others that the new era of the PA has
a different methodologically than that which existed during the Arafat era (1994-2004). (Khaledi,
2012)
It is worth mentioning here that the security plan is interlinked with Israel’s policy of asserting
control over important strategic assets and locations in order establish order among the
Palestinian people living within these locations to enable the control over and colonization of
land.
40
To provide further clarification to this, Leech (2012) states that, “Hilal and Khan (2004) use the
following metaphor: “In a prison, the prisoners control 95% of the space.” Leech, 2012, P: 7.
Leech (2012) clarifies the metaphor of Hilal and Khan: “Because the PA took over responsibility
of day to day management of Palestinians in Area ‘A’, the Israeli’s policies produce equivalent
prisoners in order to police the Palestinian people and to organize their own services.” Leech,
2012, P:7).
This Israeli policy was embedded since 1967. A real change in this policy came only from the
rupture in Israel’s methodology of control over the Palestinian Territories affected by the
Palestinian popular uprisings. Therefore, the Israeli leadership came up with a new strategy to
cooperate with the Palestinian elite living within the Occupied Palestinian Territories and with
PLO leaders to create an authority that plays the role of police instead of the Israeli government.
As a result of the Oslo Process, thousands of Palestinian political elites from the PLO and Fatah
returned to the Palestinian Territories, dependent on the help and financial investments of a
group of capitalists who became successful in the Gulf after being forced to leave Palestine
during the Nakba. These capitalists returned to Palestine in 1990 in order to give legitimacy for
the PA through their financial support and investments.
Recently, the PRDP was the main reason for creating a newly empowered Palestinian capitalist
class that was portrayed as a predatory and oligarchic group of elites whose dominant position
was favored by the PA’s neo-liberal program made possible by security collaboration with Israel.
Khalidi (2012) concludes that the aim of the PRDP comes from the Israeli interest to weave co-
existence alongside economic peace, which was promoted by the Israeli government. The PRDP
was the main reason behind increasing Palestinian dependency on foreign aid and Israel. The
latter continues to exploit its dominating position to establish a hold on Palestinians by creating a
framework for control over vital and important resources, thus curtailing any potential
Palestinian capacity to confront the superiority of the Israeli government and effectively
nullifying any meaningful progress toward achieving their independence. (Khalidi, 2012)
41
Al Khalidi (2012) states that “the adoption of the neo-liberal policy in the PRDP is one of the
PA’s most grievous mistakes. This adoption is inimical to development and liberation, which are
much needed by the Palestinian people. The PRDP cannot succeed neither as a midwife for
independence that is based on a strategy of resistance, nor as a development paradigm”
In reaction to the same question, Alaa Tartir (2012) states that “the adoption of the PRDP as a
neo-liberal paradigm depends on the definition and understanding of liberalism and neo-
liberalism. In sense, liberalism is the socio/political/ideological background of capitalism. And
in this spirit depending on international and regional experiences it became evident that the
blueprint of the neo-liberal agenda seems to be very problematic and in many ways harmful to
be implemented in a place like Palestine. It is not about right or wrong per se, it is about what
sort of path we need to have in order to create development. Do we need a development state or
do we need a quick jump with policies based on liberalization, privatization and stabilization?
Of course, the adoption of the neo-liberal agenda requires certain pre-requisites such as control,
rights and sovereignty, which are lacking in Palestine.” (Tartir (a), 2012).
Also in response to the same question, Sam Bahour (2012) states:”I cannot assure that the PA
has succeeded in adopting the neo-liberal approach and I cannot say that it was the right
decision. But I would like to say that the leaders of the Palestinian Authority have a strong
conviction that the solution of the Palestinian case will come only through the United States. I
believe that there is no problem for any country to adopt a socio-economic plan in order to
reach a paradigm of development, but the problem is how this country can benefit from this
adoption and have political and economic gains, and this is the main question regarding the
PRDP.” (Bahour, 2012)
According to Bahour (2012), the PRDP contributes to concentrating power and wealth in the
hands of a selected few (elites), who are apparently motivated by their short term personal
interests, without taking the real needs of the Palestinian people into consideration. The PRDP
has to be replaced by another strategy that is based on a participatory approach, with a special
focus on resistance and development. Bahour (2012) believes that planning at the national level
cannot be implemented in any form in a country that is under occupation. (Bahour, 2012)
42
Muhammad Attaallah (2012), who also gave his feedback regarding the same question stated: "I
believe that the PRDP is built on the main concepts of neo-liberalism. The PRDP tends to move
towards the development of the private sector and encourage the privatization of basic services,
such as electricity and water. However, the PRDP is considered a positive factor; especially the
return of the Palestinian capitalists to the Palestinian territories and their contribution to the
development of the Palestinian economy at many levels.”(Attaalah, 2012).
On other hand, Leech (2012) states that, “Hanieh (2011) explains that the majority of private
enterprises in the West Bank can now be traced through a series of holding companies owned by
the Masri and Khoury families. These two families directly own a considerable range of
properties and organizations operating in the West Bank. In short, this collection of capitalists
“completely” dominates the political economy of the Palestinian territories. This dominance
creates monopolies and prevents the development of the private sector on a competitive basis.”
Leech, 2012, P:12).
Dr. Samir Abdullah (2012) had a different opinion regarding the study and the same question. He
stated that “the basis of this research is completely out of context and has no relationship to
reality. The world has abandoned the Washington Consensus (WC) long before the existence of
the PRDP because the WC created many crises. The WC is practically considered as a victory
declaration for the capitalist system over the liberals, who believe that market mechanisms can
solve all problems as they are able to reach optimal distribution of resources, achieve growth,
equal distribution of income, and justice on the long term. However, the results indicate how
these policies failed, particularly with regard to human resources such as education, health and
citizen wellbeing. We cannot say that the PA, which is under occupation, adopted the neo-liberal
approach; this claim is completely out of context. The PRDP was developed in a period when the
Palestinian territories were under a state of chaos, and this chaos had a negative influence on
the development and production processes. Simply put, the PRDP is a short-term plan that
contributes effectively to the achievement of the long-term goals of the Palestinian people.”
(Abdullah, 2012).
43
Azmi shared Abdullah`s vision in his response to the same question: "The PRDP is not based on
the concepts of the neoliberal approach. It is just a short term plan that aims to achieve long-term
goals. It is worth mentioning here that the PRDP is the main reason behind improving the
performance of the Palestinian government in terms of managing public money, enhancing
revenues collection, reducing dependence on foreign aid from $1.8 billion to one billion Dollars,
and developing many sectors without neglecting the major obstacles imposed by the Israeli
occupation. It should be noted that many successes have been achieved on the political and
economic levels, and the PRDP is considered very suitable for the political and economic reality
in Palestine.” (Azmi, 2012).
It is very important to conclude here that four of the experts who have been interviewed stated
that the PRDP was based on the neo-liberal approach as a theoretical and practical framework.
The PRDP is not suitable for the Palestinian territories because it does not take the issue of
resistance and sustainable development into account. According to these experts, the PRDP and
its policies, particularly those that can be described as security sector reform or neoliberal
economic re-organization, have in fact worsened and made the Palestinians and their economy
even more dependent on the will of Israel and international donors. The PRDP has made
conditions much harder for the Palestinians to remain tied to the land, particularly the residents
of Area “C”. The other three experts argue that the plan did not pursue a neoliberal approach,
but rather arrived in an era of widespread chaos and lawlessness. They stated that the plan used
to be an important base for re-straightening economic and social development, from which all
Palestinians would benefit.
2. Economic growth during the PRDP
The long years of dependency on the Israeli market, the continued expansion of settlements,
political instability and the restriction of movement, have deterred productive investment and
decreased the growth of Palestinian industrial, agricultural and productive capacity. Palestinian
economic growth during more stable periods was been driven by the construction and
agricultural sectors and labor in Israel. There has also been little investment in developing high
value added export businesses, which can be considered as the basis for a self-sustainable
economy.
44
According to the PRDP (2008), “economic growth in the Palestinian Territories witnessed in
2003-2005 was largely driven by public sector spending and private consumption funded by aid
and remittances.” (PRDP, 2008, P:65).
The PRDP clarifies that the Palestinian economy has an enormous potential for future growth.
This point is clarified clearly in the third goal of the Plan, which states that the PA should work
on increasing national prosperity by moving towards fiscal stability and restoring economic
growth.
Since 2008, the Palestinian economy has been growing with real GDP projected at 8% in 2010.
This growth started at a very low level, especially in the Gaza Strip, where standards of living
are well below that prevailed in 1994.
SIDA (2011) clarifies that the growth has been driven by aid inflows, which do not entail real
economic growth in the long term. (SIDA, 2011).
On other hand, the World Bank (2011) states that “real economic growth in the West Bank is
estimated to have reached 9.3% in 2010 exceeding the PA’s budget projection of 8%.” (World
Bank, 2011, P:5).
Alaa Tartir (2012) explains that “the circulation of donor funds and the increase in government
public expenditure are the reasons behind this economic growth. The private sector and the
construction boom in places like Ramallah can be responsible for that, but for sure are not the
main engines behind this growth, as claimed. So the growth was everything else but sustainable
and long term.” (Tartir (a), 2012).
Sam Bahour (2012) states in his reaction to the same question: “Before starting to talk about
economic growth, whether it was achieved or not, it is very necessary to define the measures and
indicators of economic growth, especially since these indicators and measures have been
developed for sovereign states. I believe that the use of these indicators for measuring
Palestinian growth is a big mistake and this is due to the fact that the Palestinian territories are
under occupation and the Palestinian people have no access or control over any of their natural
resources. For example, it is possible to consider the Israeli checkpoints as one of the main
reasons behind this growth. These checkpoints have a negative effect on the free movement of the
45
Palestinian people - many sectors would require more time to implement their activities due to
the delay at checkpoints. This results in an increase in spending, thus, economic growth.”
(Bahour, 2012).
Bahour states that “another main reason behind this growth is foreign aid. This aid is
unsustainable and results in unsustainable growth. Therefore, foreign aid should be removed
from the formula used to calculate this growth so that Palestinians can have a clear image of
their economy and its performance.” (Bahour, 2012).
To confirm the points raised by Bahour, Nakhlah (2012) stated that “the development achieved
does not reflect any real development, but just the opposite. It is artificial development since it
was achieved as a result of donor funds. How could we even consider the existence of economic
growth with a deficit budget covered by external aid?” (Nakhlah, 2012).
Hazboun (2012) states that: “Unquestionably, the period between 1995 and 2000 did witness real
growth. It was a recovery period where we started to feel that we were taking vigorous steps
towards the state. I think that all the percentages we hear about economic growth do not reflect
the reality. Economists do not pay attention to the inflation rate, which is one of the main factors
that can provide the real percentage of achieved economic growth.” (Hazboun, 2012).
According to Attalah (2012), “the achieved economic growth is not a real and sustainable one,
and does not reflect any development on the socio-economic level. Poverty and unemployment
rates witnessed a steady increase in the last three years. This growth is not based on the
industrial and agriculture sectors. This growth is a natural result of donor money and the new
financial management system established by the PA.” (Attalah, 2012).
Al Khalidi (2011) portrays the achieved economic growth as an economic bubble. He clarifies
that this growth was largely fueled by donor aid and private sector investment recovery in the
West Bank and illicit tunnel economy in Gaza. Most regions, and about half of the Palestinian
people who are actually enjoying economic recovery, are excluded from this growth. (Al
Khalidi, 2011). Moreover, Al Khalidi (2012) makes the distinction between growth and
development. According to him, “development cannot be measured by percentages of economic
growth. The economic growth that has been achieved does not include all the categories of the
46
Palestinian people. This growth is only owned by the capitalists and it is moving towards the
creation of a debt-oriented growth.”(Al Khalidi, 2012).
From another perspective, Abdullah (2012) confirms that “the achieved growth rate was real and
the most important examples that can be made in this regard are the infrastructure, the road
conditions, the state of cities such as Ramallah, as well as the improvement of citizens’ situation
and the investment atmosphere. However, the increase in Palestinian government spending was
the main reason behind this growth.” (Abdullah, 2012).
Abdulrahman (2012) contradicts Abdullah’s point and states that “the achieved economic growth
in the Palestinian territories is not real because it is not directly connected with any
improvement on the poverty and unemployment levels. This growth resulted from external aid,
the improvement of the tax collection system and the infrastructure projects that have been
implemented by the PA.”(Abdulrahman, 2012).
It is very important to mention here that the majority of international organizations share, by one
way or another, the opinion of Palestinian experts who do not consider the achieved economic
growth as real and sustainable growth.
The World Bank (2011): “Growth does not, however appear sustainable. It reflects the recovery
from the very low base reached during the second intifada and is still mainly confined to the
non-tradable sector and primarily donor –driven. Unemployment in WB&G has been amongst
the highest in the world this past decade, and though it has declines slightly recently, it remains
at 16.9% for the West Bank and 37.4% for Gaza.” (World Bank, 2011, P:5).
Also, UNCTAD (2011) clarifies that “While the economy of the occupied Palestinian Territories
(OPT) grew by 7.4 per cent in 2009 and 9.3 per cent in 2010, unemployment remained high, at
30 per cent in both years. The growth was driven by donor support, and reflects an economy
recovering from a low base. Economic growth has not altered the reality of worsening long-term
development prospects, caused by the ongoing loss of Palestinian land and natural resources,
isolation from global markets, and fragmentation. Unemployment, poverty and food insecurity,
especially in Gaza, continue to be alarming. The Palestinian Authority’s fiscal position remains
precarious, despite recent improvements. A large trade deficit and dependence on the Israeli
47
economy persist. New evidence suggests that the trade deficit with Israel is overstated by official
data, which mask “indirect imports”. The tax revenue on such indirect imports, currently lost,
could increase Palestinian public revenue by 25 per cent. Meanwhile, the economic
ramifications of the severance of East Jerusalem from the rest of the OPT call for serious
attention too.” (UNCTAD, 2011, P:1).
3. Conclusion
All the experts that have been interviewed, except for one, agree that the economic growth rate
that was achieved in 2010 is non-genuine and not sustainable since it is not linked to a marked
improvement on socio-economic development indicators in Palestine. All of them confirm that
this growth was driven from external aid and it was not a result of real economic activities
connected with the major productive sectors such as agriculture, industry and services. Also,
international organizations share these experts the same opinion. The next Chapter will explore
some statistical parameters that will help us verify the validity of these views, and the translation
of the achieved economic growth into socio-economic development.
48
Chapter IV: Socio-economic Development during and after the PRDP
It is very clear that the PRDP (2008-2010) was developed and based on the main concepts of
neo-liberalism. This approach did appear to have facilitated growth, but did that growth lead to
socio-economic development? This is the main question to be investigated in this chapter.
Before moving on to the analysis phase, it is important to put some definitions on the table as to
what constitutes development. Jonas (2010) clarifies that Cardoso (1979) provides an outline
consisting of three interlinked processes that are connected with economic, social and political
development. (Jonas, 2010) According to this conceptual framework, this chapter will
investigate development during and after the implementation phases of the PRDP (2008-2010),
beginning with economic development and moving on to social development, and concluding
with a brief summary of the PA’s role in this regard.
1. Economic Development during the PRDP
The PRDP is based on economic reforms, which are eventually, and indirectly, expected to lead
to socio-economic development. The structural changes provided by the PRDP reforms are
designed to create an efficient, decentralized and industrialized economy - the main reason for
achieving a highly developed economy. These structural developments are the main
methodologies and mechanisms for achieving the following: developing human and physical
capital; facilitating the growth of private sector enterprises; facilitating economic growth;
alleviating poverty; and more equitable distribution of resources across the population. The
following economic indicators are studied in order to verify whether the economic growth
achieved during the PRDP was translated into socio-economic development.
1.1 Structural Adjustment
After examining the PRDP, we notice that it undertakes measures that are similar to those that
one might be expected to find in a “structural plan” elsewhere in the developing world.
According to Leech (2012), “Fayyadism’s reforms fail to distinguish between rents that are
potentially productive and those that are damaging.” (Leech, 2012, P:16). These reforms were
created to satisfy the concerns and interests of donor states. These reforms adopted market-based
solutions without taking their adverse impact into consideration.
49
Palestinians were unable to deal with these reforms. The privatization of electricity and the pre-
paid system that was adopted in Area C, for example, was the main reason behind increasing
poverty and adding on to the hardships of Palestinians.
Khalidi questions the applicability of structural adjustment policies to the Palestinian territories.
He sees that the longstanding financial problems in the OPT have nothing to do with the
structural problems that can be adjusted. According to Khalidi, the main reason behind these
problems is the occupation and its control over the tax and customs clearance revenue. (Tartir,
Bahour and Abdelnour, 2012)
1.2 Gross Domestic Product (GDP)1
1.2.1 GDP during 2004-2011
The Gross Domestic Product (GDP) is considered as the main indicator for measuring the growth
and development of the economy. The report of the PCBS (2010) indicates that during 2008-
2010, the GDP of the Palestinian Territories increased to reflect the highest economic growth of
9.3% in 2010, despite the circumstances on the ground characterized by the economic and
political separation between the West Bank and Gaza Strip, as well as the Israeli practices in
both regions (PCBS (a), 2011).
According to PCBS reports (2011), “In 2007, the GDP in the Palestinian Territories had
increased by 5.4% while it increased by 11.4% in the West Bank compared to a decline by 8.0%
in the Gaza the Gaza Strip.” (PCBS (a), 2011, P:7).
On the other hand, the Palestinian Territories witnessed a 5.2% decline in the GDP in 2006
compared to 2005. Also, the Gaza Strip recorded a 20.1% decline in the GDP, while the West
Bank recorded a growth of 3.5%. During that period, the Palestinian Territories were undergoing
serious political and economic problems, which resulted in the irregularity of salaries paid to
public sector employees. In 2005, the GDP increased by 8.6% in the OPT (21.1% in Gaza and
2.5% in West bank compared to 2004). (PCBS (a), 2011).
1 This data excludes those parts of Jerusalem which were annexed by Israel in 1967.
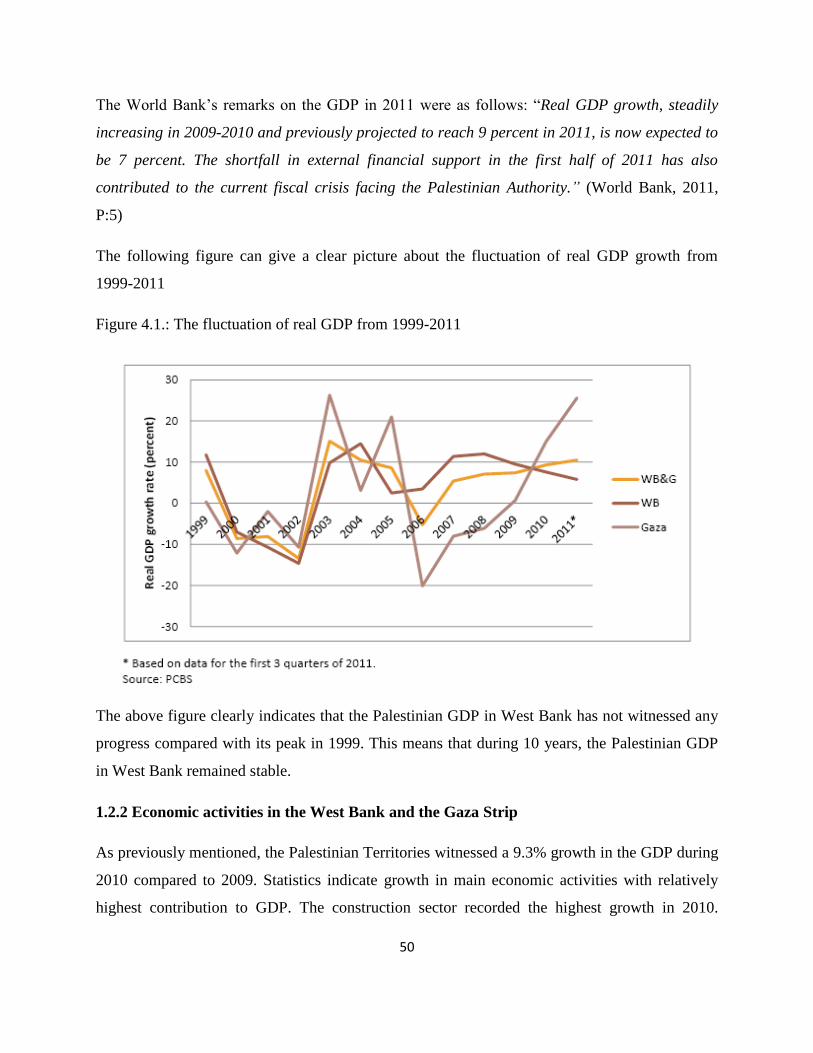
50
The World Bank’s remarks on the GDP in 2011 were as follows: “Real GDP growth, steadily
increasing in 2009-2010 and previously projected to reach 9 percent in 2011, is now expected to
be 7 percent. The shortfall in external financial support in the first half of 2011 has also
contributed to the current fiscal crisis facing the Palestinian Authority.” (World Bank, 2011,
P:5)
The following figure can give a clear picture about the fluctuation of real GDP growth from
1999-2011
Figure 4.1.: The fluctuation of real GDP from 1999-2011
The above figure clearly indicates that the Palestinian GDP in West Bank has not witnessed any
progress compared with its peak in 1999. This means that during 10 years, the Palestinian GDP
in West Bank remained stable.
1.2.2 Economic activities in the West Bank and the Gaza Strip
As previously mentioned, the Palestinian Territories witnessed a 9.3% growth in the GDP during
2010 compared to 2009. Statistics indicate growth in main economic activities with relatively
highest contribution to GDP. The construction sector recorded the highest growth in 2010.
51
According to PCBS Report (2011), “There are other activities which recorded growth of the
value added including agriculture, fishing and wholesale trade, transport and communication
services as well as Public Administration and Defense.” (PCBS Report, 2010, P:8). The
following table shows the percentage change of value added for main activities in 2010
compared to 2009. (PCBS (a), 2011)
A growth in most economic activities was witnessed in the West Bank. The contribution of
wholesale and retail activity was estimated to be about 18% of that growth. The value added in
the West Bank increased by 7.6% during 2010 compared to 2009. It is worth mentioning here
that all the economic sectors in the West Bank witnessed growth except for the mining and
manufacturing domains. The value added for mining and manufacturing recorded a 5.7%
decline. (PCBS (a), 2011)
The GDP in the Gaza Strip witnessed an increase by 15.1%. Construction was the main
economic activity and recorded the highest increase during 2010. This increase was by 232.2%
and accounted for 50.6% of the acute rise of the value added of most economic activities in the
Gaza Strip. In addition, the transport, storage and communication activities witnessed an increase
in their value added. A real improvement was marked in agriculture activity in the Gaza Strip by
34.6% compared to 2009, while the mining and manufacturing activities reflected fallback.
(PCBS (a), 2011)
According to UNCTAD (2011), “The 15 per cent GDP growth registered in Gaza in 2010 is
partly the result of recovery from a low economic base, whereby real GDP fell by 30 per cent
cumulatively between 2006 and 2009, and partly a reflection of relaxation of some Israeli
constraints on imports in mid-2010.” (UNCTAD Report, 2011, P:3). This improvement was
concentrated in the non-tradable sector, mainly construction, whose output doubled in 2010.
(UNCTAD, 2011).
In its 2011 report, UNCTAD states that “In Gaza, a modest relaxation of the Israeli blockade
over the last 18 months has enabled an improvement in economic activity.” (UNCTAD, 2011,
P:3).
52
The services sectors recorded the highest contribution to the GDP - 20.9% compared to a
contribution of 13.9% by public administration and defense. PCBS ensures that the contribution
of manufacturing and mining activities to the GDP reached 12.3% compared to 11.1% for trade
and 9.2% for construction activity. (PCBS (a), 2011)
According to PCBS (2011), “There are variations in the relative importance of the different
economic activities between the West Bank and Gaza Strip. The service activity is the highest
contributing activity to the GDP in the West Bank and Gaza Strip. Public administration and
defense represents the highest relative contributing activity after the service activity in the Gaza
strip compared to manufacturing and mining activity in the West Bank. The contribution of the
Agriculture activity to GDP in the Gaza Strip reached 9.4% compared to 5.3% in the West
Bank.” (PCBS (a), 2011, P:9).
In reaction to economic activities in the Palestinian Territories, the Israeli Government (2011)
stated that “Economic activity in the West Bank appears to have entered a slowdown, after two
years of rapid growth.” (GOI, 2011, P:6).
The Israeli Government (2011) argues that the private sector failed to reach its potential,
particularly the manufacturing sector. The economic slowdown justifies the fiscal crisis currently
plaguing the PA, which resulted from a decline in donor aid, and the inability to obtain loans
from the banking system to finance the shortfall. It is very important to mention here that the
West Bank’s economy still depends on the public sector and construction projects. These sectors
continue to be heavily financed by foreign aid that has also decreased tremendously. (GOI, 2011)
1.3 GDP per Capita
The GDP per capita is an important indicator that can be used for measuring the living conditions
of persons. In the Palestinian territories, the GDP per capita recorded an increase by 6.1% in
2010 to reach USD$ 1,502.4. (PCBS (a), 2011)
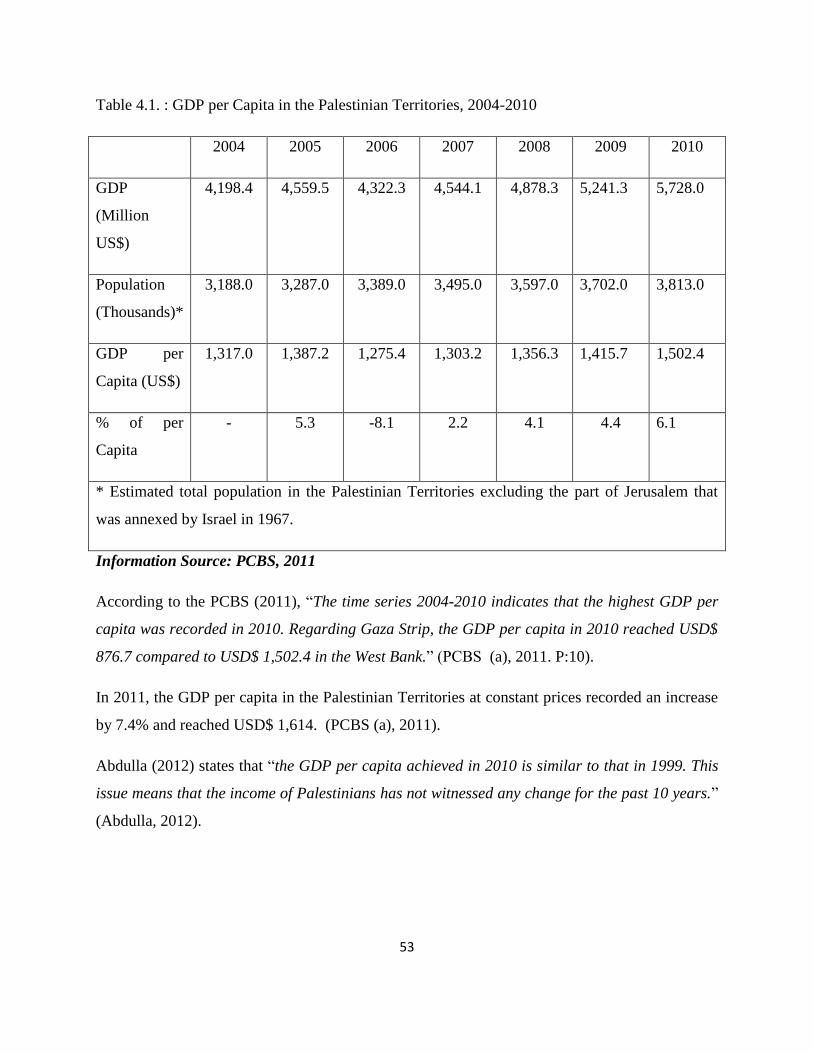
53
Table 4.1. : GDP per Capita in the Palestinian Territories, 2004-2010
2004 2005 2006 2007 2008 2009 2010
GDP
(Million
US$)
4,198.4 4,559.5 4,322.3 4,544.1 4,878.3 5,241.3 5,728.0
Population
(Thousands)*
3,188.0 3,287.0 3,389.0 3,495.0 3,597.0 3,702.0 3,813.0
GDP per
Capita (US$)
1,317.0 1,387.2 1,275.4 1,303.2 1,356.3 1,415.7 1,502.4
% of per
Capita
- 5.3 -8.1 2.2 4.1 4.4 6.1
* Estimated total population in the Palestinian Territories excluding the part of Jerusalem that
was annexed by Israel in 1967.
Information Source: PCBS, 2011
According to the PCBS (2011), “The time series 2004-2010 indicates that the highest GDP per
capita was recorded in 2010. Regarding Gaza Strip, the GDP per capita in 2010 reached USD$
876.7 compared to USD$ 1,502.4 in the West Bank.” (PCBS (a), 2011. P:10).
In 2011, the GDP per capita in the Palestinian Territories at constant prices recorded an increase
by 7.4% and reached USD$ 1,614. (PCBS (a), 2011).
Abdulla (2012) states that “the GDP per capita achieved in 2010 is similar to that in 1999. This
issue means that the income of Palestinians has not witnessed any change for the past 10 years.”
(Abdulla, 2012).
54
1.4 Prices and Purchasing Power
One of the most important indicators that affect the purchasing power is tracking the change of
prices. The Human Development Report – OPT (2009/2010) clarifies that “the overall Consumer
Price index increased from 3.8% in 2005 – 2006 to 9.8% in 2007-2008. The consumer index for
food rose by 14.6% from March to the end of April 2008 in the West Bank and 16.3% in the
Gaza Strip; the price of wheat flour increased by 73% in the West Bank and 68% in Gaza. These
increased prices are not only reflective of global increases but can be partially attributed to
increased transaction cost across the OPT and the economic blockade and containment of the
Gaza Strip.” (Human Development Report –OPT, 2009/2010, P:36).
On the other hand, the PCBS (2011) reported that during 2004-2010, the Consumer Price Index
(CPI) had risen by 29.0% taking into consideration the increase in average daily wages by
24.0%. It is worth mentioning here that the Consumer Prices Index had risen more rapidly than
the rate of change for daily wage workers in the years 2007, 2008 and 2009. (PCBS (a), 2011)
The annual Consumer Price Index in the West Bank and the Gaza Strip during 2010 had
recorded an increase by 3.75% compared to 2009. The overall Consumer Price Index during
2010 reached 129.0 compared to 124.34 in 2009. This growth was due to the increase in the
prices of food items and several products and services such as education and health. The growth
of CPI affects the purchasing power and the consumption pattern of Palestinian individuals. The
consumption pattern of Palestinian households includes food and drink by 37.6% followed by
housing by 10.4%, transportation by 9.9%, clothing by 6.9%, in addition to expenditure on goods
and recreational services, as well as services of restaurants and cafes. (PCBS (a), 2011)
In his paper, Tartir (2012) states that “Real income per capita needs a proper deconstruction
noticing the unbearable increase in the cost of living and the consumer price index.” (Tartir (b),
2012, P:2)
55
1.5 The Labor Market
It is very clear that the PRDP pays special attention to the labor market in Palestine. The PRDP
states clearly that its main objective is to facilitate an economic recovery which creates job
opportunities and reflects positively on the Palestinian labor market and labor force.
The Palestinian economy is largely dependent on labor for production; while resources such as
capital and land are very limited. The labor force recorded a lower participation in 2010
compared to 2009. During 2004-2010, the participation rate in the labor force ranged from
40.1% to 41.7%. This rate declined to 41.1% in 2010 compared to 41.6% in 2009. The number
of workers inside the labor force increased by 3.7% during 2010 compared to 2009. The year
2008 recorded a decline by 3.5% in the number of workers inside the labor force. The period
2004-2007 witnessed a continuous increase in the number of workers in the labor force. (PCBS
(a), 2011).
During the period 2004-2010, the Palestinian Territories witnessed fluctuation in the rate of
unemployment. The lowest rate was recorded in 2007 at 21.7%, while that rate reached 23.7% in
2010 compared to 24.5% in 2009. The West Bank witnessed a decline in the unemployment rate
from 17.8% to 17.2%, while the unemployment rate in Gaza strip also declined to reach 37.8%.
(PCBS (a), 2011).
The International Labor Organization affirmed an improvement in the unemployment rate in
2010. This improvement was attributed to the accelerated growth rate, but it is still considered
low in accordance with the international standards. (ILO Annual Report/oPt, 2010)
According to the World Bank’s 2011 report, 19% of the Palestinian population was unemployed
in 2011. The official data indicates that 780,000 people were working in the Palestinian
Territories in the first quarter of 2011 and there was an increase by 130,000 compared to the
previous year. This indicates a decrease in the unemployment rate by approximately 21.7%.
Young men and women are affected by this issue. In 2009, the unemployment rate among young
people was 10% higher than the overall unemployment rate. (World Bank, 2011)
56
According to Tartir (2012) , “Unemployment has remained at around 30% since 2009, with 47%
in Gaza in 2010, compared to 20% in the West Bank. Unemployment rate for Palestinian youth
under 30 is particularly alarming standing at 43%. The income and opportunities inequality gap
continues to widen not only between the West Bank and Gaza, but also within the West Bank.
Thinking of the gap between the city of Ramallah, the new Paris of the Middle East, with its
bubbled economy and the Jenin refugee camp, southern Hebron, or even the villages outside
Ramallah, not to mention areas C, can give a taste of the ‘new’ inequality phenomenon.” (Tartir
(b), 2012: P:2).
The GDP growth achieved in 2010 was “jobless”. This growth failed to find a realistic solution
for the high unemployment rate that has persisted for a decade. The growth was achieved largely
by better utilization of existing resources but without a remarkable increase in investment. The
private sector is very weak and faces high risk. These factors explain the lack of progress on job
creation. According to UNCTAD, “the unemployment rate in the Palestinian Territories is
amongst the highest in the world.” (UNCTAD, 2011, P:5).
Based on all the reviewed documents, the persistence of high unemployment rates within the
Palestinian labor force poses a threat on the life of the Palestinian people, not to mention the
strains imposed on the social fabric and on solidarity. The interruption of production activities
can lead to the deskilling of Palestinian institutions and workers, which could be one of the main
reasons behind the destruction of human capital.
57
1.6 Balance of Payments (Current Account)2
Balance of Payments (BoP) is an indicator used to measure transactions between residents of the
Palestinian Territories and non-residents in a given period. This indicator gives detailed
information in receipts and payments between the domestic economy and other countries of the
world. Balance of Payments consists of two major accounts: The Current Account and the
Capital3, and the Financial Account.
According to the PCBS (2011), “In 2004, the deficit in current account reached USD$ 1,516
Million. During 2005-2008, current account witnessed significant and continuous improvement.
In 2005, the deficit in current account decreased by 24.0% compared to 2004 and continued
until the year 2006. The year 2008 witnessed a surplus in current account by USD$ 535.1
Million resulted from a rise in net transfers from abroad, in addition to an increase in net
income, especially compensation of workers. In 2009, current account declined resulting in a
deficit of USD$ 736.8 Million, despite the fact that it was the lowest deficit recorded since
2003.” (PCBS (a), 2011, P:27).
One of the main reasons behind this deficit was the increase in the value of imports of goods and
services to Palestine, which was reflected in deficit in the trade balance, as well as the decline in
current transfers received from abroad. This deficit can reflect negatively on social indicators -
the fluctuation of poverty rate during the implementation phases of the PRDP, as an example.
It is worth mentioning here that the Palestinian economy depends heavily on foreign transfers
received by the PA. Foreign transfers are used in order to support the General Budget of the PA.
The latter seeks to reduce dependence on foreign transfers but is unable to find key solutions to
cover this deficit.
2 Current account is subdivided into four major categories: goods, services, income and current transfers. 3 Capital account is divided into capital transfers and acquisitions/disposals of non-produced non-financial assets. The items that
are recorded under capital transfers include investment grants (including cash transfers for purchases of investment goods), debt
forgiveness and migrants’ transfers. Non-produced, non-financial assets are mainly licenses, franchises and patents. Also,
included acquisitions/disposals of land by representative offices of foreign governments, for example foreign embassies.
Financial Account: Transactions in financial assets and liabilities are recorded in the financial account. Financial stocks can be
divided into four broad categories: direct investment; portfolio investment; other investment (mainly currency, deposits and
loans); and reserve assets.
58
1.7 The PA’s Fiscal Situation
In the last few years, the PA carried out strict fiscal reforms in order to control the budget deficit.
The fundamental aim of these reforms was to improve fiscal discipline and reduce dependency
on donor aid by reducing the budget deficit. These reforms were developed in order to put the
Palestinian economy on the path to financial stability – a path designed to create room for
increasing capital investment and developing the expenditure system.
The budget deficit recorded a drop to 15% in 2010 from 24% in 2009. The PA was able to
achieve this result by a combination of spending controls, especially pertaining to the
containment of public employment and wages, and enhanced revenue collection. (PCBS (a),
2011)
According to UNCTAD report (2011), “Tax revenue grew by 57 per cent in 2010, and total
public revenue grew by 22 per cent, to $1.9 billion, while expenditure was reduced by 4 per cent.
On a commitment basis, the recurrent budget deficit was $1.2 billion in 2010, down from $1.6
billion in 2009, and the total budget deficit stood at $ 1.5 billion.” (UNCTAD, 2011, P:7).
During the first quarter of 2010, budget indicators implied significant progress towards fiscal
sustainability, but this progress did not reveal definite prospects. Despite the achieved economic
growth in 2010, tax revenue covered only 15% of total spending, and spending on public
investment remained very low. The public investment accounted for less than 10 % of the total
spending and about 4% of the GDP. (UNCTAD, 2011)
One of the main indicators of fiscal weakness in Palestine is the fact that 42% of total spending
was financed by donors. It is worth mentioning here that dependence of foreign aid is neither
stable nor sustainable, taking into consideration the current state of the world economy.
(UNCTAD, 2011)
The World Bank (2011) stated that “in 2010, shortfalls in expected aid disbursements forced the
PA to resort to borrowing from domestic banks to bridge the spending gap, thus increasing
domestic dept to more than 11 percent of GDP.” (World Bank, 2011, P:7).
59
It seems that the poor should pay the cost of fiscal reforms. In 2011, the PA decided to cut net
lending by 37%, thus reducing it to 3.4% of the GDP from 11% in 2011. Also, the PA had plans
to eliminate net lending by 2011, with the full privatization of electricity companies (IMF, 2011).
Based on the expectations of the WFP, 43% of Palestinian households that use utility bill
payment deferral to cope with the crisis will be affected negatively by the moves towards the
elimination of net lending (UNCTAD, 2011).
The World Bank (2012) stated clearly in its last report that was published on 21 March, 2010 that
“The PA’s fiscal situation appears likely to worsen in 2012…the projected recurrent deficit is
expected to be about US$ 1.1 billion. This represents a nearly 14 percent decline from decline
from the 2011 budget.” (World Bank, 2012, P: 8).
Based on the aforementioned, the PA needs to set strict measures in order to control spending
and increase revenue, and these measures could have a drastic social impact on the Palestinian
people.
1.8 The Government Sector
The government sector accounts for 22.2% of the Palestinian GDP, which calls upon the
necessity to highlight the financial situation of the PA, taking all political and financial changes
into account. (PCBS (a), 2011)
Israeli practices contribute to weakening socio-economic development in the Palestinian
Territories. The development of the PRDP (2008-2010) was a turning point in the role of the
governmental sector.
1.8.1 Governmental Revenue
The year 2010 witnessed a significant increase in the revenue of the central government and a
decrease in government expenditures. This increase reduced the deficit of the general budget.
Also, the year 2010 witnessed impressive progress in the field of tax collection in line with the
PRDP. Local revenues (tax and non tax revenues) constituted 39.0% of total revenues. This
amount was useful in order to cover current expenditure with less dependence on external
transfers to support the general budget. PCBS states that “in 2010, total revenues of the
60
Palestinian Authority amounted to US$ 1.9 billion, marking an increase by 21.6%. The collected
tax revenues had reached US$ 487.2 million, which is the highest since 2004 making an increase
by 59.0% compared to 2009.” (PCBS (a), 2011, P:33)
According to the World Bank (2011), “Also, the year 2010 had witnessed an increase in the tax
clearance revenue by 15.1% compared to 2009. This increase resulted from the efficiency in the
application of the taxation system and improvement in the imports. PCBS (2011) indicates that:
“Total tax clearance revenue had reached US$ 1,269.4 million in 2010 compared to US$
1,103.2 million in 2009.” (PCBS (a), 2011, P:33).
On the other hand, UNCTAD (2011) ensured that the PA was required to continuously cope with
the volatility both of aid disbursement, and of the revenue it collects. According to UNCTAD,
the PA revenue instability is caused by a number of factors, mainly the volatility of the tax base,
and the level of economic activities affected by the Israeli closure policy and military practices.
The Israeli control over the tax and customs clearance revenue, which it collects on behalf of the
PA, is another major factor of fiscal instability in the PA. Since the customs clearance represents
60-70% of the total PA revenue, this control is destabilizing the Palestinian economy.
(UNCTAD, 2011). In early May 2011, for example, Israel withheld US$ 100 million in customs
clearance revenues owed to the PA following Palestinian national reconciliation efforts. (BBC,
2011)
According to UNCTAD (2011), “The unpredictability of Israel’s clearance of Palestinian
customs-related revenues has a major impact on Palestinian economic development, and can
easily destabilize public consumption and investment.” (UNCTAD, 2011, P:8).
It is worth mentioning here that unpredictability makes fiscal planning difficult, undermines the
PA’s ability to pay salaries for public employees and threatens its ability to pay private sector
agents who supply it with goods and services. Furthermore, international support and positive
growth cannot be translated into sustainable economic gains without ensuring the stability of
Palestinian tax revenues and reducing the restrictions imposed on the access of Palestinian
producers to external markets.
61
1.8.2 Government Expenditure
The Palestinian Central Bureau of Statistics (2011) indicates that “salaries and wages constitute
52.0% of the total government expenditure in the Palestinian Territories.” (PCBS (a), 2011,
P:34).
In 2010, Government expenditures were reduced by US$ 3,101.7 million compared to US$
3,189.8 million in 2009. The main reason for this decline was the result of the 8.2% decrease in
non-wage expenditures. On the other hand, wage expenditures witnessed a 10.9% increase in
2010 reaching their highest level at US$ 1,626.8 million. (PCBS (a), 2011).
It is worth mentioning here that the implementation period of the PRDP witnessed a modest level
of essential recruitment, particularly in the health and education sectors. This had a negative
influence on the ability of these two sectors to meet the demand of the Palestinian population
(growing at approximately 4% yearly) for basic services. (PRDP, 2008)
On the other hand Khalidi (2011) states that “the public sector payroll, at an estimated $1.7
billion, constitutes almost 25% of the GDP. But the GDP is depressed structurally as a result of
the prolonged occupation, hence, the public sector share of a small total GDP appears large.
The public sector share of the GDP even seems to be undergoing inflation.” (Khalidi, 2011)
In terms of net lending, the PRDP considers the cost of subsidizing citizens’ consumption of
energy and electricity as a significant drain on the Palestinian government’s financial resources.
The main intension of the PRDP is to reduce net-lending through the development of a new
collection system that incorporates enforcement measures, such as the obligation of citizens to
present a certificate of payment in order to obtain any public service. Considering the devastating
poverty rate in the West Bank, these measures generate more hardships for Palestinians and
create a lot of obstacles in the daily life of the Palestinian citizen.
Last but not least, the increase of infrastructure expenditures resulted in a 19.3% decline in the
budget deficit in 2010 to reach US$ 1.5 million, and the dependence on external support
witnessed a 14.6% decrease during the same year. (PCBS (a), 2011). This increase did
contribute to economic growth, but the main question here is whether it benefited all the
categories of the Palestinian population.
62
1.9 The Private Sector
According to the PRDP, “the Palestinian private sector must be the engine for sustainable
economic growth. It needs to generate productive employment, produce high value-added goods
and services, and enhance national prosperity.” (PRDP, 2008, P:6).
The private sector comprises 77.8% of the total GDP. According to the classification of National
Accounts, the private sector consists of households, non-governmental organizations, financial
and non-financial institutions. The number of workers in the private sector witnessed an increase
by 6.6%. The number of workers who were employed in the private sector in 2010 was 465
thousand. The daily wage increased to reach 74.3 NIS, and the value added for the private sector
reached US$ 4.5 billion in 2010. (PCBS (a), 2011)
According to UNCTAD (2011), “the Palestinian private sector continues to be constrained by
years of restrictions on movement and access, blockade, extremely limited access to external
markets to export goods and import production inputs, and shrinking capital and natural
resources bases.” (UNCTAD, 2011, P:2).
Restrictions imposed by the Israeli government are chief obstacles confronted by the Palestinian
private sector, and they play a major role in hindering its growth. Israel maintains security
control and jurisdiction over planning and construction in close to 60% of the West Bank area
(Area C) despite that fact that the PA is responsible for the provision of services in that area. For
example, “the PA can provide a teacher, but not build a school for the teacher to teach in.”
(World Bank, 2012)
Israel also has control and jurisdiction over the telecommunications sector. Since it retains
control of the electromagnetic spectrum, it hampers the operation of Al Wataniya Company, for
example.
Another example is the official list of military and dual-use items that was released by the Israeli
authorities on 5 July, 2010. One of the lists includes 15 categories of general items that are
prohibited - fiber glass based raw materials, drilling equipment, fertilizers, etc. Another list
contains 19 types of construction materials, which are limited to specific projects approved by
63
the PA and implemented through financial grants received from international organizations. (UN
OCHA OPT, 2010)
Land is considered a common means of storing wealth and economic assets. They provide a
foundation for economic activity in various sectors – agriculture, industry, housing, tourism. The
PA’s lack of control over Area C has profound detrimental effects on the Palestinian economy.
(World Bank, 2010). This situation also handicaps Palestinian economic activity in the Jordan
Valley, since most of the Jordan Valley is in Area C. This situation “denies Palestinians a
potential powerhouse of export-oriented high value agriculture.” (World Bank, 2012).
According to a study pertaining to the development of the agricultural and industrial sectors, “an
appropriate combination of new irrigation and growing technologies with “old” greenhouse
growing technologies and some open-field crops would enable Palestinians to develop, on
approximately 50,000 dunum4 in the Jordan Valley, an export-oriented high-value vegetable,
flower, and herb industry valued at around US$1 billion per year.” (Gal et al. 2010). Also this
study focuses on food processing and other industries which can be developed and linked with
this issue.
Due to the security measures, most Palestinians are denied access to East Jerusalem. Historically,
East Jerusalem was the center of the West Bank economy and society. The separation of East
Jerusalem from the West Bank regions also has devastating economic and social effects. (World
Bank, 2010).
The expansion of Israeli settlements in the West Bank also had negative effects on economic
activity and on the role of the private sector in achieving economic development. According to
Peace Now, “in 2011, there was a 20 percent increase in construction starts in Israeli
settlements in the West Bank, and the highest number in a decade of plans in East Jerusalem.”
(Peace Now, 2012)
4 1 dunum = 1,000 square meters
64
In response to the research question regarding the situation of the private sector, especially
following the reforms that took place during and after the PRDP, Dr. Samir Hazboun (2012)
stated the following: “The role of the private sector was improved on two levels; the
governmental level and the community level. At the governmental level, representatives of the
private sector are more involved in the planning phases of the Palestinian government, and some
people affirm that the Prime Minister is the main representative of this sector. At the community
level, the private sector begins to organize itself in the form of unions, and donor funds become
oriented towards these unions. Hazboun states that the private sector is suffering from different
constrains, including the restriction of movement imposed by the Israeli government, which
increases transaction costs and practices of the Palestinian government. During the first quarter
of 2012, the Palestinian Government demonstrated its strength in this sector, especially after
raising the rate of the imposed income tax from 15% to 30%, to be fixed later on at 20%. The
Palestinian government also imposed the necessity of professional licenses obtained from the
Palestinian Ministry of Economy. All these practices have a negative effect on the comparative
advantage of the Palestinian labor force, in comparison with the other forces in the region.”
(Hazboun, 2012)
Bahour (2012) states that “the private sector has not witnessed any progress. It is very important
to analyze the private sector in the Palestinian Territories. The private sector is not a single unit -
90% of the private sector consists of Small and Medium Enterprises (SME), which form the core
of the Palestinian economy. The Palestinian government is encouraging business communities
rather than SMEs. One of the examples that can be mentioned here is the Palestinian
Telecommunications company. This company is making an annual profit of US$120 million and
not suffering any losses. It continues to receive incentives form the Palestinian government and
has not paid income tax for the past 20 years. Minister of Economy, Dr. Hasan Abu Libdeh took
a slapdash step when he decided to establish a small department for SME’s at the Palestinian
Ministry of Economy. Bahour believes that there is no sense in establishing such a department at
the Ministry that would solely work for the interest and success of SME’s. (Bahour, 2012)
65
1.10 Trade Balance
The PRDP is committed to implementing institutional reforms in order to create an enabling
environment for private sector investment, trade and growth. One the most important indicators
that has to be studied when it comes to trade are the trade balance.
The trade balance involves exports and imports, and it is considered to be one of the major
components of GDP, and used in current accounts for the Balance of Payments.
In 2010, the value of exports reached US$ 1,378 million while the value of imports reached US$
5,367 million. This was the main reason of a deficit by 6.3% in the trade balance. (PCBS (a),
2011)
PCBS indicates that “imports from Israel comprised 75.0% of total exported goods and services
to the Palestinian Territories. This reflects the degree to which the Palestinian economy is
dependent on Israel.” (PCBS (a), 2011, P:29)
According to the World Bank (2011), “since 1967, trade in WB&G has been overwhelmingly
oriented towards Israel. As of 2008, Israel accounted for nearly 89 percent of WB&G’s exports
and 81 percent of imports. The majority of exports were for low value added goods that required
a minimal level of processing.” (World Bank, 2011, P:13).
As previously mentioned, the several years of restrictions, denial of access and blockades,
extremely limited access to external markets for the export of goods and import of production
inputs. On the other hand, GOI pointed out a good indicator pertaining to Israeli cooperation
with the PA in the following statement: “Israel was the destination for 90.3% of Palestinian
exports and the source for 65.2% of Palestinian imports.” (GOI, 2011, P: 7). These figures
indicate the Israeli government’s obstruction of any possibility to extend economic activities and
enhance the export led-oriented strategy within the PA.
Indirect imports from Israel are another indicator that has to be taken into consideration in this
regard. The UNCTAD report revealed that imports produced in a third country and re-exported
to the Palestinian Territories as if they were produced in Israel was the main reason that led to
66
the following losses; US$ 480 million per year (25% of public revenue), 10 % in lost GDP and
30000 jobs opportunities per year. (UNCTAD, 2011)
The deficit in the Trade Balance reached its highest in 2010 while the lowest was in 2004.
(PCBS (a), 2011).
The size of the Palestinian market is very small compared to other countries in the region and
around the world. Without access to regional and world markets, Palestinian producers will not
be able to achieve the minimum efficient scale. Competition within international markets will
force Palestinian producers to improve their productivity and this issue will have a positive
impact in terms of increasing employment, raising wages and alleviating poverty. The majority
of Palestinian exports counted for low value added goods. If the PA is talking about a real and
sustainable economic growth, the Palestinian economy must increase overall trade, expand trade
beyond the Israeli market, and increase the value added in exports. To accomplish this, an
appropriate trade policy regime must be in place, including the necessary institutional,
regulatory, and physical infrastructure that would facilitate trade.
1.11 The Investment Climate and the Characteristics of Economic Activities
1.11.1 The Investment Climate
The investment climate in West Bank and the Gaza Strip has been severely hampered by the
Israeli closures. The restriction of movement for goods and people within and across borders was
the main reason behind the increase of transportation costs and discouraging private and foreign
direct investment. According to the World Bank (2011), “This has created a fragmented private
sector that is driven by low-cost, labor-intensive products such as garments, furniture, and shoes
for the heavily protected domestic and Israel markets.” (Word Bank, 2011, P:22).
In its most recent report, the World Bank pointed out that the restrictions imposed by the Israeli
government have an extremely negative effect on the investment climate, plus, the PA is the only
responsible entity to take further steps in order to improve the business environment and attract
foreign direct investments. (World Bank, 2012)
67
1.11.2 The Characteristics of Economic Activities
One way to look at the structure of economy is to compare the conditions and the shares of its
major sectors; agriculture, industry and services. In the Palestinian context, tourism has to be
included in these sectors.
1.11.2.1 The Services Sector
The contribution of the services sector to GDP is the highest among economic activities. This
contribution reached 20.9% in 2010. Also, this sector constitutes the highest employment rate
and incorporates 271 thousand workers. (PCBS (a), 2011)
According to Attalah (2012), “there is no doubt that the services sector has a significant
contribution to the Palestinian GDP, but it does not have any competitive advantages since most
of the provided services do not require high technology and high-skill labor” (Attalah, 2012).
It is worth to mention here that this sector has to be developed and based on high technology in
order to compete at the regional and international levels.
1.11.2.2 Industry
The industrial sector in the Palestinian Territories witnessed decades of underinvestment. The
Israeli policies were the main reason behind this long term trajectory of stagnation and de-
development. One of the fundamental aims of the PRDP is to create a support system that would
stimulate private sector investment and link it to other sectors, such as agriculture and
construction.
The statistics of PCBS revealed that the contribution of manufacturing to GDP reached 12.3%
and the number of workers in this sector amounted to 73 thousands. The added value of this
sector declined by 5.5% during 2010. (PCBS (a), 2011)
The steady decline of the manufacturing sector is a major concern, not only because of the
potential output loss, but also because of its long-term implications, which are related to the
technological regression. It is worth mentioning here that this sector tends to be more innovative
68
and efficient than companies that produce non-tradable goods. The non-tradable goods sector is
not exposed to the rigors of global competition. (UNCTAD, 2011)
According to UNSCO (2011), “Real GDP growth between 2009 and 2010 was caused mainly by
an increased number of workers and labor force, while the labor productivity was declined.”
(UNSCO, 2011).
Khalidi (2011) states that “UNCTAD estimated that about one third of the productive capacity
that existed prior to the second intifada was lost.” (Khalidi, 2011).
Attalah (2012) states that “if we compare between the share of industry to the GDP in 2010 and
1999, we would not notice any improvement. This issue has negative consequences on the
Palestinian economy, if we are talking about sustainable development.” (Attalah, 2012).
1.11.2.3 Agriculture
The agricultural sector in Palestine is a critical industry, because it mainly contributes to food
security. The improvement of this sector can contribute effectively to immediate economic
recovery through the creation of export development strategies based on highly advanced
business models.
The PRDP clarifies very well that this sector has to be developed in such a way that could
promote the cultivation of higher value added cash crops, marketing services and create
agricultural exports to regional and global markets based on improving the trade infrastructure.
According to PCBS (2011), “The cultivated land area comprises 16.0% of the total area of the
Palestinian Territories during the agricultural year 2009/2010, based on the preliminary results
of the Agriculture Census 2010. The contribution of agriculture to GDP reached 6.2% and the
value added of agriculture increased by 22.8% during 2010. The number of workers in the
agricultural sector increased by 6.3% to reach 81 thousand in 2010.” (PCBS (a), 2011, P:38)
However, the growth rate in agriculture came after a continuous decline that spread over a
decade and therefore, cannot be considered as a good indicator. Hazboun (2012) states that
“there is continuous progress in the Palestinian agricultural sector but it is connected with new
structural changes. These structural changes are summarized in adjusting domestic agricultural
69
products to meet the demands of Israeli markets instead of meeting those of domestic markets,
and the separation between the West Bank and the Gaza Strip that contributes to increasing the
dependency of this sector on Israel. These structures contributed to an increase in the prices of
agricultural products and had a negative effect on the purchasing power of the Palestinian
citizen.” (Hazboun, 2012).
Azmi (2012) states that "there is a deterioration in the agricultural sector, but this deterioration
is not the responsibility of PA. There are a lot of factors which have to be taken into account.
According to the 2010 statistics, the contribution of this sector to GDP was about 5.9%. This
percentage reflects a huge deterioration of this sector compared to 2000 (14%). The agricultural
sector in Palestine suffers from low productivity despite the fact that 15% of the Palestinian
labor force is part of this sector.” (Azmi, 2012).
1.11.2.4 Tourism
Tourism has played an important role in the Palestinian economy. It represents a major source of
income for the future Palestinian state. Also, this sector is a way for bridging people from
different countries and cultures.
The tourism sector is significantly influenced by the political reality of the Palestinian
Territories. The Israeli occupation, the siege and the instability are all factors that hamper the
growth of the tourism sector and its contribution to the Palestinian economy. The Palestinian
Territories are rich in their religious and cultural heritage but the contribution of the tourism
sector to GDP does not exceed 3.0%. (PCBS (a), 2011)
According to PRDP, the contribution of the tourism sector to GDP exceeded 10% in 2007. This
percentage reflects the existence of several problems when we take into account the 3%
contribution of this sector to the GDP in 2011.
70
The PRDP draws attention to the rehabilitation of historical sites without taking into
consideration the quality of human resources that will assume the responsibility of managing this
sector.
Abueita (2012) states that “in recent years, there was an increase in the number of incoming
tourists, but no remarkable development was witnessed with regard to the services provided by
the tourism sector. The Israeli occupation makes it difficult for the PA to create an investment
environment and open new markets." (Abueita, 2012).
It is very important to conclude that this sector in general suffers from poor infrastructure,
decaying heritage sites and low marketing capacity. In order to ensure the sustainability of this
sector, the PA needs to take into account the systematic changes that contribute effectively to
upgrading the quality of the visitors’ experience.
1.12 Poverty
The PRDP proposes a package of services that have to be provided to the local community. This
package is based on direct intervention in order to alleviate poverty and implement activities that
would enable the poor and vulnerable to become more self-reliant.
Poverty is considered to be one of the most important indicators that reflect the performance of
the economy. According to PCBS, “about 25.7% of persons in the Palestinian Territories
suffered from poverty during 2010 (18.3% in the West Bank and 38.0% in the Gaza Strip).”
(PCBS (a), 2011, P:26).
The statistics of PCBS revealed that one out of four individuals was living below the poverty line
in 2010, and the same rate was recorded for 2009. Furthermore, these statistics indicated that
14.1% of individuals were living below the deep poverty line in 2010 (8.8% in the West Bank
and 23.9% in the Gaza Strip). (PCBS (a), 2011)
PCBS ensured that social assistance provided to households in 2010 was the main reason behind
the alleviation of poverty by 16.8% within Palestinian households in the Palestinian Territories.
(PCBS (a), 2011).
71
UNCTAD (2011) had a different opinion in this regard: “Despite GDP growth in 2010, poverty
and food insecurity decreased only slightly-remaining high throughout the OPT, not just in the
Gaza Strip.” (UNCTAD, 2011, P:5).
According to the WFP (2011), “50% of Palestine households in the Palestinian Territories were
impacted by food insecurity - 33% were classified as food insecure and nearly 17% were
classified as vulnerable to food and insecurity.” (WFP, 2011)
During his interview, Bahour (2012) stated that “poverty in Palestine is a serious problem. Last
December, the Palestinian Government decided to use the soft definition of poverty instead of the
hard definition. This decision was made to refrain from reflecting the status quo, which is really
a disaster.” (Bahour, 2012).
Bahour (2012) views deep poverty in Palestine as a new phenomenon in Palestinian society,
which has not existed prior to Oslo. (Bahour, 2012).
Palestinian survival during these hard times was clarified by the FAO: “The Palestinian people
have used various strategies to cope with poverty and food insecurity. These strategies have
included – in addition to borrowing - receiving food support from family and friends, restricting
food to adults in order to feed children, reducing health and education spending, running down
savings, and selling off jewelry, furniture, and productive assets.” (FAO, 2010, P:45)
What was the result? Overdue utility bills, lower quality and quantity of food intake, and
increased borrowing – posing a threat to Palestinian health and human capital formation in the
long-run.
72
2. Social Development
According to the PRDP (2008), economic growth requires a work force characterized by strong
work ethics, good knowledge, skills and experience – all required by the private sector. Also
economic growth requires healthy people. All of these indicators need to ensure the following:
- A modern curriculum in the primary and secondary stages.
- Relevant Tertiary education.
- High enrolment rates.
- High quality educational system and educators.
- High quality of health services.
- Significant capital investment.
It is worth mentioning here that economic growth is a means to economic development, which
leads to social development. The fundamental aim of this chapter is to assess social development
in Palestine, based on education, health and other measurements.
Regarding social development in Palestine, Alaa Tartir (2012), a Policy Advisor in Al Shabaka
(The Palestinian Policy Network) stated the following: “In my opinion the social aspect of
development needs more time to be tracked and felt. For sure, two years of implementation of the
PRDP are not enough per se to conclude whether social development was achieved. If you mean
health and education indicators for instance, maybe I would say yes, to some extent, since some
better service delivery was achieved there in comparison to the past. However, I do not consider
this social development. I consider it a better public service delivery which is a duty of the PA.
What matters here is the empowerment and enhancement of the capacities and choices of the
people to conclude whether social development was achieved. This is what I believe to be more
important than the indicators concerning the increase of the number of classes or beds.” (Tartir
(a), 2012)
73
Hazboun states that social development in Palestine is deteriorating significantly. The economic
growth achieved creates a gap between the capitalists and the poor people. Hazboun does not
want to have the Latin American model, especially the high rate of poverty and unemployment.
Hazboun clarifies that the Palestinian Government should refer to the Palestinian Development
plan, which was developed by Dr. Yusuf Sayegh (1990 -2010) as a long term development plan
that carries the clear slogan: “no development under occupation.” (Hazboun, 2012).
Nakhlah (2012) shares Hazboun’s opinion. For him, there are no signs or indicators for real
social development in Palestine during the implementation phases of the PRDP. The catholic
marriage between the capitalists and the decision makers leaves a negative impact on the
distribution of wealth, contributes to the creation of monopolies, increases poverty and
unemployment rates, and produces a fracture in Palestinian society that has been domesticated
with loans and debts that prevent people from expressing their opinions freely. According to
Nakhlah (2012), “education continues to deteriorate. Tertiary education institutions are not able
to cover their running costs and suffer from deficits. There is a lack in teaching tools. On the
other hand, the health sector is suffering from many problems represented by lack of investment
and brain drain phenomena. Citizens resort to obtain distinct medical services from neighboring
countries.” (Nakhla, 2012).
Abdullah (2012) has a different opinion regarding social development in Palestine. He believes
that real social development was achieved during and after the implementation phases of the
PRDP. “Services are more accessible now and high in quality. Services are accessible to only
those who need them the most, with a special focus on marginalized people.” (Abdullah, 2012).
2.1 The Human Development Index
The Human Development Index provides a composite measure of four dimensions of human
development; life expectancy, adult literacy, gross enrolment in education and decent standard of
living, measured by PPP and income.
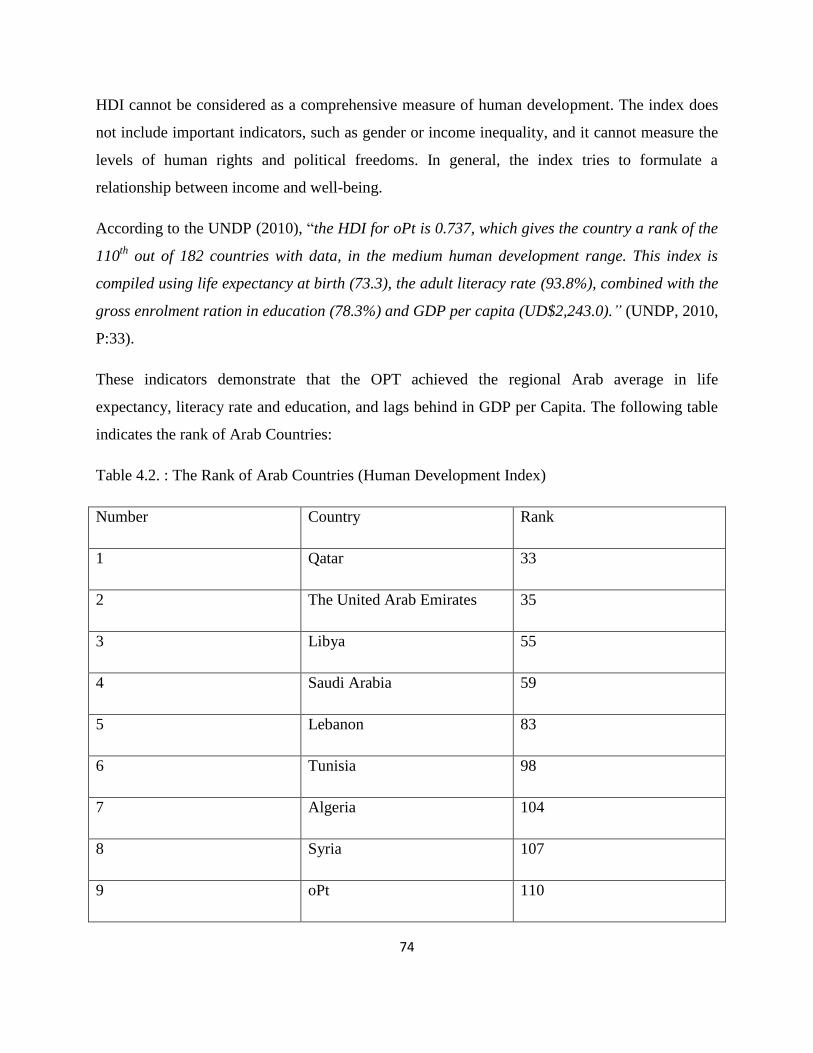
74
HDI cannot be considered as a comprehensive measure of human development. The index does
not include important indicators, such as gender or income inequality, and it cannot measure the
levels of human rights and political freedoms. In general, the index tries to formulate a
relationship between income and well-being.
According to the UNDP (2010), “the HDI for oPt is 0.737, which gives the country a rank of the
110th
out of 182 countries with data, in the medium human development range. This index is
compiled using life expectancy at birth (73.3), the adult literacy rate (93.8%), combined with the
gross enrolment ration in education (78.3%) and GDP per capita (UD$2,243.0).” (UNDP, 2010,
P:33).
These indicators demonstrate that the OPT achieved the regional Arab average in life
expectancy, literacy rate and education, and lags behind in GDP per Capita. The following table
indicates the rank of Arab Countries:
Table 4.2. : The Rank of Arab Countries (Human Development Index)
Number Country Rank
1 Qatar 33
2 The United Arab Emirates 35
3 Libya 55
4 Saudi Arabia 59
5 Lebanon 83
6 Tunisia 98
7 Algeria 104
8 Syria 107
9 oPt 110
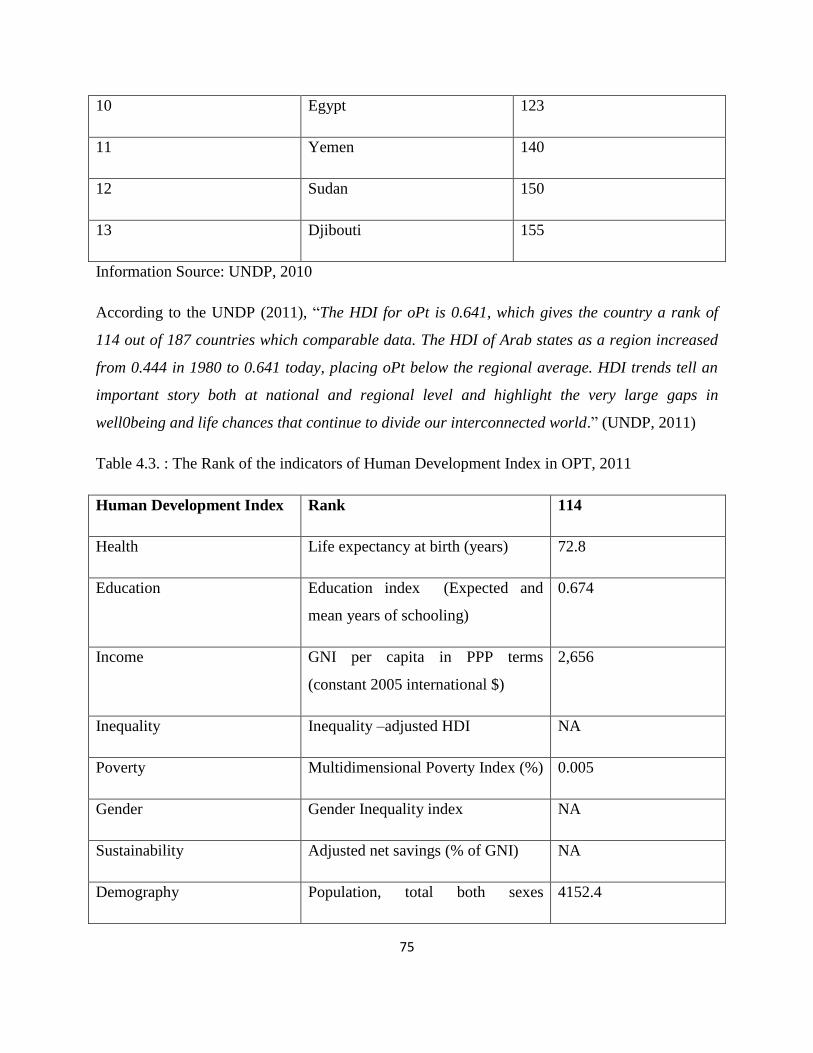
75
10 Egypt 123
11 Yemen 140
12 Sudan 150
13 Djibouti 155
Information Source: UNDP, 2010
According to the UNDP (2011), “The HDI for oPt is 0.641, which gives the country a rank of
114 out of 187 countries which comparable data. The HDI of Arab states as a region increased
from 0.444 in 1980 to 0.641 today, placing oPt below the regional average. HDI trends tell an
important story both at national and regional level and highlight the very large gaps in
well0being and life chances that continue to divide our interconnected world.” (UNDP, 2011)
Table 4.3. : The Rank of the indicators of Human Development Index in OPT, 2011
Human Development Index Rank 114
Health Life expectancy at birth (years) 72.8
Education Education index (Expected and
mean years of schooling)
0.674
Income GNI per capita in PPP terms
(constant 2005 international $)
2,656
Inequality Inequality –adjusted HDI NA
Poverty Multidimensional Poverty Index (%) 0.005
Gender Gender Inequality index NA
Sustainability Adjusted net savings (% of GNI) NA
Demography Population, total both sexes 4152.4
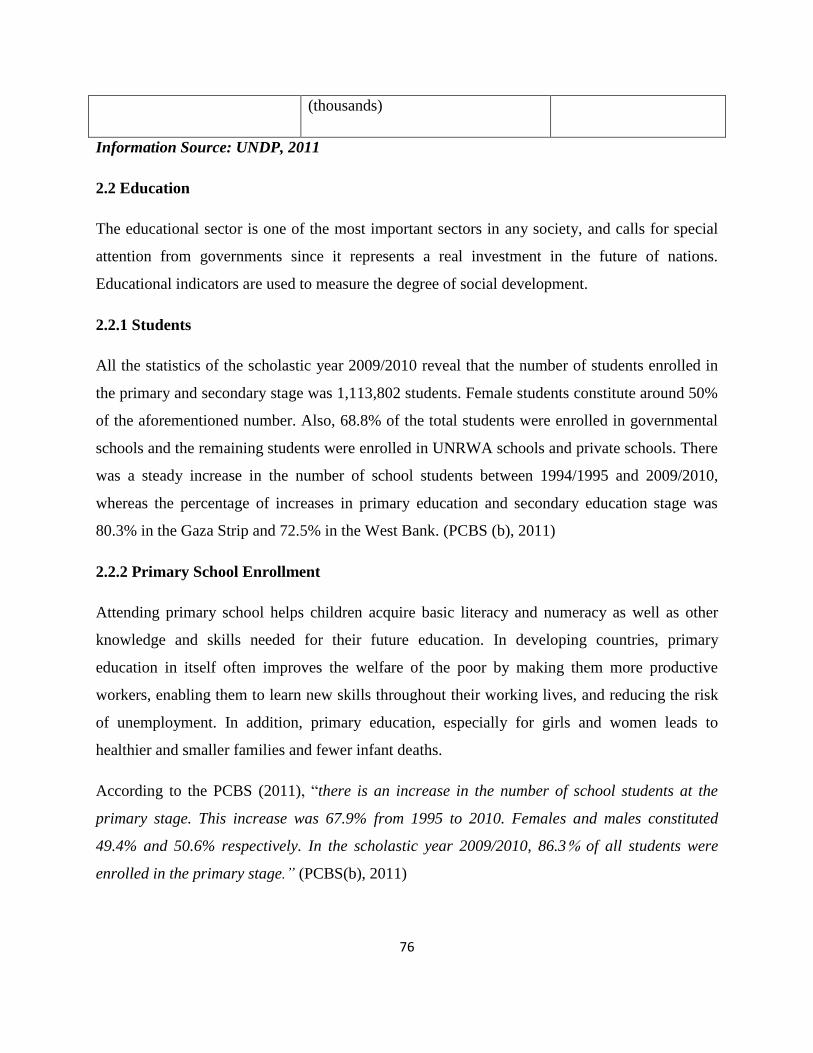
76
(thousands)
Information Source: UNDP, 2011
2.2 Education
The educational sector is one of the most important sectors in any society, and calls for special
attention from governments since it represents a real investment in the future of nations.
Educational indicators are used to measure the degree of social development.
2.2.1 Students
All the statistics of the scholastic year 2009/2010 reveal that the number of students enrolled in
the primary and secondary stage was 1,113,802 students. Female students constitute around 50%
of the aforementioned number. Also, 68.8% of the total students were enrolled in governmental
schools and the remaining students were enrolled in UNRWA schools and private schools. There
was a steady increase in the number of school students between 1994/1995 and 2009/2010,
whereas the percentage of increases in primary education and secondary education stage was
80.3% in the Gaza Strip and 72.5% in the West Bank. (PCBS (b), 2011)
2.2.2 Primary School Enrollment
Attending primary school helps children acquire basic literacy and numeracy as well as other
knowledge and skills needed for their future education. In developing countries, primary
education in itself often improves the welfare of the poor by making them more productive
workers, enabling them to learn new skills throughout their working lives, and reducing the risk
of unemployment. In addition, primary education, especially for girls and women leads to
healthier and smaller families and fewer infant deaths.
According to the PCBS (2011), “there is an increase in the number of school students at the
primary stage. This increase was 67.9% from 1995 to 2010. Females and males constituted
49.4% and 50.6% respectively. In the scholastic year 2009/2010, 86.3% of all students were
enrolled in the primary stage.” (PCBS(b), 2011)
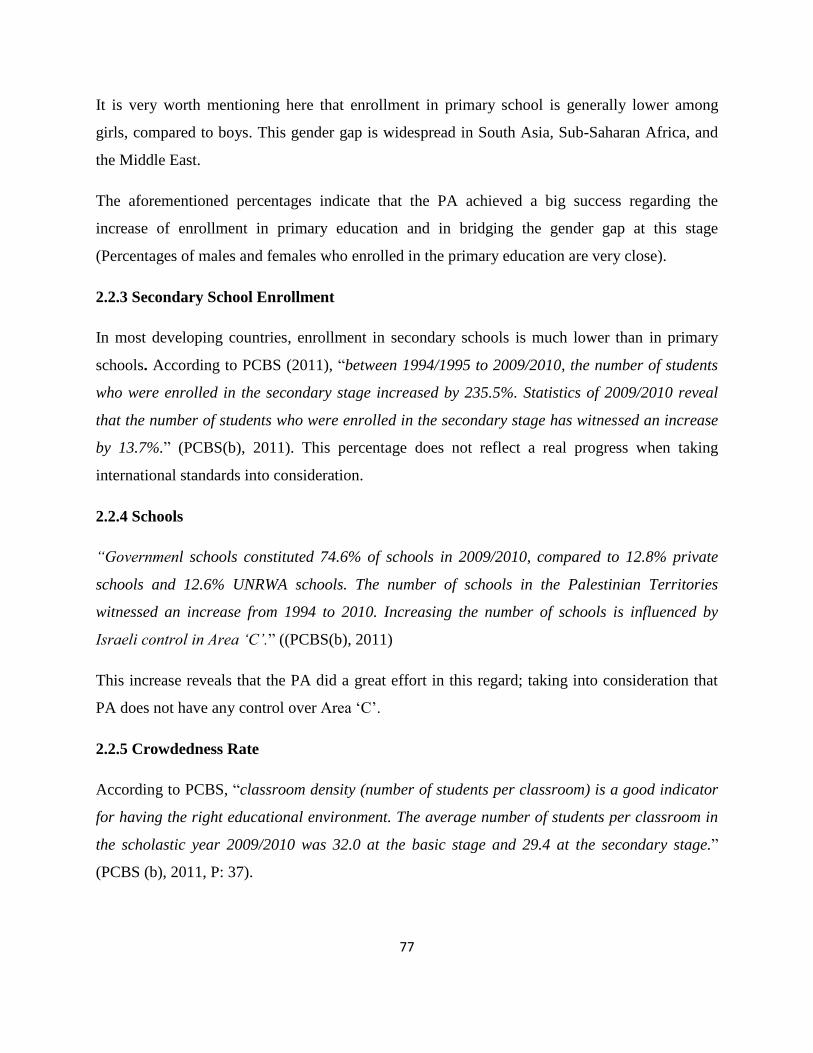
77
It is very worth mentioning here that enrollment in primary school is generally lower among
girls, compared to boys. This gender gap is widespread in South Asia, Sub-Saharan Africa, and
the Middle East.
The aforementioned percentages indicate that the PA achieved a big success regarding the
increase of enrollment in primary education and in bridging the gender gap at this stage
(Percentages of males and females who enrolled in the primary education are very close).
2.2.3 Secondary School Enrollment
In most developing countries, enrollment in secondary schools is much lower than in primary
schools. According to PCBS (2011), “between 1994/1995 to 2009/2010, the number of students
who were enrolled in the secondary stage increased by 235.5%. Statistics of 2009/2010 reveal
that the number of students who were enrolled in the secondary stage has witnessed an increase
by 13.7%.” (PCBS(b), 2011). This percentage does not reflect a real progress when taking
international standards into consideration.
2.2.4 Schools
“Governmenl schools constituted 74.6% of schools in 2009/2010, compared to 12.8% private
schools and 12.6% UNRWA schools. The number of schools in the Palestinian Territories
witnessed an increase from 1994 to 2010. Increasing the number of schools is influenced by
Israeli control in Area ‘C’.” ((PCBS(b), 2011)
This increase reveals that the PA did a great effort in this regard; taking into consideration that
PA does not have any control over Area ‘C’.
2.2.5 Crowdedness Rate
According to PCBS, “classroom density (number of students per classroom) is a good indicator
for having the right educational environment. The average number of students per classroom in
the scholastic year 2009/2010 was 32.0 at the basic stage and 29.4 at the secondary stage.”
(PCBS (b), 2011, P: 37).
78
It is worth mentioning here that the average number of students per classroom in developed
countries is 22 (UNESCO, 2011). This means that the Palestinian Ministry of Education and
Higher Education needs to make considerable efforts in order to reduce this number in the
coming years in order to ensure the efficiency of the educational process.
2.2.6 Teachers in Schools (West Bank)
According to PCBS (2011), “the number of teachers in schools in the West Bank was 29,390
during the scholastic year 2009/2010 (12,162 male teachers and 17,228 female teachers). 78.1%
of teachers teach at governmental schools, 7.1% teach at UNRWA schools, 14.8% teach at
private schools in the West Bank. The number of students per teacher at governmental schools
was 23.2 in 2009/2010; in UNRWA schools, the figure was 26.7, while in private schools it was
16.9.” (PCBS (b), 2011, P: 38).
It is worth mentioning here that the average number of students per teacher in developed
countries is 11.4 (UNESCO, 2011), meaning once again, that the Palestinian Ministry of
Education needs to conducts more efforts to achieve this number.
Abed Al Rahman states that “with the population rate growing at approximately 4% per year,
and taking into consideration the high poverty and unemployment rates, the Palestinian social
sector is under increasing stress. It is hard to provide high quality services within the education
and health systems. Also the PA has not recruited any teachers in the last two years, which
reflected negatively on the quality of the education system.”
2.2.7 Literacy Rate
In 2010, there were 120,402 illiterate individuals aged 15 years and over in the Palestinian
Territories; 79,548 in the West Bank and 40,854 in the Gaza Strip, 28,478 males and 91,924
females, distributed in the following manner: 81,984 in urban localities, 26,149 in rural localities
and 12,269 in refugee camps. (PCBS (b), 2011)
Wafa (2011) states that “illiteracy rates among individuals aged 15 years and over in the
Palestinian Territories fell from 13.9% to 5.1% from 1997 to 2010.” (PCBS (b), 2011). This
79
decline is considered a big success for the PA when compared with the slower rise of literacy in
other countries at the regional and international levels.
2.2.8 The Quality of Education in Palestine
Neither the number of students enrolled at a level of study nor the amount of resources invested
in education can indicate the quality of education. Consequently, we would only have a rough
idea about a country’s accomplishments in education.
A report issued by the UNESCO (2011) notes that the Palestinian educational system does not
work diligently to promote active learning, and the educational tools used do not contribute
effectively to the development of this system. Also, a recent study issued by the Palestinian
Ministry of Education highlighted the deteriorating level of hygiene in a large number of
governmental schools. (UNSECO, 2011)
According to the World Bank (2007), government schools in the Gaza Strip and the West Bank
are quite small in comparison to international standards. This issue poses important implications
for resource utilization and efficiency. (World Bank, 2007)
There are still many schools that require resources, equipment and educational tools that can
reflect positively on enhancing the quality of education in the Palestinian Territories.
Overcrowding in schools continues to be a challenge yet to be overcome by the PA.
Taking into consideration the speedy rate of advancements in technology and the economy,
today’s students should be morally and intellectually prepared for several career changes over
their working lifetime. The ability for constant learning is becoming a major requirement of the
new job market, characteristic of the knowledge economy. Investing in education is not only an
important way to build a country’s human capital and move it closer to the knowledge economy,
thus improving its prospects for economic growth and higher living standards. For every
individual, education also has a value in its own right because it broadens people’s horizons and
helps them to live healthier, more financially secure, and fulfilling lives. Furthermore, human
capital is established through education or training that increases the economic productivity of
individuals, enabling them to produce more valuable goods and services, and along these lines,
80
earn a higher income. Governments, workers and employers invest in human capital by devoting
money and time to education and training.
2.3 The Health Sector
The health of a country’s population is often monitored using two statistical indicators: life
expectancy at birth and the under-5 mortality rate (U5M). These indicators are also often cited
among broader measures of a population’s quality of life because they indirectly reflect many
aspects of people’s welfare, including their levels of income and nutrition, the quality of their
environment, and their access to health care, safe water, and sanitation.
2.3.1 Life Expectancy at Birth
As mentioned previously in the literature review, life expectancy at birth indicates the number of
years a newborn baby would live if health conditions prevailing at the time of its birth were to
stay the same throughout its life. This indicator does not predict how long a baby will actually
live, but rather reflects the overall health conditions characteristic of this particular country in
this particular year.
According to the UNICEF (2010) life expectancy at birth in the Palestinian Territories is 75
years for females and 72 years for males. (UNICEF, 2010) This is a good percentage in
accordance with the international standards
2.3.2 The Mortality Rate
The Palestinian society has a high fertility rate, which indicates that the Palestinian society is a
young society with a relatively high proportion of young people. The decline in the rates of
mortality and the stability of high fertility rates lead to a high natural rate of population, which
requires appropriate economic and social practices and policies in order to confront the
implications of this increase. The natural rate of population increased by 2.9% in during the first
half of 2010, which makes it one of the highest rates in the world. The mortality rate in the
Palestinian Territories is very low compared to that rate in Arab countries. The mortality rate was
declined from 4.9 per one thousand in 1997 to 4.1 per thousand in 2010. (PCBS (b), 2011)
81
The U5M rate indicates the probability of dying by age five per 1,000 live births. Due to the fact
that children are most susceptible to malnutrition and inadequate hygienic conditions, they
account for the largest portion of deaths in most developing countries.
According to the UNICIF (2010), infant mortality and U5M rates in the Palestinian Territories
for 2010 were 20 and 22 per one thousand respectively. This percentage reflects a real progress
in the health conditions of the Palestinian people, taking into consideration the infant mortality
and under five mortality rates for 2008, which recorded a rate of 27 and 28 per one thousand
respectively. (UNICEF, 2010)
Decreasing the U5M is usually seen as the most effective way for increasing life expectancy at
birth in the developing world. All the indicators demonstrate a steady improvement, although the
PA needs to invest in improving public health measures (safe drinking water, sanitation, and
mass immunizations), training medical personnel, and building clinics and hospitals.
82
Chapter V: Discussion and Conclusion
- Neo-liberalism and the PRDP
While neo-liberalism is being rejected by many experts and countries around the globe, the PA is
developing its neo-liberal state building program ‘Ending the Occupation, Establishing the
State’. This program was designed and incorporated with the PRDP (2008-2010) in order to offer
the Palestinian people a practical plan that aims to achieve growth and prosperity.
The PRDP is no more than a security plan devoted to the presence of the occupation hindering
any chance for reaching a political and just solution to the conflict that has been going on for
over 60 years. The PRDP was the main reason for creating a newly empowered Palestinian
capitalist class that was portrayed as a predatory and oligarchic group of elites whose dominant
position was favored by the PA’s neo-liberal program, made possible by security collaboration
with Israel. This plan contributes to concentrating power and wealth in the hands of these elites,
who are apparently motivated by their short term personal interests, without taking the real needs
of the Palestinian people into consideration.
The PRDP comes from the Israeli interest to weave co-existence alongside economic peace,
which was promoted by the Israeli government. The PRDP was the main reason behind
increasing Palestinian dependency on Foreign aid and on Israel. The latter continues to exploit its
dominating position to establish a hold on Palestinians by creating a framework for control over
vital and important resources, thus curtailing any potential Palestinian capacity to confront the
superiority of the Israeli government and effectively nullifying any meaningful progress toward
achieving their independence
The adoption of the neo-liberal policy in the PRDP is one of the PA’s most grievous mistakes.
The PRDP failed as a midwife for independence that is based on a strategy of resistance and a
development paradigm. The PRDP has to be replaced by another strategy that is based on a
participatory approach with special focus on the two aforementioned options.
83
- Economic Growth during the PRDP
Economic growth in the Palestinian Territories was merely an “economic bubble” and therefore,
could not be considered sustainable. The economic growth by 9% in 2010 was nothing other than
a myth. It was fueled by donor aid and private investment recovery in the West Bank without any
focus on the Gaza Strip. This growth is mainly taking place in Areas A and B, and not in Area C.
This growth does include all categories of the Palestinian people. It is solely owned by the
capitalists and is moving towards the creation of a debt-oriented growth. The achieved growth is
not real because it is not directly connected with any improvement on the poverty and
employment levels. This growth is accompanied by an ongoing loss of Palestinian land and
natural resources, isolation from global markets, fragmentation and food insecurity. This growth
is not linked to a marked improvement in socio-economic development. This growth was not a
result of real economic activities connected with the major productive sectors such as agriculture,
industry and services.
- Socio-economic development in Palestine’s neo-liberal era
Structural Reform and Adjustment
Palestinians were unable to deal with these reforms. The privatization of electricity and the pre-
paid system that was adopted in the Palestinian Territories was the main reason behind
increasing poverty and adding on to the hardship of Palestinians. There is a big question mark
regarding the applicability of structural adjustment policies in the Palestinian Territories. The
longstanding problems in the territories have nothing to do with the structural problems that can
be adjusted. The occupation and its control over tax and customs clearance revenue is the main
reason behind these problems.
The Palestinian GDP during the PRDP (2008-2010)
The Palestinian GDP during and after the PRDP has not witnessed any progress compared with
its peak in 1999, meaning that for a period of 10 years, the Palestinian GDP remained stable.
84
Economic activities during the PRDP (2008-2010)
Economic activities in the Palestinian territories have entered a slowdown, especially after years
of rapid growth. The private sector was unable to reach its potential, particularly the industrial
sector. A fiscal crisis is currently plaguing the PA, which resulted from a decline in donor aid,
and the inability to obtain loans from the banking system to finance the shortfall. The economy
of West Bank still depends on the public sector and construction projects. These sectors continue
to be heavily financed by foreign aid, which has also decreased tremendously.
GDP per Capita
The GDP per Capita achieved in 2010 is similar to that in 1999, meaning that the income of
Palestinians has not witnessed any change for the past 10 years.
Prices and Purchasing Power
The consumer price index in the Palestinian Territories increased by 29.0% during 2004-2010,
due to the increase in the prices of food items and several products and services, such as
education and health. This increase in prices is not only reflective of global increases but it was
the reason for the transaction cost increase across the OPT and the economic blockade and
containment of the Gaza Strip. The growth of CPI affects negatively the purchasing power and
the consumption pattern of Palestinian individuals, who are already suffering high poverty and
unemployment.
The labor Market
The Palestinian economy is largely dependent on labor for production, while resources such as
capital and land are very limited. The labor force recorded a lower participation in 2010
compared to 2009. During 2004-2010, the participation rate in the labor force ranged from
40.1% to 41.7%. This rate declined to 41.1% in 2010 compared to 41.6% in 2009. During the
period 2004-2010, the Palestinian Territories witnessed fluctuation in the rate of unemployment.
The lowest rate was recorded in 2007 at 21.7%, while that rate reached 23.7% in 2010 compared
to 24.5% in 2009. The West Bank witnessed a decline in the unemployment rate from 17.8% to
85
17.2%, while the unemployment rate in the Gaza strip also declined to reach 37.8%. (PCBS,
2011)
The employment rate in the Palestinian Territories is still considered low in accordance with the
international standards, yet some international organizations assert that the unemployment rate in
the Palestinian Territories is amongst the highest in the world. The achieved economic growth in
2010 was jobless. This growth was failed to seek a realistic solution for the high unemployment
rate in the Palestinian Territories. This growth was driven from Foreign aid without a remarkable
increase in investment. The private sector is unable to achieve any progress in terms of job
creation.
The persistence of high unemployment rates within the Palestinian labor force poses a threat on
the life of the Palestinian people, not to mention the strains imposed on the social fabric and on
solidarity. The interruption of production activities can lead to the deskilling of Palestinian
institutions and workers, which could be one of the main reasons behind the destruction of
human capital.
Balance of Payment
According to PCBS (2011): “In 2009, current account declined resulting in a deficit of USD$
736.8 Million, despite the fact that it was the lowest deficit recorded since 2003.” (PCBS, 2011,
P:27).
One of the main reasons behind this deficit was the increase in the value of imported goods and
services to Palestine, which was reflected as a deficit in the trade balance, as well as the decline
in current transfers received from abroad. This deficit may reflect negatively on social indicators
- the fluctuation of poverty rate during the implementation phases of the PRDP, as an example.
It is worth mentioning here that the Palestinian economy depends heavily on foreign transfers
received by the PA, which are used in order to support the General Budget of the PA. The latter
seeks to reduce dependence on foreign transfers but is unable to find key solutions to cover this
deficit.
86
The PA’s Fiscal Situation
In the last few years, the PA carried out strict fiscal reforms in order to control the budget deficit.
The fundamental aim of these reforms was to improve fiscal discipline and reduce dependency
on donor aid by reducing the budget deficit. These reforms were developed in order to put the
Palestinian economy on the path to financial stability – a path designed to create room for
increasing capital investment and developing the expenditure system.
One of the main indicators of fiscal weakness in Palestine is the fact that 42% of total spending
was financed by donors. It is worth mentioning here that dependence on foreign aid is neither
stable nor sustainable, taking into consideration the current state of the world economy.
It seems that the poor should pay the cost of fiscal reforms. The PA has plans to eliminate net
lending by 2011, with the full privatization of electricity companies. All international
organizations predict that the fiscal situation of the PA will deteriorate even more in 2012.
Based on the aforementioned, the PA needs to set strict measures in order to control spending
and increase revenue, and these measures could have a drastic social impact on the Palestinian
people.
Government Revenue
The year 2010 witnessed a significant increase in the revenue of the central government, which
reduced the deficit within the general budget, and a decrease in government expenditures. Also,
the year 2010 witnessed impressive progress in the field of tax collection in line with the PRDP.
The PA is required to continuously cope with the volatility both of aid disbursement and of
collected revenue. The instability of revenue is caused by a number of factors, mainly the
volatility of the tax base, and the level of economic activities affected by Israeli closure policies
and military practices. The Israeli control over the tax and customs clearance revenue is another
major factor of fiscal instability in the PA.
The unpredictability of Israel’s clearance of Palestinian customs-related revenues makes fiscal
planning difficult, undermines the PA’s ability to pay salaries for public employees and threatens
its ability to pay private sector agents who supply it with goods and services. Furthermore,
87
international support and positive growth cannot be translated into sustainable economic gains
without ensuring the stability of Palestinian tax revenues and reducing the restrictions imposed
on the access of Palestinian producers to external markets.
Government Revenue
In 2010, Government expenditures were reduced by US$ 3,101.7 million compared to US$
3,189.8 million in 2009. The main reason for this decline was the result of the 8.2% decrease in
non-wage expenditures. On the other hand, wage expenditures witnessed a 10.9% increase in
2010 reaching their highest level at US$ 1,626.8 million. (PCBS (a), 2011).
It is worth mentioning here that the implementation period of the PRDP witnessed a modest level
of essential recruitment, particularly in the health and education sectors. This had a negative
influence on the ability of these two sectors to meet the demand of the Palestinian population
(growing at approximately 4% yearly) for basic services.
In terms of net lending, the PRDP considers the cost of subsidizing citizens’ consumption of
energy and electricity as a significant drain on the Palestinian government’s financial resources.
The main intension of the PRDP is to reduce net-lending through the development of a new
collection system that incorporates enforcement measures, such as the obligation of citizens to
present a certificate of payment in order to obtain any public service. Considering the devastating
poverty rate in the West Bank, these measures generate more hardships for Palestinians and
create a lot of obstacles in the daily life of the Palestinian citizen.
The PRDP was accompanied by an increase in infrastructure projects. This increase did
contribute to economic growth, but the main question here is whether it benefited all the
categories of the Palestinian population.
The Private Sector
Restrictions imposed by the Israeli government are chief obstacles confronted by the Palestinian
private sector, and they play a major role in hindering its growth. Israel maintains security
control and jurisdiction over planning and construction in close to 60% of the West Bank area
(Area C) despite that fact that the PA is responsible for the provision of services in that area.
88
This situation also handicaps Palestinian economic activity and reflects negatively on any
potential to develop the Palestinian private sector.
Small business enterprises are the main pillar of the Palestinian private sector. The Palestinian
government is encouraging business communities rather than SMEs. One of the examples that
can be mentioned here is the Palestinian Telecommunications company. This company is making
an annual profit of US$120 million and not suffering any losses. It continues to receive
incentives form the Palestinian government and has not paid income tax for the past 20 years.
Trade Balance
The deficit in the Palestinian trade balance is 6.3%. The percentage of PA imports from Israel is
75% from the total imported goods. This issue indicates the extent to which the Palestinian
economy depends on the Israeli economy – almost totally.
Several years of restrictions, denial of access and blockades, have extremely limited access to
external markets for the export of goods and import of production inputs. Indirect imports from
Israel are another indicator that has to be taken into consideration in this regard. The UNCTAD
report revealed that imports produced in a third country and re-exported to the Palestinian
Territories as if they were produced in Israel was the main reason that led to the following losses;
US$ 480 million per year (25% of public revenue), 10 % in lost GDP and 30000 jobs
opportunities per year. (UNCTAD, 2011)
The deficit in the Trade Balance reached its highest in 2010, while its lowest was in 2004.
(PCBS (a), 2011). The size of the Palestinian market is very small compared to other countries
in the region and around the world. Without access to regional and world markets, Palestinian
producers will not be able to achieve the minimum efficient scale. Competition within
international markets will force Palestinian producers to improve their productivity, which will
have a positive impact in terms of increasing employment, raising wages and alleviating poverty.
The majority of Palestinian exports counted for low value added goods. If the PA is talking about
a real and sustainable economic growth, the Palestinian economy must increase overall trade,
expand trade beyond the Israeli market, and increase the value added in exports. To accomplish
89
this, an appropriate trade policy regime must be in place, including the necessary institutional,
regulatory, and physical infrastructure that would facilitate trade.
The Investment Climate
The investment climate in the West Bank and the Gaza Strip has been severely hampered by
Israeli closures. The restriction of movement for goods and people within and across borders was
the main reason behind the increase of transportation costs and discouraging private and foreign
direct investment.
The services sector has a significant contribution to the Palestinian GDP, but it does not have any
competitive advantages since most of the provided services do not require high technology and
high-skill labor.
Industry
The industrial sector in the Palestinian Territories witnessed decades of underinvestment. The
Israeli policies were the main reason behind this long term trajectory of stagnation and de-
development.
The steady decline of the manufacturing sector is a major concern, not only because of potential
output loss, but also because of its long-term implications, which are related to technological
regression. It is worth mentioning here that this sector tends to be more innovative and efficient
than companies that produce non-tradable goods. The non-tradable goods sector is not exposed
to the rigors of global competition. (UNCTAD, 2011)
There was no remarkable improvement in the share of industry to the GDP in 2010 and 1999;
which has negative consequences on the Palestinian economy when sustainable development is
taken into consideration.
90
Agriculture
The agricultural sector in Palestine is a critical industry, because it mainly contributes to food
security. The improvement of this sector can contribute effectively to immediate economic
recovery through the creation of export development strategies based on highly advanced
business models.
There is continuous progress in the Palestinian agricultural sector connected with new structural
changes, summarized in adjusting domestic agricultural products to meet the demands of Israeli
markets instead of meeting those of domestic markets, and the separation between the West
Bank and the Gaza Strip that contributes to increasing the dependency of this sector on Israel.
These contributed to an increase in the prices of agricultural products and had a negative effect
on the purchasing power of the Palestinian citizen.
There is deterioration in the agricultural sector, and this is not the responsibility of PA. There are
a lot of factors which have to be taken into account. According to the 2010 statistics, the
contribution of this sector to GDP was about 5.9%. This percentage reflects a huge deterioration
within this sector compared to 2000 (14%). The agricultural sector in Palestine suffers from low
productivity despite the fact that it employs 15% of the Palestinian labor force.
Tourism
In recent years, there was an increase in the number of incoming tourists, but no remarkable
development was witnessed with regard to the services provided by the tourism sector. The
Israeli occupation makes it difficult for the PA to create an investment environment and open
new markets.
This sector in general suffers from poor infrastructure, decaying heritage sites and low marketing
capacity. In order to ensure the sustainability of this sector, the PA needs to take into account the
systematic changes that contribute effectively to upgrading the quality of the visitors’
experience.
91
Poverty
Despite the achieved economic growth in 2010, poverty and food insecurity are remaining high
in the Palestinian Territories and the Gaza Strip. Poverty in Palestine is a serious problem and a
new phenomenon – which did not exist prior to Oslo - in Palestinian society.
- Social Development
Social development in Palestine is under siege, and is deteriorating significantly. The economic
growth achieved creates a gap between the capitalists and the poor people. The catholic marriage
between the capitalists and the decision makers leaves a negative impact on the distribution of
wealth, contributes to the creation of monopolies, increases poverty and unemployment, and
produces a fracture in Palestinian society that has been domesticated with loans and debts that
prevent people from expressing their opinions freely.
The Human Development Index
In comparison with Arab countries, the Palestinian Territories ranked well in all the indicators of
the Human Development Index.
Education
There was a steady increase in the number of school students between 1994/1995 and
2009/2010, whereas the percentage of increases in primary education and secondary education
stage was 80.3% in the Gaza Strip and 72.5% in the West Bank. (PCBS (b), 2011).
The PA achieved a big success regarding the increase of enrollment in primary education and in
bridging the gender gap at this stage (Percentages of males and females who enrolled in the
primary education are very close). The percentage of enrollment in the secondary education does
not reflect a real progress when taking international standards into consideration.
The increase in the number of schools from 1999 - 2010 reveals that the PA did a great effort in
this regard; taking into consideration that the PA does not have any control over Area ‘C’.
92
The average number of students per classroom in developed countries is 22 (UNESCO, 2011).
This means that the Palestinian Ministry of Education and Higher Education needs to make
considerable efforts in order to reduce this number in the coming years in order to ensure the
efficiency of the educational process.
The average number of students per teacher in developed countries is 11.4 (UNESCO, 2011),
meaning once again, that the Palestinian Ministry of Education needs to conduct more efforts to
achieve this number. With the population rate growing at approximately 4% per year, and taking
into consideration the high poverty and unemployment rates, the Palestinian social sector is
under increasing stress. It is hard to provide high quality services within the education and health
systems. Also the PA has not recruited any teachers in the last two years, which reflected
negatively on the quality of the education system.
The decline of the literacy rate in 2010 is considered a big success for the PA when compared
with the slower rise of literacy in other countries at the regional and international levels.
A report issued by the UNESCO (2011) notes that the Palestinian educational system does not
work diligently to promote active learning, and the educational tools used do not contribute
effectively to the development of this system. Also, a recent study issued by the Palestinian
Ministry of Education highlighted the deteriorating level of hygiene in a large number of
governmental schools. (UNSECO, 2011)
Taking into consideration the speedy rate of advancements in technology and the economy,
today’s students should be morally and intellectually prepared for several career changes over
their working lifetime. The ability for constant learning is becoming a major requirement of the
new job market, characteristic of the knowledge economy. Investing in education is not only an
important way to build a country’s human capital and move it closer to the knowledge economy,
thus improving its prospects for economic growth and higher living standards. For every
individual, education also has a value in its own right because it broadens people’s horizons and
helps them to live healthier, more financially secure, and fulfilling lives. Furthermore, human
capital is established through education or training that increases the economic productivity of
individuals, enabling them to produce more valuable goods and services, and along these lines,
93
earn a higher income. Governments, workers and employers invest in human capital by devoting
money and time to education and training.
Health
According to the UN, life expectancy at birth in the Palestinian Territories is 75 years for
females and 72 years for males. (UNICEF, 2011). This is a good percentage in accordance with
the international standards
Decreasing the U5M is usually seen as the most effective way for increasing life expectancy at
birth in the developing world. All the indicators demonstrate a steady improvement, although the
PA needs to invest in improving public health measures (safe drinking water, sanitation, and
mass immunizations), training medical personnel, and building clinics and hospitals.
Final Conclusion
The study concludes that adherence to the neo-liberal approach through the PRDP did not lead to
a paradigm of development, but rather one that maximized dependency on external aid and on
Israel. The study also shows that economic growth in the Palestinian Territories was merely an
“economic bubble” and therefore, could not be considered sustainable. Realized economic
growth was not translated into socio-economic development. The implementation of neo-liberal
reforms in the Palestinian Territories experienced an increase in poverty and unemployment
rates, in addition to the rise of a new social class whose main interest is directly linked to the
privatization of the public sector and the liberalization of the economy. The PRDP has to be
replaced by another strategy that is based on a participatory approach with special focus on
resistance and sustainable development.
94
Bibliography
Abdullah, S. Interviewed by Issa, M (1st of April, 2012).
Abueita, M. Interviewed by Issa, M (30th
March, 2012).
Ahmad, O., D. Lopez, and M. Inoue. 2000. The decline in child mortality: a reappraisal.
Bulletin of the World Health Organization, 78 (10), 1175-91.
Anonymous, 2006. “World Economic and Social Survey” New York, USA. Available from:
http://www.un.org/esa/policy/wess/wess2006files/chap2.pdf. [Accessed 18th January,
2012].
Attallah, M. Interviewed by Issa, M (18th
of April, 2012)
Azmi, A. Interviewed by Issa, M (18th
of April, 2012)
Awad, W.N, October 28, 2008. An Economic Snapshot of Palestine and the PRDD, MIFTAH.
Available from: http://www.miftah,org/Display. [Accessed 18th January, 2012].
Ayres, Robert U. 1998. Turning Point: an End to the Growth Paradigm. London: Earthscan
Publications. pp. 193-4.
Babbie, E. 1986. Observing ourselves. Belmont, CA: Wadsworth.
Babbie, E. 1989. The practice of social research. Belmont, CA: Wadsworth.
Bahour, S. Interviewed by Issa, M. (25th
of March, 2012)
Barro, R. 1991. Economic growth in a cross section of countries. The Quarterly Journal of
Economics, 106 (2), 407-443.
Blomgren, Anna-Maria. 1997: Nyliberal politisk filosofi. En kritisk analys av Milton Friedman,
Robert Nozick och F. A. Hayek. Nora: Bokförlaget Nya Doxa
Brohman, John. 1996. Popular Development: Rethinking the Theory and Practice of
Development. New York, NY: Wiley-Blackwell
95
CBL Economic Review . 2009. The role of Private Sector Development in economic growth: the
case of Lesotho. General Bank of Lesotho. Report Number: 12.
Chen Huan. 2009 A Literature Review on the Relationship between Foreign Trade and Economic
Growth. International Journal for Economics and Finance, Vol. 1, No.1, 127-128 Available
form:http:// www.ccsenet.org/journal.html. [Accessed 18th January, 2012].
Chen, D., and C. Dahlman. 2004. Knowledge and Development: A Cross-Section Approach.
Policy Research Working Paper Series No. 3366. Washington, D.C., World Bank.
Chenery, H. Ahluwalia, M. Bell, C. Duloy, J.H. and Jolly, R., 1976. Redistribution with Growth,
Oxford University Press, p.3
Chong, A., and Calderon, C. 2000, On the Causality and Feedback Between Institutional
Measures and Economic Growth. Economics and Politics, 12(1): 69-81
Cook, Paul. 1997. Privatization, Public Enterprise Reform and the World Bank: Has
‘Bureaucrats in Business’ Got it Right?”. Journal of International Development 9 (6): 887-
897 2001 Competition and its Regulation: Key Issues. Institute for Development Policy
and Management, The University of Manchester, CRC Working Paper No.13.
De Walle, N. 1989. Privatization in Developing Countries: A Review of the Issues. World
Development. Vol. 17, No. 5, pp. 601-615, 1989. Printed in Great Britain.
Efange, P. 1987. “An overview of Public and Private Enterprises in Africa: Role, Status,
Scope, Performance and Challenges for Implementing the Lagos Plan of Action” In
Proceedings of the Africans Association of Public Administration and Management.
Sixth Round Table Conference held in Blantyre, Public Enterprises Performance
and the Privatization Debate: A Review of the option for Africa. India: Vikas
Publishing House PVT LTD India.
96
Epstein, I. 1988. Quantitative and qualitative methods. In R. Grinnell, Jr., (Ed.), Social work
research and evaluation (pp. 185–198). Itasca, IL: F. E. Peacock.
Gal, Itzhak, Adi Ashkenazi, Saeb Bamya, and Shawqi Makhtoob. June 2010. “The Economic
Development of the Jordan Valley” in Arie Arnon and Saeb Bamya (editors) Economic
Dimensions of a Two-State Agreement Between Israel and Palestine. Volume II
Supplementary Papers, Aix Group.
GOI. 2011. Measures Taken by Israel un Support of Developing the Palestinian Economy and
Scocio-Structure. Government of Israel. New York
Hanieh, A. 2008. Palestine in the Middle East: Opposing Neo-liberalism and US Power Part 1.
Available from: http://mrzine.monthlyreview.org/ [Accessed 15th December 2011].
Harriss J., J. Hunter and C. Lewis, eds. 1995. New Institutional Economics and Third World
Development. London: Routledg.
Hazboun, S. Interviewed by Issa, M (28th
of March, 2012).
Hemming, R., and A. Mansor. 1988. Privatization and Public Enterprises.
IMFOccasional Paper (56): 1-22. Washington, DC: International Monetary Fund.
Hicks, N. 1980. Is there a tradeoff between growth and basic needs?. Finance and Development,
17 (2), 17-20.
Ibrahim, N, 2011, Illusion of Development under Israeli Occupation, Latin Patriarch Printing
Press, Jerusalem and Beit Jala, 2011. Print
ILO, Annual report on the situation of workers of the occupied Arab territories, 10 June 2010.
Available.from:<www.ilo.int/global/About_the_ILO/Media_and_public_information/Press
_releases/lang—en/WCMS_141537/index.htm>. [Accessed 20th February, 2012].
IMF (2011). Macroeconomic and fiscal framework for the West Bank and Gaza: Seventeenth
review of progress. Staff report for AHLC meeting. Brussels. 13 April
97
Jonas, G. 2010, Political Economy of Ecuador in the Neoliberal Era of Development, Master
Thesis, University of Toledo
Kaufmann, D., Kraay, A. and Zoido-Lobaton, P. 2000. Governance Matters: From
Measurement to Action. Finance and Development, 37 (2), Washington DC: International
Monetary Fund
Kendrick, John W. 1961. Productivity Trends in the United States. Princeton University Press for
NBER. p. 111.
Khalidi, R and Samour, S (a), 2011. After Tunisia and Egypt: Palestinian Neo-liberalism at
Cross Road. Jadaliyya. Available from: http://www.jadaliyya.com [Accessed 6th
December 2011].
Khalidi, R. and Samour, S (b). 2011. Neoliberalism as Liberation: The Statehood Program and
the Remaking of the Palestinian National Movement. Journal of Palestine Studies, Vol.
XL, No. 2, pp. 1–25.
Khalidi, R. 2011. Interview: Raja Khalidi on the neoliberal consensus in Palestine. Available
from:http://electronicintifada.net/content/interview-raja-khalidi-neoliberal
consensuspalestine/9870. [Accessed 6th December 2011].
Khalidi, R. Interviewed by Issa, M (6th
of April, 2012)
Kotz, M. 2008. Globalization and Neo-liberalism. Department of Economics and Political
Economy. Research Institute. University of Massachusetts. Volume 12, Numb
Krogstad, Erlend. 2007. “The Post-Washington Consensus: Brand New Agenda or Old Wine in a
New Bottle?”. Challenge 50 (2): 67-85.
Laleye, O. M. (1985). The Role of Public Enterprises in the Development of Nigeria.
Unpublished Ph.D. Thesis, University of Ife, Ile-Ife.
98
Leech, P. 2012. Re-reading the Myth of Fayyadism: A Critical Analysis of the Palestinian’s
Authority’s Reform and State-building Agenda, 2008-2012. Arab Center for Research and
Policy Studies. Doha, Qatar.
Leonard, Thomas M. 2006. Encyclopedia of the Developing World. London, UK: Taylor
&Francis.
Mazumdar, K. 1996. An analysis of causal flow between social development and economic
growth: the Social Development Index. American Journal of Economics and Sociology, 55
Miller, K., 1992. A Framework for Integrated risk Management in International Business.
Journal of International Business Studies, Vol. 2, pp. 311-331 (3), 361-384.
Matsuyama, K., 1997 Structural changes, Northwestern University Evanston, USA. Available
from:http://faculty.wcas.northwestern.edu/~kmatsu/Structural%20Change pdf. [Accessed:
16th December 2011].
Nakhleh, K. Interviewed by Issa, M (1st of April, 2012)
Öniş, Ziya and Fikret Şenses. 2005. Rethinking the Emerging Post-Washington Consensus.
Development and Change 36 (2): 263-90.
P.P.A Wasantha Athukoral. 2003. The Impact of Foreign Direct Investment for Economic
Growth: A Case Study in Sri Lank, 9th
International conference on Sri Lanka Studies,
28th– 30th
, November 2003. Matara, Sri Lank.
PA. 2008. Palestinian Reform and Development Plan (2008-2010). Available from:
http//www.mop-gov.ps. [Accessed:16th August 2011].
PCBS (a). 2011. Performance of Palestinian Economy 2010. Palestinian Central Bureau of
Statistics. Ramallah, Palestine.
PCBS (b). 2011. Palestinian Children –Issues and States: Annual Report, 2011. Report No.14.
Ramallah, Palestine.
PCBS (c). 2011. Various Statistics. Palestinian Central Bureau of Statistics. Ramallah, Palestine
99
Peace Now. January 2012. Torpedoing the Two State Solution: Summary of 2011 in the
Settlements. Available at http://peacenow.org.il/eng/2011Summary
Penn State University, 2008, Penn State University USA, Available
form:http://450.aers.psu.edu/glossary_search.cfm?letter. [Accessed: 16th December 2011].
Riddell, B., 1992. Things fall apt again: Structural adjustment programmes in Sub-Saharan
Africa. The Journal of Modern African Studies, Vol. 30, No. 1. , pp. 53-68.
Rodrik, D. 2006. Goodbye Washington Consensus, hello Washington confusion? A review of the
World Bank’s “Economic Growth in the 1990s: Learning from a Decade of Reform.
Journal of Economic Literature, vol. 44, pp. 973-987
Schultz, T., 1951. Measures for Economic Development of Underdeveloped Countries. Journal
of Farm Economics, Vol. 33, No. 4, pp. 585- 587.
Seers, D., 1969. The Meaning of Development. International Development Papers, P.20
Seers, D., 1977. The New Meaning of Development. International Development Papers. P.25
Sherman, E., & Reid, W. J. 1994. Qualitative research in social work. New York: Columbia
University Press.
Shujiro, U. 1998. Japanese foreign direct investment in Asia: Its impact on export expantion and
technology acquisition of the host economies. Waseda University and Japan Center for
Economic research
Sida. 2011. Country Profile of the Occupied Palestinian Territory: A Review of the
Implementation of the UN Convention on the Rights of the Child. A Co-publication by
SIDA and Save the Children (Sweden). August, 2011
Sosna, S. A. 1983. Public Enterprises in Developing Countries, Legal Status. Moscow, Progress
Publishers.
Soubbotina, T. (Ed.) 2004. Beyond Economic Growth: An Introduction to Sustainable
Development. The World Bank, Washington, D.C.
100
Stiglitz, J. 1998. More Instruments and Broader Goals: Moving toward the Post-Washington
Consensus, WIDER Annual Lectures, United Nations University.
Stiglitz, Joseph. 2002. Globalization and Its Discontents. New York, NY: W.W. Norton.
Stiglitz, Joseph. 2008. Mexico’s Reaction to the Economic Crisis has been Weak. The LA Times,
November 19.
Sumner, Andrew. 2006. In Search of the Post-Washington (Dis)consensus: The ‘Missing’
Content of the PRSPs. Third World Quarterly 27 (8): 1401-12.
Targ, H and Cormier, D. 2004. Globalization, Neo-liberalism and Workers. Department of
Political Science – Prude University.
Tartir, A. (a) ([email protected]) (March 20th
, 2012) Thesis Interview. Email to: Issa, M
Tartir, A (b). 2012. Aid and Development in Palestine: Anything, But Linear Relationship. Can
Aid Contribute to Development. Birzeit University Working Paper 2012/4 (ENG)
Conferences & Public Events Module.
Tartir, A.; Bahour, S.; and Abdelnour, S. 2012. Defeating Dependency, Creating a Resistance
Economy. al-shabaka policy brief, February. [Online], Available: http://www.alshabaka.
org/sites/default/files/policybrief/en/defeating-dependency-creating-resistanceeconomy/
defeating-dependency-creating-resistance-economy.pdf
Thomas, V., Y. Wang, and X. Fan. 2000 . Measuring Education Inequality: Gini Coefficients of
Education. Policy Research Working Paper. Washington, D.C., World Bank.
Thorsen and Lie, 2008, What is Neo-liberalism?. Department of Political Science, University of
Oslo.
UNCTAD (2007), Report on UNCTAD assistance to the Palestinian people: Developments in
the Economy of the occupied Palestinian territory. United Nations Conference on Trade
and Development. Geneva. Available, 11 July 2007
101
UNCTAD (2011) Report on UNCTAD Assistance to the Palestinian People: Developments in
the Economy of the occupied Palestinian territory, United Nations Conference on Trade
and Development, Geneva. Available: http://www.unctad.org/en/docs//tdb58d4_en.pdf
UNDP. 1996. Human Development Report. A Co-publication of UNDP and Oxford University
press. New York
UNDP 2008, Mid-Term Strategic Framework. UNDP/PAPP.
UNDP. 2009. Human Development Report 2009/10 (OPT): Investing in Human Security for a
Future State. Jerusalem.
UNDP. 2011. Human Development Report 211: Sustainability and Equity: A Better Future for
OPT. 2 November, 2011
UNSCO 2011. Socio-economic report. Supplement: Employment and productivity profile
growth. March. 2011
Wade, R. (2002). US hegemony and the World Bank: the fight over people and ideas. Review of
International Political Economy, vol. 9, No. 2, pp. 215-243
Weaver, Fredrick. 2000. Latin America in the World Economy: Mercantile Colonialism to
Global Capitalism. Boulder, CO: Westview Press.
World Bank. 1993. Developing the Occupied Territories: An Investment in Peace. (Washington,
DC: The World Bank Group, 1993).
World Bank (2007). Two Years after London: Restarting Palestinian Economic Recovery.
Economic Monitoring Report to the Ad Hoc Liaison Committee, 24 September.
World Bank. 2010. The Underpinnings of the Future Palestinian State: Sustainable Growth and
Institutions. Economic Monitoring Report to the Ad Hoc Liaison Committee. September
21
World Bank. 2012. Stagnation or Revival?. Palestinian Economic Prospects. March 21, 2012
102
World Bank (2011). Building the Palestinian State: Sustaining growth, institutions, and service
delivery. Report to AHLC. 13 April.
World Development Report (2005). A Better Investment Climate for Everyone. A Co-publication
of The World Bank and Oxford University Press. Report Number: 15
World Food Programme (2011). Socio-economic and Food Fecurity Survey. West Bank and
Gaza.
103
Appendices
Appendix 1: Interview questions
- Did the Palestinian territories adhere effectively to the neo-liberal approach? Was this
adherence appropriate? And did the PRDP lead to a paradigm of development?
- In what aspects have the Occupied Palestinian Territories experienced economic growth during
the implementation phases of the PRDP?
- What are the main reasons behind the achievement of this economic growth?
- Was this growth translated into socio-economic development in the Palestinian Territories?
- Did the Occupied Palestinian Territories become more socially developed after the
implementation phases of the PRDP?