Embed Size (px)
Citation preview
THE STEEL INDEX (TSI) Asian production costs Tim Hard – TSI Managing Director
www.thesteelindex.com
DISCLAIMER
All INFORMATION PRESENTED IN THIS REPORT IS AGREED TO BE CONFIDENTIAL AND CANNOT BE REPRODUCED WITHOUT THE EXPRESSED PERMISSION OF THE STEEL INDEX
This document does not constitute an offer or solicitation to buy or sell any investment product(s). It does not take into account the specific investment objectives, financial situation or particular needs of any person. Investors should seek advice from a financial adviser before investing in any investment products or adopting any investment strategies. In the event that the investor chooses not to seek advice from a financial adviser, he/she should consider whether the product in question is suitable for him/her. The investment product(s) discussed herein are subject to significant investment risks, including the possible loss of the principal amount invested. Past performance of investment products is not necessarily a guide to future performance.
Unless expressly stated, we do not make any representations nor give any warranties in respect of the information contained in this presentation. To the extent permitted by the applicable law, we hereby exclude all warranties, conditions, representations or duties whatsoever and howsoever arising (whether express or implied) including but not limited to any representations or warranties as to the ownership of intellectual property or other rights in the presentation, or the satisfactory quality, merchantability or fitness for a particular purpose of, any goods or services referred to at any time in this presentation, any express or statutory warranties, and any warranties or duties regarding accuracy, timeliness, completeness, performance, availability, lack of negligence or of workmanlike effort.
To the fullest extent allowed by applicable law, you agree that we will not be liable to you or your business under any circumstances whatsoever (whether in contract, negligence or any other tort, breach of statutory duty or otherwise) for any loss of profits, income, business interruption, loss of business information or for increase in any costs, liabilities or expenses or any other loss whatsoever and however arising directly or indirectly out of or in connection with or relating to the information in this presentation and we shall not be liable for any loss, damages, costs, expenses or other liability which you incur or suffer as a result of your use of the information in this presentation.
We take all such steps as are reasonably necessary to provide information that is accurate and reliable, but exclude to the fullest extent permitted by law any liability for the inaccuracy of the information in this report.
The Steel Index (TSI) used all reasonable endeavours to certify the correctness of the information contained in this presentation.
Without limiting the above, you acknowledge and agree that we shall not be liable for matters beyond our reasonable control including but not limited to information gathered during field visits, third party information presented or the acts of third parties.
You understand and expressly agree that use of the information presented here is at your sole risk, that any content, material and/or data presented or verbalised or otherwise obtained through your use of the information in this presentation is at your own discretion and risk and that you will be solely responsible for any damage to you personally or your company or organization or business associates whatsoever which in any way results from the use, reliance or application of such content material and/or data and/or information.
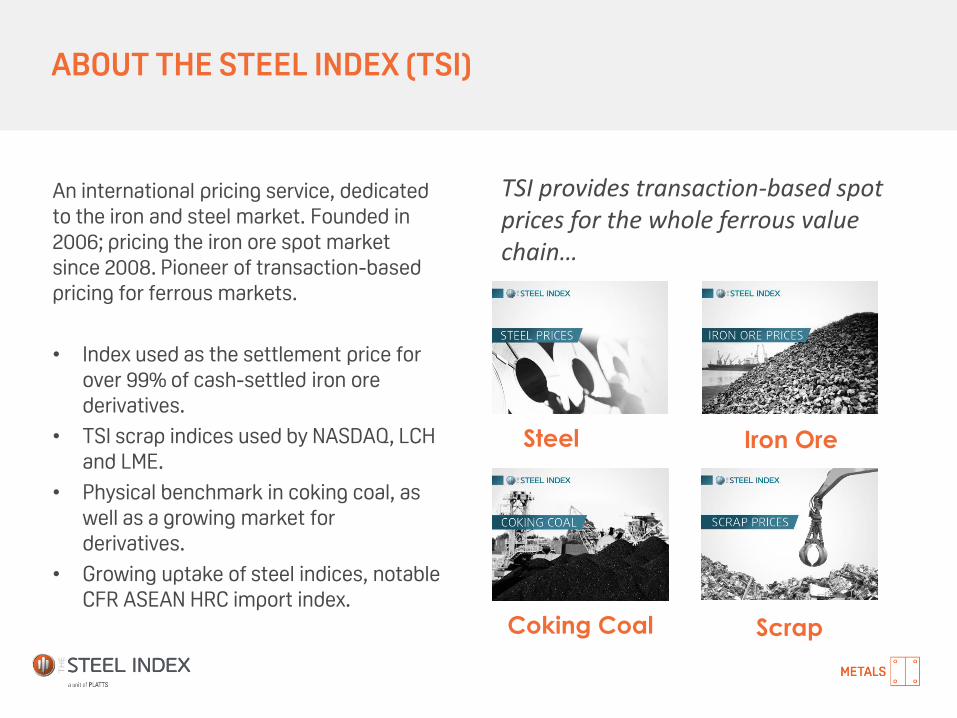
ABOUT THE STEEL INDEX (TSI)
An international pricing service, dedicated to the iron and steel market. Founded in 2006; pricing the iron ore spot market since 2008. Pioneer of transaction-based pricing for ferrous markets.
• Index used as the settlement price for over 99% of cash-settled iron ore derivatives.
• TSI scrap indices used by NASDAQ, LCH and LME.
• Physical benchmark in coking coal, as well as a growing market for derivatives.
• Growing uptake of steel indices, notable CFR ASEAN HRC import index.
Steel Iron Ore
Scrap Coking Coal
TSI provides transaction-based spot prices for the whole ferrous value chain…
AGENDA
I. Steelmaking costs
II. Steelmaking competitiveness
III. Margin competitiveness
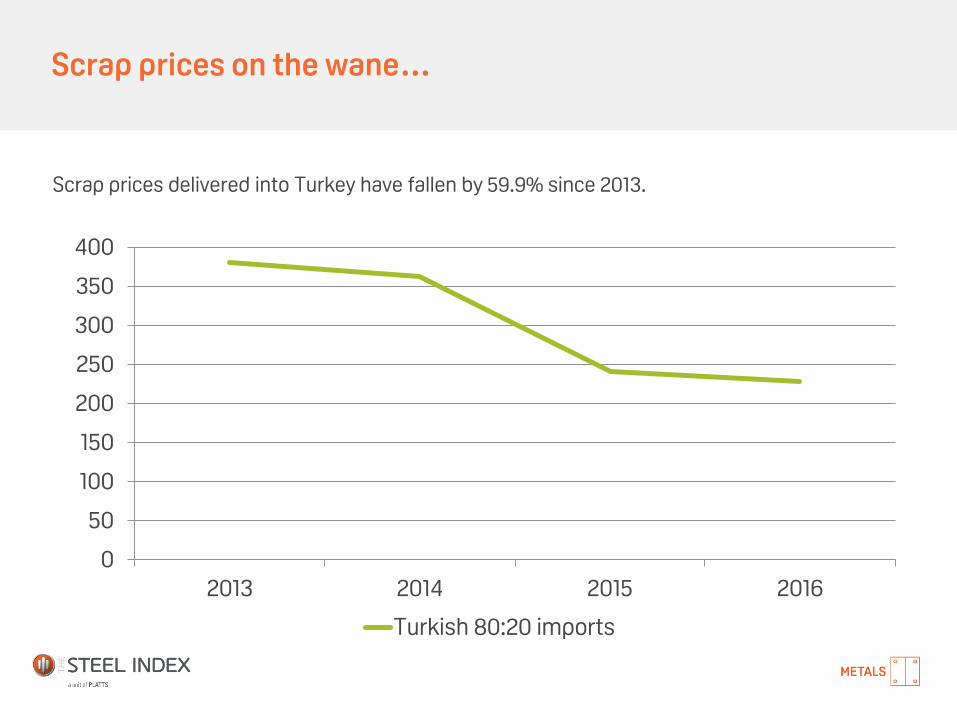
Scrap prices on the wane…
Scrap prices delivered into Turkey have fallen by 59.9% since 2013.
0
50
100
150
200
250
300
350
400
2013 2014 2015 2016
Turkish 80:20 imports
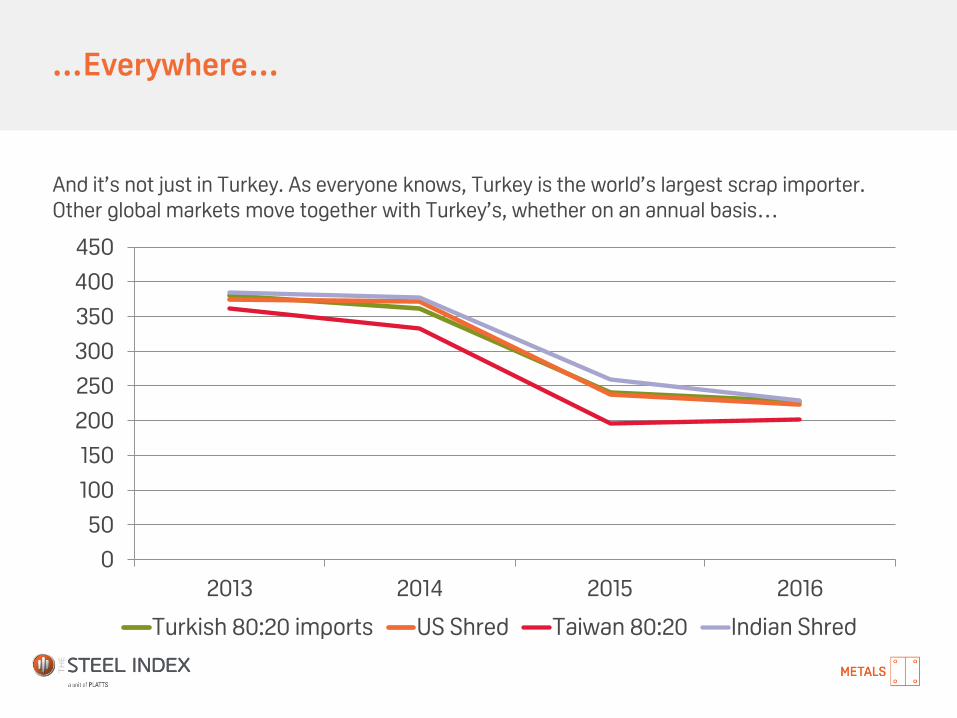
…Everywhere…
And it’s not just in Turkey. As everyone knows, Turkey is the world’s largest scrap importer. Other global markets move together with Turkey’s, whether on an annual basis…
0
50
100
150
200
250
300
350
400
450
2013 2014 2015 2016
Turkish 80:20 imports US Shred Taiwan 80:20 Indian Shred
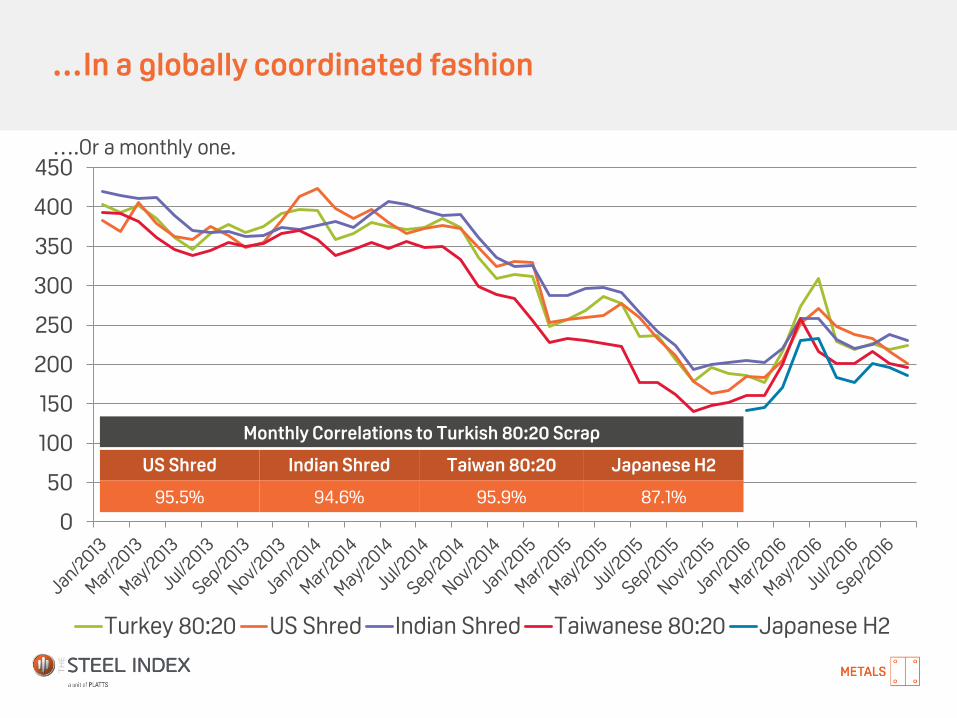
…In a globally coordinated fashion
0
50
100
150
200
250
300
350
400
450
Turkey 80:20 US Shred Indian Shred Taiwanese 80:20 Japanese H2
….Or a monthly one.
Monthly Correlations to Turkish 80:20 Scrap
US Shred Indian Shred Taiwan 80:20 Japanese H2
95.5% 94.6% 95.9% 87.1%
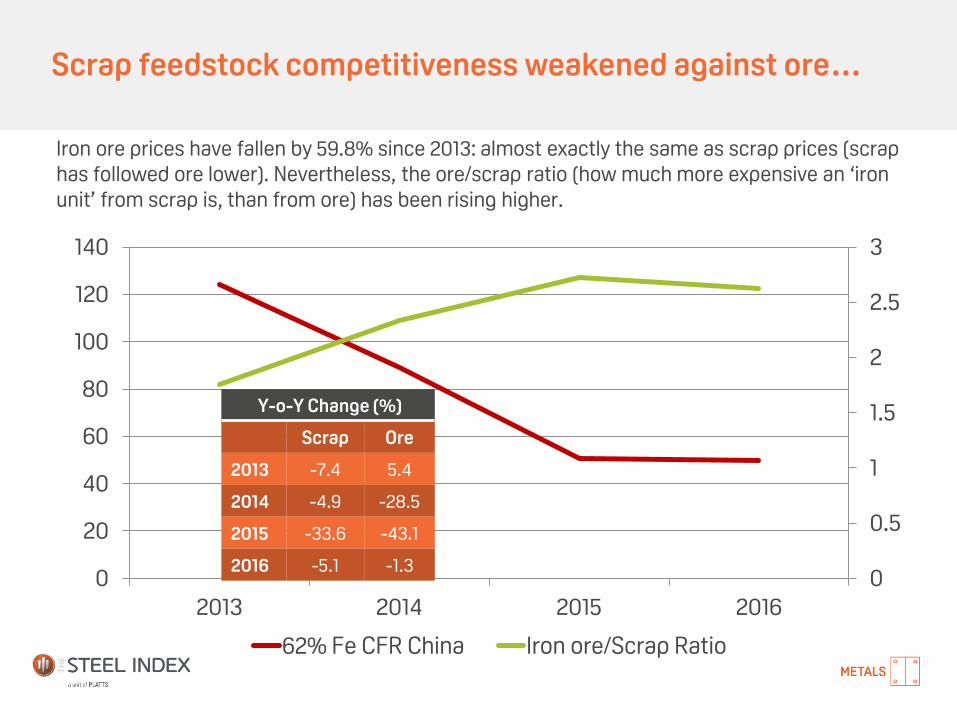
Scrap feedstock competitiveness weakened against ore…
Iron ore prices have fallen by 59.8% since 2013: almost exactly the same as scrap prices (scrap has followed ore lower). Nevertheless, the ore/scrap ratio (how much more expensive an ‘iron unit’ from scrap is, than from ore) has been rising higher.
0
0.5
1
1.5
2
2.5
3
0
20
40
60
80
100
120
140
2013 2014 2015 2016
62% Fe CFR China Iron ore/Scrap Ratio
Y-o-Y Change (%)
Scrap Ore
2013 -7.4 5.4
2014 -4.9 -28.5
2015 -33.6 -43.1
2016 -5.1 -1.3
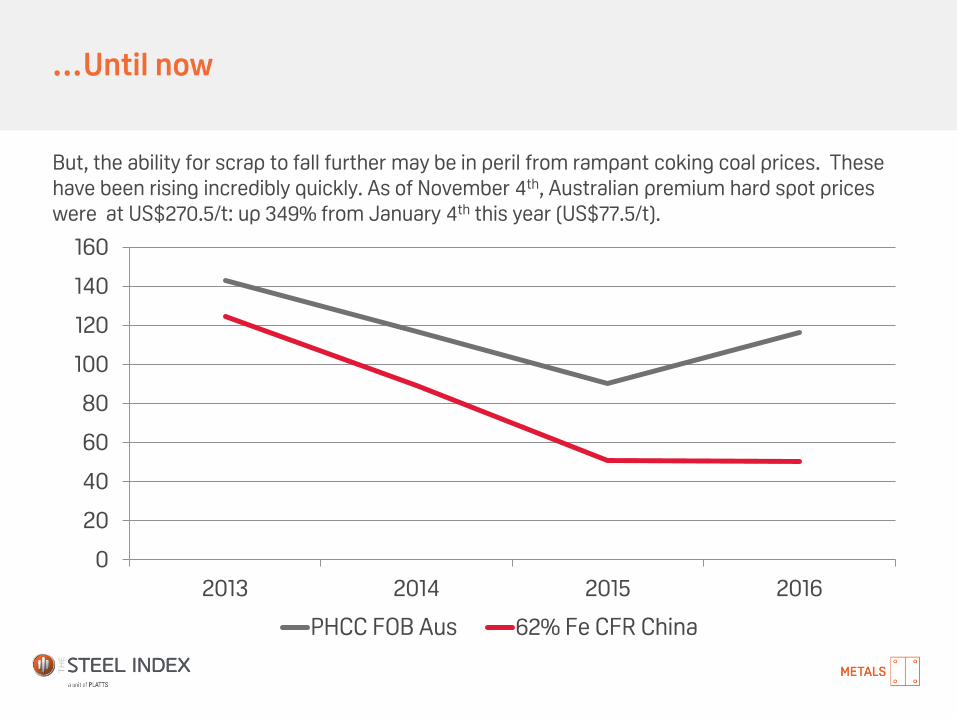
…Until now
But, the ability for scrap to fall further may be in peril from rampant coking coal prices. These have been rising incredibly quickly. As of November 4th, Australian premium hard spot prices were at US$270.5/t: up 349% from January 4th this year (US$77.5/t).
0
20
40
60
80
100
120
140
160
2013 2014 2015 2016
PHCC FOB Aus 62% Fe CFR China
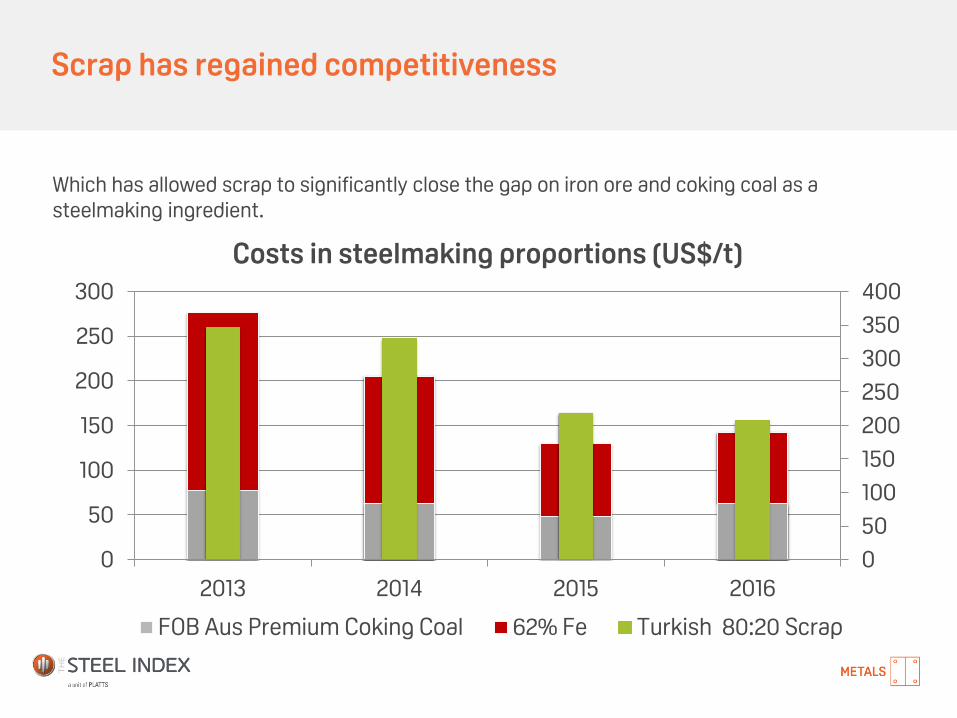
Scrap has regained competitiveness
Which has allowed scrap to significantly close the gap on iron ore and coking coal as a steelmaking ingredient.
0
50
100
150
200
250
300
350
400
0
50
100
150
200
250
300
2013 2014 2015 2016
Costs in steelmaking proportions (US$/t)
FOB Aus Premium Coking Coal 62% Fe Turkish 80:20 Scrap
AGENDA
I. Steelmaking costs
II. Steelmaking competitiveness
III. Margin competitiveness
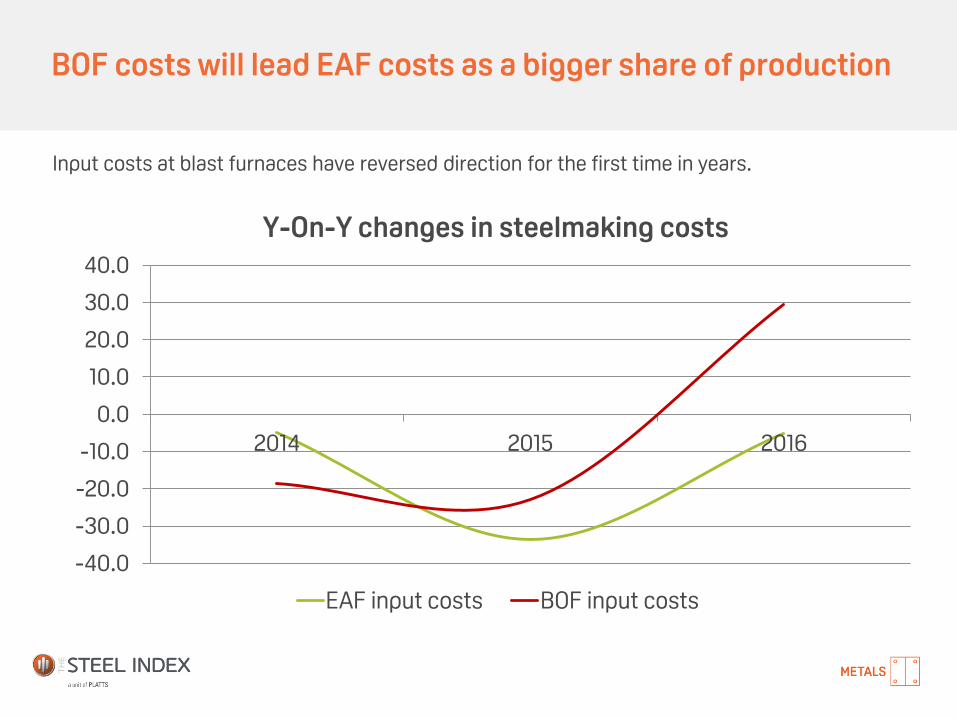
BOF costs will lead EAF costs as a bigger share of production
Input costs at blast furnaces have reversed direction for the first time in years.
-40.0
-30.0
-20.0
-10.0
0.0
10.0
20.0
30.0
40.0
2014 2015 2016
Y-On-Y changes in steelmaking costs
EAF input costs BOF input costs
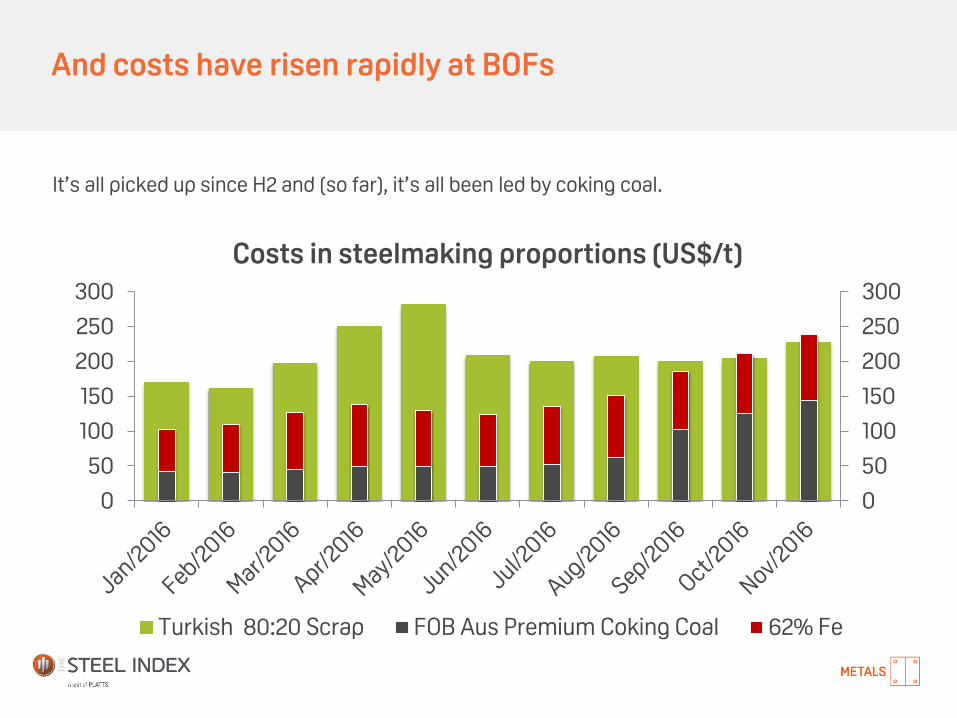
And costs have risen rapidly at BOFs
It’s all picked up since H2 and (so far), it’s all been led by coking coal.
0
50
100
150
200
250
300
0
50
100
150
200
250
300
Costs in steelmaking proportions (US$/t)
Turkish 80:20 Scrap FOB Aus Premium Coking Coal 62% Fe
Immediate and medium term implications
It’s all picked up since H2 and (so far), it’s all been led by coking coal.
EAF production costs are now more competitive than BOF costs.
But…this is increasing demand for scrap.
Integrated mills have reversed cuts in scrap input: moving from 15% to 30% in recent weeks.
Buying is picking up everywhere, not just Turkey. China has been repeatedly in the deep-sea scrap import market over the last month as have others.
Higher grade iron ore is now being sought after (to reduce the amount of coking coal needed in the burden). This is causing iron ore prices to rise.
Steel prices are rising in China: which will benefit EAF producers elsewhere, before it benefits China.
Winter is coming…which will contract scrap supply, just as demand is picking up.
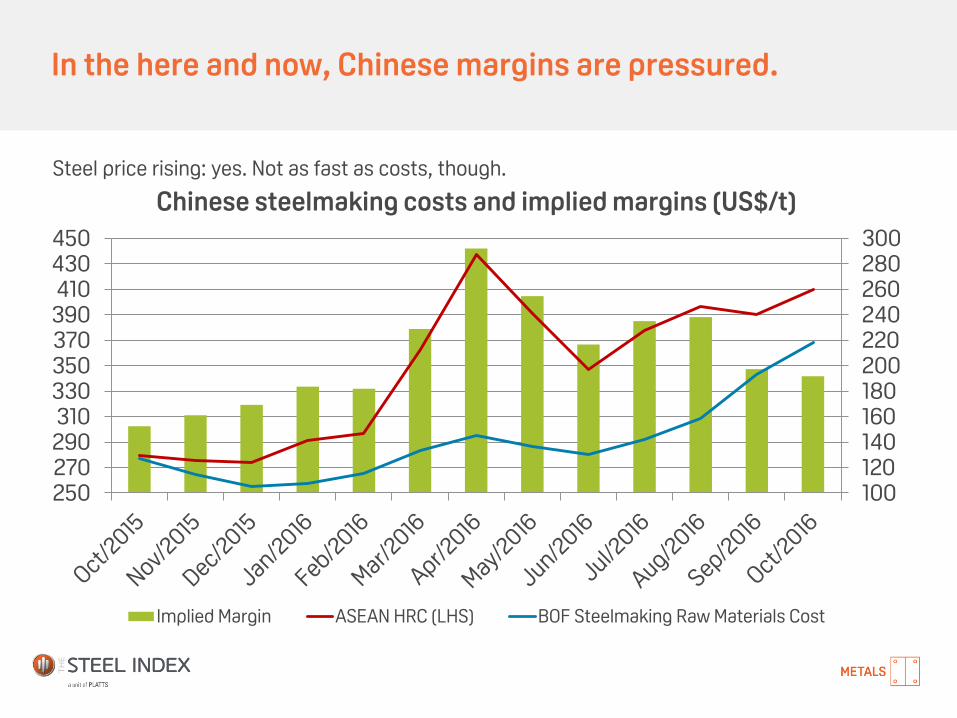
In the here and now, Chinese margins are pressured.
100120140160180200220240260280300
250270290310330350370390410430450
Chinese steelmaking costs and implied margins (US$/t)
Implied Margin ASEAN HRC (LHS) BOF Steelmaking Raw Materials Cost
Steel price rising: yes. Not as fast as costs, though.
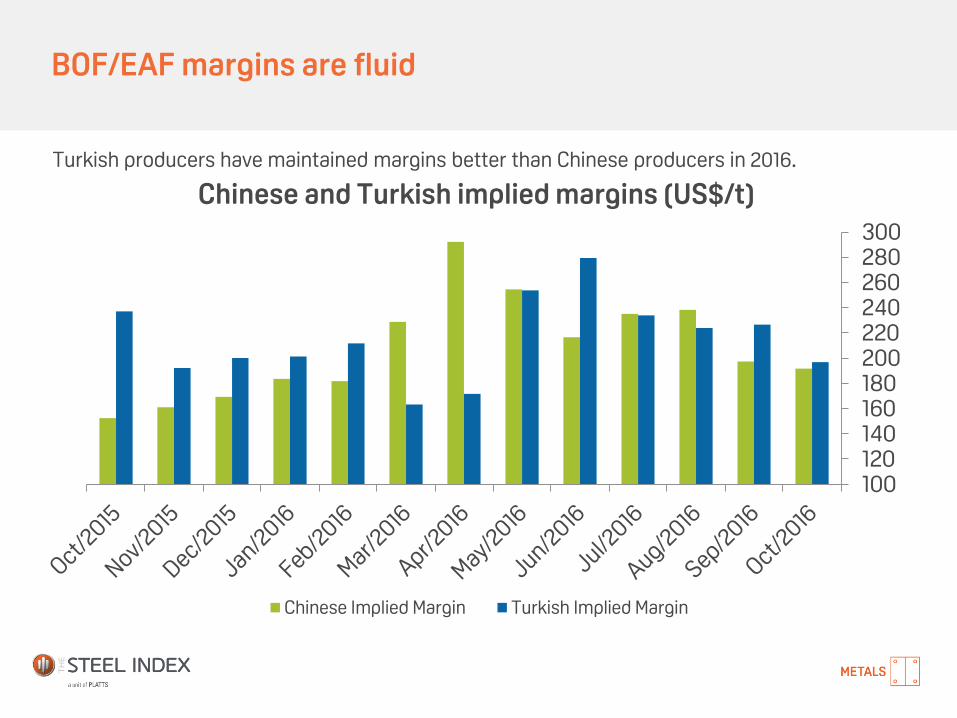
BOF/EAF margins are fluid
100120140160180200220240260280300
Chinese and Turkish implied margins (US$/t)
Chinese Implied Margin Turkish Implied Margin
Turkish producers have maintained margins better than Chinese producers in 2016.
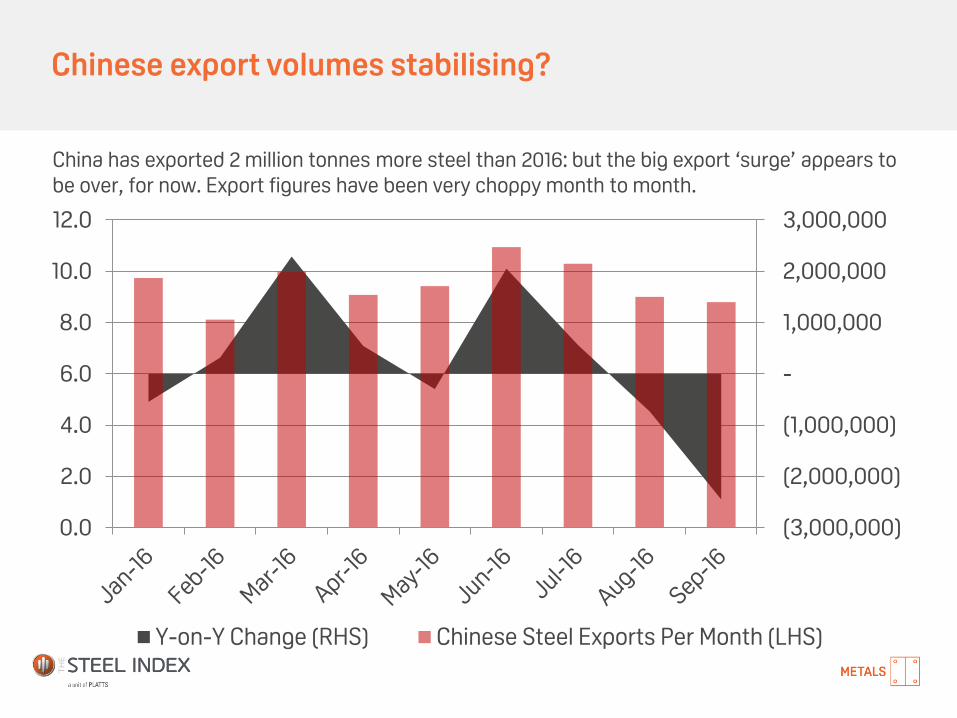
Chinese export volumes stabilising?
China has exported 2 million tonnes more steel than 2016: but the big export ‘surge’ appears to be over, for now. Export figures have been very choppy month to month.
(3,000,000)
(2,000,000)
(1,000,000)
-
1,000,000
2,000,000
3,000,000
0.0
2.0
4.0
6.0
8.0
10.0
12.0
Y-on-Y Change (RHS) Chinese Steel Exports Per Month (LHS)
AGENDA
I. Steelmaking costs
II. Steelmaking competitiveness
III. Margin competitiveness
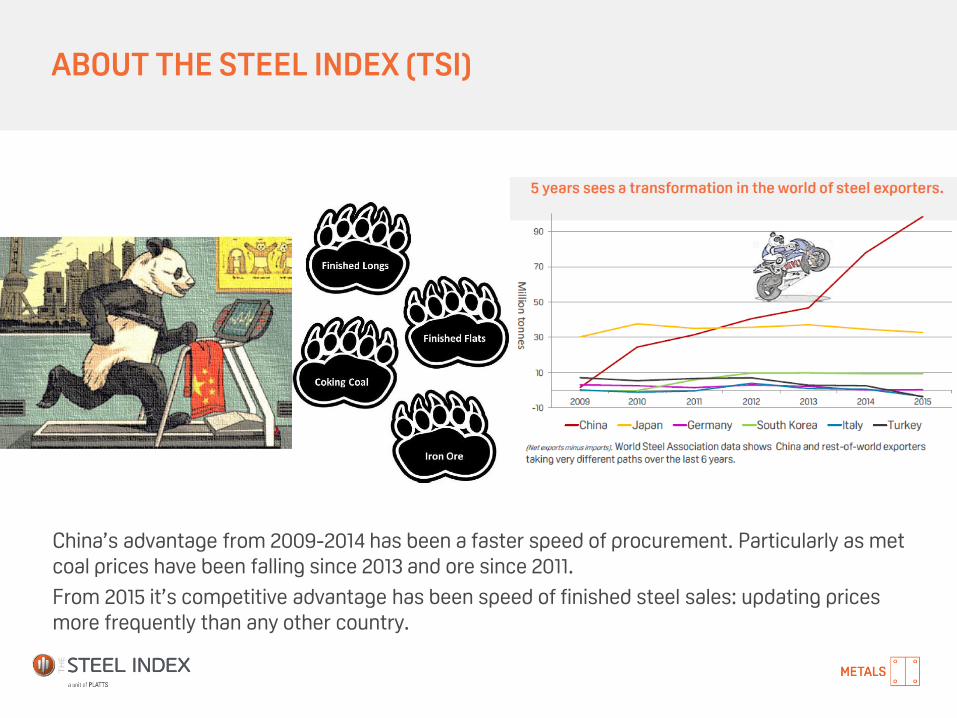
ABOUT THE STEEL INDEX (TSI)
China’s advantage from 2009-2014 has been a faster speed of procurement. Particularly as met coal prices have been falling since 2013 and ore since 2011.
From 2015 it’s competitive advantage has been speed of finished steel sales: updating prices more frequently than any other country.
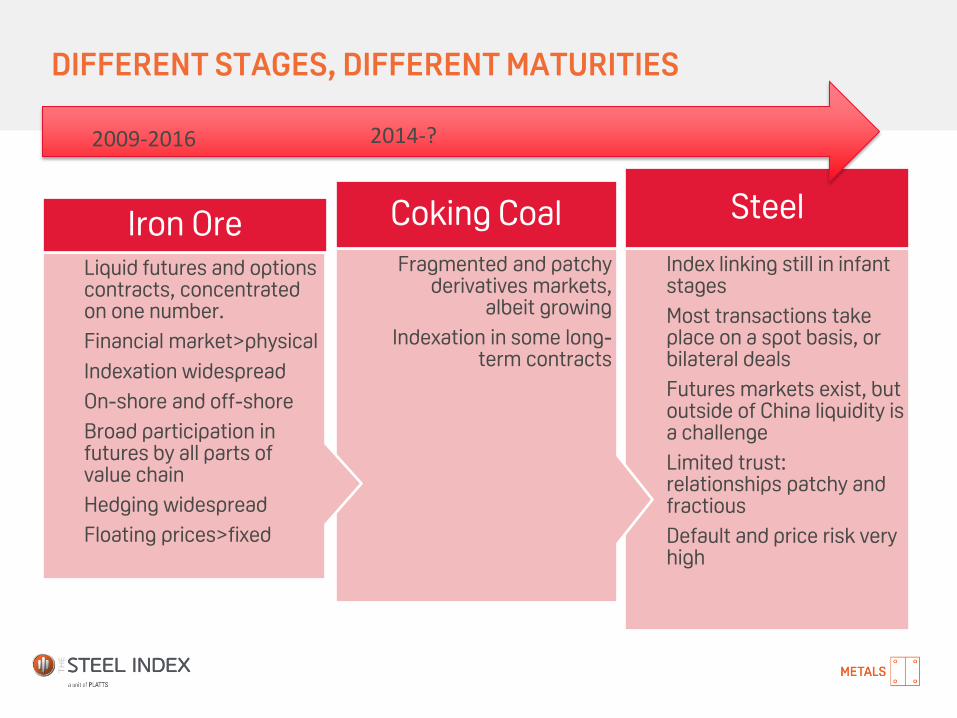
DIFFERENT STAGES, DIFFERENT MATURITIES
Index linking still in infant stages
Most transactions take place on a spot basis, or bilateral deals
Futures markets exist, but outside of China liquidity is a challenge
Limited trust: relationships patchy and fractious
Default and price risk very high
Steel
Fragmented and patchy derivatives markets,
albeit growing
Indexation in some long-term contracts
Coking Coal
Liquid futures and options contracts, concentrated on one number.
Financial market>physical
Indexation widespread
On-shore and off-shore
Broad participation in futures by all parts of value chain
Hedging widespread
Floating prices>fixed
Iron Ore
2009-2016 2014-?
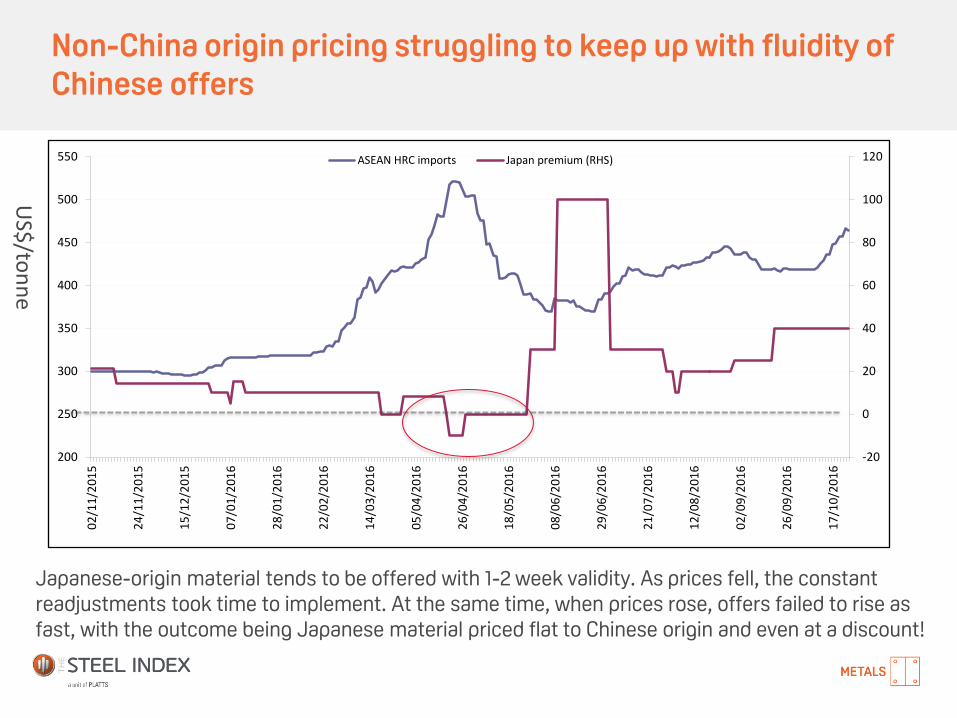
Non-China origin pricing struggling to keep up with fluidity of Chinese offers
Japanese-origin material tends to be offered with 1-2 week validity. As prices fell, the constant readjustments took time to implement. At the same time, when prices rose, offers failed to rise as fast, with the outcome being Japanese material priced flat to Chinese origin and even at a discount!
US$
/ton
ne
-20
0
20
40
60
80
100
120
200
250
300
350
400
450
500
550
02
/11
/20
15
24
/11
/20
15
15
/12
/20
15
07
/01
/20
16
28
/01
/20
16
22
/02
/20
16
14
/03
/20
16
05
/04
/20
16
26
/04
/20
16
18
/05
/20
16
08
/06
/20
16
29
/06
/20
16
21
/07
/20
16
12
/08
/20
16
02
/09
/20
16
26
/09
/20
16
17
/10
/20
16
ASEAN HRC imports Japan premium (RHS)
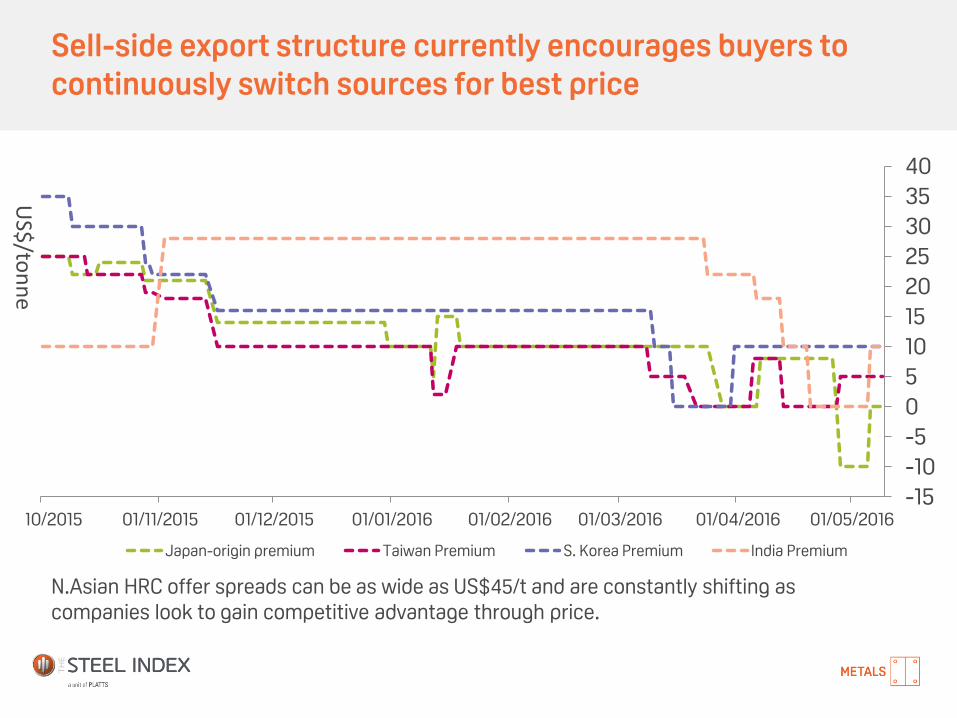
Sell-side export structure currently encourages buyers to continuously switch sources for best price
-15
-10
-5
0
5
10
15
20
25
30
35
40
01/10/2015 01/11/2015 01/12/2015 01/01/2016 01/02/2016 01/03/2016 01/04/2016 01/05/2016
Japan-origin premium Taiwan Premium S. Korea Premium India Premium
N.Asian HRC offer spreads can be as wide as US$45/t and are constantly shifting as companies look to gain competitive advantage through price.
US$
/ton
ne
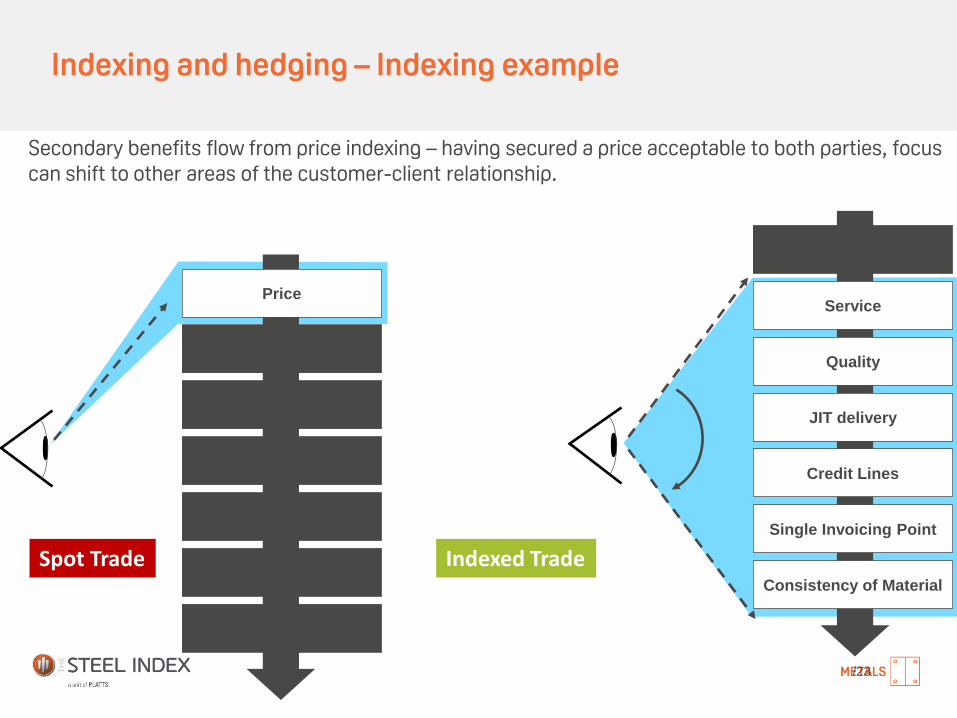
Indexing and hedging – Indexing example
/23
Price
t
Service
Quality
JIT delivery
Credit Lines
Single Invoicing Point
Consistency of Material
Price
Service
Quality
JIT delivery
Credit Lines
Single Invoicing Point
Consistency of Material
Secondary benefits flow from price indexing – having secured a price acceptable to both parties, focus can shift to other areas of the customer-client relationship.
Spot Trade Indexed Trade
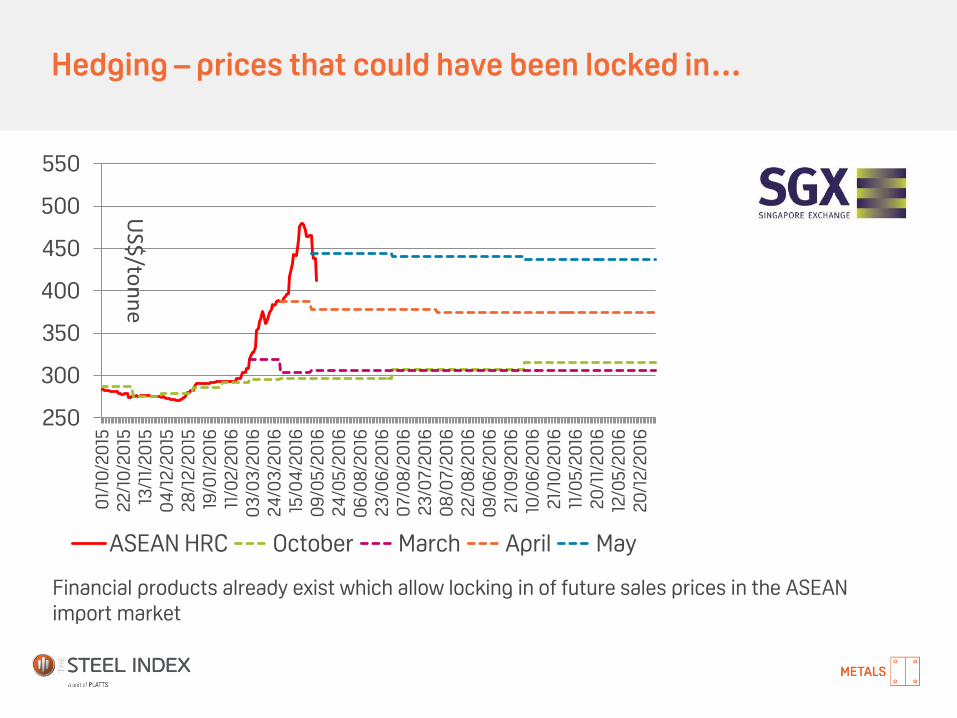
Hedging – prices that could have been locked in…
Financial products already exist which allow locking in of future sales prices in the ASEAN import market
250
300
350
400
450
500
550
01/
10/2
015
22
/10
/20
1513
/11/
20
150
4/1
2/2
015
28
/12
/20
1519
/01/
20
1611
/02
/20
160
3/0
3/2
016
24
/03
/20
1615
/04
/20
160
9/0
5/2
016
24
/05
/20
160
6/0
8/2
016
23
/06
/20
160
7/0
8/2
016
23
/07/
20
160
8/0
7/2
016
22
/08
/20
160
9/0
6/2
016
21/
09
/20
1610
/06
/20
162
1/10
/20
1611
/05
/20
162
0/1
1/2
016
12/0
5/2
016
20
/12
/20
16
ASEAN HRC October March April May
US$
/ton
ne
Thank you! (And DISCLAIMER, again)
All INFORMATION PRESENTED IN THIS REPORT IS AGREED TO BE CONFIDENTIAL AND CANNOT BE REPRODUCED WITHOUT THE EXPRESSED PERMISSION OF THE STEEL INDEX
This document does not constitute an offer or solicitation to buy or sell any investment product(s). It does not take into account the specific investment objectives, financial situation or particular needs of any person. Investors should seek advice from a financial adviser before investing in any investment products or adopting any investment strategies. In the event that the investor chooses not to seek advice from a financial adviser, he/she should consider whether the product in question is suitable for him/her. The investment product(s) discussed herein are subject to significant investment risks, including the possible loss of the principal amount invested. Past performance of investment products is not necessarily a guide to future performance.
Unless expressly stated, we do not make any representations nor give any warranties in respect of the information contained in this presentation. To the extent permitted by the applicable law, we hereby exclude all warranties, conditions, representations or duties whatsoever and howsoever arising (whether express or implied) including but not limited to any representations or warranties as to the ownership of intellectual property or other rights in the presentation, or the satisfactory quality, merchantability or fitness for a particular purpose of, any goods or services referred to at any time in this presentation, any express or statutory warranties, and any warranties or duties regarding accuracy, timeliness, completeness, performance, availability, lack of negligence or of workmanlike effort.
To the fullest extent allowed by applicable law, you agree that we will not be liable to you or your business under any circumstances whatsoever (whether in contract, negligence or any other tort, breach of statutory duty or otherwise) for any loss of profits, income, business interruption, loss of business information or for increase in any costs, liabilities or expenses or any other loss whatsoever and however arising directly or indirectly out of or in connection with or relating to the information in this presentation and we shall not be liable for any loss, damages, costs, expenses or other liability which you incur or suffer as a result of your use of the information in this presentation.
We take all such steps as are reasonably necessary to provide information that is accurate and reliable, but exclude to the fullest extent permitted by law any liability for the inaccuracy of the information in this report.
The Steel Index (TSI) used all reasonable endeavours to certify the correctness of the information contained in this presentation.
Without limiting the above, you acknowledge and agree that we shall not be liable for matters beyond our reasonable control including but not limited to information gathered during field visits, third party information presented or the acts of third parties.
You understand and expressly agree that use of the information presented here is at your sole risk, that any content, material and/or data presented or verbalised or otherwise obtained through your use of the information in this presentation is at your own discretion and risk and that you will be solely responsible for any damage to you personally or your company or organization or business associates whatsoever which in any way results from the use, reliance or application of such content material and/or data and/or information.