Embed Size (px)
Citation preview

The Role of IT Leadership
in Service and Support
Jeff Rumburg

27 Years of IT Service and Support Benchmarking Data
More than 3,000 IT Service and Support Benchmarks
Global Database
70+ Key Performance Indicators
More than 120 Industry Best Practices
2© 2015 MetricNet, LLC, www.metricnet.com
3
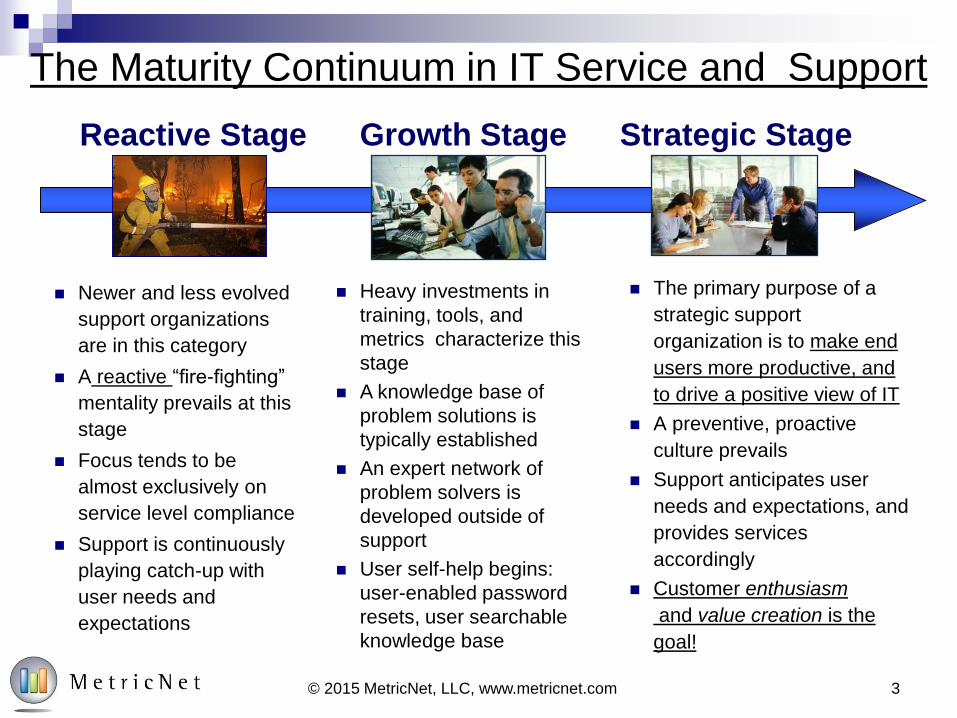
Newer and less evolved
support organizations
are in this category
A reactive “fire-fighting”
mentality prevails at this
stage
Focus tends to be
almost exclusively on
service level compliance
Support is continuously
playing catch-up with
user needs and
expectations
The primary purpose of a
strategic support
organization is to make end
users more productive, and
to drive a positive view of IT
A preventive, proactive
culture prevails
Support anticipates user
needs and expectations, and
provides services
accordingly
Customer enthusiasm
and value creation is the
goal!
Heavy investments in
training, tools, and
metrics characterize this
stage
A knowledge base of
problem solutions is
typically established
An expert network of
problem solvers is
developed outside of
support
User self-help begins:
user-enabled password
resets, user searchable
knowledge base
Reactive Stage Growth Stage Strategic Stage
The Maturity Continuum in IT Service and Support
© 2015 MetricNet, LLC, www.metricnet.com
4© 2015 MetricNet, LLC, www.metricnet.com
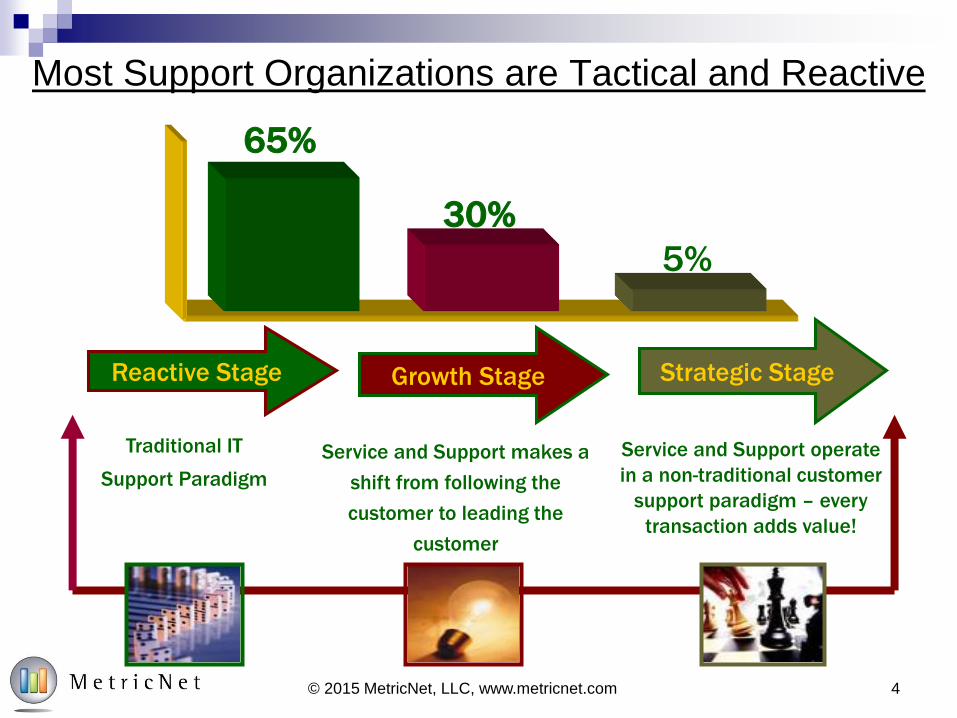
65%
30%
5%
Reactive Stage Growth Stage Strategic Stage
Traditional IT
Support Paradigm
Service and Support makes a
shift from following the
customer to leading the
customer
Service and Support operate
in a non-traditional customer
support paradigm – every
transaction adds value!
Most Support Organizations are Tactical and Reactive

A Leadership Vacuum Above Service and Support
The Dilemma with Leadership in IT
Service and Support…
You Don’t ask for much…
So You Don’t Get Much!
5© 2015 MetricNet, LLC, www.metricnet.com

What Does Effective Leadership Look Like?
6© 2015 MetricNet, LLC, www.metricnet.com
1. Think of Service and Support as a Business – And Act Accordingly!
2. Understand the Economic Potential of Service and Support
3. Demand Business Results and Accountability
4. Become Conversant in the KPI’s of Service and Support
5. Think Holistically – End-to-End Support Process
6. Define and Set Expectations
7. Expect Strategic Thinking and Proactivity
8. Manage the Message of Service and Support
9. Dedicate Time and Attention to the Function
7
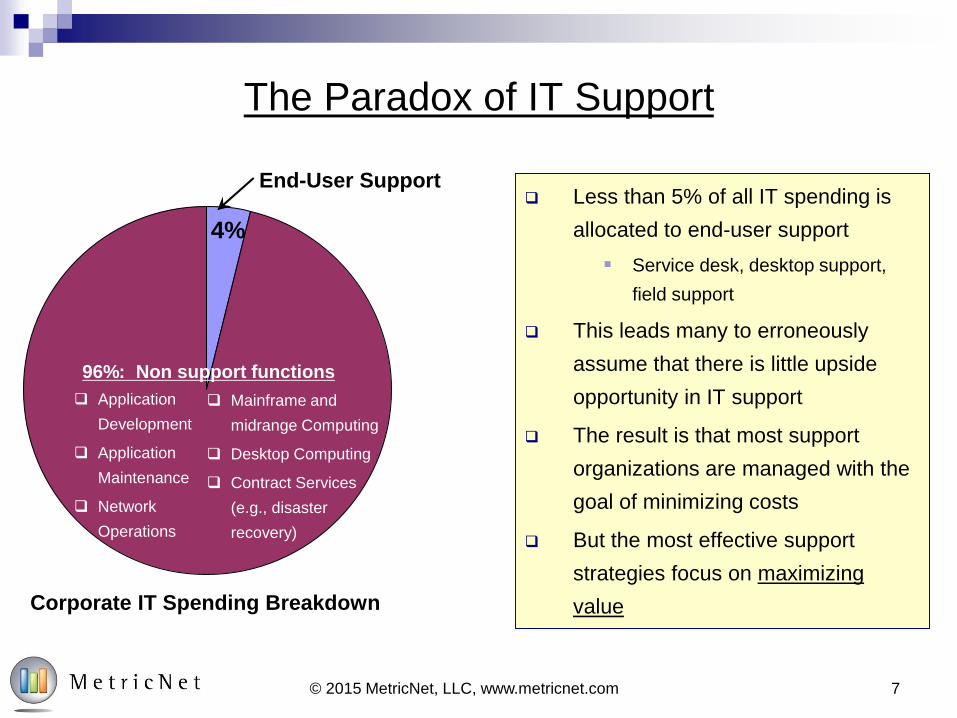
The Paradox of IT Support
Less than 5% of all IT spending is
allocated to end-user support
Service desk, desktop support,
field support
This leads many to erroneously
assume that there is little upside
opportunity in IT support
The result is that most support
organizations are managed with the
goal of minimizing costs
But the most effective support
strategies focus on maximizing
value
© 2015 MetricNet, LLC, www.metricnet.com
Corporate IT Spending Breakdown
4%
96%: Non support functions
End-User Support
Application
Development
Application
Maintenance
Network
Operations
Mainframe and
midrange Computing
Desktop Computing
Contract Services
(e.g., disaster
recovery)
8
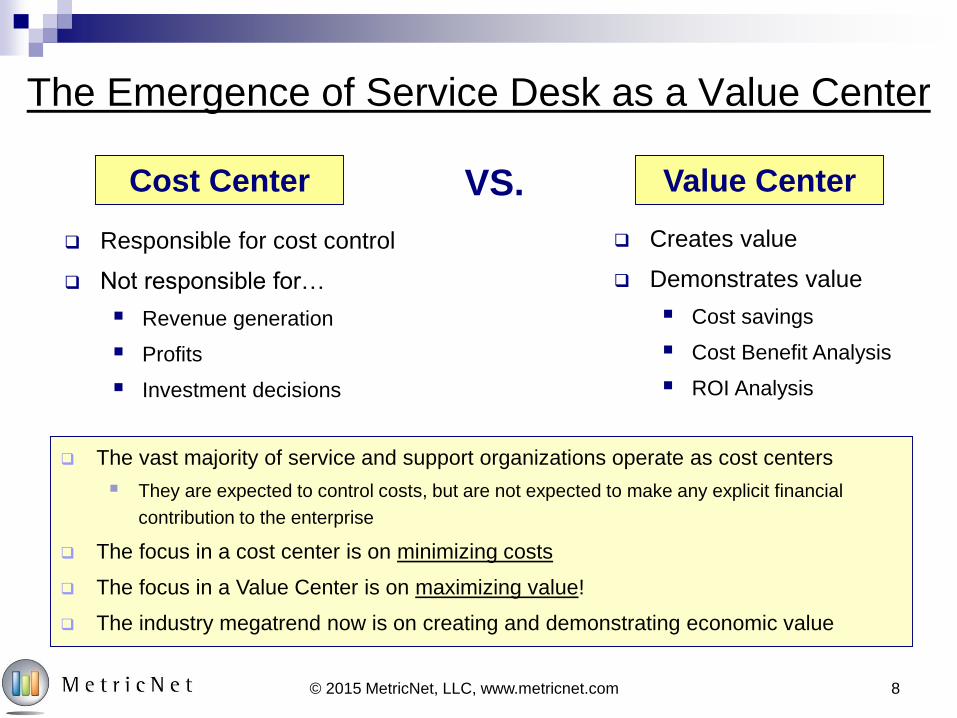
The Emergence of Service Desk as a Value Center
Responsible for cost control
Not responsible for…
Revenue generation
Profits
Investment decisions
Cost Center Value Center
© 2015 MetricNet, LLC, www.metricnet.com
VS.
Creates value
Demonstrates value
Cost savings
Cost Benefit Analysis
ROI Analysis
The vast majority of service and support organizations operate as cost centers
They are expected to control costs, but are not expected to make any explicit financial
contribution to the enterprise
The focus in a cost center is on minimizing costs
The focus in a Value Center is on maximizing value!
The industry megatrend now is on creating and demonstrating economic value
9© 2015 MetricNet, LLC, www.metricnet.com
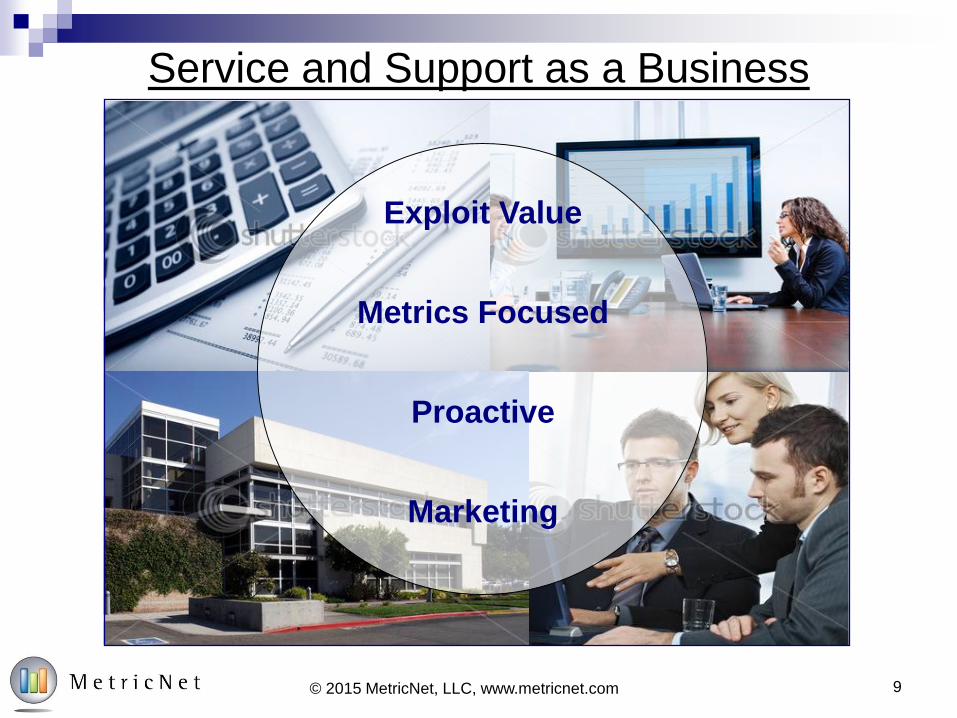
Exploit Value
Metrics Focused
Proactive
Marketing
Service and Support as a Business
Understand the Economic Potential of Service and Support
10© 2015 MetricNet, LLC, www.metricnet.com
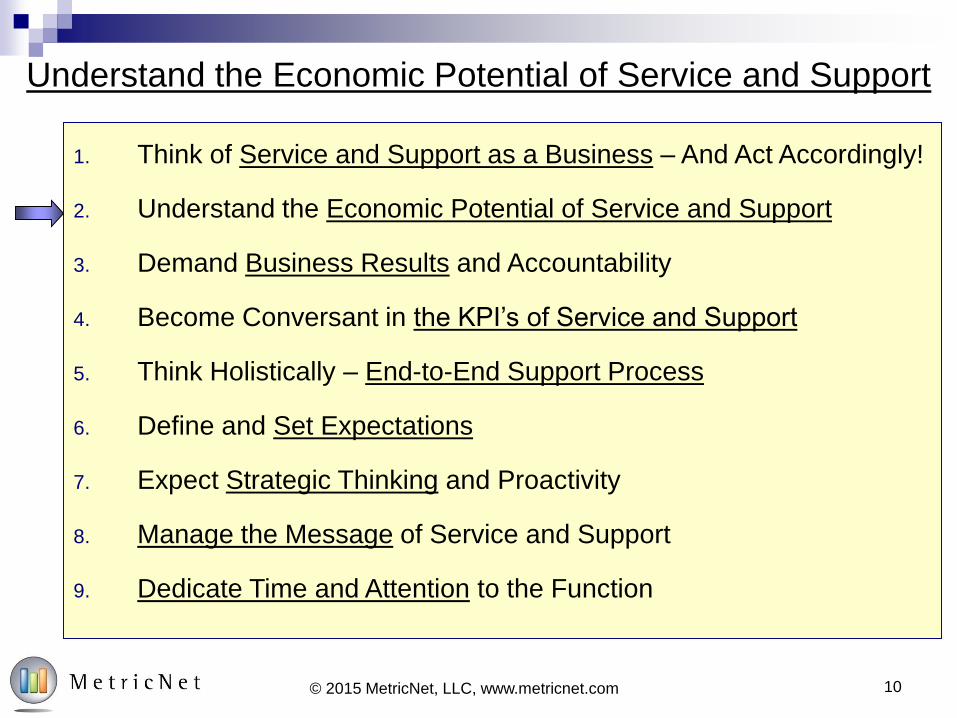
1. Think of Service and Support as a Business – And Act Accordingly!
2. Understand the Economic Potential of Service and Support
3. Demand Business Results and Accountability
4. Become Conversant in the KPI’s of Service and Support
5. Think Holistically – End-to-End Support Process
6. Define and Set Expectations
7. Expect Strategic Thinking and Proactivity
8. Manage the Message of Service and Support
9. Dedicate Time and Attention to the Function
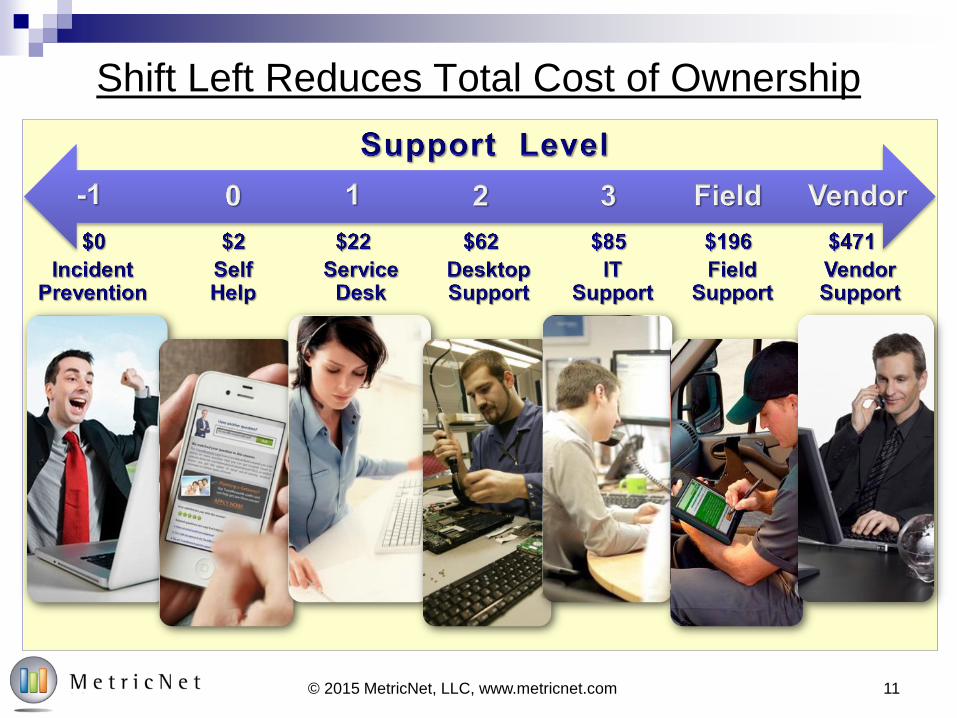
Shift Left Reduces Total Cost of Ownership
11© 2015 MetricNet, LLC, www.metricnet.com
12
0
10
20
30
40
50
60
70
0 1 2 3 4 5
Pro
du
cti
ve H
ou
rs L
ost
per
Em
plo
yee p
er
Year
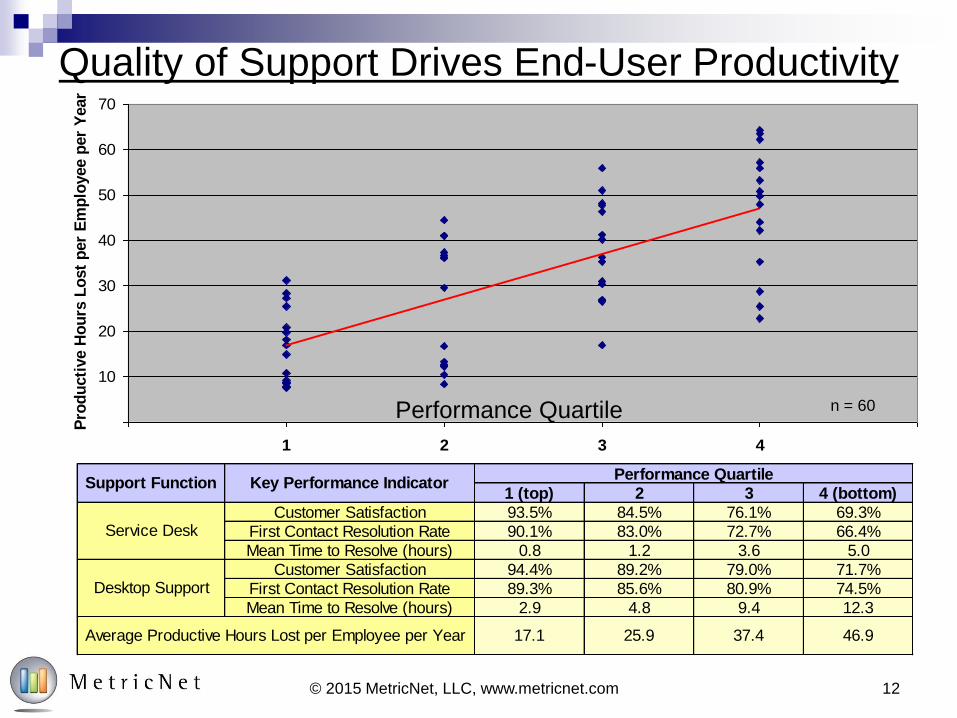
Quality of Support Drives End-User Productivity
1 (top) 2 3 4 (bottom)
Customer Satisfaction 93.5% 84.5% 76.1% 69.3%
First Contact Resolution Rate 90.1% 83.0% 72.7% 66.4%
Mean Time to Resolve (hours) 0.8 1.2 3.6 5.0
Customer Satisfaction 94.4% 89.2% 79.0% 71.7%
First Contact Resolution Rate 89.3% 85.6% 80.9% 74.5%
Mean Time to Resolve (hours) 2.9 4.8 9.4 12.3
Service Desk
Desktop Support
Performance QuartileSupport Function Key Performance Indicator
37.4 46.9Average Productive Hours Lost per Employee per Year 17.1 25.9
Performance Quartile n = 60
© 2015 MetricNet, LLC, www.metricnet.com
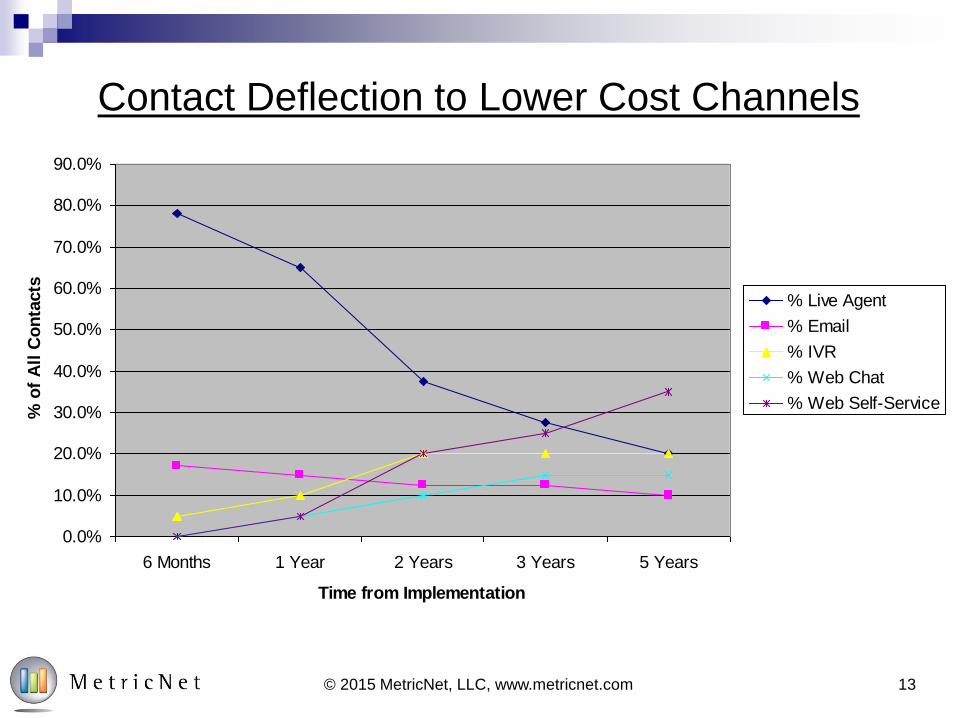
Contact Deflection to Lower Cost Channels
0.0%
10.0%
20.0%
30.0%
40.0%
50.0%
60.0%
70.0%
80.0%
90.0%
6 Months 1 Year 2 Years 3 Years 5 Years
Time from Implementation
% o
f A
ll C
on
tacts
% Live Agent
% IVR
% Web Chat
% Web Self-Service
13© 2015 MetricNet, LLC, www.metricnet.com
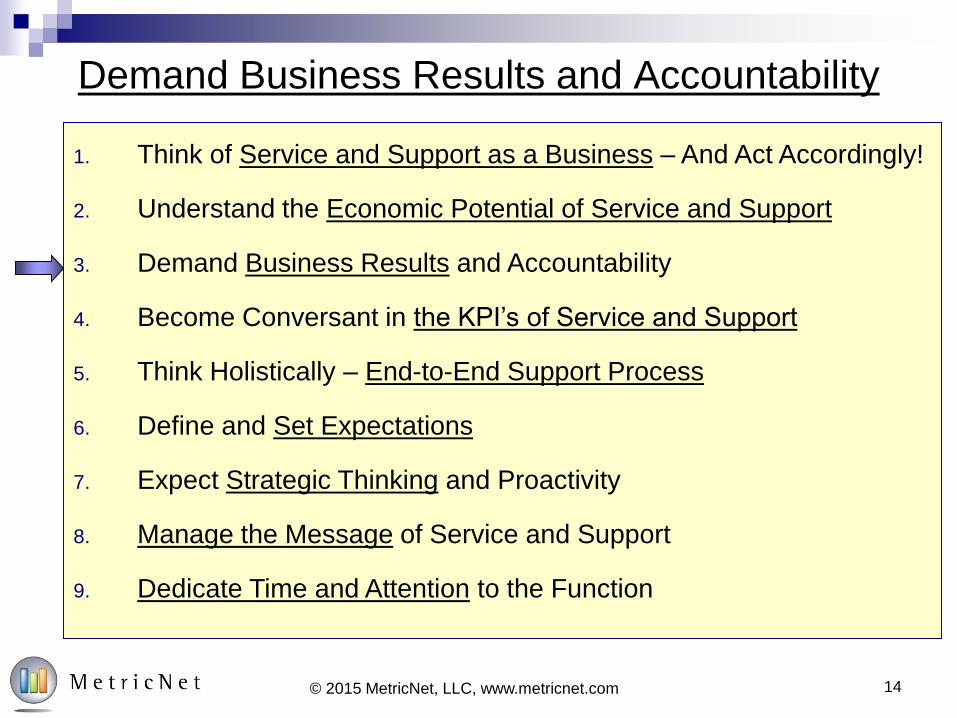
Demand Business Results and Accountability
14© 2015 MetricNet, LLC, www.metricnet.com
1. Think of Service and Support as a Business – And Act Accordingly!
2. Understand the Economic Potential of Service and Support
3. Demand Business Results and Accountability
4. Become Conversant in the KPI’s of Service and Support
5. Think Holistically – End-to-End Support Process
6. Define and Set Expectations
7. Expect Strategic Thinking and Proactivity
8. Manage the Message of Service and Support
9. Dedicate Time and Attention to the Function
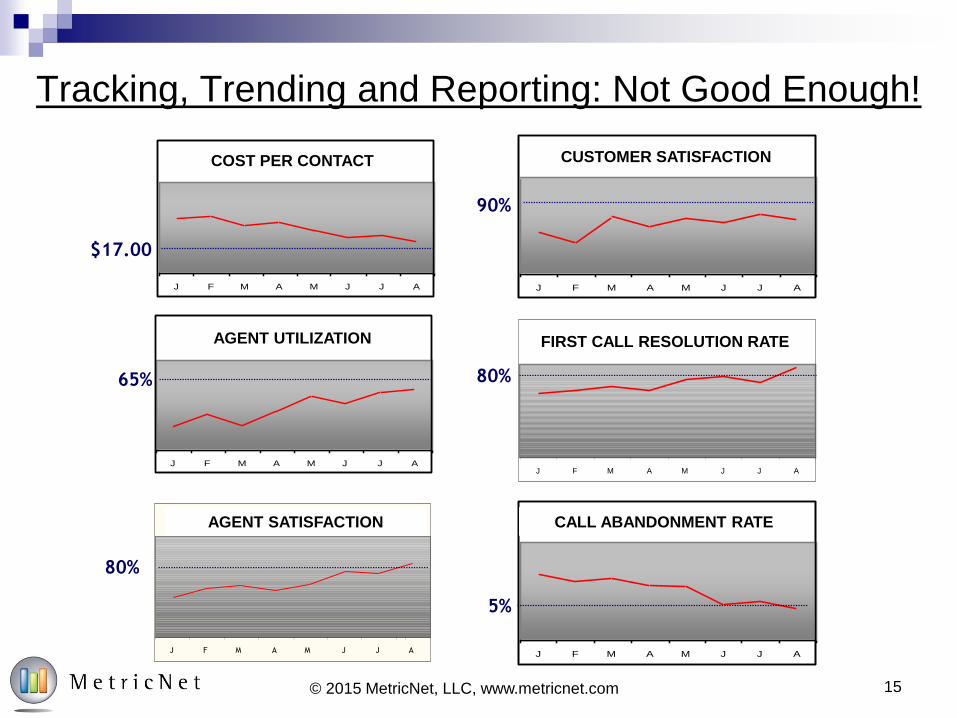
Tracking, Trending and Reporting: Not Good Enough!
80%
65%
$17.00
AGENT UTILIZATION
J F M A M J J A
FIRST CONTACT RESOLUTION
J F M A M J J A
COST PER CONTACT
J F M A M J J A
CUSTOMER SATISFACTION
J F M A M J J A
5%
80%
90%
CALL ABANDONMENT
J F M A M J J A
BALANCED SCORE
J F M A M J J A
COST PER CONTACT CUSTOMER SATISFACTION
FIRST CALL RESOLUTION RATEAGENT UTILIZATION
AGENT SATISFACTION CALL ABANDONMENT RATE
15© 2015 MetricNet, LLC, www.metricnet.com
16
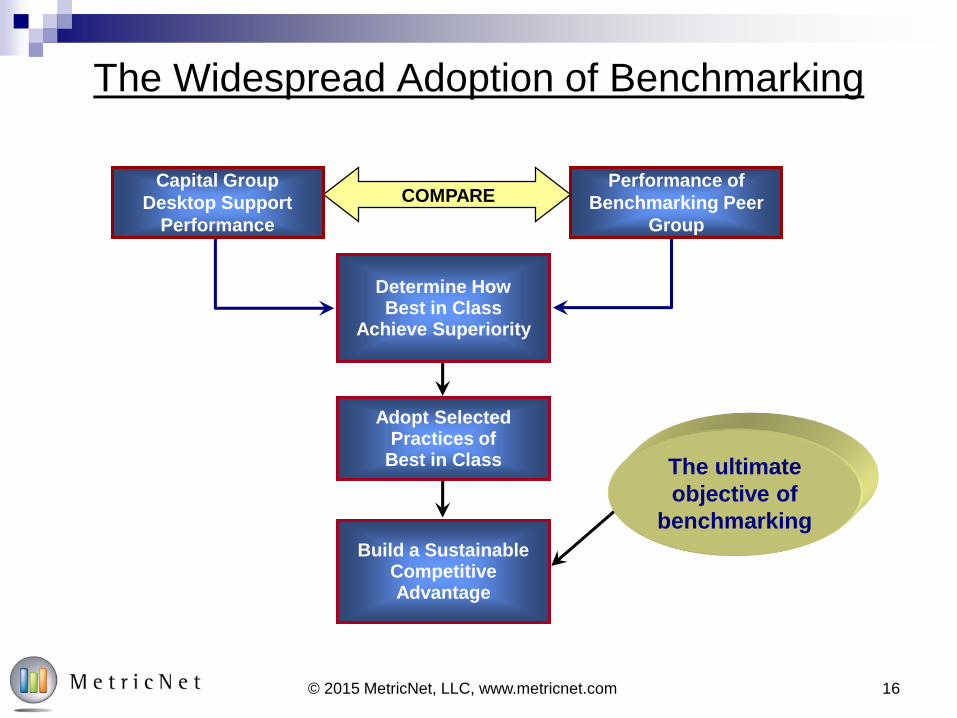
Performance of
Benchmarking Peer
Group
Determine How Best in Class
Achieve Superiority
Adopt Selected Practices of
Best in Class
Build a Sustainable Competitive Advantage
The ultimate
objective of
benchmarking
The Widespread Adoption of Benchmarking
© 2015 MetricNet, LLC, www.metricnet.com
COMPARECapital Group
Desktop Support
Performance

ROI: Prove it Or Lose It!
ROI =Return
Investment=
Savings
Spending
ROI is a simple ratio
It requires quantification of Return (Savings), and Investment
(Spending)
It is measured over a one-year timeframe (One Year ROI is
implied in the metric)
It is one of the most widely used and accepted financial metrics
It can be used prospectively, as part of a Business Case
Analysis
…Or retrospectively to evaluate past business performance
17© 2015 MetricNet, LLC, www.metricnet.com
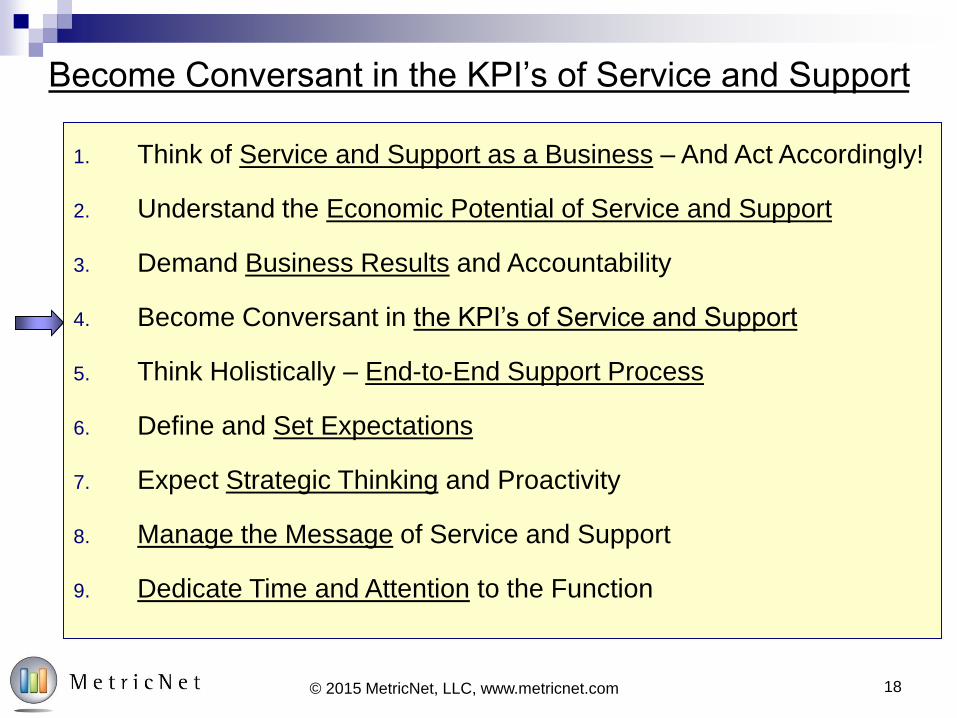
Become Conversant in the KPI’s of Service and Support
18© 2015 MetricNet, LLC, www.metricnet.com
1. Think of Service and Support as a Business – And Act Accordingly!
2. Understand the Economic Potential of Service and Support
3. Demand Business Results and Accountability
4. Become Conversant in the KPI’s of Service and Support
5. Think Holistically – End-to-End Support Process
6. Define and Set Expectations
7. Expect Strategic Thinking and Proactivity
8. Manage the Message of Service and Support
9. Dedicate Time and Attention to the Function

The Premise Behind Service Desk KPI’s
We’ve all heard the expression…
“If you’re not measuring it,
you’re not managing it!”
But there’s more to the story…Lots more!
19© 2015 MetricNet, LLC, www.metricnet.com
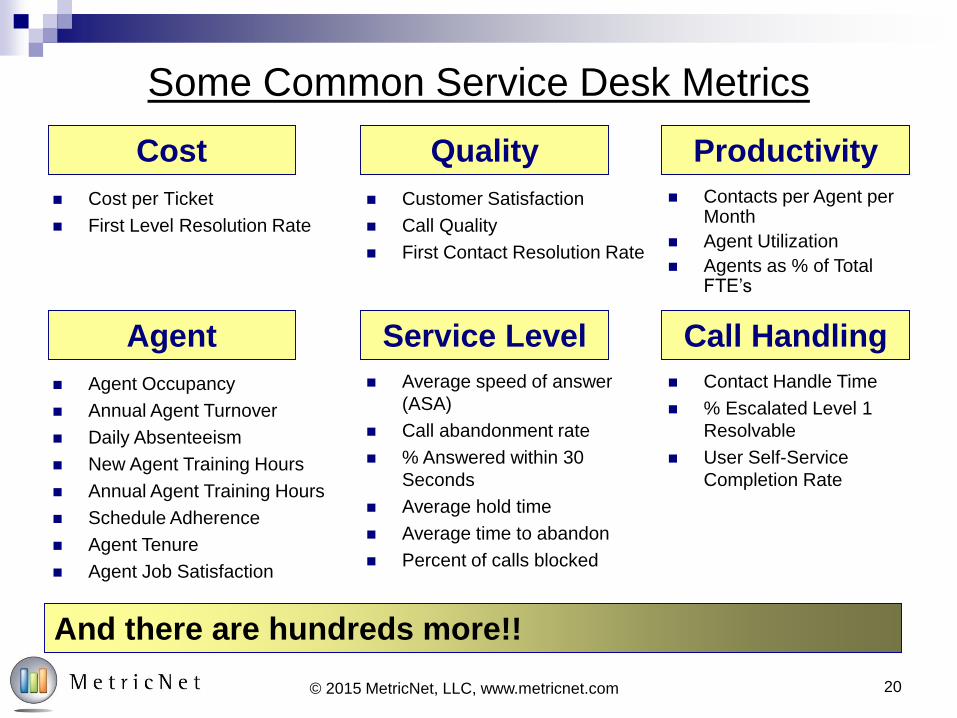
Some Common Service Desk Metrics
Cost per Ticket
First Level Resolution Rate
Cost
Service Level
Quality
Call HandlingAgent
Average speed of answer
(ASA)
Call abandonment rate
% Answered within 30
Seconds
Average hold time
Average time to abandon
Percent of calls blocked
Contacts per Agent per Month
Agent Utilization
Agents as % of Total FTE’s
Customer Satisfaction
Call Quality
First Contact Resolution Rate
Agent Occupancy
Annual Agent Turnover
Daily Absenteeism
New Agent Training Hours
Annual Agent Training Hours
Schedule Adherence
Agent Tenure
Agent Job Satisfaction
Contact Handle Time
% Escalated Level 1
Resolvable
User Self-Service
Completion Rate
And there are hundreds more!!
Productivity
20© 2015 MetricNet, LLC, www.metricnet.com

21© 2015 MetricNet, LLC, www.metricnet.com
The 80/20 Rule for Service Desk KPI’s
Cost per TicketCost
Productivity
Quality
Call Handling
Agent Utilization
Customer Satisfaction
First Contact Resolution Rate
Agent Agent Job Satisfaction
Aggregate Balanced scorecard
TCO First Level Resolution Rate
Read MetricNet’s whitepapers on IT Support KPI’s. Go to www.metricnet.com to download your copy!
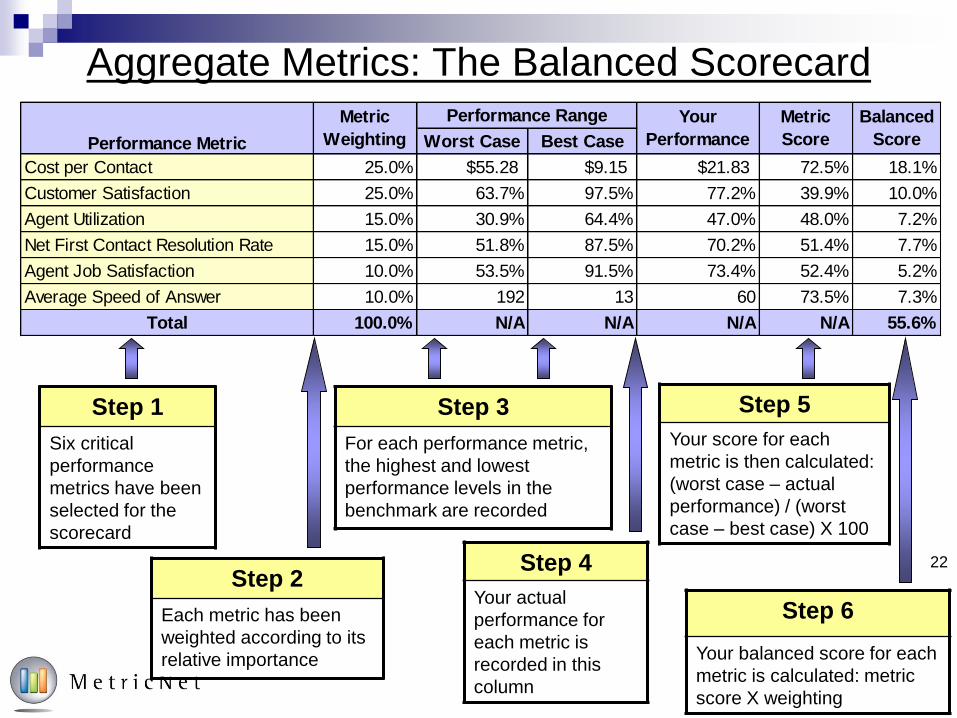
Aggregate Metrics: The Balanced Scorecard
Step 1
Six critical
performance
metrics have been
selected for the
scorecard
Step 2
Each metric has been
weighted according to its
relative importance
Step 3
For each performance metric,
the highest and lowest
performance levels in the
benchmark are recorded
Step 4
Your actual
performance for
each metric is
recorded in this
column
Step 5
Your score for each
metric is then calculated:
(worst case – actual
performance) / (worst
case – best case) X 100
Step 6
Your balanced score for each
metric is calculated: metric
score X weighting
22
Worst Case Best Case
Cost per Contact 25.0% $55.28 $9.15 $21.83 72.5% 18.1%
Customer Satisfaction 25.0% 63.7% 97.5% 77.2% 39.9% 10.0%
Agent Utilization 15.0% 30.9% 64.4% 47.0% 48.0% 7.2%
Net First Contact Resolution Rate 15.0% 51.8% 87.5% 70.2% 51.4% 7.7%
Agent Job Satisfaction 10.0% 53.5% 91.5% 73.4% 52.4% 5.2%
Average Speed of Answer 10.0% 192 13 60 73.5% 7.3%
Total 100.0% N/A N/A N/A N/A 55.6%
Performance RangeMetric
WeightingPerformance Metric
Balanced
Score
Your
Performance
Metric
Score

23© 2015 MetricNet, LLC, www.metricnet.com
Benchmarking Your Overall Performance
0.0%
10.0%
20.0%
30.0%
40.0%
50.0%
60.0%
70.0%
80.0%
90.0%
100.0%
Ba
lan
ced
Sc
ore
s
High 86.5%
Average ----- 50.3%
Median 50.3%
Low 13.8%
Your Score 55.6%
Balanced Scores
Key Statistics
23© 2015 MetricNet, LLC, www.metricnet.com

The Service Desk Performance Trend
40%
45%
50%
55%
60%
65%
70%
75%
80%
85%
Jan Feb Mar Apr May Jun Jul Aug Sep Oct Nov Dec
Se
rvic
e D
es
k B
ala
nc
ed
Sc
ore
12 Month Average Monthly Score
24© 2015 MetricNet, LLC, www.metricnet.com
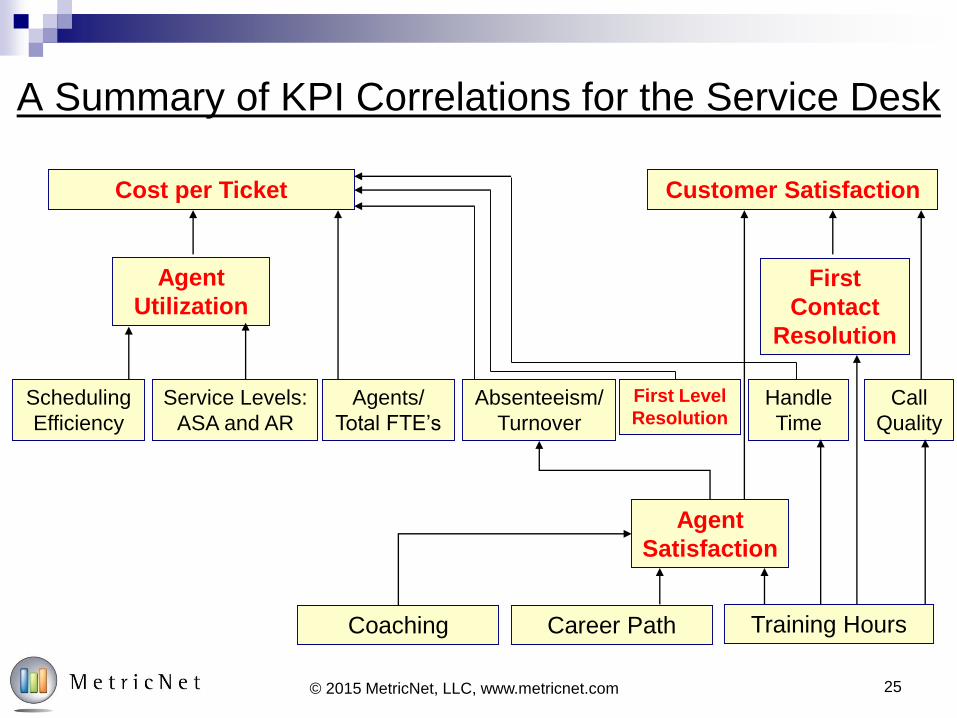
A Summary of KPI Correlations for the Service Desk
Cost per Ticket Customer Satisfaction
Agent
Utilization
First
Contact
Resolution
Agent
Satisfaction
Coaching Career Path Training Hours
Call
Quality
Handle
Time
Agents/
Total FTE’s
Absenteeism/
Turnover
First Level
ResolutionScheduling
Efficiency
Service Levels:
ASA and AR
25© 2015 MetricNet, LLC, www.metricnet.com
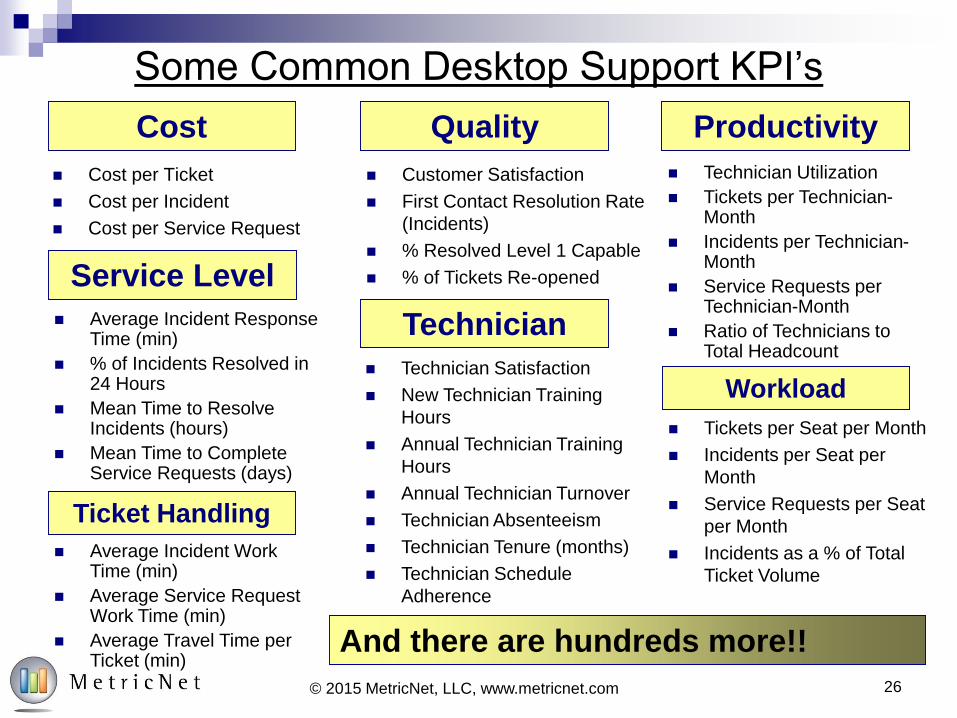
Some Common Desktop Support KPI’s
Cost per Ticket
Cost per Incident
Cost per Service Request
Cost Productivity
Service Level
Quality
Ticket Handling
Technician Average Incident Response Time (min)
% of Incidents Resolved in 24 Hours
Mean Time to Resolve Incidents (hours)
Mean Time to Complete Service Requests (days)
Technician Utilization
Tickets per Technician-Month
Incidents per Technician-Month
Service Requests per Technician-Month
Ratio of Technicians to Total Headcount
Customer Satisfaction
First Contact Resolution Rate
(Incidents)
% Resolved Level 1 Capable
% of Tickets Re-opened
Technician Satisfaction
New Technician Training
Hours
Annual Technician Training
Hours
Annual Technician Turnover
Technician Absenteeism
Technician Tenure (months)
Technician Schedule
Adherence
Average Incident Work Time (min)
Average Service Request Work Time (min)
Average Travel Time per Ticket (min)
And there are hundreds more!!
Workload
Tickets per Seat per Month
Incidents per Seat per
Month
Service Requests per Seat
per Month
Incidents as a % of Total
Ticket Volume
26© 2015 MetricNet, LLC, www.metricnet.com

The 80/20 Rule for Desktop Support KPI’s
Cost per TicketCost
Productivity
Quality
Call Handling
Technician Utilization
Customer satisfaction
First contact resolution rate (incidents)
Technician Technician Satisfaction
Aggregate Balanced scorecard
TCO % Resolved Level 1 Capable
Service Level Mean Time to Resolve
© 2015 MetricNet, LLC, www.metricnet.com 27

A Summary of KPI Correlations for Desktop Support
Cost per Ticket Customer Satisfaction
Technician
Utilization
FCR
(Incidents)
Technician
Satisfaction
Coaching Career Path Training Hours
SL’s
MTTR
Work/
Travel TimeTechs/
Total FTE’s
Absenteeism/
Turnover
First Level
Resolution
Scheduling
Efficiency
Service
Levels: MTTR
28© 2015 MetricNet, LLC, www.metricnet.com

Think Holistically – End-to-End Support Process
1. Think of Service and Support as a Business – And Act Accordingly!
2. Understand the Economic Potential of Service and Support
3. Demand Business Results and Accountability
4. Become Conversant in the KPI’s of Service and Support
5. Think Holistically – End-to-End Support Process
6. Define and Set Expectations
7. Expect Strategic Thinking and Proactivity
8. Manage the Message of Service and Support
9. Dedicate Time and Attention to the Function
29© 2015 MetricNet, LLC, www.metricnet.com
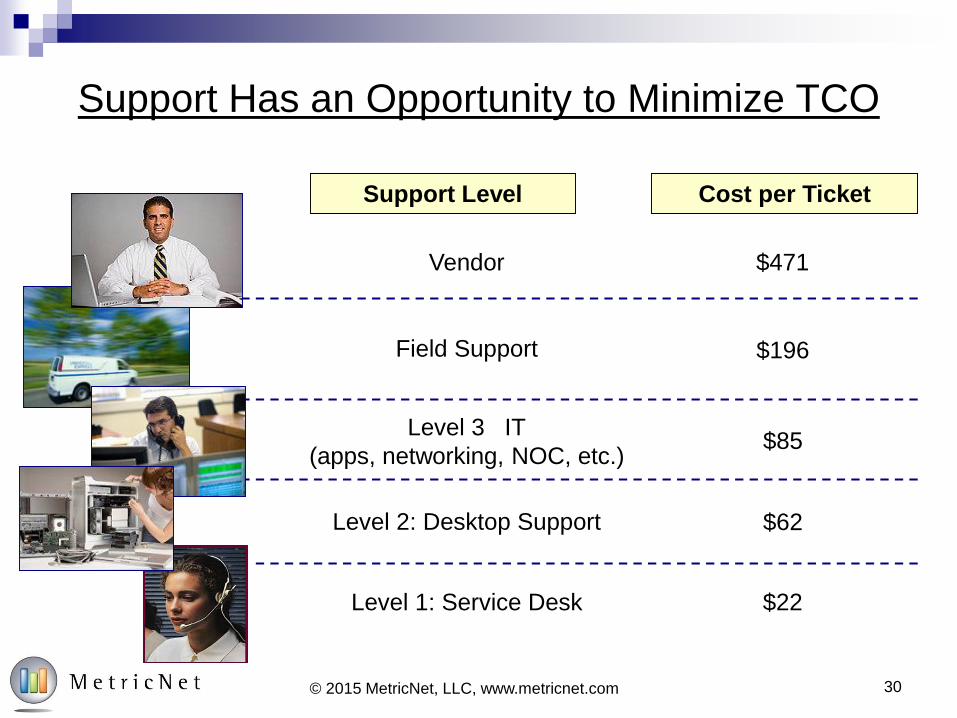
Support Has an Opportunity to Minimize TCO
Support Level Cost per Ticket
Vendor
Level 2: Desktop Support
Field Support
Level 3 IT
(apps, networking, NOC, etc.)
Level 1: Service Desk
$471
$196
$85
$62
$22
30© 2015 MetricNet, LLC, www.metricnet.com
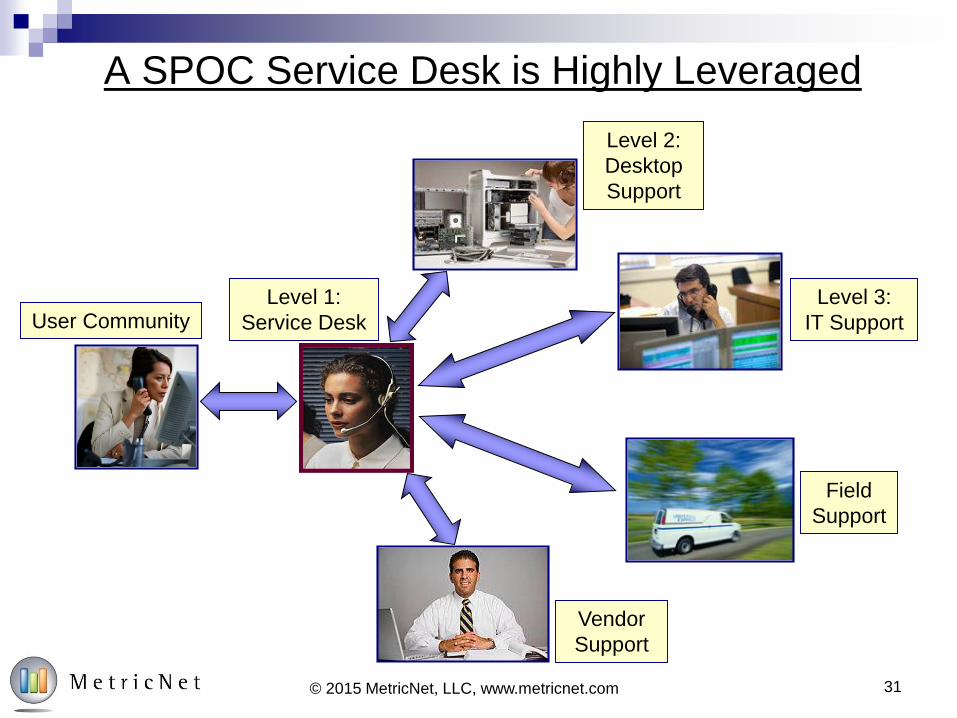
A SPOC Service Desk is Highly Leveraged
User CommunityLevel 1:
Service Desk
Level 2:
Desktop
Support
Field
Support
Level 3:
IT Support
Vendor
Support
31© 2015 MetricNet, LLC, www.metricnet.com
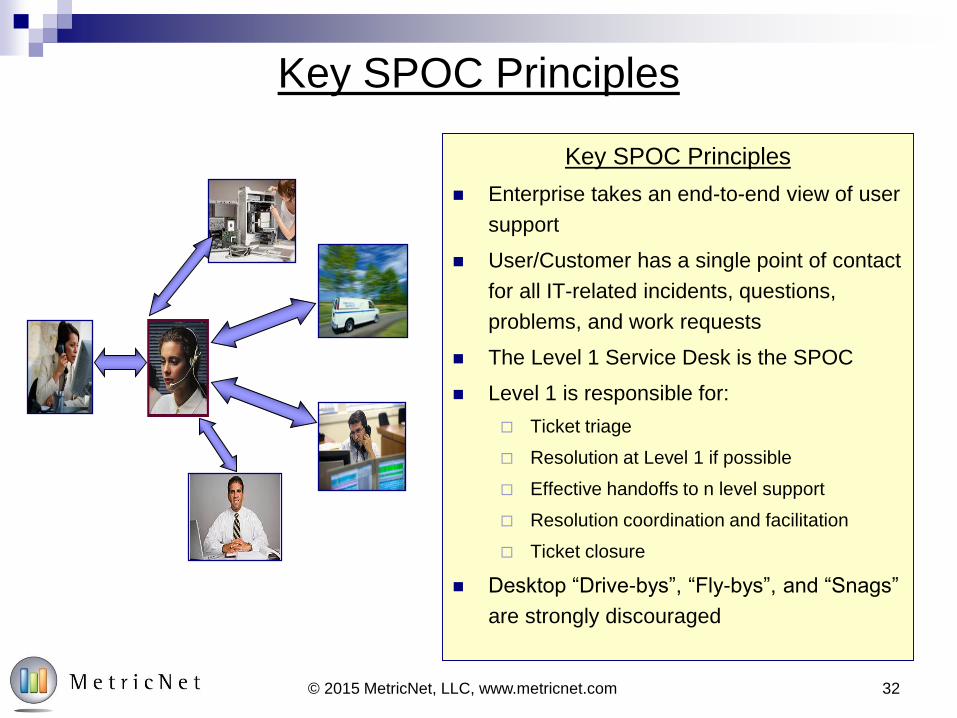
Key SPOC Principles
Key SPOC Principles
Enterprise takes an end-to-end view of user
support
User/Customer has a single point of contact
for all IT-related incidents, questions,
problems, and work requests
The Level 1 Service Desk is the SPOC
Level 1 is responsible for:
Ticket triage
Resolution at Level 1 if possible
Effective handoffs to n level support
Resolution coordination and facilitation
Ticket closure
Desktop “Drive-bys”, “Fly-bys”, and “Snags”
are strongly discouraged
© 2015 MetricNet, LLC, www.metricnet.com 32
33
0.0%
10.0%
20.0%
30.0%
40.0%
50.0%
60.0%
70.0%
80.0%
90.0%
100.0%
Ne
t F
irs
t L
ev
el R
es
olu
tio
n
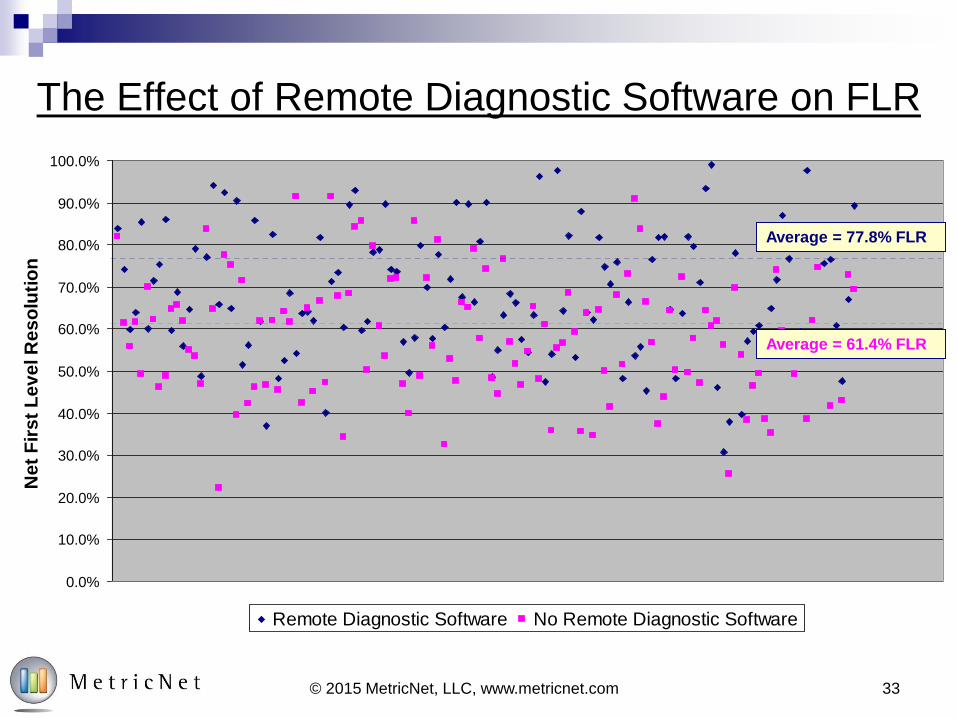
Remote Diagnostic Software No Remote Diagnostic Software
The Effect of Remote Diagnostic Software on FLR
Average = 77.8% FLR
Average = 61.4% FLR
© 2015 MetricNet, LLC, www.metricnet.com
34
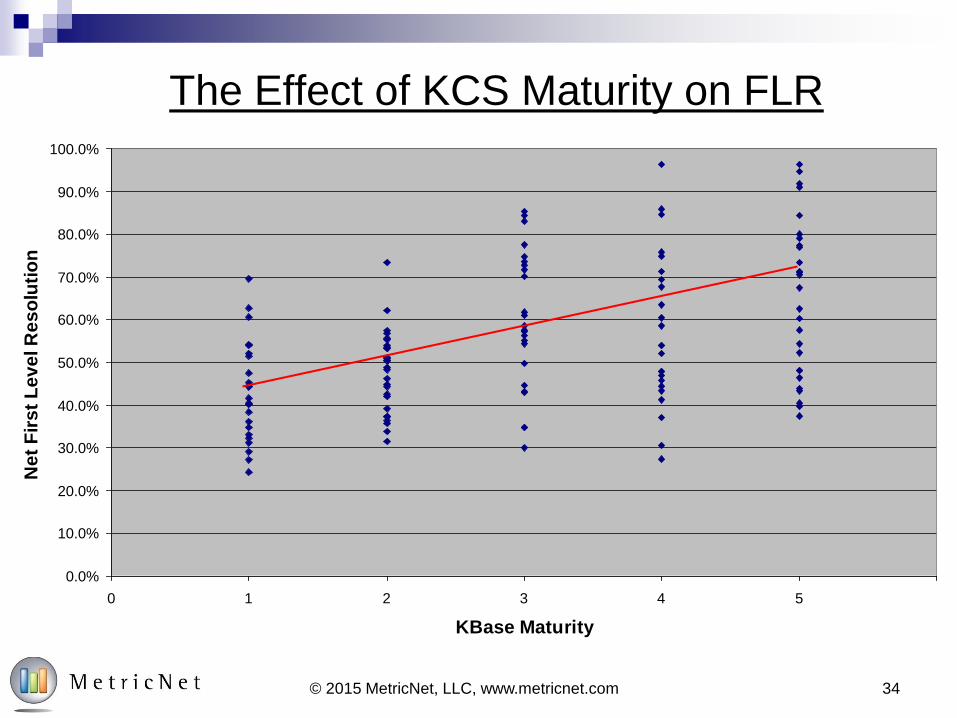
The Effect of KCS Maturity on FLR
© 2015 MetricNet, LLC, www.metricnet.com
0.0%
10.0%
20.0%
30.0%
40.0%
50.0%
60.0%
70.0%
80.0%
90.0%
100.0%
0 1 2 3 4 5 6
KBase Maturity
Ne
t F
irs
t L
ev
el R
es
olu
tio
n
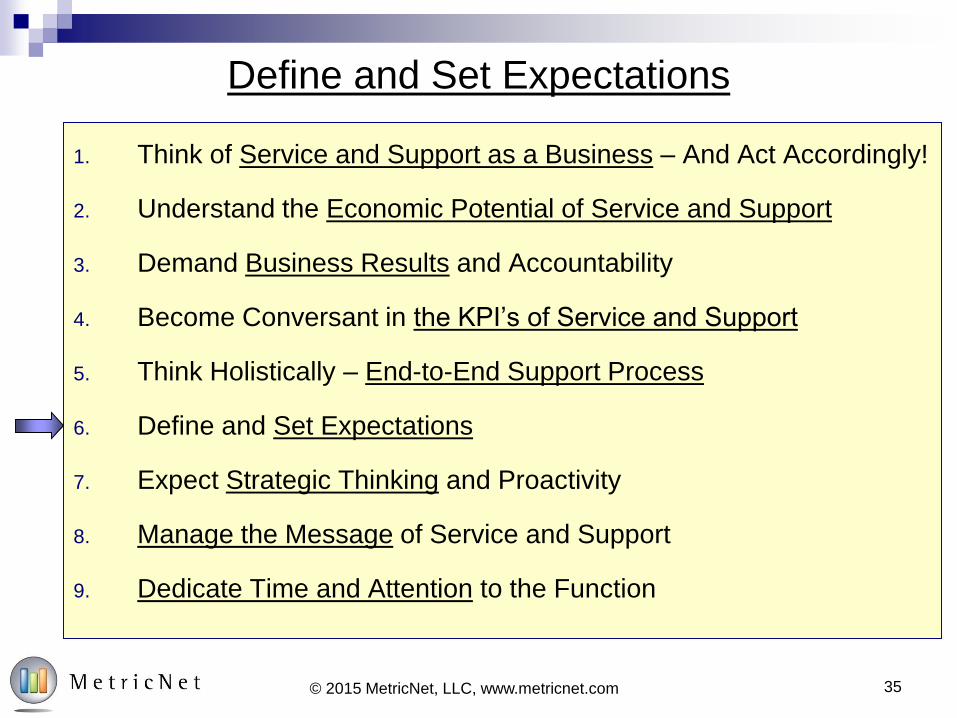
1. Think of Service and Support as a Business – And Act Accordingly!
2. Understand the Economic Potential of Service and Support
3. Demand Business Results and Accountability
4. Become Conversant in the KPI’s of Service and Support
5. Think Holistically – End-to-End Support Process
6. Define and Set Expectations
7. Expect Strategic Thinking and Proactivity
8. Manage the Message of Service and Support
9. Dedicate Time and Attention to the Function
Define and Set Expectations
35© 2015 MetricNet, LLC, www.metricnet.com

Six-Part Model for Service Desk Best Practices
Proactively Managing
Stakeholder Expectations
Stakeholder Communication
A Holistic Approach to
Performance
Measurement
Performance Measurement
Leveraging People and
ProcessesTechnology
Expeditious Delivery of
Customer ServiceProcess
Proactive, Life-cycle
Management of
Personnel
Human
Resources
Defining Your Charter
and MissionStrategy
DefinitionModel
Component
Customer
Enthusiasm
Strategy
Human Resources
ProcessTechnology
PerformanceMeasurement
Stakeholder Communication
36© 2015 MetricNet, LLC, www.metricnet.com
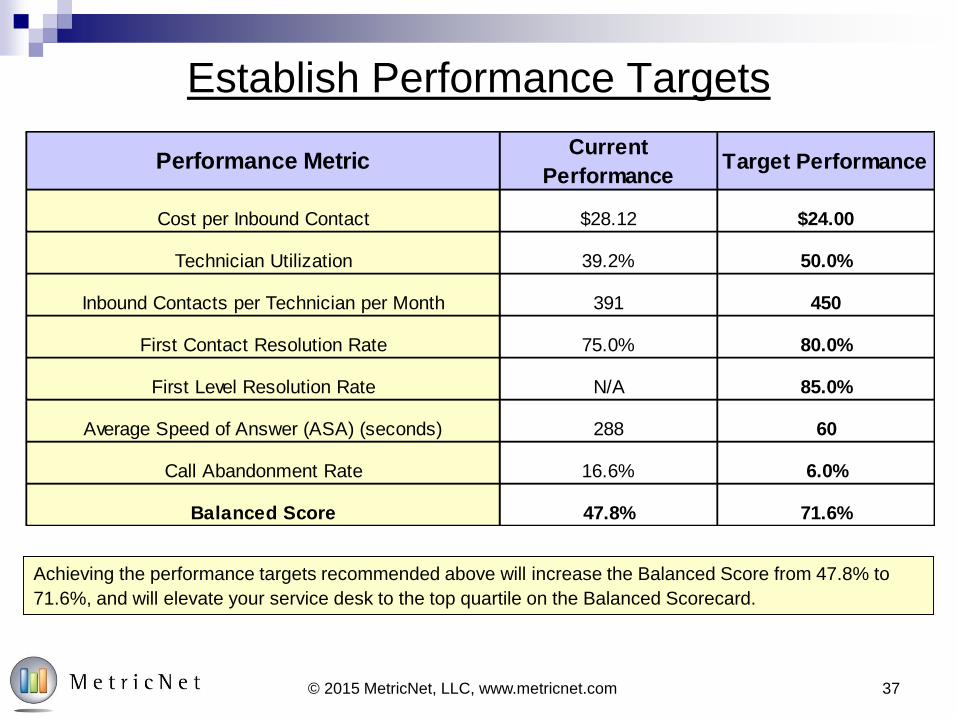
Establish Performance Targets
37© 2015 MetricNet, LLC, www.metricnet.com
Achieving the performance targets recommended above will increase the Balanced Score from 47.8% to
71.6%, and will elevate your service desk to the top quartile on the Balanced Scorecard.
Performance MetricCurrent
PerformanceTarget Performance
Cost per Inbound Contact $28.12 $24.00
Technician Utilization 39.2% 50.0%
Inbound Contacts per Technician per Month 391 450
First Contact Resolution Rate 75.0% 80.0%
First Level Resolution Rate N/A 85.0%
Average Speed of Answer (ASA) (seconds) 288 60
Call Abandonment Rate 16.6% 6.0%
Balanced Score 47.8% 71.6%
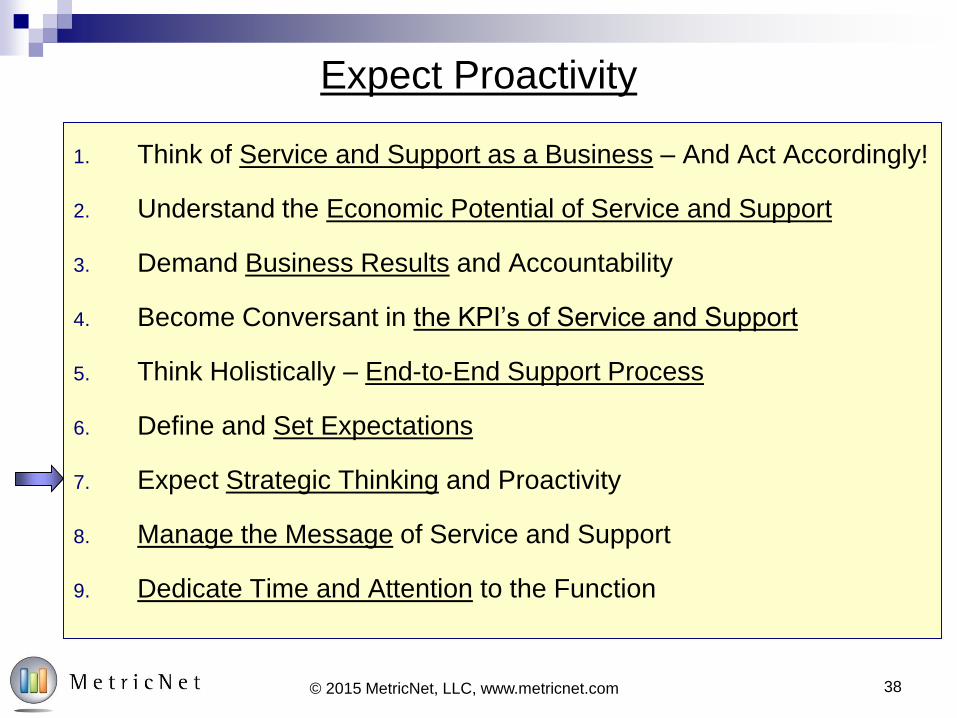
Expect Proactivity
38© 2015 MetricNet, LLC, www.metricnet.com
1. Think of Service and Support as a Business – And Act Accordingly!
2. Understand the Economic Potential of Service and Support
3. Demand Business Results and Accountability
4. Become Conversant in the KPI’s of Service and Support
5. Think Holistically – End-to-End Support Process
6. Define and Set Expectations
7. Expect Strategic Thinking and Proactivity
8. Manage the Message of Service and Support
9. Dedicate Time and Attention to the Function
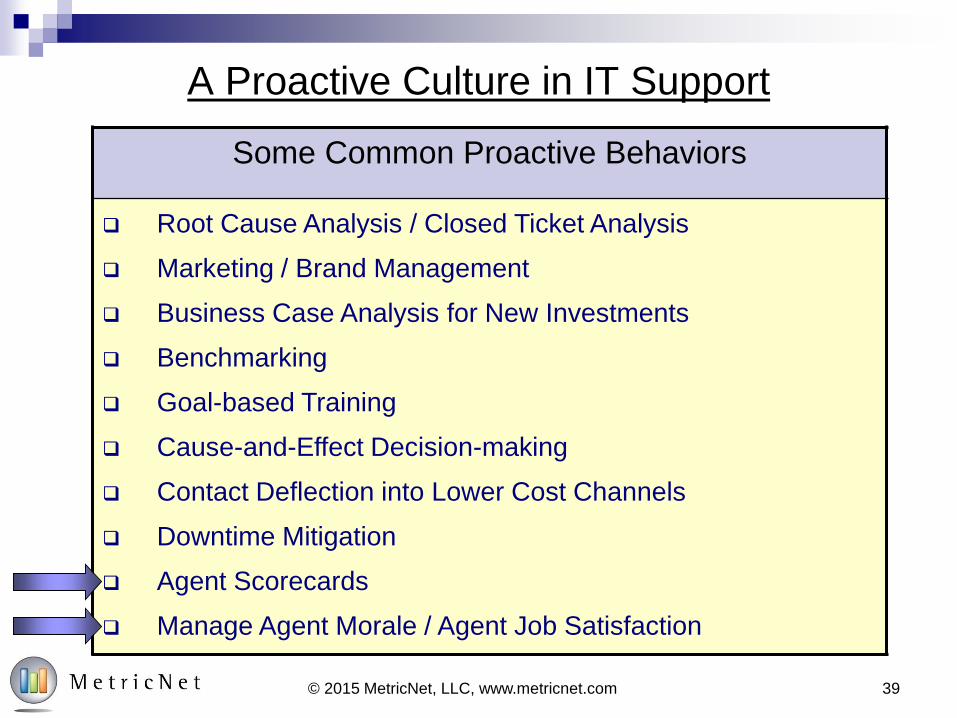
A Proactive Culture in IT Support
Some Common Proactive Behaviors
Root Cause Analysis / Closed Ticket Analysis
Marketing / Brand Management
Business Case Analysis for New Investments
Benchmarking
Goal-based Training
Cause-and-Effect Decision-making
Contact Deflection into Lower Cost Channels
Downtime Mitigation
Agent Scorecards
Manage Agent Morale / Agent Job Satisfaction
39© 2015 MetricNet, LLC, www.metricnet.com
40© MetricNet, LLC, www.metricnet.com
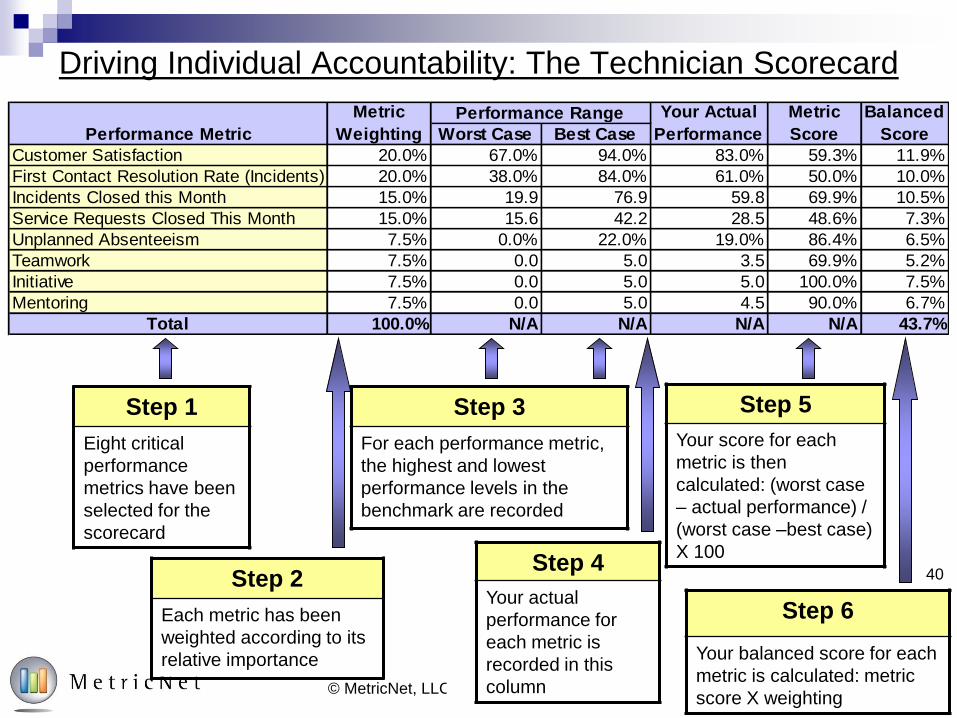
Driving Individual Accountability: The Technician Scorecard
Step 1
Eight critical
performance
metrics have been
selected for the
scorecard
Step 2
Each metric has been
weighted according to its
relative importance
Step 3
For each performance metric,
the highest and lowest
performance levels in the
benchmark are recorded
Step 4
Your actual
performance for
each metric is
recorded in this
column
Step 5
Your score for each
metric is then
calculated: (worst case
– actual performance) /
(worst case –best case)
X 100
Step 6
Your balanced score for each
metric is calculated: metric
score X weighting
40
Worst Case Best Case
Customer Satisfaction 20.0% 67.0% 94.0% 83.0% 59.3% 11.9%
First Contact Resolution Rate (Incidents) 20.0% 38.0% 84.0% 61.0% 50.0% 10.0%
Incidents Closed this Month 15.0% 19.9 76.9 59.8 69.9% 10.5%
Service Requests Closed This Month 15.0% 15.6 42.2 28.5 48.6% 7.3%
Unplanned Absenteeism 7.5% 0.0% 22.0% 19.0% 86.4% 6.5%
Teamwork 7.5% 0.0 5.0 3.5 69.9% 5.2%
Initiative 7.5% 0.0 5.0 5.0 100.0% 7.5%
Mentoring 7.5% 0.0 5.0 4.5 90.0% 6.7%
Total 100.0% N/A N/A N/A N/A 43.7%
Balanced
Score
Your Actual
Performance
Metric
Score
Performance RangeMetric
WeightingPerformance Metric

41© 2015 MetricNet, LLC, www.metricnet.com
Monthly Technician Performance Postings
Sep Aug Jul Jun May Apr
11 1 95.8% 98.0% 97.1% 95.7% 98.3% 97.3% 97.0%
32 2 92.8% 92.1% 90.3% 89.3% 84.6% 92.2% 90.2%
21 3 91.5% 88.5% 83.2% 94.0% 93.7% 93.5% 90.7%
35 4 91.0% 86.8% 85.2% 78.5% 80.5% 68.2% 81.7%
14 5 89.5% 89.1% 90.0% 90.1% 92.3% 92.1% 90.5%
26 6 83.8% 84.4% 90.2% 86.5% 77.8% 63.9% 81.1%
25 7 83.0% 73.6% 81.9% 72.1% 84.8% 87.9% 80.5%
15 8 70.4% 66.6% 53.3% 56.3% 56.6% 39.0% 57.0%
20 9 64.9% 66.5% 70.1% 56.9% 40.9% 72.7% 62.0%
31 10 62.3% 47.4% 22.7% 38.4% 26.0% 93.0% 48.3%
16 11 61.0% 62.8% 54.5% 45.9% 41.7% 62.7% 54.8%
17 12 57.9% 42.1% 32.3% 71.6% 60.3% 60.3% 54.1%
33 13 56.8% 75.5% 64.8% 80.3% 79.7% 73.5% 71.8%
13 14 52.2% 34.9% 61.0% 52.8% 58.9% 48.7% 51.4%
24 15 48.9% 66.7% 86.9% 87.7% 83.6% 74.5% 74.7%
28 16 46.4% 45.5% 19.3% 40.3% 28.8% 32.4% 35.4%
27 17 43.7% 26.5% 31.5% 24.3% 22.2% 17.2% 27.6%
19 18 41.5% 28.4% 50.1% 48.1% 71.1% 81.0% 53.4%
23 19 39.1% 52.3% 57.1% 86.4% 87.7% 88.9% 68.6%
22 20 36.8% 18.7% 19.3% 52.9% 66.4% 64.3% 43.1%
12 21 36.6% 43.2% 33.1% 65.7% 69.0% 86.0% 55.6%
30 22 36.3% 22.6% 23.5% 85.8% 81.5% 70.3% 53.3%
29 23 34.1% 44.9% 50.2% 28.3% 48.9% 36.9% 40.5%
34 24 33.4% 37.9% 23.1% 21.7% 29.7% 22.6% 28.0%
18 25 32.6% 68.4% 80.4% 88.4% 83.8% 91.6% 74.2%
59.3% 58.5% 58.0% 65.5% 66.0% 68.4% 62.6%
Monthly
Ranking
Monthly Average
Technician
Number
Monthly Scorecard Performance Six Month
Average
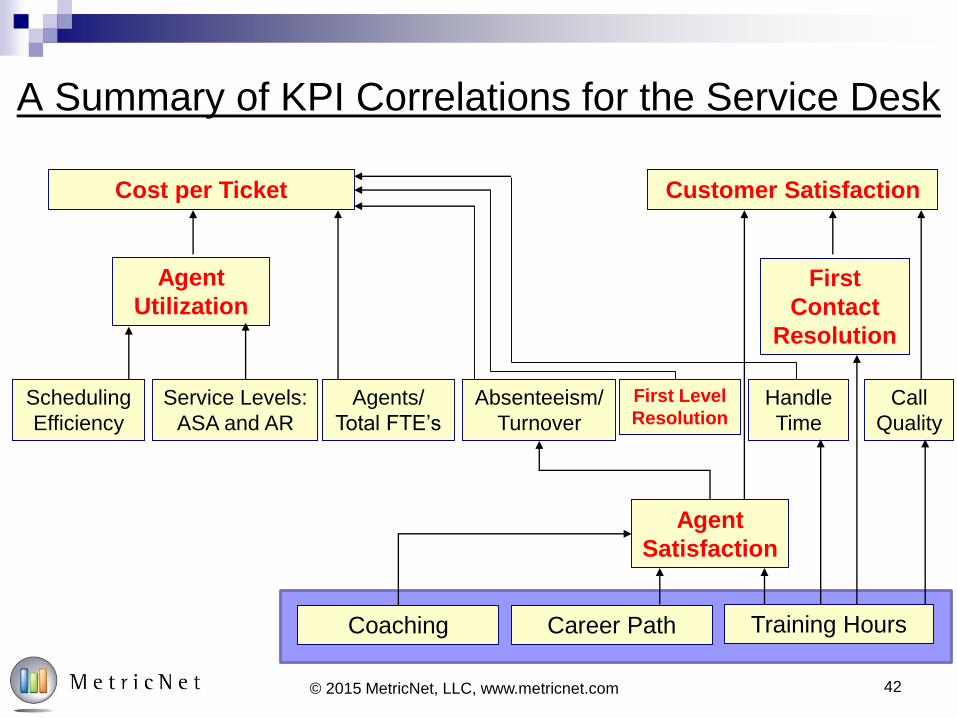
A Summary of KPI Correlations for the Service Desk
Cost per Ticket Customer Satisfaction
Agent
Utilization
First
Contact
Resolution
Agent
Satisfaction
Coaching Career Path Training Hours
Call
Quality
Handle
Time
Agents/
Total FTE’s
Absenteeism/
Turnover
First Level
ResolutionScheduling
Efficiency
Service Levels:
ASA and AR
42© 2015 MetricNet, LLC, www.metricnet.com
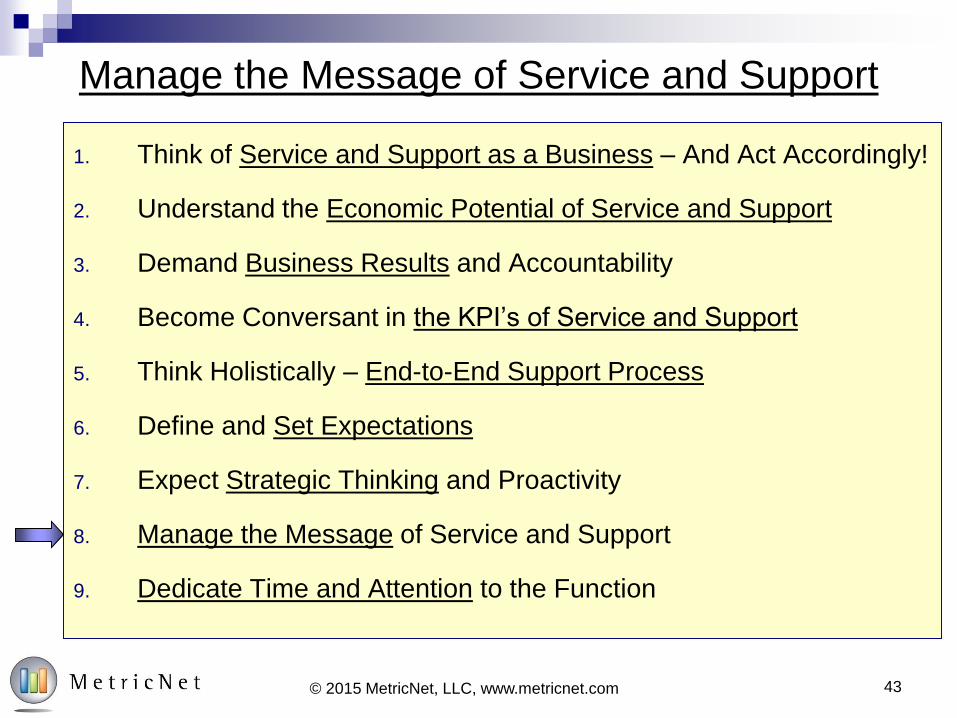
Manage the Message of Service and Support
43© 2015 MetricNet, LLC, www.metricnet.com
1. Think of Service and Support as a Business – And Act Accordingly!
2. Understand the Economic Potential of Service and Support
3. Demand Business Results and Accountability
4. Become Conversant in the KPI’s of Service and Support
5. Think Holistically – End-to-End Support Process
6. Define and Set Expectations
7. Expect Strategic Thinking and Proactivity
8. Manage the Message of Service and Support
9. Dedicate Time and Attention to the Function

44© 2015 MetricNet, LLC, www.metricnet.com
Message Management in IT Support
We’ve all heard the expression…
“Expectations Not Set…
are Expectations Not Met!
So, let’s get serious about proactively managing
expectations!
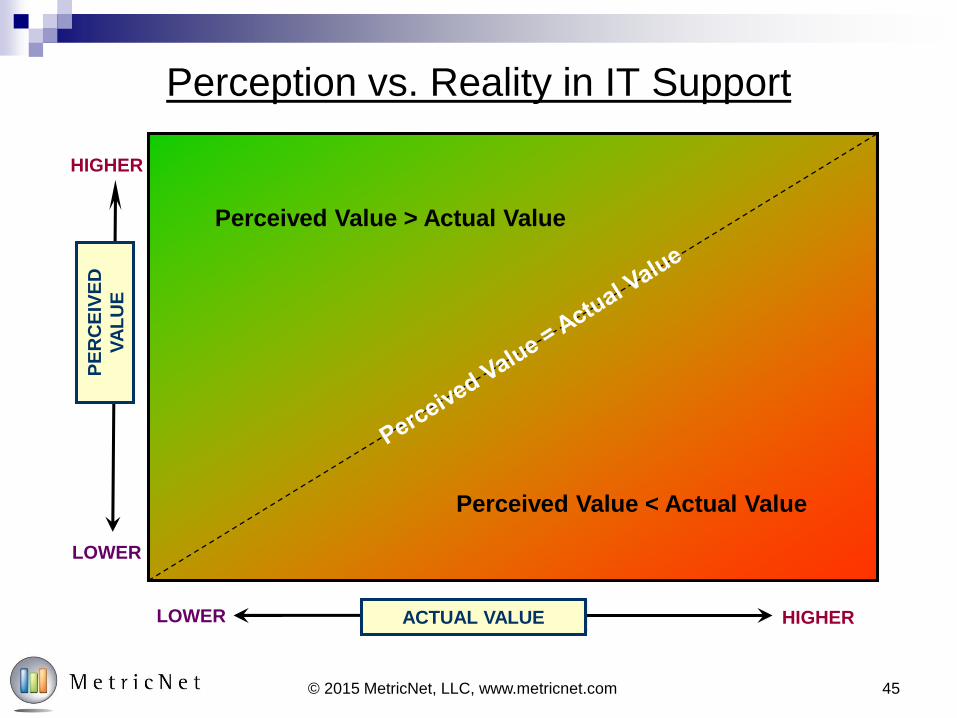
45© 2015 MetricNet, LLC, www.metricnet.com
Perception vs. Reality in IT Support
LOWER COST HIGHERACTUAL VALUE
PE
RC
EIV
ED
VA
LU
E
HIGHER
LOWER
Perceived Value > Actual Value
Perceived Value < Actual Value

Perception Is Almost Always Worse Than the Reality
LOWER COST HIGHERACTUAL VALUE
PE
RC
EIV
ED
VA
LU
E
HIGHER
LOWER
Perceived Value > Actual Value
Perceived Value < Actual Value
A Common (but
Dangerous) Operating
Position
46© 2015 MetricNet, LLC, www.metricnet.com

Brand Management in IT Support
LOWER COST HIGHERACTUAL VALUE
PE
RC
EIV
ED
VA
LU
E
HIGHER
LOWER
Perceived Value > Actual Value
Perceived Value < Actual Value
#1 Operational
Effectiveness
#2 B
ran
d
Man
ag
em
en
t
47© 2015 MetricNet, LLC, www.metricnet.com
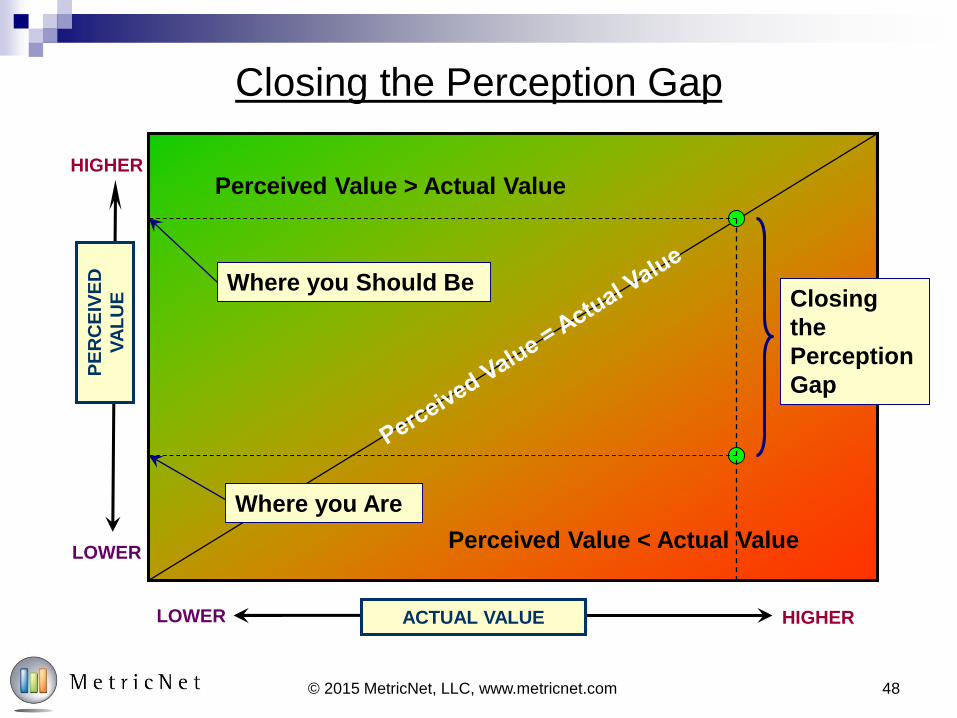
Closing the Perception Gap
LOWER COST HIGHERACTUAL VALUE
PE
RC
EIV
ED
VA
LU
E
HIGHER
LOWER
Perceived Value > Actual Value
Perceived Value < Actual Value
Closing
the
Perception
Gap
Where you Should Be
Where you Are
48© 2015 MetricNet, LLC, www.metricnet.com

49© 2015 MetricNet, LLC, www.metricnet.com
Brand Management: The Five W’s
1. Who – Who are the Key Stakeholder Groups?
2. What – What are the Key Messages?
3. When – When are You Going to Communicate Them?
4. Where/How – Where/How do You Reach the Stakeholders?
5. Why – Why are We Doing This?

Key Success Factors in Messaging IT Support
MessagesTim
ing
Timing
Frequent Contact
• New employee orientation
• At session log-in
• During training
• During the incident
• At scheduled sessions
Messages
Multiple Messages
• Services
• Major initiatives
• Performance Levels
• FAQ’s
• Success Stories
Channels
Use All Available
• Log-in messages
• Newsletters
• Reference Guides
• Asset tags
• Surveys
• User Liaisons
Tim
ing
50© 2015 MetricNet, LLC, www.metricnet.com
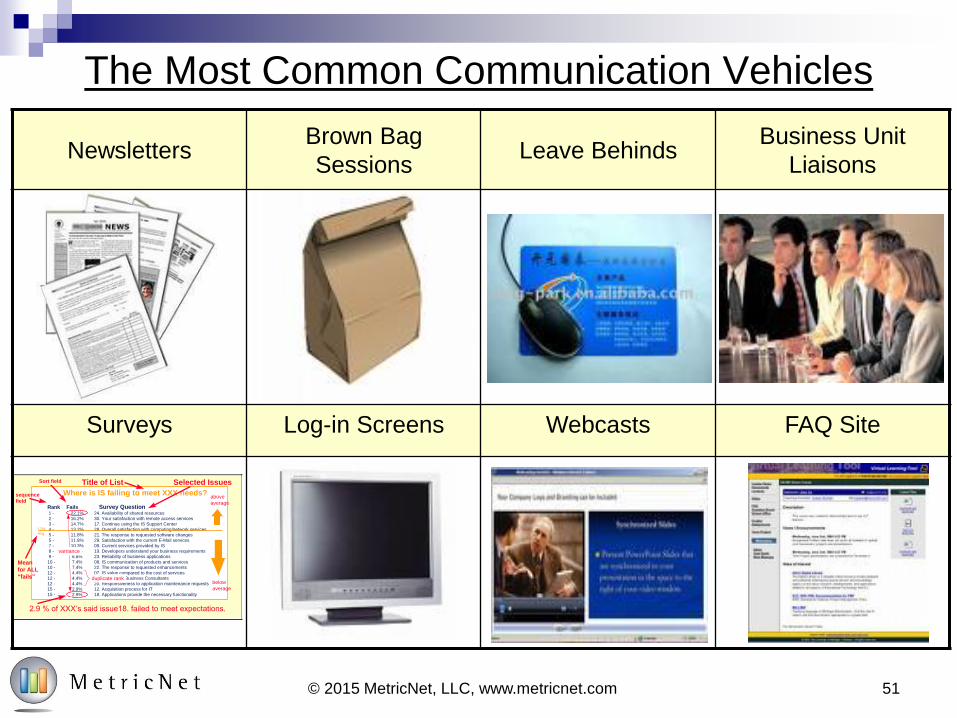
51© 2015 MetricNet, LLC, www.metricnet.com
The Most Common Communication Vehicles
Where is IS failing to meet XXX needs?
Rank Fails Survey Question
1 - 22.1% 24. Availability of shared resources
2 - 16.2% 30. Your satisfaction with remote access services
3 - 14.7% 17. Continue using the IS Support Center
4 - 13.2% 28. Overall satisfaction with computing/network services
5 - 11.8% 21. The response to requested software changes
5 - 11.8% 29. Satisfaction with the current E-Mail services
7 - 10.3% 09. Current services provided by IS
8 - 8.8% 19. Developers understand your business requirements
9 - 8.8% 23. Reliability of business applications
10 - 7.4% 08. IS communication of products and services
10 - 7.4% 22. The response to requested enhancements
12 - 4.4% 07. IS value compared to the cost of services
12 - 4.4% 14. Value of IS Business Consultants
12 - 4.4% 20. Responsiveness to application maintenance requests
15 - 2.9% 12. Acquisition process for IT
15 - 2.9% 18. Applications provide the necessary functionality
12%
Avg.
2.9 % of XXX’s said issue18. failed to meet expectations.
Mean
for ALL
“fails”
Sort field
sequence
field
varriance
duplicate rank
Title of List
above
average
below
average
Selected Issues
NewslettersBrown Bag
SessionsLeave Behinds
Business Unit
Liaisons
Surveys Log-in Screens Webcasts FAQ Site

52© 2015 MetricNet, LLC, www.metricnet.com
Messaging Summary
Managing the gap between perception and reality is fairly
straightforward
It doesn’t take a lot of time, or cost a lot of money
But it is critically important
The success of your support organization depends as much on your
image, as it does on your actual performance!
The Benefits of effective Internal Marketing include:
The Opportunity to convey your value proposition!
Customer loyalty and positive word-of-mouth referrals
Credibility, which leverages your ability to Get Things Done!
A Positive Image for IT overall
High levels of Customer Satisfaction

Dedicate Time and Attention to the Function
53© 2015 MetricNet, LLC, www.metricnet.com
1. Think of Service and Support as a Business – And Act Accordingly!
2. Understand the Economic Potential of Service and Support
3. Demand Business Results and Accountability
4. Become Conversant in the KPI’s of Service and Support
5. Think Holistically – End-to-End Support Process
6. Define and Set Expectations
7. Expect Strategic Thinking and Proactivity
8. Manage the Message of Service and Support
9. Dedicate Time and Attention to the Function

© 2015 MetricNet, LLC, www.metricnet.com 54
Exploit the Opportunity!

84%
47%
31%29%
22%19%
8%
0%
10%
20%
30%
40%
50%
60%
70%
80%
90%
Service Desk Desktop
Support
Network
Outages
VPN Training Enterprise
Applications
Desktop
Software
Factors Contributing to IT Customer Satisfaction
% S
ayin
g V
ery
Im
po
rtan
t
n = 1,044
Global large cap companies
Survey type: multiple choice
3 responses allowed per survey
84% cited the service desk as a very important factor in their overall satisfaction with corporate IT
47% cited desktop support as a very important factor in their overall satisfaction with corporate IT
55© 2015 MetricNet, LLC, www.metricnet.com
Service Desk Drives Customer Satisfaction for All of IT
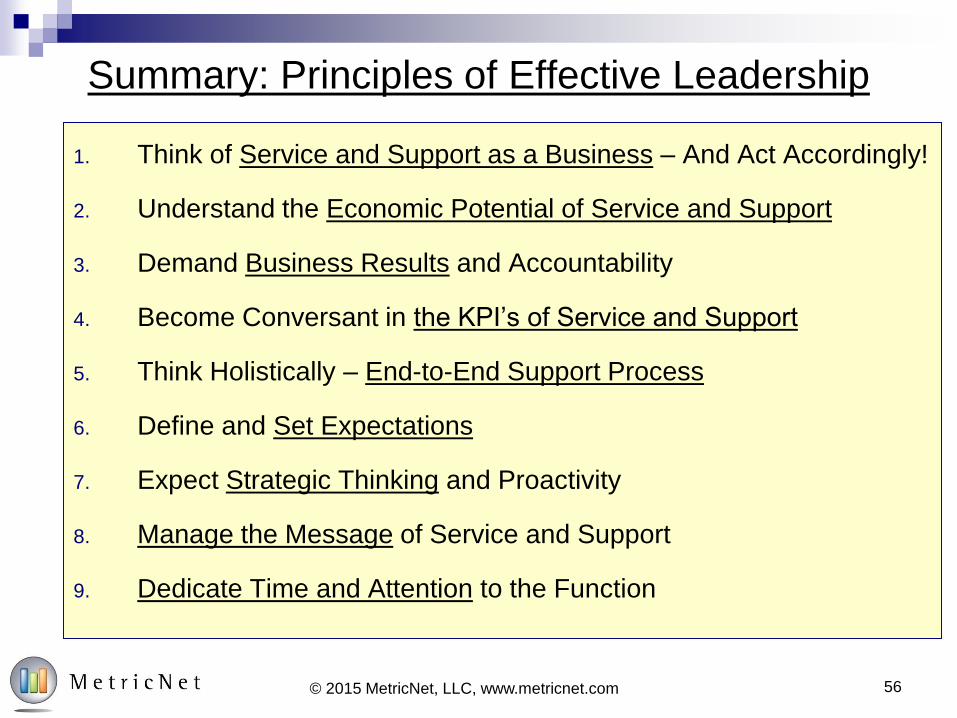
Summary: Principles of Effective Leadership
56© 2015 MetricNet, LLC, www.metricnet.com
1. Think of Service and Support as a Business – And Act Accordingly!
2. Understand the Economic Potential of Service and Support
3. Demand Business Results and Accountability
4. Become Conversant in the KPI’s of Service and Support
5. Think Holistically – End-to-End Support Process
6. Define and Set Expectations
7. Expect Strategic Thinking and Proactivity
8. Manage the Message of Service and Support
9. Dedicate Time and Attention to the Function

57© 2015 MetricNet, LLC, www.metricnet.com
Exploit Value
Metrics Focused
Proactive
Marketing
Service and Support as a Business

Questions?
Thank you for attending this session.
Don’t forget to complete an evaluation form!

6060© 2014 MetricNet, LLC, www.metricnet.com
2014 Total Traffic MOM
Bad Referral Traffic
Visit MetricNet at the Annual HDI Conference in Las Vegas!
More info at metricnet.com/hdiconf15
Session 107: Benchmark 2014: Global Results for Desktop Support
Wednesday, March 25, 2015 at 10:15am
Session 401: The Role of IT Leadership in Service and Support
Thursday, March 26, 2015 at 10:00am
Session 705: Past and Present: 25 Years of Service Desk KPIs
Friday, March 27, 2015 at 9:00am

Thank You!

Questions?

About MetricNet
Your Benchmarking Partner
63

Your Speaker: Jeff Rumburg
© 2015 MetricNet, LLC, www.metricnet.com
Co Founder and Managing Partner,
MetricNet, LLC
Winner of the 2014 Ron Muns
Lifetime Achievement Award
Former CEO, The Verity Group
Former Vice President, Gartner
Founder of the Service Desk
Benchmarking Consortium
Author of A Hands-On Guide to
Competitive Benchmarking
Harvard MBA, Stanford MS
64

Benchmarking is MetricNet’s Core Business
Call Centers
Telecom
Information
Technology
Satisfaction
Customer Service
Technical Support
Telemarketing/Telesales
Collections
Service Desk
Desktop Support
Field Support
Price Benchmarking
Customer Satisfaction
Employee Satisfaction
65© 2015 MetricNet, LLC, www.metricnet.com
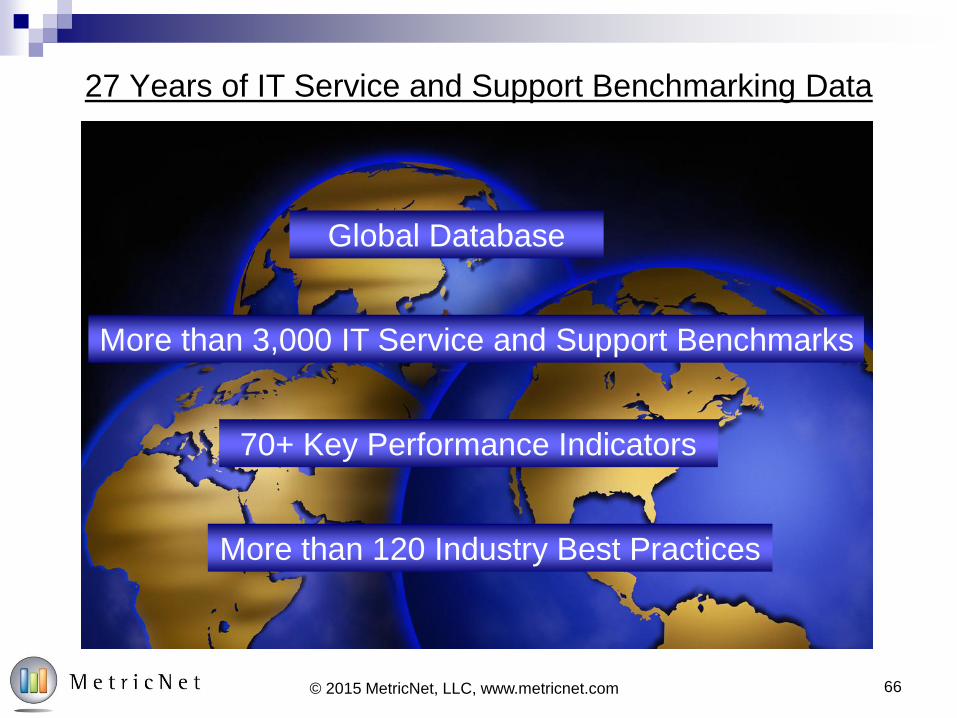
27 Years of IT Service and Support Benchmarking Data
More than 3,000 IT Service and Support Benchmarks
Global Database
70+ Key Performance Indicators
More than 120 Industry Best Practices
66© 2015 MetricNet, LLC, www.metricnet.com
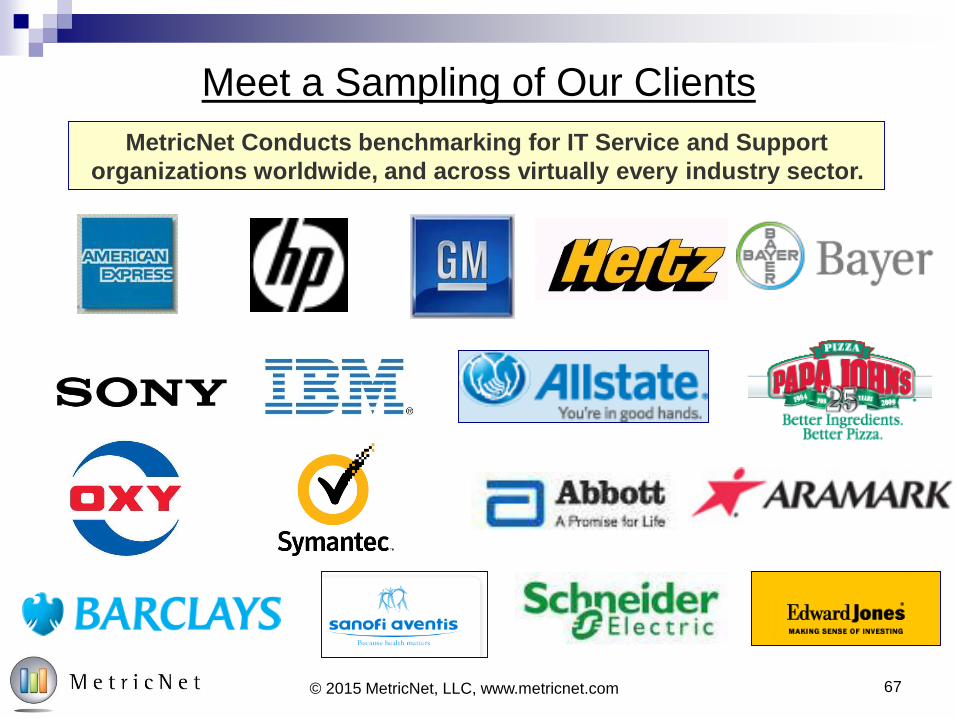
Meet a Sampling of Our Clients
MetricNet Conducts benchmarking for IT Service and Support
organizations worldwide, and across virtually every industry sector.
67© 2015 MetricNet, LLC, www.metricnet.com

You Can Reach MetricNet…
By Phone…
703-992-7559
On Our Website…
www.metricnet.com
Or E-mail us…
68© 2015 MetricNet, LLC, www.metricnet.com

Thank You!