Embed Size (px)
Citation preview

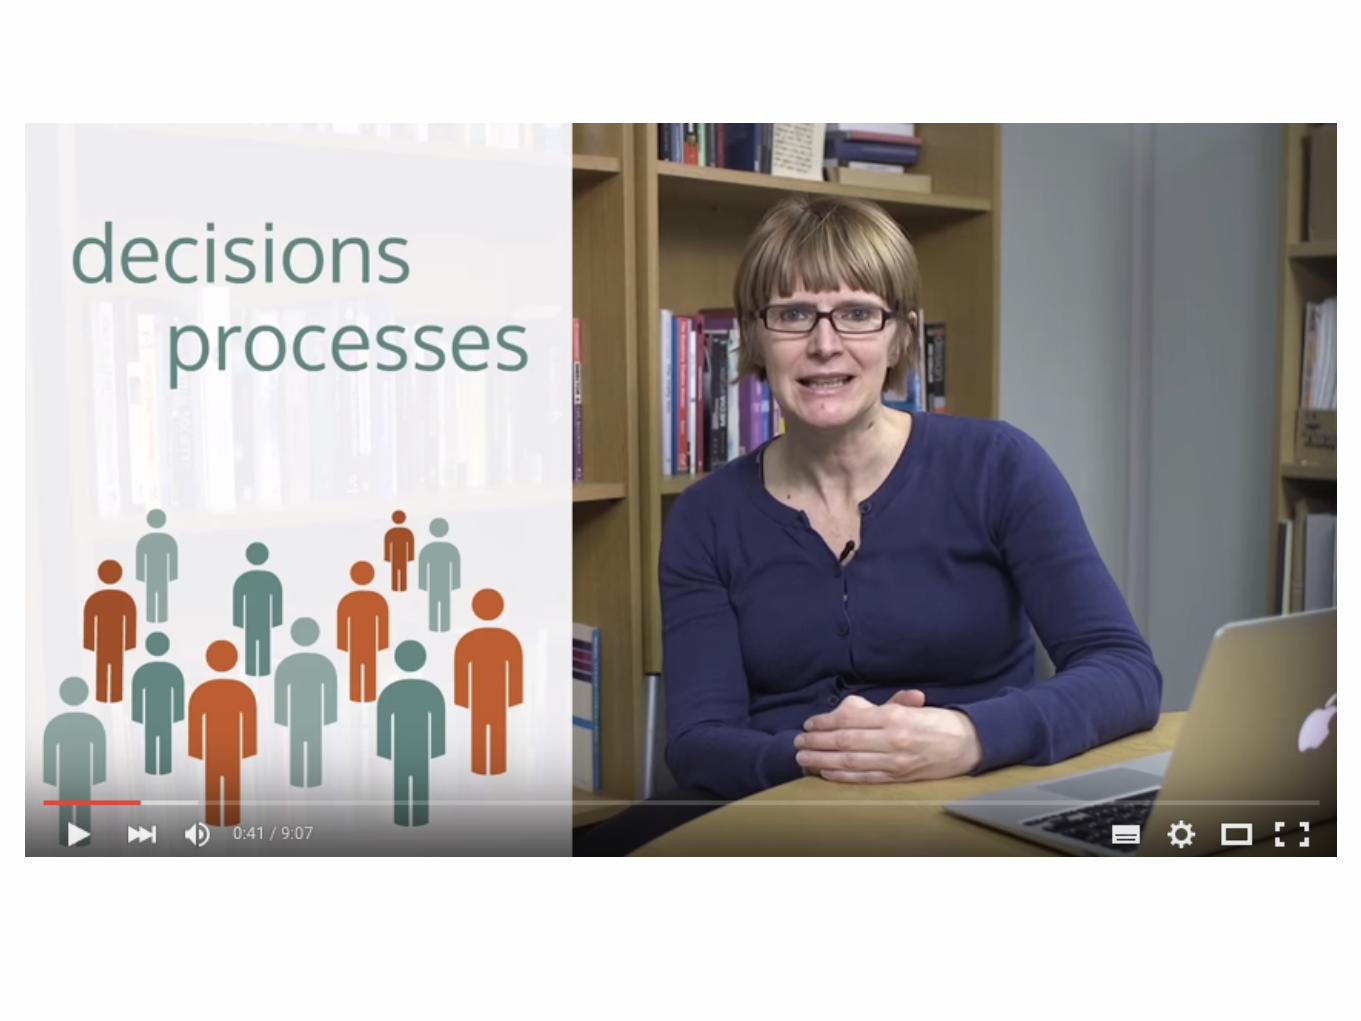
데이터 읽어주는 남자
4번째 순서

김영웅
꿈꾸는 데이터 디자이너 매니저
경영정보시스템 전공 박사과정
경영전문대학원 MBA
컴퓨터공학 전공
Ryan Kim | Convergence Business Designer Facebook. https://www.facebook.com/keyassist E-mail. [email protected] Web. http://keyassist.tistory.com
데이터.읽어주는남자

Sabermetrics

Sabermetrics
여러가지 수리적 방법론을 동원해 야구라는 스포츠를 쪼개 분해하는 행위

<source=http://georgetownsportsanalysis.wordpress.com>

<source=http://knowmore.washingtonpost.com/2014/02/10/the-data-driven-nba-offense/>

Money ball by Aron Sorkin

01 오클랜드는 1년 반짝 팀?
02 빌리빈 팀만의 단독성과?
03 폴 디포데스타 @LA 다저스
04 위대한 혁명적 순간은 없다
05 모든 개혁은 과정이다<source= http://ppss.kr/archives/5593 재구성>
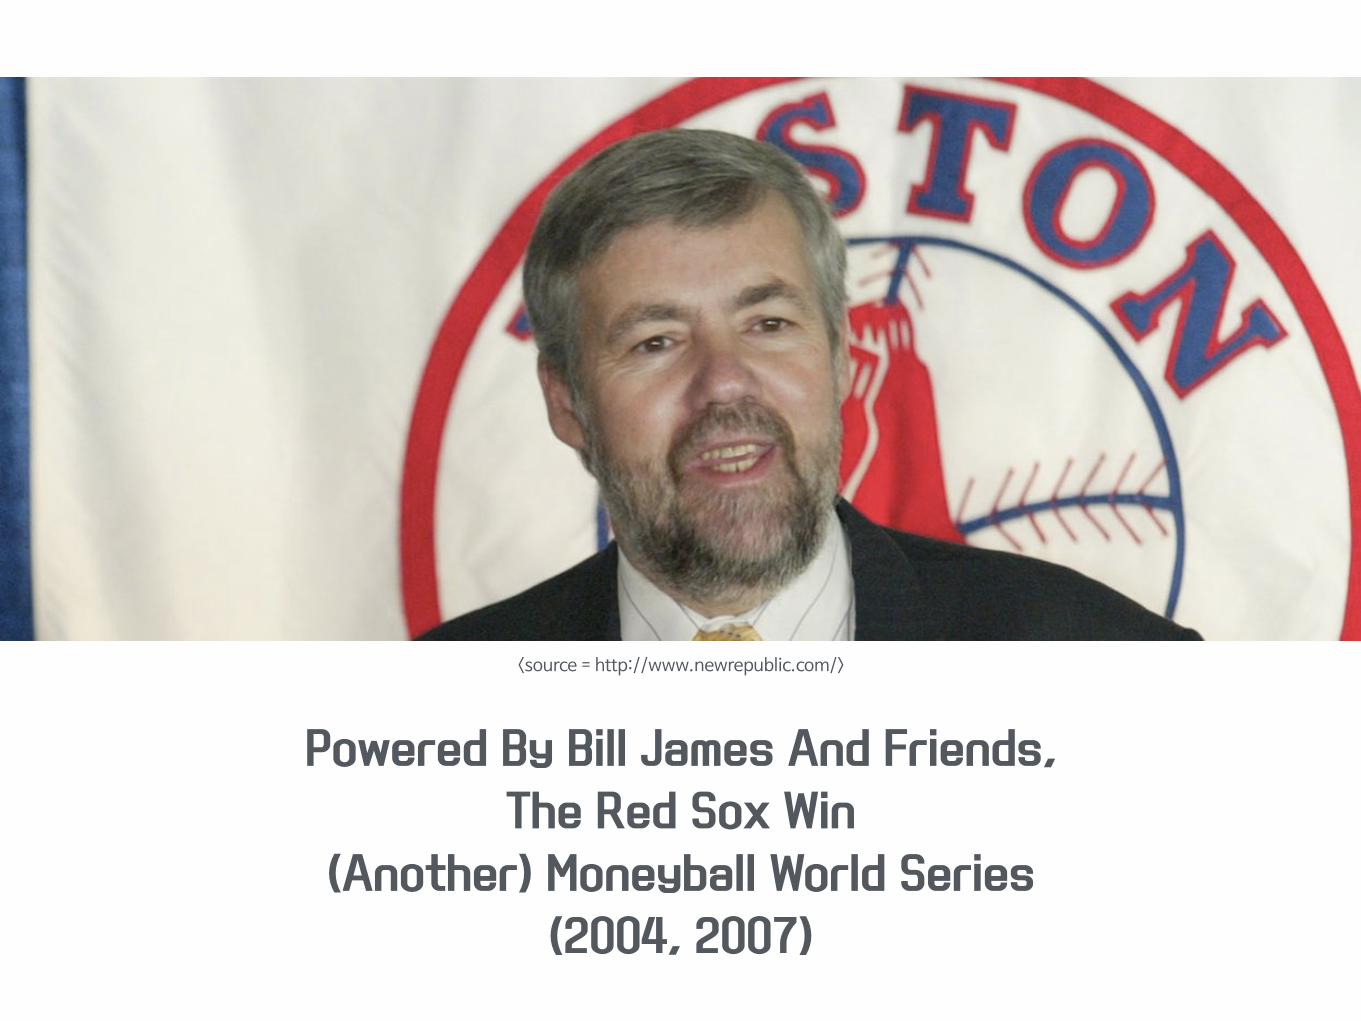
<source = http://www.newrepublic.com/>
Powered By Bill James And Friends,
The Red Sox Win
(Another) Moneyball World Series
(2004, 2007)

<source=http://knology.net/~johnfjarvis/runs_survey.html >

01 세이버 메트릭스가 비판받는 이유
02 지나치게 통계와 숫자에 집착한다
03 축구에서 점유율과 승리의 관계
04 단순한 상관관계인지 의미인지
05 승리로 이어지는 요소에 집중
06 분석행위 & 린스타트업
<source=http://keyassist.tistory.com/209 재구성>

01 세이버 메트릭스
02 통계학 < 데이터과학
03 데이터에 큰 비중, 광범위한 전문지식
04 분석기술 + 야구지식 → 문제해결
05 MBA, 통계학, 컴퓨터공학
<source=http://keyassist.tistory.com/209 재구성>

숫자를 활용해 야구를
객관적이고 합리적으로 보기 위한 행동

플레이 자체를 통해 요소요소를 정확히 평가하는 경지는
매우 어렵다

논리적이고
합리적인
데이터 분석은판단의 효율성을 돕고
그러해야 한다


컨텐츠의 생명력

data visualization
about customer behaviors
vs
using data to enhance customer experience

#1 Data Visualization

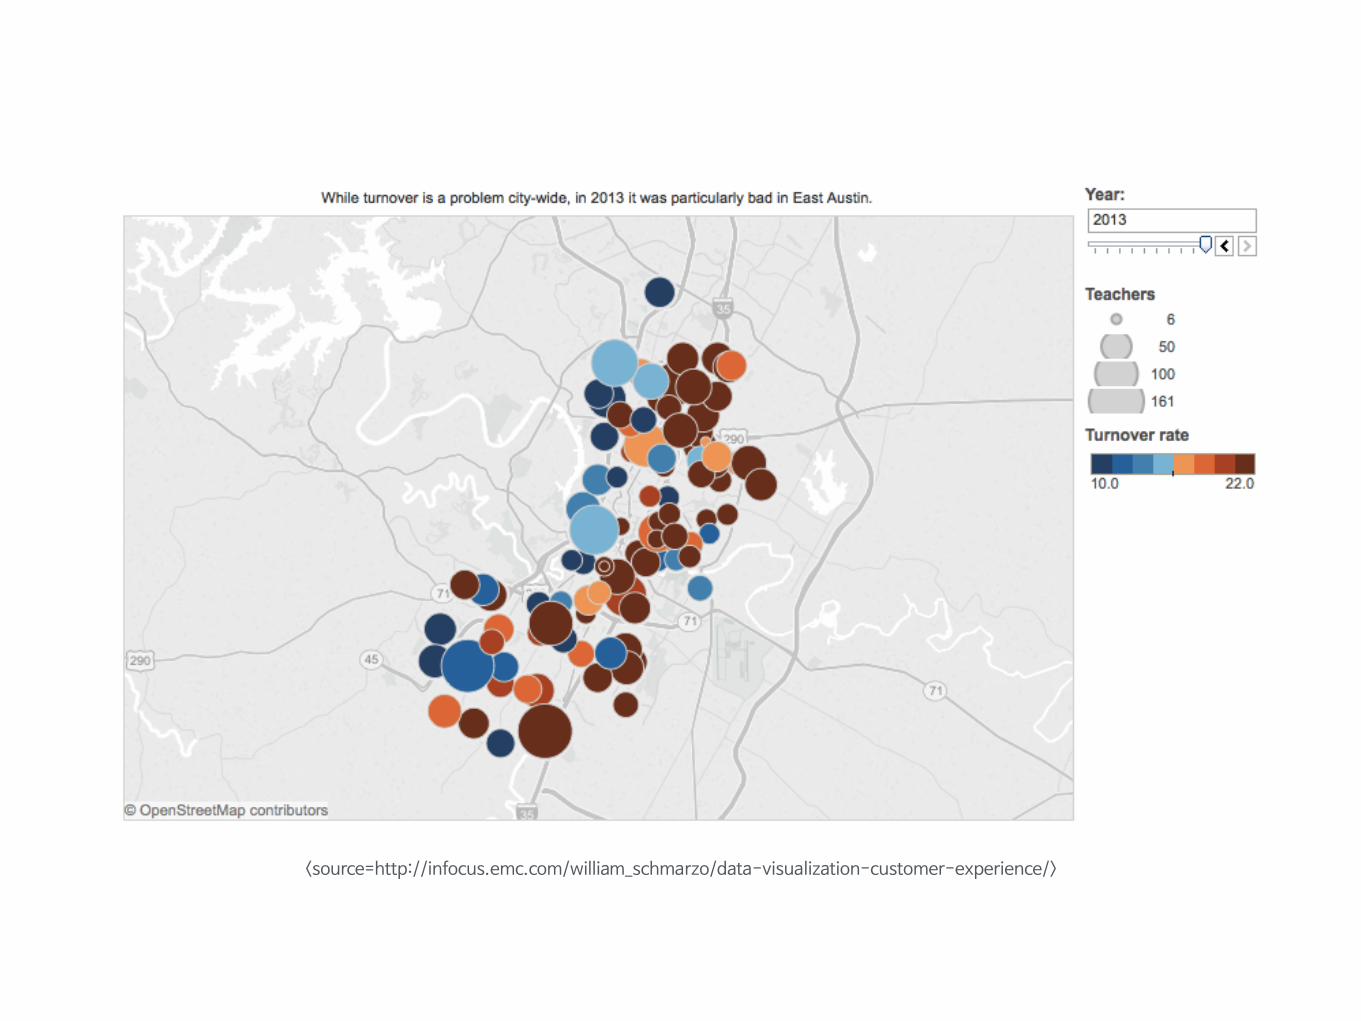
Data Visualization: 데이터를 활용하는 실무자들이
인사이트와 트렌드를 도출하고
데이터에 숨겨진 상관관계를 도출하기 위해
시각화를 활용하는 것을 의미

<source=http://infocus.emc.com/william_schmarzo/data-visualization-customer-experience/>
<source=http://infocus.emc.com/william_schmarzo/data-visualization-customer-experience/>

The key goal of
data visualization: 데이터 실무자들이 데이터 시각화 툴을 활용하여
데이터 안의 반복적인 경향을 찾아내거나
그래픽을 통해 데이터 안의 상관관계를 도출하는 것

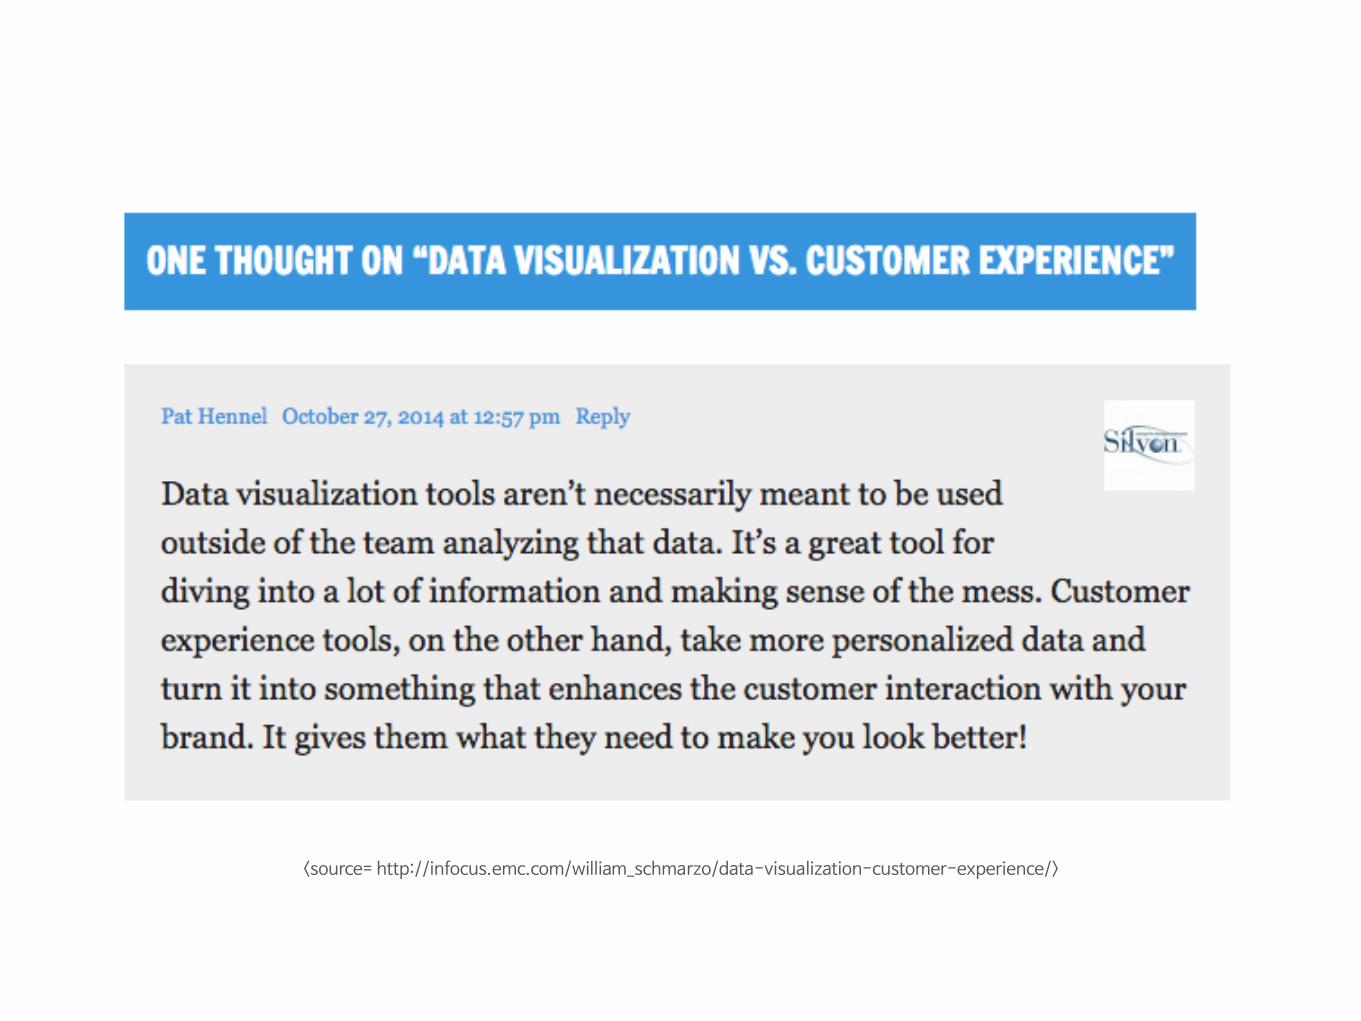
#2 Customer Experience Design

Customer Experience
(or customer experience design):
웹페이지, 모바일 앱, 이메일, 판매시기 등에
고객 참여관점에서 더 끌리고 차별화된
인터랙션을 제공하기 위해
분석의 통찰력을 활용하는 것

고객 경험 디자인은
고객이 하려고 목적을 두는 것에 상관없이
직관적이고 실용적인 방법으로
분석결과를 전달하는 데 중점을 둔다.

<source=http://infocus.emc.com/william_schmarzo/data-visualization-customer-experience/>

Data visualization and
customer experience design
are two very different
but very critical big data capabilities.

Data Visualization seeks to use data visualization techniques
to help data practitioners
to tease patterns, trends
and relationships
buried in the data.

Customer Experience Design
uses analytic insights to create a more
targeted and compelling
customer engagement.
<source= http://infocus.emc.com/william_schmarzo/data-visualization-customer-experience/>
How a visualisation is made


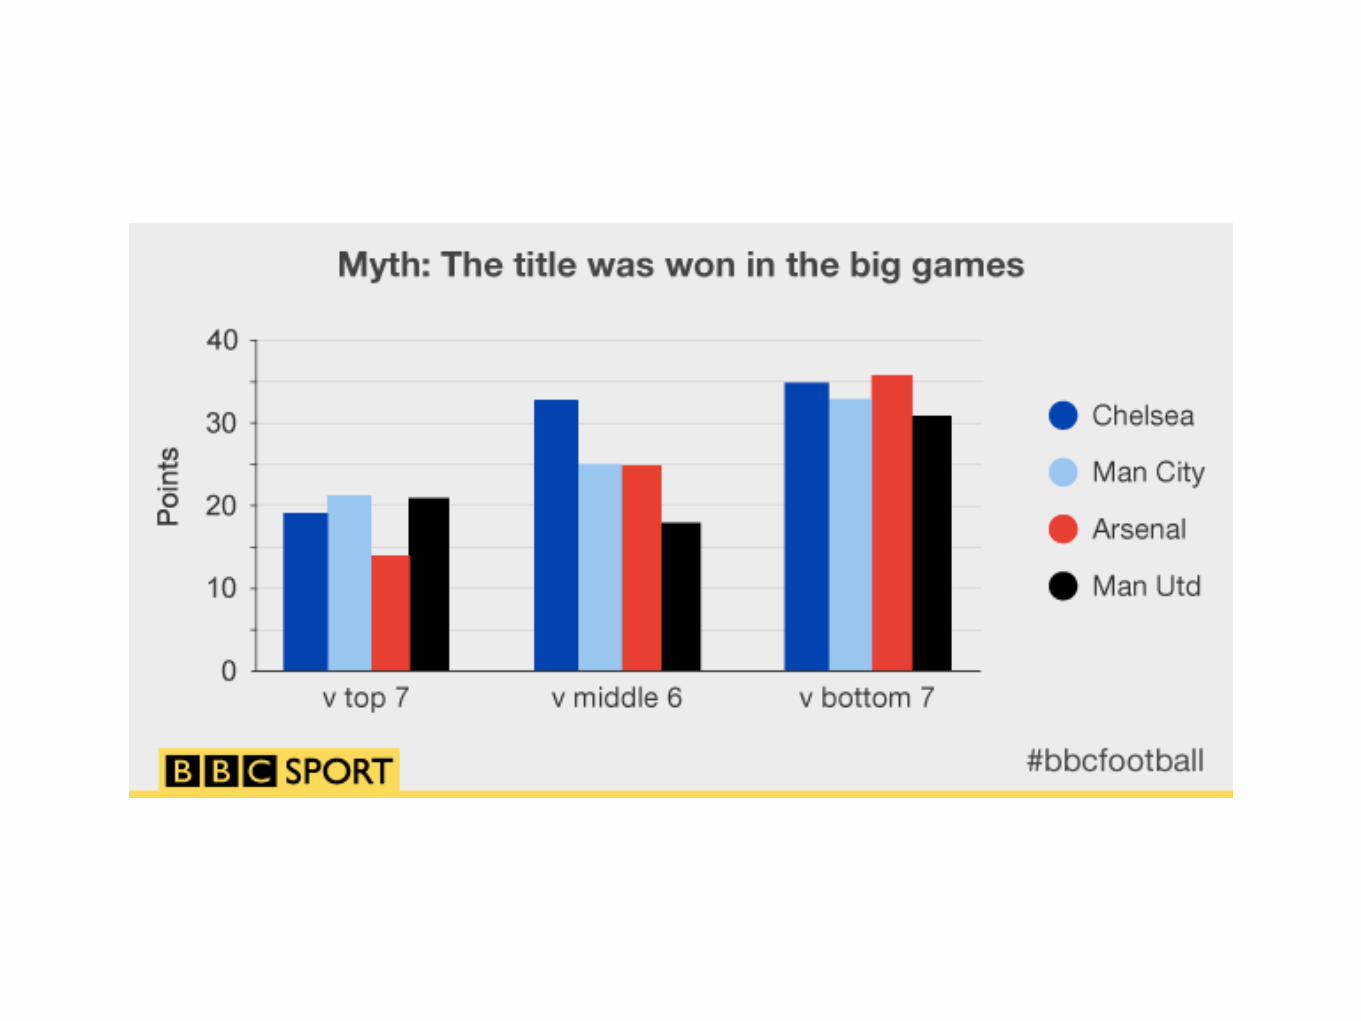
Data Visualization
for defeat Myth<source=http://www.bbc.com/sport/0/football/33757354>


How to tell a story with data

Visual Literacy

Five steps of effective storytelling
Audience + Insights + Context + Storytelling Elements + Practice
<source=Accenture Report “Accelerating Understanding Through Data Visualization">

Storytelling + Data = Understanding Data visualization is the capstone of the data supply chain and especially critical in this era of big data
<source=Accenture Report “Accelerating Understanding Through Data Visualization">

01 Define audience
02 Frame insights
03 Consider context
04 Select storytelling elements
05 Organize and practice<source=Accenture Report “Accelerating Understanding Through Data Visualization">

Next Agenda

Data-driven Innovation
Big Data-Driven Innovation:
Disruption vs. Optimization
Computational thinking
& Data action

주간 데이터.읽어주는남자
Referencehttp://sabr.org/
http://visualoop.com/
http://flowingdata.com/
http://www.forbes.com/
http://keyassist.tistory.com/
http://networkofcenters.net/
http://ppss.kr/archives/5593/
http://knology.net/~johnfjarvis/
https://en.wikipedia.org/wiki/Sabermetrics/
http://fivethirtyeight.com/features/billion-dollar-billy-beane/
http://mssportslaw.olemiss.edu/files/2014/06/MSLR-3.2-Manning.pdf
http://knowmore.washingtonpost.com/2014/02/10/the-data-driven-nba-offense/
http://www.forbes.com/sites/allenstjohn/2013/10/31/powered-by-bill-james-and-friends-the-red-sox-win-another-moneyball-world-series/

김영웅
꿈꾸는 데이터 디자이너 매니저
경영정보시스템 전공 박사과정
경영전문대학원 MBA
컴퓨터공학 전공
Ryan Kim | Convergence Business Designer Facebook. https://www.facebook.com/keyassist E-mail. [email protected] Web. http://keyassist.tistory.com
데이터.읽어주는남자


![[4회 인터넷리더십] 모바일의 미래상_김지현](https://img.pdfslide.tips/doc/110x75/557208cb497959fc0b8bd6f3/4-557208cb497959fc0b8bd6f3.jpg)


![[4회 인터넷리더십] 인터넷이 일으키는 의사소통의 변화와 트랜드_박남호](https://img.pdfslide.tips/doc/110x75/557208cb497959fc0b8bd6f4/4-557208cb497959fc0b8bd6f4.jpg)
![[최종] 201402 한글소리영어](https://img.pdfslide.tips/doc/110x75/55bade68bb61eb84608b45b6/-201402--55bd23188f96a.jpg)
![[최종] 201404 한글소리영어](https://img.pdfslide.tips/doc/110x75/55bade64bb61eb84608b45b4/-201404-.jpg)


![[4회 인터넷리더십] 새로운 소통의 시대_방대욱](https://img.pdfslide.tips/doc/110x75/557208cb497959fc0b8bd6f6/4-557208cb497959fc0b8bd6f6.jpg)
