Embed Size (px)
Citation preview

A 2016 Election Post-Mortem:
The ABC News/Washington Post
Tracking Poll
Presented at the annual meeting
of the American Association for Public Opinion Research
New Orleans, LA
May 14, 2016
Gregory Holyk, Gary Langer - Langer Research Associates
Scott Clement - The Washington Post

Credibil ity of the polling industry has been questioned
following Trump’s surprise victory.
We performed our own post-mortem of the ABC
News/Washington Post tracking poll.
Abt Associates
Dual-overlapping RDD, English/Spanish, 65% cell
18 daily waves, Oct. 22-Nov.6
Daily n=440, increased to 800 for the last 4 days
Each estimate (except the first release) based on ~1,100 -
1,200 likely voters, increasing the last 4 days to peak at
2,200 for the final estimate
Fallout From the 2016 Election

Final popular vote estimate was 2 pts. off, exactly the mean
error in final estimate going back to 1984.
Dug around for any possible irregularities and found:
LV modeling made sense
No indications of differential non-response by groups
No improvements using different weighting procedures
No evidence of “shy” Trump voters
No consistent interviewer effects
At the end of the day, the overall narrative based on state -
level polls and aggregator probabilit ies was off.
As the AAPOR report concluded, there was no major failure
of high-quality national polls, including the ABC/Post
tracking poll.
Key Takeaways

Vote Preference Trendline

Oct. 20-22 data showed 50-38% Clinton-Trump
At the time, this estimate seemed reasonable given:
The Access Hollywood tape had come out recently
Many Republicans publically pulled their support
He was widely seen as having lost the debates to Clinton
Enthusiasm among Trump voters was down significantly
The share of registered leaned Republicans who were certain to
vote also was down
Narrowed quickly in the next 5 days as new data was rolled
into the estimates (+12, +9, +6, +4, +2, +1)
Shifts l ike this occurred in 1996 and 1992 as well .
Variation in Tracking

ABC/Post
final est.
Actual
vote
Major party
margin error
Major party
total error
2016 47-43% 48-46% 2 pts. 4 pts.
2012 50-47 51-47 1 1
2008 53-44 53-46 2 2
2004 48-49 48-51 2 2
2000 45-48 48-48 3 3
1996 51-39 49-41 4 4
1992 44-37 43-37 1 1
1988 44-52 46-53 1 3
1984 40-55 41-59 3 5
Average 2 3
ABC/Post Past Performance
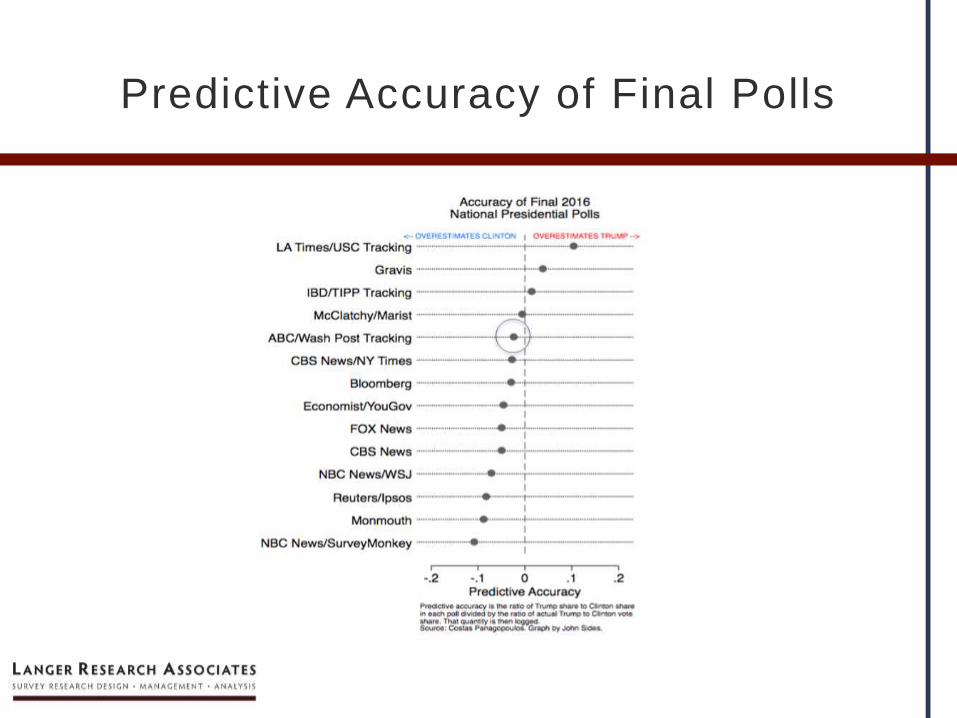
Predictive Accuracy of Final Polls

Evaluating the Tracking Poll

Constructed more than 30 cut-off LV models
Estimated turnout:
ABC/Post LV model 61%
Actual turnout, VEP (highest office) 59%
Actual turnout, VAP (highest office) 55%
Nearly all of the models showed a +3-5-point Clinton lead.
Evaluated a regression-based probabilistic LV model (only
possible in mid-tracking) and it moved estimates 2 pts. on
the margin toward Trump.
Will explore this approach in the future.
Advantage: Uses all respondents in the vote estimate, weighted to
their likelihood of voting.
Likely Voter Modeling

Unlike many state-level polls, we properly weighted for
education, as we always do, so that wasn’t a problem.
Did the weight need to be adjusted for population density?
We calculated a new weight that took into account
population density.
This had no notable effect.
Is there evidence of shy Trump voters among those who
participated in the survey? No, those who refused or DK’d
the vote question didn’t look disproportionately like Trump
voters.
Weighting

Perhaps support for Trump was underestimated because the l ikely voter models generally excluded those who were not certain to vote?
No. In waves where we asked vote preference among probable, there was no shift towards Trump.
The sample of likely voters looked very similar in both cases.
Did those who refused to answer the vote question end up supporting Trump?
It’s not clear this would have helped Trump.
Refusers were more apt to be women and minorities, but also less likely to have a college degree and to be younger. (Those who DK’d also were less apt to have a college degree.)
Among refusers, leaned Democrats outnumbered leaned Republicans.
“Shy” Trump Voters

Pre-election polls often overestimate vote for third party
candidates
This election had two major third party candidates in
Johnson and Stein
Our final estimate didn’t miss the third party candidates by
much:
4 percent for Johnson in ABC/Post, vs. 3 percent actual vote
1 percent for Stein in ABC/Post, vs. 1 percent actual vote
Johnson voters in our poll looked a lot closer in
demographic characteristics to Trump voters than Clinton
voters, but we were only over by 1 pt.
Third-Party Misestimation?

How Did Tracking Compare to
Other Indicators?

No clear benchmark for turnout and vote preferences among
groups.
Exit polls have problems:
They’re weighted to actual vote, but cannot be adjusted for size of
group since that’s unknown.
Research suggests exit polls underestimate less-educated,
younger and nonwhite voters.
Best comparison for the tracking poll is to multi level
regression with poststratification (MRP) estimates.
Comparing Tracking, MRP and Exit Poll

Tracking and MRP Turnout and Vote
Final tracking Final MRP
Size Cl-Tr Diff. Size Cl-Tr Diff.
All 100% 47-43 +4 100% 47-44 +3
Whites 72 37-53 -16 73 38-54 -16
No degree 59 42-49 -7 63 42-49 -7
Degree 41 54-35 +19 37 54-36 +18
Among whites:
Men, no deg. 18 29-60 -31 21 25-65 -40
Women, no deg. 23 29-64 -35 24 35-58 -23
Men, degree 15 43-42 +1 14 43-46 -3
Women, degree 15 51-39 +12 14 55-37 +18

MRP Turnout Predictions

MRP Margin Prediction Errors

MRP in the Swing States
HuffPost Pollster MRP Estimates
State Actual Average Error Predicted Error State N
Georgia -5.2 -2.4 2.8 -5.6 -0.4 332
Wisconsin -0.8 6.1 6.9 -0.2 0.6 169
Florida -1.2 1.8 3.0 -0.5 0.7 658
Michigan -0.2 6.0 6.2 0.5 0.7 291
Pennsylvania -0.7 4.1 4.8 -2.7 -2.0 375
Colorado 4.9 4.9 0.0 7.0 2.1 139
Minnesota 1.5 6.9 5.4 3.7 2.2 163
Arizona -3.5 -1.6 1.9 -5.8 -2.2 214
Virginia 5.3 5.3 0.0 2.9 -2.4 277
North Carolina -3.7 1.6 5.3 -6.1 -2.5 323
New Hampshire 0.4 3.3 2.9 3.2 2.8 38
Ohio -8.1 -1.0 7.1 -5.2 2.9 367
Iowa -9.4 -3.0 6.4 -5.0 4.4 99
Nevada 2.4 2.1 -0.3 7.0 4.6 81

Our MRP 538 HuffPo DKos
YouGov
MRP
Clinton % 46.8% 48.5% 45.7% NA 47.9%
Trump % 44.3% 44.9% 40.8% NA 44.1%
Margin 2.5 pts. 3.6 pts. 4.9 pts. NA 3.8 pts.
Correct predictions 50 46 46 46 43
RMSE margin all 5.8% 7.1% 7.1% 7.0% 7.6%
RMSE margin no AK, HI, DC 4.5% 6.7% 7.2% 7.0% 7.6%
RMSE margin battlegrounds 2.5% 3.9% 4.5% 4.7% 5.5%
RMSE 2 party margin (no AK, HI, DC) 4.6% 7.1% 7.1% 6.9% 8.0%
RMSE Clinton % (no AK, HI, DC) 2.3% 3.1% 3.6% 2.7% 3.3%
RMSE Trump % (no AK, HI, DC) 3.5% 4.0% 6.9% 6.6% 4.7%
Our MRP Estimates/RMSEs vs. Others

MRP Estimates NEP Exit Poll Estimates
Subgroup TurnoutTurnout
share Clinton Trump MarginTurnout
share Clinton Trump Margin
18-29 31% 11% 49% 34% 15 pts. 19% 55% 36% 19 pts.
65+ 78 25 44 51 -7 16 45 52 -7
No degree 54 63 42 49 -7 50 44 51 -7
Degree 79 37 54 36 18 50 52 42 10
Whites 69 73 38 54 -16 71 37 57 -20
Among whites:
Men no deg. 60 21 25 66 -41 16 23 71 -48
Women no deg. 65 24 35 58 -23 17 34 61 -27
Men deg. 83 14 43 46 -3 17 39 53 -14
Women deg. 83 14 55 37 18 20 51 44 7
Comparing MRP to Exit Poll

National polls were generally correct and accurate by
historical standards.
State-level polls showed a competitive, uncertain contest.
BUT state-level polls clearly underestimated Trump in the
Midwest.
Reasons for underestimating Trump in state polls:
Real change in vote preference in the final week
Over-representation of college-educated whites
Some “shy” Trump voters in state-level polls in the Midwest, but it
was not the main contributing factor. (Note, we found little evidence
of shy Trump voters in our national sample.)
AAPOR Report on 2016 Polling

Predictions by Polling Aggregators
85%
71%
98%
89%
99%
92%
Predicted probability of a
Clinton Electoral College
win

Post-2016 election, for national-level polling, we’re dealing
with a perception problem more than a real problem. (There
were persistent problems with state-level polls and the
estimates based on them.)
Our final pre-election estimate of the national popular vote
was highly accurate, as were most others’.
The final estimate of +4 pts for Clinton was 2 points off the
actual margin, average for ABC/Post polls back to ’84.
To the decimal point, our final estimate was 1.6 pts. off and
the MRP estimate was .4 pts. off.
These differences are too small to identify any “cause” of
their inaccuracy. As estimates, they weren’t all that
inaccurate.
Conclusions

Much of the problem is the popular vote didn’t match the
Electoral College vote.
Our results showed no clear leader, but other results
predicted a Clinton victory, including:
Early exit poll results, weighted to pre-election state polls,
suggested a Clinton win.
Aggregators’ probabilistic models
ABC News’ Presidential State Ratings (274-188 Clinton-Trump,
with 76 tossups)
Our own MRP model based on the tracking poll predicted a
293-245 electoral vote victory for Trump.
Conclusions cont’d
A 2016 Election Post-Mortem:
The ABC News/Washington Post
Tracking Poll
Thank you!


![MANUAL_05 - Post Mortem[1]](https://img.pdfslide.tips/doc/110x75/577daafc1a28ab223f8bbd1b/manual05-post-mortem1.jpg)