Embed Size (px)
Citation preview

Applying data science to sales pipelines – for fun and profit!
!Andy Twigg!
CTO!

Data!science!
Domain!expertise!
Machine!learning! Data! • 62B sales pipeline records!
• Structured, unstructured!• 3rd party public data!• Fine-grained temporal data!
Deep expertise:!• sales!• forecasting!• revenue models!
• Automated ML infrastructure!• ML models tuned for specific
problems!

CUSTOMERS!

DATA SCIENCE @ C9!
• Opportunity Scoring!• What is Pr(win) for this deal?!• What is Pr(win in quarter) for this deal?!• How does this compare to sales team commits?!• Which deals can we influence most?!
• Forecasting!• How much will we close this quarter?!

SALES PIPELINES & OPPORTUNITIES!
• Opportunities are temporal creatures; while ‘open’ they proceed through a number of observations and terminate in one of a discrete set of ‘closed’ states – typically won or lost!
• Usually they proceed through ‘stages’, except:!• An opportunity can be entered into the CRM system as closed (no open observations)!• Stages are only a partial order - can skip / revisit stages!• Can be re-opened after closed!
• As the opportunity evolves, we get more and more data about the opportunity!• A pipeline is a set of open opportunities!
Lead created!
Stage: Qualifying!
Email sent!
Email sent: response!
Amount= $1000! Call!
Stage: demo!
Meeting! Demo!
Push close date!
Stage: negotiation!
Closed/won!
ReopenedAmount=
$2000!
Closed/won!

ANATOMY OF AN OPPTY!

ANATOMY OF AN OPPTY!
Pushed out Pulled back
in
Final outcome: won
Committed here (by the sales rep)

ANATOMY OF AN OPPTY!
Pushed out Pulled back
in
Final outcome: won
Committed here (by the sales rep)
Predicted won from the start
Predicted won in the correct
quarter

PREDICTIVE ENGINE!
Build a fine-grained history of closed
opportunities
• Cleaning!• Preprocessing!• Featurizing!• ~10 GB/customer!• ~ 1M training rows!!
1,000s of raw signals per opportunity
• Structured (CRM, ERP)!• Unstructured (NLP)!• Firmographic!• Gov sources!• SEC filings!• Crunchbase!• …!!
Identify historic deals with similar behavior
Continuously re-score opportunities as they
evolve
Update model as opportunities close
• Fully-automated model rebuilding and scoring platform!• Model input features:!
• Historic observations of opportunity!• Sales-specific features e.g. momentum!• Temporal features e.g. std(amount over last 30 days)!• Industry-wide features e.g. avg_sales_cycle(target)!
• Continuously cross-validated model tuning!• Extensible, scalable platform using Hadoop (HDFS), Python!
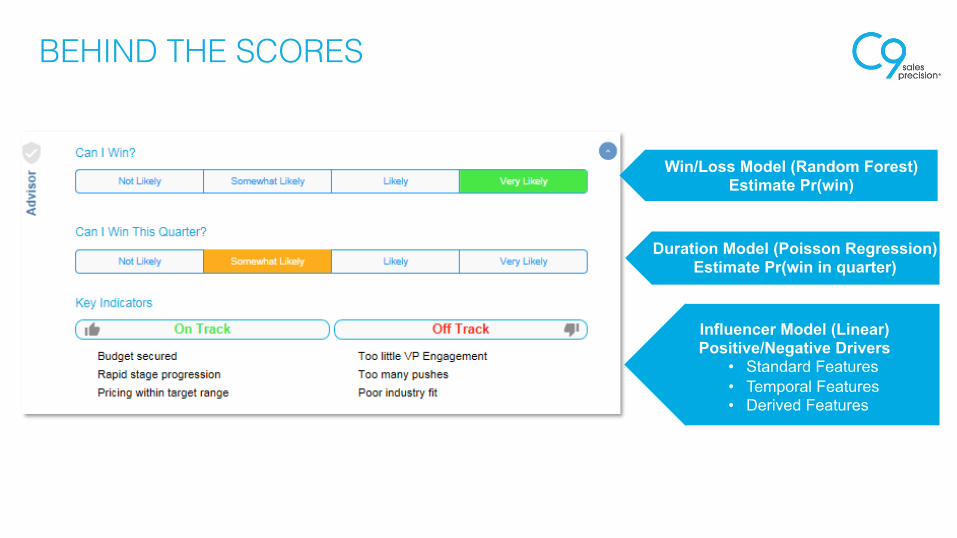
Win/Loss Model (Random Forest) Estimate Pr(win)
Duration Model (Poisson Regression) Estimate Pr(win in quarter)
Influencer Model (Linear) Positive/Negative Drivers
• Standard Features • Temporal Features • Derived Features
BEHIND THE SCORES!

©2014 All Rights Reserved

©2014 All Rights Reserved


sales team: good precision (~70-80%) but poor recall (~10-40%)!C9 won precision ~ sales team won precision!C9 won recall ~ 3 x sales team won recall!
First observation Last observation
precision recall f1 precision recall f1
C9 scoring 0.65 0.86 0.74 0.75 0.93 0.83
Commit 0.70 0.07 0.13 0.87 0.45 0.59


FORECASTING: TOP-DOWN VS BOTTOM-UP!
Top-down: Predict current quarter based on previous quarters!!
Accounts for seasonality and trending!!
Ignores state of current pipeline!
0.0e+00
2.5e+08
observed
5.0e+07
2.5e+08
trend
−5e+06
5e+06
seasonal
−1e+07
5e+06
2013.0 2013.2 2013.4 2013.6 2013.8 2014.0 2014.2 2014.4
random
Time
Decomposition of additive time series
Bottom-up: Predict current quarter based on currently open pipeline!!
Considers quality of deals in pipe!!
Ignores trends, deals not in pipe!
$265,410!
$157,000 77%
$200,000 37%
$82,000 86%
+!-!
+!-!
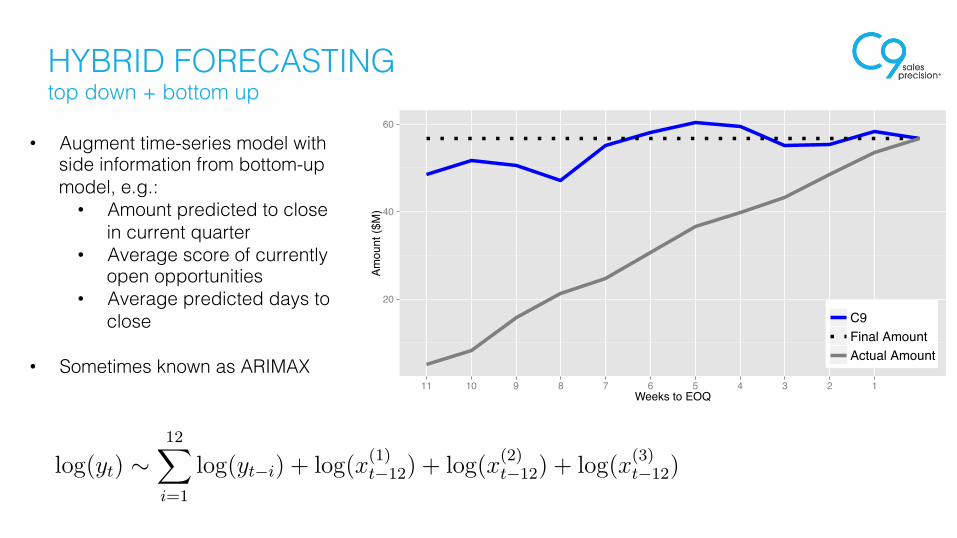
HYBRID FORECASTING!top down + bottom up!
20
40
60
11 10 9 8 7 6 5 4 3 2 1Weeks to EOQ
Amou
nt ($
M)
C9Final AmountActual Amount
Amount Forecast
• Augment time-series model with side information from bottom-up model, e.g.:!
• Amount predicted to close in current quarter!
• Average score of currently open opportunities!
• Average predicted days to close!
!• Sometimes known as ARIMAX!
log(yt) ∼12!
i=1
log(yt−i) + log(x(1)t−12) + log(x(2)
t−12) + log(x(3)t−12)