Embed Size (px)
Citation preview
Statistical Modeling in 3D:
Describing ExplainingPredicting
11th Intl Conference of the Thailand Econometric Society, 1/2018
Galit Shmueli徐茉莉
Institute of Service
Science
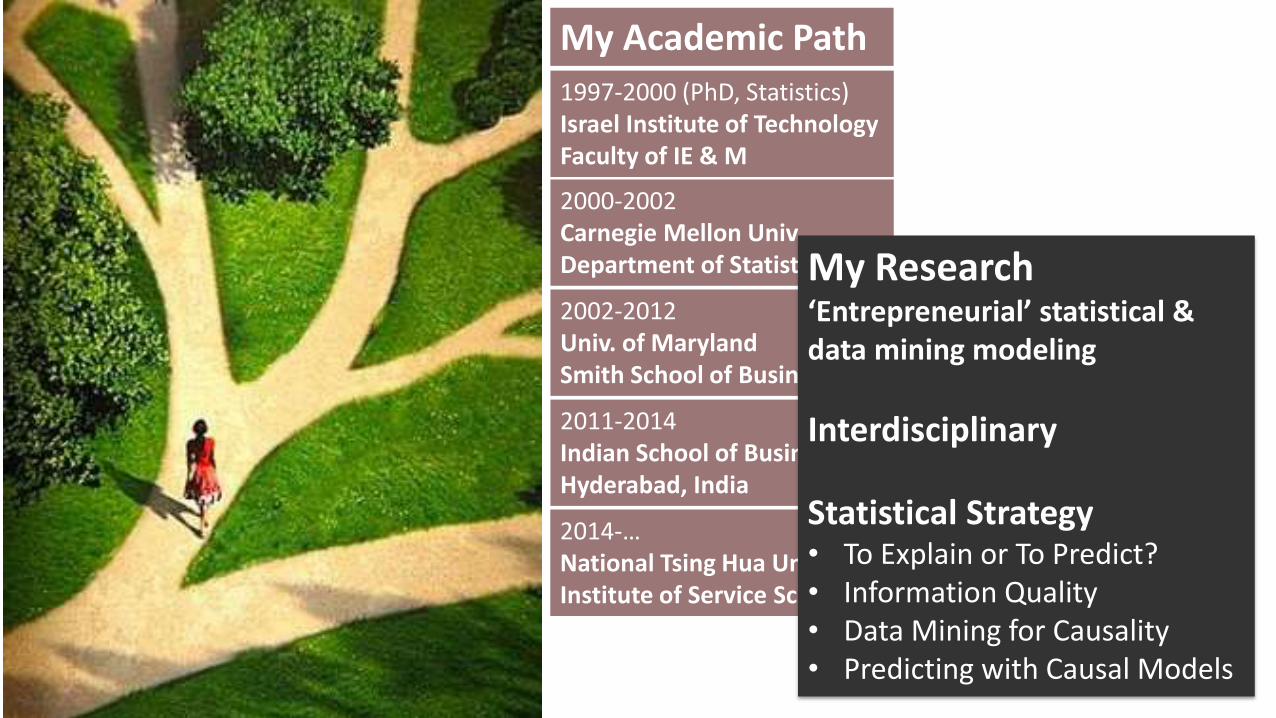
1997-2000 (PhD, Statistics)Israel Institute of TechnologyFaculty of IE & M
2000-2002 Carnegie Mellon Univ.Department of Statistics
2002-2012 Univ. of Maryland Smith School of Business
2011-2014 Indian School of Business Hyderabad, India
2014-… National Tsing Hua Univ. Institute of Service Science
My Academic Path
My Research ‘Entrepreneurial’ statistical & data mining modeling
Interdisciplinary
Statistical Strategy• To Explain or To Predict?• Information Quality• Data Mining for Causality• Predicting with Causal Models
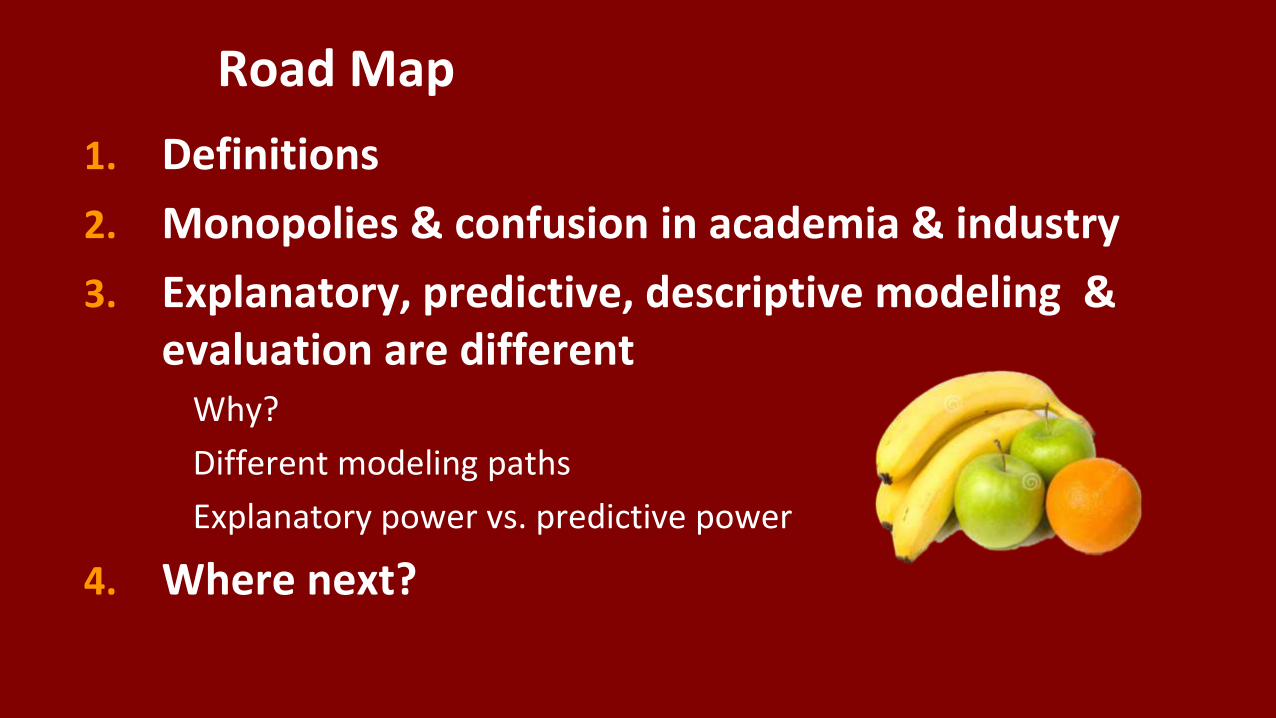
Road Map
1. Definitions
2. Monopolies & confusion in academia & industry
3. Explanatory, predictive, descriptive modeling & evaluation are different
Why?
Different modeling paths
Explanatory power vs. predictive power
4. Where next?
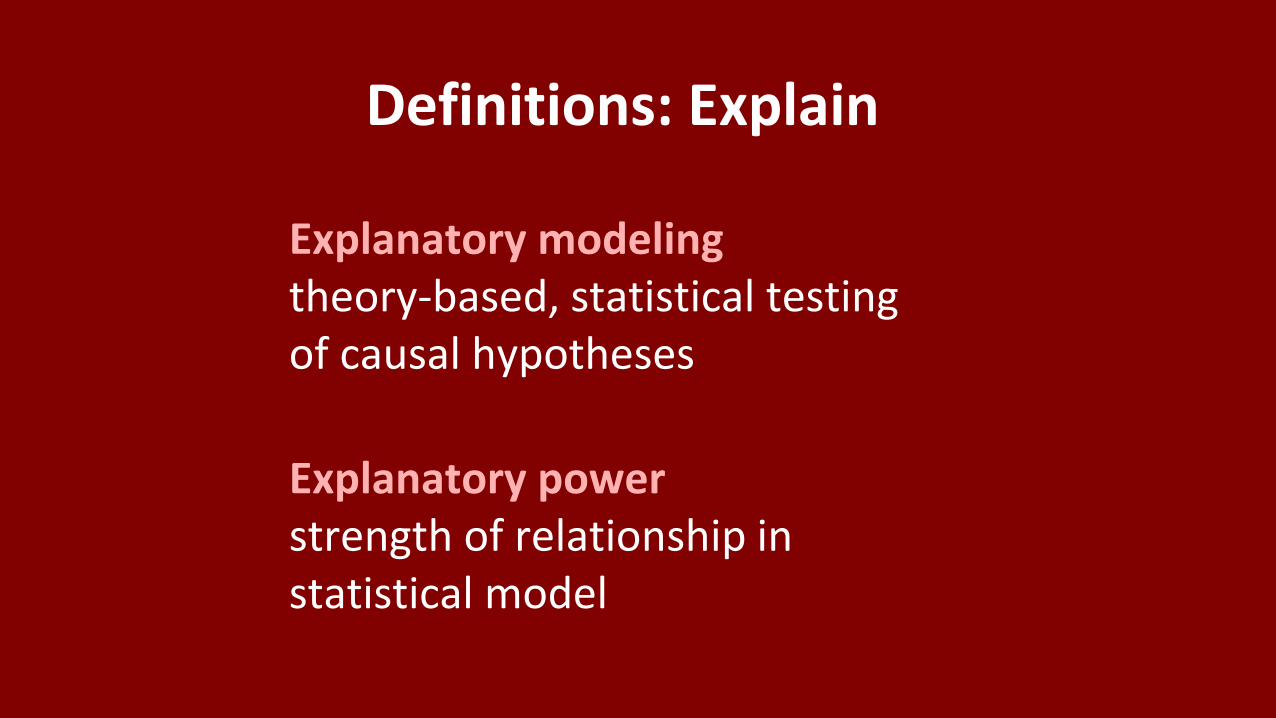
Definitions: Explain
Explanatory modelingtheory-based, statistical testing of causal hypotheses
Explanatory powerstrength of relationship in statistical model
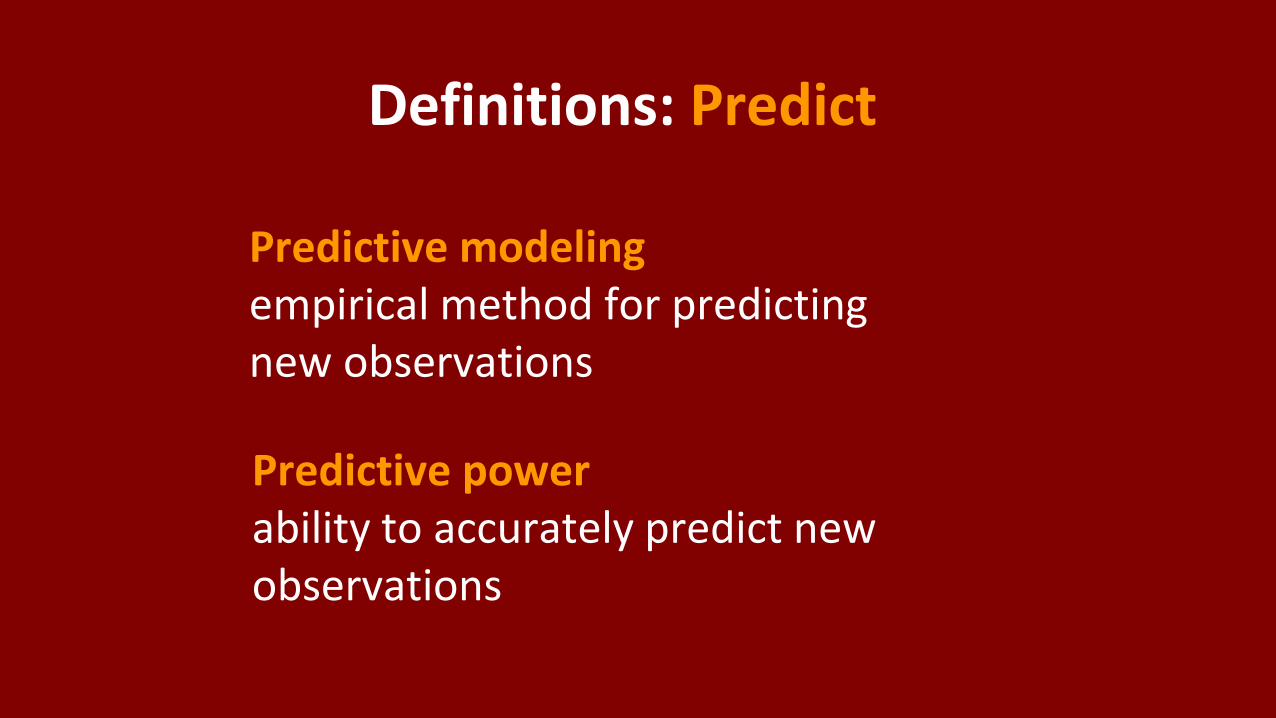
Definitions: Predict
Predictive modelingempirical method for predicting new observations
Predictive powerability to accurately predict new observations
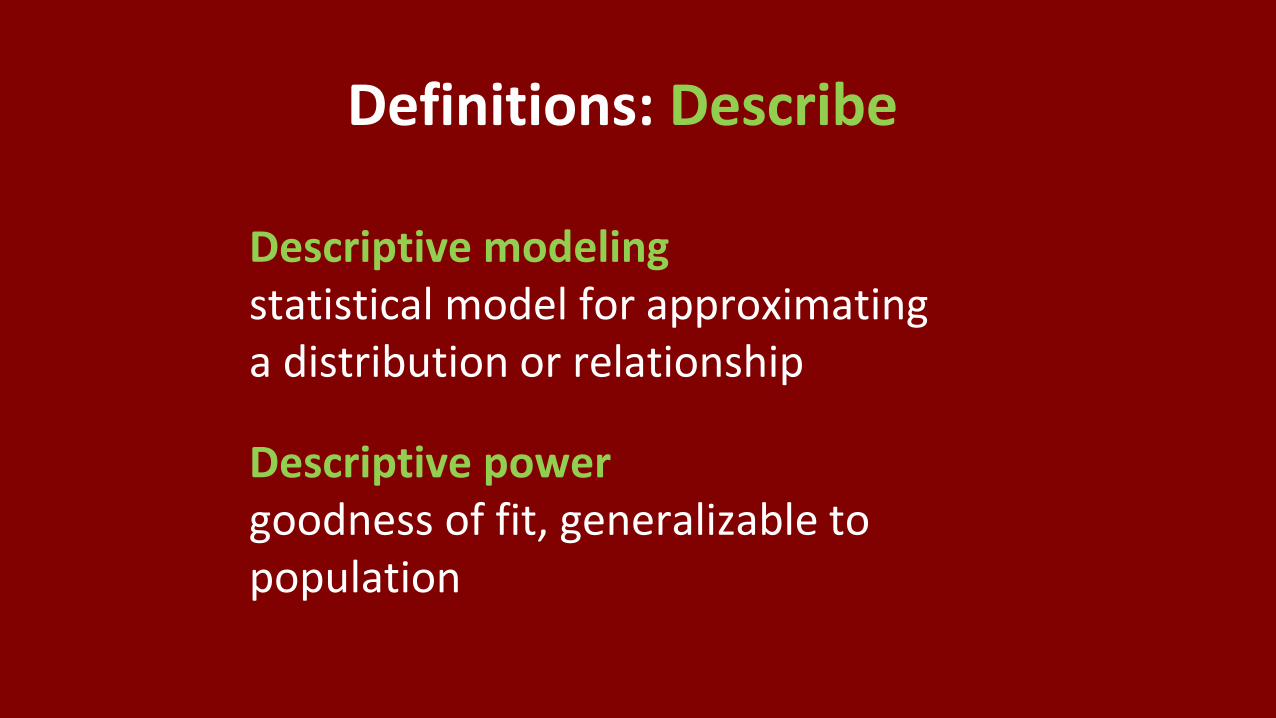
Definitions: Describe
Descriptive modelingstatistical model for approximating a distribution or relationship
Descriptive powergoodness of fit, generalizable to population
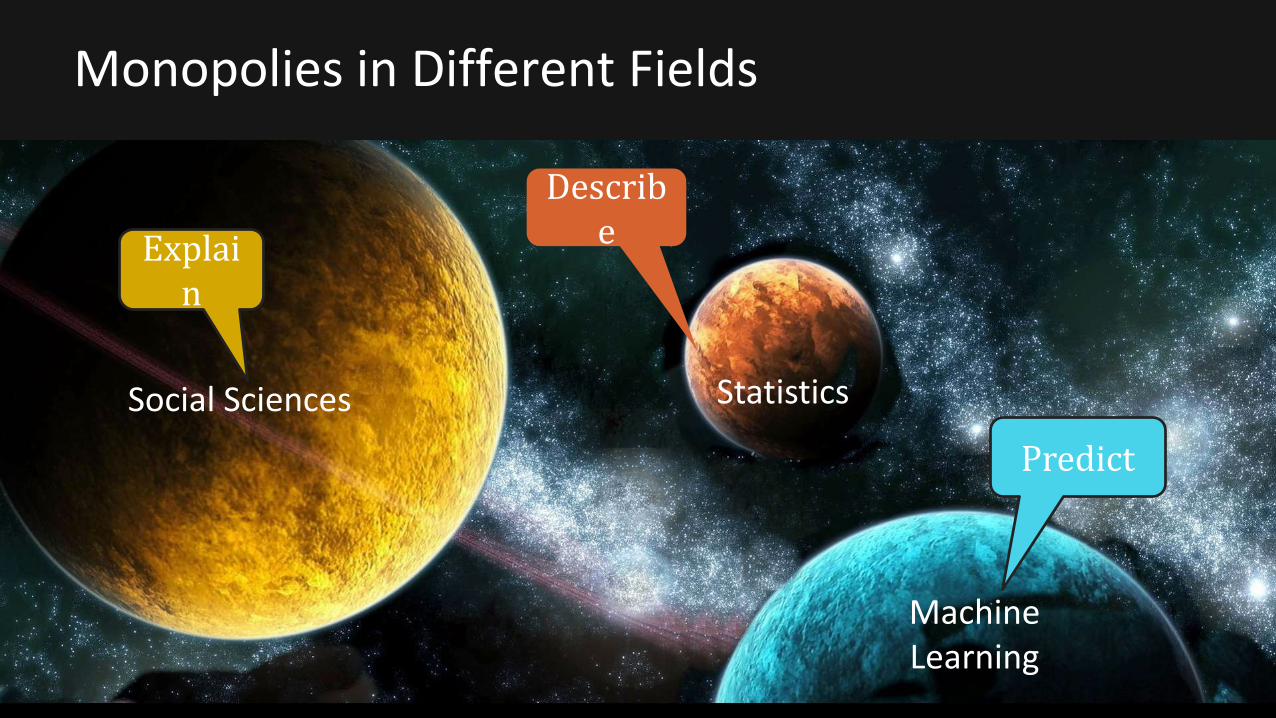
Explain
Predict
Describe
Social Sciences
Machine Learning
Statistics
Monopolies in Different Fields

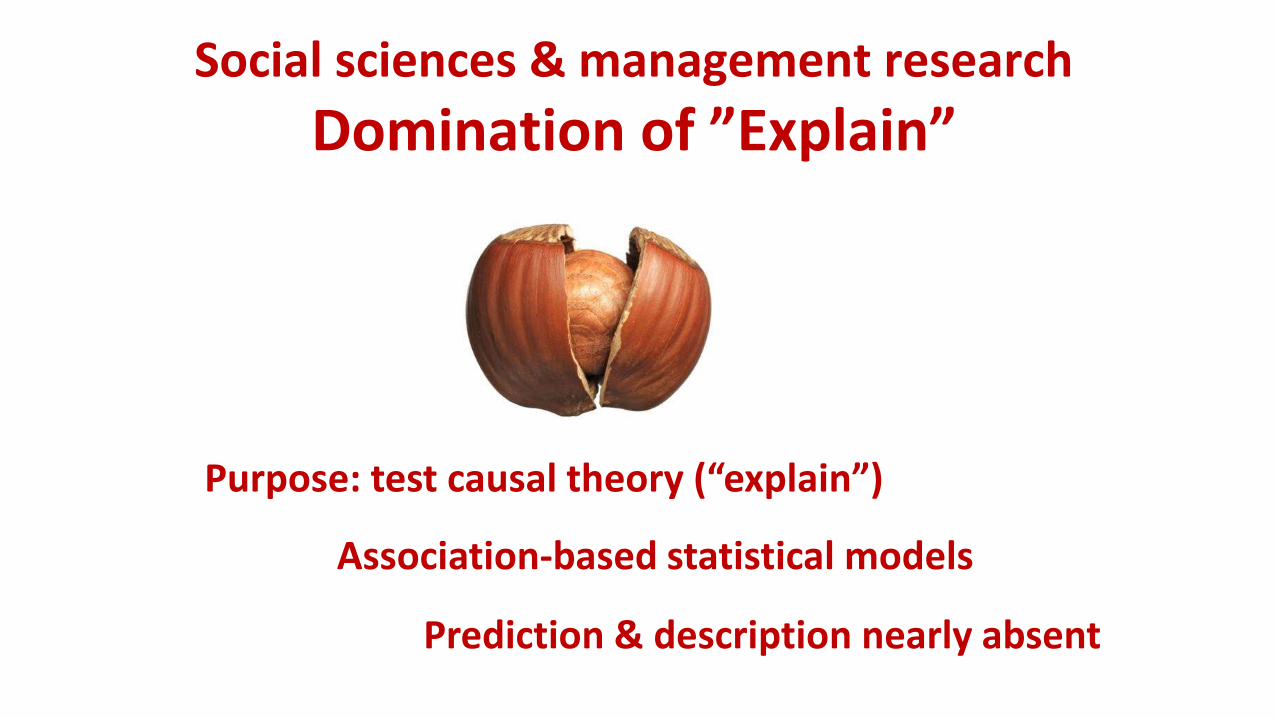
Social sciences & management research
Domination of ”Explain”
Purpose: test causal theory (“explain”)
Association-based statistical models
Prediction & description nearly absent
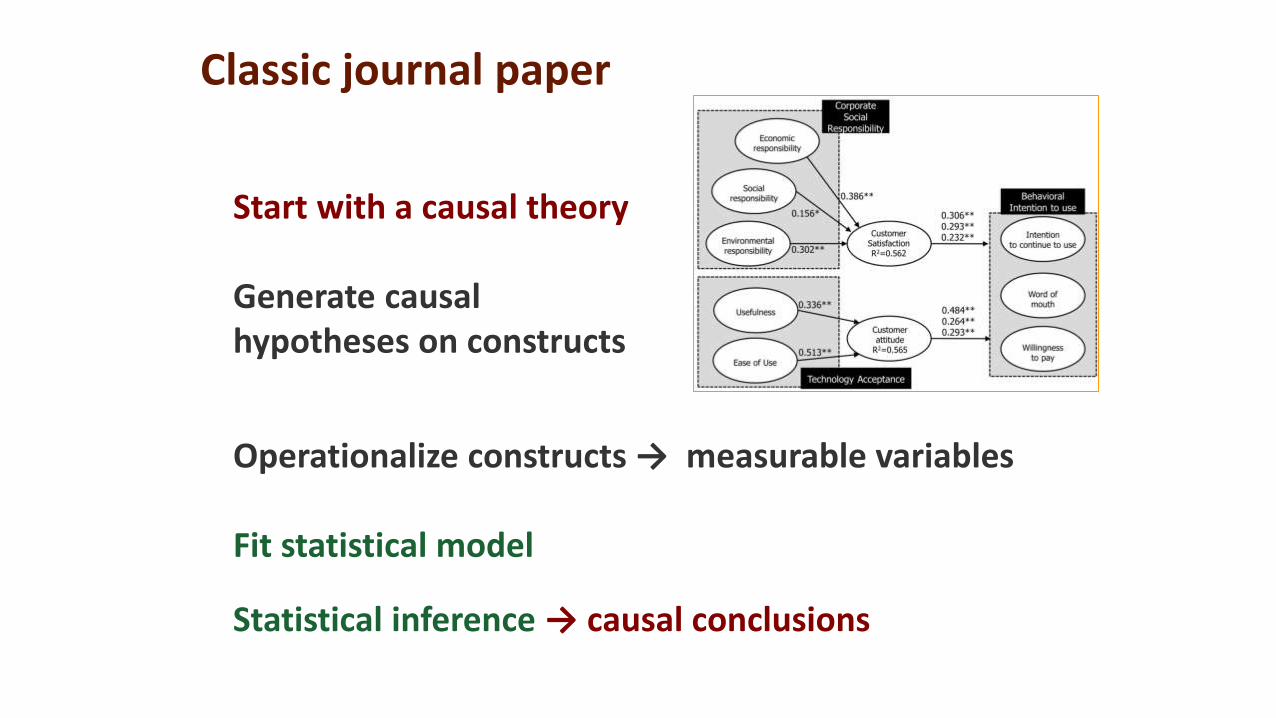
Start with a causal theory
Generate causal hypotheses on constructs
Operationalize constructs → measurable variables
Fit statistical model
Classic journal paper
Statistical inference → causal conclusions
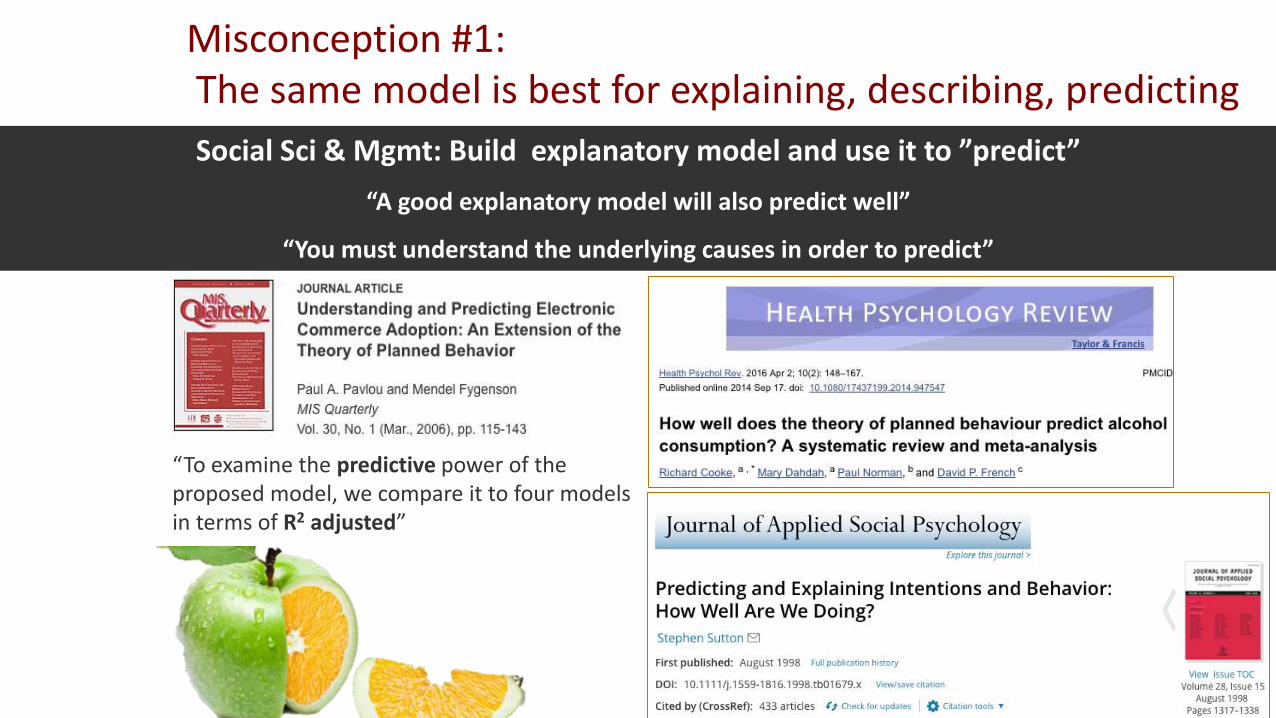
Misconception #1:The same model is best for explaining, describing, predicting
Social Sci & Mgmt: Build explanatory model and use it to ”predict”
“A good explanatory model will also predict well”
“You must understand the underlying causes in order to predict”
“To examine the predictive power of the proposed model, we compare it to four models in terms of R2 adjusted”
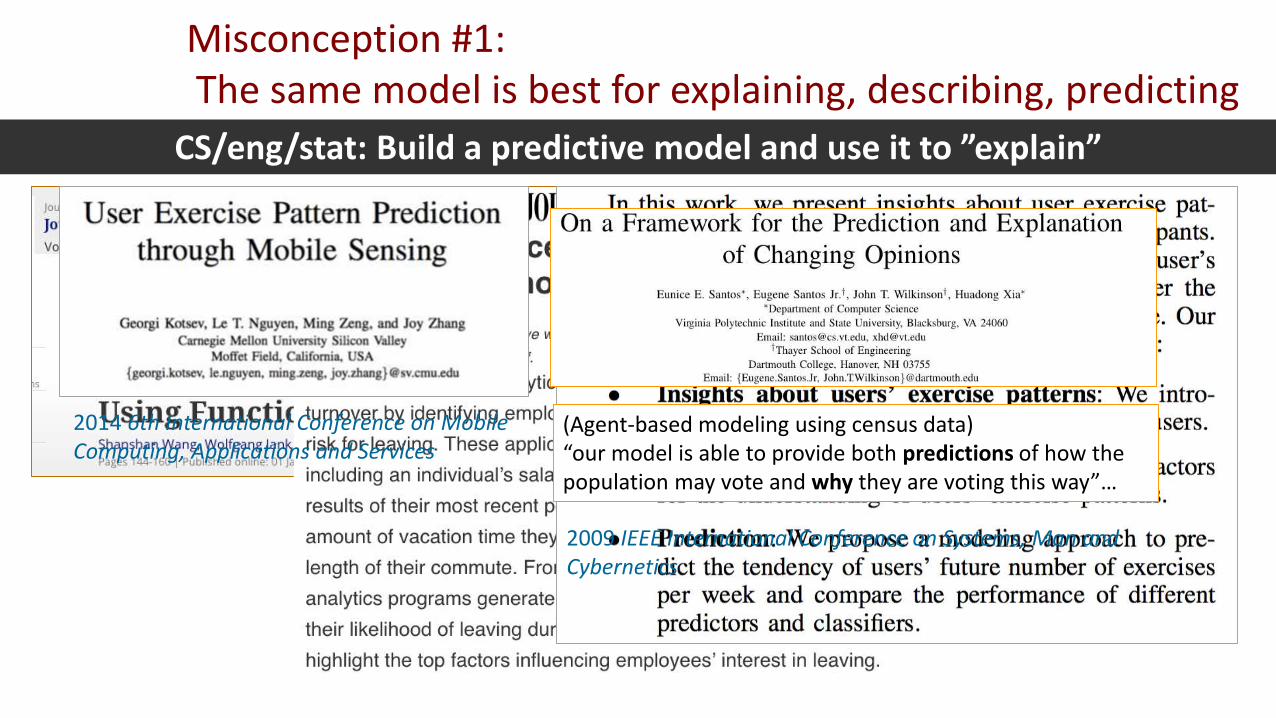
Misconception #1:The same model is best for explaining, describing, predicting
CS/eng/stat: Build a predictive model and use it to ”explain”
in cs / stat / engineering / industry
2014 6th International Conference on Mobile Computing, Applications and Services
(Agent-based modeling using census data)“our model is able to provide both predictions of how the population may vote and why they are voting this way”…
2009 IEEE International Conference on Systems, Man and Cybernetics
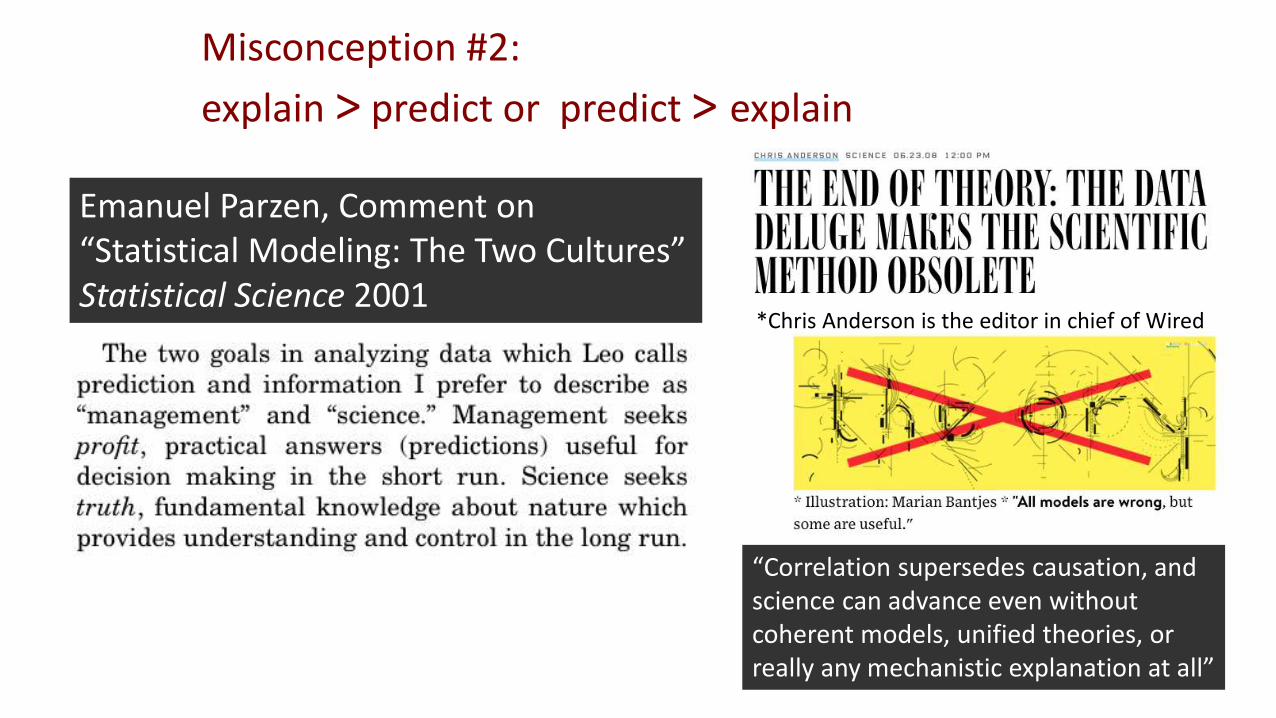
Misconception #2:
explain > predict or predict > explain
Emanuel Parzen, Comment on “Statistical Modeling: The Two Cultures” Statistical Science 2001
“Correlation supersedes causation, and science can advance even without coherent models, unified theories, or really any mechanistic explanation at all”
*Chris Anderson is the editor in chief of Wired

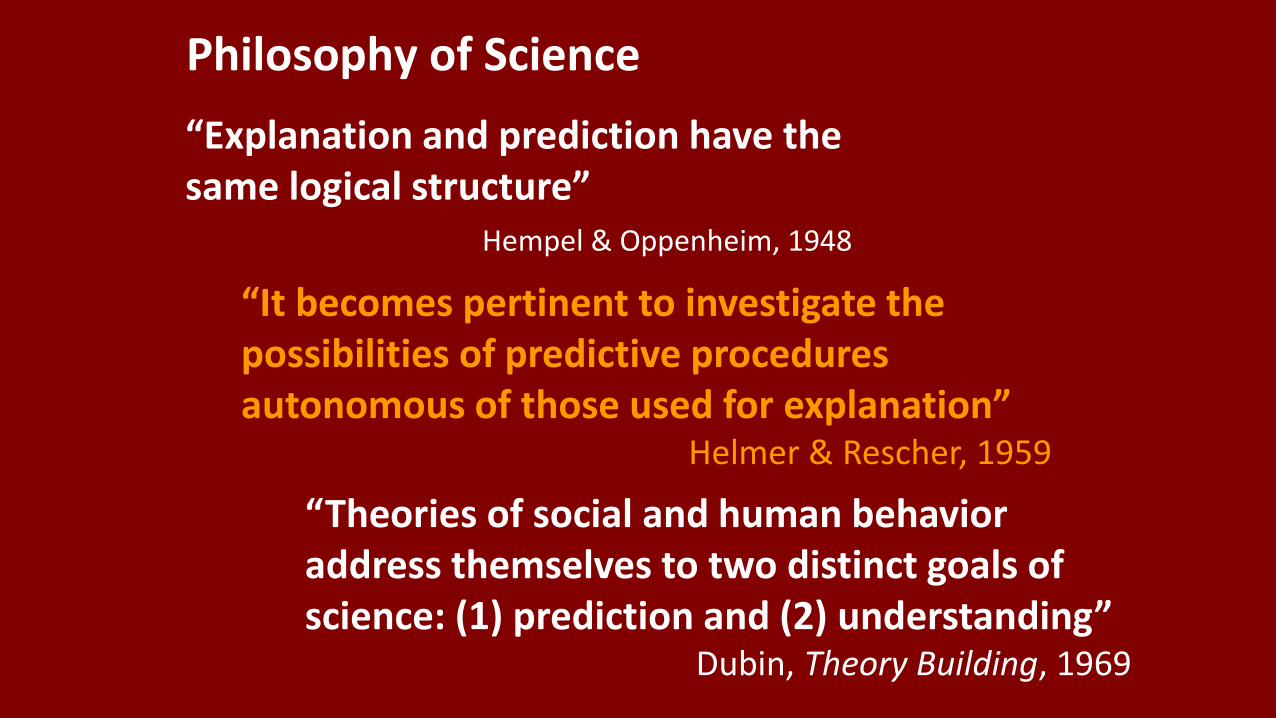
Philosophy of Science
“Explanation and prediction have the same logical structure”
Hempel & Oppenheim, 1948
“It becomes pertinent to investigate the possibilities of predictive procedures autonomous of those used for explanation”
Helmer & Rescher, 1959
“Theories of social and human behavior address themselves to two distinct goals of science: (1) prediction and (2) understanding”
Dubin, Theory Building, 1969
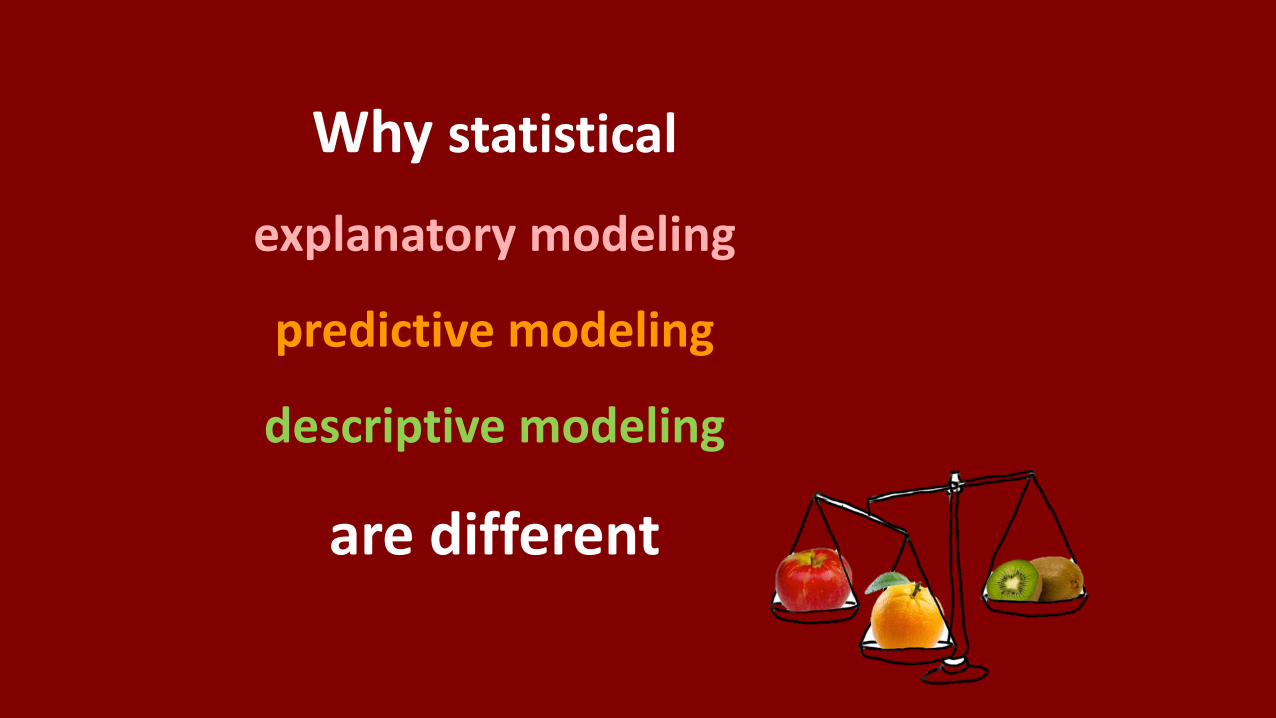
Why statistical
explanatory modeling
predictive modeling
descriptive modeling
are different
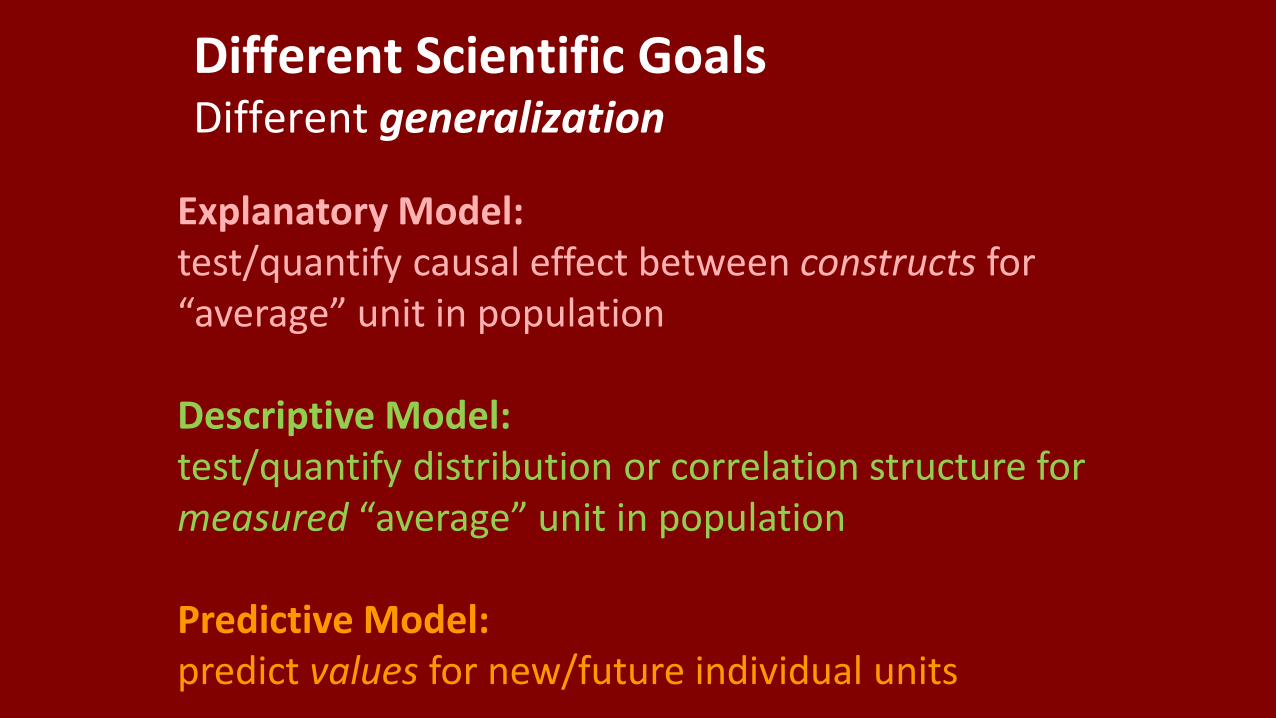
Explanatory Model: test/quantify causal effect between constructs for “average” unit in population
Descriptive Model:test/quantify distribution or correlation structure for measured “average” unit in population
Predictive Model: predict values for new/future individual units
Different Scientific GoalsDifferent generalization
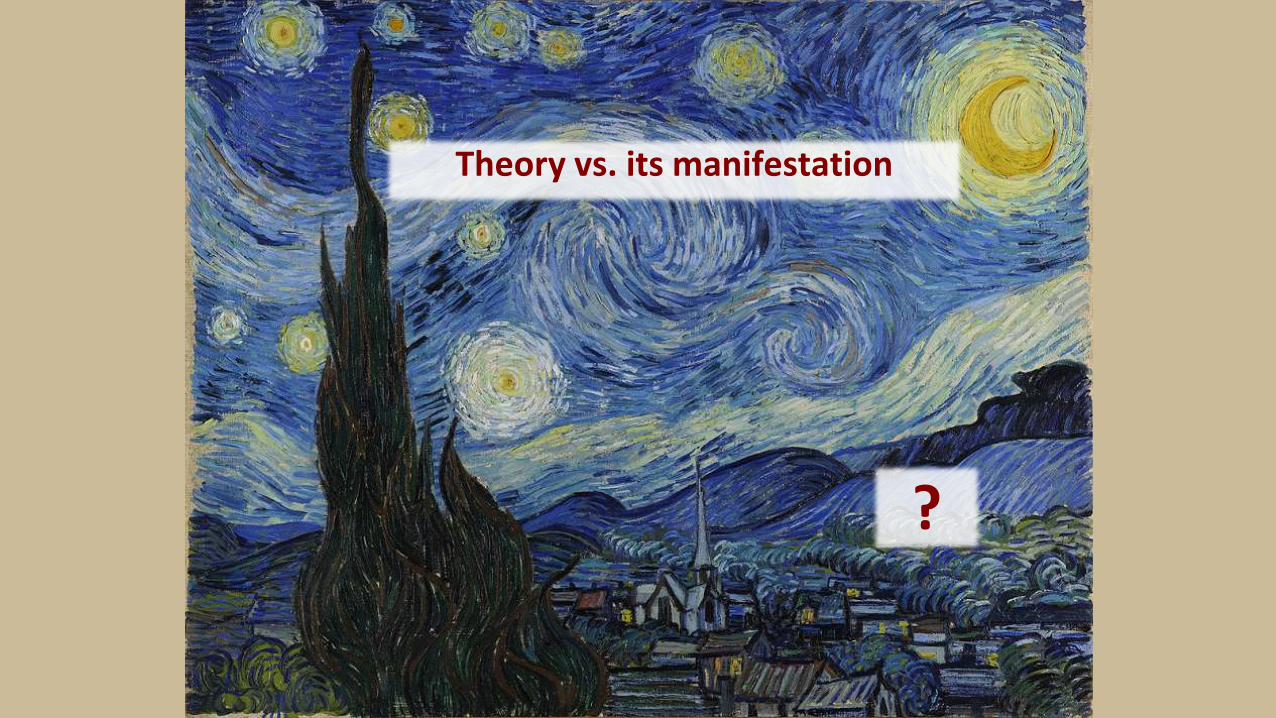
Theory vs. its manifestation
?
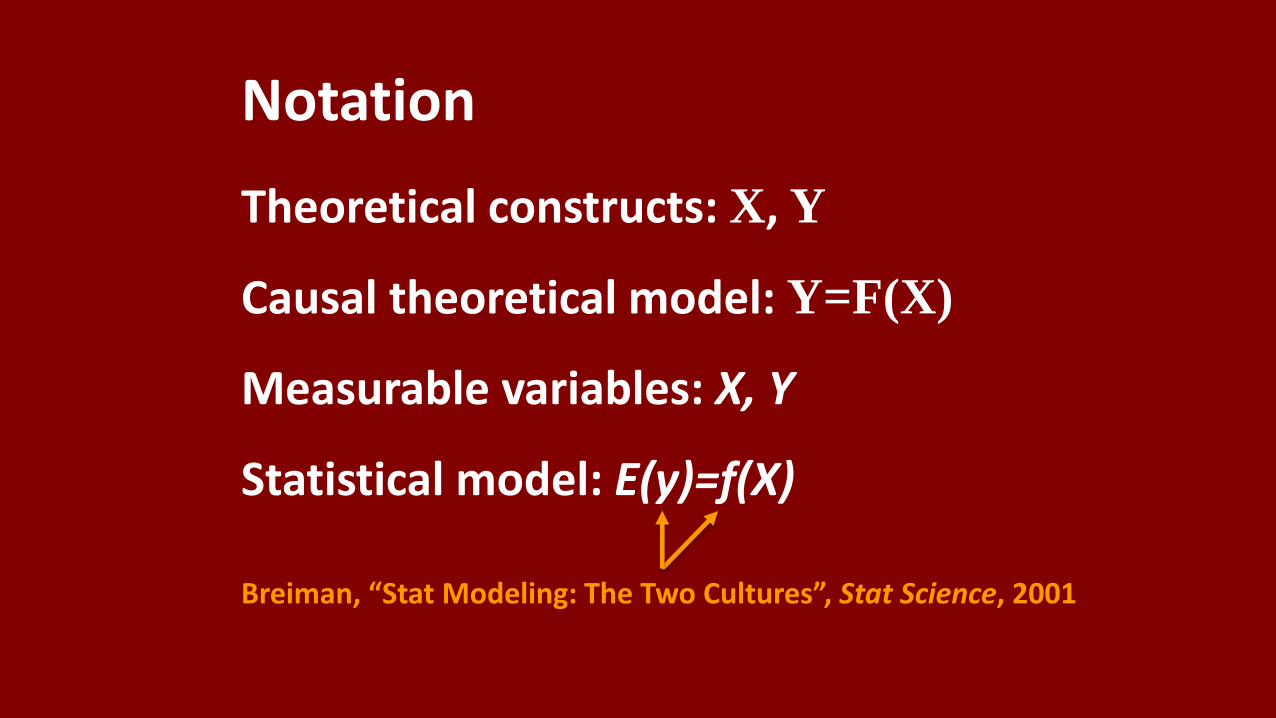
Notation
Theoretical constructs: X, Y
Causal theoretical model: Y=F(X)
Measurable variables: X, Y
Statistical model: E(y)=f(X)
Breiman, “Stat Modeling: The Two Cultures”, Stat Science, 2001
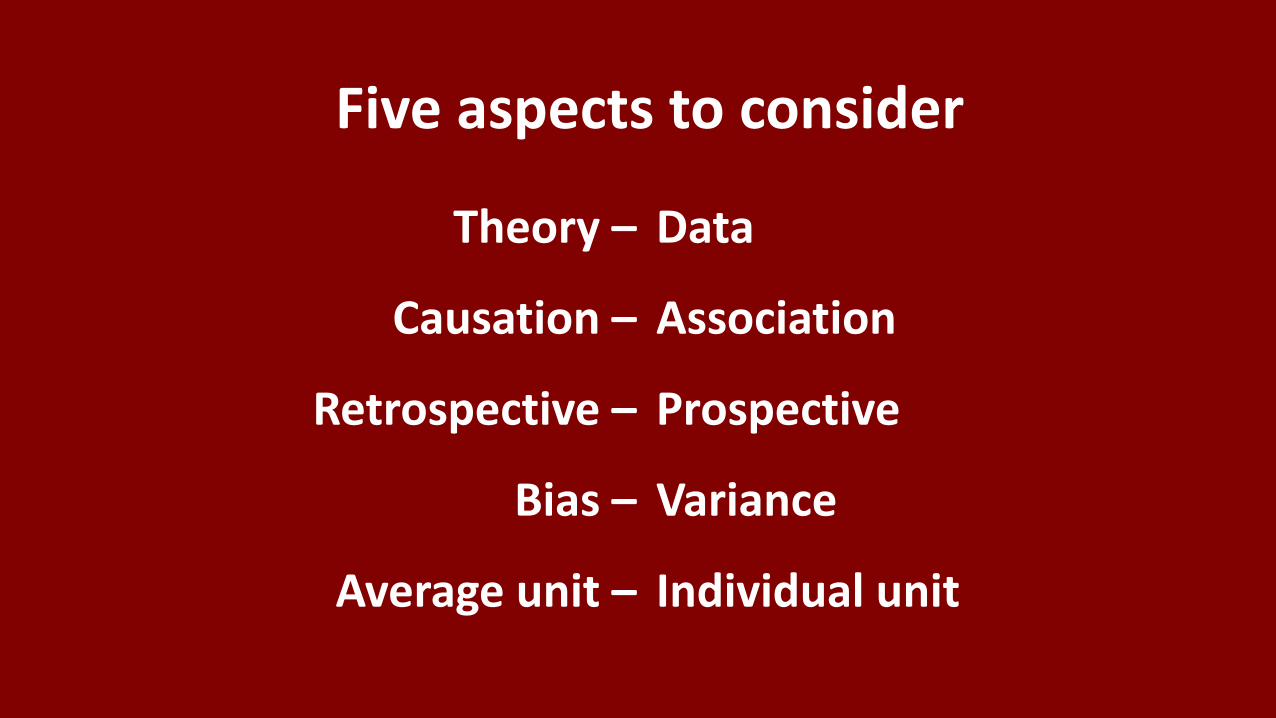
Five aspects to consider
Theory –
Causation –
Retrospective –
Bias –
Average unit –
Data
Association
Prospective
Variance
Individual unit
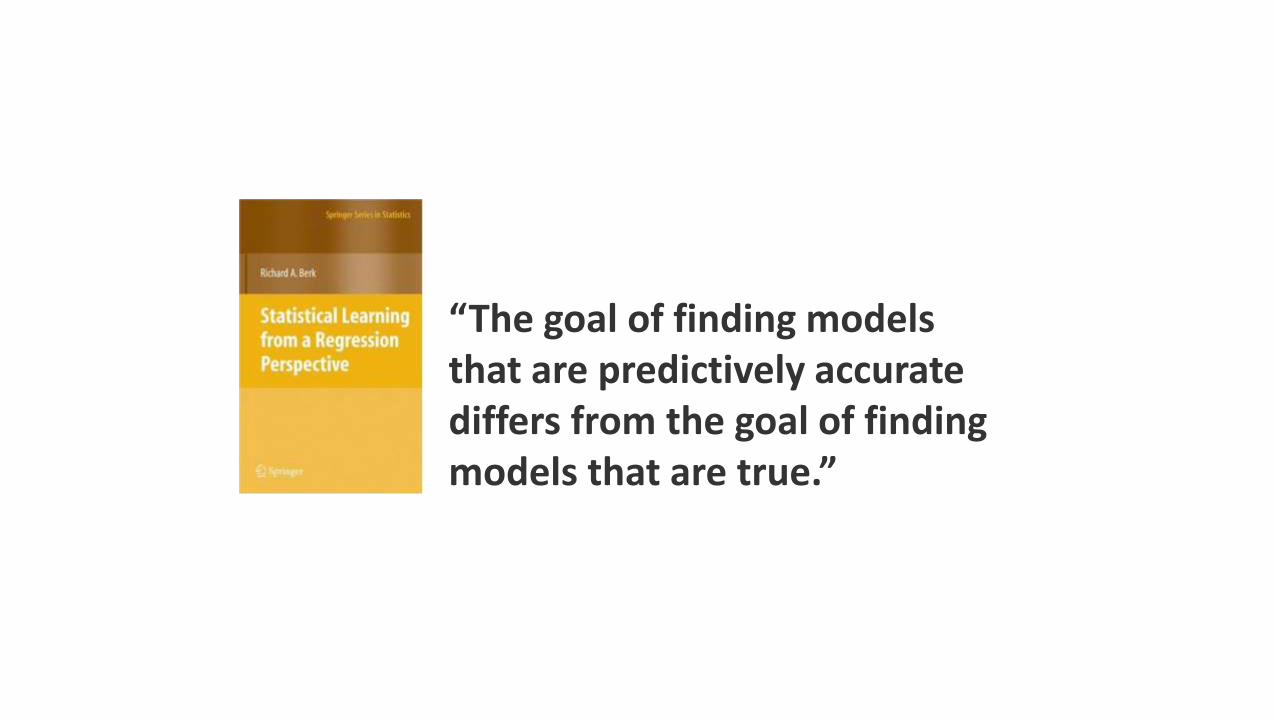
“The goal of finding models that are predictively accurate differs from the goal of finding models that are true.”
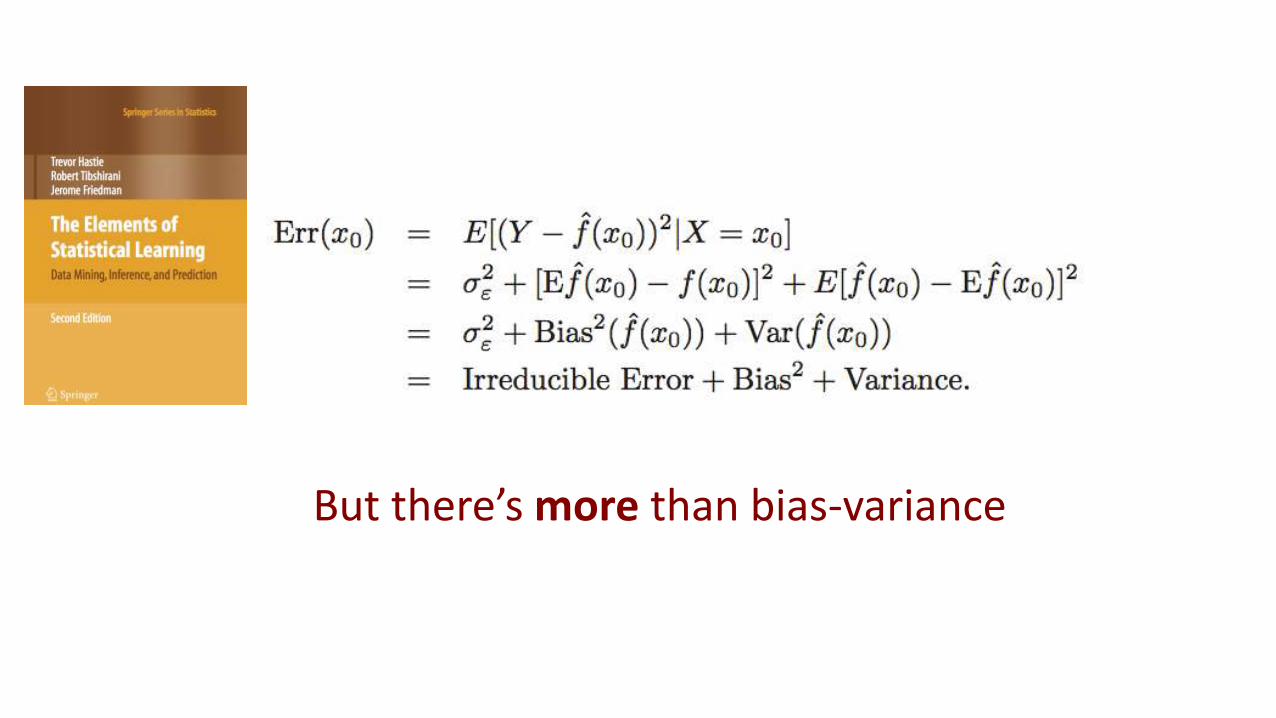
But there’s more than bias-variance
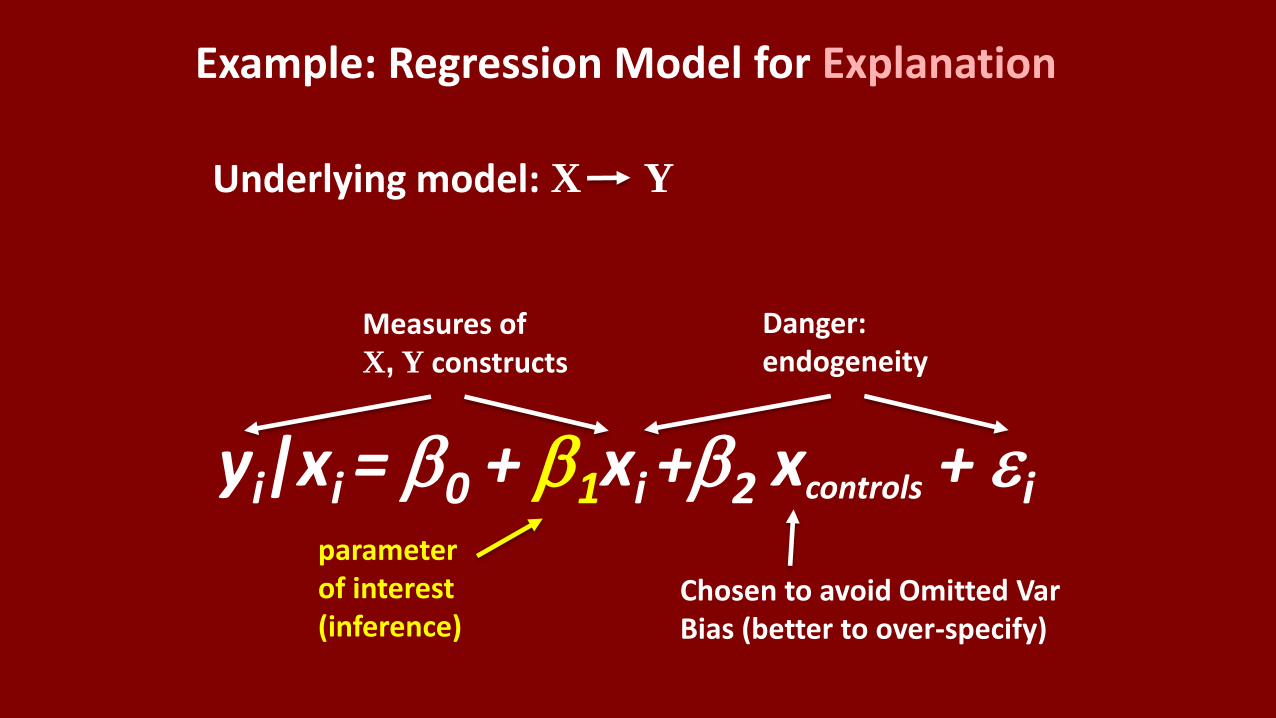
Example: Regression Model for Explanation
yi|xi = b0 + b1xi +b2 xcontrols + eiparameter of interest (inference)
Chosen to avoid Omitted VarBias (better to over-specify)
Measures of X, Y constructs
Underlying model: X Y
Danger: endogeneity
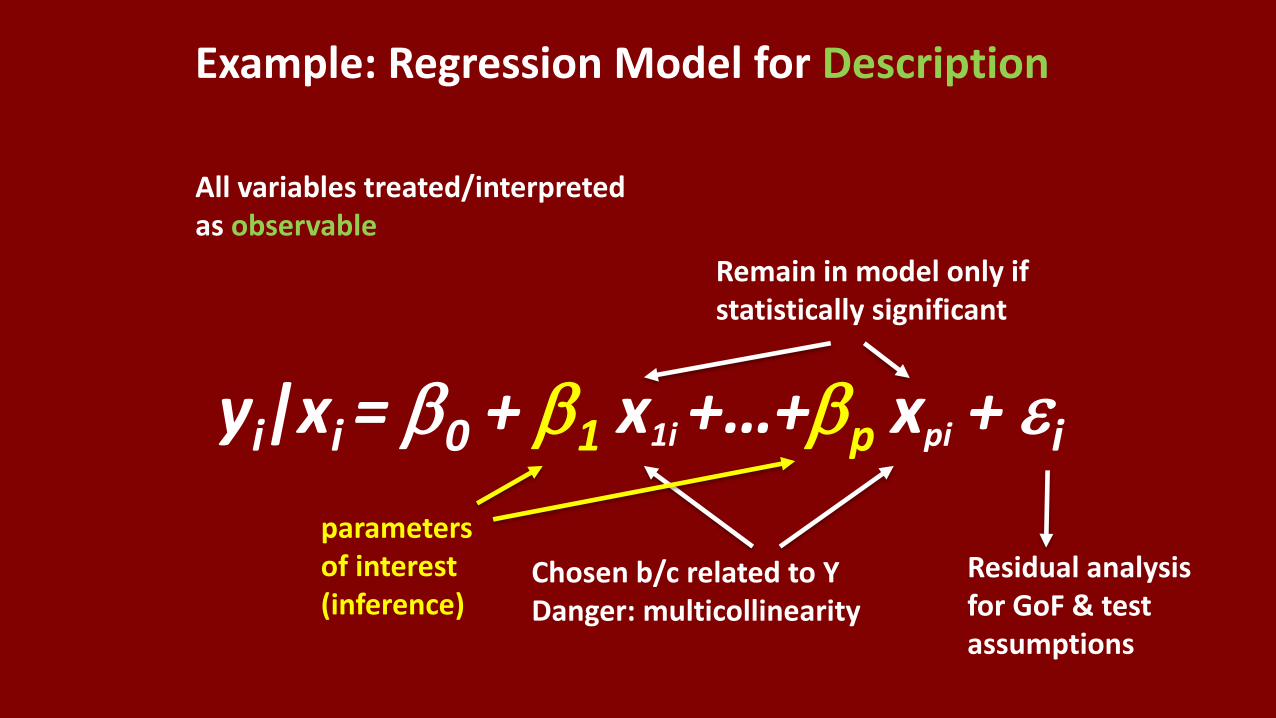
yi|xi = b0 + b1 x1i +…+bp xpi + ei
parameters of interest (inference)
Chosen b/c related to YDanger: multicollinearity
All variables treated/interpreted as observable
Remain in model only if statistically significant
Residual analysis for GoF & test assumptions
Example: Regression Model for Description
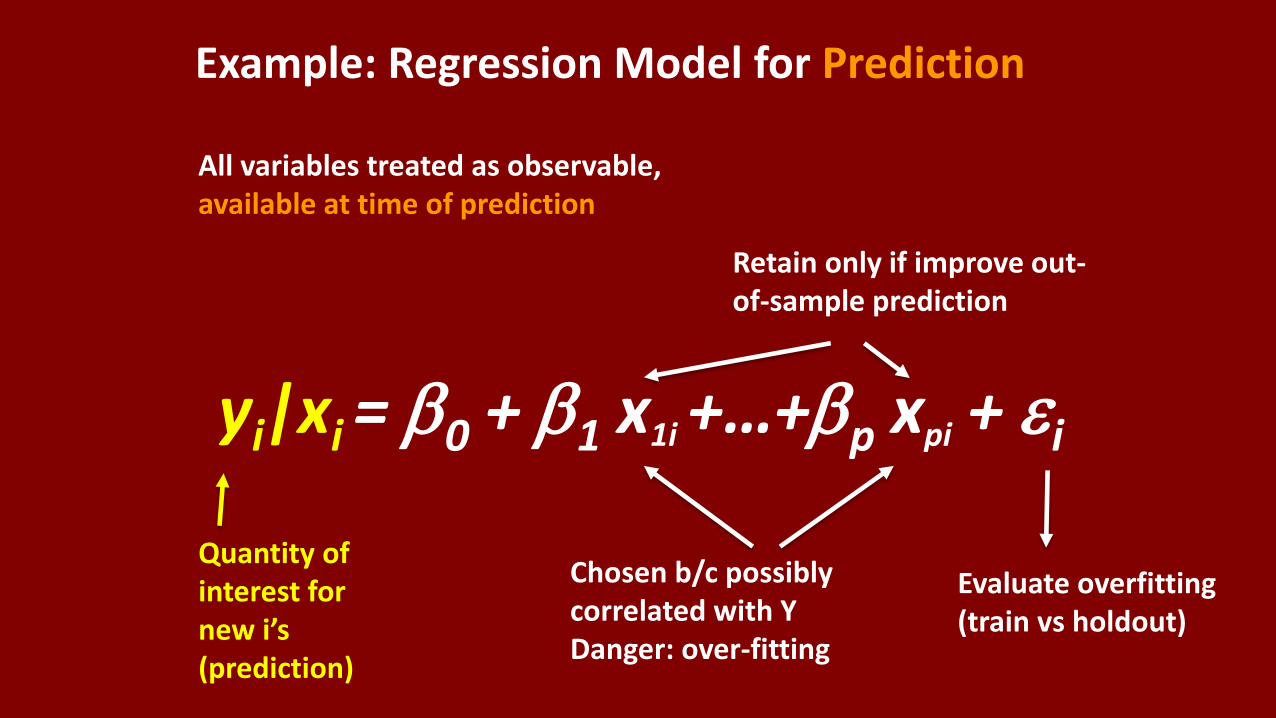
yi|xi = b0 + b1 x1i +…+bp xpi + ei
Quantity of interest for new i’s (prediction)
Chosen b/c possibly correlated with YDanger: over-fitting
All variables treated as observable, available at time of prediction
Retain only if improve out-of-sample prediction
Evaluate overfitting (train vs holdout)
Example: Regression Model for Prediction
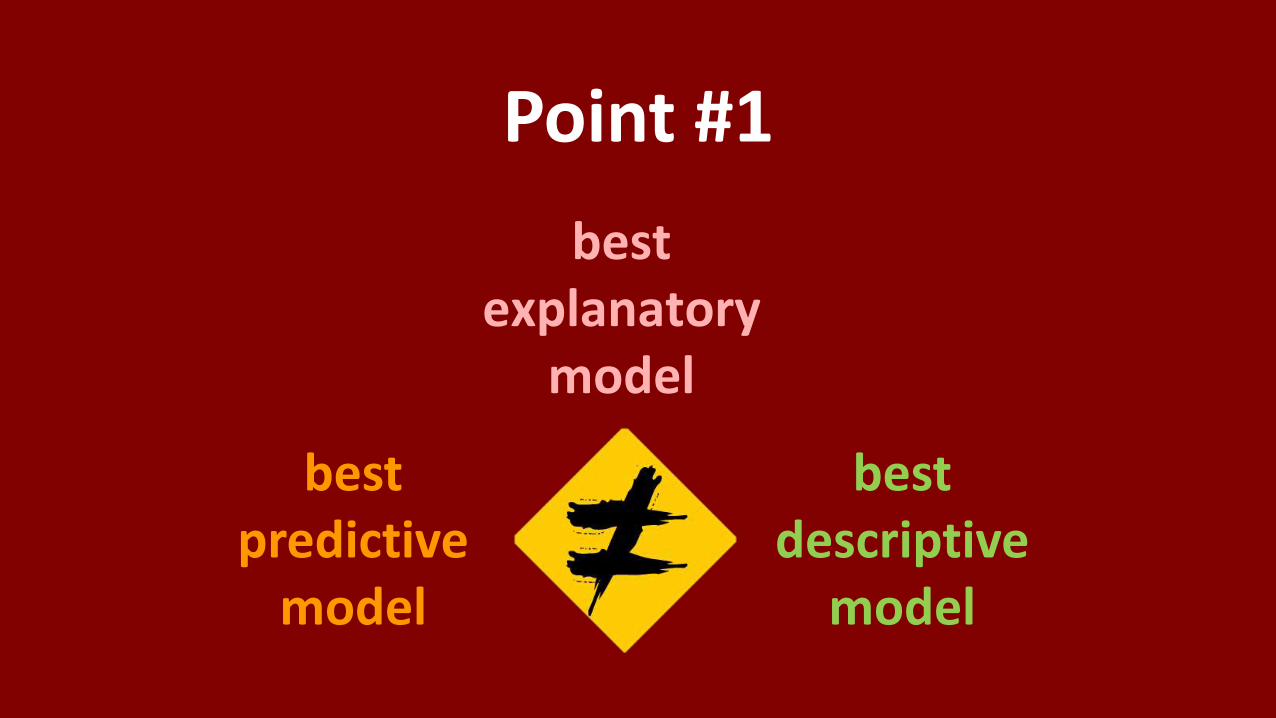
best explanatory
model
best predictive
model
Point #1
best descriptive
model
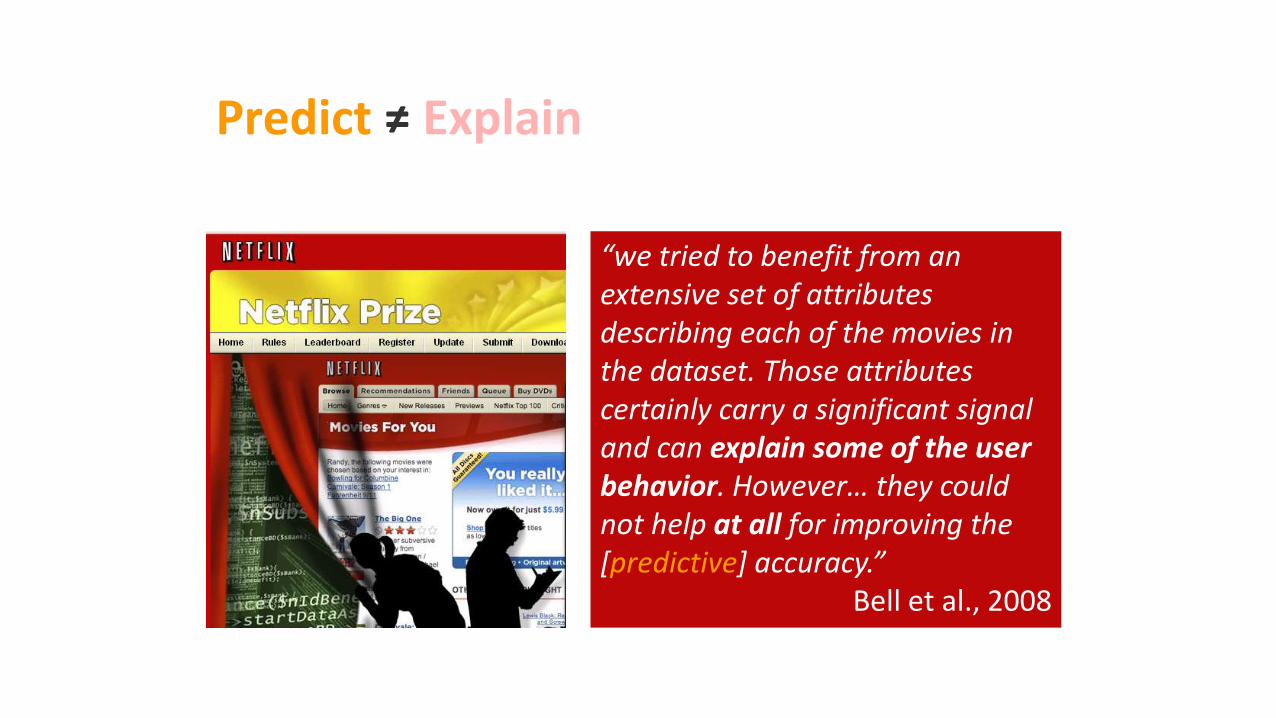
Predict ≠ Explain
+ ?
“we tried to benefit from an extensive set of attributes describing each of the movies in the dataset. Those attributes certainly carry a significant signal and can explain some of the user behavior. However… they could not help at all for improving the [predictive] accuracy.”
Bell et al., 2008
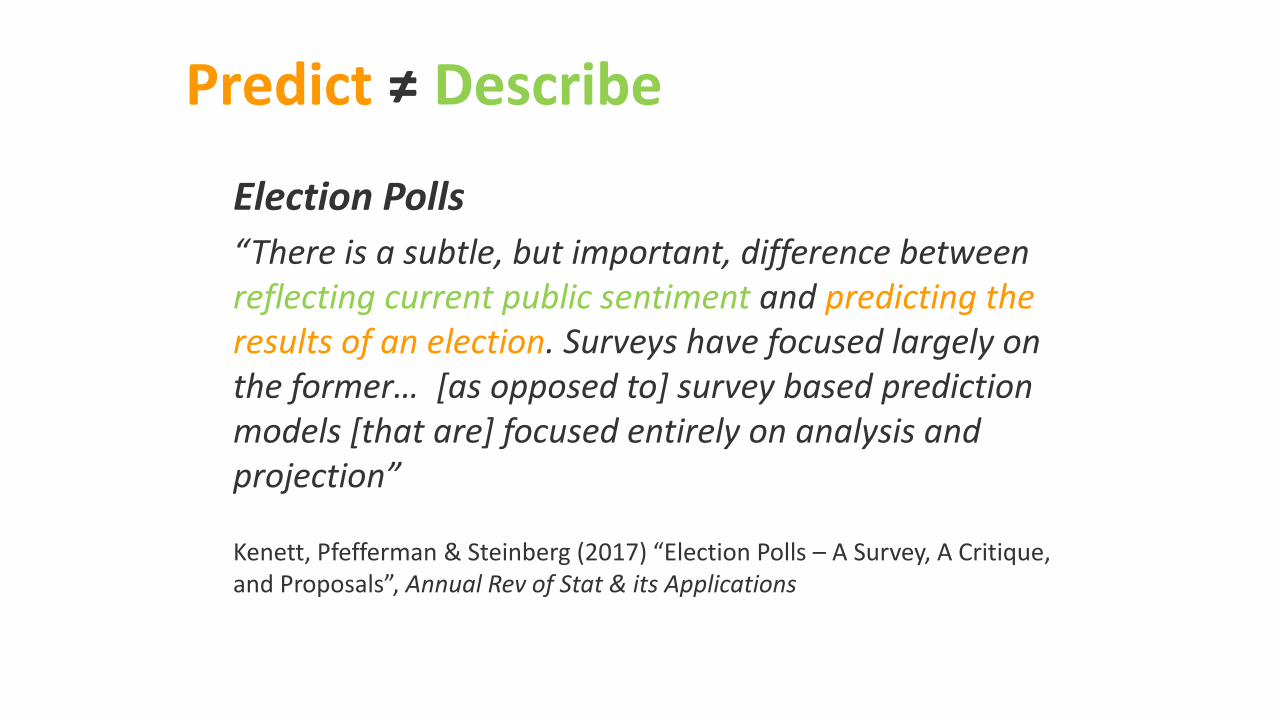
Predict ≠ Describe
Election Polls
“There is a subtle, but important, difference between reflecting current public sentiment and predicting the results of an election. Surveys have focused largely on the former… [as opposed to] survey based prediction models [that are] focused entirely on analysis and projection”
Kenett, Pfefferman & Steinberg (2017) “Election Polls – A Survey, A Critique, and Proposals”, Annual Rev of Stat & its Applications
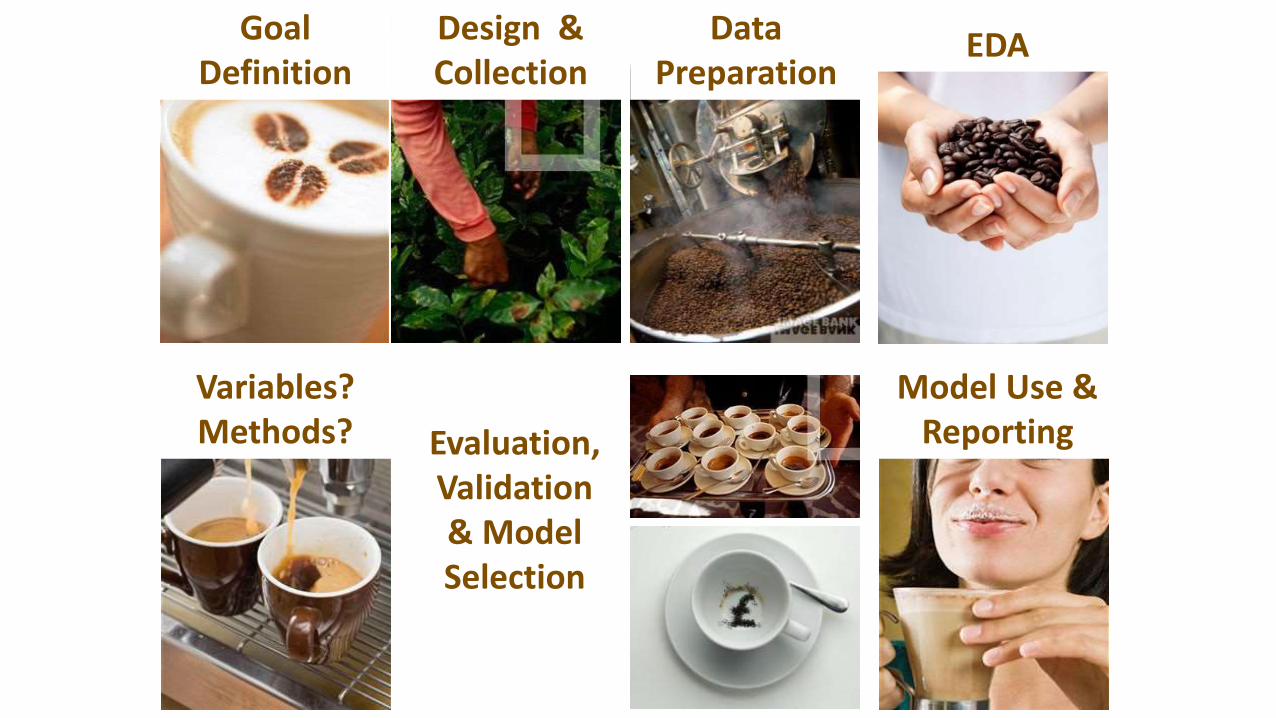
Goal Definition
Design & Collection
Data Preparation
EDA
Variables? Methods? Evaluation,
Validation & Model Selection
Model Use & Reporting
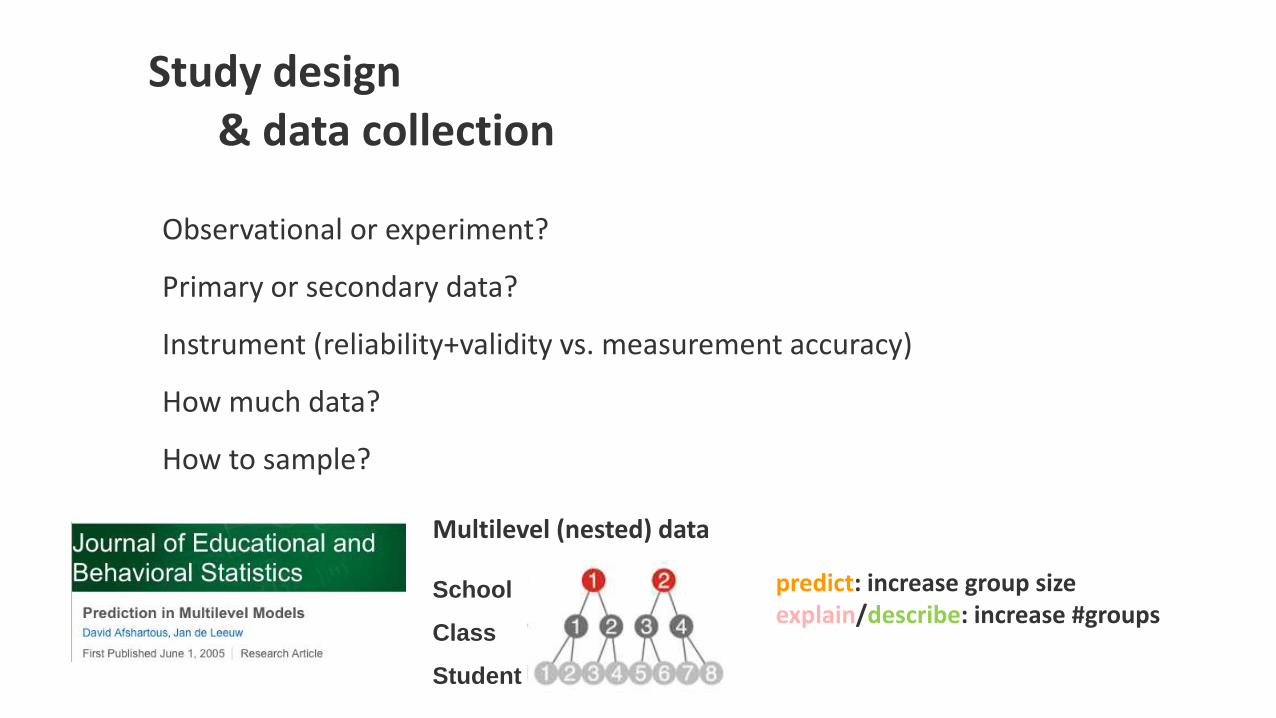
Observational or experiment?
Primary or secondary data?
Instrument (reliability+validity vs. measurement accuracy)
How much data?
How to sample?
Study design & data collection
predict: increase group sizeexplain/describe: increase #groups
Multilevel (nested) data
School
Class
Student
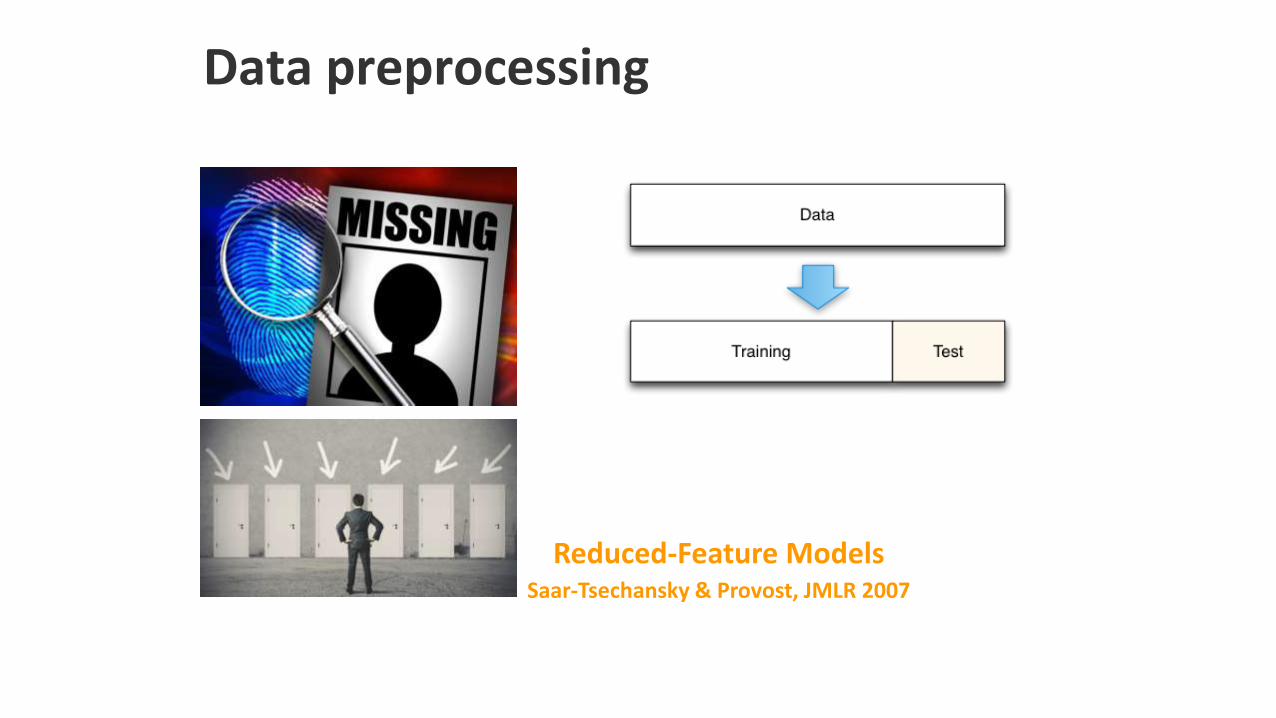
Data preprocessing
Reduced-Feature ModelsSaar-Tsechansky & Provost, JMLR 2007
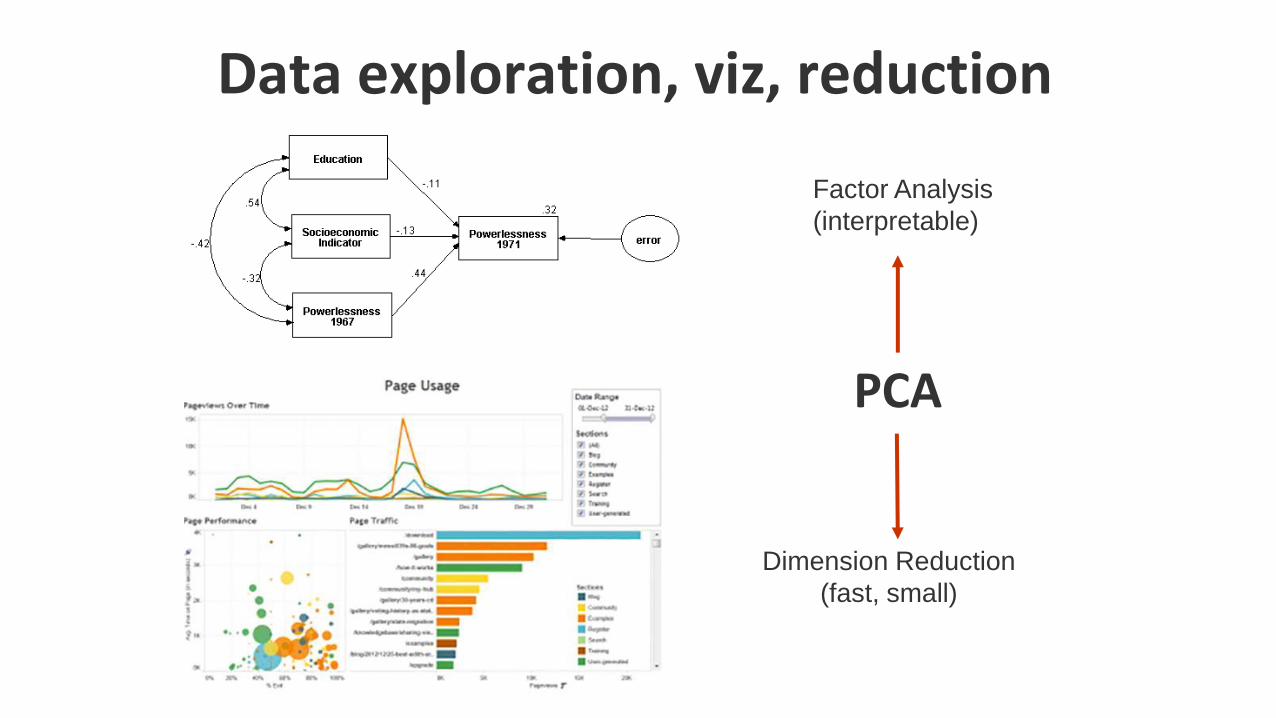
Data exploration, viz, reduction
PCA
Factor Analysis
(interpretable)
Dimension Reduction
(fast, small)
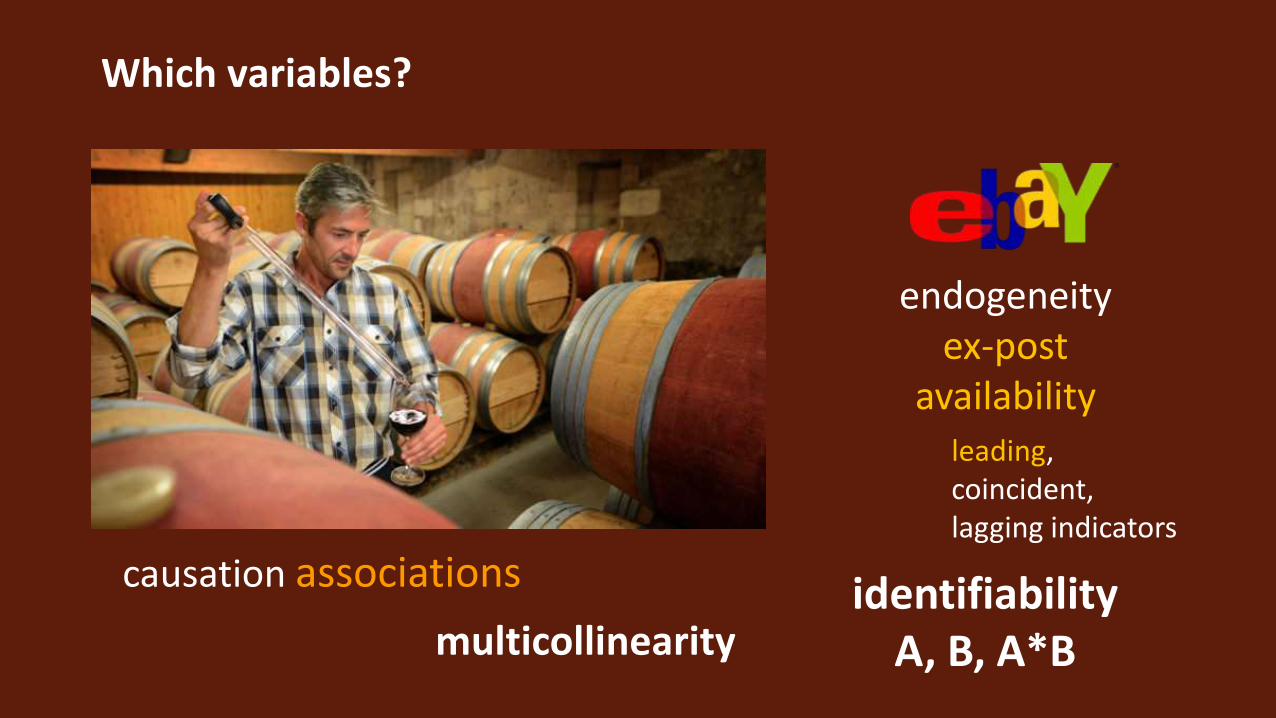
Which variables?
multicollinearity
causation associations
endogeneity ex-post
availability
identifiabilityA, B, A*B
leading, coincident, lagging indicators
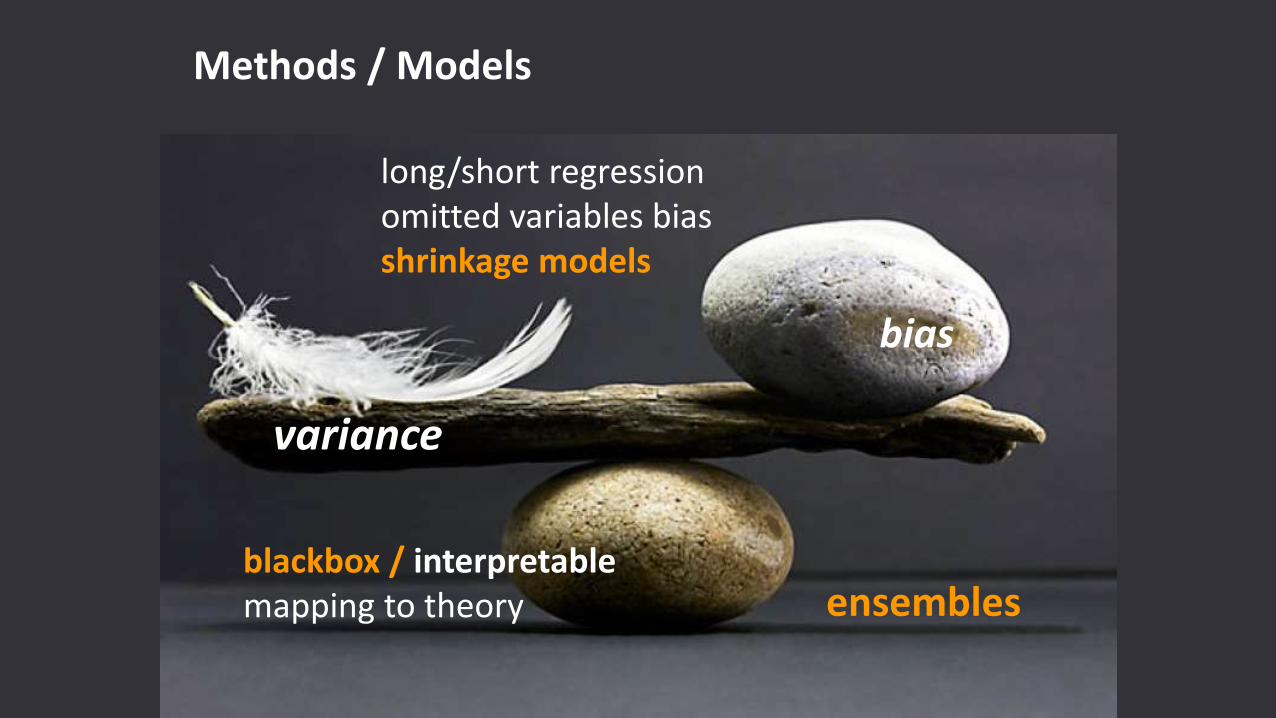
ensembles
long/short regressionomitted variables biasshrinkage models
variance
bias
Methods / Models
blackbox / interpretablemapping to theory
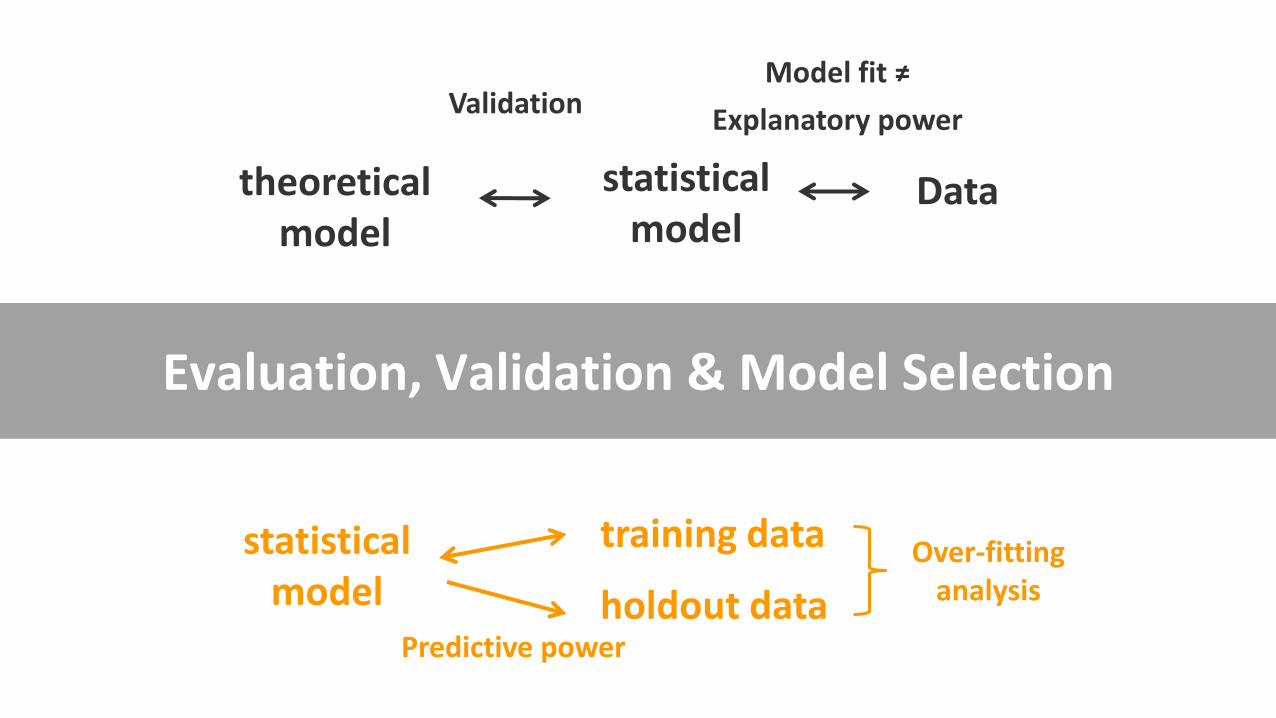
Evaluation, Validation & Model Selection
training datastatistical model holdout data
Predictive power
Over-fitting analysis
theoretical model
statistical model
Data
ValidationModel fit ≠
Explanatory power
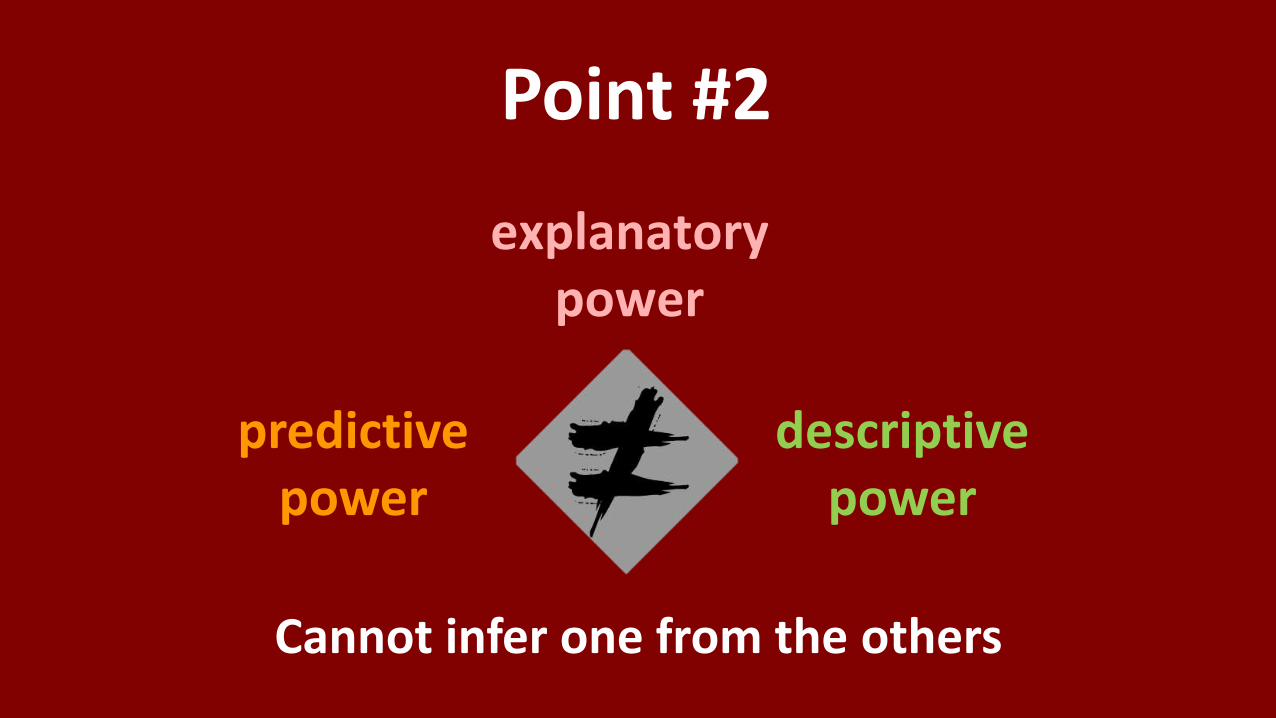
Point #2
Cannot infer one from the others
explanatory power
predictive power
descriptive power
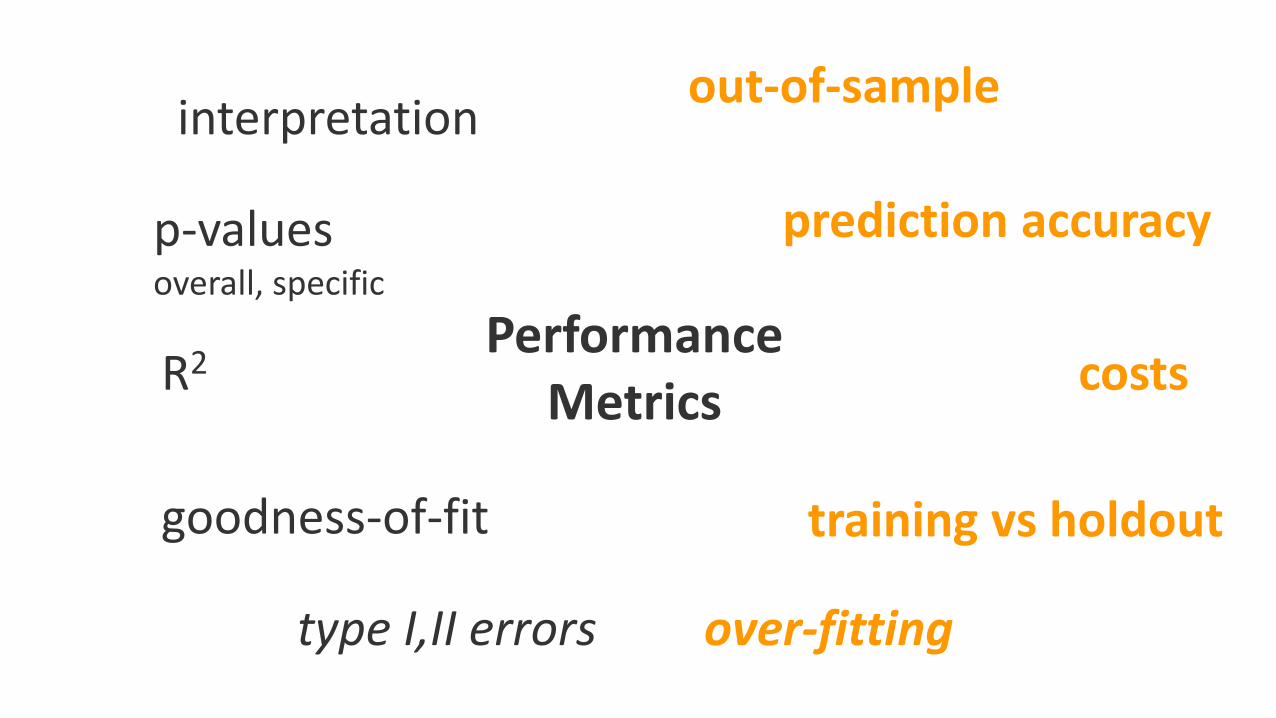
out-of-sample
Performance Metrics
type I,II errors
goodness-of-fit
p-values overall, specific
over-fitting
costs
prediction accuracy
interpretation
training vs holdout
R2
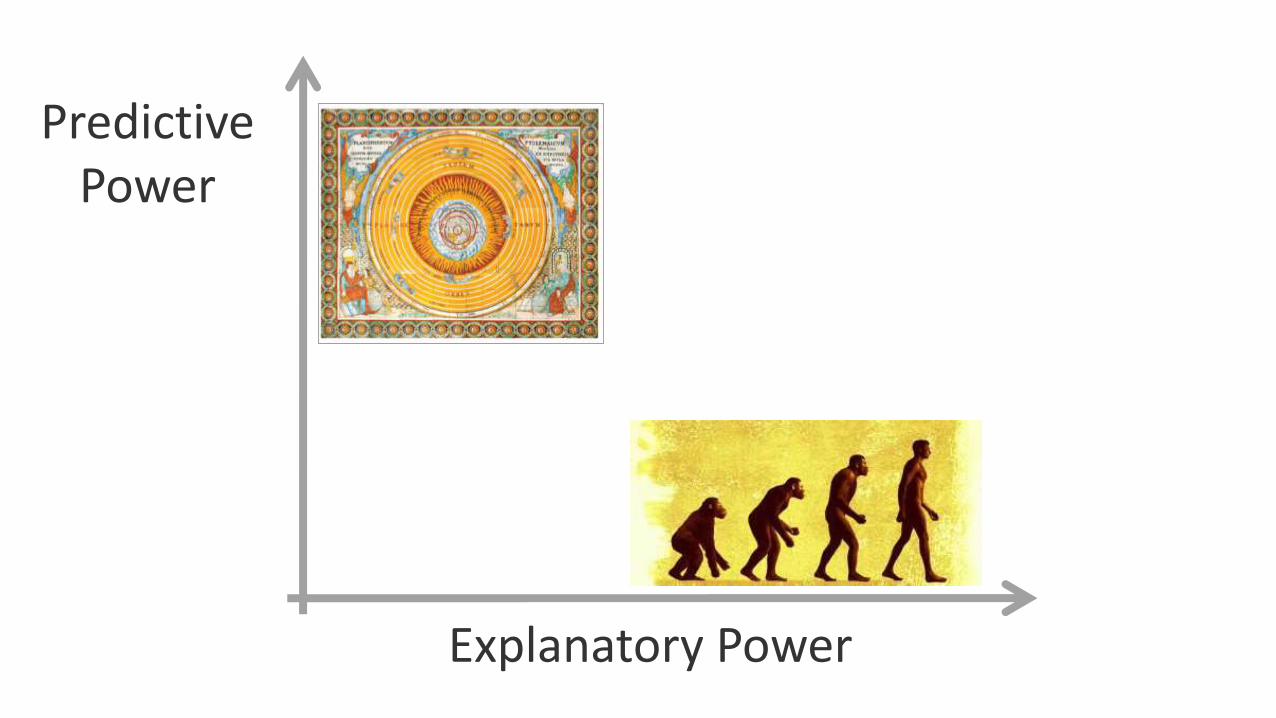
Explanatory Power
Predictive Power
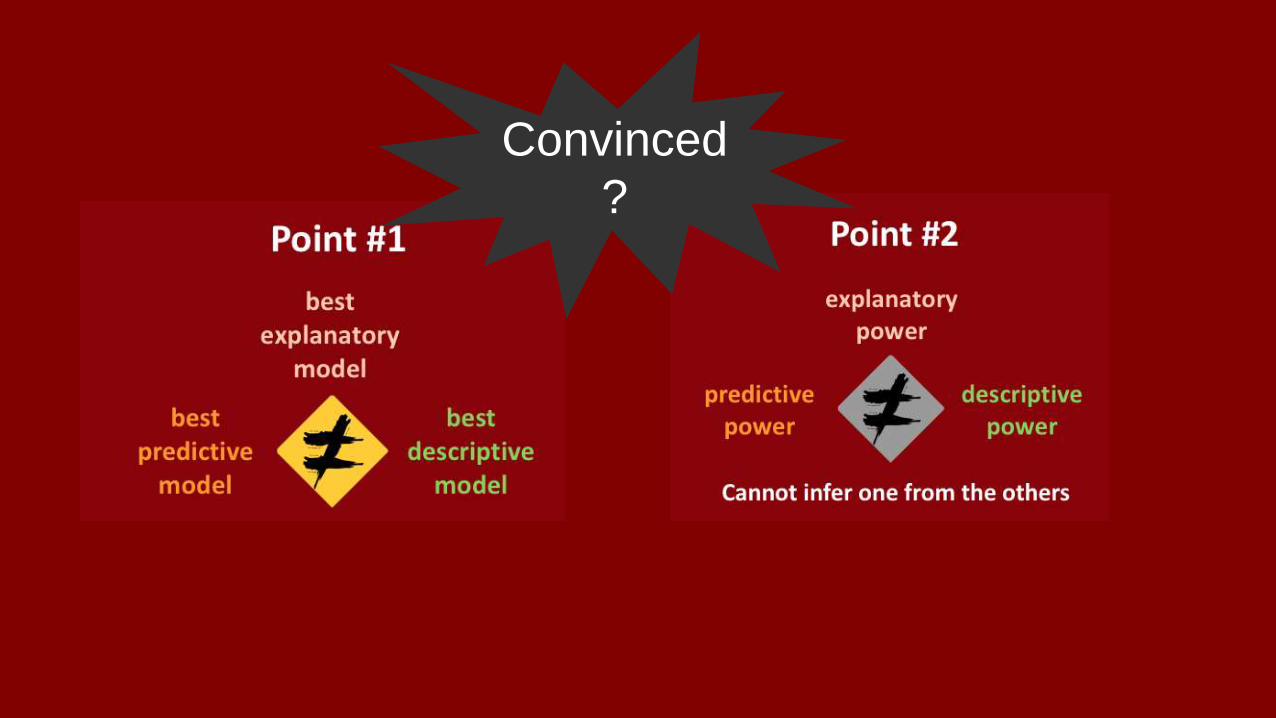
Convinced
?

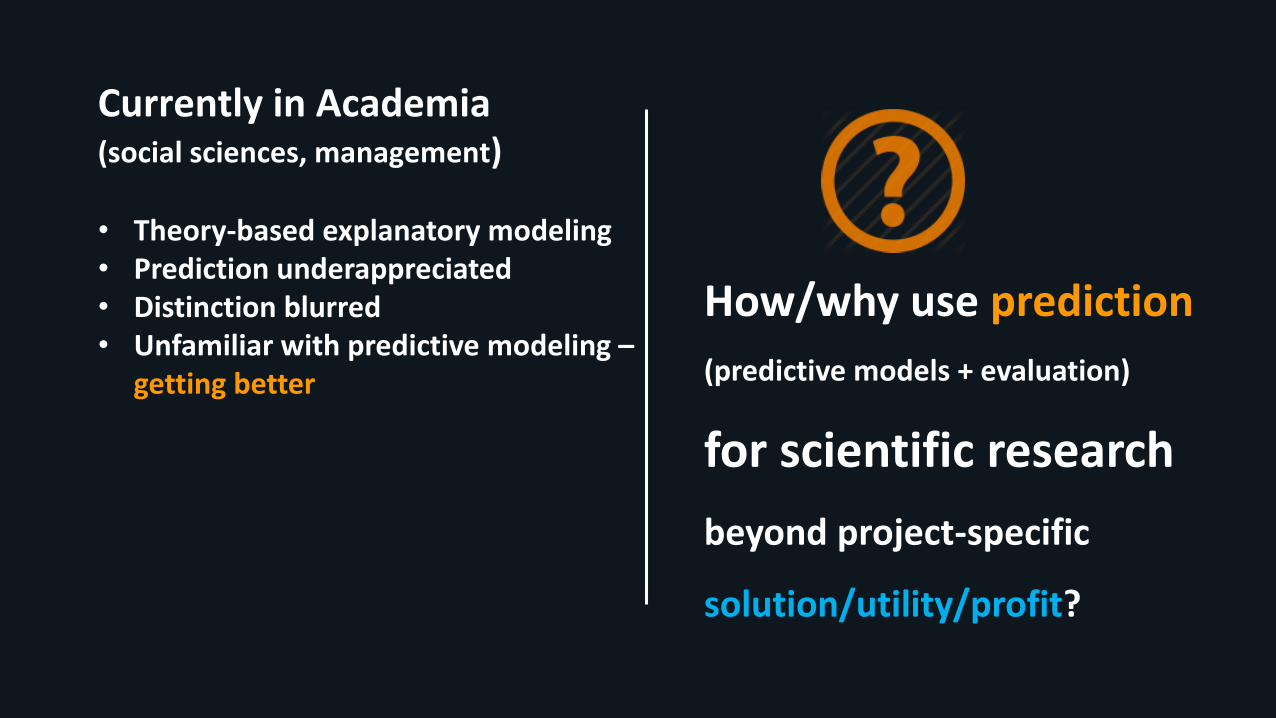
Currently in Academia (social sciences, management)
• Theory-based explanatory modeling• Prediction underappreciated• Distinction blurred• Unfamiliar with predictive modeling –
getting better
How/why use prediction
(predictive models + evaluation)
for scientific research
beyond project-specific
solution/utility/profit?
The predictive power of an explanatory/descriptive model has important scientific value
relevance, reality check, predictability
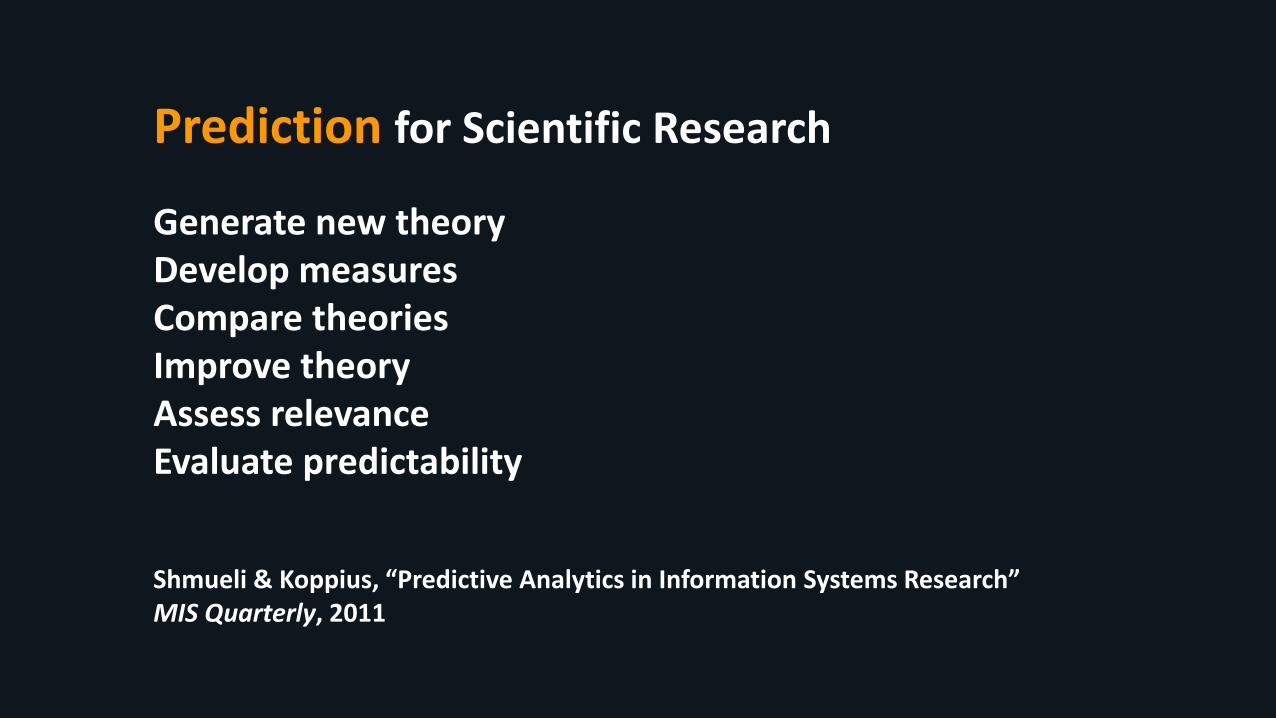
Generate new theoryDevelop measuresCompare theoriesImprove theoryAssess relevanceEvaluate predictability
Prediction for Scientific Research
Shmueli & Koppius, “Predictive Analytics in Information Systems Research” MIS Quarterly, 2011
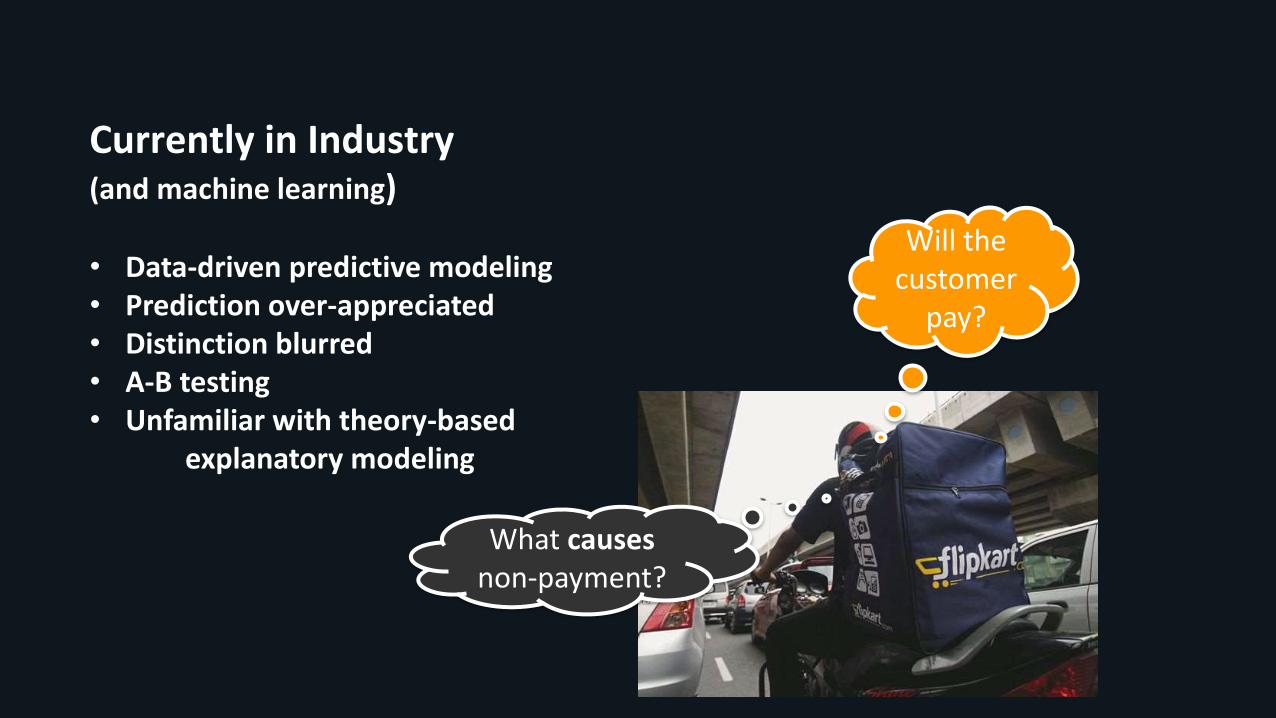
Currently in Industry(and machine learning)
• Data-driven predictive modeling• Prediction over-appreciated • Distinction blurred• A-B testing• Unfamiliar with theory-based
explanatory modeling
Will the customer
pay?
What causesnon-payment?
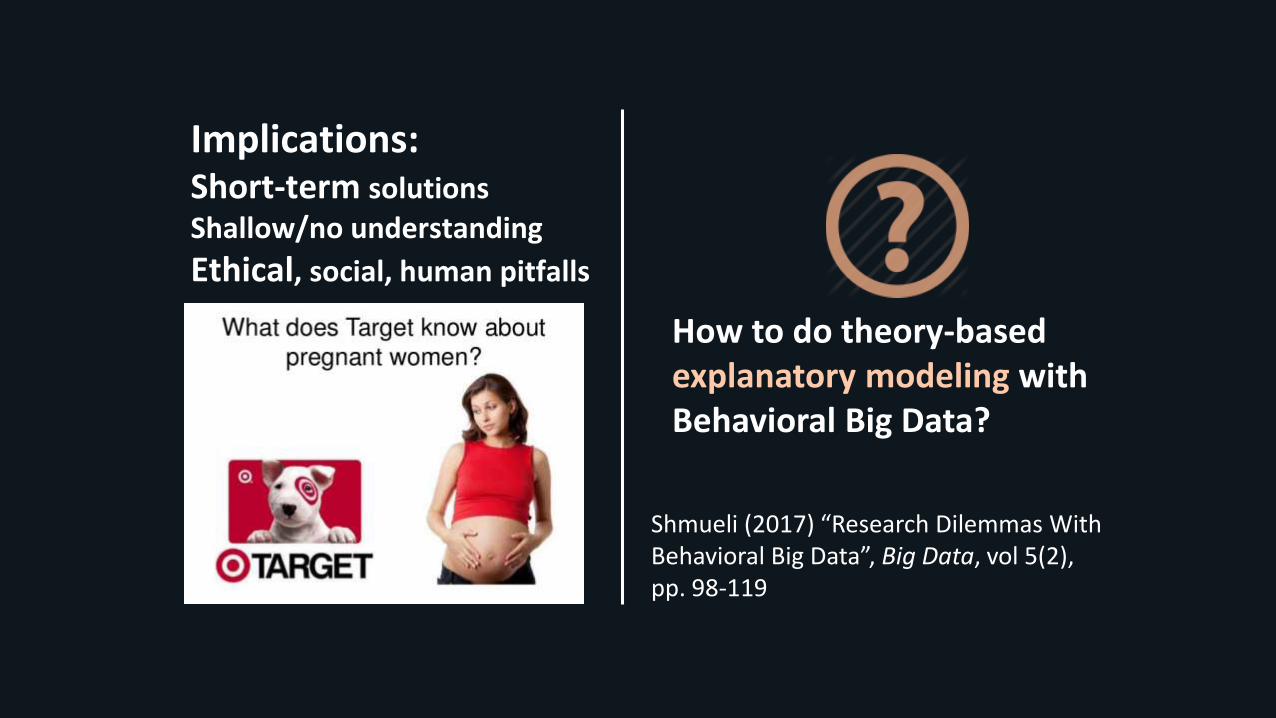
Implications:Short-term solutionsShallow/no understanding
Ethical, social, human pitfalls
Shmueli (2017) “Research Dilemmas With Behavioral Big Data”, Big Data, vol 5(2), pp. 98-119
How to do theory-based explanatory modeling with Behavioral Big Data?
Explain + Predict + Describe
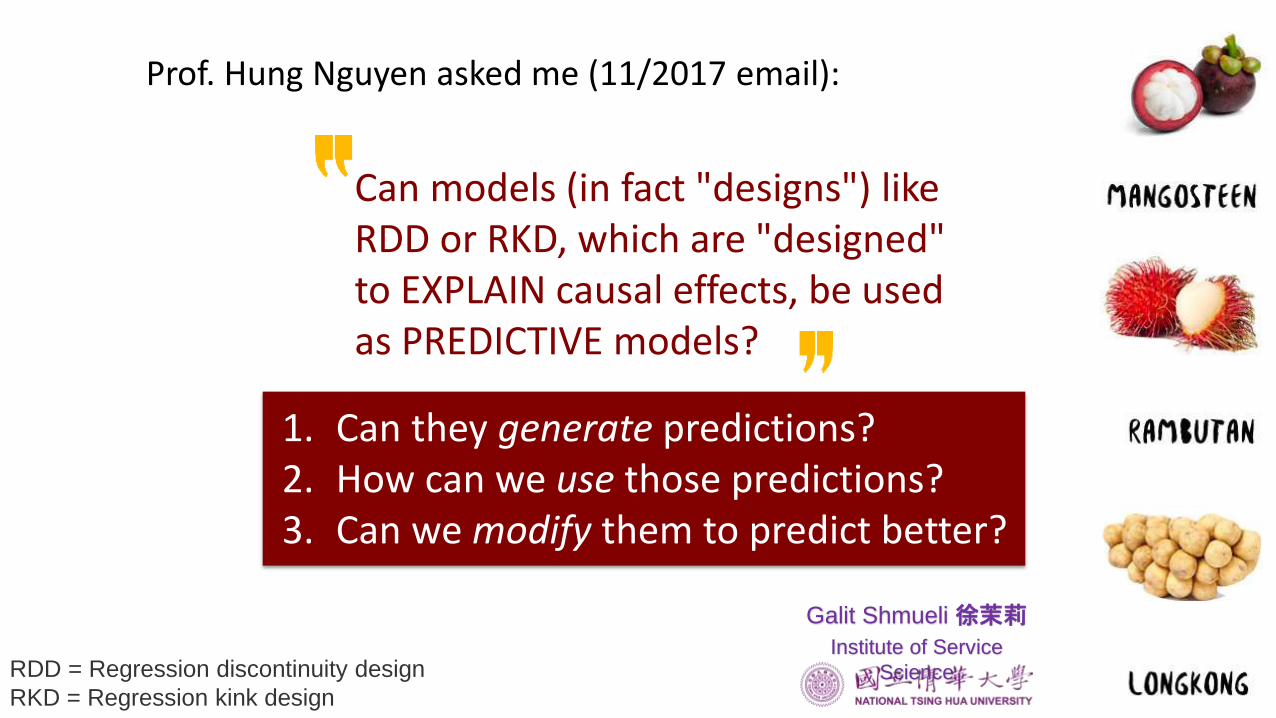
Can models (in fact "designs") like RDD or RKD, which are "designed" to EXPLAIN causal effects, be used as PREDICTIVE models?
RDD = Regression discontinuity design
RKD = Regression kink design
Prof. Hung Nguyen asked me (11/2017 email):
1. Can they generate predictions?2. How can we use those predictions?3. Can we modify them to predict better?
Galit Shmueli徐茉莉
Institute of Service
Science