Embed Size (px)
Citation preview
- 2 -
א א א א א א א א אא א א א א א א א אא ، א، ، א""אא""""אא""، א א אא א א א
א א א אא א א ..א
���������� ������������������� !"�#$%&$'($&)*+,
-�./&0$* +12*�2�3456!"�78��9:;<�9:=�>?<@ABCDE�FG��H
I JH�#*&)K:=LM�N;O�MPN�QR8
The designations employed and the presentation of material in this document do not imply the expression of anyopinion whatsoever on the part of FAO, concerning the legal status of any country, territory, city or area or ofits authorities or concerning the delimitation of frontiers or boundaries. The designations “developed” and“developing economies” are intended for statistical convenience and do not necessarily express a judgement aboutthe stage reached by a particular country or area in the development process.
Les appellations employées dans ce document et la présentationdes données qui y figurent n’impliquent, de lapart part de la FAO, aucune prise de position quant au statut juridique des pays, territoires, villes ou zones, ou deleurs autorités, ni quant au tracé de leurs frontières ou limites. Les expressions “développée” et “pays endéveloppement” son utilisées pour des raisons de ommodité statistique et n’expriment pas nécessairement unjugement quant au niveau de développement atteint par tel pays ou région.
Las denominaciones empleadas en este documento y la forma en que aparecen presentados los datos que contieneno implican, por parte de la FAO, juicio alguno sobre la condición jurídica de ninguno de los países, territorios,ciudades o zonas, o de sus autoridades, ni respecto de la delimitación de sus fronteras o límites. Las definicionesde economías “desarrolladas” y “en desarrollo” se usan para fines estadísticos y no representan un juicio acercadel nevel alcanzado en el proceso de desarrollo por un país o área determinados.
SYMBOLS - SYMBOLES - SIMBOLOS - א - ��
- None or negligible; Néant ou négligeable; Nada o cantidad insignificante.
;�������
. . . Not specified; Reinseignements non spécifiés; Datos no especificados.
�;א��
* Secretariat estimate; Estimation du Secrétariat; Estimación de la Secreteria
א א ; �����
Jute data in bales are converted at 180 kg per bale;Les ciffres de jute en balles sont convertis au taux de 180 kg par balle;Las cifras de yute correspondientes a las balas han sido multiplicados por 180 kg por bala;
א אא ١٨٠١٨٠א��������������180�� !
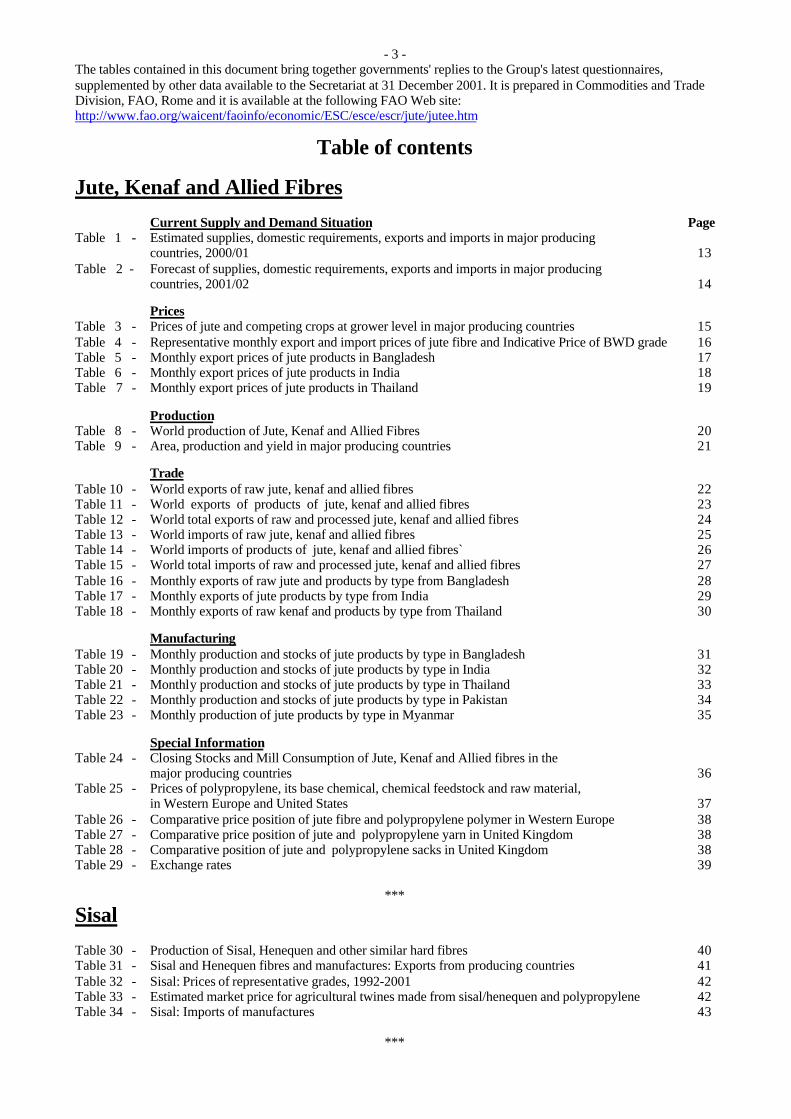
- 3 -The tables contained in this document bring together governments' replies to the Group's latest questionnaires,supplemented by other data available to the Secretariat at 31 December 2001. It is prepared in Commodities and TradeDivision, FAO, Rome and it is available at the following FAO Web site:http://www.fao.org/waicent/faoinfo/economic/ESC/esce/escr/jute/jutee.htm
Table of contents
Jute, Kenaf and Allied FibresCurrent Supply and Demand Situation Page
Table 1 - Estimated supplies, domestic requirements, exports and imports in major producing countries, 2000/01 13
Table 2 - Forecast of supplies, domestic requirements, exports and imports in major producing countries, 2001/02 14
PricesTable 3 - Prices of jute and competing crops at grower level in major producing countries 15Table 4 - Representative monthly export and import prices of jute fibre and Indicative Price of BWD grade 16Table 5 - Monthly export prices of jute products in Bangladesh 17Table 6 - Monthly export prices of jute products in India 18Table 7 - Monthly export prices of jute products in Thailand 19
ProductionTable 8 - World production of Jute, Kenaf and Allied Fibres 20Table 9 - Area, production and yield in major producing countries 21
TradeTable 10 - World exports of raw jute, kenaf and allied fibres 22Table 11 - World exports of products of jute, kenaf and allied fibres 23Table 12 - World total exports of raw and processed jute, kenaf and allied fibres 24Table 13 - World imports of raw jute, kenaf and allied fibres 25Table 14 - World imports of products of jute, kenaf and allied fibres` 26Table 15 - World total imports of raw and processed jute, kenaf and allied fibres 27Table 16 - Monthly exports of raw jute and products by type from Bangladesh 28Table 17 - Monthly exports of jute products by type from India 29Table 18 - Monthly exports of raw kenaf and products by type from Thailand 30
ManufacturingTable 19 - Monthly production and stocks of jute products by type in Bangladesh 31Table 20 - Monthly production and stocks of jute products by type in India 32Table 21 - Monthly production and stocks of jute products by type in Thailand 33Table 22 - Monthly production and stocks of jute products by type in Pakistan 34Table 23 - Monthly production of jute products by type in Myanmar 35
Special InformationTable 24 - Closing Stocks and Mill Consumption of Jute, Kenaf and Allied fibres in the
major producing countries 36Table 25 - Prices of polypropylene, its base chemical, chemical feedstock and raw material,
in Western Europe and United States 37Table 26 - Comparative price position of jute fibre and polypropylene polymer in Western Europe 38Table 27 - Comparative price position of jute and polypropylene yarn in United Kingdom 38Table 28 - Comparative position of jute and polypropylene sacks in United Kingdom 38Table 29 - Exchange rates 39
***
SisalTable 30 - Production of Sisal, Henequen and other similar hard fibres 40Table 31 - Sisal and Henequen fibres and manufactures: Exports from producing countries 41Table 32 - Sisal: Prices of representative grades, 1992-2001 42Table 33 - Estimated market price for agricultural twines made from sisal/henequen and polypropylene 42Table 34 - Sisal: Imports of manufactures 43
***
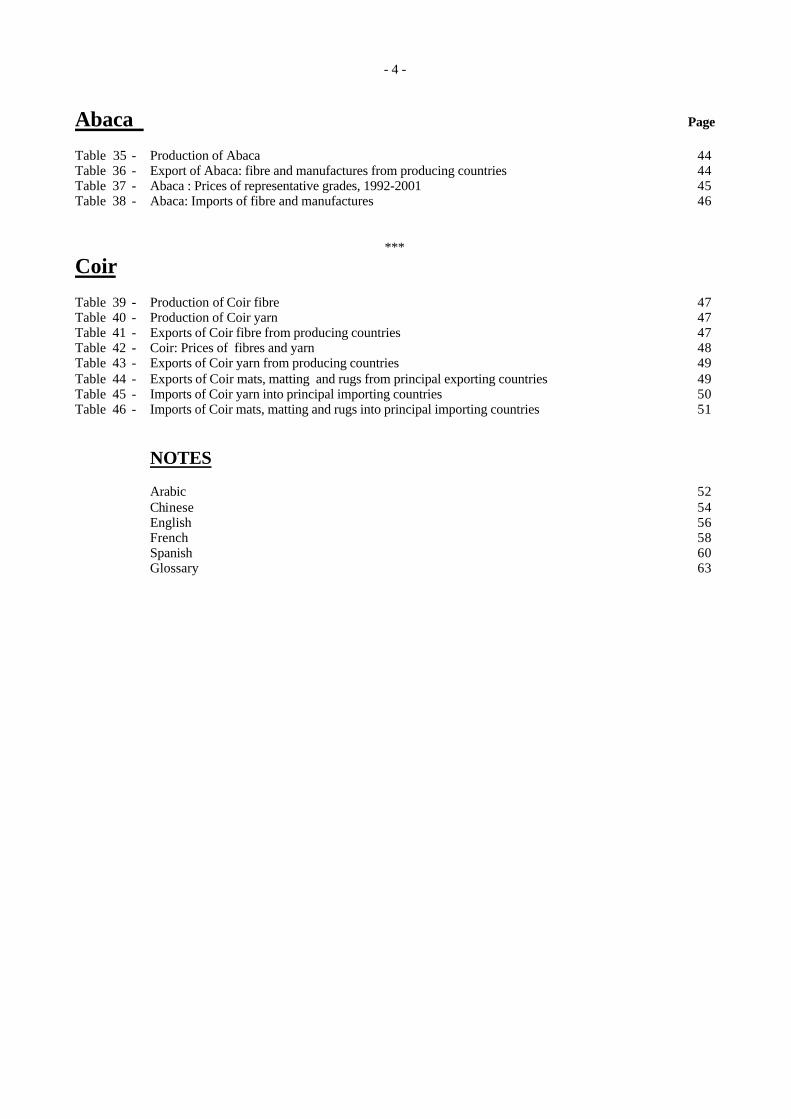
- 4 -
Abaca Page
Table 35 - Production of Abaca 44Table 36 - Export of Abaca: fibre and manufactures from producing countries 44Table 37 - Abaca : Prices of representative grades, 1992-2001 45Table 38 - Abaca: Imports of fibre and manufactures 46
***
Coir
Table 39 - Production of Coir fibre 47Table 40 - Production of Coir yarn 47Table 41 - Exports of Coir fibre from producing countries 47Table 42 - Coir: Prices of fibres and yarn 48Table 43 - Exports of Coir yarn from producing countries 49Table 44 - Exports of Coir mats, matting and rugs from principal exporting countries 49Table 45 - Imports of Coir yarn into principal importing countries 50Table 46 - Imports of Coir mats, matting and rugs into principal importing countries 51
NOTES
Arabic 52Chinese 54English 56French 58Spanish 60Glossary 63
- 5 -
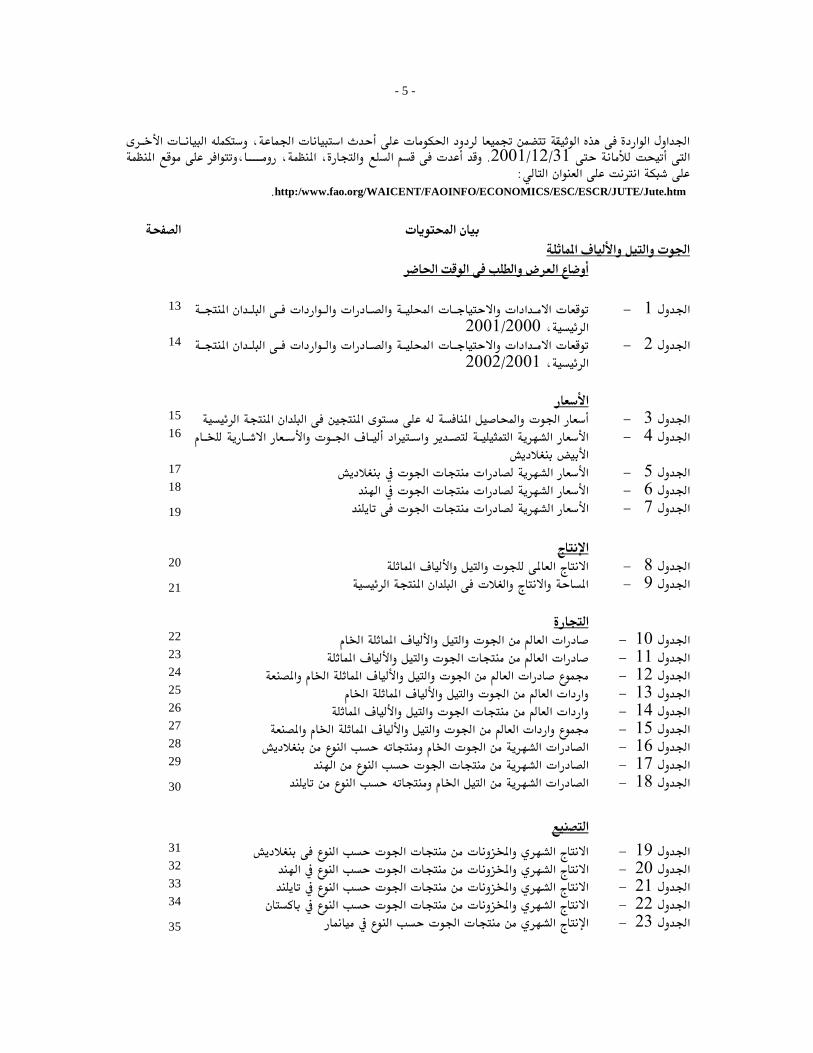
א א ، א א א א א א א אא.31/12/2001א א ، ، א ، א א
א א :אאhttp:/www.fao.org/WAICENT/FAOINFO/ECONOMICS/ESC/ESCR/JUTE/Jute.htm.
א אא א א א
א א א א
13 א א א א א א א א א א א א א2000/2001،א
−1א14 א א א א א א א א א א א א א
، 2001/2002א−2א
א15 א א א א א א א א −3א16 א א א א א א א א
א−4א
17 א א א א −5א18 א א א א א −6א19 א אא א −7א
א20 א א א א א −8א21 א א א א א א א −9א
א22 א א א א אא א −10א23 א א א א א א −11א24 א א א א א א א א −12א25 א א א א א א א א −13א26 א א א א א א א −14א27 א א א א א א א א א −15א28 א א א א א א −16א29 א א אא א א −17א30 א א א א א א −18א
א31 א א א א א −19א32 א א אא א א −20א33 א א א א א −21א34 א א א א א −22א35 א א א א −23א
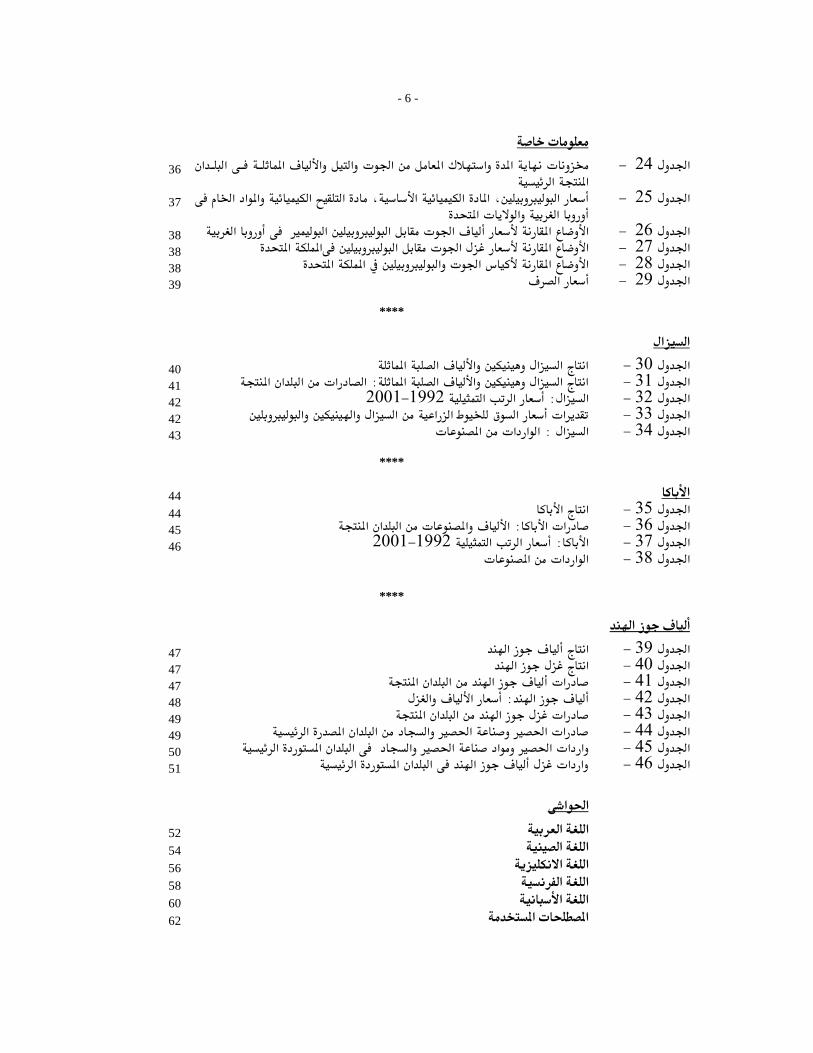
- 6 -
36 א א א א א א אא אא א
−24א
37 א א א א א ، א א א ، אא א א
−25א
38 א אא א א א −26א38 א אא א א א −27א38 א אא א א א −28א39 א −29א
****
א א40 א א א א א א −30א41 א א א א א א:א א א א א −31א42 א א:א 1992−2001א −32א42 א א א א א א אא −33א43 א א:א א א א −34א
****
44 א44 א א −35א45 א א:א א א א א −36א46 א:א 1992−2001א −37א
א א א א −38א
****
א47 א א −39א47 אא −40א47 א א א א א −41א48 א:א א −42א49 א א א א א −43א49 א א א א א א א א −44א50 א א א א א א א א א א −45א51 א א א א א א א −46א
א א52 א א54 א א56 א א58 א א60 א א62 א א
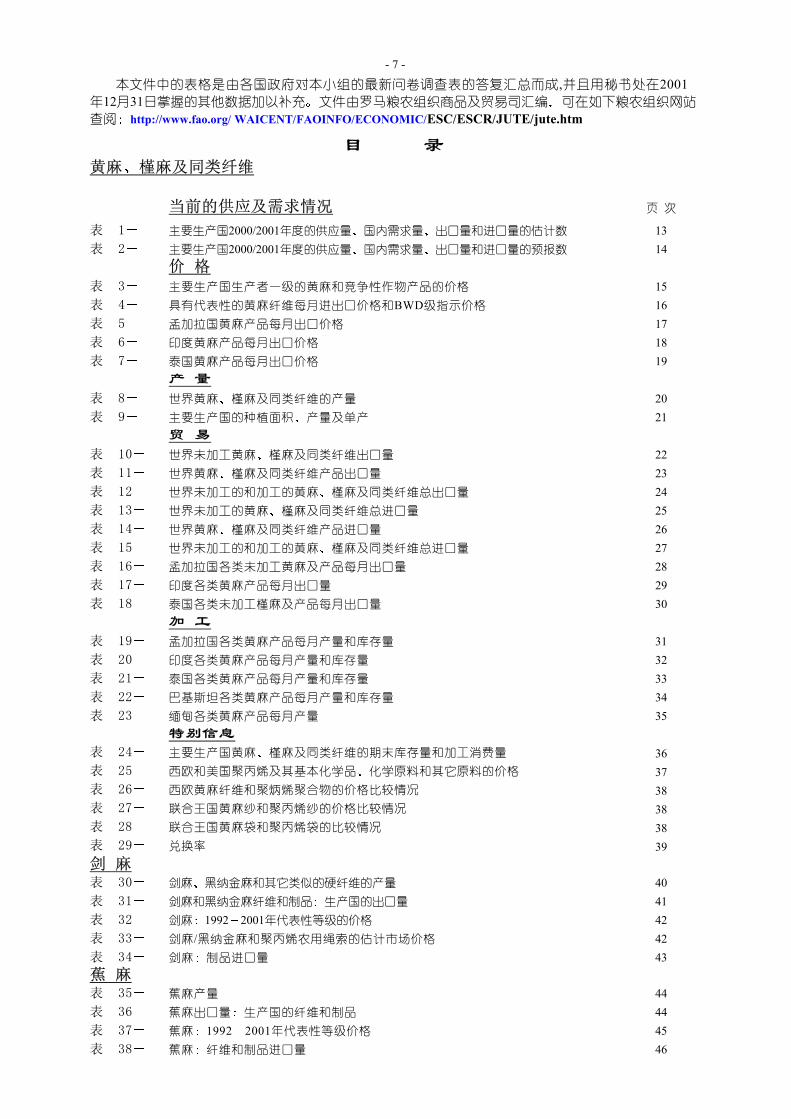
- 7 -
本文件中的表格是由各国政府对本小组的最新问卷调查表的答复汇总而成,并且用秘书处在2001年12月31日掌握的其他数据加以补充 文件由罗马粮农组织商品及贸易司汇编 可在如下粮农组织网站
查阅 http://www.fao.org/ WAICENT/FAOINFO/ECONOMIC/ESC/ESCR/JUTE/jute.htm
目 录黄麻 槿麻及同类纤维
当前的供应及需求情况 页 次
表 1 主要生产国2000/2001年度的供应量 国内需求量 出口量和进口量的估计数 13
表 2 主要生产国2000/2001年度的供应量 国内需求量 出口量和进口量的预报数 14
价 格表 3 主要生产国生产者一级的黄麻和竞争性作物产品的价格 15
表 4 具有代表性的黄麻纤维每月进出口价格和BWD级指示价格 16
表 5 孟加拉国黄麻产品每月出口价格 17
表 6 印度黄麻产品每月出口价格 18
表 7 泰国黄麻产品每月出口价格 19
产 量表 8 世界黄麻 槿麻及同类纤维的产量 20
表 9 主要生产国的种植面积 产量及单产 21
贸 易表 10 世界未加工黄麻 槿麻及同类纤维出口量 22
表 11 世界黄麻 槿麻及同类纤维产品出口量 23
表 12 世界未加工的和加工的黄麻 槿麻及同类纤维总出口量 24
表 13 世界未加工的黄麻 槿麻及同类纤维总进口量 25
表 14 世界黄麻 槿麻及同类纤维产品进口量 26
表 15 世界未加工的和加工的黄麻 槿麻及同类纤维总进口量 27
表 16 孟加拉国各类未加工黄麻及产品每月出口量 28
表 17 印度各类黄麻产品每月出口量 29
表 18 泰国各类未加工槿麻及产品每月出口量 30
加 工表 19 孟加拉国各类黄麻产品每月产量和库存量 31
表 20 印度各类黄麻产品每月产量和库存量 32
表 21 泰国各类黄麻产品每月产量和库存量 33
表 22 巴基斯坦各类黄麻产品每月产量和库存量 34
表 23 缅甸各类黄麻产品每月产量 35
特别信息表 24 主要生产国黄麻 槿麻及同类纤维的期末库存量和加工消费量 36
表 25 西欧和美国聚丙烯及其基本化学品 化学原料和其它原料的价格 37
表 26 西欧黄麻纤维和聚炳烯聚合物的价格比较情况 38
表 27 联合王国黄麻纱和聚丙烯纱的价格比较情况 38
表 28 联合王国黄麻袋和聚丙烯袋的比较情况 38
表 29 兑换率 39
剑 麻表 30 剑麻 黑纳金麻和其它类似的硬纤维的产量 40
表 31 剑麻和黑纳金麻纤维和制品 生产国的出口量 41
表 32 剑麻 1992 2001年代表性等级的价格 42
表 33 剑麻/黑纳金麻和聚丙烯农用绳索的估计市场价格 42
表 34 剑麻 制品进口量 43
蕉 麻表 35 蕉麻产量 44
表 36 蕉麻出口量 生产国的纤维和制品 44
表 37 蕉麻 1992 2001年代表性等级价格 45
表 38 蕉麻 纤维和制品进口量 46
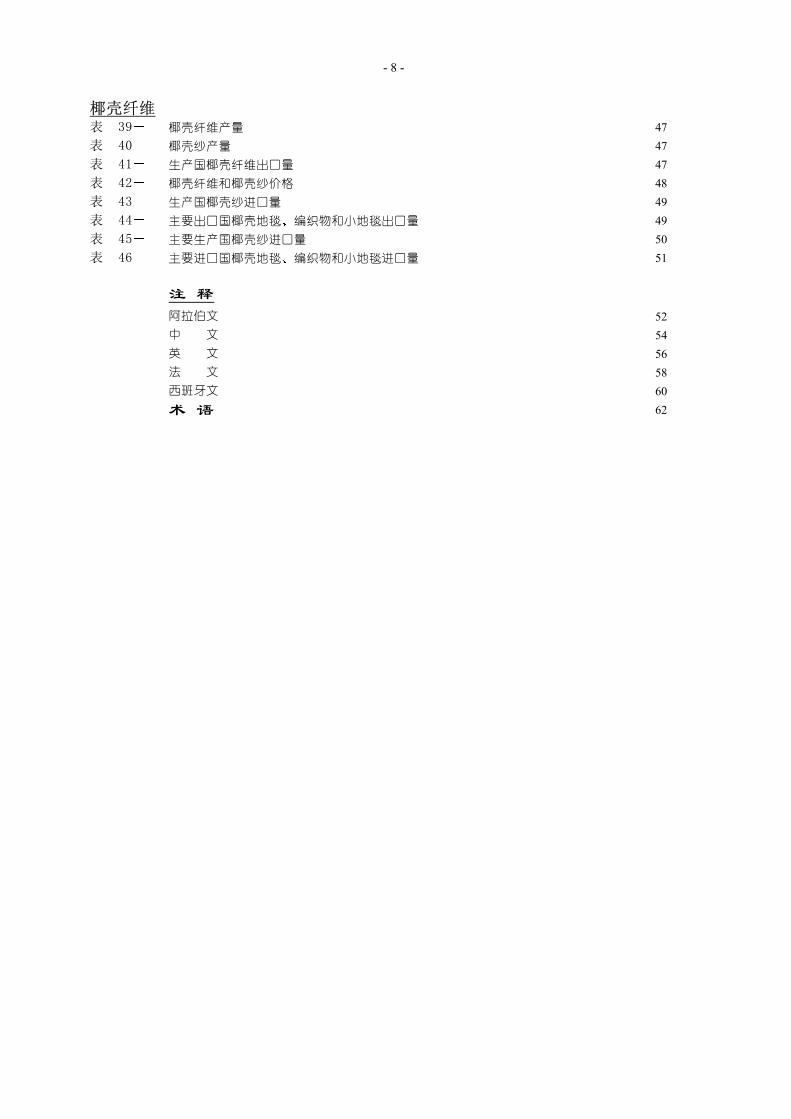
- 8 -
椰壳纤维表 39 椰壳纤维产量 47
表 40 椰壳纱产量 47
表 41 生产国椰壳纤维出口量 47
表 42 椰壳纤维和椰壳纱价格 48
表 43 生产国椰壳纱进口量 49
表 44 主要出口国椰壳地毯 编织物和小地毯出口量 49
表 45 主要生产国椰壳纱进口量 50
表 46 主要进口国椰壳地毯 编织物和小地毯进口量 51
注 释阿拉伯文 52
中 文 54
英 文 56
法 文 58
西班牙文 60
术 语 62
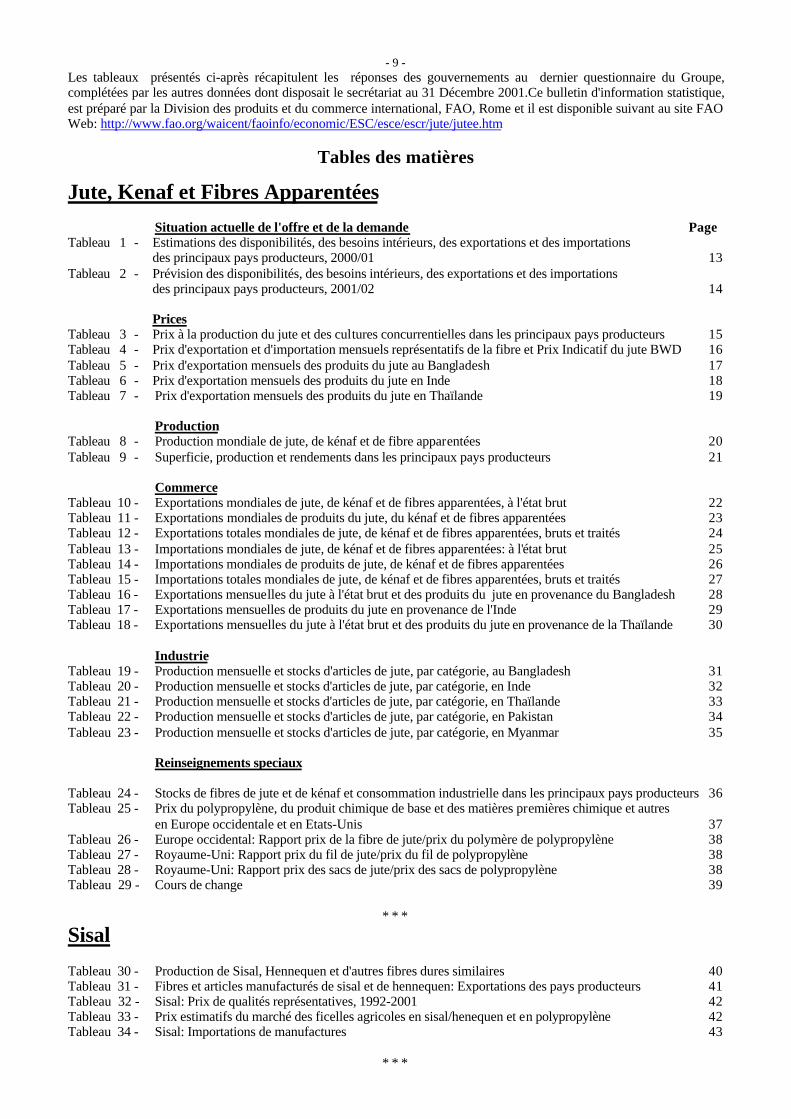
- 9 -Les tableaux présentés ci-après récapitulent les réponses des gouvernements au dernier questionnaire du Groupe,complétées par les autres données dont disposait le secrétariat au 31 Décembre 2001.Ce bulletin d'information statistique,est préparé par la Division des produits et du commerce international, FAO, Rome et il est disponible suivant au site FAOWeb: http://www.fao.org/waicent/faoinfo/economic/ESC/esce/escr/jute/jutee.htm
Tables des matières
Jute, Kenaf et Fibres ApparentéesSituation actuelle de l'offre et de la demande Page
Tableau 1 - Estimations des disponibilités, des besoins intérieurs, des exportations et des importationsdes principaux pays producteurs, 2000/01 13
Tableau 2 - Prévision des disponibilités, des besoins intérieurs, des exportations et des importationsdes principaux pays producteurs, 2001/02 14
PricesTableau 3 - Prix à la production du jute et des cultures concurrentielles dans les principaux pays producteurs 15Tableau 4 - Prix d'exportation et d'importation mensuels représentatifs de la fibre et Prix Indicatif du jute BWD 16Tableau 5 - Prix d'exportation mensuels des produits du jute au Bangladesh 17Tableau 6 - Prix d'exportation mensuels des produits du jute en Inde 18Tableau 7 - Prix d'exportation mensuels des produits du jute en Thaïlande 19
ProductionTableau 8 - Production mondiale de jute, de kénaf et de fibre apparentées 20Tableau 9 - Superficie, production et rendements dans les principaux pays producteurs 21
CommerceTableau 10 - Exportations mondiales de jute, de kénaf et de fibres apparentées, à l'état brut 22Tableau 11 - Exportations mondiales de produits du jute, du kénaf et de fibres apparentées 23Tableau 12 - Exportations totales mondiales de jute, de kénaf et de fibres apparentées, bruts et traités 24Tableau 13 - Importations mondiales de jute, de kénaf et de fibres apparentées: à l'état brut 25Tableau 14 - Importations mondiales de produits de jute, de kénaf et de fibres apparentées 26Tableau 15 - Importations totales mondiales de jute, de kénaf et de fibres apparentées, bruts et traités 27Tableau 16 - Exportations mensuelles du jute à l'état brut et des produits du jute en provenance du Bangladesh 28Tableau 17 - Exportations mensuelles de produits du jute en provenance de l'Inde 29Tableau 18 - Exportations mensuelles du jute à l'état brut et des produits du jute en provenance de la Thaïlande 30
IndustrieTableau 19 - Production mensuelle et stocks d'articles de jute, par catégorie, au Bangladesh 31Tableau 20 - Production mensuelle et stocks d'articles de jute, par catégorie, en Inde 32Tableau 21 - Production mensuelle et stocks d'articles de jute, par catégorie, en Thaïlande 33Tableau 22 - Production mensuelle et stocks d'articles de jute, par catégorie, en Pakistan 34Tableau 23 - Production mensuelle et stocks d'articles de jute, par catégorie, en Myanmar 35
Reinseignements speciaux
Tableau 24 - Stocks de fibres de jute et de kénaf et consommation industrielle dans les principaux pays producteurs 36Tableau 25 - Prix du polypropylène, du produit chimique de base et des matières premières chimique et autres
en Europe occidentale et en Etats-Unis 37Tableau 26 - Europe occidental: Rapport prix de la fibre de jute/prix du polymère de polypropylène 38Tableau 27 - Royaume-Uni: Rapport prix du fil de jute/prix du fil de polypropylène 38Tableau 28 - Royaume-Uni: Rapport prix des sacs de jute/prix des sacs de polypropylène 38Tableau 29 - Cours de change 39
* * *
Sisal
Tableau 30 - Production de Sisal, Hennequen et d'autres fibres dures similaires 40Tableau 31 - Fibres et articles manufacturés de sisal et de hennequen: Exportations des pays producteurs 41Tableau 32 - Sisal: Prix de qualités représentatives, 1992-2001 42Tableau 33 - Prix estimatifs du marché des ficelles agricoles en sisal/henequen et en polypropylène 42Tableau 34 - Sisal: Importations de manufactures 43
* * *
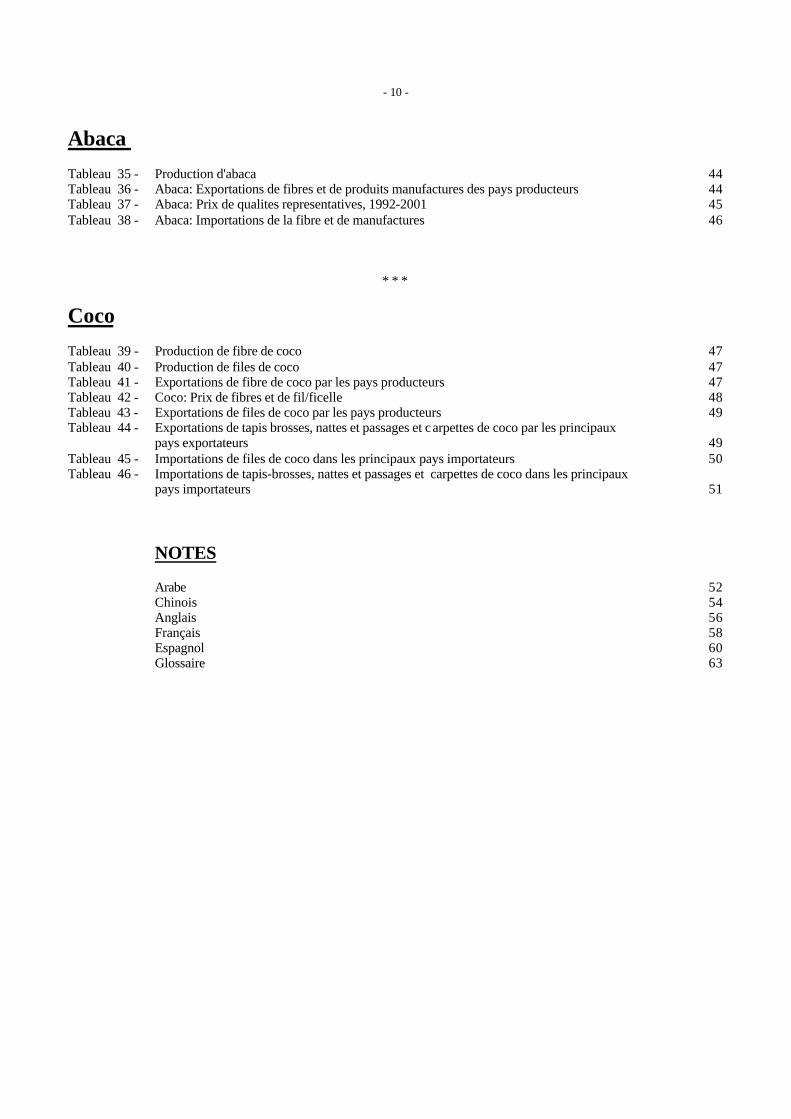
- 10 -
Abaca Tableau 35 - Production d'abaca 44Tableau 36 - Abaca: Exportations de fibres et de produits manufactures des pays producteurs 44Tableau 37 - Abaca: Prix de qualites representatives, 1992-2001 45Tableau 38 - Abaca: Importations de la fibre et de manufactures 46
* * *
CocoTableau 39 - Production de fibre de coco 47Tableau 40 - Production de files de coco 47Tableau 41 - Exportations de fibre de coco par les pays producteurs 47Tableau 42 - Coco: Prix de fibres et de fil/ficelle 48Tableau 43 - Exportations de files de coco par les pays producteurs 49Tableau 44 - Exportations de tapis brosses, nattes et passages et carpettes de coco par les principaux
pays exportateurs 49Tableau 45 - Importations de files de coco dans les principaux pays importateurs 50Tableau 46 - Importations de tapis-brosses, nattes et passages et carpettes de coco dans les principaux
pays importateurs 51
NOTES
Arabe 52Chinois 54Anglais 56Français 58Espagnol 60Glossaire 63
- 11 -
Los cuadros contenidos en este documento reúnen las respuestas de los Gobiernos al último cuestionario del Grupo,complementados concuestionario del Grupo, complementados con otros datos de que disponía la Secretaría al 31 dediciembre 2001. La presente hoja de información estadística, está preparada por la Dirección de Productos Básicos yCommercio, FAO, Roma y está disponible en el siguiente FAO Web sitehttp://www.fao.org/waicent/faoinfo/economic/ESC/esce/escr/jute/jutee.htm
Indice
Yute, Kenaf y Fibras AfinesSituación actual de la oferta y de la demanda Pagina
Cuadro 1 - Estimaciones de los suministros, las necesidades internas, las exportaciones y las importacionesde los principales países productores, 2000/01 9
Cuadro 2 - Pronósticos de los suministros, las necesidades internas, las exportaciones y las importacionesde los principales países productores, 2001/02 10
Precios Cuadro 3 - Precios al productor del yute y los cultivos que compiten con el yute en los principales países
productores 11Cuadro 4 - Precios mensuales representativos de exportación de la fibra y precio Indicativo de yute BWD 12Cuadro 5 - Precios mensuales de exportación de productos de yute, en Bangladesh 13Cuadro 6 - Precios mensuales de exportación de productos de yute, en la India 14Cuadro 7 - Precios mensuales de exportación de productos de yute, en Tailandia 15
ProducciónCuadro 8 - Producción mundial de yute, kenaf y fibras afines 16Cuadro 9 - Superficie, producción y rendimientos en los principales países productores 17
ComercioCuadro 10 - Exportaciones mundiales de yute, kenaf y fibras afines en bruto 18Cuadro 11 - Exportaciones mundiales de productos de yute, kenaf y fibras afines 19Cuadro 12 - Exportaciones totales mundiales de yute, kenaf y fibras afines en bruto y elaboradas 20Cuadro 13 - Importaciones mundiales de yute, kenaf y fibras afines en bruto 21Cuadro 14 - Importaciones mundiales de productos de yute, kenaf y fibras afines 22Cuadro 15 - Importaciones totales mundiales de yute, kenaf y fibras afines en bruto y elaboradas 23Cuadro 16 - Exportaciones mensuales de yute en bruto y elaboradas, por tipos, de Bangladesh 24Cuadro 17 - Exportaciones mensuales de productos de yute, por tipos, de la India 25Cuadro 18 - Exportaciones mensuales de yute en bruto y elaboradas, por tipos, de la Thaïlande 30
ManufacturasCuadro 19 - Producción y existencias mensual de artículos de yute, por tipos, en Bangladesh 31Cuadro 20 - Producción y existencias mensual de artículos de yute, por tipos, en la India 32Cuadro 21 - Producción y existencias mensual de artículos de yute, por tipos, en la Tailandia 33Cuadro 22 - Producción y existencias mensual de artículos de yute, por tipos, en Pakistan 34Cuadro 23 - Producción y existencias mensual de artículos de yute, por tipos, en Myanmar 35
Special InformationCuadro 24 - Existencias de fibra de yute y de kenaf y consumo en las fábricas de los principales
países productores 36Cuadro 25 - Precios de polipropileno, de sus productos químicos básicos y de sus materias primas en
Europa occidental y en Estados Unidos 37Cuadro 26 - Europa occidental: Situación comparativa de la fibra del yute y del polímero de polipropileno 38Cuadro 27 - Reino Unido: Situación comparativa entre el hilo de yute y el de polipropileno 38Cuadro 28 - Reino Unido: Situación comparativa entre los sacos de yute y les de polipropileno 38Cuadro 29 - Tipo de cambio 39
* * *
Sisal
Cuadro 30 - Producción de Sisal, Henequén y de otras fibras duras similares 40Cuadro 31 - Fibras y manufacturas de sisal y de henequén: Exportaciones de los países productores 41
- 12 -( Sisal)
Cuadro 32 - Sisal: Precios de las calidades representativas, 1992-2001 42Cuadro 33 - Precios de mercado estimados para los bramantes agricolas de sisal/henequén y de polipopileno 42Cuadro 34 - Sisal : Importaciones de manufacturas 43
* * *
Abaca Cuadro 35 - Producción de abacá 44Cuadro 36 - Abacá: Exportaciones de fibras y manufacturas de los países productores 44Cuadro 37 - Abacá: Precios de las calidades representativas, 1992-2001 45Cuadro 38 - Abacá: Importaciones de fibra y de manufacturas 46
* * *
Bonote
Cuadro 39 - Producción de bonote 47Cuadro 40 - Producción de hilo de bonote 47Cuadro 41 - Exportaciones de bonote de los países productores 47Cuadro 42 - Bonote: Precios de la fibra y de hilo/bramante 48Cuadro 43 - Exportaciones de hilo de bonote de los países productores 49Cuadro 44 - Exportaciones de esteras, material de esterado y alfombras de bonote de los principales
países exportadores 49Cuadro 45 - Importaciones de esteras, material de esterado y alfombras de bonote en los países importadores 50Cuadro 46 - Importaciones de hilo de bonote en los psíses importadores 51
Notas
Arabe 52Chino 54Inglés 56Francés 58Español 60Glosario 63
- 13 -
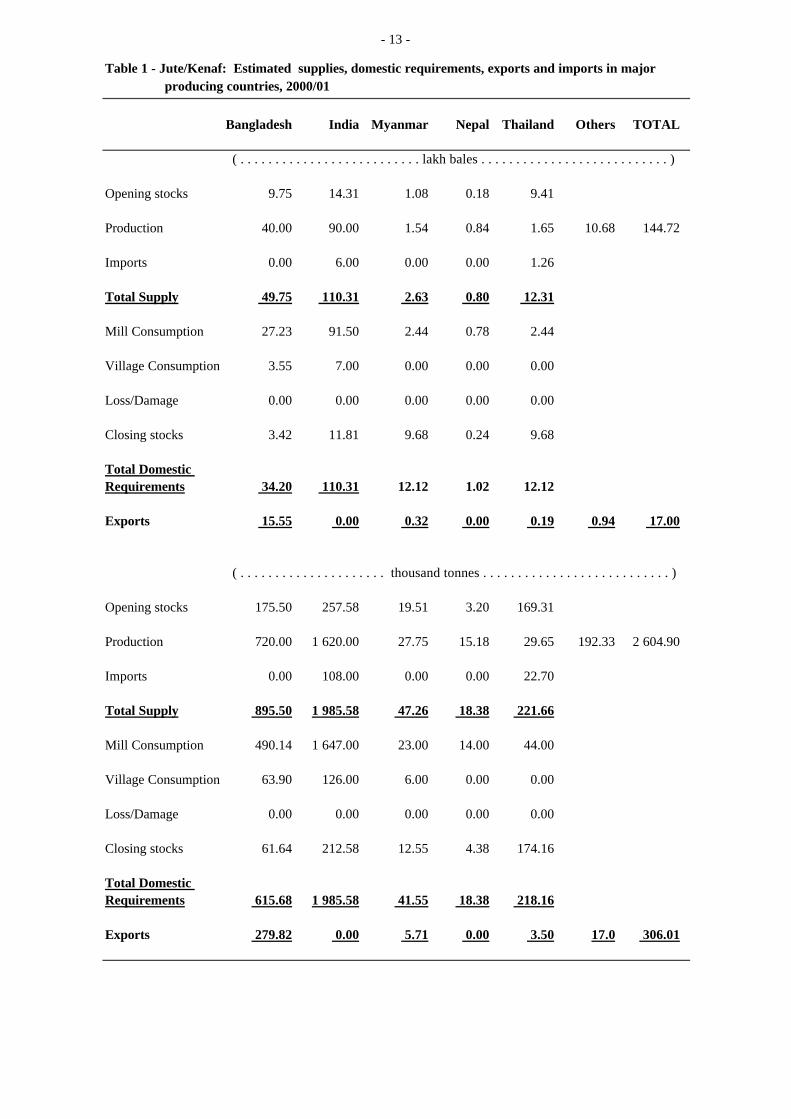
Table 1 - Jute/Kenaf: Estimated supplies, domestic requirements, exports and imports in major producing countries, 2000/01
Bangladesh India Myanmar Nepal Thailand Others TOTAL
( . . . . . . . . . . . . . . . . . . . . . . . . . . lakh bales . . . . . . . . . . . . . . . . . . . . . . . . . . . )
Opening stocks 9.75 14.31 1.08 0.18 9.41
Production 40.00 90.00 1.54 0.84 1.65 10.68 144.72
Imports 0.00 6.00 0.00 0.00 1.26
Total Supply 49.75 110.31 2.63 0.80 12.31
Mill Consumption 27.23 91.50 2.44 0.78 2.44
Village Consumption 3.55 7.00 0.00 0.00 0.00
Loss/Damage 0.00 0.00 0.00 0.00 0.00
Closing stocks 3.42 11.81 9.68 0.24 9.68
Total Domestic Requirements 34.20 110.31 12.12 1.02 12.12 Exports 15.55 0.00 0.32 0.00 0.19 0.94 17.00
( . . . . . . . . . . . . . . . . . . . . . thousand tonnes . . . . . . . . . . . . . . . . . . . . . . . . . . . )
Opening stocks 175.50 257.58 19.51 3.20 169.31
Production 720.00 1 620.00 27.75 15.18 29.65 192.33 2 604.90
Imports 0.00 108.00 0.00 0.00 22.70
Total Supply 895.50 1 985.58 47.26 18.38 221.66
Mill Consumption 490.14 1 647.00 23.00 14.00 44.00
Village Consumption 63.90 126.00 6.00 0.00 0.00
Loss/Damage 0.00 0.00 0.00 0.00 0.00
Closing stocks 61.64 212.58 12.55 4.38 174.16
Total Domestic Requirements 615.68 1 985.58 41.55 18.38 218.16
Exports 279.82 0.00 5.71 0.00 3.50 17.0 306.01
- 14 -
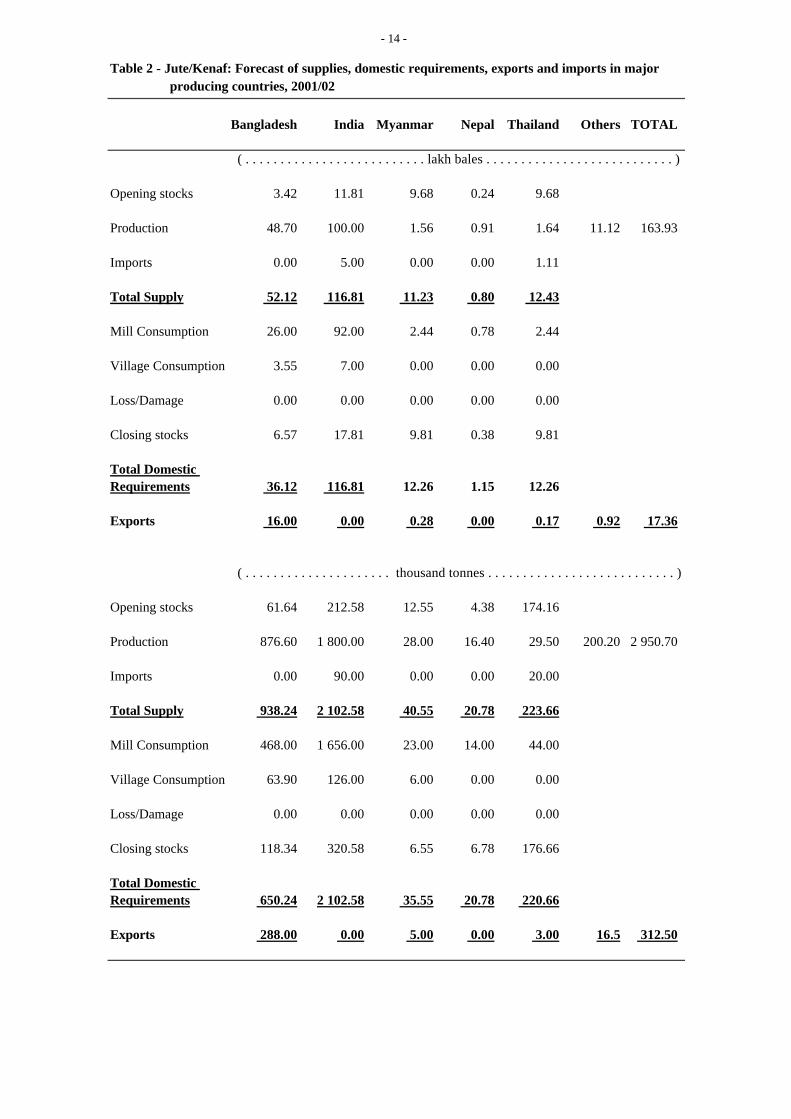
Table 2 - Jute/Kenaf: Forecast of supplies, domestic requirements, exports and imports in major producing countries, 2001/02
Bangladesh India Myanmar Nepal Thailand Others TOTAL
( . . . . . . . . . . . . . . . . . . . . . . . . . . lakh bales . . . . . . . . . . . . . . . . . . . . . . . . . . . )
Opening stocks 3.42 11.81 9.68 0.24 9.68
Production 48.70 100.00 1.56 0.91 1.64 11.12 163.93
Imports 0.00 5.00 0.00 0.00 1.11
Total Supply 52.12 116.81 11.23 0.80 12.43
Mill Consumption 26.00 92.00 2.44 0.78 2.44
Village Consumption 3.55 7.00 0.00 0.00 0.00
Loss/Damage 0.00 0.00 0.00 0.00 0.00
Closing stocks 6.57 17.81 9.81 0.38 9.81
Total Domestic Requirements 36.12 116.81 12.26 1.15 12.26 Exports 16.00 0.00 0.28 0.00 0.17 0.92 17.36
( . . . . . . . . . . . . . . . . . . . . . thousand tonnes . . . . . . . . . . . . . . . . . . . . . . . . . . . )
Opening stocks 61.64 212.58 12.55 4.38 174.16
Production 876.60 1 800.00 28.00 16.40 29.50 200.20 2 950.70
Imports 0.00 90.00 0.00 0.00 20.00
Total Supply 938.24 2 102.58 40.55 20.78 223.66
Mill Consumption 468.00 1 656.00 23.00 14.00 44.00
Village Consumption 63.90 126.00 6.00 0.00 0.00
Loss/Damage 0.00 0.00 0.00 0.00 0.00
Closing stocks 118.34 320.58 6.55 6.78 176.66
Total Domestic Requirements 650.24 2 102.58 35.55 20.78 220.66
Exports 288.00 0.00 5.00 0.00 3.00 16.5 312.50

- 15 -
Table 3 - Prices of jute and competing crops at grower level in major producing countries
BANGLADESH 1/ INDIA THAILAND 4/
Jute Rice Jute 2/ Rice 3/ Jute Cassava . . . Taka/maund . . . . . . Rupees/maund . . . . . . Baht/tonne . . .
1995/96 Season 510.8 458.9 515.4 174.5 10 328 3 0961996/97 Season 367.3 375.5 439.5 . . . 8 720 2 5471997/98 Season 212.9 436.1 235.2 155.4 5 088 2 7261998/99 Season 281.3 517.1 341.8 206.5 6 330 2 882
1999/00 Season 339.0 446.3 360.1 197.4 8 977 2 320
1999 July 330.0 445.7 361.0 222.1 - 2 600August 344.0 455.4 368.4 229.5 - 2 480September 341.0 459.1 341.5 227.7 6 330 2 450October 329.0 459.1 340.8 227.7 - 2 480November 308.0 441.5 344.4 203.4 10 600 2 530December 306.0 424.4 342.2 181.0 10 000 2 490
2000 January 341.0 431.8 374.7 178.2 - 2 150February 348.0 440.8 391.7 169.8 - 2 080March 375.0 454.6 379.4 176.4 - 2 090April 380.0 453.9 375.9 180.1 - 2 090May 327.0 442.7 340.8 175.4 - 2 080June 359.0 436.3 363.9 130.6 - 2 080
2000/01 Season 396.6 432.4 368.9 158.5 11 415 2 0322000 July 334.0 431.1 345.3 138.1 - 1 999
August 311.0 430.7 299.0 153.0 - 1 850September 314.0 430.7 301.0 145.6 - 1 760October 319.0 430.4 318.4 145.6 11 630 1 830November 339.0 428.1 361.7 145.6 10 960 - December 366.0 424.8 382.2 149.3 11 500 -
2001 January 426.0 428.9 384.8 153.0 11 900 2 130February 432.0 430.7 399.8 173.6 11 750 2 090March 448.0 447.5 429.2 177.3 10 750 2 090April 467.0 452.4 468.1 182.9 - 2 070May 496.0 433.3 536.0 179.2 - 2 170June 507.0 420.3 590.8 179.2 - 2 330
2001/02 Season 403.2 426.4 381.0 190.4 2 330
2001 July 487.0 413.9 488.2 182.9 - 2 330August 399.0 418.4 346.0 190.4 - 2 330September 366.0 426.2 336.7 194.1October 299.0 447.1 358.3 192.2November 425.0 375.7 192.2December 443.0
1998 Calendar Year 243.3 507.5 275.4 180.6 6 000 3 1441999 Calendar Year 305.2 479.7 355.3 211.2 8 977 2 6222000 Calendar Year 342.8 436.3 352.8 157.3 11 363 2 001
- 16 -
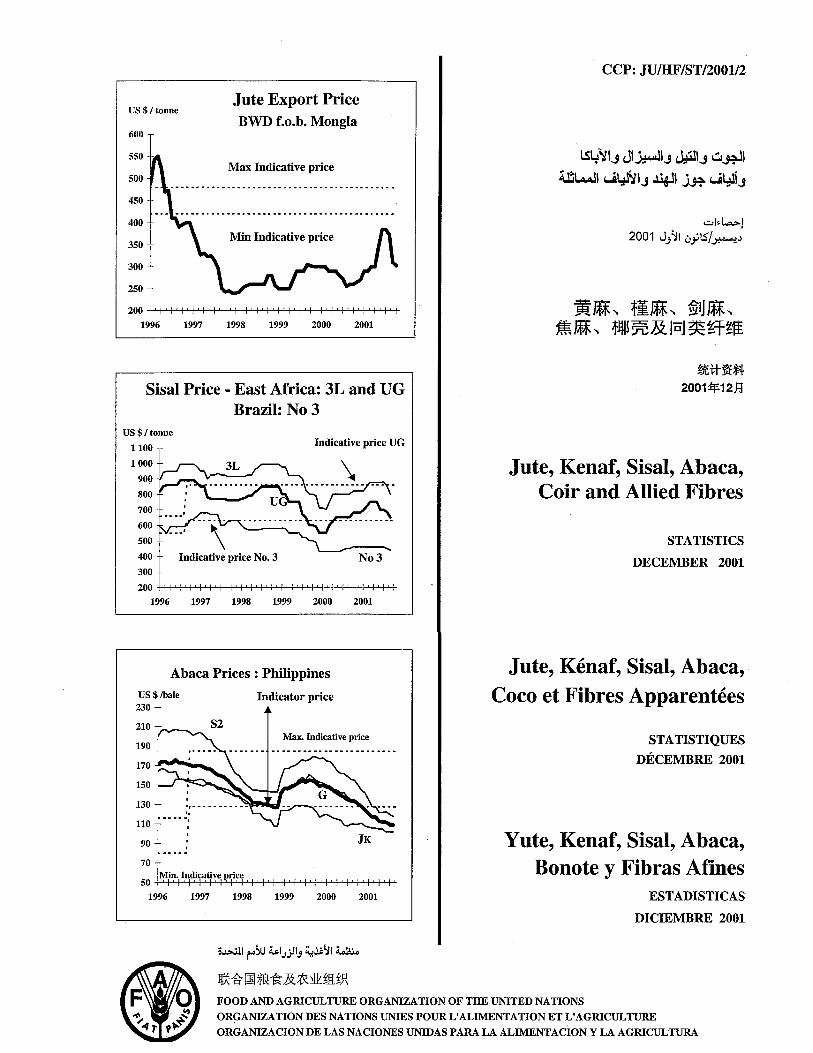
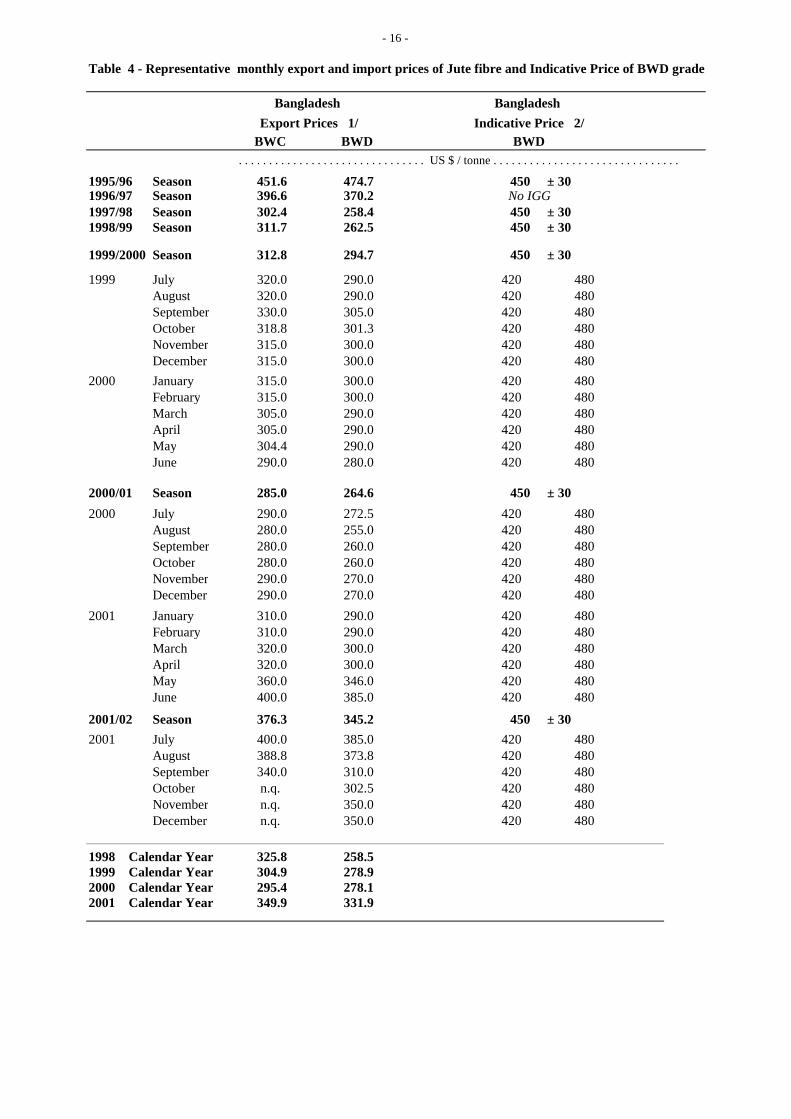
Table 4 - Representative monthly export and import prices of Jute fibre and Indicative Price of BWD grade
Bangladesh Bangladesh Export Prices 1/ Indicative Price 2/
BWC BWD BWD . . . . . . . . . . . . . . . . . . . . . . . . . . . . . . . US $ / tonne . . . . . . . . . . . . . . . . . . . . . . . . . . . . . . .
1995/96 Season 451.6 474.7 450 ± 301996/97 Season 396.6 370.2 No IGG1997/98 Season 302.4 258.4 450 ± 301998/99 Season 311.7 262.5 450 ± 30
1999/2000 Season 312.8 294.7 450 ± 30
1999 July 320.0 290.0 420 480August 320.0 290.0 420 480September 330.0 305.0 420 480October 318.8 301.3 420 480November 315.0 300.0 420 480December 315.0 300.0 420 480
2000 January 315.0 300.0 420 480February 315.0 300.0 420 480March 305.0 290.0 420 480April 305.0 290.0 420 480May 304.4 290.0 420 480June 290.0 280.0 420 480
2000/01 Season 285.0 264.6 450 ± 30
2000 July 290.0 272.5 420 480August 280.0 255.0 420 480September 280.0 260.0 420 480October 280.0 260.0 420 480November 290.0 270.0 420 480December 290.0 270.0 420 480
2001 January 310.0 290.0 420 480February 310.0 290.0 420 480March 320.0 300.0 420 480April 320.0 300.0 420 480May 360.0 346.0 420 480June 400.0 385.0 420 480
2001/02 Season 376.3 345.2 450 ± 302001 July 400.0 385.0 420 480
August 388.8 373.8 420 480September 340.0 310.0 420 480October n.q. 302.5 420 480November n.q. 350.0 420 480December n.q. 350.0 420 480
1998 Calendar Year 325.8 258.51999 Calendar Year 304.9 278.92000 Calendar Year 295.4 278.12001 Calendar Year 349.9 331.9
- 17 -
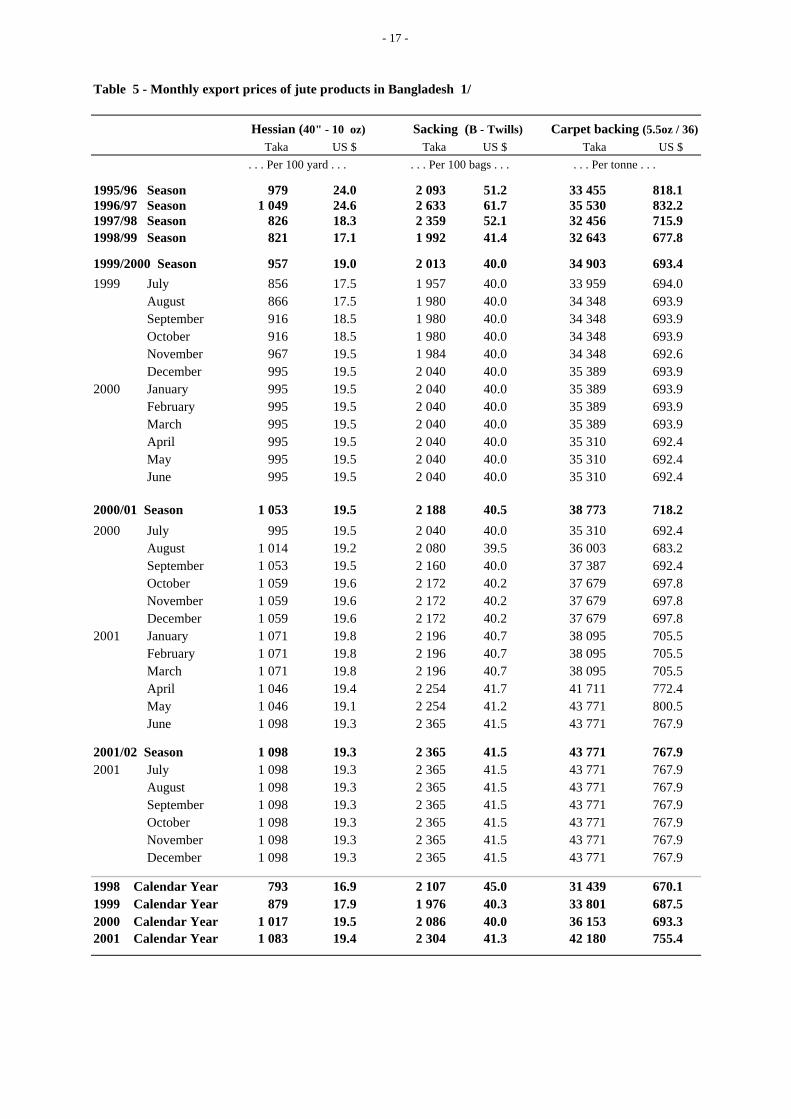
Table 5 - Monthly export prices of jute products in Bangladesh 1/
Hessian (40" - 10 oz) Sacking (B - Twills) Carpet backing (5.5oz / 36)Taka US $ Taka US $ Taka US $
. . . Per 100 yard . . . . . . Per 100 bags . . . . . . Per tonne . . .
1995/96 Season 979 24.0 2 093 51.2 33 455 818.11996/97 Season 1 049 24.6 2 633 61.7 35 530 832.21997/98 Season 826 18.3 2 359 52.1 32 456 715.91998/99 Season 821 17.1 1 992 41.4 32 643 677.8
1999/2000 Season 957 19.0 2 013 40.0 34 903 693.41999 July 856 17.5 1 957 40.0 33 959 694.0
August 866 17.5 1 980 40.0 34 348 693.9September 916 18.5 1 980 40.0 34 348 693.9October 916 18.5 1 980 40.0 34 348 693.9November 967 19.5 1 984 40.0 34 348 692.6December 995 19.5 2 040 40.0 35 389 693.9
2000 January 995 19.5 2 040 40.0 35 389 693.9February 995 19.5 2 040 40.0 35 389 693.9March 995 19.5 2 040 40.0 35 389 693.9April 995 19.5 2 040 40.0 35 310 692.4May 995 19.5 2 040 40.0 35 310 692.4June 995 19.5 2 040 40.0 35 310 692.4
2000/01 Season 1 053 19.5 2 188 40.5 38 773 718.2
2000 July 995 19.5 2 040 40.0 35 310 692.4August 1 014 19.2 2 080 39.5 36 003 683.2September 1 053 19.5 2 160 40.0 37 387 692.4October 1 059 19.6 2 172 40.2 37 679 697.8November 1 059 19.6 2 172 40.2 37 679 697.8December 1 059 19.6 2 172 40.2 37 679 697.8
2001 January 1 071 19.8 2 196 40.7 38 095 705.5February 1 071 19.8 2 196 40.7 38 095 705.5March 1 071 19.8 2 196 40.7 38 095 705.5April 1 046 19.4 2 254 41.7 41 711 772.4May 1 046 19.1 2 254 41.2 43 771 800.5June 1 098 19.3 2 365 41.5 43 771 767.9
2001/02 Season 1 098 19.3 2 365 41.5 43 771 767.92001 July 1 098 19.3 2 365 41.5 43 771 767.9
August 1 098 19.3 2 365 41.5 43 771 767.9September 1 098 19.3 2 365 41.5 43 771 767.9October 1 098 19.3 2 365 41.5 43 771 767.9November 1 098 19.3 2 365 41.5 43 771 767.9December 1 098 19.3 2 365 41.5 43 771 767.9
1998 Calendar Year 793 16.9 2 107 45.0 31 439 670.11999 Calendar Year 879 17.9 1 976 40.3 33 801 687.52000 Calendar Year 1 017 19.5 2 086 40.0 36 153 693.32001 Calendar Year 1 083 19.4 2 304 41.3 42 180 755.4
- 18 -
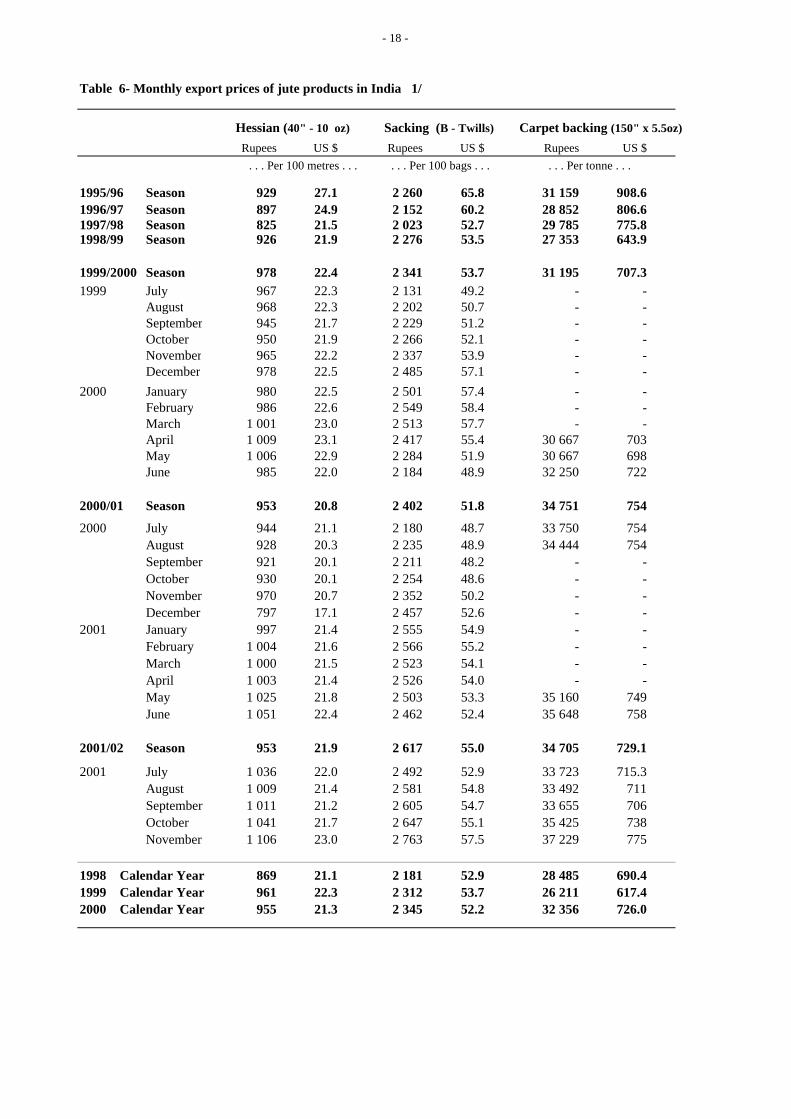
Table 6- Monthly export prices of jute products in India 1/
Hessian (40" - 10 oz) Sacking (B - Twills) Carpet backing (150" x 5.5oz)
Rupees US $ Rupees US $ Rupees US $ . . . Per 100 metres . . . . . . Per 100 bags . . . . . . Per tonne . . .
1995/96 Season 929 27.1 2 260 65.8 31 159 908.61996/97 Season 897 24.9 2 152 60.2 28 852 806.61997/98 Season 825 21.5 2 023 52.7 29 785 775.81998/99 Season 926 21.9 2 276 53.5 27 353 643.9
1999/2000 Season 978 22.4 2 341 53.7 31 195 707.31999 July 967 22.3 2 131 49.2 - -
August 968 22.3 2 202 50.7 - -September 945 21.7 2 229 51.2 - -October 950 21.9 2 266 52.1 - -November 965 22.2 2 337 53.9 - -December 978 22.5 2 485 57.1 - -
2000 January 980 22.5 2 501 57.4 - -February 986 22.6 2 549 58.4 - -March 1 001 23.0 2 513 57.7 - -April 1 009 23.1 2 417 55.4 30 667 703May 1 006 22.9 2 284 51.9 30 667 698June 985 22.0 2 184 48.9 32 250 722
2000/01 Season 953 20.8 2 402 51.8 34 751 754
2000 July 944 21.1 2 180 48.7 33 750 754August 928 20.3 2 235 48.9 34 444 754September 921 20.1 2 211 48.2 - -October 930 20.1 2 254 48.6 - -November 970 20.7 2 352 50.2 - -December 797 17.1 2 457 52.6 - -
2001 January 997 21.4 2 555 54.9 - -February 1 004 21.6 2 566 55.2 - -March 1 000 21.5 2 523 54.1 - -April 1 003 21.4 2 526 54.0 - -May 1 025 21.8 2 503 53.3 35 160 749June 1 051 22.4 2 462 52.4 35 648 758
2001/02 Season 953 21.9 2 617 55.0 34 705 729.1
2001 July 1 036 22.0 2 492 52.9 33 723 715.3August 1 009 21.4 2 581 54.8 33 492 711September 1 011 21.2 2 605 54.7 33 655 706October 1 041 21.7 2 647 55.1 35 425 738November 1 106 23.0 2 763 57.5 37 229 775
1998 Calendar Year 869 21.1 2 181 52.9 28 485 690.41999 Calendar Year 961 22.3 2 312 53.7 26 211 617.42000 Calendar Year 955 21.3 2 345 52.2 32 356 726.0
- 19 -
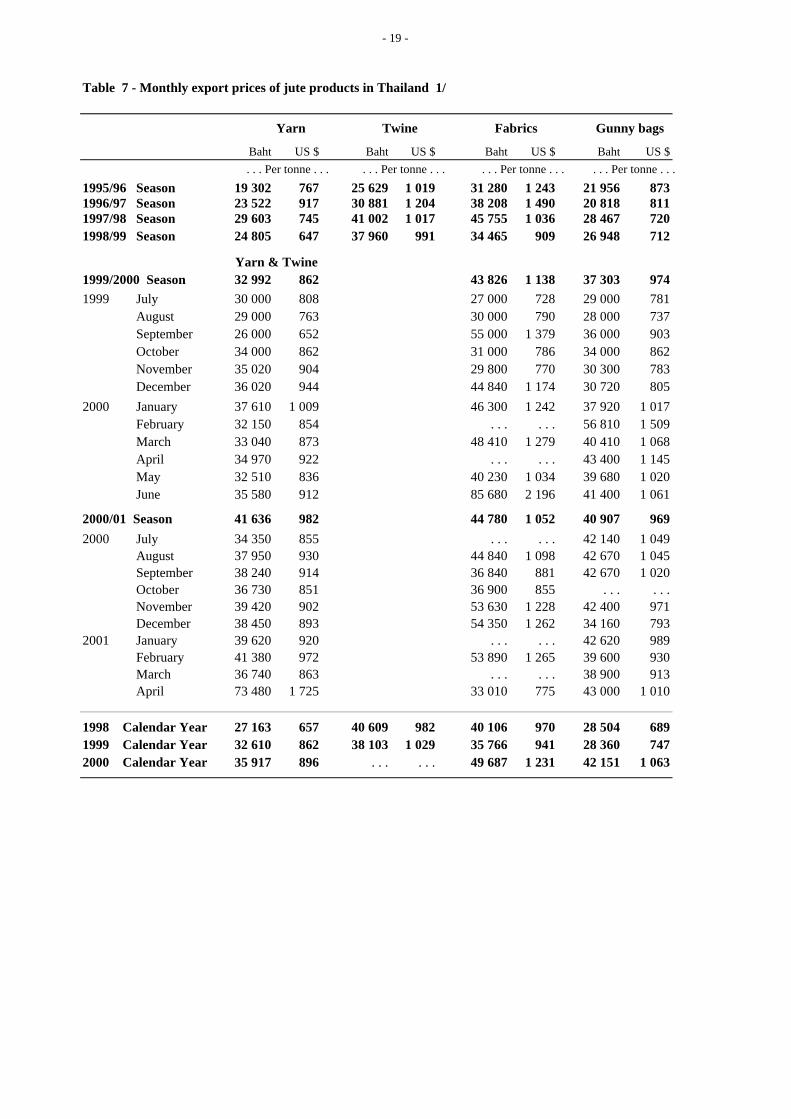
Table 7 - Monthly export prices of jute products in Thailand 1/
Yarn Twine Fabrics Gunny bags
Baht US $ Baht US $ Baht US $ Baht US $ . . . Per tonne . . . . . . Per tonne . . . . . . Per tonne . . . . . . Per tonne . . .
1995/96 Season 19 302 767 25 629 1 019 31 280 1 243 21 956 8731996/97 Season 23 522 917 30 881 1 204 38 208 1 490 20 818 8111997/98 Season 29 603 745 41 002 1 017 45 755 1 036 28 467 7201998/99 Season 24 805 647 37 960 991 34 465 909 26 948 712
Yarn & Twine 1999/2000 Season 32 992 862 43 826 1 138 37 303 9741999 July 30 000 808 27 000 728 29 000 781
August 29 000 763 30 000 790 28 000 737September 26 000 652 55 000 1 379 36 000 903October 34 000 862 31 000 786 34 000 862November 35 020 904 29 800 770 30 300 783December 36 020 944 44 840 1 174 30 720 805
2000 January 37 610 1 009 46 300 1 242 37 920 1 017February 32 150 854 . . . . . . 56 810 1 509March 33 040 873 48 410 1 279 40 410 1 068April 34 970 922 . . . . . . 43 400 1 145May 32 510 836 40 230 1 034 39 680 1 020June 35 580 912 85 680 2 196 41 400 1 061
2000/01 Season 41 636 982 44 780 1 052 40 907 9692000 July 34 350 855 . . . . . . 42 140 1 049
August 37 950 930 44 840 1 098 42 670 1 045September 38 240 914 36 840 881 42 670 1 020October 36 730 851 36 900 855 . . . . . .November 39 420 902 53 630 1 228 42 400 971December 38 450 893 54 350 1 262 34 160 793
2001 January 39 620 920 . . . . . . 42 620 989February 41 380 972 53 890 1 265 39 600 930March 36 740 863 . . . . . . 38 900 913April 73 480 1 725 33 010 775 43 000 1 010
1998 Calendar Year 27 163 657 40 609 982 40 106 970 28 504 6891999 Calendar Year 32 610 862 38 103 1 029 35 766 941 28 360 7472000 Calendar Year 35 917 896 . . . . . . 49 687 1 231 42 151 1 063
- 20 -
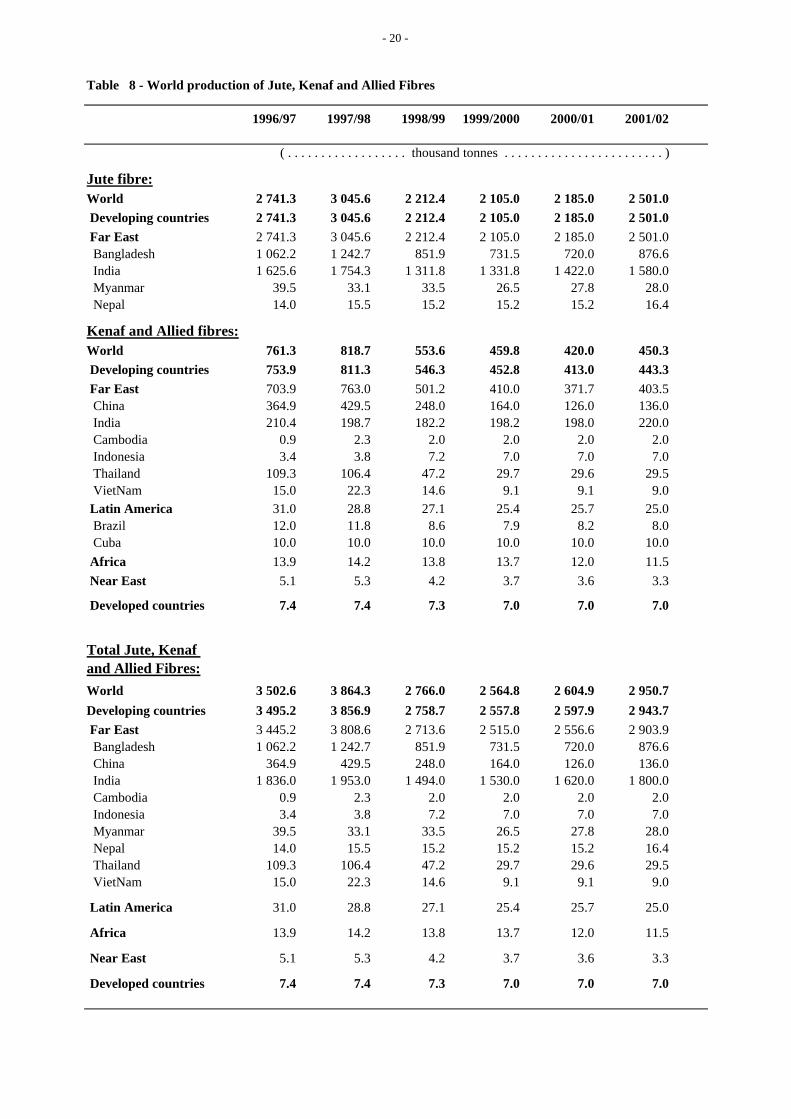
Table 8 - World production of Jute, Kenaf and Allied Fibres
1996/97 1997/98 1998/99 1999/2000 2000/01 2001/02
( . . . . . . . . . . . . . . . . . . thousand tonnes . . . . . . . . . . . . . . . . . . . . . . . . )
Jute fibre:World 2 741.3 3 045.6 2 212.4 2 105.0 2 185.0 2 501.0 Developing countries 2 741.3 3 045.6 2 212.4 2 105.0 2 185.0 2 501.0 Far East 2 741.3 3 045.6 2 212.4 2 105.0 2 185.0 2 501.0 Bangladesh 1 062.2 1 242.7 851.9 731.5 720.0 876.6 India 1 625.6 1 754.3 1 311.8 1 331.8 1 422.0 1 580.0 Myanmar 39.5 33.1 33.5 26.5 27.8 28.0 Nepal 14.0 15.5 15.2 15.2 15.2 16.4
Kenaf and Allied fibres:World 761.3 818.7 553.6 459.8 420.0 450.3 Developing countries 753.9 811.3 546.3 452.8 413.0 443.3 Far East 703.9 763.0 501.2 410.0 371.7 403.5 China 364.9 429.5 248.0 164.0 126.0 136.0 India 210.4 198.7 182.2 198.2 198.0 220.0 Cambodia 0.9 2.3 2.0 2.0 2.0 2.0 Indonesia 3.4 3.8 7.2 7.0 7.0 7.0 Thailand 109.3 106.4 47.2 29.7 29.6 29.5 VietNam 15.0 22.3 14.6 9.1 9.1 9.0 Latin America 31.0 28.8 27.1 25.4 25.7 25.0 Brazil 12.0 11.8 8.6 7.9 8.2 8.0 Cuba 10.0 10.0 10.0 10.0 10.0 10.0 Africa 13.9 14.2 13.8 13.7 12.0 11.5 Near East 5.1 5.3 4.2 3.7 3.6 3.3
Developed countries 7.4 7.4 7.3 7.0 7.0 7.0
Total Jute, Kenaf and Allied Fibres:World 3 502.6 3 864.3 2 766.0 2 564.8 2 604.9 2 950.7Developing countries 3 495.2 3 856.9 2 758.7 2 557.8 2 597.9 2 943.7 Far East 3 445.2 3 808.6 2 713.6 2 515.0 2 556.6 2 903.9 Bangladesh 1 062.2 1 242.7 851.9 731.5 720.0 876.6 China 364.9 429.5 248.0 164.0 126.0 136.0 India 1 836.0 1 953.0 1 494.0 1 530.0 1 620.0 1 800.0 Cambodia 0.9 2.3 2.0 2.0 2.0 2.0 Indonesia 3.4 3.8 7.2 7.0 7.0 7.0 Myanmar 39.5 33.1 33.5 26.5 27.8 28.0 Nepal 14.0 15.5 15.2 15.2 15.2 16.4 Thailand 109.3 106.4 47.2 29.7 29.6 29.5 VietNam 15.0 22.3 14.6 9.1 9.1 9.0
Latin America 31.0 28.8 27.1 25.4 25.7 25.0
Africa 13.9 14.2 13.8 13.7 12.0 11.5
Near East 5.1 5.3 4.2 3.7 3.6 3.3
Developed countries 7.4 7.4 7.3 7.0 7.0 7.0
- 21 -
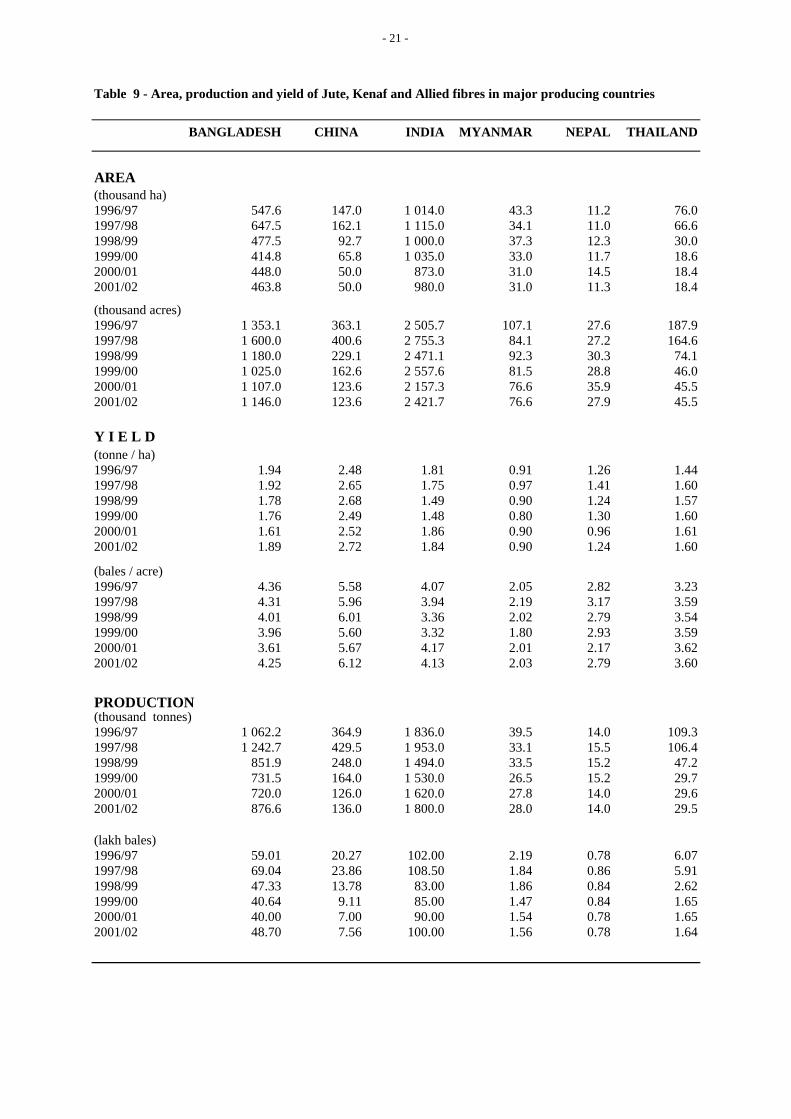
Table 9 - Area, production and yield of Jute, Kenaf and Allied fibres in major producing countries
BANGLADESH CHINA INDIA MYANMAR NEPAL THAILAND
AREA (thousand ha)1996/97 547.6 147.0 1 014.0 43.3 11.2 76.01997/98 647.5 162.1 1 115.0 34.1 11.0 66.61998/99 477.5 92.7 1 000.0 37.3 12.3 30.01999/00 414.8 65.8 1 035.0 33.0 11.7 18.62000/01 448.0 50.0 873.0 31.0 14.5 18.42001/02 463.8 50.0 980.0 31.0 11.3 18.4
(thousand acres)1996/97 1 353.1 363.1 2 505.7 107.1 27.6 187.91997/98 1 600.0 400.6 2 755.3 84.1 27.2 164.61998/99 1 180.0 229.1 2 471.1 92.3 30.3 74.11999/00 1 025.0 162.6 2 557.6 81.5 28.8 46.02000/01 1 107.0 123.6 2 157.3 76.6 35.9 45.52001/02 1 146.0 123.6 2 421.7 76.6 27.9 45.5
Y I E L D (tonne / ha)1996/97 1.94 2.48 1.81 0.91 1.26 1.441997/98 1.92 2.65 1.75 0.97 1.41 1.601998/99 1.78 2.68 1.49 0.90 1.24 1.571999/00 1.76 2.49 1.48 0.80 1.30 1.602000/01 1.61 2.52 1.86 0.90 0.96 1.612001/02 1.89 2.72 1.84 0.90 1.24 1.60
(bales / acre)1996/97 4.36 5.58 4.07 2.05 2.82 3.231997/98 4.31 5.96 3.94 2.19 3.17 3.591998/99 4.01 6.01 3.36 2.02 2.79 3.541999/00 3.96 5.60 3.32 1.80 2.93 3.592000/01 3.61 5.67 4.17 2.01 2.17 3.622001/02 4.25 6.12 4.13 2.03 2.79 3.60
PRODUCTION (thousand tonnes)1996/97 1 062.2 364.9 1 836.0 39.5 14.0 109.31997/98 1 242.7 429.5 1 953.0 33.1 15.5 106.41998/99 851.9 248.0 1 494.0 33.5 15.2 47.21999/00 731.5 164.0 1 530.0 26.5 15.2 29.72000/01 720.0 126.0 1 620.0 27.8 14.0 29.62001/02 876.6 136.0 1 800.0 28.0 14.0 29.5
(lakh bales)1996/97 59.01 20.27 102.00 2.19 0.78 6.071997/98 69.04 23.86 108.50 1.84 0.86 5.911998/99 47.33 13.78 83.00 1.86 0.84 2.621999/00 40.64 9.11 85.00 1.47 0.84 1.652000/01 40.00 7.00 90.00 1.54 0.78 1.652001/02 48.70 7.56 100.00 1.56 0.78 1.64
- 22 -
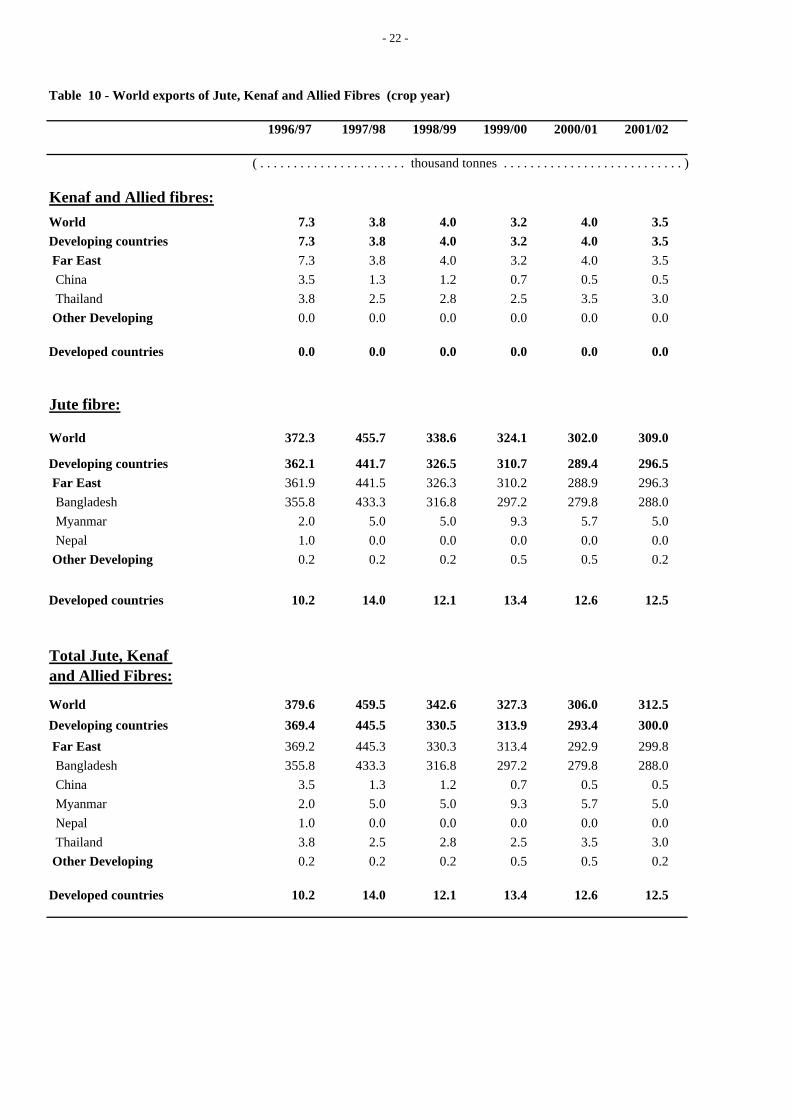
Table 10 - World exports of Jute, Kenaf and Allied Fibres (crop year)
1996/97 1997/98 1998/99 1999/00 2000/01 2001/02
( . . . . . . . . . . . . . . . . . . . . . . thousand tonnes . . . . . . . . . . . . . . . . . . . . . . . . . . . )
Kenaf and Allied fibres: World 7.3 3.8 4.0 3.2 4.0 3.5
Developing countries 7.3 3.8 4.0 3.2 4.0 3.5
Far East 7.3 3.8 4.0 3.2 4.0 3.5 China 3.5 1.3 1.2 0.7 0.5 0.5
Thailand 3.8 2.5 2.8 2.5 3.5 3.0
Other Developing 0.0 0.0 0.0 0.0 0.0 0.0
Developed countries 0.0 0.0 0.0 0.0 0.0 0.0
Jute fibre:
World 372.3 455.7 338.6 324.1 302.0 309.0
Developing countries 362.1 441.7 326.5 310.7 289.4 296.5 Far East 361.9 441.5 326.3 310.2 288.9 296.3 Bangladesh 355.8 433.3 316.8 297.2 279.8 288.0 Myanmar 2.0 5.0 5.0 9.3 5.7 5.0 Nepal 1.0 0.0 0.0 0.0 0.0 0.0 Other Developing 0.2 0.2 0.2 0.5 0.5 0.2
Developed countries 10.2 14.0 12.1 13.4 12.6 12.5
Total Jute, Kenaf and Allied Fibres:
World 379.6 459.5 342.6 327.3 306.0 312.5
Developing countries 369.4 445.5 330.5 313.9 293.4 300.0
Far East 369.2 445.3 330.3 313.4 292.9 299.8 Bangladesh 355.8 433.3 316.8 297.2 279.8 288.0 China 3.5 1.3 1.2 0.7 0.5 0.5 Myanmar 2.0 5.0 5.0 9.3 5.7 5.0 Nepal 1.0 0.0 0.0 0.0 0.0 0.0 Thailand 3.8 2.5 2.8 2.5 3.5 3.0 Other Developing 0.2 0.2 0.2 0.5 0.5 0.2
Developed countries 10.2 14.0 12.1 13.4 12.6 12.5
- 23 -
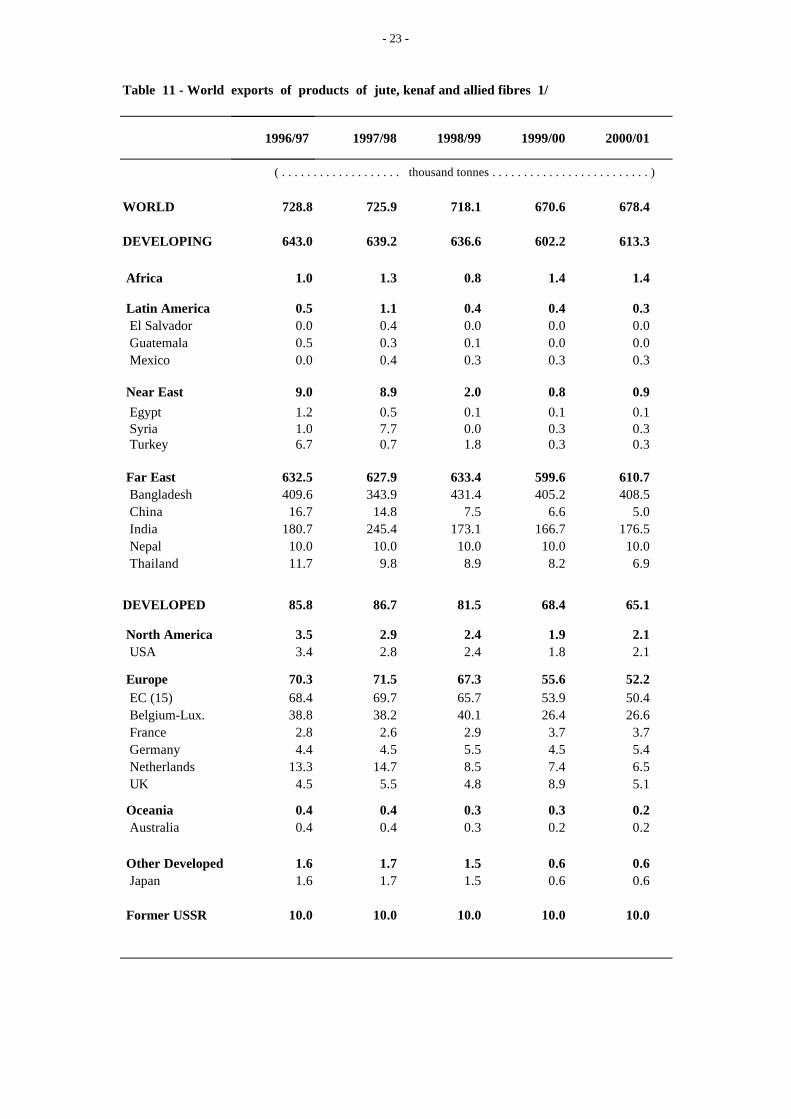
Table 11 - World exports of products of jute, kenaf and allied fibres 1/
1996/97 1997/98 1998/99 1999/00 2000/01
( . . . . . . . . . . . . . . . . . . . thousand tonnes . . . . . . . . . . . . . . . . . . . . . . . . . )
WORLD 728.8 725.9 718.1 670.6 678.4
DEVELOPING 643.0 639.2 636.6 602.2 613.3
Africa 1.0 1.3 0.8 1.4 1.4
Latin America 0.5 1.1 0.4 0.4 0.3 El Salvador 0.0 0.4 0.0 0.0 0.0 Guatemala 0.5 0.3 0.1 0.0 0.0 Mexico 0.0 0.4 0.3 0.3 0.3
Near East 9.0 8.9 2.0 0.8 0.9 Egypt 1.2 0.5 0.1 0.1 0.1 Syria 1.0 7.7 0.0 0.3 0.3 Turkey 6.7 0.7 1.8 0.3 0.3
Far East 632.5 627.9 633.4 599.6 610.7 Bangladesh 409.6 343.9 431.4 405.2 408.5 China 16.7 14.8 7.5 6.6 5.0 India 180.7 245.4 173.1 166.7 176.5 Nepal 10.0 10.0 10.0 10.0 10.0 Thailand 11.7 9.8 8.9 8.2 6.9
DEVELOPED 85.8 86.7 81.5 68.4 65.1
North America 3.5 2.9 2.4 1.9 2.1 USA 3.4 2.8 2.4 1.8 2.1
Europe 70.3 71.5 67.3 55.6 52.2 EC (15) 68.4 69.7 65.7 53.9 50.4 Belgium-Lux. 38.8 38.2 40.1 26.4 26.6 France 2.8 2.6 2.9 3.7 3.7 Germany 4.4 4.5 5.5 4.5 5.4 Netherlands 13.3 14.7 8.5 7.4 6.5 UK 4.5 5.5 4.8 8.9 5.1
Oceania 0.4 0.4 0.3 0.3 0.2 Australia 0.4 0.4 0.3 0.2 0.2
Other Developed 1.6 1.7 1.5 0.6 0.6 Japan 1.6 1.7 1.5 0.6 0.6
Former USSR 10.0 10.0 10.0 10.0 10.0
- 24 -
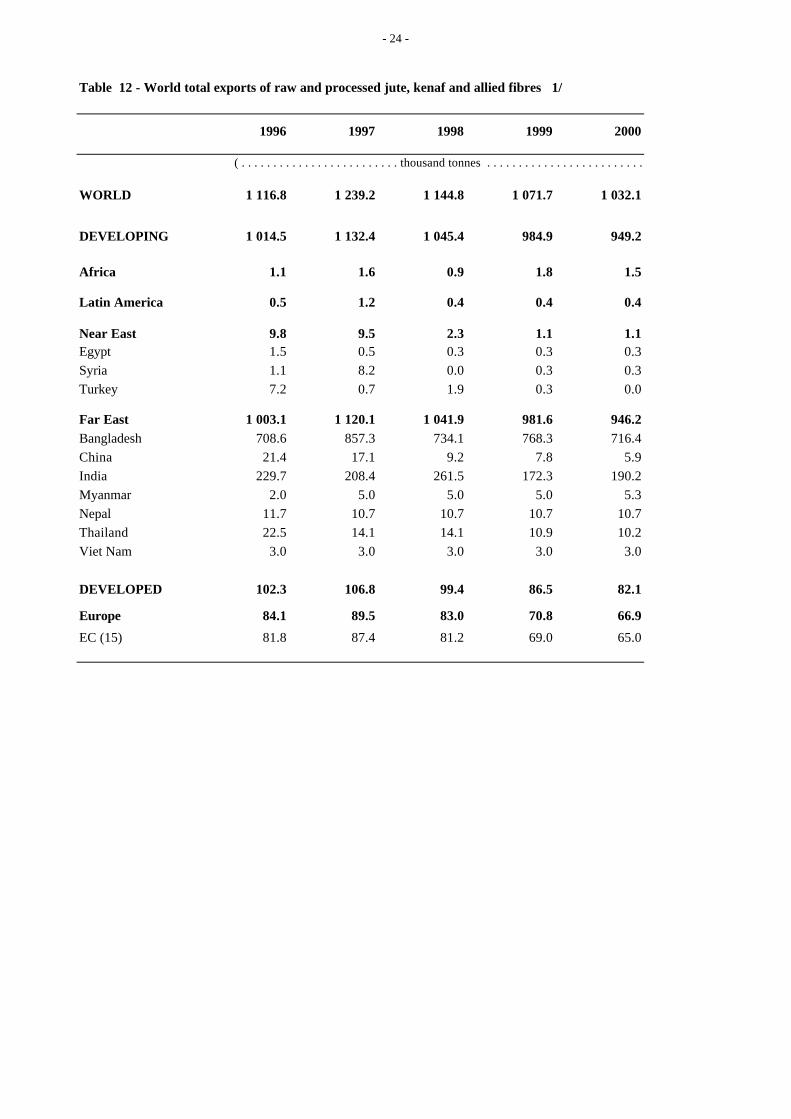
Table 12 - World total exports of raw and processed jute, kenaf and allied fibres 1/
1996 1997 1998 1999 2000
( . . . . . . . . . . . . . . . . . . . . . . . . . thousand tonnes . . . . . . . . . . . . . . . . . . . . . . . . . . )
WORLD 1 116.8 1 239.2 1 144.8 1 071.7 1 032.1
DEVELOPING 1 014.5 1 132.4 1 045.4 984.9 949.2
Africa 1.1 1.6 0.9 1.8 1.5
Latin America 0.5 1.2 0.4 0.4 0.4
Near East 9.8 9.5 2.3 1.1 1.1Egypt 1.5 0.5 0.3 0.3 0.3Syria 1.1 8.2 0.0 0.3 0.3Turkey 7.2 0.7 1.9 0.3 0.0
Far East 1 003.1 1 120.1 1 041.9 981.6 946.2Bangladesh 708.6 857.3 734.1 768.3 716.4China 21.4 17.1 9.2 7.8 5.9India 229.7 208.4 261.5 172.3 190.2Myanmar 2.0 5.0 5.0 5.0 5.3Nepal 11.7 10.7 10.7 10.7 10.7Thailand 22.5 14.1 14.1 10.9 10.2Viet Nam 3.0 3.0 3.0 3.0 3.0
DEVELOPED 102.3 106.8 99.4 86.5 82.1
Europe 84.1 89.5 83.0 70.8 66.9
EC (15) 81.8 87.4 81.2 69.0 65.0
- 25 -
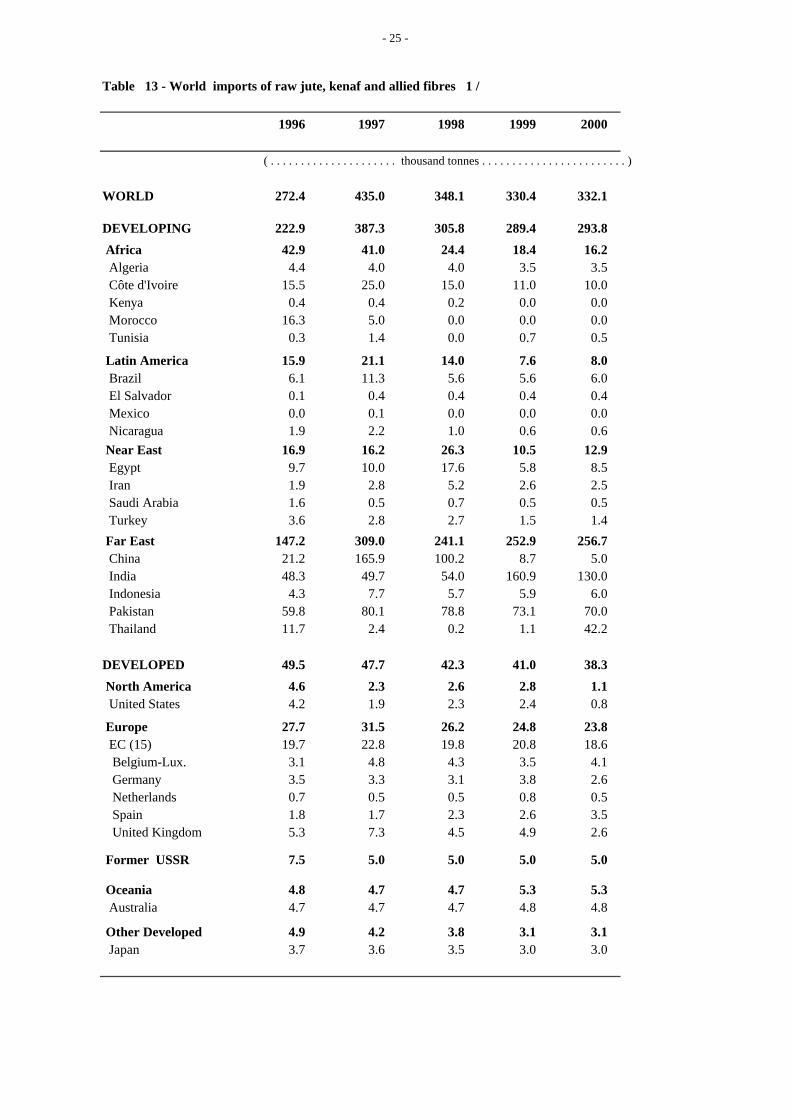
Table 13 - World imports of raw jute, kenaf and allied fibres 1 /
1996 1997 1998 1999 2000 ( . . . . . . . . . . . . . . . . . . . . . thousand tonnes . . . . . . . . . . . . . . . . . . . . . . . . )
WORLD 272.4 435.0 348.1 330.4 332.1
DEVELOPING 222.9 387.3 305.8 289.4 293.8
Africa 42.9 41.0 24.4 18.4 16.2 Algeria 4.4 4.0 4.0 3.5 3.5 Côte d'Ivoire 15.5 25.0 15.0 11.0 10.0 Kenya 0.4 0.4 0.2 0.0 0.0 Morocco 16.3 5.0 0.0 0.0 0.0 Tunisia 0.3 1.4 0.0 0.7 0.5
Latin America 15.9 21.1 14.0 7.6 8.0 Brazil 6.1 11.3 5.6 5.6 6.0 El Salvador 0.1 0.4 0.4 0.4 0.4 Mexico 0.0 0.1 0.0 0.0 0.0 Nicaragua 1.9 2.2 1.0 0.6 0.6 Near East 16.9 16.2 26.3 10.5 12.9 Egypt 9.7 10.0 17.6 5.8 8.5 Iran 1.9 2.8 5.2 2.6 2.5 Saudi Arabia 1.6 0.5 0.7 0.5 0.5 Turkey 3.6 2.8 2.7 1.5 1.4
Far East 147.2 309.0 241.1 252.9 256.7 China 21.2 165.9 100.2 8.7 5.0 India 48.3 49.7 54.0 160.9 130.0 Indonesia 4.3 7.7 5.7 5.9 6.0 Pakistan 59.8 80.1 78.8 73.1 70.0 Thailand 11.7 2.4 0.2 1.1 42.2
DEVELOPED 49.5 47.7 42.3 41.0 38.3
North America 4.6 2.3 2.6 2.8 1.1 United States 4.2 1.9 2.3 2.4 0.8
Europe 27.7 31.5 26.2 24.8 23.8 EC (15) 19.7 22.8 19.8 20.8 18.6 Belgium-Lux. 3.1 4.8 4.3 3.5 4.1 Germany 3.5 3.3 3.1 3.8 2.6 Netherlands 0.7 0.5 0.5 0.8 0.5 Spain 1.8 1.7 2.3 2.6 3.5 United Kingdom 5.3 7.3 4.5 4.9 2.6
Former USSR 7.5 5.0 5.0 5.0 5.0
Oceania 4.8 4.7 4.7 5.3 5.3 Australia 4.7 4.7 4.7 4.8 4.8
Other Developed 4.9 4.2 3.8 3.1 3.1 Japan 3.7 3.6 3.5 3.0 3.0
- 26 -
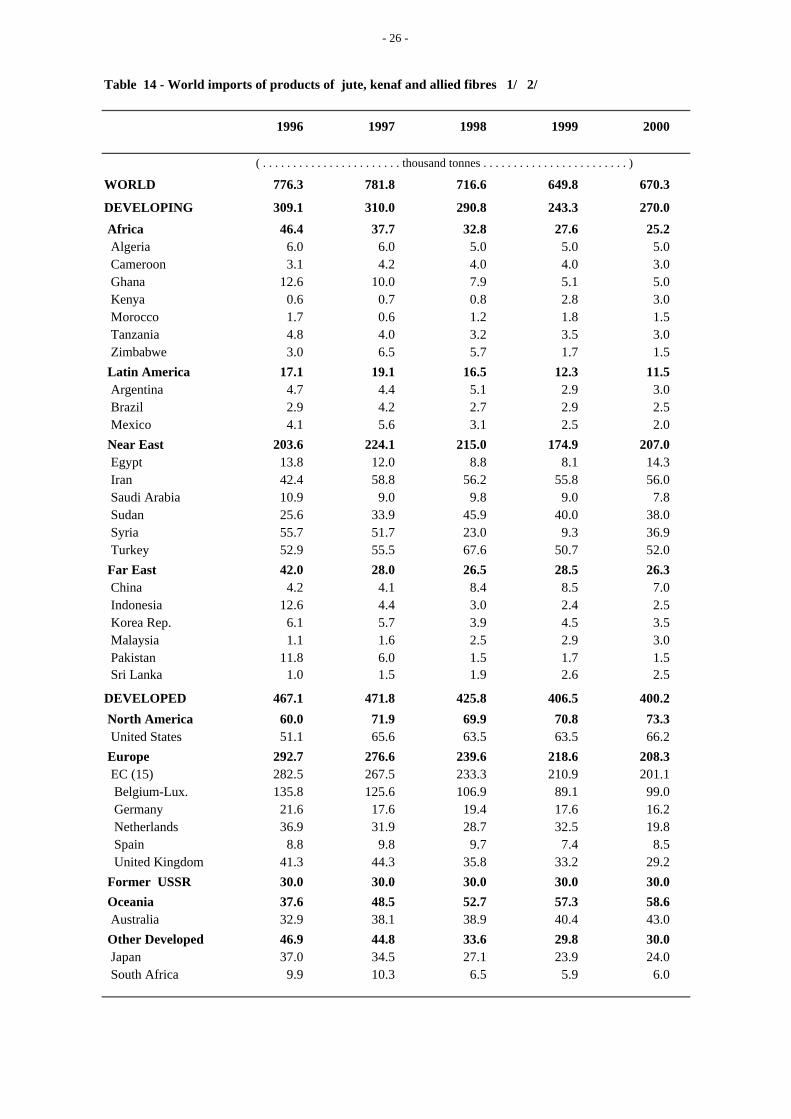
Table 14 - World imports of products of jute, kenaf and allied fibres 1/ 2/
1996 1997 1998 1999 2000 ( . . . . . . . . . . . . . . . . . . . . . . . thousand tonnes . . . . . . . . . . . . . . . . . . . . . . . . )
WORLD 776.3 781.8 716.6 649.8 670.3
DEVELOPING 309.1 310.0 290.8 243.3 270.0
Africa 46.4 37.7 32.8 27.6 25.2 Algeria 6.0 6.0 5.0 5.0 5.0 Cameroon 3.1 4.2 4.0 4.0 3.0 Ghana 12.6 10.0 7.9 5.1 5.0 Kenya 0.6 0.7 0.8 2.8 3.0 Morocco 1.7 0.6 1.2 1.8 1.5 Tanzania 4.8 4.0 3.2 3.5 3.0 Zimbabwe 3.0 6.5 5.7 1.7 1.5 Latin America 17.1 19.1 16.5 12.3 11.5 Argentina 4.7 4.4 5.1 2.9 3.0 Brazil 2.9 4.2 2.7 2.9 2.5 Mexico 4.1 5.6 3.1 2.5 2.0 Near East 203.6 224.1 215.0 174.9 207.0 Egypt 13.8 12.0 8.8 8.1 14.3 Iran 42.4 58.8 56.2 55.8 56.0 Saudi Arabia 10.9 9.0 9.8 9.0 7.8 Sudan 25.6 33.9 45.9 40.0 38.0 Syria 55.7 51.7 23.0 9.3 36.9 Turkey 52.9 55.5 67.6 50.7 52.0 Far East 42.0 28.0 26.5 28.5 26.3 China 4.2 4.1 8.4 8.5 7.0 Indonesia 12.6 4.4 3.0 2.4 2.5 Korea Rep. 6.1 5.7 3.9 4.5 3.5 Malaysia 1.1 1.6 2.5 2.9 3.0 Pakistan 11.8 6.0 1.5 1.7 1.5 Sri Lanka 1.0 1.5 1.9 2.6 2.5
DEVELOPED 467.1 471.8 425.8 406.5 400.2
North America 60.0 71.9 69.9 70.8 73.3 United States 51.1 65.6 63.5 63.5 66.2 Europe 292.7 276.6 239.6 218.6 208.3 EC (15) 282.5 267.5 233.3 210.9 201.1 Belgium-Lux. 135.8 125.6 106.9 89.1 99.0 Germany 21.6 17.6 19.4 17.6 16.2 Netherlands 36.9 31.9 28.7 32.5 19.8 Spain 8.8 9.8 9.7 7.4 8.5 United Kingdom 41.3 44.3 35.8 33.2 29.2 Former USSR 30.0 30.0 30.0 30.0 30.0 Oceania 37.6 48.5 52.7 57.3 58.6 Australia 32.9 38.1 38.9 40.4 43.0 Other Developed 46.9 44.8 33.6 29.8 30.0 Japan 37.0 34.5 27.1 23.9 24.0 South Africa 9.9 10.3 6.5 5.9 6.0
- 27 -
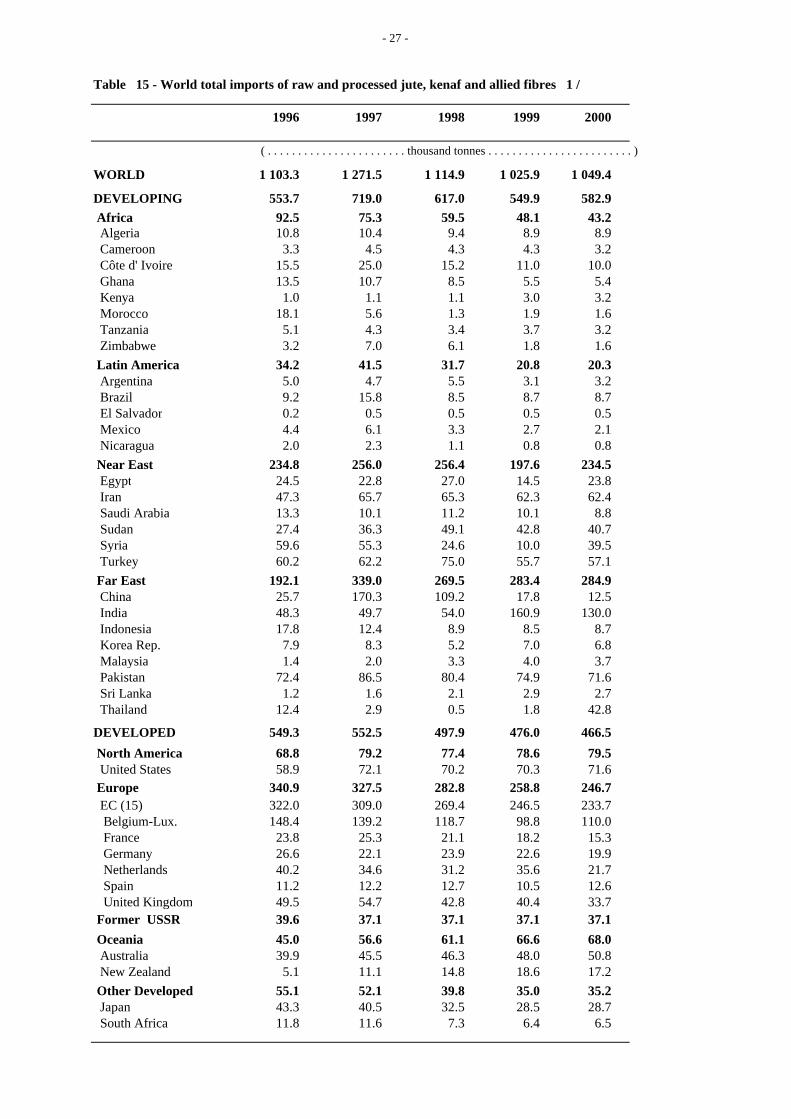
Table 15 - World total imports of raw and processed jute, kenaf and allied fibres 1 /
1996 1997 1998 1999 2000 ( . . . . . . . . . . . . . . . . . . . . . . . thousand tonnes . . . . . . . . . . . . . . . . . . . . . . . . )
WORLD 1 103.3 1 271.5 1 114.9 1 025.9 1 049.4
DEVELOPING 553.7 719.0 617.0 549.9 582.9 Africa 92.5 75.3 59.5 48.1 43.2 Algeria 10.8 10.4 9.4 8.9 8.9 Cameroon 3.3 4.5 4.3 4.3 3.2 Côte d' Ivoire 15.5 25.0 15.2 11.0 10.0 Ghana 13.5 10.7 8.5 5.5 5.4 Kenya 1.0 1.1 1.1 3.0 3.2 Morocco 18.1 5.6 1.3 1.9 1.6 Tanzania 5.1 4.3 3.4 3.7 3.2 Zimbabwe 3.2 7.0 6.1 1.8 1.6 Latin America 34.2 41.5 31.7 20.8 20.3 Argentina 5.0 4.7 5.5 3.1 3.2 Brazil 9.2 15.8 8.5 8.7 8.7 El Salvador 0.2 0.5 0.5 0.5 0.5 Mexico 4.4 6.1 3.3 2.7 2.1 Nicaragua 2.0 2.3 1.1 0.8 0.8 Near East 234.8 256.0 256.4 197.6 234.5 Egypt 24.5 22.8 27.0 14.5 23.8 Iran 47.3 65.7 65.3 62.3 62.4 Saudi Arabia 13.3 10.1 11.2 10.1 8.8 Sudan 27.4 36.3 49.1 42.8 40.7 Syria 59.6 55.3 24.6 10.0 39.5 Turkey 60.2 62.2 75.0 55.7 57.1 Far East 192.1 339.0 269.5 283.4 284.9 China 25.7 170.3 109.2 17.8 12.5 India 48.3 49.7 54.0 160.9 130.0 Indonesia 17.8 12.4 8.9 8.5 8.7 Korea Rep. 7.9 8.3 5.2 7.0 6.8 Malaysia 1.4 2.0 3.3 4.0 3.7 Pakistan 72.4 86.5 80.4 74.9 71.6 Sri Lanka 1.2 1.6 2.1 2.9 2.7 Thailand 12.4 2.9 0.5 1.8 42.8
DEVELOPED 549.3 552.5 497.9 476.0 466.5
North America 68.8 79.2 77.4 78.6 79.5 United States 58.9 72.1 70.2 70.3 71.6 Europe 340.9 327.5 282.8 258.8 246.7 EC (15) 322.0 309.0 269.4 246.5 233.7 Belgium-Lux. 148.4 139.2 118.7 98.8 110.0 France 23.8 25.3 21.1 18.2 15.3 Germany 26.6 22.1 23.9 22.6 19.9 Netherlands 40.2 34.6 31.2 35.6 21.7 Spain 11.2 12.2 12.7 10.5 12.6 United Kingdom 49.5 54.7 42.8 40.4 33.7 Former USSR 39.6 37.1 37.1 37.1 37.1 Oceania 45.0 56.6 61.1 66.6 68.0 Australia 39.9 45.5 46.3 48.0 50.8 New Zealand 5.1 11.1 14.8 18.6 17.2 Other Developed 55.1 52.1 39.8 35.0 35.2 Japan 43.3 40.5 32.5 28.5 28.7 South Africa 11.8 11.6 7.3 6.4 6.5
- 28 -
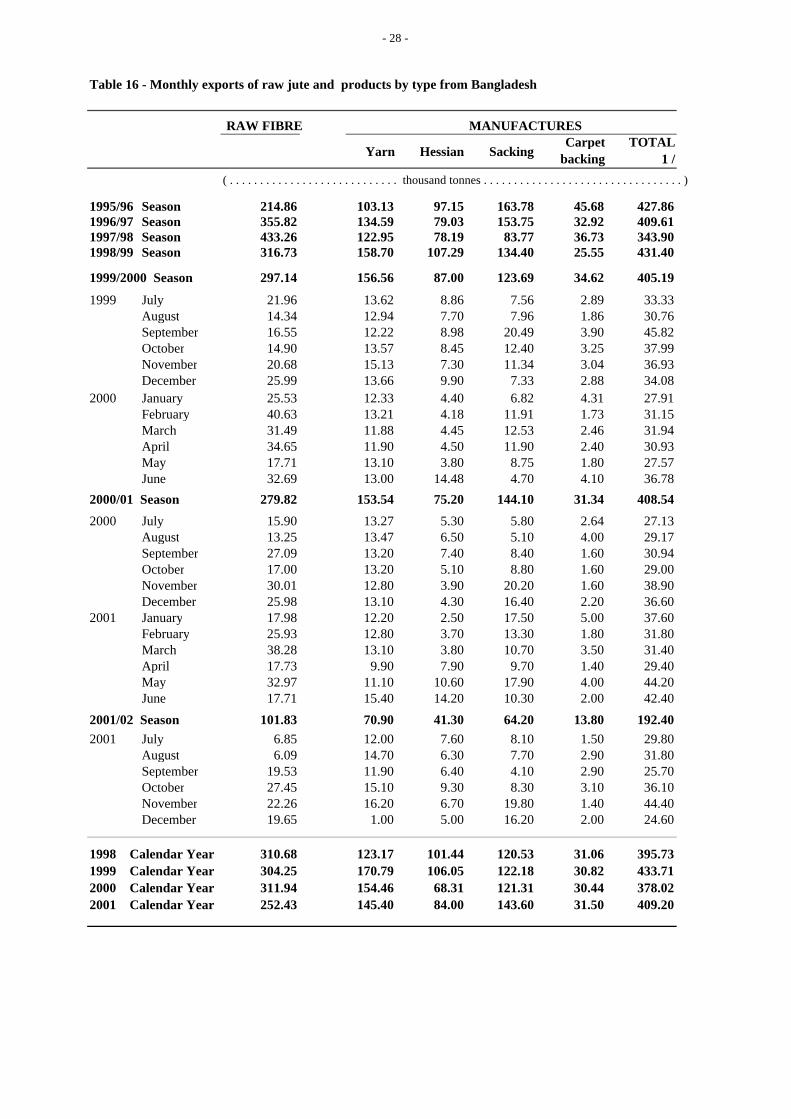
Table 16 - Monthly exports of raw jute and products by type from Bangladesh
RAW FIBRE MANUFACTURES
Yarn Hessian SackingCarpet
backingTOTAL
1 /
( . . . . . . . . . . . . . . . . . . . . . . . . . . . . thousand tonnes . . . . . . . . . . . . . . . . . . . . . . . . . . . . . . . . . )
1995/96 Season 214.86 103.13 97.15 163.78 45.68 427.861996/97 Season 355.82 134.59 79.03 153.75 32.92 409.611997/98 Season 433.26 122.95 78.19 83.77 36.73 343.901998/99 Season 316.73 158.70 107.29 134.40 25.55 431.40
1999/2000 Season 297.14 156.56 87.00 123.69 34.62 405.19
1999 July 21.96 13.62 8.86 7.56 2.89 33.33August 14.34 12.94 7.70 7.96 1.86 30.76September 16.55 12.22 8.98 20.49 3.90 45.82October 14.90 13.57 8.45 12.40 3.25 37.99November 20.68 15.13 7.30 11.34 3.04 36.93December 25.99 13.66 9.90 7.33 2.88 34.08
2000 January 25.53 12.33 4.40 6.82 4.31 27.91February 40.63 13.21 4.18 11.91 1.73 31.15March 31.49 11.88 4.45 12.53 2.46 31.94April 34.65 11.90 4.50 11.90 2.40 30.93May 17.71 13.10 3.80 8.75 1.80 27.57June 32.69 13.00 14.48 4.70 4.10 36.78
2000/01 Season 279.82 153.54 75.20 144.10 31.34 408.54
2000 July 15.90 13.27 5.30 5.80 2.64 27.13August 13.25 13.47 6.50 5.10 4.00 29.17September 27.09 13.20 7.40 8.40 1.60 30.94October 17.00 13.20 5.10 8.80 1.60 29.00November 30.01 12.80 3.90 20.20 1.60 38.90December 25.98 13.10 4.30 16.40 2.20 36.60
2001 January 17.98 12.20 2.50 17.50 5.00 37.60February 25.93 12.80 3.70 13.30 1.80 31.80March 38.28 13.10 3.80 10.70 3.50 31.40April 17.73 9.90 7.90 9.70 1.40 29.40May 32.97 11.10 10.60 17.90 4.00 44.20June 17.71 15.40 14.20 10.30 2.00 42.40
2001/02 Season 101.83 70.90 41.30 64.20 13.80 192.402001 July 6.85 12.00 7.60 8.10 1.50 29.80
August 6.09 14.70 6.30 7.70 2.90 31.80September 19.53 11.90 6.40 4.10 2.90 25.70October 27.45 15.10 9.30 8.30 3.10 36.10November 22.26 16.20 6.70 19.80 1.40 44.40December 19.65 1.00 5.00 16.20 2.00 24.60
1998 Calendar Year 310.68 123.17 101.44 120.53 31.06 395.731999 Calendar Year 304.25 170.79 106.05 122.18 30.82 433.712000 Calendar Year 311.94 154.46 68.31 121.31 30.44 378.022001 Calendar Year 252.43 145.40 84.00 143.60 31.50 409.20
- 29 -
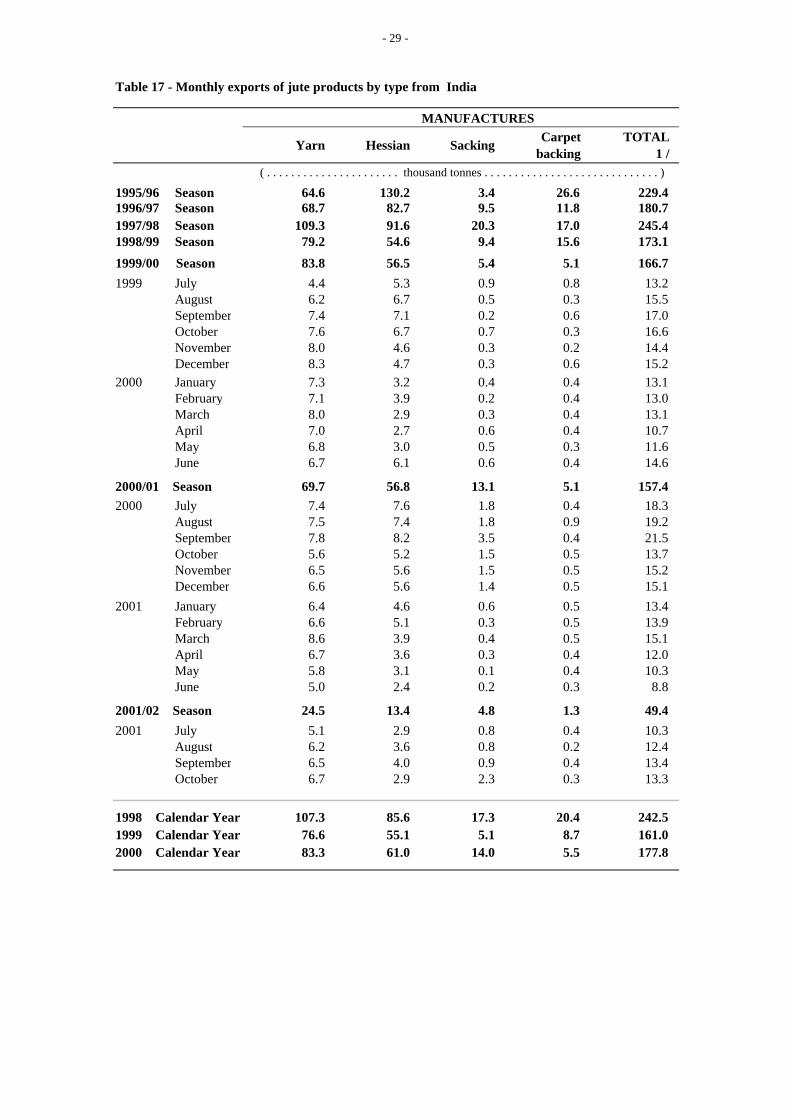
Table 17 - Monthly exports of jute products by type from India
MANUFACTURES
Yarn Hessian SackingCarpet
backingTOTAL
1 / ( . . . . . . . . . . . . . . . . . . . . . . thousand tonnes . . . . . . . . . . . . . . . . . . . . . . . . . . . . . )
1995/96 Season 64.6 130.2 3.4 26.6 229.41996/97 Season 68.7 82.7 9.5 11.8 180.71997/98 Season 109.3 91.6 20.3 17.0 245.41998/99 Season 79.2 54.6 9.4 15.6 173.1
1999/00 Season 83.8 56.5 5.4 5.1 166.71999 July 4.4 5.3 0.9 0.8 13.2
August 6.2 6.7 0.5 0.3 15.5September 7.4 7.1 0.2 0.6 17.0October 7.6 6.7 0.7 0.3 16.6November 8.0 4.6 0.3 0.2 14.4December 8.3 4.7 0.3 0.6 15.2
2000 January 7.3 3.2 0.4 0.4 13.1February 7.1 3.9 0.2 0.4 13.0March 8.0 2.9 0.3 0.4 13.1April 7.0 2.7 0.6 0.4 10.7May 6.8 3.0 0.5 0.3 11.6June 6.7 6.1 0.6 0.4 14.6
2000/01 Season 69.7 56.8 13.1 5.1 157.42000 July 7.4 7.6 1.8 0.4 18.3
August 7.5 7.4 1.8 0.9 19.2September 7.8 8.2 3.5 0.4 21.5October 5.6 5.2 1.5 0.5 13.7November 6.5 5.6 1.5 0.5 15.2December 6.6 5.6 1.4 0.5 15.1
2001 January 6.4 4.6 0.6 0.5 13.4February 6.6 5.1 0.3 0.5 13.9March 8.6 3.9 0.4 0.5 15.1April 6.7 3.6 0.3 0.4 12.0May 5.8 3.1 0.1 0.4 10.3June 5.0 2.4 0.2 0.3 8.8
2001/02 Season 24.5 13.4 4.8 1.3 49.42001 July 5.1 2.9 0.8 0.4 10.3
August 6.2 3.6 0.8 0.2 12.4September 6.5 4.0 0.9 0.4 13.4October 6.7 2.9 2.3 0.3 13.3
1998 Calendar Year 107.3 85.6 17.3 20.4 242.51999 Calendar Year 76.6 55.1 5.1 8.7 161.02000 Calendar Year 83.3 61.0 14.0 5.5 177.8
- 30 -
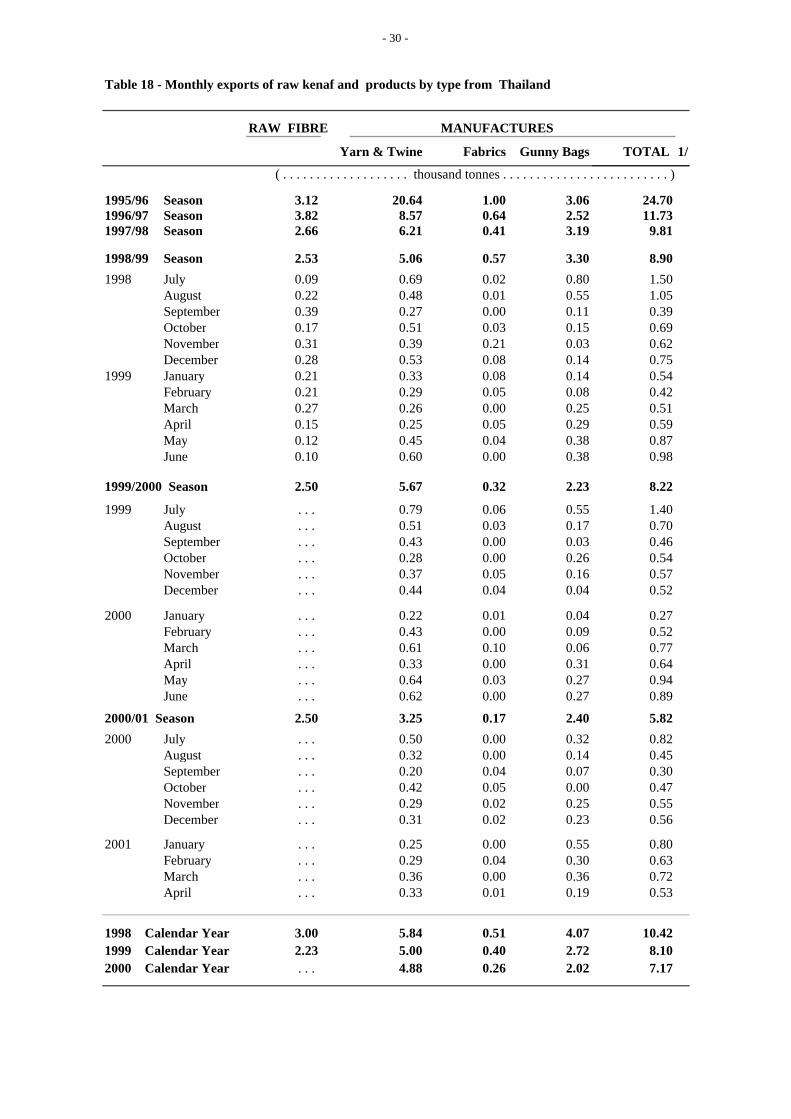
Table 18 - Monthly exports of raw kenaf and products by type from Thailand
RAW FIBRE MANUFACTURES
Yarn & Twine Fabrics Gunny Bags TOTAL 1/
( . . . . . . . . . . . . . . . . . . . thousand tonnes . . . . . . . . . . . . . . . . . . . . . . . . . )
1995/96 Season 3.12 20.64 1.00 3.06 24.701996/97 Season 3.82 8.57 0.64 2.52 11.731997/98 Season 2.66 6.21 0.41 3.19 9.81
1998/99 Season 2.53 5.06 0.57 3.30 8.90
1998 July 0.09 0.69 0.02 0.80 1.50August 0.22 0.48 0.01 0.55 1.05September 0.39 0.27 0.00 0.11 0.39October 0.17 0.51 0.03 0.15 0.69November 0.31 0.39 0.21 0.03 0.62December 0.28 0.53 0.08 0.14 0.75
1999 January 0.21 0.33 0.08 0.14 0.54February 0.21 0.29 0.05 0.08 0.42March 0.27 0.26 0.00 0.25 0.51April 0.15 0.25 0.05 0.29 0.59May 0.12 0.45 0.04 0.38 0.87June 0.10 0.60 0.00 0.38 0.98
1999/2000 Season 2.50 5.67 0.32 2.23 8.22
1999 July . . . 0.79 0.06 0.55 1.40August . . . 0.51 0.03 0.17 0.70September . . . 0.43 0.00 0.03 0.46October . . . 0.28 0.00 0.26 0.54November . . . 0.37 0.05 0.16 0.57December . . . 0.44 0.04 0.04 0.52
2000 January . . . 0.22 0.01 0.04 0.27February . . . 0.43 0.00 0.09 0.52March . . . 0.61 0.10 0.06 0.77April . . . 0.33 0.00 0.31 0.64May . . . 0.64 0.03 0.27 0.94June . . . 0.62 0.00 0.27 0.89
2000/01 Season 2.50 3.25 0.17 2.40 5.82
2000 July . . . 0.50 0.00 0.32 0.82August . . . 0.32 0.00 0.14 0.45September . . . 0.20 0.04 0.07 0.30October . . . 0.42 0.05 0.00 0.47November . . . 0.29 0.02 0.25 0.55December . . . 0.31 0.02 0.23 0.56
2001 January . . . 0.25 0.00 0.55 0.80February . . . 0.29 0.04 0.30 0.63March . . . 0.36 0.00 0.36 0.72April . . . 0.33 0.01 0.19 0.53
1998 Calendar Year 3.00 5.84 0.51 4.07 10.421999 Calendar Year 2.23 5.00 0.40 2.72 8.102000 Calendar Year . . . 4.88 0.26 2.02 7.17
- 31 -
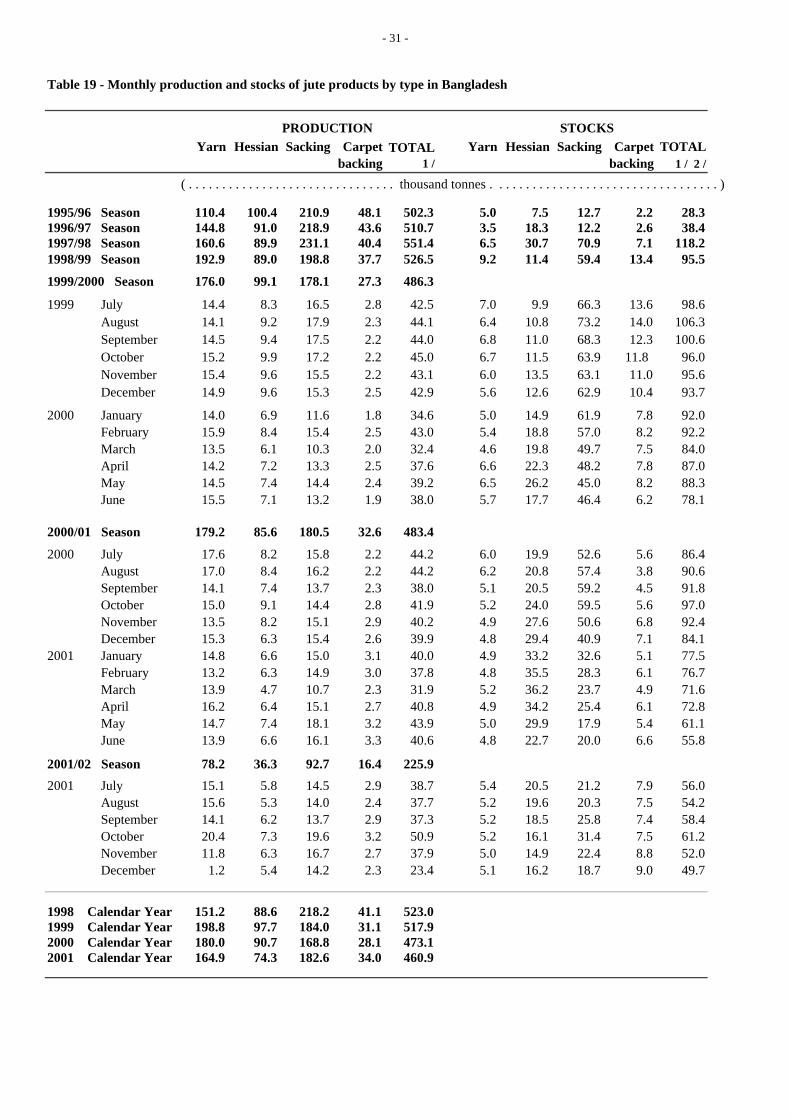
Table 19 - Monthly production and stocks of jute products by type in Bangladesh
PRODUCTION STOCKSYarn Hessian Sacking Carpet
backingTOTAL
1 / Yarn Hessian Sacking Carpet
backingTOTAL
1 / 2 /
( . . . . . . . . . . . . . . . . . . . . . . . . . . . . . . . thousand tonnes . . . . . . . . . . . . . . . . . . . . . . . . . . . . . . . . . . )
1995/96 Season 110.4 100.4 210.9 48.1 502.3 5.0 7.5 12.7 2.2 28.31996/97 Season 144.8 91.0 218.9 43.6 510.7 3.5 18.3 12.2 2.6 38.41997/98 Season 160.6 89.9 231.1 40.4 551.4 6.5 30.7 70.9 7.1 118.21998/99 Season 192.9 89.0 198.8 37.7 526.5 9.2 11.4 59.4 13.4 95.5
1999/2000 Season 176.0 99.1 178.1 27.3 486.3
1999 July 14.4 8.3 16.5 2.8 42.5 7.0 9.9 66.3 13.6 98.6August 14.1 9.2 17.9 2.3 44.1 6.4 10.8 73.2 14.0 106.3September 14.5 9.4 17.5 2.2 44.0 6.8 11.0 68.3 12.3 100.6October 15.2 9.9 17.2 2.2 45.0 6.7 11.5 63.9 11.8 96.0November 15.4 9.6 15.5 2.2 43.1 6.0 13.5 63.1 11.0 95.6December 14.9 9.6 15.3 2.5 42.9 5.6 12.6 62.9 10.4 93.7
2000 January 14.0 6.9 11.6 1.8 34.6 5.0 14.9 61.9 7.8 92.0February 15.9 8.4 15.4 2.5 43.0 5.4 18.8 57.0 8.2 92.2March 13.5 6.1 10.3 2.0 32.4 4.6 19.8 49.7 7.5 84.0April 14.2 7.2 13.3 2.5 37.6 6.6 22.3 48.2 7.8 87.0May 14.5 7.4 14.4 2.4 39.2 6.5 26.2 45.0 8.2 88.3June 15.5 7.1 13.2 1.9 38.0 5.7 17.7 46.4 6.2 78.1
2000/01 Season 179.2 85.6 180.5 32.6 483.4
2000 July 17.6 8.2 15.8 2.2 44.2 6.0 19.9 52.6 5.6 86.4August 17.0 8.4 16.2 2.2 44.2 6.2 20.8 57.4 3.8 90.6September 14.1 7.4 13.7 2.3 38.0 5.1 20.5 59.2 4.5 91.8October 15.0 9.1 14.4 2.8 41.9 5.2 24.0 59.5 5.6 97.0November 13.5 8.2 15.1 2.9 40.2 4.9 27.6 50.6 6.8 92.4December 15.3 6.3 15.4 2.6 39.9 4.8 29.4 40.9 7.1 84.1
2001 January 14.8 6.6 15.0 3.1 40.0 4.9 33.2 32.6 5.1 77.5February 13.2 6.3 14.9 3.0 37.8 4.8 35.5 28.3 6.1 76.7March 13.9 4.7 10.7 2.3 31.9 5.2 36.2 23.7 4.9 71.6April 16.2 6.4 15.1 2.7 40.8 4.9 34.2 25.4 6.1 72.8May 14.7 7.4 18.1 3.2 43.9 5.0 29.9 17.9 5.4 61.1June 13.9 6.6 16.1 3.3 40.6 4.8 22.7 20.0 6.6 55.8
2001/02 Season 78.2 36.3 92.7 16.4 225.9
2001 July 15.1 5.8 14.5 2.9 38.7 5.4 20.5 21.2 7.9 56.0August 15.6 5.3 14.0 2.4 37.7 5.2 19.6 20.3 7.5 54.2September 14.1 6.2 13.7 2.9 37.3 5.2 18.5 25.8 7.4 58.4October 20.4 7.3 19.6 3.2 50.9 5.2 16.1 31.4 7.5 61.2November 11.8 6.3 16.7 2.7 37.9 5.0 14.9 22.4 8.8 52.0December 1.2 5.4 14.2 2.3 23.4 5.1 16.2 18.7 9.0 49.7
1998 Calendar Year 151.2 88.6 218.2 41.1 523.01999 Calendar Year 198.8 97.7 184.0 31.1 517.92000 Calendar Year 180.0 90.7 168.8 28.1 473.12001 Calendar Year 164.9 74.3 182.6 34.0 460.9
- 32 -
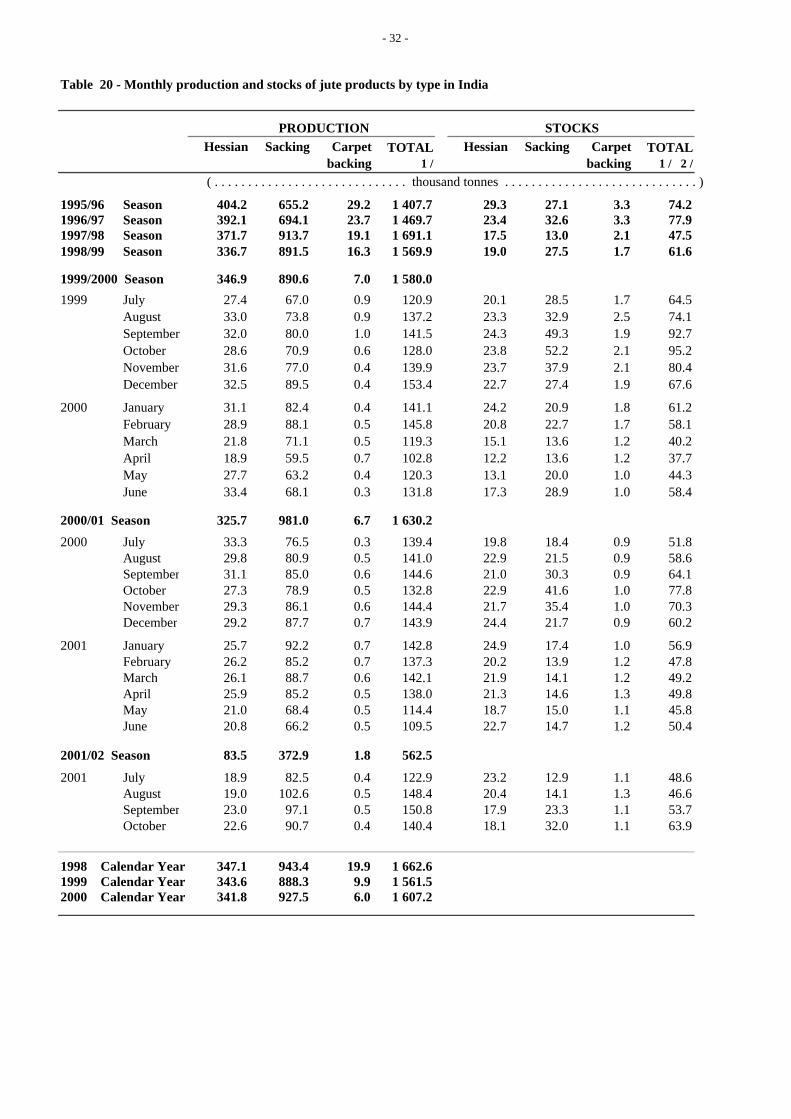
Table 20 - Monthly production and stocks of jute products by type in India
PRODUCTION STOCKSHessian Sacking Carpet
backingTOTAL
1 / Hessian Sacking Carpet
backingTOTAL
1 / 2 /
( . . . . . . . . . . . . . . . . . . . . . . . . . . . . . thousand tonnes . . . . . . . . . . . . . . . . . . . . . . . . . . . . . )
1995/96 Season 404.2 655.2 29.2 1 407.7 29.3 27.1 3.3 74.21996/97 Season 392.1 694.1 23.7 1 469.7 23.4 32.6 3.3 77.91997/98 Season 371.7 913.7 19.1 1 691.1 17.5 13.0 2.1 47.51998/99 Season 336.7 891.5 16.3 1 569.9 19.0 27.5 1.7 61.6
1999/2000 Season 346.9 890.6 7.0 1 580.0
1999 July 27.4 67.0 0.9 120.9 20.1 28.5 1.7 64.5August 33.0 73.8 0.9 137.2 23.3 32.9 2.5 74.1September 32.0 80.0 1.0 141.5 24.3 49.3 1.9 92.7October 28.6 70.9 0.6 128.0 23.8 52.2 2.1 95.2November 31.6 77.0 0.4 139.9 23.7 37.9 2.1 80.4December 32.5 89.5 0.4 153.4 22.7 27.4 1.9 67.6
2000 January 31.1 82.4 0.4 141.1 24.2 20.9 1.8 61.2February 28.9 88.1 0.5 145.8 20.8 22.7 1.7 58.1March 21.8 71.1 0.5 119.3 15.1 13.6 1.2 40.2April 18.9 59.5 0.7 102.8 12.2 13.6 1.2 37.7May 27.7 63.2 0.4 120.3 13.1 20.0 1.0 44.3June 33.4 68.1 0.3 131.8 17.3 28.9 1.0 58.4
2000/01 Season 325.7 981.0 6.7 1 630.2
2000 July 33.3 76.5 0.3 139.4 19.8 18.4 0.9 51.8August 29.8 80.9 0.5 141.0 22.9 21.5 0.9 58.6September 31.1 85.0 0.6 144.6 21.0 30.3 0.9 64.1October 27.3 78.9 0.5 132.8 22.9 41.6 1.0 77.8November 29.3 86.1 0.6 144.4 21.7 35.4 1.0 70.3December 29.2 87.7 0.7 143.9 24.4 21.7 0.9 60.2
2001 January 25.7 92.2 0.7 142.8 24.9 17.4 1.0 56.9February 26.2 85.2 0.7 137.3 20.2 13.9 1.2 47.8March 26.1 88.7 0.6 142.1 21.9 14.1 1.2 49.2April 25.9 85.2 0.5 138.0 21.3 14.6 1.3 49.8May 21.0 68.4 0.5 114.4 18.7 15.0 1.1 45.8June 20.8 66.2 0.5 109.5 22.7 14.7 1.2 50.4
2001/02 Season 83.5 372.9 1.8 562.5
2001 July 18.9 82.5 0.4 122.9 23.2 12.9 1.1 48.6August 19.0 102.6 0.5 148.4 20.4 14.1 1.3 46.6September 23.0 97.1 0.5 150.8 17.9 23.3 1.1 53.7October 22.6 90.7 0.4 140.4 18.1 32.0 1.1 63.9
1998 Calendar Year 347.1 943.4 19.9 1 662.61999 Calendar Year 343.6 888.3 9.9 1 561.52000 Calendar Year 341.8 927.5 6.0 1 607.2
- 33 -
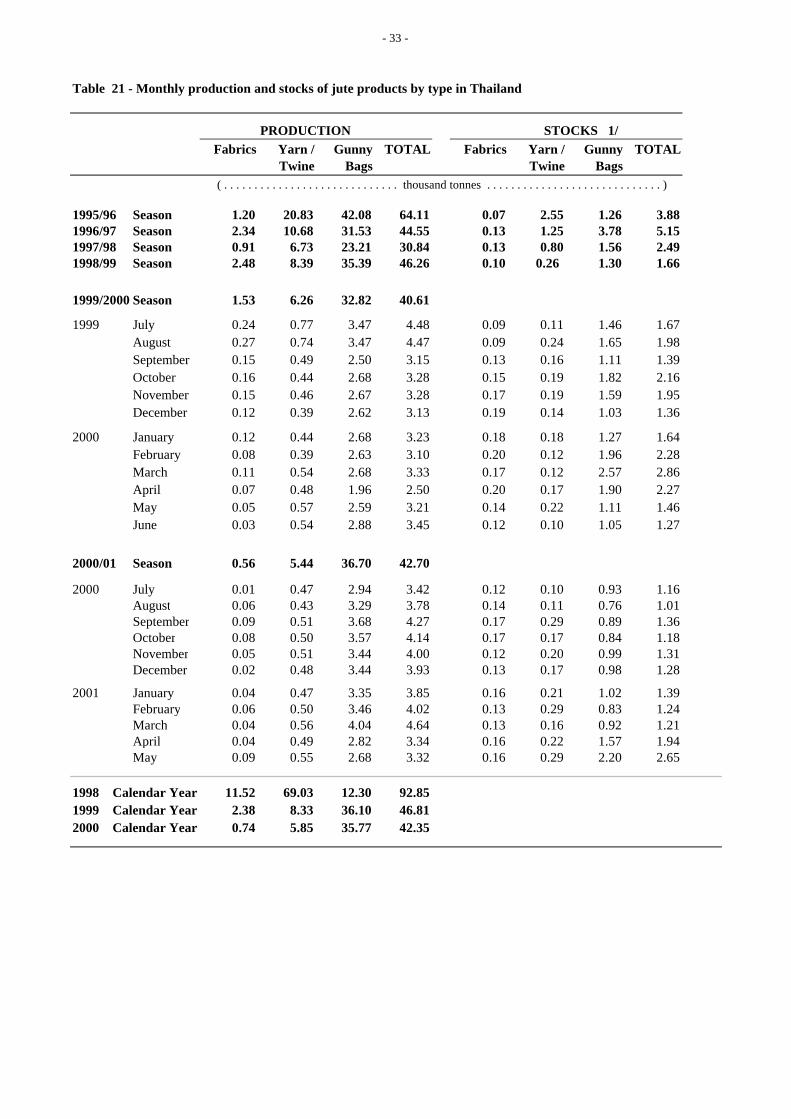
Table 21 - Monthly production and stocks of jute products by type in Thailand
PRODUCTION STOCKS 1/Fabrics Yarn /
TwineGunny
BagsTOTAL Fabrics Yarn /
TwineGunny
BagsTOTAL
( . . . . . . . . . . . . . . . . . . . . . . . . . . . . . thousand tonnes . . . . . . . . . . . . . . . . . . . . . . . . . . . . . )
1995/96 Season 1.20 20.83 42.08 64.11 0.07 2.55 1.26 3.881996/97 Season 2.34 10.68 31.53 44.55 0.13 1.25 3.78 5.151997/98 Season 0.91 6.73 23.21 30.84 0.13 0.80 1.56 2.491998/99 Season 2.48 8.39 35.39 46.26 0.10 0.26 1.30 1.66
1999/2000 Season 1.53 6.26 32.82 40.61
1999 July 0.24 0.77 3.47 4.48 0.09 0.11 1.46 1.67August 0.27 0.74 3.47 4.47 0.09 0.24 1.65 1.98September 0.15 0.49 2.50 3.15 0.13 0.16 1.11 1.39October 0.16 0.44 2.68 3.28 0.15 0.19 1.82 2.16November 0.15 0.46 2.67 3.28 0.17 0.19 1.59 1.95December 0.12 0.39 2.62 3.13 0.19 0.14 1.03 1.36
2000 January 0.12 0.44 2.68 3.23 0.18 0.18 1.27 1.64February 0.08 0.39 2.63 3.10 0.20 0.12 1.96 2.28March 0.11 0.54 2.68 3.33 0.17 0.12 2.57 2.86April 0.07 0.48 1.96 2.50 0.20 0.17 1.90 2.27May 0.05 0.57 2.59 3.21 0.14 0.22 1.11 1.46June 0.03 0.54 2.88 3.45 0.12 0.10 1.05 1.27
2000/01 Season 0.56 5.44 36.70 42.70
2000 July 0.01 0.47 2.94 3.42 0.12 0.10 0.93 1.16August 0.06 0.43 3.29 3.78 0.14 0.11 0.76 1.01September 0.09 0.51 3.68 4.27 0.17 0.29 0.89 1.36October 0.08 0.50 3.57 4.14 0.17 0.17 0.84 1.18November 0.05 0.51 3.44 4.00 0.12 0.20 0.99 1.31December 0.02 0.48 3.44 3.93 0.13 0.17 0.98 1.28
2001 January 0.04 0.47 3.35 3.85 0.16 0.21 1.02 1.39February 0.06 0.50 3.46 4.02 0.13 0.29 0.83 1.24March 0.04 0.56 4.04 4.64 0.13 0.16 0.92 1.21April 0.04 0.49 2.82 3.34 0.16 0.22 1.57 1.94May 0.09 0.55 2.68 3.32 0.16 0.29 2.20 2.65
1998 Calendar Year 11.52 69.03 12.30 92.851999 Calendar Year 2.38 8.33 36.10 46.812000 Calendar Year 0.74 5.85 35.77 42.35
- 34-
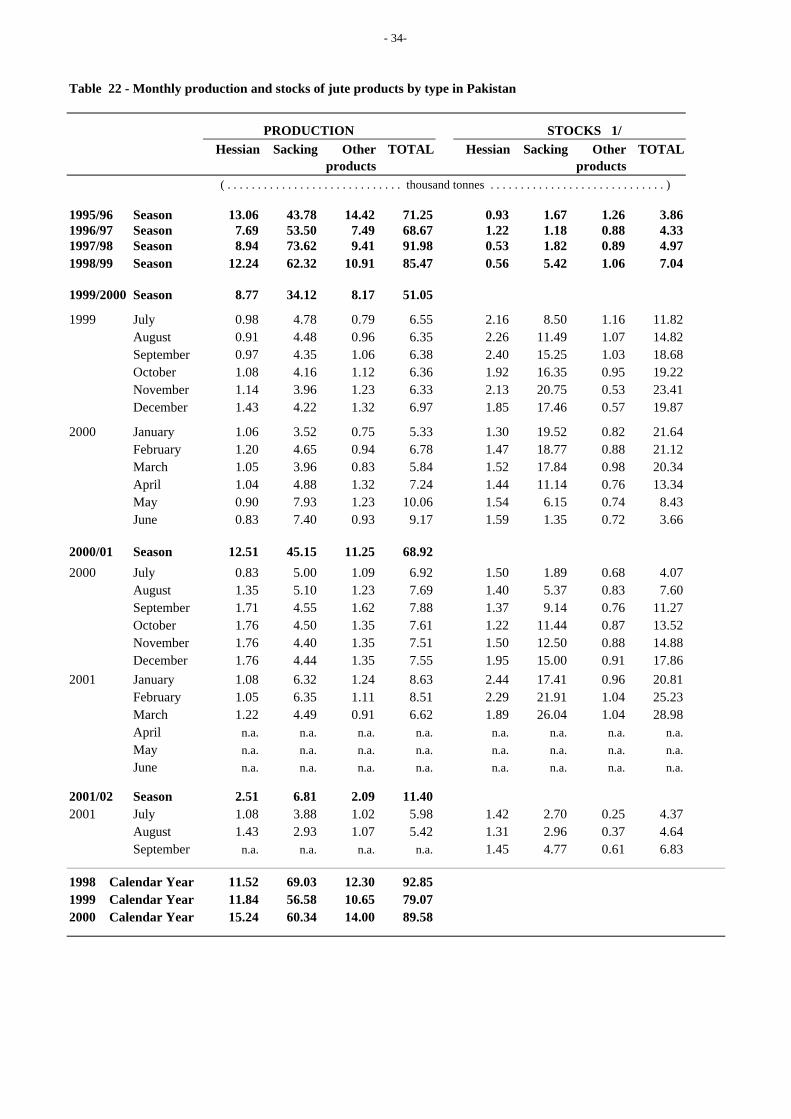
Table 22 - Monthly production and stocks of jute products by type in Pakistan
PRODUCTION STOCKS 1/Hessian Sacking Other
productsTOTAL Hessian Sacking Other
productsTOTAL
( . . . . . . . . . . . . . . . . . . . . . . . . . . . . . thousand tonnes . . . . . . . . . . . . . . . . . . . . . . . . . . . . . )
1995/96 Season 13.06 43.78 14.42 71.25 0.93 1.67 1.26 3.861996/97 Season 7.69 53.50 7.49 68.67 1.22 1.18 0.88 4.331997/98 Season 8.94 73.62 9.41 91.98 0.53 1.82 0.89 4.971998/99 Season 12.24 62.32 10.91 85.47 0.56 5.42 1.06 7.04
1999/2000 Season 8.77 34.12 8.17 51.05
1999 July 0.98 4.78 0.79 6.55 2.16 8.50 1.16 11.82August 0.91 4.48 0.96 6.35 2.26 11.49 1.07 14.82September 0.97 4.35 1.06 6.38 2.40 15.25 1.03 18.68October 1.08 4.16 1.12 6.36 1.92 16.35 0.95 19.22November 1.14 3.96 1.23 6.33 2.13 20.75 0.53 23.41December 1.43 4.22 1.32 6.97 1.85 17.46 0.57 19.87
2000 January 1.06 3.52 0.75 5.33 1.30 19.52 0.82 21.64February 1.20 4.65 0.94 6.78 1.47 18.77 0.88 21.12March 1.05 3.96 0.83 5.84 1.52 17.84 0.98 20.34April 1.04 4.88 1.32 7.24 1.44 11.14 0.76 13.34May 0.90 7.93 1.23 10.06 1.54 6.15 0.74 8.43June 0.83 7.40 0.93 9.17 1.59 1.35 0.72 3.66
2000/01 Season 12.51 45.15 11.25 68.92
2000 July 0.83 5.00 1.09 6.92 1.50 1.89 0.68 4.07August 1.35 5.10 1.23 7.69 1.40 5.37 0.83 7.60September 1.71 4.55 1.62 7.88 1.37 9.14 0.76 11.27October 1.76 4.50 1.35 7.61 1.22 11.44 0.87 13.52November 1.76 4.40 1.35 7.51 1.50 12.50 0.88 14.88December 1.76 4.44 1.35 7.55 1.95 15.00 0.91 17.86
2001 January 1.08 6.32 1.24 8.63 2.44 17.41 0.96 20.81February 1.05 6.35 1.11 8.51 2.29 21.91 1.04 25.23March 1.22 4.49 0.91 6.62 1.89 26.04 1.04 28.98April n.a. n.a. n.a. n.a. n.a. n.a. n.a. n.a.May n.a. n.a. n.a. n.a. n.a. n.a. n.a. n.a.June n.a. n.a. n.a. n.a. n.a. n.a. n.a. n.a.
2001/02 Season 2.51 6.81 2.09 11.402001 July 1.08 3.88 1.02 5.98 1.42 2.70 0.25 4.37
August 1.43 2.93 1.07 5.42 1.31 2.96 0.37 4.64September n.a. n.a. n.a. n.a. 1.45 4.77 0.61 6.83
1998 Calendar Year 11.52 69.03 12.30 92.851999 Calendar Year 11.84 56.58 10.65 79.072000 Calendar Year 15.24 60.34 14.00 89.58
- 35 -
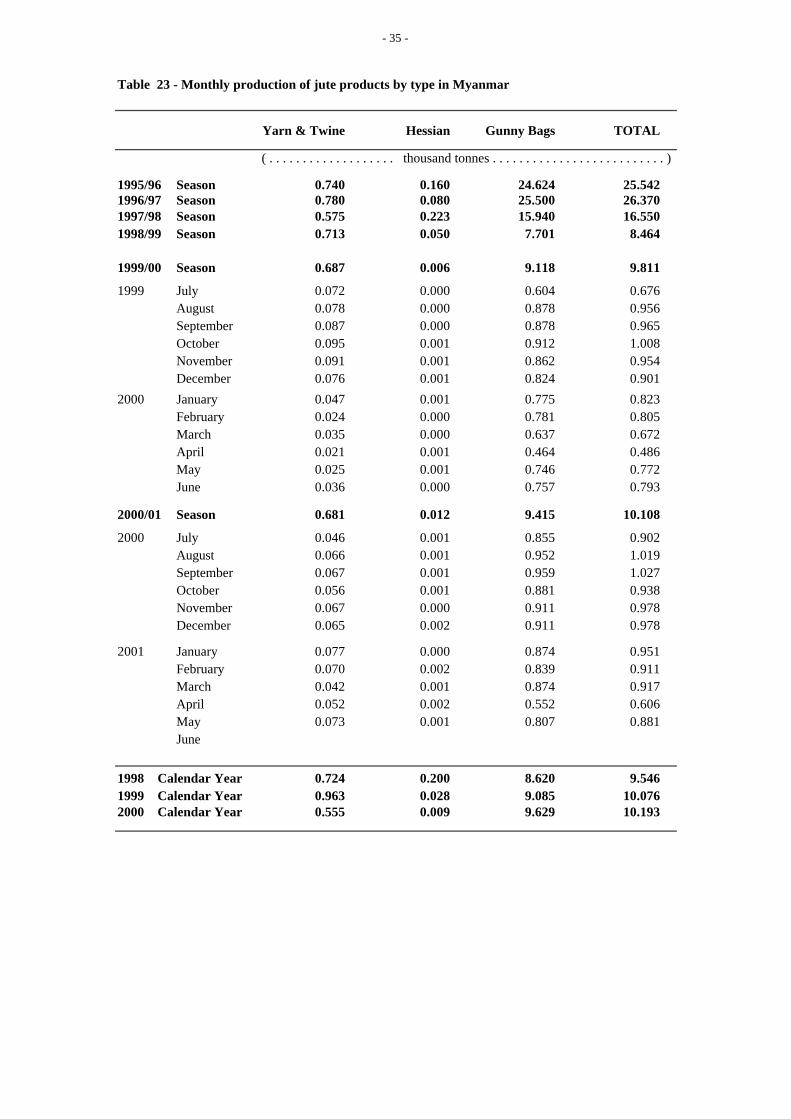
Table 23 - Monthly production of jute products by type in Myanmar
Yarn & Twine Hessian Gunny Bags TOTAL
( . . . . . . . . . . . . . . . . . . . thousand tonnes . . . . . . . . . . . . . . . . . . . . . . . . . . )
1995/96 Season 0.740 0.160 24.624 25.5421996/97 Season 0.780 0.080 25.500 26.3701997/98 Season 0.575 0.223 15.940 16.5501998/99 Season 0.713 0.050 7.701 8.464
1999/00 Season 0.687 0.006 9.118 9.811
1999 July 0.072 0.000 0.604 0.676August 0.078 0.000 0.878 0.956September 0.087 0.000 0.878 0.965October 0.095 0.001 0.912 1.008November 0.091 0.001 0.862 0.954December 0.076 0.001 0.824 0.901
2000 January 0.047 0.001 0.775 0.823February 0.024 0.000 0.781 0.805March 0.035 0.000 0.637 0.672April 0.021 0.001 0.464 0.486May 0.025 0.001 0.746 0.772June 0.036 0.000 0.757 0.793
2000/01 Season 0.681 0.012 9.415 10.108
2000 July 0.046 0.001 0.855 0.902August 0.066 0.001 0.952 1.019September 0.067 0.001 0.959 1.027October 0.056 0.001 0.881 0.938November 0.067 0.000 0.911 0.978December 0.065 0.002 0.911 0.978
2001 January 0.077 0.000 0.874 0.951February 0.070 0.002 0.839 0.911March 0.042 0.001 0.874 0.917April 0.052 0.002 0.552 0.606May 0.073 0.001 0.807 0.881June
1998 Calendar Year 0.724 0.200 8.620 9.5461999 Calendar Year 0.963 0.028 9.085 10.0762000 Calendar Year 0.555 0.009 9.629 10.193
- 36 -
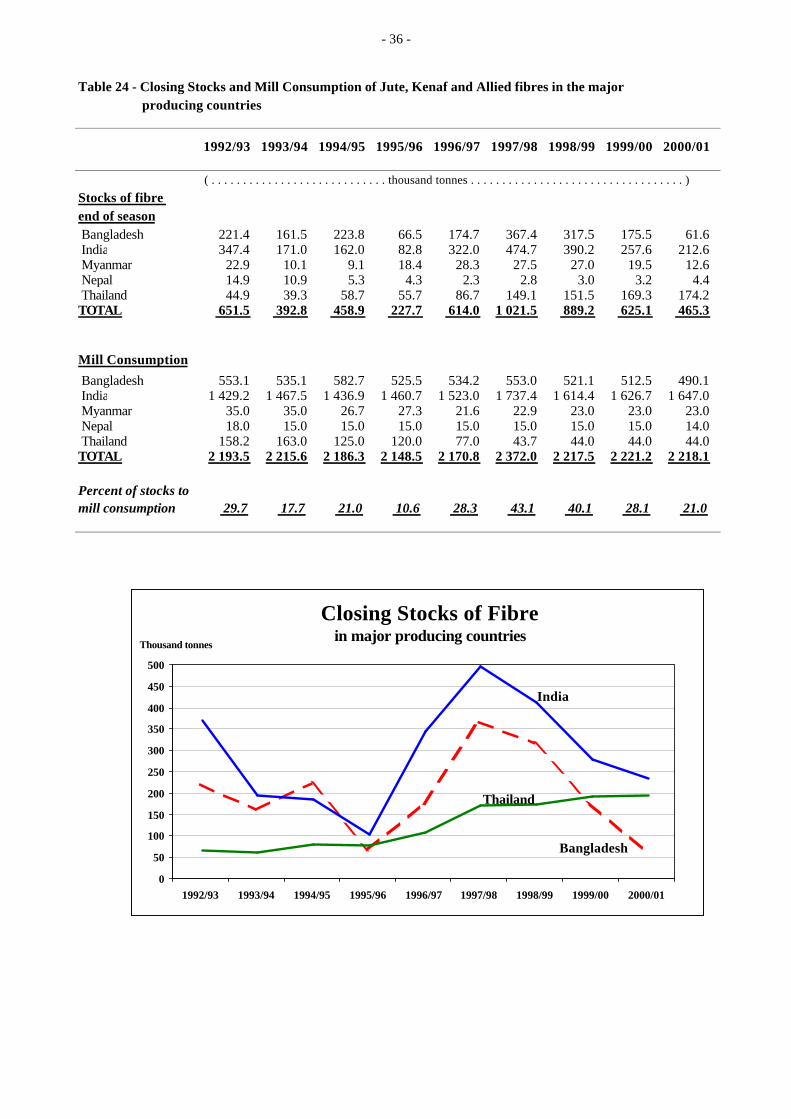
Table 24 - Closing Stocks and Mill Consumption of Jute, Kenaf and Allied fibres in the major producing countries
1992/93 1993/94 1994/95 1995/96 1996/97 1997/98 1998/99 1999/00 2000/01
( . . . . . . . . . . . . . . . . . . . . . . . . . . . . thousand tonnes . . . . . . . . . . . . . . . . . . . . . . . . . . . . . . . . . . )
Stocks of fibre end of season Bangladesh 221.4 161.5 223.8 66.5 174.7 367.4 317.5 175.5 61.6 India 347.4 171.0 162.0 82.8 322.0 474.7 390.2 257.6 212.6 Myanmar 22.9 10.1 9.1 18.4 28.3 27.5 27.0 19.5 12.6 Nepal 14.9 10.9 5.3 4.3 2.3 2.8 3.0 3.2 4.4 Thailand 44.9 39.3 58.7 55.7 86.7 149.1 151.5 169.3 174.2TOTAL 651.5 392.8 458.9 227.7 614.0 1 021.5 889.2 625.1 465.3
Mill Consumption
Bangladesh 553.1 535.1 582.7 525.5 534.2 553.0 521.1 512.5 490.1 India 1 429.2 1 467.5 1 436.9 1 460.7 1 523.0 1 737.4 1 614.4 1 626.7 1 647.0 Myanmar 35.0 35.0 26.7 27.3 21.6 22.9 23.0 23.0 23.0 Nepal 18.0 15.0 15.0 15.0 15.0 15.0 15.0 15.0 14.0 Thailand 158.2 163.0 125.0 120.0 77.0 43.7 44.0 44.0 44.0TOTAL 2 193.5 2 215.6 2 186.3 2 148.5 2 170.8 2 372.0 2 217.5 2 221.2 2 218.1
Percent of stocks tomill consumption 29.7 17.7 21.0 10.6 28.3 43.1 40.1 28.1 21.0
0
50
100
150
200
250
300
350
400
450
500
1992/93 1993/94 1994/95 1995/96 1996/97 1997/98 1998/99 1999/00 2000/01
Thousand tonnes
Closing Stocks of Fibrein major producing countries
India
Thailand
Bangladesh
- 37 -
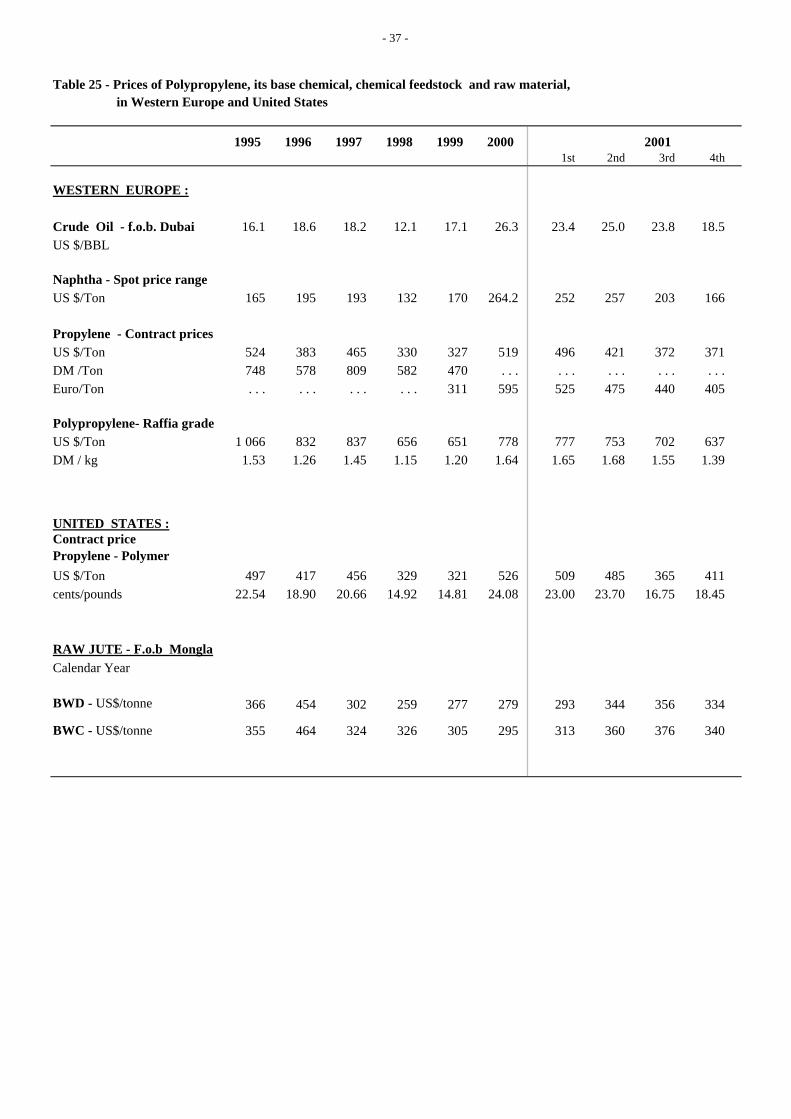
Table 25 - Prices of Polypropylene, its base chemical, chemical feedstock and raw material, in Western Europe and United States
1995 1996 1997 1998 1999 2000 20011st 2nd 3rd 4th
WESTERN EUROPE :
Crude Oil - f.o.b. Dubai 16.1 18.6 18.2 12.1 17.1 26.3 23.4 25.0 23.8 18.5US $/BBL
Naphtha - Spot price rangeUS $/Ton 165 195 193 132 170 264.2 252 257 203 166
Propylene - Contract pricesUS $/Ton 524 383 465 330 327 519 496 421 372 371DM /Ton 748 578 809 582 470 . . . . . . . . . . . . . . .Euro/Ton . . . . . . . . . . . . 311 595 525 475 440 405
Polypropylene- Raffia gradeUS $/Ton 1 066 832 837 656 651 778 777 753 702 637DM / kg 1.53 1.26 1.45 1.15 1.20 1.64 1.65 1.68 1.55 1.39
UNITED STATES :Contract pricePropylene - PolymerUS $/Ton 497 417 456 329 321 526 509 485 365 411cents/pounds 22.54 18.90 20.66 14.92 14.81 24.08 23.00 23.70 16.75 18.45
RAW JUTE - F.o.b MonglaCalendar Year
BWD - US$/tonne 366 454 302 259 277 279 293 344 356 334
BWC - US$/tonne 355 464 324 326 305 295 313 360 376 340
- 38 -
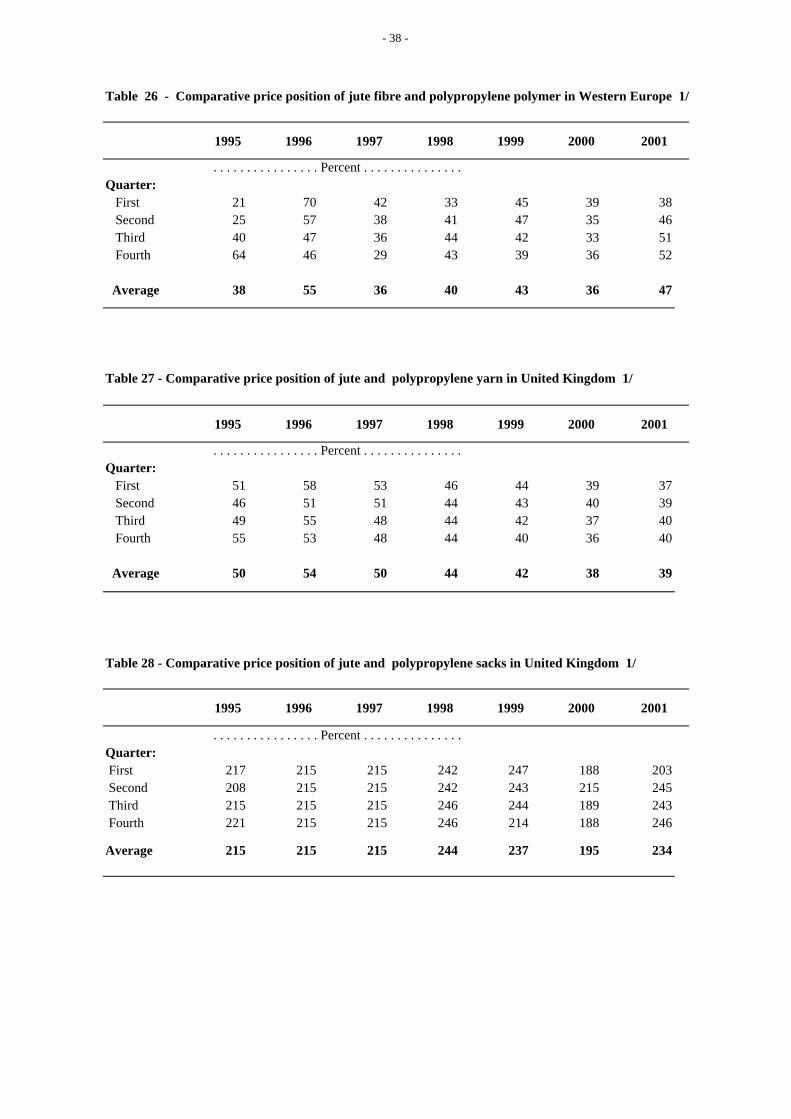
Table 26 - Comparative price position of jute fibre and polypropylene polymer in Western Europe 1/
1995 1996 1997 1998 1999 2000 2001
. . . . . . . . . . . . . . . . Percent . . . . . . . . . . . . . . . Quarter: First 21 70 42 33 45 39 38 Second 25 57 38 41 47 35 46 Third 40 47 36 44 42 33 51 Fourth 64 46 29 43 39 36 52
Average 38 55 36 40 43 36 47
Table 27 - Comparative price position of jute and polypropylene yarn in United Kingdom 1/
1995 1996 1997 1998 1999 2000 2001
. . . . . . . . . . . . . . . . Percent . . . . . . . . . . . . . . . Quarter: First 51 58 53 46 44 39 37 Second 46 51 51 44 43 40 39 Third 49 55 48 44 42 37 40 Fourth 55 53 48 44 40 36 40
Average 50 54 50 44 42 38 39
Table 28 - Comparative price position of jute and polypropylene sacks in United Kingdom 1/
1995 1996 1997 1998 1999 2000 2001
. . . . . . . . . . . . . . . . Percent . . . . . . . . . . . . . . . Quarter: First 217 215 215 242 247 188 203 Second 208 215 215 242 243 215 245 Third 215 215 215 246 244 189 243 Fourth 221 215 215 246 214 188 246
Average 215 215 215 244 237 195 234
- 39 -
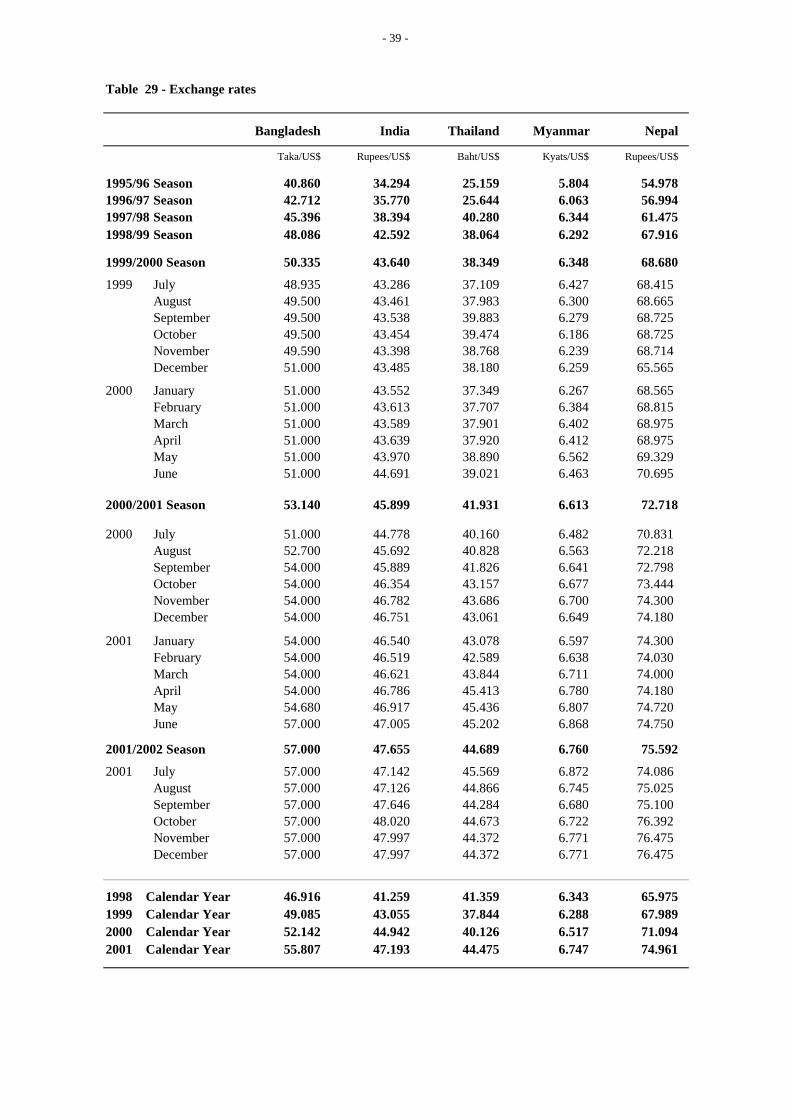
Table 29 - Exchange rates
Bangladesh India Thailand Myanmar Nepal
Taka/US$ Rupees/US$ Baht/US$ Kyats/US$ Rupees/US$
1995/96 Season 40.860 34.294 25.159 5.804 54.9781996/97 Season 42.712 35.770 25.644 6.063 56.9941997/98 Season 45.396 38.394 40.280 6.344 61.4751998/99 Season 48.086 42.592 38.064 6.292 67.916
1999/2000 Season 50.335 43.640 38.349 6.348 68.680
1999 July 48.935 43.286 37.109 6.427 68.415August 49.500 43.461 37.983 6.300 68.665September 49.500 43.538 39.883 6.279 68.725October 49.500 43.454 39.474 6.186 68.725November 49.590 43.398 38.768 6.239 68.714December 51.000 43.485 38.180 6.259 65.565
2000 January 51.000 43.552 37.349 6.267 68.565February 51.000 43.613 37.707 6.384 68.815March 51.000 43.589 37.901 6.402 68.975April 51.000 43.639 37.920 6.412 68.975May 51.000 43.970 38.890 6.562 69.329June 51.000 44.691 39.021 6.463 70.695
2000/2001 Season 53.140 45.899 41.931 6.613 72.718
2000 July 51.000 44.778 40.160 6.482 70.831August 52.700 45.692 40.828 6.563 72.218September 54.000 45.889 41.826 6.641 72.798October 54.000 46.354 43.157 6.677 73.444November 54.000 46.782 43.686 6.700 74.300December 54.000 46.751 43.061 6.649 74.180
2001 January 54.000 46.540 43.078 6.597 74.300February 54.000 46.519 42.589 6.638 74.030March 54.000 46.621 43.844 6.711 74.000April 54.000 46.786 45.413 6.780 74.180May 54.680 46.917 45.436 6.807 74.720June 57.000 47.005 45.202 6.868 74.750
2001/2002 Season 57.000 47.655 44.689 6.760 75.592
2001 July 57.000 47.142 45.569 6.872 74.086August 57.000 47.126 44.866 6.745 75.025September 57.000 47.646 44.284 6.680 75.100October 57.000 48.020 44.673 6.722 76.392November 57.000 47.997 44.372 6.771 76.475December 57.000 47.997 44.372 6.771 76.475
1998 Calendar Year 46.916 41.259 41.359 6.343 65.9751999 Calendar Year 49.085 43.055 37.844 6.288 67.9892000 Calendar Year 52.142 44.942 40.126 6.517 71.0942001 Calendar Year 55.807 47.193 44.475 6.747 74.961
- 40 -
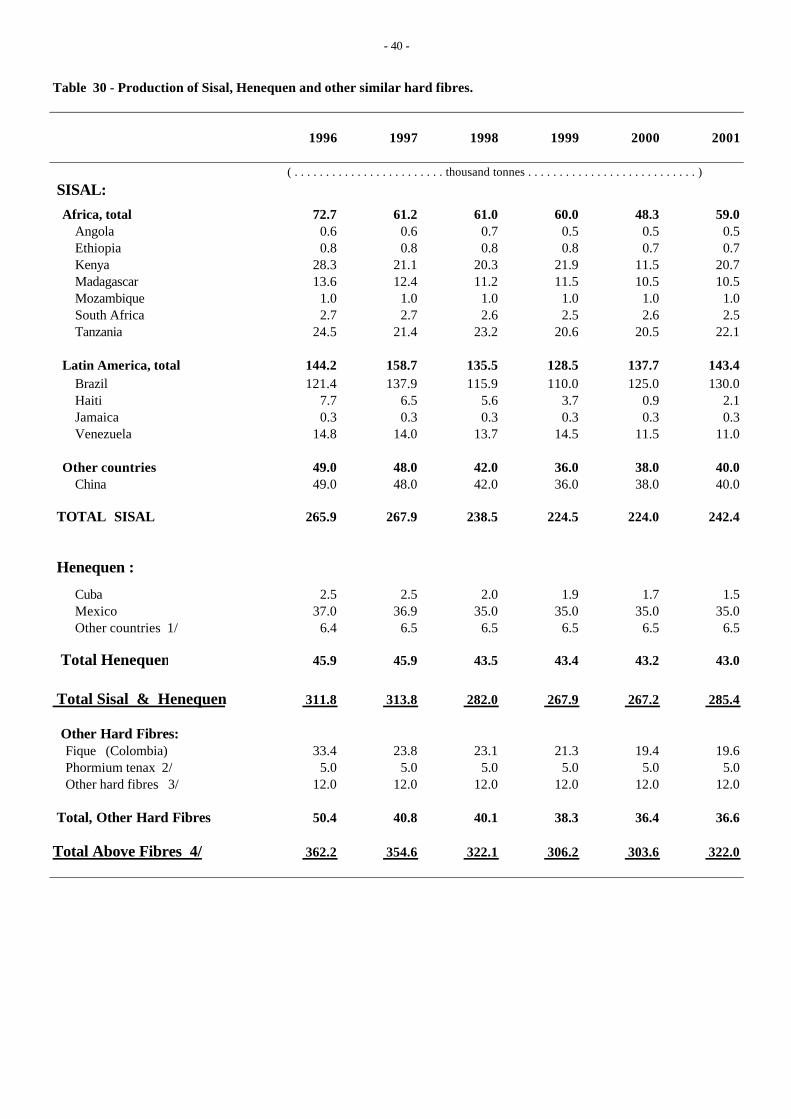
Table 30 - Production of Sisal, Henequen and other similar hard fibres.
1996 1997 1998 1999 2000 2001
( . . . . . . . . . . . . . . . . . . . . . . . . thousand tonnes . . . . . . . . . . . . . . . . . . . . . . . . . . . )
SISAL: Africa, total 72.7 61.2 61.0 60.0 48.3 59.0
Angola 0.6 0.6 0.7 0.5 0.5 0.5 Ethiopia 0.8 0.8 0.8 0.8 0.7 0.7 Kenya 28.3 21.1 20.3 21.9 11.5 20.7 Madagascar 13.6 12.4 11.2 11.5 10.5 10.5 Mozambique 1.0 1.0 1.0 1.0 1.0 1.0 South Africa 2.7 2.7 2.6 2.5 2.6 2.5 Tanzania 24.5 21.4 23.2 20.6 20.5 22.1
Latin America, total 144.2 158.7 135.5 128.5 137.7 143.4 Brazil 121.4 137.9 115.9 110.0 125.0 130.0 Haiti 7.7 6.5 5.6 3.7 0.9 2.1 Jamaica 0.3 0.3 0.3 0.3 0.3 0.3 Venezuela 14.8 14.0 13.7 14.5 11.5 11.0
Other countries 49.0 48.0 42.0 36.0 38.0 40.0 China 49.0 48.0 42.0 36.0 38.0 40.0
TOTAL SISAL 265.9 267.9 238.5 224.5 224.0 242.4
Henequen :
Cuba 2.5 2.5 2.0 1.9 1.7 1.5 Mexico 37.0 36.9 35.0 35.0 35.0 35.0 Other countries 1/ 6.4 6.5 6.5 6.5 6.5 6.5
Total Henequen 45.9 45.9 43.5 43.4 43.2 43.0
Total Sisal & Henequen 311.8 313.8 282.0 267.9 267.2 285.4
Other Hard Fibres: Fique (Colombia) 33.4 23.8 23.1 21.3 19.4 19.6 Phormium tenax 2/ 5.0 5.0 5.0 5.0 5.0 5.0 Other hard fibres 3/ 12.0 12.0 12.0 12.0 12.0 12.0 Total, Other Hard Fibres 50.4 40.8 40.1 38.3 36.4 36.6 Total Above Fibres 4/ 362.2 354.6 322.1 306.2 303.6 322.0
- 41 -
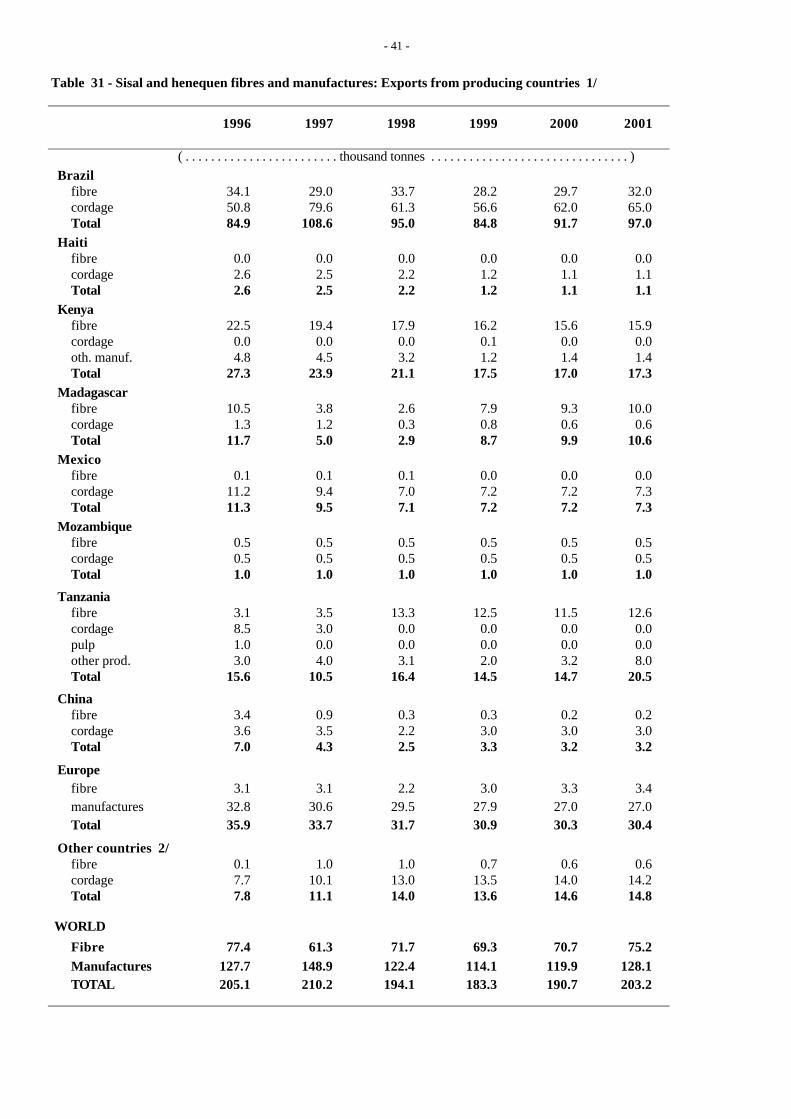
Table 31 - Sisal and henequen fibres and manufactures: Exports from producing countries 1/
1996 1997 1998 1999 2000 2001
( . . . . . . . . . . . . . . . . . . . . . . . . thousand tonnes . . . . . . . . . . . . . . . . . . . . . . . . . . . . . . . ) Brazil
fibre 34.1 29.0 33.7 28.2 29.7 32.0cordage 50.8 79.6 61.3 56.6 62.0 65.0Total 84.9 108.6 95.0 84.8 91.7 97.0
Haitifibre 0.0 0.0 0.0 0.0 0.0 0.0cordage 2.6 2.5 2.2 1.2 1.1 1.1Total 2.6 2.5 2.2 1.2 1.1 1.1
Kenyafibre 22.5 19.4 17.9 16.2 15.6 15.9cordage 0.0 0.0 0.0 0.1 0.0 0.0oth. manuf. 4.8 4.5 3.2 1.2 1.4 1.4Total 27.3 23.9 21.1 17.5 17.0 17.3
Madagascarfibre 10.5 3.8 2.6 7.9 9.3 10.0cordage 1.3 1.2 0.3 0.8 0.6 0.6Total 11.7 5.0 2.9 8.7 9.9 10.6
Mexicofibre 0.1 0.1 0.1 0.0 0.0 0.0cordage 11.2 9.4 7.0 7.2 7.2 7.3Total 11.3 9.5 7.1 7.2 7.2 7.3
Mozambiquefibre 0.5 0.5 0.5 0.5 0.5 0.5cordage 0.5 0.5 0.5 0.5 0.5 0.5Total 1.0 1.0 1.0 1.0 1.0 1.0
Tanzaniafibre 3.1 3.5 13.3 12.5 11.5 12.6cordage 8.5 3.0 0.0 0.0 0.0 0.0 pulp 1.0 0.0 0.0 0.0 0.0 0.0other prod. 3.0 4.0 3.1 2.0 3.2 8.0Total 15.6 10.5 16.4 14.5 14.7 20.5
Chinafibre 3.4 0.9 0.3 0.3 0.2 0.2cordage 3.6 3.5 2.2 3.0 3.0 3.0Total 7.0 4.3 2.5 3.3 3.2 3.2
Europefibre 3.1 3.1 2.2 3.0 3.3 3.4manufactures 32.8 30.6 29.5 27.9 27.0 27.0Total 35.9 33.7 31.7 30.9 30.3 30.4
Other countries 2/fibre 0.1 1.0 1.0 0.7 0.6 0.6cordage 7.7 10.1 13.0 13.5 14.0 14.2Total 7.8 11.1 14.0 13.6 14.6 14.8
WORLD
Fibre 77.4 61.3 71.7 69.3 70.7 75.2Manufactures 127.7 148.9 122.4 114.1 119.9 128.1TOTAL 205.1 210.2 194.1 183.3 190.7 203.2
- 42 -
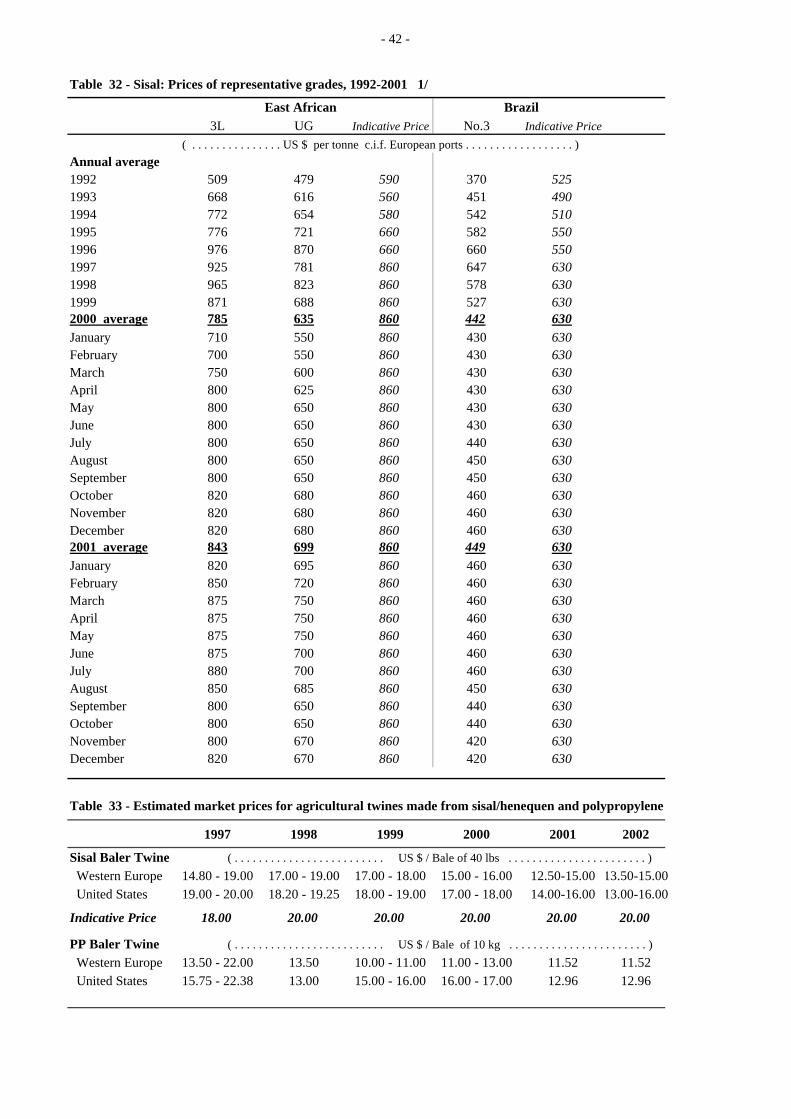
Table 32 - Sisal: Prices of representative grades, 1992-2001 1/
East African Brazil3L UG Indicative Price No.3 Indicative Price
( . . . . . . . . . . . . . . . US $ per tonne c.i.f. European ports . . . . . . . . . . . . . . . . . . )Annual average1992 509 479 590 370 5251993 668 616 560 451 4901994 772 654 580 542 5101995 776 721 660 582 5501996 976 870 660 660 5501997 925 781 860 647 6301998 965 823 860 578 6301999 871 688 860 527 6302000 average 785 635 860 442 630January 710 550 860 430 630February 700 550 860 430 630March 750 600 860 430 630April 800 625 860 430 630May 800 650 860 430 630June 800 650 860 430 630July 800 650 860 440 630August 800 650 860 450 630September 800 650 860 450 630October 820 680 860 460 630November 820 680 860 460 630December 820 680 860 460 6302001 average 843 699 860 449 630January 820 695 860 460 630February 850 720 860 460 630March 875 750 860 460 630April 875 750 860 460 630May 875 750 860 460 630June 875 700 860 460 630July 880 700 860 460 630August 850 685 860 450 630September 800 650 860 440 630October 800 650 860 440 630November 800 670 860 420 630December 820 670 860 420 630
Table 33 - Estimated market prices for agricultural twines made from sisal/henequen and polypropylene
1997 1998 1999 2000 2001 2002
Sisal Baler Twine ( . . . . . . . . . . . . . . . . . . . . . . . . . US $ / Bale of 40 lbs . . . . . . . . . . . . . . . . . . . . . . . )
Western Europe 14.80 - 19.00 17.00 - 19.00 17.00 - 18.00 15.00 - 16.00 12.50-15.00 13.50-15.00 United States 19.00 - 20.00 18.20 - 19.25 18.00 - 19.00 17.00 - 18.00 14.00-16.00 13.00-16.00
Indicative Price 18.00 20.00 20.00 20.00 20.00 20.00
PP Baler Twine ( . . . . . . . . . . . . . . . . . . . . . . . . . US $ / Bale of 10 kg . . . . . . . . . . . . . . . . . . . . . . . )
Western Europe 13.50 - 22.00 13.50 10.00 - 11.00 11.00 - 13.00 11.52 11.52 United States 15.75 - 22.38 13.00 15.00 - 16.00 16.00 - 17.00 12.96 12.96
- 43 -
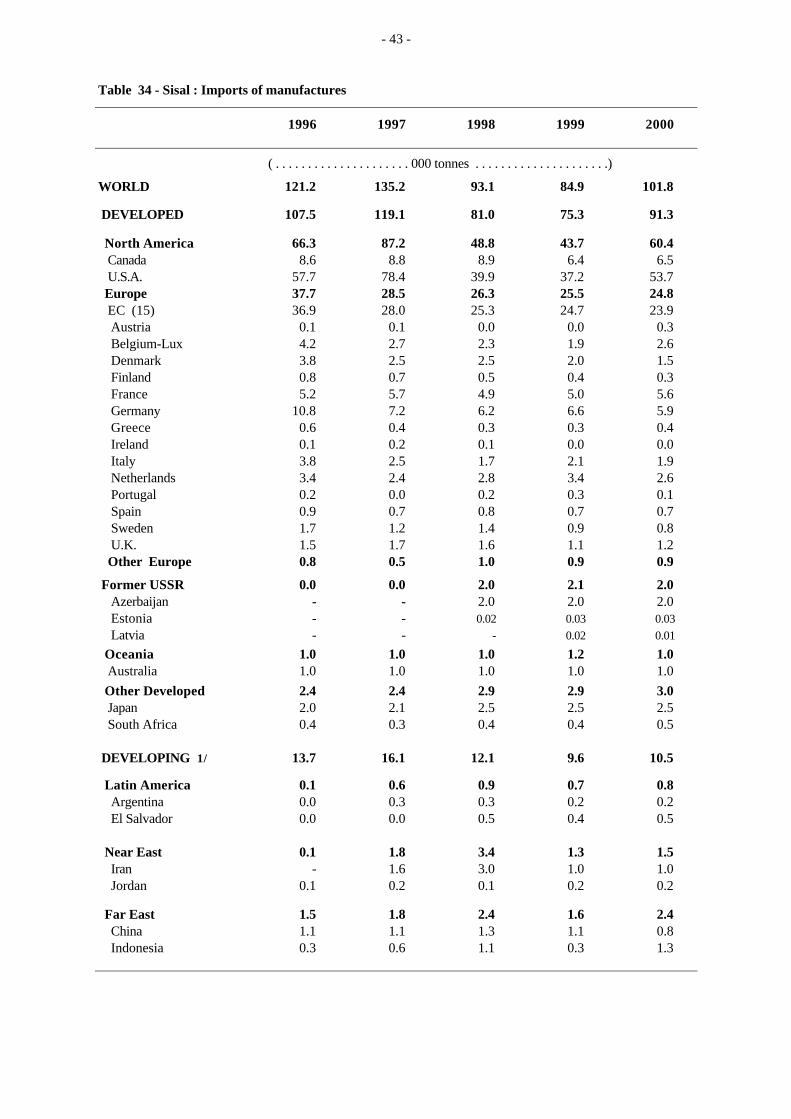
Table 34 - Sisal : Imports of manufactures
1996 1997 1998 1999 2000
( . . . . . . . . . . . . . . . . . . . . . 000 tonnes . . . . . . . . . . . . . . . . . . . . .)
WORLD 121.2 135.2 93.1 84.9 101.8
DEVELOPED 107.5 119.1 81.0 75.3 91.3
North America 66.3 87.2 48.8 43.7 60.4 Canada 8.6 8.8 8.9 6.4 6.5 U.S.A. 57.7 78.4 39.9 37.2 53.7 Europe 37.7 28.5 26.3 25.5 24.8 EC (15) 36.9 28.0 25.3 24.7 23.9 Austria 0.1 0.1 0.0 0.0 0.3 Belgium-Lux 4.2 2.7 2.3 1.9 2.6 Denmark 3.8 2.5 2.5 2.0 1.5 Finland 0.8 0.7 0.5 0.4 0.3 France 5.2 5.7 4.9 5.0 5.6 Germany 10.8 7.2 6.2 6.6 5.9 Greece 0.6 0.4 0.3 0.3 0.4 Ireland 0.1 0.2 0.1 0.0 0.0 Italy 3.8 2.5 1.7 2.1 1.9 Netherlands 3.4 2.4 2.8 3.4 2.6 Portugal 0.2 0.0 0.2 0.3 0.1 Spain 0.9 0.7 0.8 0.7 0.7 Sweden 1.7 1.2 1.4 0.9 0.8 U.K. 1.5 1.7 1.6 1.1 1.2 Other Europe 0.8 0.5 1.0 0.9 0.9
Former USSR 0.0 0.0 2.0 2.1 2.0 Azerbaijan - - 2.0 2.0 2.0 Estonia - - 0.02 0.03 0.03 Latvia - - - 0.02 0.01
Oceania 1.0 1.0 1.0 1.2 1.0 Australia 1.0 1.0 1.0 1.0 1.0 Other Developed 2.4 2.4 2.9 2.9 3.0 Japan 2.0 2.1 2.5 2.5 2.5 South Africa 0.4 0.3 0.4 0.4 0.5
DEVELOPING 1/ 13.7 16.1 12.1 9.6 10.5
Latin America 0.1 0.6 0.9 0.7 0.8 Argentina 0.0 0.3 0.3 0.2 0.2 El Salvador 0.0 0.0 0.5 0.4 0.5
Near East 0.1 1.8 3.4 1.3 1.5 Iran - 1.6 3.0 1.0 1.0 Jordan 0.1 0.2 0.1 0.2 0.2
Far East 1.5 1.8 2.4 1.6 2.4 China 1.1 1.1 1.3 1.1 0.8 Indonesia 0.3 0.6 1.1 0.3 1.3
- 44 -
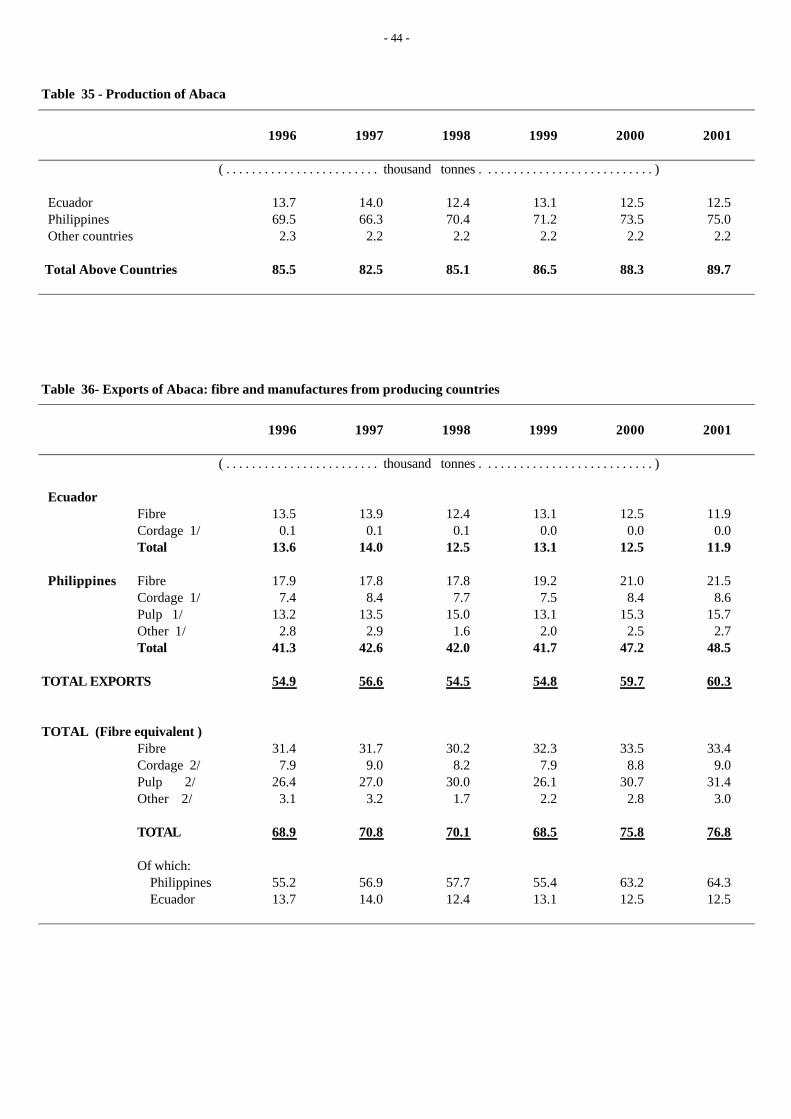
Table 35 - Production of Abaca
1996 1997 1998 1999 2000 2001
( . . . . . . . . . . . . . . . . . . . . . . . . thousand tonnes . . . . . . . . . . . . . . . . . . . . . . . . . . . )
Ecuador 13.7 14.0 12.4 13.1 12.5 12.5 Philippines 69.5 66.3 70.4 71.2 73.5 75.0 Other countries 2.3 2.2 2.2 2.2 2.2 2.2
Total Above Countries 85.5 82.5 85.1 86.5 88.3 89.7
Table 36- Exports of Abaca: fibre and manufactures from producing countries
1996 1997 1998 1999 2000 2001
( . . . . . . . . . . . . . . . . . . . . . . . . thousand tonnes . . . . . . . . . . . . . . . . . . . . . . . . . . . )
EcuadorFibre 13.5 13.9 12.4 13.1 12.5 11.9
Cordage 1/ 0.1 0.1 0.1 0.0 0.0 0.0Total 13.6 14.0 12.5 13.1 12.5 11.9
Philippines Fibre 17.9 17.8 17.8 19.2 21.0 21.5Cordage 1/ 7.4 8.4 7.7 7.5 8.4 8.6Pulp 1/ 13.2 13.5 15.0 13.1 15.3 15.7Other 1/ 2.8 2.9 1.6 2.0 2.5 2.7Total 41.3 42.6 42.0 41.7 47.2 48.5
TOTAL EXPORTS 54.9 56.6 54.5 54.8 59.7 60.3
TOTAL (Fibre equivalent )Fibre 31.4 31.7 30.2 32.3 33.5 33.4Cordage 2/ 7.9 9.0 8.2 7.9 8.8 9.0
Pulp 2/ 26.4 27.0 30.0 26.1 30.7 31.4
Other 2/ 3.1 3.2 1.7 2.2 2.8 3.0
TOTAL 68.9 70.8 70.1 68.5 75.8 76.8
Of which:
Philippines 55.2 56.9 57.7 55.4 63.2 64.3 Ecuador 13.7 14.0 12.4 13.1 12.5 12.5
- 45 -
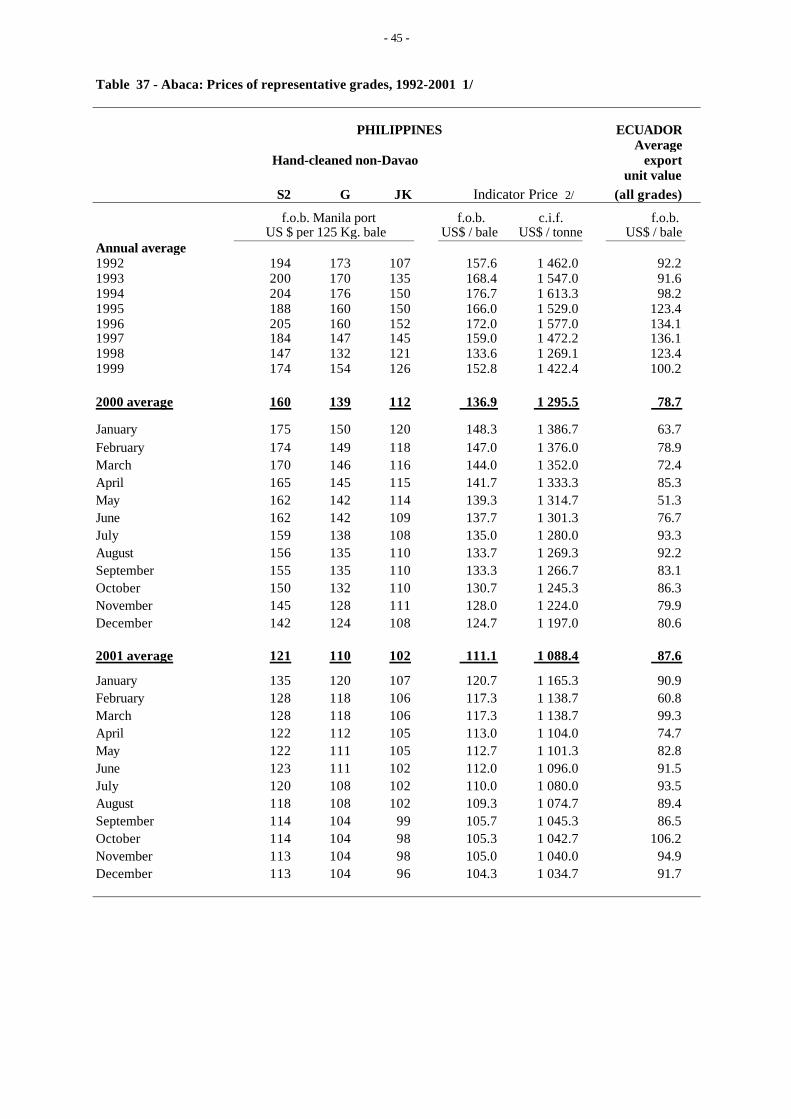
Table 37 - Abaca: Prices of representative grades, 1992-2001 1/
PHILIPPINES ECUADORAverage
Hand-cleaned non-Davao exportunit value
S2 G JK Indicator Price 2/ (all grades)
f.o.b. Manila port f.o.b. c.i.f. f.o.b. US $ per 125 Kg. bale US$ / bale US$ / tonne US$ / bale
Annual average1992 194 173 107 157.6 1 462.0 92.21993 200 170 135 168.4 1 547.0 91.61994 204 176 150 176.7 1 613.3 98.21995 188 160 150 166.0 1 529.0 123.41996 205 160 152 172.0 1 577.0 134.11997 184 147 145 159.0 1 472.2 136.11998 147 132 121 133.6 1 269.1 123.41999 174 154 126 152.8 1 422.4 100.2
2000 average 160 139 112 136.9 1 295.5 78.7
January 175 150 120 148.3 1 386.7 63.7February 174 149 118 147.0 1 376.0 78.9March 170 146 116 144.0 1 352.0 72.4April 165 145 115 141.7 1 333.3 85.3May 162 142 114 139.3 1 314.7 51.3June 162 142 109 137.7 1 301.3 76.7July 159 138 108 135.0 1 280.0 93.3August 156 135 110 133.7 1 269.3 92.2September 155 135 110 133.3 1 266.7 83.1October 150 132 110 130.7 1 245.3 86.3November 145 128 111 128.0 1 224.0 79.9December 142 124 108 124.7 1 197.0 80.6
2001 average 121 110 102 111.1 1 088.4 87.6
January 135 120 107 120.7 1 165.3 90.9February 128 118 106 117.3 1 138.7 60.8March 128 118 106 117.3 1 138.7 99.3April 122 112 105 113.0 1 104.0 74.7May 122 111 105 112.7 1 101.3 82.8June 123 111 102 112.0 1 096.0 91.5July 120 108 102 110.0 1 080.0 93.5August 118 108 102 109.3 1 074.7 89.4September 114 104 99 105.7 1 045.3 86.5October 114 104 98 105.3 1 042.7 106.2November 113 104 98 105.0 1 040.0 94.9December 113 104 96 104.3 1 034.7 91.7
- 46 -
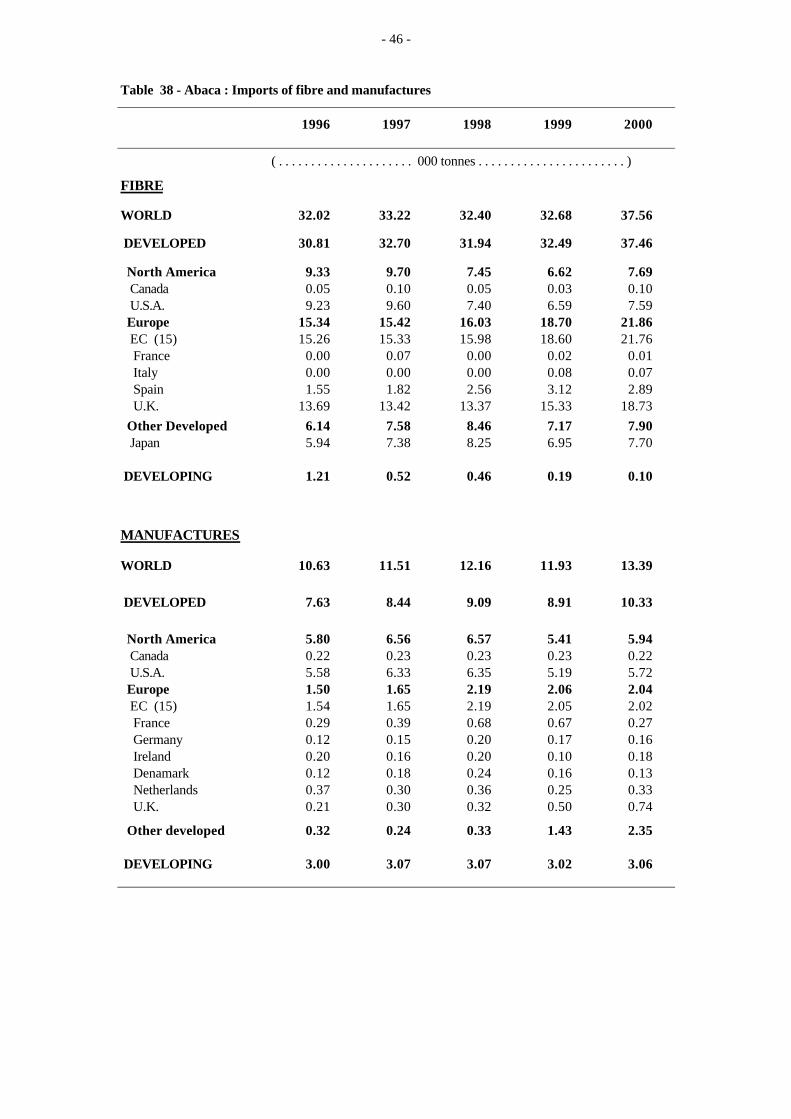
Table 38 - Abaca : Imports of fibre and manufactures
1996 1997 1998 1999 2000
( . . . . . . . . . . . . . . . . . . . . . 000 tonnes . . . . . . . . . . . . . . . . . . . . . . . )
FIBRE
WORLD 32.02 33.22 32.40 32.68 37.56
DEVELOPED 30.81 32.70 31.94 32.49 37.46
North America 9.33 9.70 7.45 6.62 7.69 Canada 0.05 0.10 0.05 0.03 0.10 U.S.A. 9.23 9.60 7.40 6.59 7.59 Europe 15.34 15.42 16.03 18.70 21.86 EC (15) 15.26 15.33 15.98 18.60 21.76 France 0.00 0.07 0.00 0.02 0.01 Italy 0.00 0.00 0.00 0.08 0.07 Spain 1.55 1.82 2.56 3.12 2.89 U.K. 13.69 13.42 13.37 15.33 18.73 Other Developed 6.14 7.58 8.46 7.17 7.90 Japan 5.94 7.38 8.25 6.95 7.70
DEVELOPING 1.21 0.52 0.46 0.19 0.10
MANUFACTURES
WORLD 10.63 11.51 12.16 11.93 13.39
DEVELOPED 7.63 8.44 9.09 8.91 10.33
North America 5.80 6.56 6.57 5.41 5.94 Canada 0.22 0.23 0.23 0.23 0.22 U.S.A. 5.58 6.33 6.35 5.19 5.72 Europe 1.50 1.65 2.19 2.06 2.04 EC (15) 1.54 1.65 2.19 2.05 2.02 France 0.29 0.39 0.68 0.67 0.27 Germany 0.12 0.15 0.20 0.17 0.16 Ireland 0.20 0.16 0.20 0.10 0.18 Denamark 0.12 0.18 0.24 0.16 0.13 Netherlands 0.37 0.30 0.36 0.25 0.33 U.K. 0.21 0.30 0.32 0.50 0.74
Other developed 0.32 0.24 0.33 1.43 2.35
DEVELOPING 3.00 3.07 3.07 3.02 3.06
- 47 -
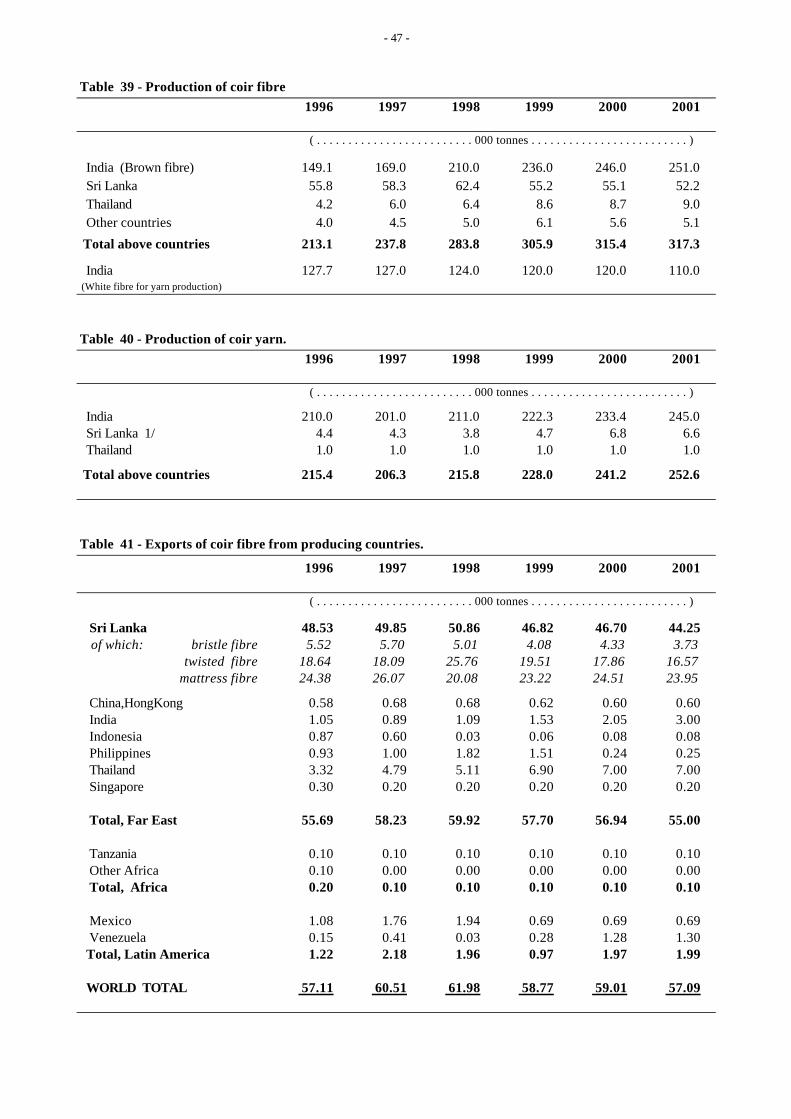
Table 39 - Production of coir fibre1996 1997 1998 1999 2000 2001
( . . . . . . . . . . . . . . . . . . . . . . . . . 000 tonnes . . . . . . . . . . . . . . . . . . . . . . . . . )
India (Brown fibre) 149.1 169.0 210.0 236.0 246.0 251.0 Sri Lanka 55.8 58.3 62.4 55.2 55.1 52.2 Thailand 4.2 6.0 6.4 8.6 8.7 9.0 Other countries 4.0 4.5 5.0 6.1 5.6 5.1
Total above countries 213.1 237.8 283.8 305.9 315.4 317.3
India 127.7 127.0 124.0 120.0 120.0 110.0 (White fibre for yarn production)
Table 40 - Production of coir yarn.1996 1997 1998 1999 2000 2001
( . . . . . . . . . . . . . . . . . . . . . . . . . 000 tonnes . . . . . . . . . . . . . . . . . . . . . . . . . )
India 210.0 201.0 211.0 222.3 233.4 245.0 Sri Lanka 1/ 4.4 4.3 3.8 4.7 6.8 6.6 Thailand 1.0 1.0 1.0 1.0 1.0 1.0
Total above countries 215.4 206.3 215.8 228.0 241.2 252.6
Table 41 - Exports of coir fibre from producing countries.
1996 1997 1998 1999 2000 2001
( . . . . . . . . . . . . . . . . . . . . . . . . . 000 tonnes . . . . . . . . . . . . . . . . . . . . . . . . . )
Sri Lanka 48.53 49.85 50.86 46.82 46.70 44.25of which: bristle fibre 5.52 5.70 5.01 4.08 4.33 3.73
twisted fibre 18.64 18.09 25.76 19.51 17.86 16.57mattress fibre 24.38 26.07 20.08 23.22 24.51 23.95
China,HongKong 0.58 0.68 0.68 0.62 0.60 0.60 India 1.05 0.89 1.09 1.53 2.05 3.00 Indonesia 0.87 0.60 0.03 0.06 0.08 0.08 Philippines 0.93 1.00 1.82 1.51 0.24 0.25 Thailand 3.32 4.79 5.11 6.90 7.00 7.00 Singapore 0.30 0.20 0.20 0.20 0.20 0.20
Total, Far East 55.69 58.23 59.92 57.70 56.94 55.00
Tanzania 0.10 0.10 0.10 0.10 0.10 0.10 Other Africa 0.10 0.00 0.00 0.00 0.00 0.00 Total, Africa 0.20 0.10 0.10 0.10 0.10 0.10
Mexico 1.08 1.76 1.94 0.69 0.69 0.69 Venezuela 0.15 0.41 0.03 0.28 1.28 1.30 Total, Latin America 1.22 2.18 1.96 0.97 1.97 1.99
WORLD TOTAL 57.11 60.51 61.98 58.77 59.01 57.09
- 48 -
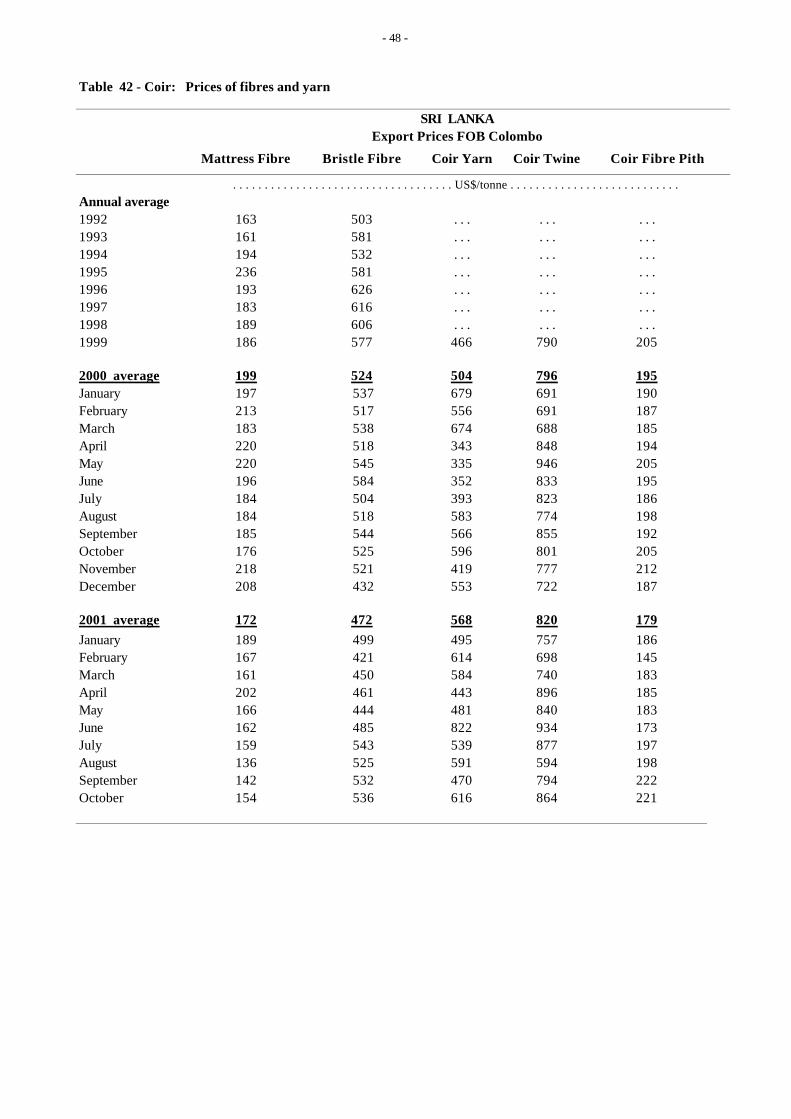
Table 42 - Coir: Prices of fibres and yarn
SRI LANKAExport Prices FOB Colombo
Mattress Fibre Bristle Fibre Coir Yarn Coir Twine Coir Fibre Pith
. . . . . . . . . . . . . . . . . . . . . . . . . . . . . . . . . . . US$/tonne . . . . . . . . . . . . . . . . . . . . . . . . . . . Annual average1992 163 503 . . . . . . . . .1993 161 581 . . . . . . . . .1994 194 532 . . . . . . . . .1995 236 581 . . . . . . . . .1996 193 626 . . . . . . . . .1997 183 616 . . . . . . . . .1998 189 606 . . . . . . . . .1999 186 577 466 790 205
2000 average 199 524 504 796 195January 197 537 679 691 190February 213 517 556 691 187March 183 538 674 688 185April 220 518 343 848 194May 220 545 335 946 205June 196 584 352 833 195July 184 504 393 823 186August 184 518 583 774 198September 185 544 566 855 192October 176 525 596 801 205November 218 521 419 777 212December 208 432 553 722 187
2001 average 172 472 568 820 179January 189 499 495 757 186February 167 421 614 698 145March 161 450 584 740 183April 202 461 443 896 185May 166 444 481 840 183June 162 485 822 934 173July 159 543 539 877 197August 136 525 591 594 198September 142 532 470 794 222October 154 536 616 864 221
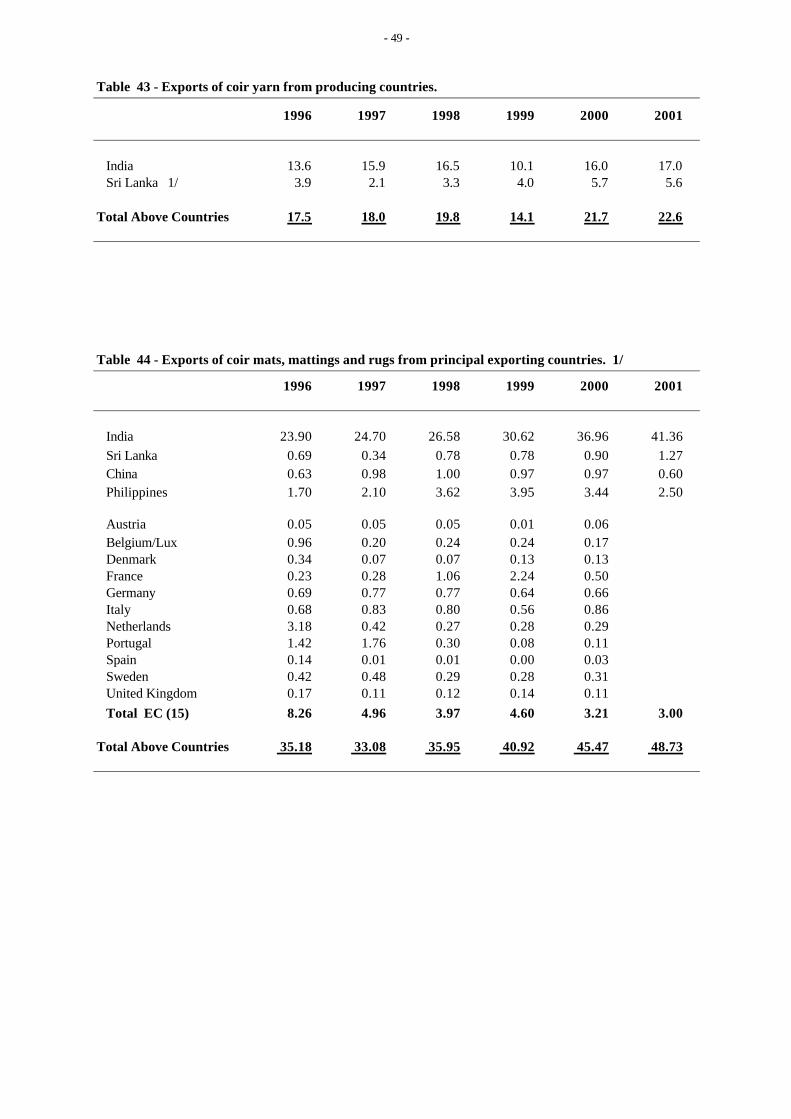
- 49 -
Table 43 - Exports of coir yarn from producing countries.
1996 1997 1998 1999 2000 2001
India 13.6 15.9 16.5 10.1 16.0 17.0 Sri Lanka 1/ 3.9 2.1 3.3 4.0 5.7 5.6
Total Above Countries 17.5 18.0 19.8 14.1 21.7 22.6
Table 44 - Exports of coir mats, mattings and rugs from principal exporting countries. 1/
1996 1997 1998 1999 2000 2001
India 23.90 24.70 26.58 30.62 36.96 41.36Sri Lanka 0.69 0.34 0.78 0.78 0.90 1.27China 0.63 0.98 1.00 0.97 0.97 0.60Philippines 1.70 2.10 3.62 3.95 3.44 2.50
Austria 0.05 0.05 0.05 0.01 0.06 Belgium/Lux 0.96 0.20 0.24 0.24 0.17 Denmark 0.34 0.07 0.07 0.13 0.13 France 0.23 0.28 1.06 2.24 0.50 Germany 0.69 0.77 0.77 0.64 0.66 Italy 0.68 0.83 0.80 0.56 0.86 Netherlands 3.18 0.42 0.27 0.28 0.29 Portugal 1.42 1.76 0.30 0.08 0.11 Spain 0.14 0.01 0.01 0.00 0.03 Sweden 0.42 0.48 0.29 0.28 0.31 United Kingdom 0.17 0.11 0.12 0.14 0.11 Total EC (15) 8.26 4.96 3.97 4.60 3.21 3.00
Total Above Countries 35.18 33.08 35.95 40.92 45.47 48.73
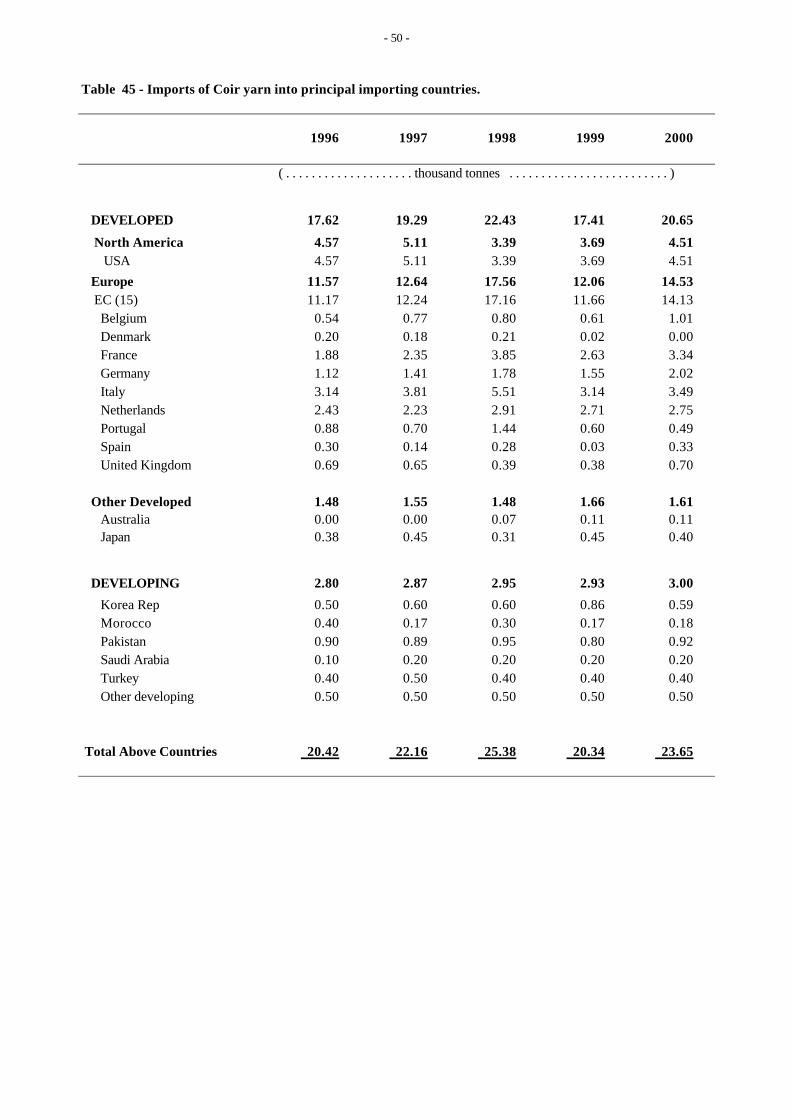
- 50 -
Table 45 - Imports of Coir yarn into principal importing countries.
1996 1997 1998 1999 2000
( . . . . . . . . . . . . . . . . . . . . thousand tonnes . . . . . . . . . . . . . . . . . . . . . . . . . )
DEVELOPED 17.62 19.29 22.43 17.41 20.65
North America 4.57 5.11 3.39 3.69 4.51 USA 4.57 5.11 3.39 3.69 4.51
Europe 11.57 12.64 17.56 12.06 14.53 EC (15) 11.17 12.24 17.16 11.66 14.13
Belgium 0.54 0.77 0.80 0.61 1.01 Denmark 0.20 0.18 0.21 0.02 0.00 France 1.88 2.35 3.85 2.63 3.34 Germany 1.12 1.41 1.78 1.55 2.02 Italy 3.14 3.81 5.51 3.14 3.49 Netherlands 2.43 2.23 2.91 2.71 2.75 Portugal 0.88 0.70 1.44 0.60 0.49 Spain 0.30 0.14 0.28 0.03 0.33 United Kingdom 0.69 0.65 0.39 0.38 0.70
Other Developed 1.48 1.55 1.48 1.66 1.61 Australia 0.00 0.00 0.07 0.11 0.11 Japan 0.38 0.45 0.31 0.45 0.40
DEVELOPING 2.80 2.87 2.95 2.93 3.00
Korea Rep 0.50 0.60 0.60 0.86 0.59 Morocco 0.40 0.17 0.30 0.17 0.18 Pakistan 0.90 0.89 0.95 0.80 0.92 Saudi Arabia 0.10 0.20 0.20 0.20 0.20 Turkey 0.40 0.50 0.40 0.40 0.40 Other developing 0.50 0.50 0.50 0.50 0.50
Total Above Countries 20.42 22.16 25.38 20.34 23.65
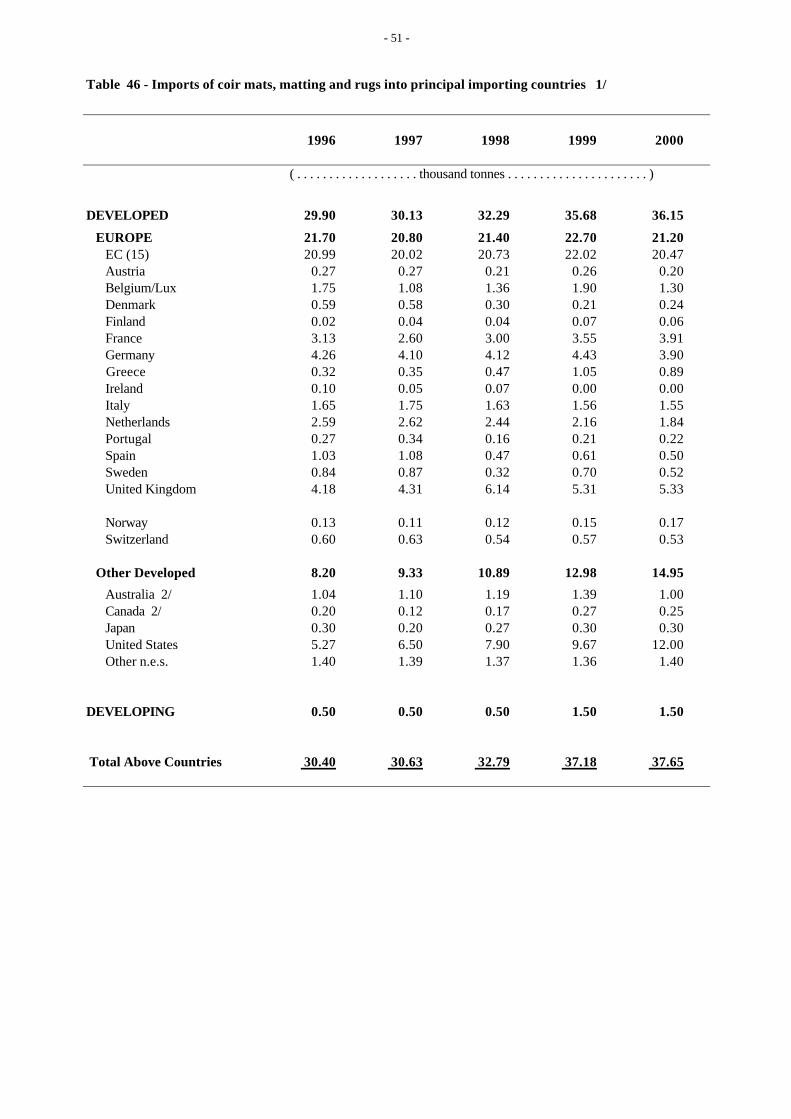
- 51 -
Table 46 - Imports of coir mats, matting and rugs into principal importing countries 1/
1996 1997 1998 1999 2000
( . . . . . . . . . . . . . . . . . . . thousand tonnes . . . . . . . . . . . . . . . . . . . . . . )
DEVELOPED 29.90 30.13 32.29 35.68 36.15
EUROPE 21.70 20.80 21.40 22.70 21.20 EC (15) 20.99 20.02 20.73 22.02 20.47 Austria 0.27 0.27 0.21 0.26 0.20 Belgium/Lux 1.75 1.08 1.36 1.90 1.30 Denmark 0.59 0.58 0.30 0.21 0.24 Finland 0.02 0.04 0.04 0.07 0.06 France 3.13 2.60 3.00 3.55 3.91 Germany 4.26 4.10 4.12 4.43 3.90 Greece 0.32 0.35 0.47 1.05 0.89 Ireland 0.10 0.05 0.07 0.00 0.00 Italy 1.65 1.75 1.63 1.56 1.55 Netherlands 2.59 2.62 2.44 2.16 1.84 Portugal 0.27 0.34 0.16 0.21 0.22 Spain 1.03 1.08 0.47 0.61 0.50 Sweden 0.84 0.87 0.32 0.70 0.52 United Kingdom 4.18 4.31 6.14 5.31 5.33
Norway 0.13 0.11 0.12 0.15 0.17 Switzerland 0.60 0.63 0.54 0.57 0.53
Other Developed 8.20 9.33 10.89 12.98 14.95
Australia 2/ 1.04 1.10 1.19 1.39 1.00 Canada 2/ 0.20 0.12 0.17 0.27 0.25 Japan 0.30 0.20 0.27 0.30 0.30 United States 5.27 6.50 7.90 9.67 12.00 Other n.e.s. 1.40 1.39 1.37 1.36 1.40
DEVELOPING 0.50 0.50 0.50 1.50 1.50
Total Above Countries 30.40 30.63 32.79 37.18 37.65
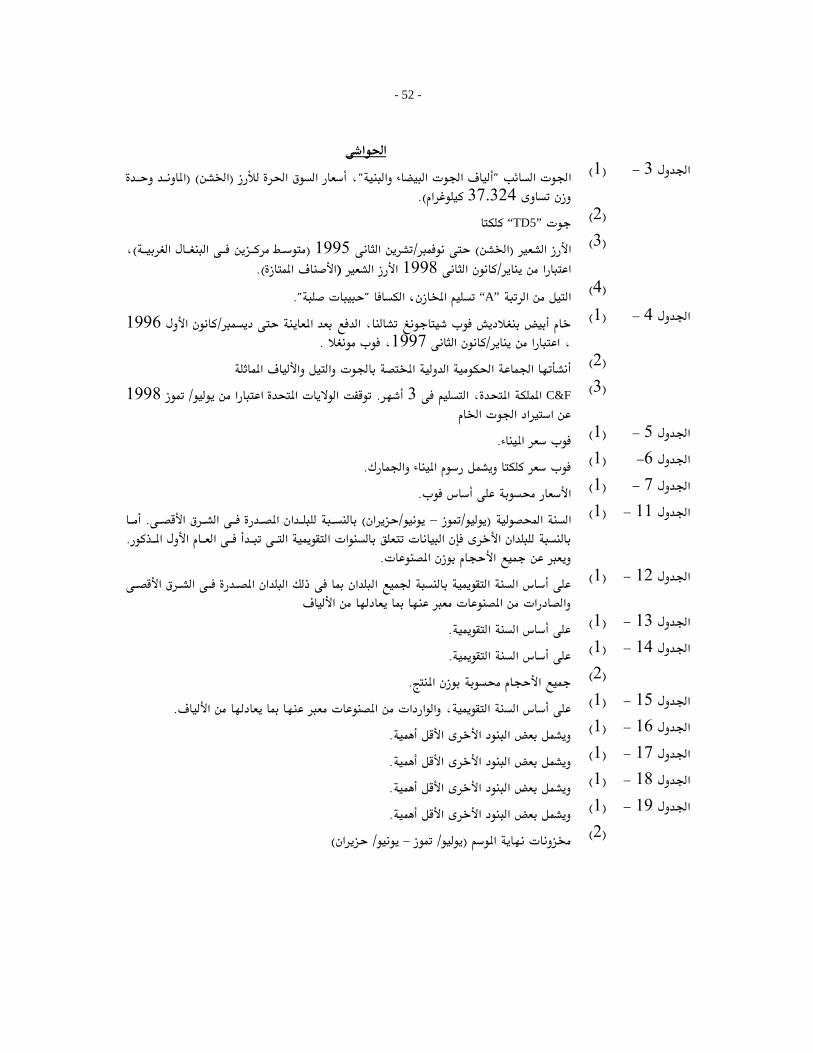
- 52 -
א אא א"א א א"א א (א(، א)
).א37.324)1( −3א
“TD5”)2(
א א(1995א/)א(א ،)אא א1998א/א א(א ).א
)3(
א "."א،א”A“א )4(
א א 1996א/،א א .،1997א/،
)1( −4א
א א א א א א א )2(
C&Fאא ، א.3א א א 1998/אא א א א
)3(
.א )1( −5א
א .א )1( −6א
.א )1( −7א
א א)א/−/(א א א .אא א א א א א א א .א
א .א
)1( −11א
א אא א א א א א אא א א א
)1( −12א
א .א )1( −13א
א .א )1( −14א
א .א )2(
א א א א א ، א .א )1( −15א
א א .א )1( −16א
א א .א )1( −17א
א א .א )1( −18א
א א .א )1( −19א
)א/–/(א )2(
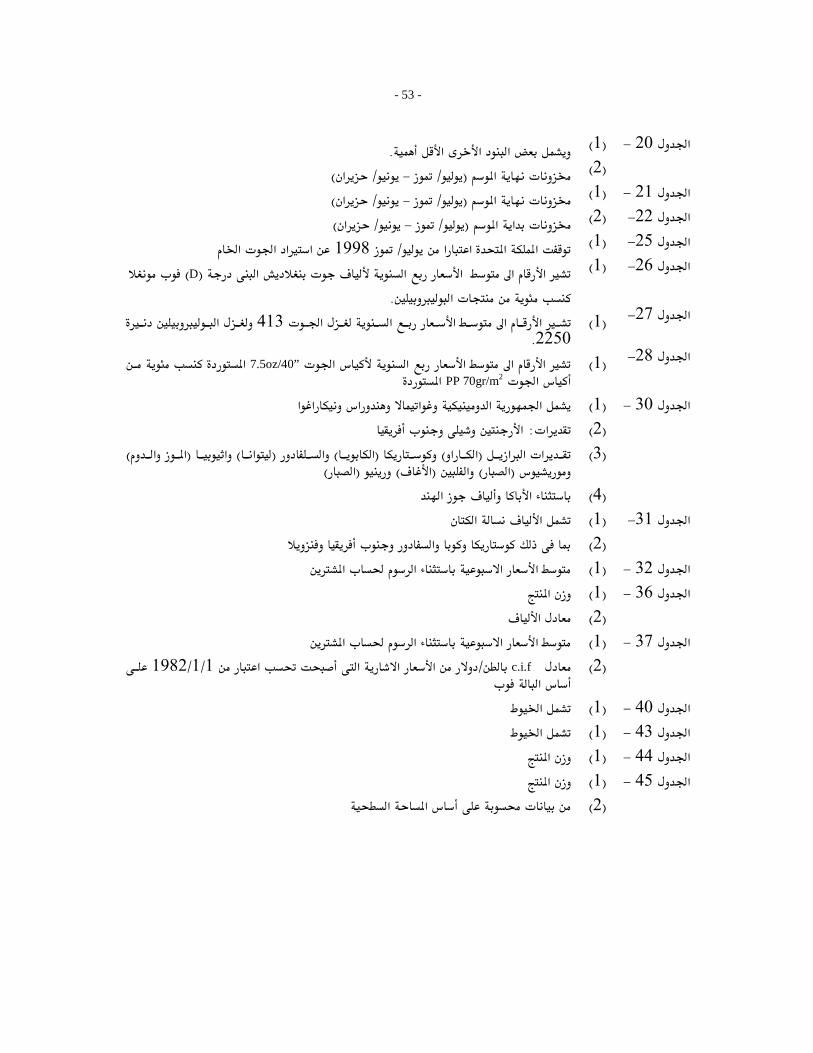
- 53 -
א א .א )1( −20א)א/–/(א )2()א/–/(א )1( −21א)א/–/(אא )2( −22א
א א א א1998/א א א א )1( −25אא א א )D(אא
.א)1( −26א
א א א א א413א2250.
)1( −27א
א א א א”7.5oz/40אאPPא 70gr/m2א
)1( −28א
א א א א א א )1( −30אא:א )2(
א א א(א א(א)א(א)א()א )א)א()א(א)א(
)3(
א א )4(א א )1( −31א
א )2(א א א א )1( −32א
א )1( −36אא )2(
א א א א )1( −37אc.i.f/א א א 1/1/1982א
א)2(
א )1( −40אא )1( −43אא )1( −44אא )1( −45א
א א )2(
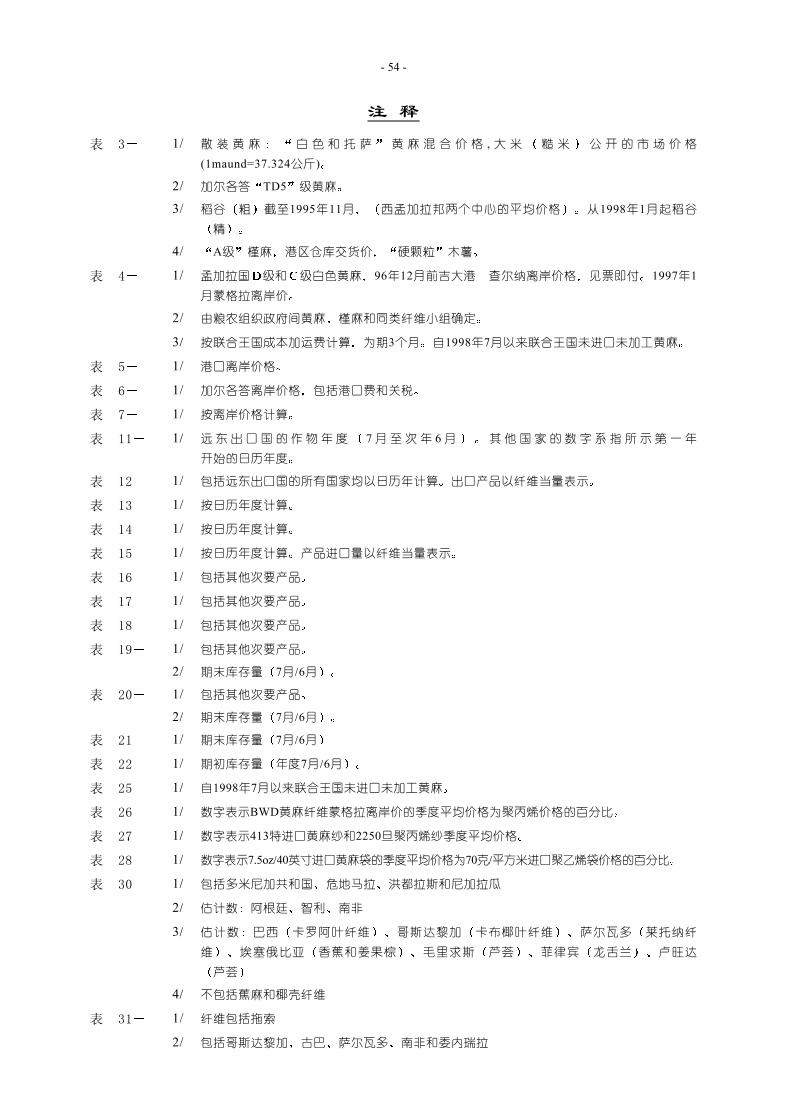
- 54 -
注 释
表 3 1/ 散 装 黄 麻 白 色 和 托 萨 黄 麻 混 合 价 格 , 大 米 糙 米 公 开 的 市 场 价 格
(1maund=37.324公斤)
2/
3/
加尔各答 TD5 级黄麻
稻谷 粗 截至1995年11月 西孟加拉邦两个中心的平均价格 从1998年1月起稻谷
精
4/ A级 槿麻 港区仓库交货价 硬颗粒 木薯
表 4 1/ 孟加拉国 级和 级白色黄麻 96年12月前吉大港 查尔纳离岸价格 见票即付 1997年1
月蒙格拉离岸价
2/ 由粮农组织政府间黄麻 槿麻和同类纤维小组确定
3/ 按联合王国成本加运费计算 为期3个月 自1998年7月以来联合王国未进口未加工黄麻
表 5 1/ 港口离岸价格
表 6 1/ 加尔各答离岸价格 包括港口费和关税
表 7 1/ 按离岸价格计算
表 11 1/ 远 东 出 口 国 的 作 物 年 度 7 月 至 次 年 6 月 其 他 国 家 的 数 字 系 指 所 示 第 一 年
开始的日历年度
表 12 1/ 包括远东出口国的所有国家均以日历年计算 出口产品以纤维当量表示
表 13 1/ 按日历年度计算
表 14 1/ 按日历年度计算
表 15 1/ 按日历年度计算 产品进口量以纤维当量表示
表 16 1/ 包括其他次要产品
表 17 1/ 包括其他次要产品
表 18 1/ 包括其他次要产品
表 19 1/
2/
包括其他次要产品
期末库存量 7月/6月
表 20 1/
2/
包括其他次要产品
期末库存量 7月/6月
表 21 1/ 期末库存量 7月/6月
表 22 1/ 期初库存量 年度7月/6月
表 25 1/ 自1998年7月以来联合王国未进口未加工黄麻
表 26 1/ 数字表示BWD黄麻纤维蒙格拉离岸价的季度平均价格为聚丙烯价格的百分比
表 27 1/ 数字表示413特进口黄麻纱和2250旦聚丙烯纱季度平均价格
表 28 1/ 数字表示7.5oz/40英寸进口黄麻袋的季度平均价格为70克/平方米进口聚乙烯袋价格的百分比
表 30 1/ 包括多米尼加共和国 危地马拉 洪都拉斯和尼加拉瓜
2/ 估计数 阿根廷 智利 南非
3/ 估计数 巴西 卡罗阿叶纤维 哥斯达黎加 卡布椰叶纤维 萨尔瓦多 莱托纳纤
维 埃塞俄比亚 香蕉和姜果棕 毛里求斯 芦荟 菲律宾 龙舌兰 卢旺达
芦荟
4/ 不包括蕉麻和椰壳纤维
表 31 1/ 纤维包括拖索
2/ 包括哥斯达黎加 古巴 萨尔瓦多 南非和委内瑞拉
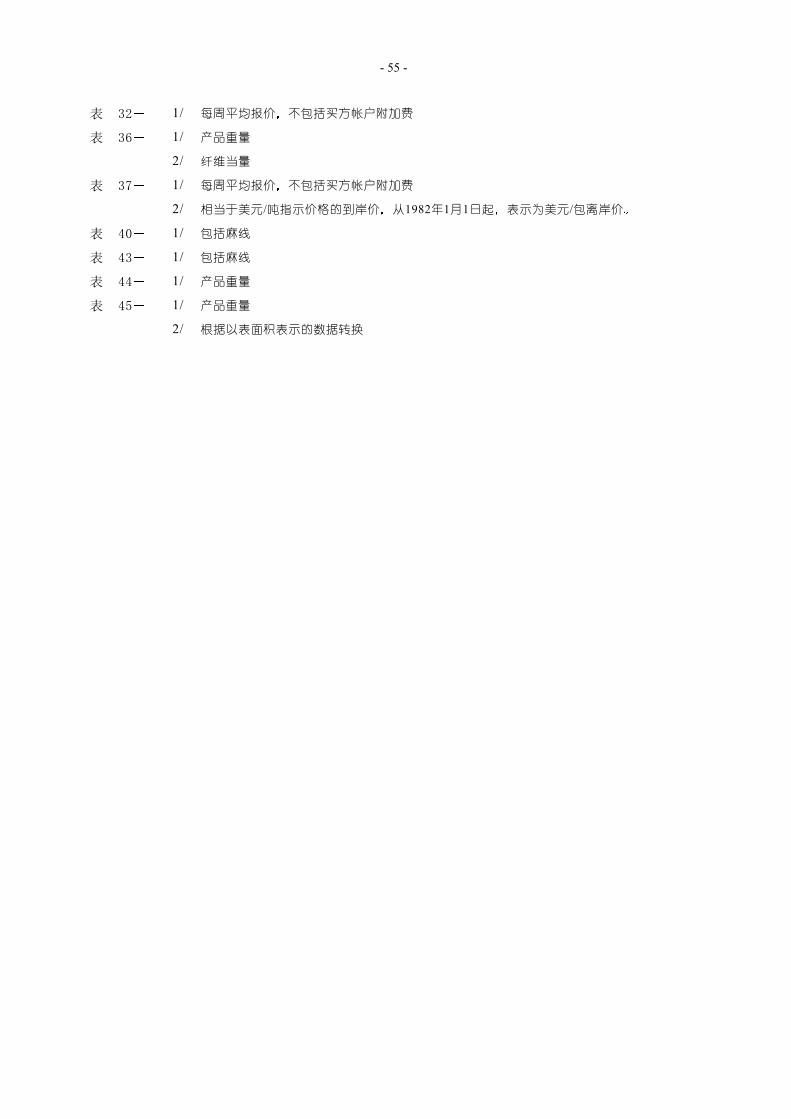
- 55 -
表 32 1/ 每周平均报价 不包括买方帐户附加费
表 36 1/ 产品重量
2/ 纤维当量
表 37 1/ 每周平均报价 不包括买方帐户附加费
2/ 相当于美元/吨指示价格的到岸价 从1982年1月1日起 表示为美元/包离岸价
表 40 1/ 包括麻线
表 43 1/ 包括麻线
表 44 1/ 产品重量
表 45 1/ 产品重量
2/ 根据以表面积表示的数据转换
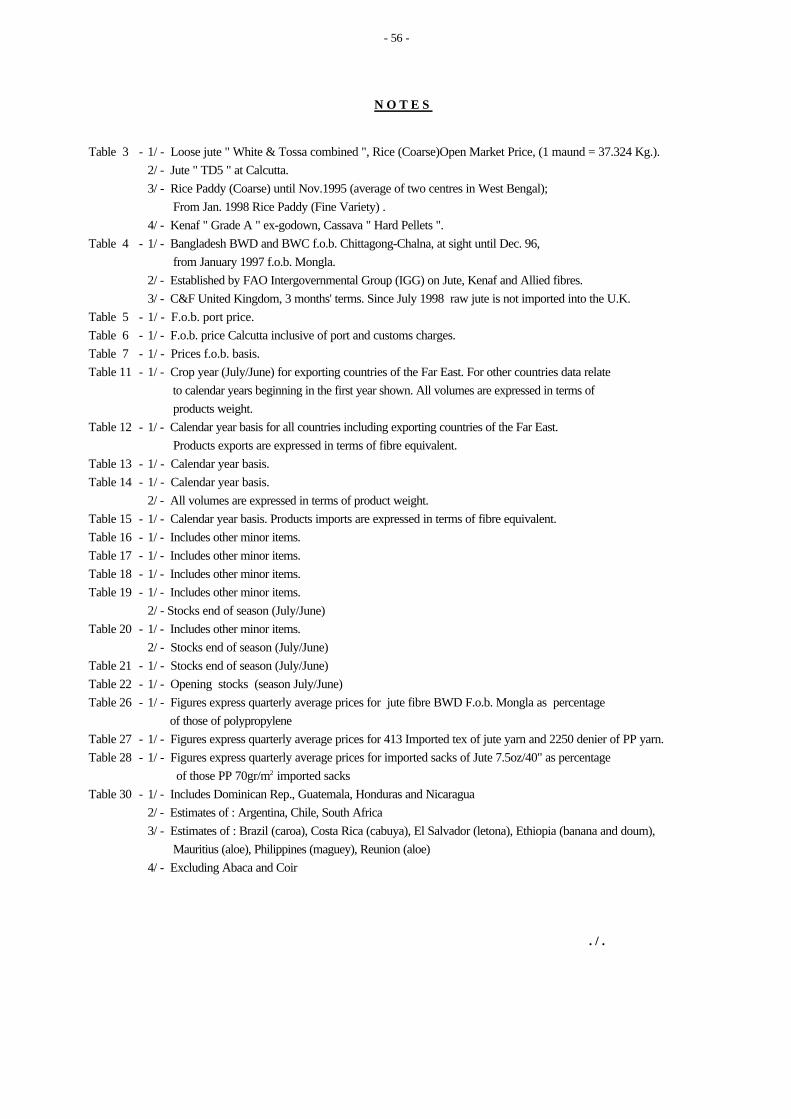
- 56 -
N O T E S
Table 3 - 1/ - Loose jute " White & Tossa combined ", Rice (Coarse)Open Market Price, (1 maund = 37.324 Kg.).2/ - Jute " TD5 " at Calcutta. 3/ - Rice Paddy (Coarse) until Nov.1995 (average of two centres in West Bengal); From Jan. 1998 Rice Paddy (Fine Variety) .4/ - Kenaf " Grade A " ex-godown, Cassava " Hard Pellets ".
Table 4 - 1/ - Bangladesh BWD and BWC f.o.b. Chittagong-Chalna, at sight until Dec. 96, from January 1997 f.o.b. Mongla.2/ - Established by FAO Intergovernmental Group (IGG) on Jute, Kenaf and Allied fibres.3/ - C&F United Kingdom, 3 months' terms. Since July 1998 raw jute is not imported into the U.K.
Table 5 - 1/ - F.o.b. port price.Table 6 - 1/ - F.o.b. price Calcutta inclusive of port and customs charges.Table 7 - 1/ - Prices f.o.b. basis.Table 11 - 1/ - Crop year (July/June) for exporting countries of the Far East. For other countries data relate to calendar years beginning in the first year shown. All volumes are expressed in terms of products weight.Table 12 - 1/ - Calendar year basis for all countries including exporting countries of the Far East. Products exports are expressed in terms of fibre equivalent.Table 13 - 1/ - Calendar year basis.Table 14 - 1/ - Calendar year basis.
2/ - All volumes are expressed in terms of product weight.Table 15 - 1/ - Calendar year basis. Products imports are expressed in terms of fibre equivalent.Table 16 - 1/ - Includes other minor items. Table 17 - 1/ - Includes other minor items. Table 18 - 1/ - Includes other minor items. Table 19 - 1/ - Includes other minor items.
2/ - Stocks end of season (July/June)Table 20 - 1/ - Includes other minor items.
2/ - Stocks end of season (July/June)Table 21 - 1/ - Stocks end of season (July/June)Table 22 - 1/ - Opening stocks (season July/June)Table 26 - 1/ - Figures express quarterly average prices for jute fibre BWD F.o.b. Mongla as percentage
of those of polypropyleneTable 27 - 1/ - Figures express quarterly average prices for 413 Imported tex of jute yarn and 2250 denier of PP yarn.Table 28 - 1/ - Figures express quarterly average prices for imported sacks of Jute 7.5oz/40" as percentage
of those PP 70gr/m2 imported sacksTable 30 - 1/ - Includes Dominican Rep., Guatemala, Honduras and Nicaragua
2/ - Estimates of : Argentina, Chile, South Africa3/ - Estimates of : Brazil (caroa), Costa Rica (cabuya), El Salvador (letona), Ethiopia (banana and doum), Mauritius (aloe), Philippines (maguey), Reunion (aloe)4/ - Excluding Abaca and Coir
. / .
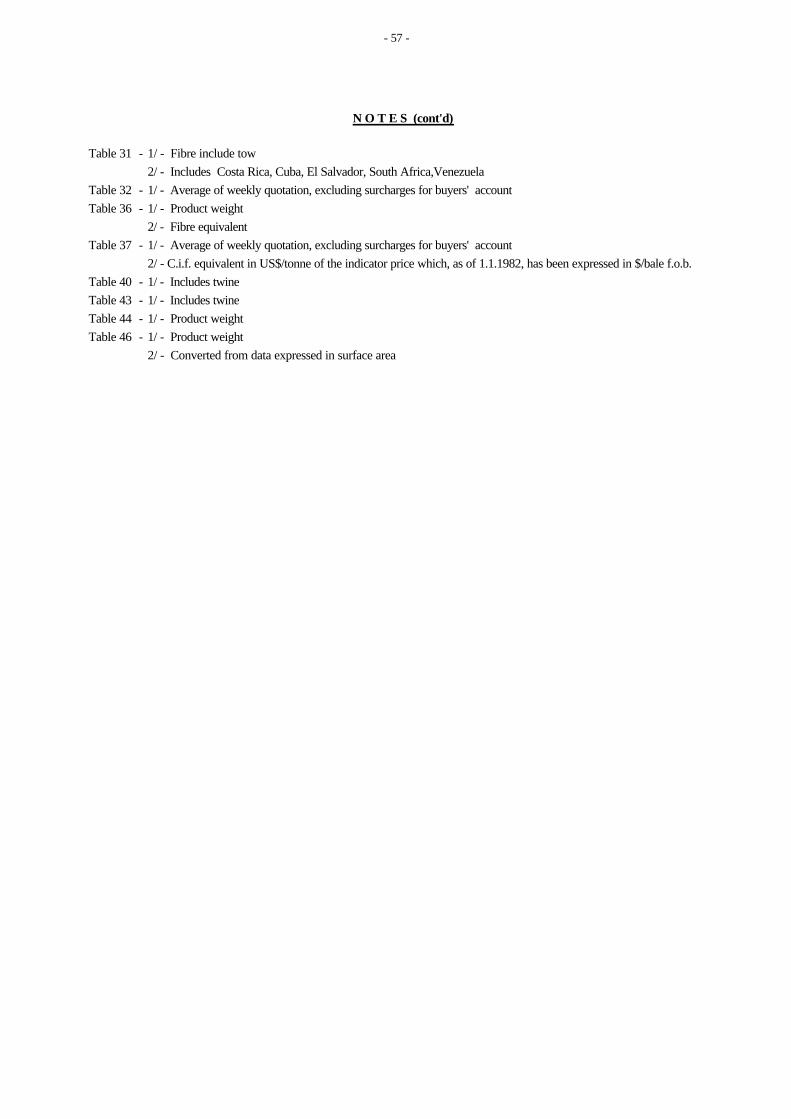
- 57 -
N O T E S (cont'd)
Table 31 - 1/ - Fibre include tow2/ - Includes Costa Rica, Cuba, El Salvador, South Africa,Venezuela
Table 32 - 1/ - Average of weekly quotation, excluding surcharges for buyers' accountTable 36 - 1/ - Product weight
2/ - Fibre equivalentTable 37 - 1/ - Average of weekly quotation, excluding surcharges for buyers' account
2/ - C.i.f. equivalent in US$/tonne of the indicator price which, as of 1.1.1982, has been expressed in $/bale f.o.b.Table 40 - 1/ - Includes twineTable 43 - 1/ - Includes twineTable 44 - 1/ - Product weightTable 46 - 1/ - Product weight
2/ - Converted from data expressed in surface area
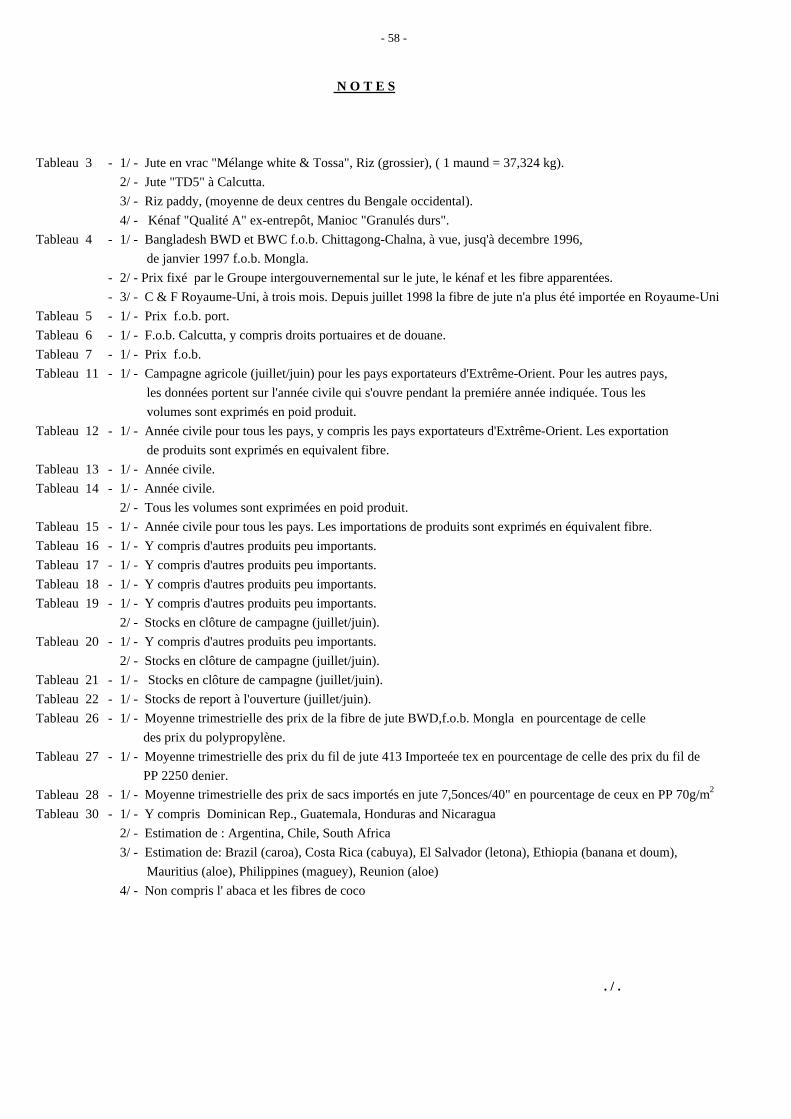
- 58 -
N O T E S
Tableau 3 - 1/ - Jute en vrac "Mélange white & Tossa", Riz (grossier), ( 1 maund = 37,324 kg). 2/ - Jute "TD5" à Calcutta.
3/ - Riz paddy, (moyenne de deux centres du Bengale occidental). 4/ - Kénaf "Qualité A" ex-entrepôt, Manioc "Granulés durs".
Tableau 4 - 1/ - Bangladesh BWD et BWC f.o.b. Chittagong-Chalna, à vue, jusq'à decembre 1996, de janvier 1997 f.o.b. Mongla.- 2/ - Prix fixé par le Groupe intergouvernemental sur le jute, le kénaf et les fibre apparentées.- 3/ - C & F Royaume-Uni, à trois mois. Depuis juillet 1998 la fibre de jute n'a plus été importée en Royaume-Uni
Tableau 5 - 1/ - Prix f.o.b. port.Tableau 6 - 1/ - F.o.b. Calcutta, y compris droits portuaires et de douane. Tableau 7 - 1/ - Prix f.o.b.Tableau 11 - 1/ - Campagne agricole (juillet/juin) pour les pays exportateurs d'Extrême-Orient. Pour les autres pays,
les données portent sur l'année civile qui s'ouvre pendant la premiére année indiquée. Tous les volumes sont exprimés en poid produit.
Tableau 12 - 1/ - Année civile pour tous les pays, y compris les pays exportateurs d'Extrême-Orient. Les exportation de produits sont exprimés en equivalent fibre.
Tableau 13 - 1/ - Année civile.Tableau 14 - 1/ - Année civile.
2/ - Tous les volumes sont exprimées en poid produit.Tableau 15 - 1/ - Année civile pour tous les pays. Les importations de produits sont exprimés en équivalent fibre.Tableau 16 - 1/ - Y compris d'autres produits peu importants.Tableau 17 - 1/ - Y compris d'autres produits peu importants.Tableau 18 - 1/ - Y compris d'autres produits peu importants.Tableau 19 - 1/ - Y compris d'autres produits peu importants.
2/ - Stocks en clôture de campagne (juillet/juin).Tableau 20 - 1/ - Y compris d'autres produits peu importants.
2/ - Stocks en clôture de campagne (juillet/juin).Tableau 21 - 1/ - Stocks en clôture de campagne (juillet/juin).Tableau 22 - 1/ - Stocks de report à l'ouverture (juillet/juin).Tableau 26 - 1/ - Moyenne trimestrielle des prix de la fibre de jute BWD,f.o.b. Mongla en pourcentage de celle
des prix du polypropylène.Tableau 27 - 1/ - Moyenne trimestrielle des prix du fil de jute 413 Importeée tex en pourcentage de celle des prix du fil de
PP 2250 denier.Tableau 28 - 1/ - Moyenne trimestrielle des prix de sacs importés en jute 7,5onces/40" en pourcentage de ceux en PP 70g/m2
Tableau 30 - 1/ - Y compris Dominican Rep., Guatemala, Honduras and Nicaragua2/ - Estimation de : Argentina, Chile, South Africa3/ - Estimation de: Brazil (caroa), Costa Rica (cabuya), El Salvador (letona), Ethiopia (banana et doum), Mauritius (aloe), Philippines (maguey), Reunion (aloe)4/ - Non compris l' abaca et les fibres de coco
. / .
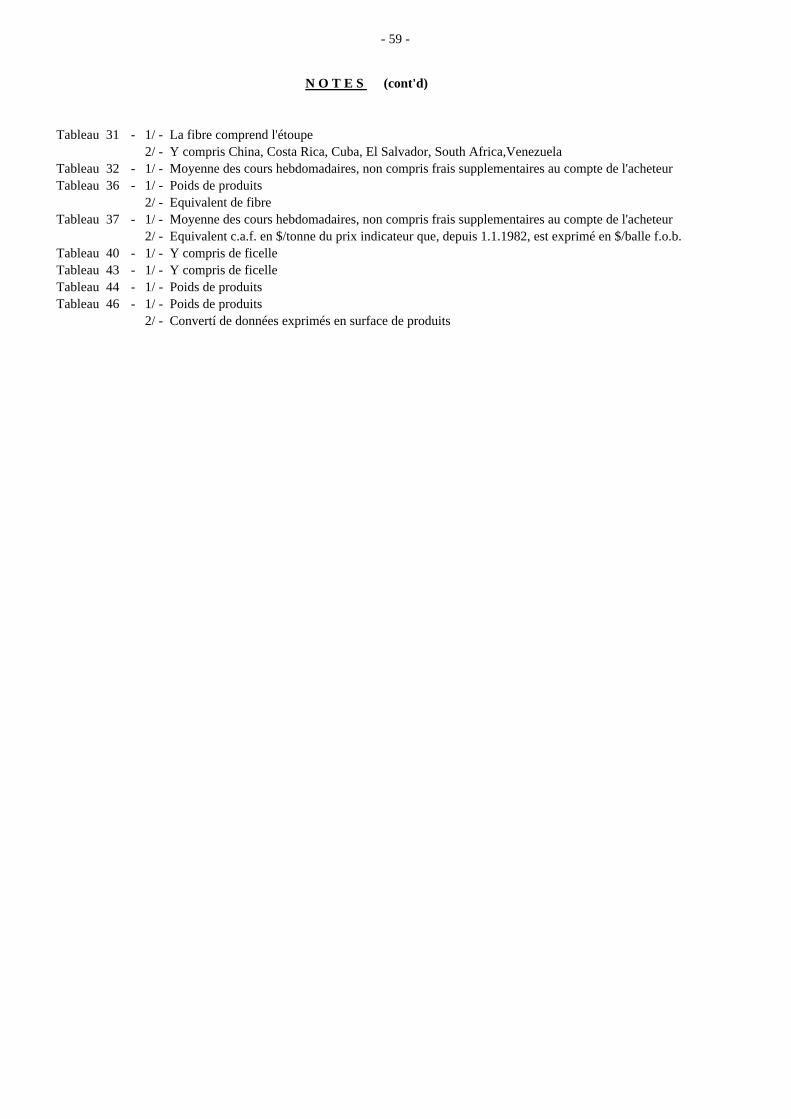
- 59 -
N O T E S (cont'd)
Tableau 31 - 1/ - La fibre comprend l'étoupe2/ - Y compris China, Costa Rica, Cuba, El Salvador, South Africa,Venezuela
Tableau 32 - 1/ - Moyenne des cours hebdomadaires, non compris frais supplementaires au compte de l'acheteurTableau 36 - 1/ - Poids de produits
2/ - Equivalent de fibreTableau 37 - 1/ - Moyenne des cours hebdomadaires, non compris frais supplementaires au compte de l'acheteur
2/ - Equivalent c.a.f. en $/tonne du prix indicateur que, depuis 1.1.1982, est exprimé en $/balle f.o.b.Tableau 40 - 1/ - Y compris de ficelleTableau 43 - 1/ - Y compris de ficelleTableau 44 - 1/ - Poids de produitsTableau 46 - 1/ - Poids de produits
2/ - Convertí de données exprimés en surface de produits
- 60 -
N O T A S
Cuadro 3 - 1/ - Yute suelto "Blanco y Tossa mezclados", Arroz (basto), (1 maund = 37,324 kg).2/ - Jute "TD5" en Calcutta, Arroz cáscara (promedio de los centros en Bengala Occidental).3/ - Arroz cáscara (promedio de los centros en Bengala Occidental).4/ - Kénaf "Calidad A", ex-godown, en almacén, Yuca " Pelets duros".
Cuadro 4 - 1/ - Bangladesh calidad BWD y BWC, f.o.b. Chittagong-Chalna, a la vista, hasta diciembre 1996, desde enero 1997 f.o.b. Mongla.2/ - Precio fijado por el Grupo Intergubernamental sobre el Yute, Kenaf y Fibras Afines 3/ - C & F Reino Unido, tres meses. Desde julio 1998 el jute crudo no ha sido importado en Reino Unido
Cuadro 5 - 1/ - Precio en puerto f.o.b.Cuadro 6 - 1/ - Calcutta f.o.b., incluidos gastos portuarios y de aduana.Cuadro 7 - 1/ - Precios f.o.b.Cuadro 11 - 1/ - Año agrícola (julio/junio) para países exportadores del Lejano Oriente. Para otros países, los datos corresponden a los años civiles que comienzan en el años indicado en primer lugar.
Todos los volúmenes se expresan en términos de producto cargado.Cuadro 12 - 1/ - Año civil para todos los países, incluidos los países exportadores del Lejano Oriente. Las exportaciones de productos se expresan en términos de equivalente en fibra.Cuadro 13 1/ - Año civil.Cuadro 14 - 1/ - Año civil.
- 2/ - Todos los volúmenes se expresan en términos de producto cargado.Cuadro 15 - 1/ - Año civil para todos los países. Las importaciones de productos se expresan en términos de equivalente en fibra.Cuadro 16 - 1/ - Se incluyen otros artículos menores.Cuadro 17 - 1/ - Se incluyen otros artículos menores.Cuadro 18 - 1/ - Se incluyen otros artículos menores.Cuadro 19 - 1/ - Se incluyen otros artículos menores.
- 2/ - Existencias al final de la temporada (julio/junio)Cuadro 20 - 1/ - Se incluyen otros artículos menores.
- 2/ - Existencias al final de la temporada (julio/junio)Cuadro 21 - 1/ - Existencias al final de la temporada (julio/junio)Cuadro 22 - 1/ - Existencias iniciales (julio/junio)Cuadro 26 - 1/ - Las cifras expresan los precios trimestrales medios de la fibra de yute BWD, f.o.b. Mongla
en porcentaje de los del polipropileno.Cuadro 27 - 1/ - Las cifras expresan los precios trimestrales medios del hilo de yute de 413 Importado tex en
porcentaje de los del hilo de PP de 2250 denier.Cuadro 28 1/ - Las cifras expresan los precios trimestrales medios de los sacos importados de yute 7,5oz/40" en
porcentaje de los sacos importados de PP 70g/m2.Cuadro 30 - 1/ - Se incluyen Dominican Rep., Guatemala, Honduras and Nicaragua.
2/ - Estimación de : Argentina, Chile, South Africa.3/ - Estimación de: Brazil (caroa), Costa Rica (cabuya), El Salvador (letona), Ethiopia (banana y doum), Mauritius (aloe), Philippines (maguey), Reunion (aloe).4/ - Excluyendo el abacá y el bonote.
. / .
- 61 -
N O T A S (cont'd)
Cuadro 31 - 1/ - La fibra encluye la estopa.2/ - Se incluyen China, Costa Rica, Cuba, El Salvador, South Africa,Venezuela.
Cuadro 32 - 1/ - Promedio de las cotizaciones semanales, excluidos recargos a cuenta del comprador.Cuadro 36 - 1/ - En peso del producto.
2/ - Equivalente en fibra.Cuadro 37 - 1/ - Promedio de las cotizaciones semanales, excluidos recargos a cuenta del comprador.
2/ - Equivalente c.i.f. en $/tonnes del precio indicador que, a partir del 1.1.1982, se ha expresado en $/bala, f.o.b.Cuadro 40 - 1/ - Se incluyen bramante.Cuadro 43 - 1/ - Se incluyen bramante.Cuadro 44 - 1/ - En peso del producto.Cuadro 46 - 1/ - En peso del producto.
2/ - Convertido de los datos expresados en superficial el aréa.
GLOSSARY
א א
术 语 黄麻、槿麻、剑麻、蕉麻、
椰壳纤维 א א א א א
א 1. 期初库存量 1- א 2. 产 量 2- א 3. 进口量 א א 3- א4. 总供应量 א א 4- א5. 工厂消费量 א 5- א6. 村社消费量 א 6- א7. 损 坏 7- אא 8. 期末库存量 8- א 9. 国内总需要量 א 9- א10. 出口量 א 10- א11. 地毯衬垫布 א 11- א12. 纤维布 -12 13. 纤 维 -13 14. 粗黄麻袋 14- א 15. 打包麻布 15- א 16. 黄麻袋 16- א 17. 黄麻/槿麻 א 17- א18. 进口黄麻布 -18 19. 进口黄麻袋 -19 20. 槿 麻 20- א 21. 其它麻袋布 -21 22. 产 量 22- א 23. 大米/食糖用麻袋布 א 23- א24. 麻袋布 א 24- א25. 二级交织麻袋布 א א א 25- א26. 麻 线 א 26- א27. 麻纱/麻线 אא 17- א28. 麻 纱 28- א 29. 面 积 -29 30. 单 产 -30 31. 线纤维 -31 32. 拖 索 32- א 33. 漕用拖索 -33 34. 农用麻线 א א א אא 34- א
35. 绳 索 א א 35- א36. 墙面/地面复盖物 א א 36- א37. 细 纱 37- א 38. 粗 布 38- א 39. 纸 浆 39- א 40. 土工织物 -40 41. 手工艺品 -41 42. 垫 -42 43. 鬃 毛 א 43- א44. 合股线 -44 45. 地 毯 -45 46. 编织物 א 46- א 聚 丙 烯 א 47. 进口聚丙烯织物 א א 47- )(א
48. 初级地毯衬垫 א 48- א49. 次级地毯衬垫 א 49- א50. 标准及聚丙烯地毯衬垫 א–) 50- )א
51. 原 油 א 51- א52. 桶 -52 53. 石脑油 -53 54. 现贷价格 א 54- א55. 合同价格 א 55- א56. 酒椰纤维级 -56
- 63 -
GLOSSARY GLOSSAIRE GLOSARIO Jute, Kenaf, Sisal, Abaca, Coir Jute, Kénaf, Sisal, Abaca, Coco Yute, Kenaf, Sisal, Abaca, Bonote 1. Opening stocks 1. Stocks de report à l'ouverture 1. Existencias iniciales 2. Production 2. Production 2. Producción 3. Imports 3. Importations 3. Importaciones 4. Total Supply 4. Disponibilités totales 4. Disponibilidades totales 5. Mill Consumption 5. Consommation des filatures 5. Consumo fabril 6. Village Consumption 6. Consommation des villages 6. Consumo rural 7. Damage 7. Dégâts 7. Daños 8. Closing stocks 8. Stocks de reports en fin de campagne 8. Remanentes de cierre 9. Total Domestic requirements 9. Besoins intérieurs totaux 9. Necesidades internas totales 10. Exports 10. Exportations 10. Exportaciones 11. Carpet backing cloth 11. Tissu pour dossier de tapis 11. Entramado de fondo para alfombras 12. Fabrics 12. Tissu 12. Tejidos 13. Fibre 13. Fibre 13. Fibra 14. Gunny bags 14. Sacs en toile 14. Sacos de arpillera 15. Hessian 15. Hessian 15. Arpillera 16. Jute bag 16. Sac de jute 16. Saco de yute 17. Jute/Kenaf 17. Jute/Kénaf 17. Yute/Kenaf 18. Imported jute cloth 18. Toile de jute importée 18. Tela de yute importada 19. Imported jute bags 19. Sacs de jute importée 19. Sacos de yute importado 20. Mesta 20. Mesta (nom donné au kénaf en Inde 20. Mestas (kenaf)
et au Pakistan) 21. Other sacking 21. Autres toiles à sacs 21. Otras telas de saco 22. Products 22. Produits dérivés du jute 22. Productos 23. Rice/sugar sacking 23. Toile à sacs pour riz/sucre 23. Tela de saco para arroz/azúcar 24. Sacking 24. Toile à sacs 24. Tela de saco 25. Sacking B-twills 25. Toile à sacs en croisé qualité B. 25. Tejidos cruzados calidad B.
para tela de saco 26. Twine 26. Ficelle 26. Bramante 27. Yarn/twine 27. Fil/ficelle 27. Hilo/bramante 28. Yarn 28. Fil 28. Hilo 29. Area 29. Superficie 29. Superficie 30. Yield 30. Rendement 30. Rendimiento 31. Line Fibre 31. Filasse 31. Fibra linear 32. Tow 32. Étoupe 32. Estopa 33. Flume tow 33. Flume 33. Estopa de espadado 34. Agricultural twines 34. Ficelles agricoles 34. Bramantes para uso agricola 35. Ropes and cordage 35. Cordes et cables 35. Cuerdas y cables 36. Wall/Floor covering 36. Rêvetements de sol et muraux 36. Alfombra y esteras 37. Fine yarns 37. Fils fin 37. Hilos finos 38. Buffin cloth 38. Chiffon de polissage 38. Paños de pilir 39. Paper pulp 39. Pâte à papier 39. Pasta de papel 40. Geotextile 40. Géotextile 40. Geotextiles 41. Handicraft 41. Produits d'artisanat 41. Artesania 42. Mattress 42. Matelas 42. Colchón 43. Bristle 43. Brin 43. Cerda 44. Twisted 44. Torsées 44. Torcido 45. Carpets and rugs 45. Tapis et carpettes 45. Alfombras y mantas 46. Matting 46. Nattes et passages 46. Esteras
Polypropylene Polypropylène Polipropileno
47. Imported PP Woven 47. PP Importé tissu 47. Polipropileno PP importado tejido 48. Primary (carpet backing) 48. Primaire (dossier de tapis) 48. Entramado primario para alfombras 49. Secondary (carpet backing) 49. Secondaire (dossier de tapis) 49. Entramado secundario para alfombras 50. Standard PP (carpet backing) 50. Standard PP (dossier de tapis) 50. Polipropileno PP estándar
para fondo de alfombra 51. Crude oil 51. Petrole brut 51. Petroleo crudo 52. Barrel 52. Baril 52. Barril 53. Naphtha 53. Naphte 53. Nafta 54. Spot price range 54. Fourchette cours du disponible 54. Escala de precios para entrega inmediata 55. Contract price 55. Prix contractuels 55. Precios contractuales 56. Raffia grade 56. Qualité raphia 56. Calidad rafia


![تحت المجهر [ كتب - أخبار - رجال - أحاديث ] · k ١٧٥ – ١٧٤ ١ א א א e١f k ٥ א א e٢f](https://img.pdfslide.tips/doc/110x75/5e7bfde4b6c22e3d413ec5ba/-f-k-a.jpg)