Embed Size (px)
DESCRIPTION
中国科学院上海生命科学研究院研究生课程 人类群体遗传学. 人类群体遗传学 基本原理和分析方法. 中科院 - 马普学会计算生物学伙伴研究所. 徐书华 金 力. 第八讲. 人群遗传结构分析 ( II ). 第八讲. 人群分化与遗传多样性 STRUCTURE 分析 文件格式 参数设定 结果解释 软件展示 STRUCTURE 2.2.3. 人群遗传结构分析. 人群遗传结构分析 Gene tree based AMOVA (hierarchical F statistics) Factor analysis - PowerPoint PPT Presentation
Citation preview

人类群体遗传学基本原理和分析方法
中科院 - 马普学会计算生物学伙伴研究所
中国科学院上海生命科学研究院研究生课程 人类群体遗传学
徐书华 金 力

第八讲第八讲人群遗传结构分析人群遗传结构分析 (( IIII ))

第八讲第八讲►人群分化与遗传多样性人群分化与遗传多样性►STRUCTURESTRUCTURE 分析分析
文件格式文件格式 参数设定参数设定 结果解释结果解释
►软件展示软件展示 STRUCTURE 2.2.3STRUCTURE 2.2.3

人群遗传结构分析人群遗传结构分析►人群遗传结构分析人群遗传结构分析
Gene tree basedGene tree based AMOVA (hierarchical AMOVA (hierarchical FF statistics) statistics) Factor analysisFactor analysis Principle Component analysisPrinciple Component analysis STRUCTURE analysisSTRUCTURE analysis


Geographical distribution Geographical distribution HGDP samples (52 HGDP samples (52 populations)populations)
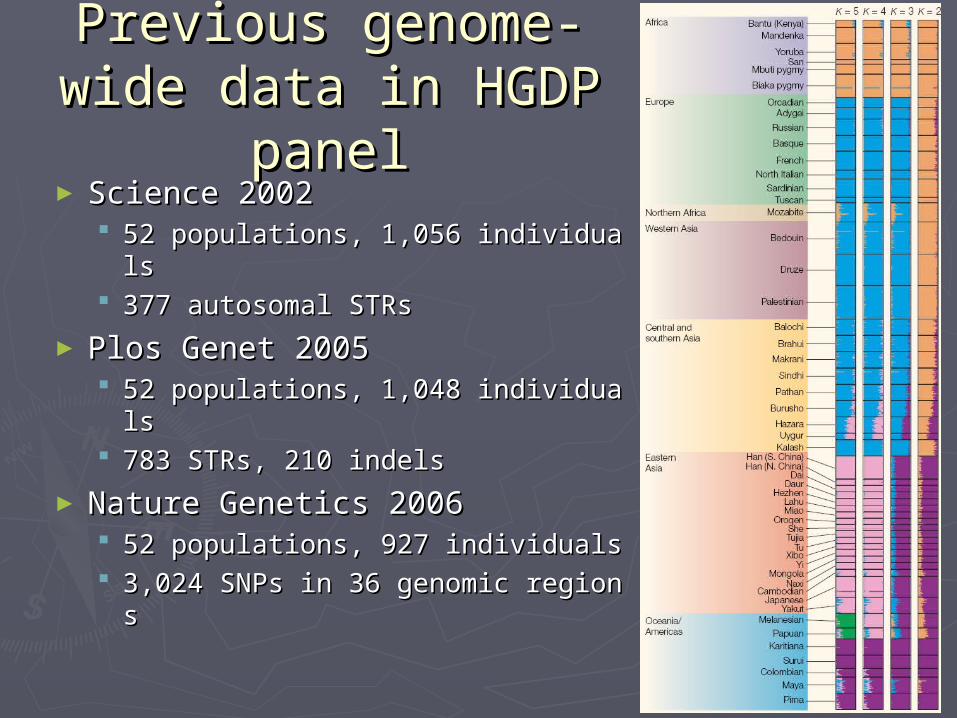
Previous genome-Previous genome-wide data in HGDP wide data in HGDP
panelpanel► Science 2002Science 2002
52 populations, 1,056 individuals52 populations, 1,056 individuals 377 autosomal STRs377 autosomal STRs
► Plos Genet 2005Plos Genet 2005 52 populations, 1,048 individuals52 populations, 1,048 individuals 783 STRs, 210 indels783 STRs, 210 indels
► Nature Genetics 2006Nature Genetics 2006 52 populations, 927 individuals52 populations, 927 individuals 3,024 SNPs in 36 genomic regions3,024 SNPs in 36 genomic regions

NIH & University of Michigan
Stanford University

Genotype, haplotype and copy-number varGenotype, haplotype and copy-number variation in worldwide human populationsiation in worldwide human populations► Study design:Study design:
Genome-wide patterns of variation; Genome-wide patterns of variation; Fine-scale population structure.Fine-scale population structure.
► Data structure:Data structure: 29 HGDP populations, 485 individuals.29 HGDP populations, 485 individuals. 4 HapMap populations, 112 individuals.4 HapMap populations, 112 individuals. 525,910 SNPs, 396 CNVs (Illumina HumanHap550K).525,910 SNPs, 396 CNVs (Illumina HumanHap550K).
► New findings:New findings: Increasing linkage disequilibrium is observed with increasing geograpIncreasing linkage disequilibrium is observed with increasing geographic distance from Africa (a serial founder effecthic distance from Africa (a serial founder effect ). ). The global distribution of CNVs largely accords with population strucThe global distribution of CNVs largely accords with population structure analyses for SNP data sets of similar size. ture analyses for SNP data sets of similar size.
► Conclusions:Conclusions: Support the utility of CNVs in human population-genetic research.Support the utility of CNVs in human population-genetic research.

Worldwide Human Relationships Worldwide Human Relationships Inferred from Genome-Wide Inferred from Genome-Wide
Patterns of VariationPatterns of Variation► Study design:Study design:
Human genetic diversity; Human genetic diversity; Fine-scale population structure.Fine-scale population structure.
► Data structure:Data structure: 51 populations; 938 individuals.51 populations; 938 individuals. 650,000 SNPs (Illumina HumanHap650K).650,000 SNPs (Illumina HumanHap650K).
► New findings:New findings: The relationship between haplotype heterozygosity and geography was consistThe relationship between haplotype heterozygosity and geography was consistent with the hypothesis of a serial founder effect with a single origin in ent with the hypothesis of a serial founder effect with a single origin in sub-Saharan Africa.sub-Saharan Africa. Observed a pattern of ancestral allele frequency distributions that reflectObserved a pattern of ancestral allele frequency distributions that reflects variation in population dynamics among geographic regions. s variation in population dynamics among geographic regions.
► Conclusions:Conclusions: This data set allows the most comprehensive characterization to date of humThis data set allows the most comprehensive characterization to date of human genetic variation. Individual ancestry and population substructure are dan genetic variation. Individual ancestry and population substructure are detectable with very high resolution.etectable with very high resolution.

NJ tree based on SNP NJ tree based on SNP genotypesgenotypes

Population structure inferred by Population structure inferred by STRUCTURESTRUCTURE

Maximum likelihood tree of 51 Maximum likelihood tree of 51 populationspopulations
North Africa
Middle East
Europe
South/Central Asia
East Asia
America
Oceania
150,000 SNPs

MDS plotsMDS plots
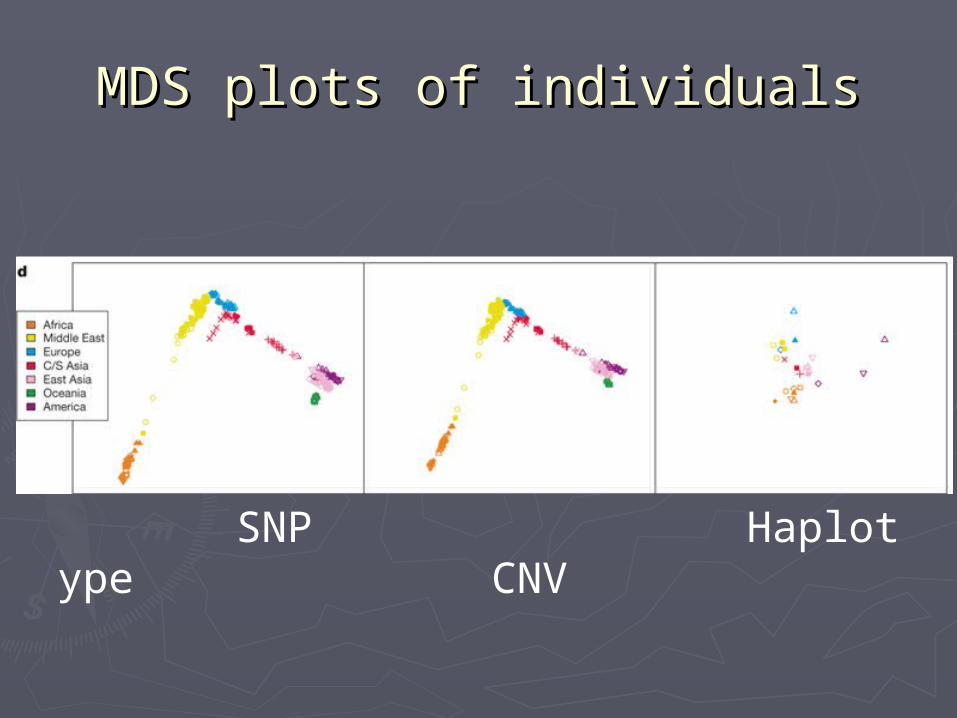
MDS plots of individualsMDS plots of individuals
SNP Haplotype CNV
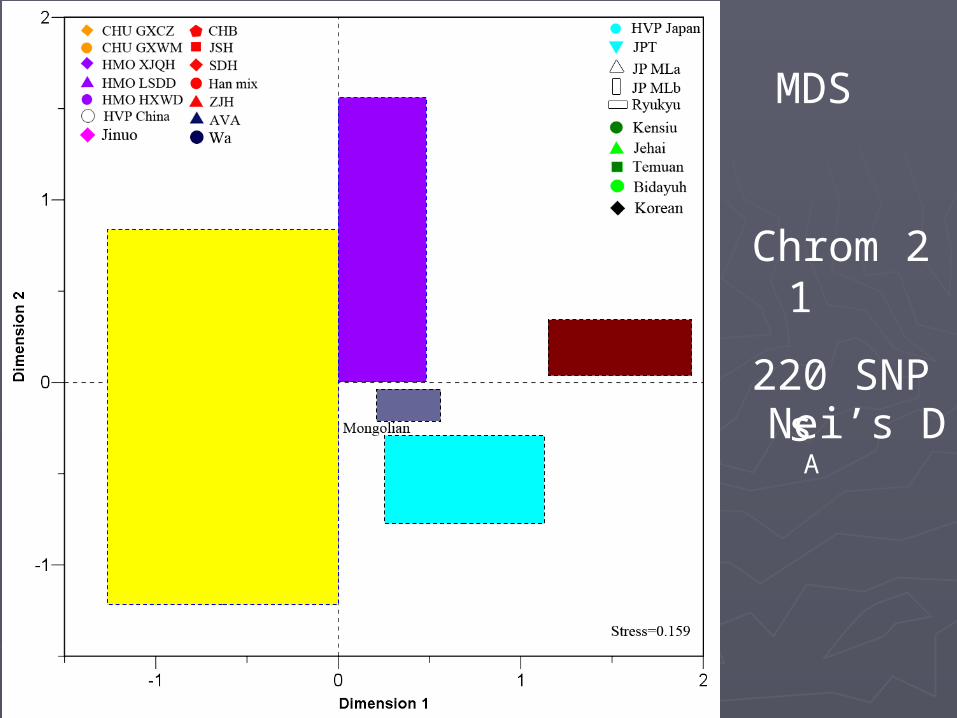
MDS
Nei’s DA
Chrom 21220 SNPs


PCA plotsPCA plots

PCA of populationsPCA of populations
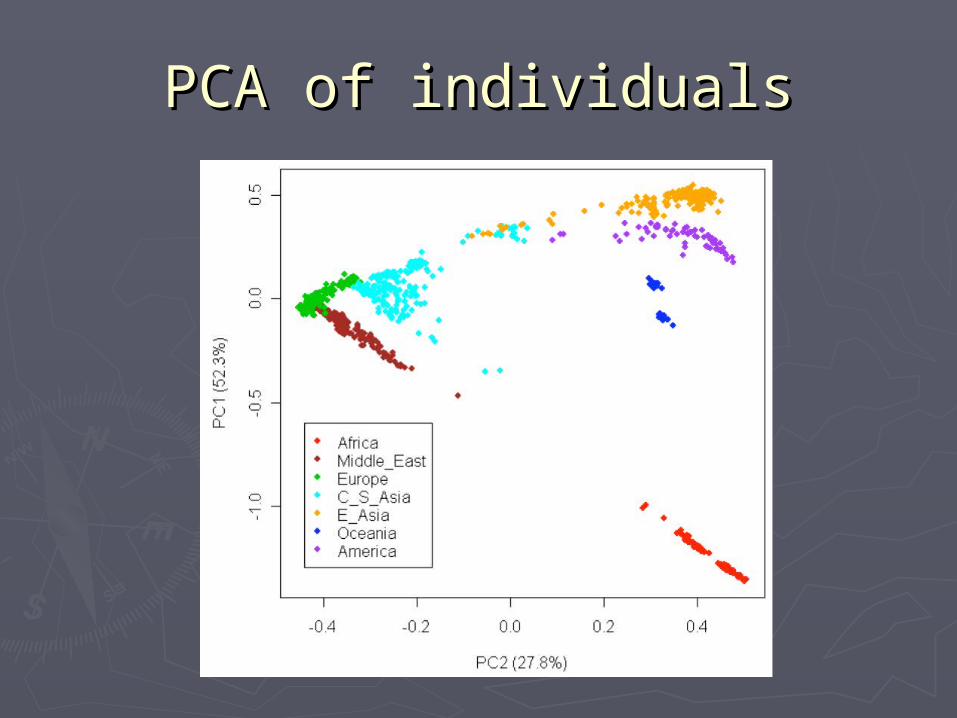
PCA of individualsPCA of individuals

STR can not, SNP canSTR can not, SNP canEurope Middle East

Han and Northern HanHan and Northern Han

56 ethnic groups in 56 ethnic groups in ChinaChina

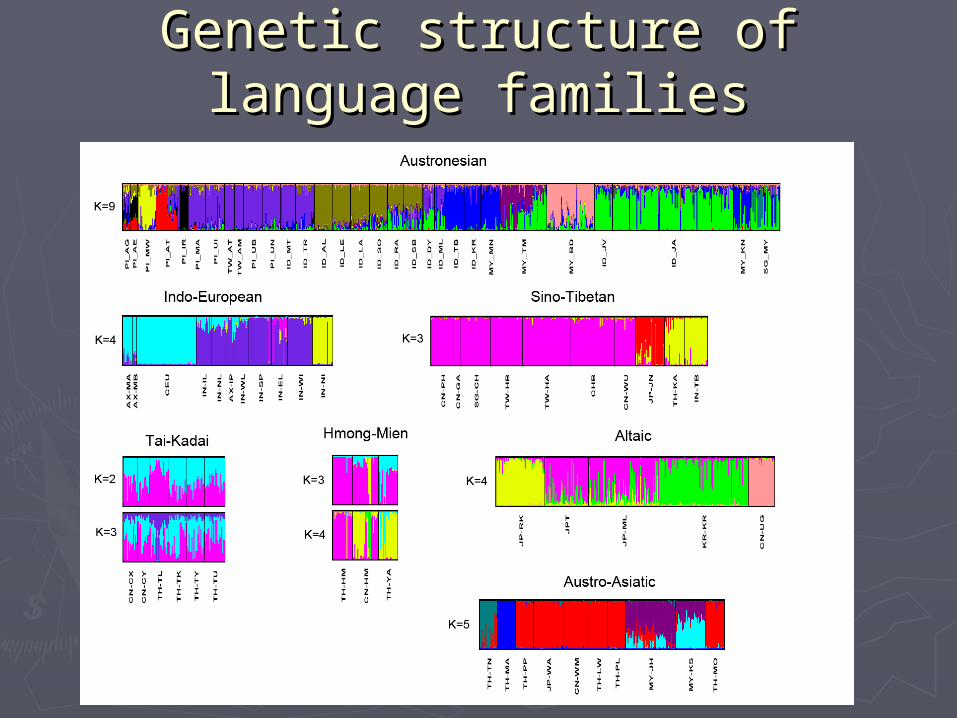
Genetic structure of Genetic structure of language familieslanguage families

Two types of genetic Two types of genetic structurestructure
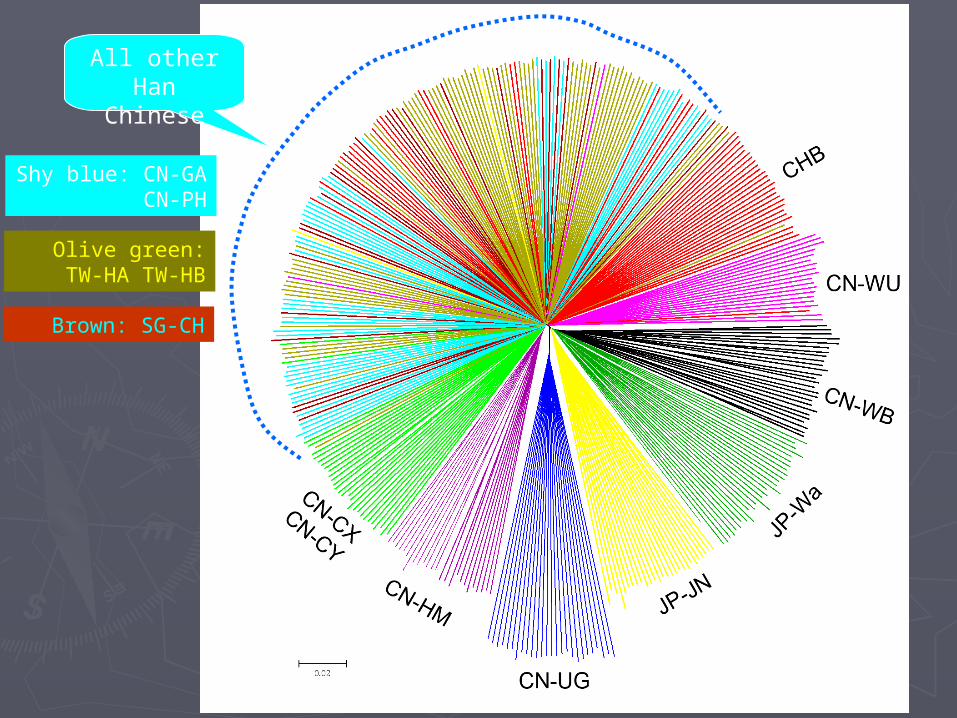
All other Han Chinese
Shy blue: CN-GA CN-PH
Olive green: TW-HA TW-HB
Brown: SG-CH

Inference on population Inference on population structure using multi-structure using multi-locus genotype datalocus genotype data
STRUCTURE V2.2.3STRUCTURE V2.2.3
► Pritchard, Stephens, and Donnelly (2Pritchard, Stephens, and Donnelly (2000) 000) ► Falush, Stephens, and Pritchard (200Falush, Stephens, and Pritchard (2003)3)

Main objectiveMain objective
► Assign individuals to Assign individuals to populations on the bases of populations on the bases of their genotypes, while their genotypes, while simultaneously estimating simultaneously estimating population allele frequenciespopulation allele frequencies

Other objectivesOther objectives
►Begin with a set of predefined Begin with a set of predefined populations and to classify populations and to classify individuals of unknown originindividuals of unknown origin
►Identify the extent of admixture Identify the extent of admixture of individualsof individuals
►Infer the origin of particular Infer the origin of particular loci in the sampled individualsloci in the sampled individuals
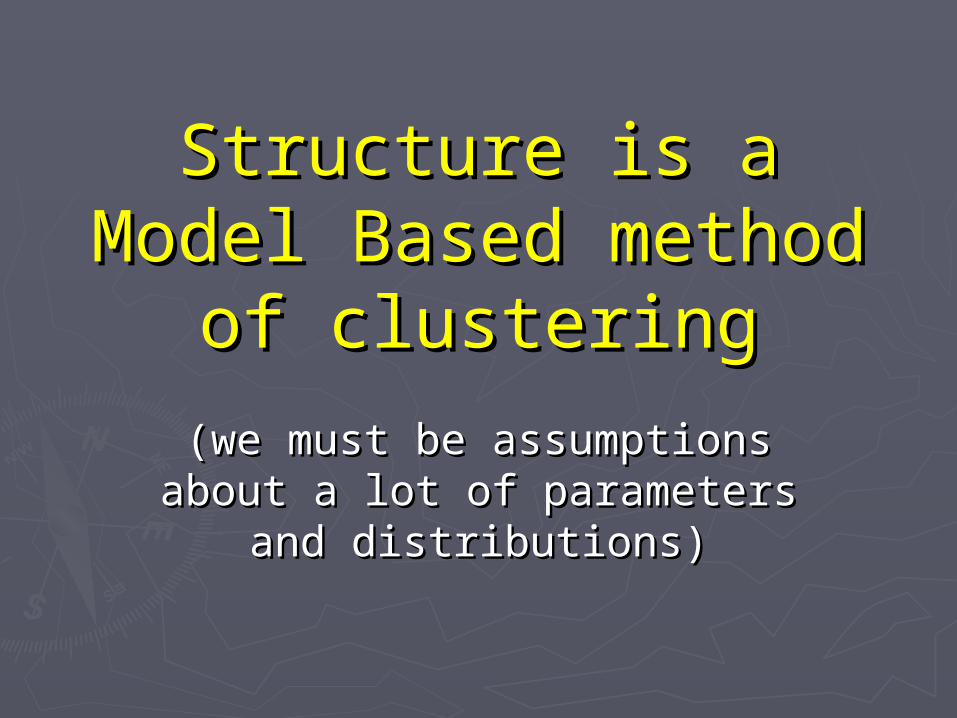
Structure is a Structure is a Model Based method Model Based method
of clusteringof clustering(we must be assumptions (we must be assumptions
about a lot of parameters about a lot of parameters and distributions)and distributions)

Four basic modelsFour basic models
1.1. Model without admixtureModel without admixtureeach individual is assumed to each individual is assumed to
originate in one (only one) of K originate in one (only one) of K populationspopulations
2.2. Model with admixtureModel with admixtureeach individual is assumed to have each individual is assumed to have
inherited some proportion of its inherited some proportion of its ancestry from each of K ancestry from each of K populationspopulations

Four basic modelsFour basic models
3.3. Linkage modelLinkage model““Chunks” of chromosomes as derived as Chunks” of chromosomes as derived as
intact units from one or another K intact units from one or another K population and all allele copies on population and all allele copies on the same “chunk” derive from the same the same “chunk” derive from the same population. population.
The model consider the derived The model consider the derived correlations in ancestrycorrelations in ancestry

Four basic modelsFour basic models
4.4. F modelF modelThe populations all diverged from a The populations all diverged from a
common ancestral population at the common ancestral population at the same time, but allows that the same time, but allows that the populations may have experienced populations may have experienced different amounts of drift since different amounts of drift since the divergence eventthe divergence event

AssumptionsAssumptions
• “Our main modeling assumptions are Hardy-Weinberg equilibrium within populations and complete linkage equilibrium between loci within populations”
• “Loosely speaking, the idea here is that the model accounts for the presence oh HWD or LD by introducing population structure and attempts to find populations groupings that (as far as possible) are not in disequilibrium”

DataData
►Consider a sample of N individuals each onConsider a sample of N individuals each one genotyped at L locie genotyped at L loci►Assume that the individuals represent a miAssume that the individuals represent a mixture of K unobserved populations (K unknoxture of K unobserved populations (K unknown)wn)►If diploid, we have an If diploid, we have an NN×2L×2L data matrix data matrix XX►If n-ploid If n-ploid XX is is N×N×where where JJll is the number of alleles at the is the number of alleles at the llthth locus locus
L
l lJ1

Input file formatInput file format


Parameter settingParameter setting
►Main parameters (mainparams.txt)Main parameters (mainparams.txt)►Extra parameters (extraparams.txt)Extra parameters (extraparams.txt)

软件演示 软件演示 ((structurestructure))

Summary plot of estimates of individual Summary plot of estimates of individual membership fractionmembership fraction


常用软件常用软件►STRUCTURESTRUCTURE
http://pritch.bsd.uchicago.edu/softhttp://pritch.bsd.uchicago.edu/software/structure2_2.htmlware/structure2_2.html►EIGENSOFTEIGENSOFT
http://http://genepath.med.harvard.edu/~reich/Sofgenepath.med.harvard.edu/~reich/Software.htmtware.htm
►SPSSSPSS

练习练习►利用利用 HapMapHapMap 数据进行数据进行 STRUCTURESTRUCTURE 分析;分析;
http://www.hapmap.orghttp://www.hapmap.org