Embed Size (px)
Citation preview

1政府統計處Census and Statistics Department
Latest developments of compiling Gross Domestic Product of Hong Kong
Speakers: Ms Sharon NG, Senior StatisticianMiss Gloria MA, Senior StatisticianMiss Winnie TAM, StatisticianMs Jasmin LEE, Statistician
2政府統計處Census and Statistics Department
Contents
(I) Fundamental concepts and uses of GDP
(II) Methods and data sources for compiling GDP
(III) Chain volume measures of GDP
(IV) Commonly asked questions on the concepts of GDP
(V) Q&As
3政府統計處Census and Statistics Department
(I) Fundamental concepts and
uses of GDP
4政府統計處Census and Statistics Department
What is Gross Domestic Product (GDP)?
Gross Domestic Product (GDP): measure of the total value of production (product) of all resident producing units of a country or territory (domestic) in a specified period, before deducting allowance for consumption of fixed capital (gross).
5政府統計處Census and Statistics Department
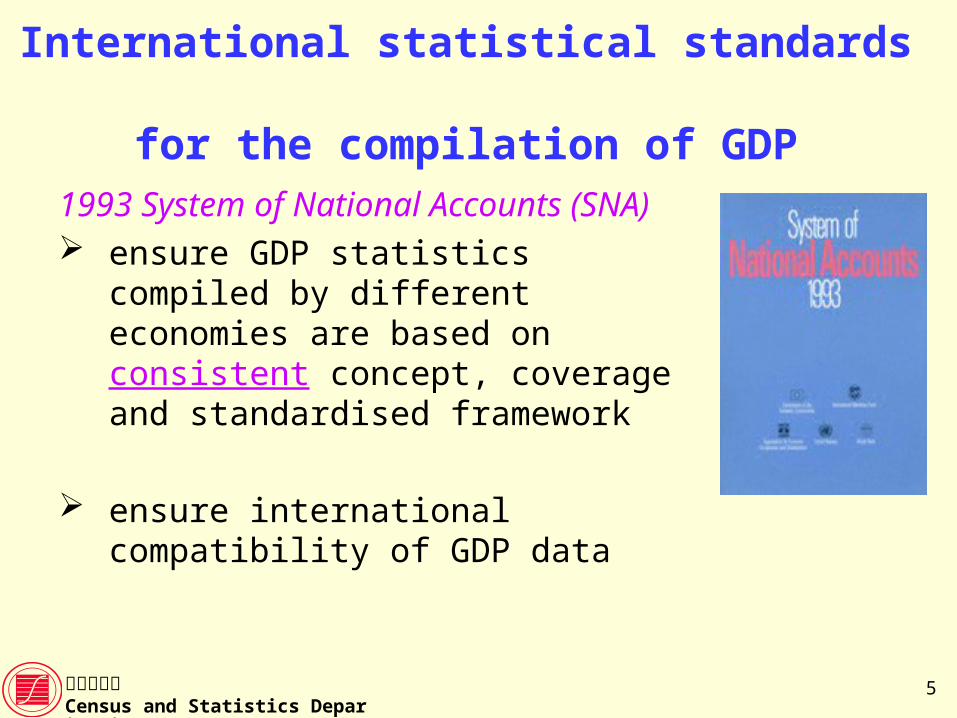
International statistical standards for the compilation of GDP
1993 System of National Accounts (SNA) ensure GDP statistics compiled by
different economies are based on consistent concept, coverage and standardised framework
ensure international compatibility of GDP data
6政府統計處Census and Statistics Department
Three approaches for
compiling GDP
7政府統計處Census and Statistics Department
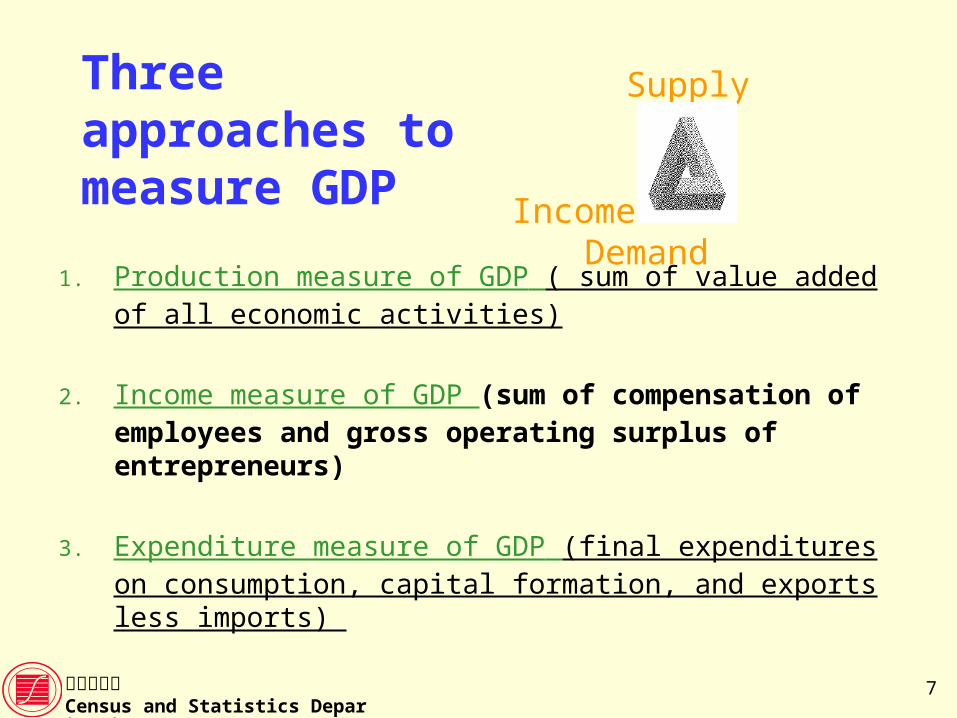
Three approaches to measure GDP
1. Production measure of GDP ( sum of value added of all economic activities)
2. Income measure of GDP (sum of compensation of employees and gross operating surplus of entrepreneurs)
3. Expenditure measure of GDP (final expenditures on consumption, capital formation, and exports less imports)
Supply
Income Demand
8政府統計處Census and Statistics Department
Given there can be 3 alternative approaches to compile GDP, are we supposed to have 3 figures of GDP or one single figure of GDP?
In theoryGDP estimates by the 3 approaches should be the same
In practiceStatistical discrepancy exists, as different data sources are used for different approaches
Supply
Income Demand
9政府統計處Census and Statistics Department
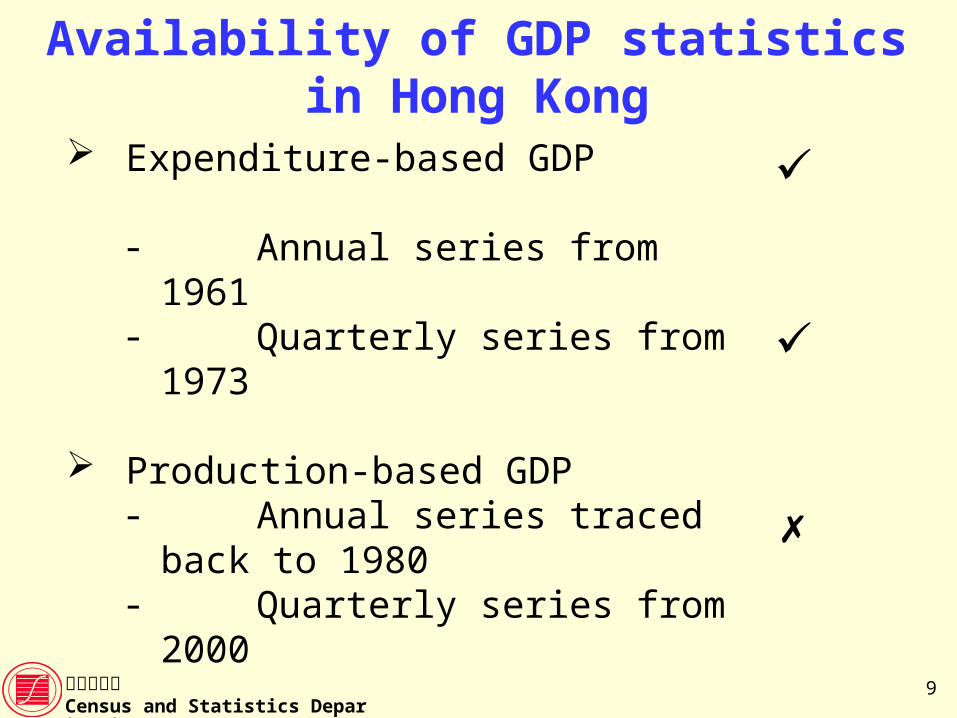
Availability of GDP statistics in Hong Kong
Expenditure-based GDP- Annual series from 1961- Quarterly series from 1973
Production-based GDP- Annual series traced back to
1980- Quarterly series from 2000
Income-based GDP- Once compiled for 1970 -
1980, but had discontinued since 1981
10政府統計處Census and Statistics Department
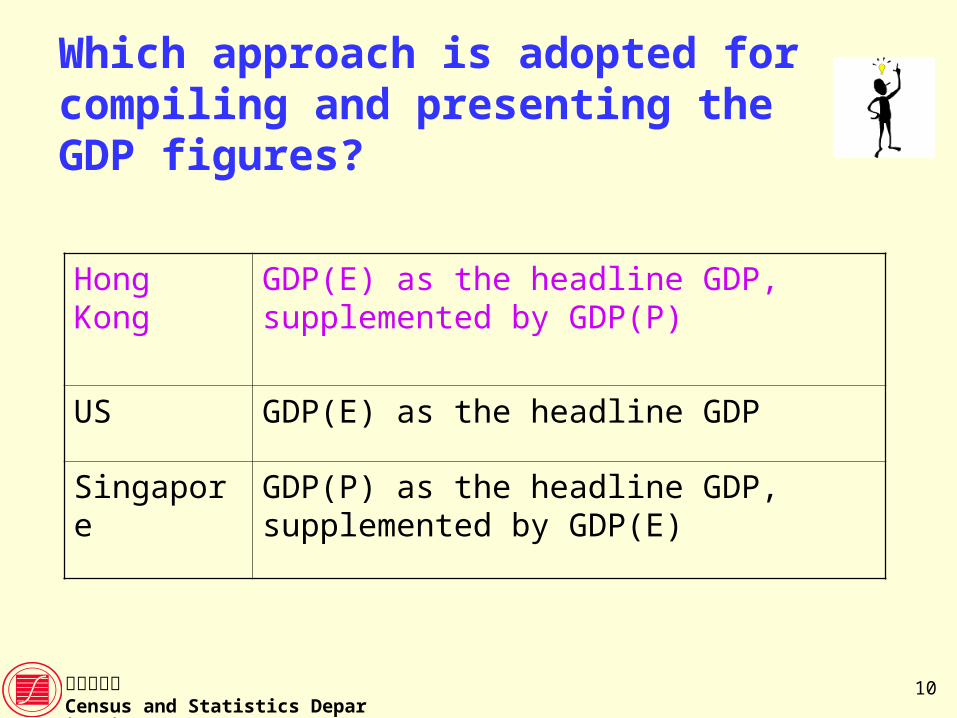
Which approach is adopted for compiling and presenting the GDP figures?
Hong Kong GDP(E) as the headline GDP, supplemented by GDP(P)
US GDP(E) as the headline GDP
Singapore GDP(P) as the headline GDP, supplemented by GDP(E)
11政府統計處Census and Statistics Department
Uses of GDP
12政府統計處Census and Statistics Department
Measure of economic growth
Why is GDP so important?
13政府統計處Census and Statistics Department
GDP is commonly used for charting the economic growth of an economy
Measured by change in the volume measure of GDP over time (growth rate in real terms)
Positive growth : expansion of economic activities
Negative growth : contraction of economic activities
14政府統計處Census and Statistics Department
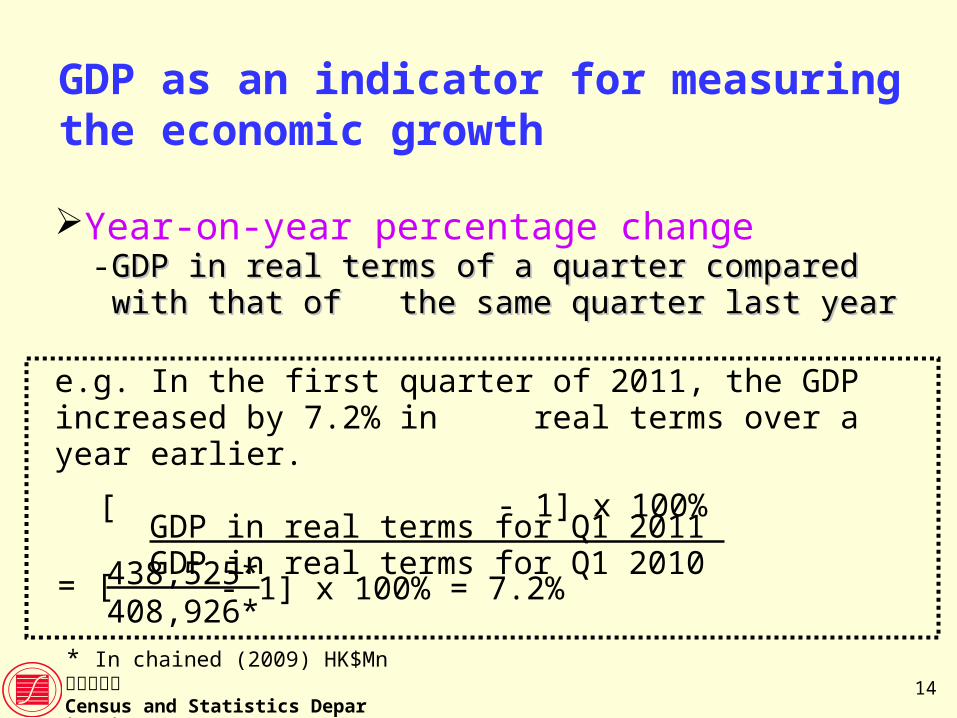
GDP as an indicator for measuring the economic growth
Year-on-year percentage change- GDP in real terms of a quarter compared with that of GDP in real terms of a quarter compared with that of the the
same quarter last yearsame quarter last year
e.g. In the first quarter of 2011, the GDP increased by 7.2% in real terms over a year earlier.
GDP in real terms for Q1 2011 GDP in real terms for Q1 2010
= [ - 1] x 100% = 7.2%
[ - 1] x 100%
438,525*408,926*
* In chained (2009) HK$Mn
15政府統計處Census and Statistics Department
Seasonally adjusted GDP series
Seasonally adjustment: remove the seasonal Seasonally adjustment: remove the seasonal effects which repeat each year in a systematic effects which repeat each year in a systematic mannermanner
Quarter-to-quarter percentage changeQuarter-to-quarter percentage change- - seasonally adjusted GDP of a particular seasonally adjusted GDP of a particular
quarter compared with that of last quarterquarter compared with that of last quarter- - capture turning point more promptlycapture turning point more promptly
GDP as an indicator for measuring theeconomic growth (Cont’d)
16政府統計處Census and Statistics Department
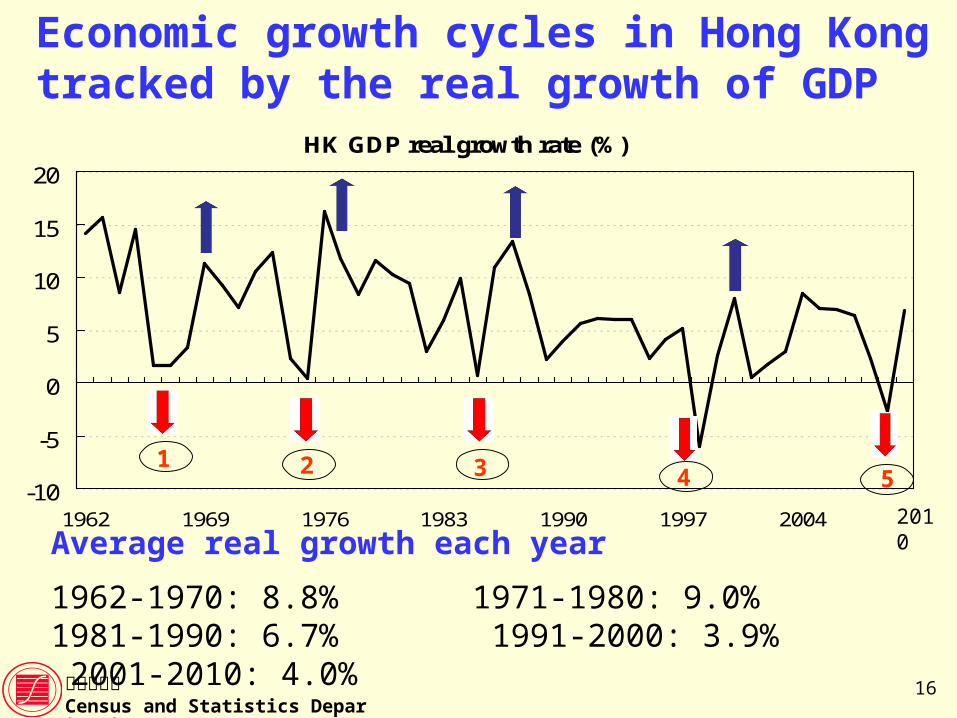
HK GDP real growth rate (%)
-10
-5
0
5
10
15
20
1962 1969 1976 1983 1990 1997 2004
Economic growth cycles in Hong Kong tracked by the real growth of GDP
Average real growth each year
1962-1970: 8.8% 1971-1980: 9.0% 1981-1990: 6.7% 1991-2000: 3.9% 2001-2010: 4.0%
1 32 4
2010
5
17政府統計處Census and Statistics Department
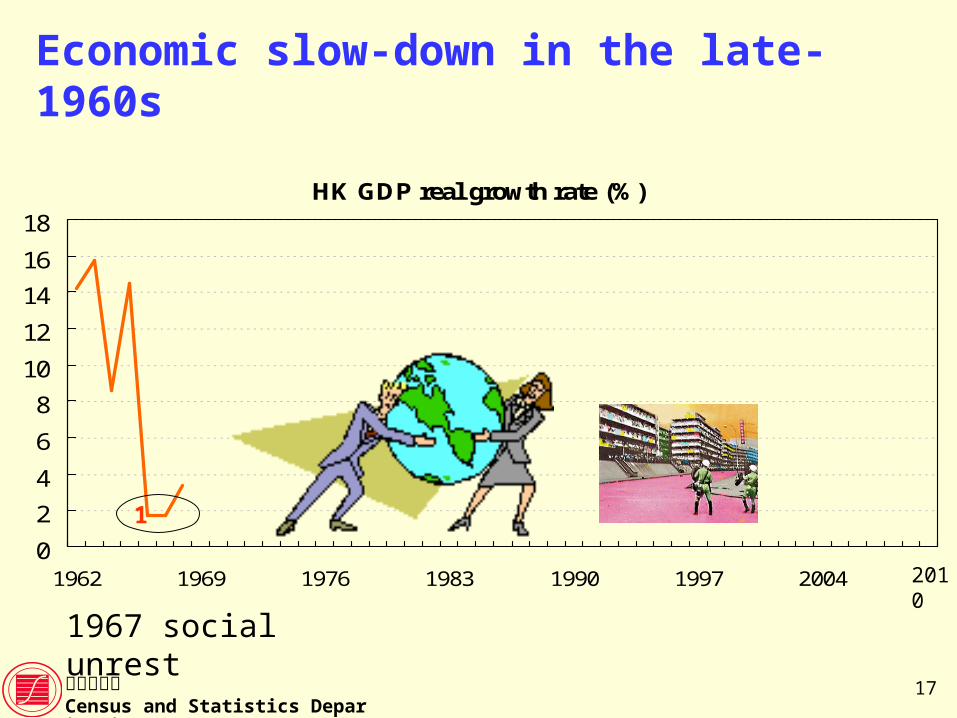
Economic slow-down in the late-1960s
HK GDP real growth rate (%)
0
2
4
6
8
10
12
14
16
18
1962 1969 1976 1983 1990 1997 2004
1967 social unrest
1
2010
18政府統計處Census and Statistics Department
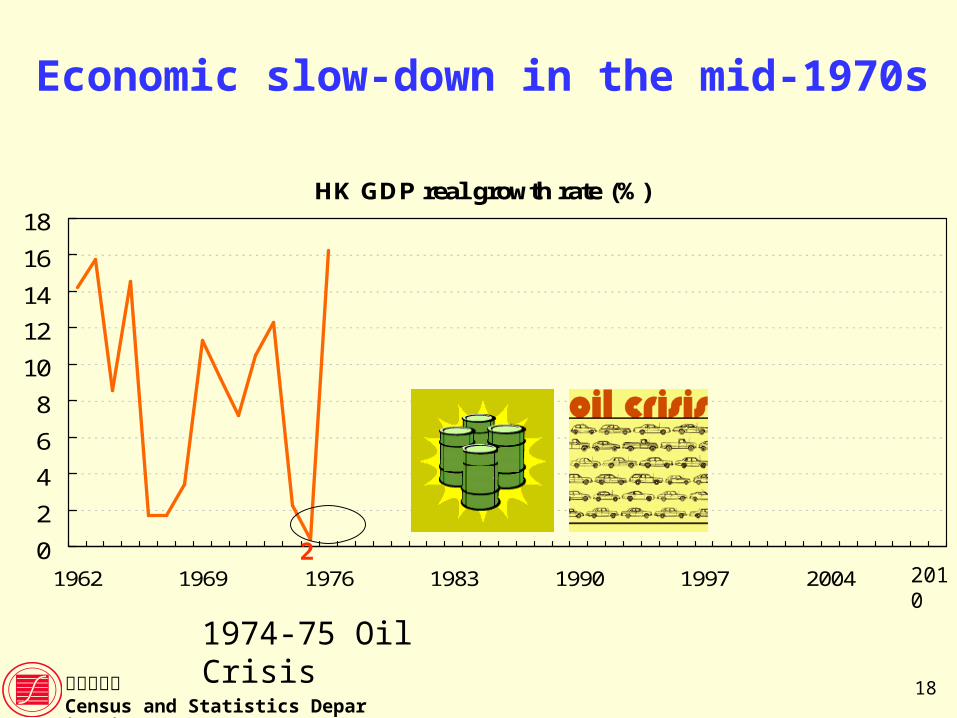
Economic slow-down in the mid-1970s
HK GDP real growth rate (%)
0
2
4
6
8
10
12
14
16
18
1962 1969 1976 1983 1990 1997 2004
1974-75 Oil Crisis
2
2010
19政府統計處Census and Statistics Department
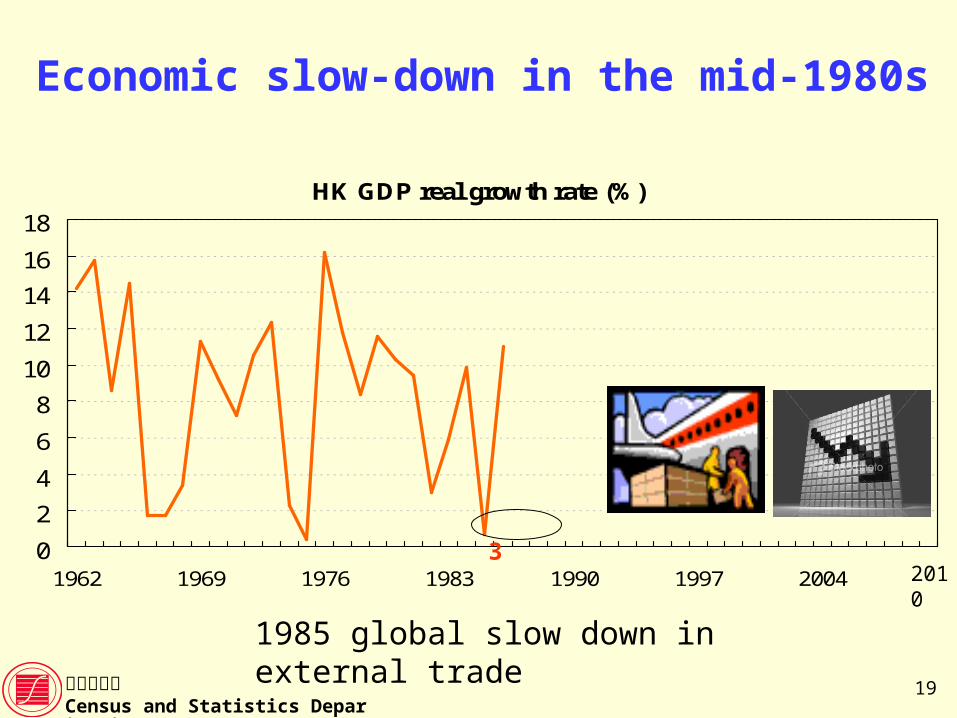
Economic slow-down in the mid-1980s
HK GDP real growth rate (%)
0
2
4
6
8
10
12
14
16
18
1962 1969 1976 1983 1990 1997 2004
1985 global slow down in external trade
3
2010
20政府統計處Census and Statistics Department
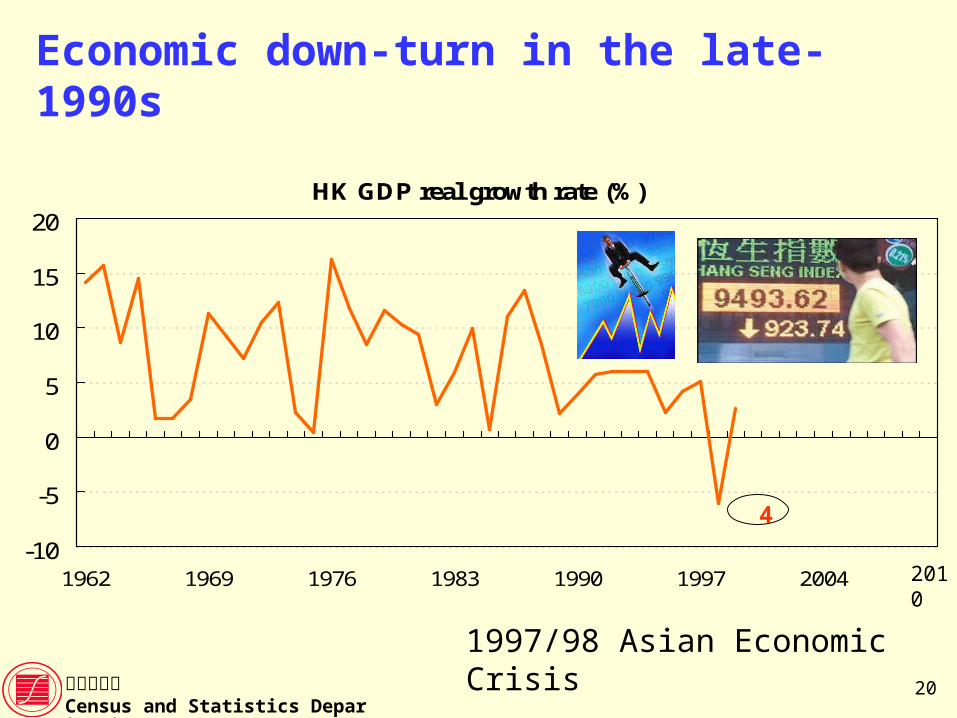
Economic down-turn in the late-1990s
HK GDP real growth rate (%)
-10
-5
0
5
10
15
20
1962 1969 1976 1983 1990 1997 2004
1997/98 Asian Economic Crisis
4
2010
21政府統計處Census and Statistics Department
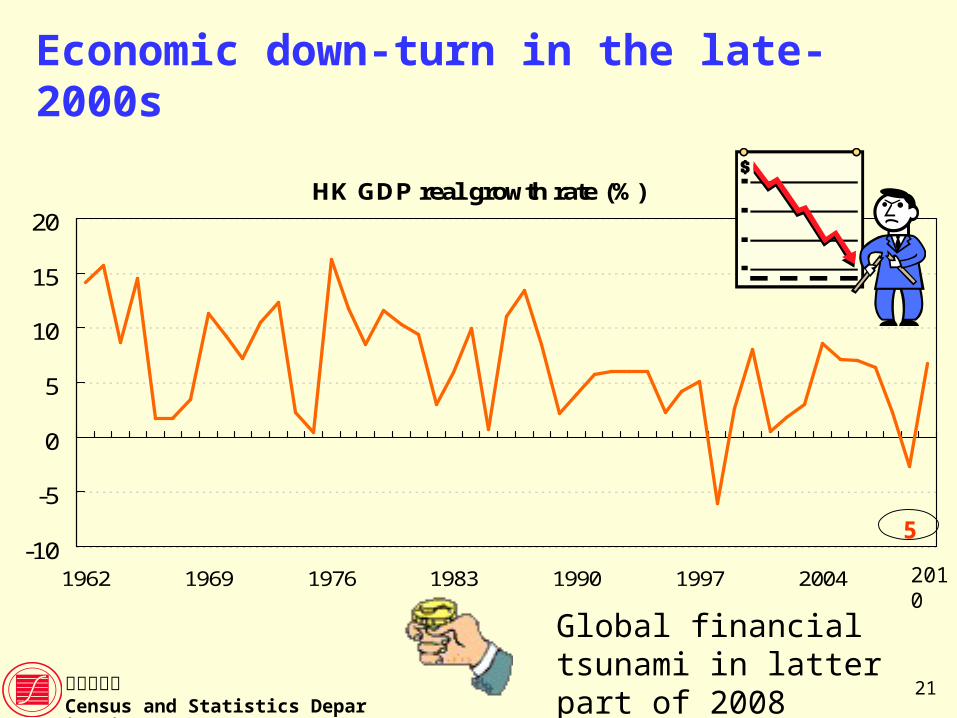
Economic down-turn in the late-2000s
HK GDP real growth rate (%)
-10
-5
0
5
10
15
20
1962 1969 1976 1983 1990 1997 2004
Global financial tsunami in latter part of 2008
5
2010
22政府統計處Census and Statistics Department
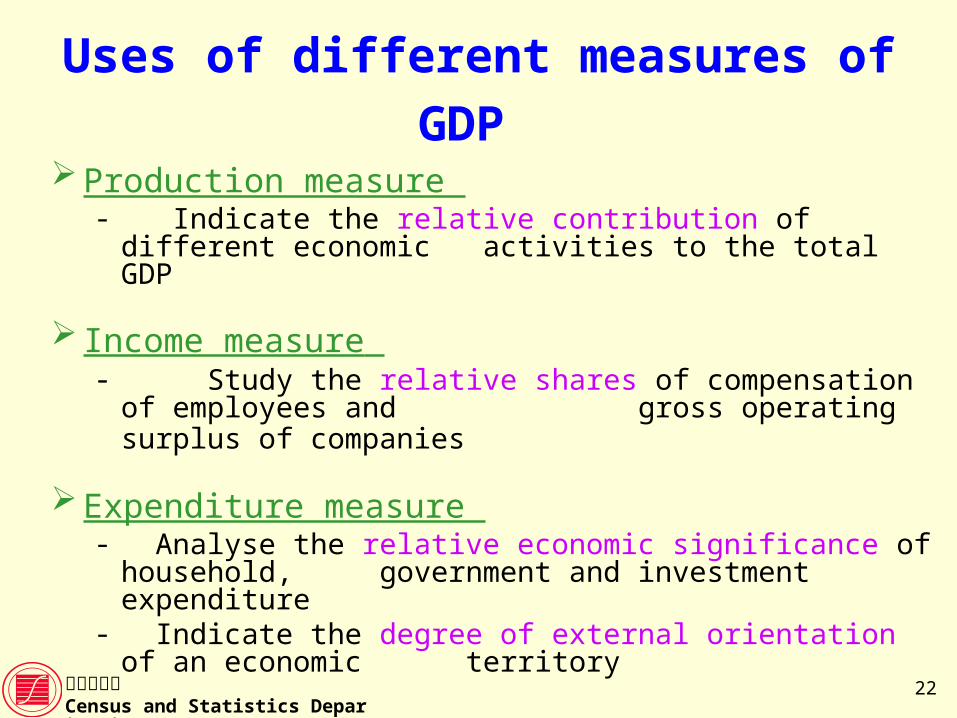
Uses of different measures of GDP Production measure
- Indicate the relative contribution of different economic activities to the total GDP
Income measure - Study the relative shares of compensation of employees
and gross operating surplus of companies
Expenditure measure - Analyse the relative economic significance of household,
government and investment expenditure- Indicate the degree of external orientation of an economic
territory
23政府統計處Census and Statistics Department
(II) Methods and data sources
for compiling GDP
24政府統計處Census and Statistics Department
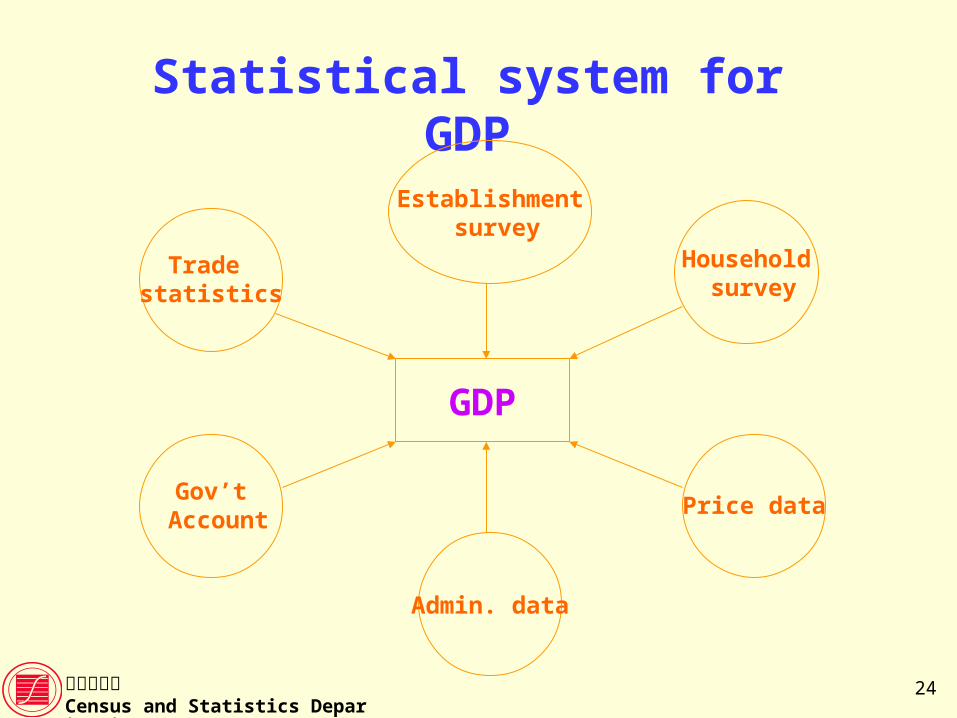
Statistical system for GDP
GDP
Trade statistics
Gov’t Account
Household survey
Establishment survey
Price data
Admin. data
25政府統計處Census and Statistics Department
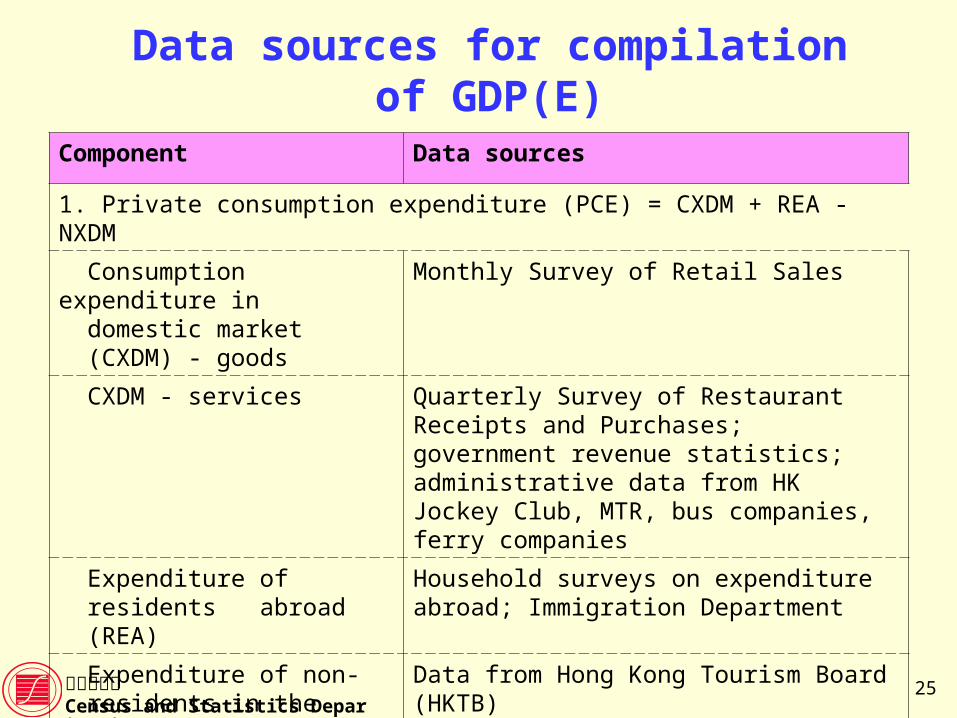
Data sources for compilation of GDP(E)
Component Data sources
1. Private consumption expenditure (PCE) = CXDM + REA - NXDM
Consumption expenditure indomestic market(CXDM) - goods
Monthly Survey of Retail Sales
CXDM - services Quarterly Survey of Restaurant Receipts and Purchases; government revenue statistics; administrative data from HK Jockey Club, MTR, bus companies, ferry companies
Expenditure of residents abroad (REA)
Household surveys on expenditure abroad; Immigration Department
Expenditure of non-residents in the domestic market (NXDM)
Data from Hong Kong Tourism Board (HKTB)
26政府統計處Census and Statistics Department
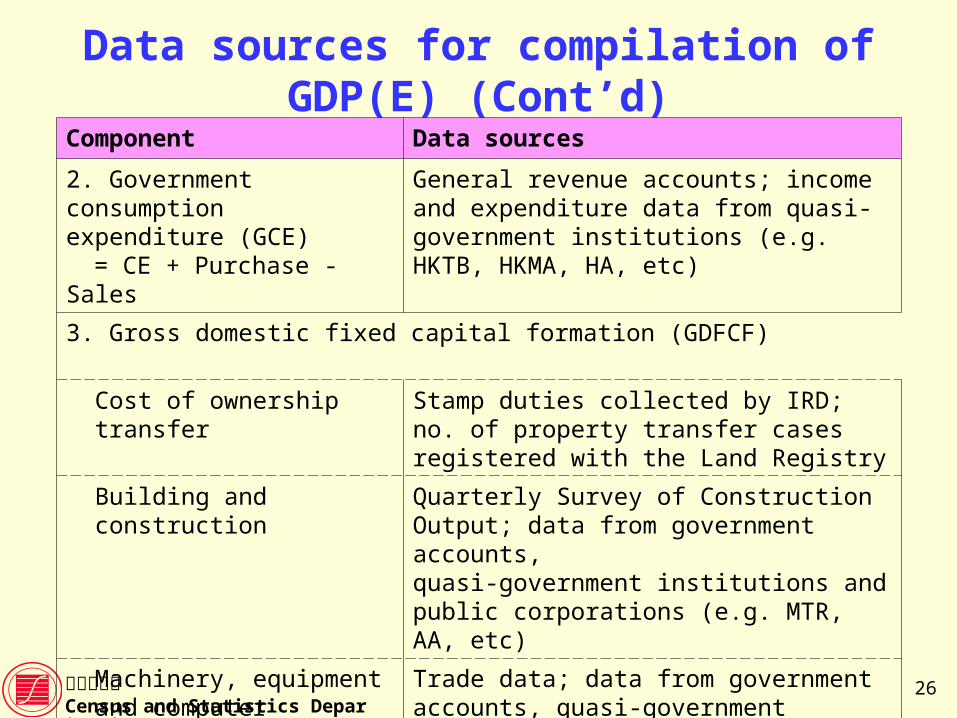
Data sources for compilation of GDP(E) (Cont’d)
Component Data sources
2. Government consumption expenditure (GCE)
= CE + Purchase - Sales
General revenue accounts; income and expenditure data from quasi-government institutions (e.g. HKTB, HKMA, HA, etc)
3. Gross domestic fixed capital formation (GDFCF)
Cost of ownership transfer Stamp duties collected by IRD; no. of property transfer cases registered with the Land Registry
Building and construction Quarterly Survey of Construction Output; data from government accounts, quasi-government institutions and public corporations (e.g. MTR, AA, etc)
Machinery, equipment and computer software
Trade data; data from government accounts, quasi-government institutions and public corporations; data from economic surveys
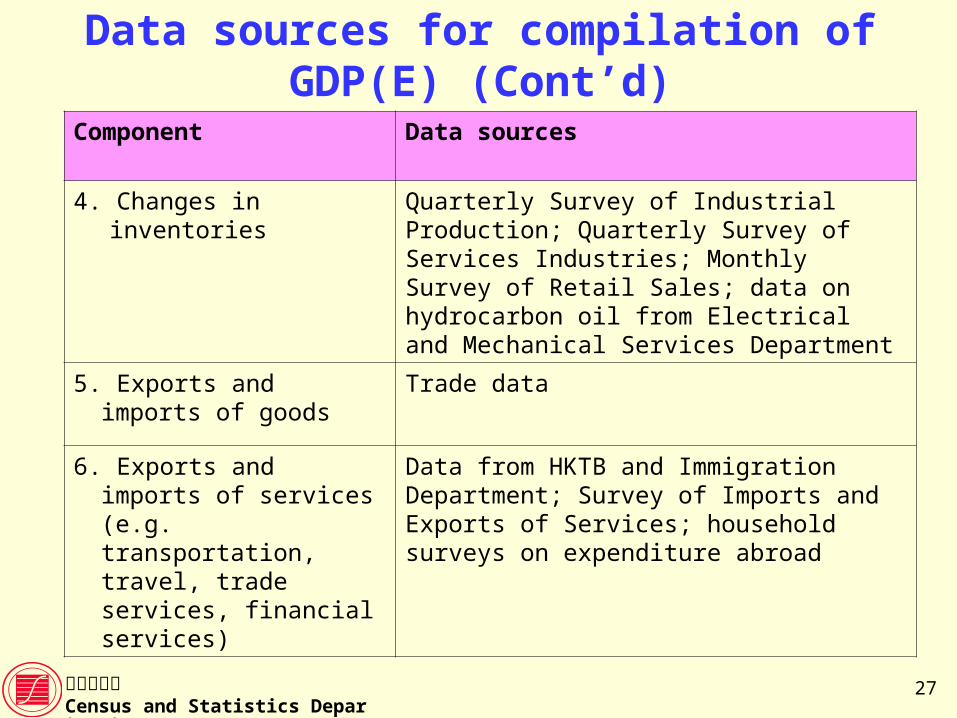
27政府統計處Census and Statistics Department
Component Data sources
4. Changes in inventories Quarterly Survey of Industrial Production; Quarterly Survey of Services Industries; Monthly Survey of Retail Sales; data on hydrocarbon oil from Electrical and Mechanical Services Department
5. Exports and imports of goods Trade data
6. Exports and imports of services (e.g. transportation, travel, trade services, financial services)
Data from HKTB and Immigration Department; Survey of Imports and Exports of Services; household surveys on expenditure abroad
Data sources for compilation of GDP(E) (Cont’d)
28政府統計處Census and Statistics Department
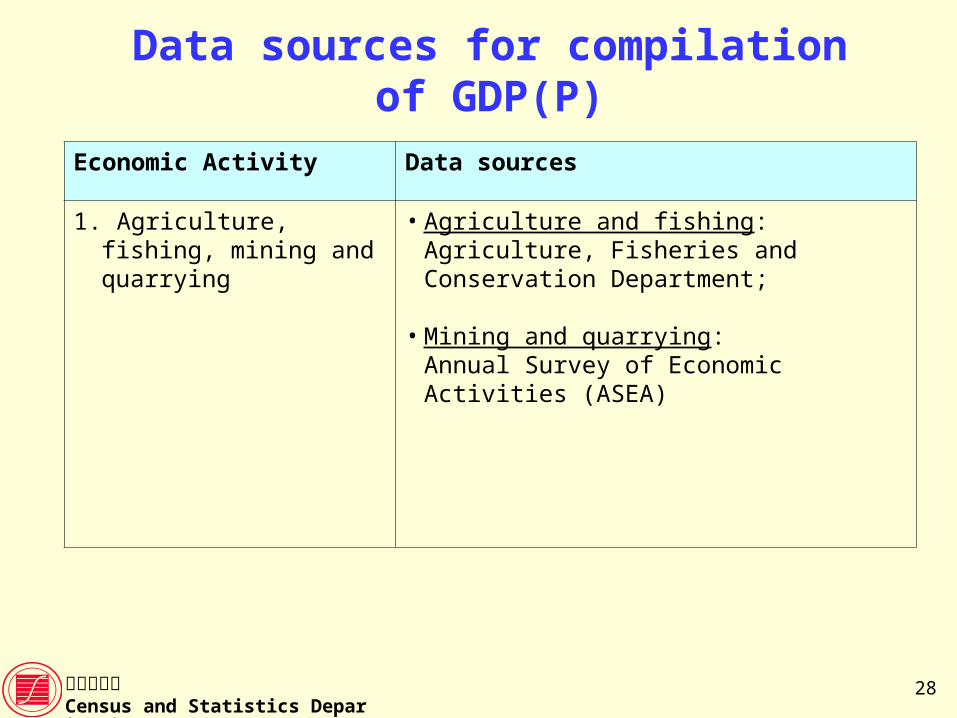
Data sources for compilation of GDP(P)
Economic Activity Data sources
1. Agriculture, fishing, mining and quarrying
• Agriculture and fishing: Agriculture, Fisheries and Conservation Department;
• Mining and quarrying: Annual Survey of Economic Activities (ASEA)
29政府統計處Census and Statistics Department
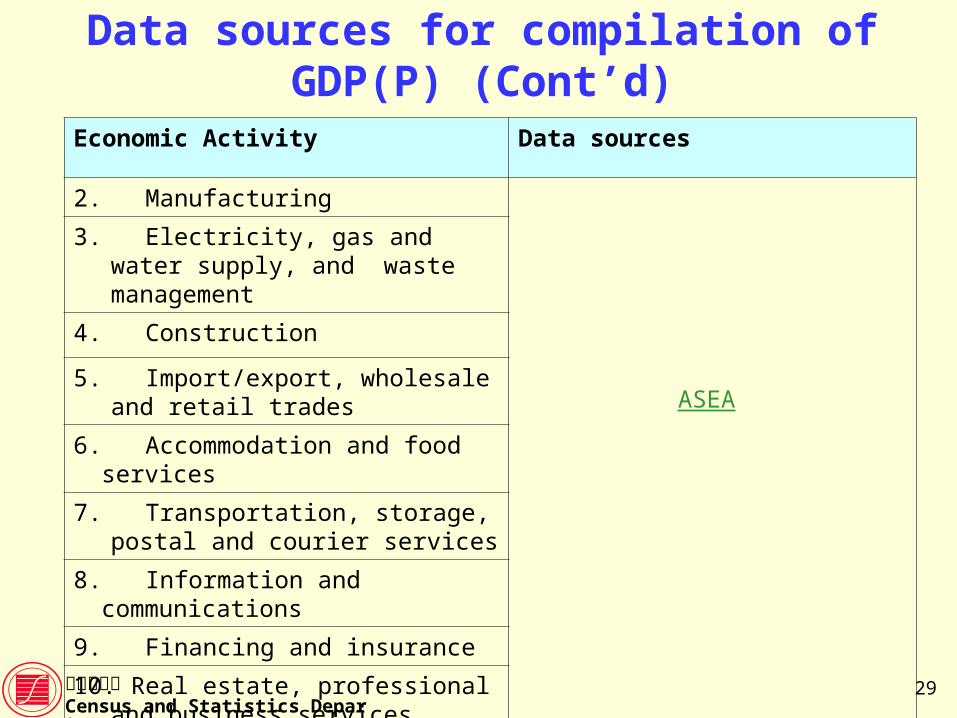
Data sources for compilation of GDP(P) (Cont’d)
Economic Activity Data sources
2. Manufacturing
ASEA
3. Electricity, gas and water supply, and waste management
4. Construction
5. Import/export, wholesale and retail trades
6. Accommodation and food services
7. Transportation, storage, postal and courier services
8. Information and communications
9. Financing and insurance
10. Real estate, professional and business services

30政府統計處Census and Statistics Department
Data sources for compilation of GDP(P) (Cont’d)
Economic Activity Data sources
11. Public administration*, social and personal services
• Government revenue accounts;
• Income and expenditure data from Quasi-government institutions (e.g. HKTB);
• Administrative records for government subvented non-profit institutions;
• Financial reports of private non-profit institutions; and
• ASEA
* Includes general administration, public order and safety services and other services provided by government departments which are not engaged in market activities
31政府統計處Census and Statistics Department
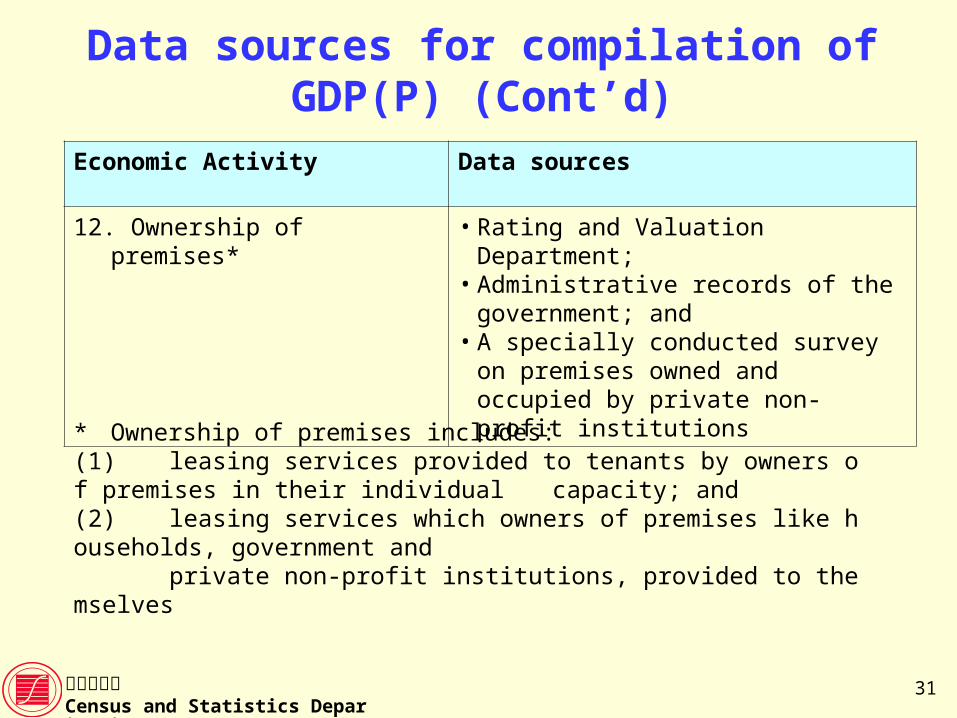
Data sources for compilation of GDP(P) (Cont’d)
Economic Activity Data sources
12. Ownership of premises* • Rating and Valuation Department;• Administrative records of the government;
and• A specially conducted survey on premises
owned and occupied by private non-profit institutions
* Ownership of premises includes: (1) leasing services provided to tenants by owners of premises in their individual
capacity; and(2) leasing services which owners of premises like households, government and private non-profit institutions, provided to themselves
32政府統計處Census and Statistics Department
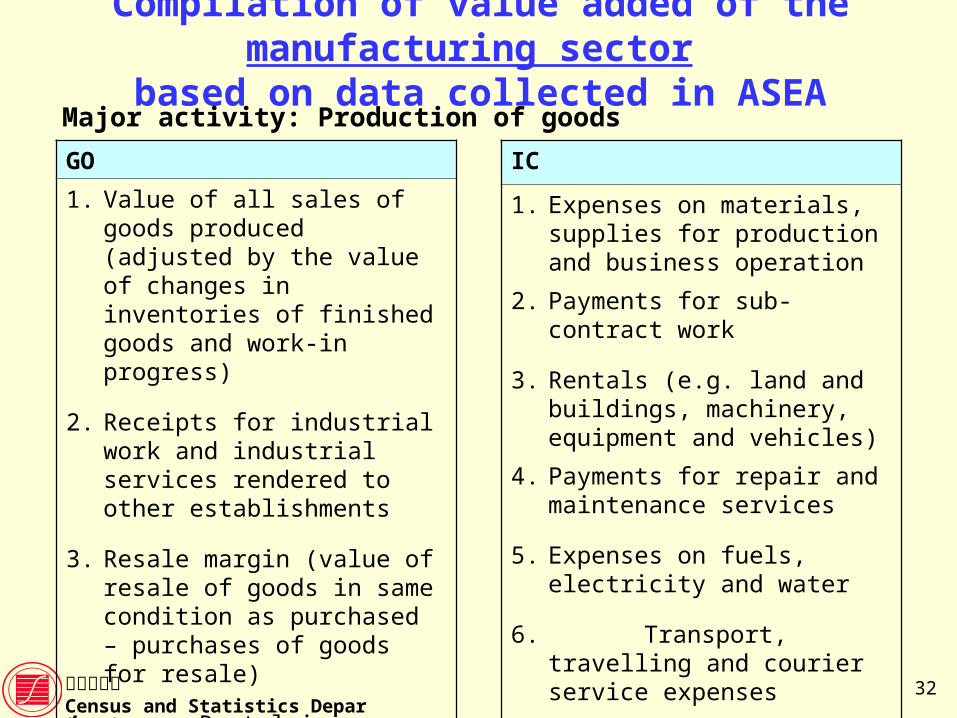
Compilation of value added of the manufacturing sector based on data collected in ASEA
Major activity: Production of goods
GO
1. Value of all sales of goods produced (adjusted by the value of changes in inventories of finished goods and work-in progress)
2. Receipts for industrial work and industrial services rendered to other establishments
3. Resale margin (value of resale of goods in same condition as purchased – purchases of goods for resale)
4. Rental income
.
.
IC
1. Expenses on materials, supplies for production and business operation
2. Payments for sub-contract work
3. Rentals (e.g. land and buildings, machinery, equipment and vehicles)
4. Payments for repair and maintenance services
5. Expenses on fuels, electricity and water
6. Transport, travelling and courier service expenses
.
.
33政府統計處Census and Statistics Department
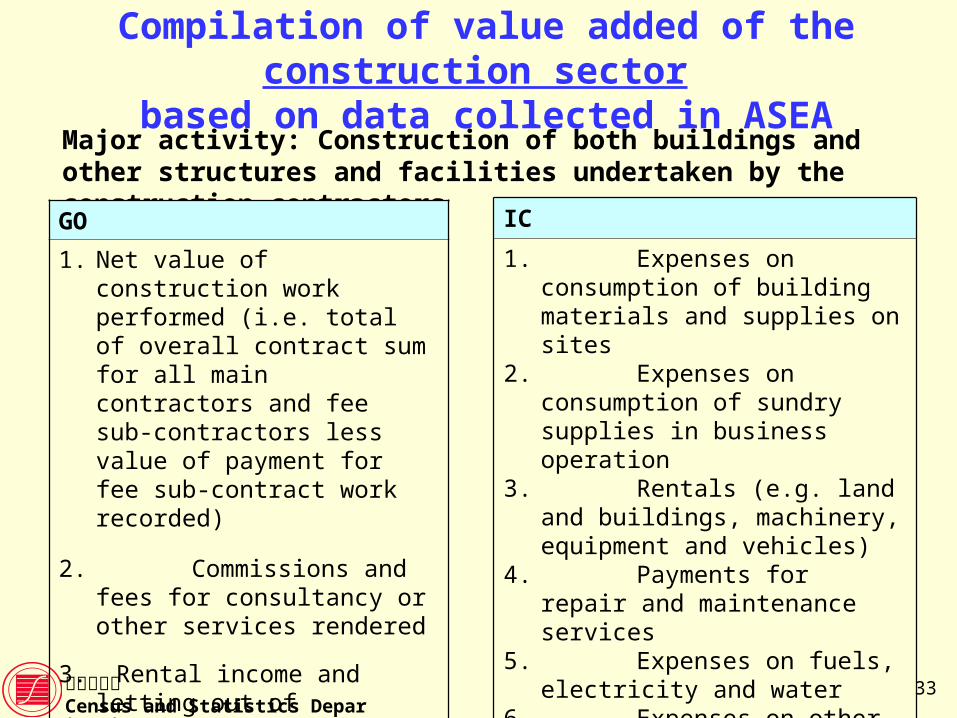
Compilation of value added of the construction sector based on data collected in ASEA
Major activity: Construction of both buildings and other structures and facilities undertaken by the construction contractors
GO
1. Net value of construction work performed (i.e. total of overall contract sum for all main contractors and fee sub-contractors less value of payment for fee sub-contract work recorded)
2. Commissions and fees for consultancy or other services rendered
3. Rental income and letting out of machinery and equipment without operator
:
IC
1. Expenses on consumption of building materials and supplies on sites
2. Expenses on consumption of sundry supplies in business operation
3. Rentals (e.g. land and buildings, machinery, equipment and vehicles)
4. Payments for repair and maintenance services
5. Expenses on fuels, electricity and water
6. Expenses on other services such as transportation, technical consultancy, insurance, etc.
:
34政府統計處Census and Statistics Department
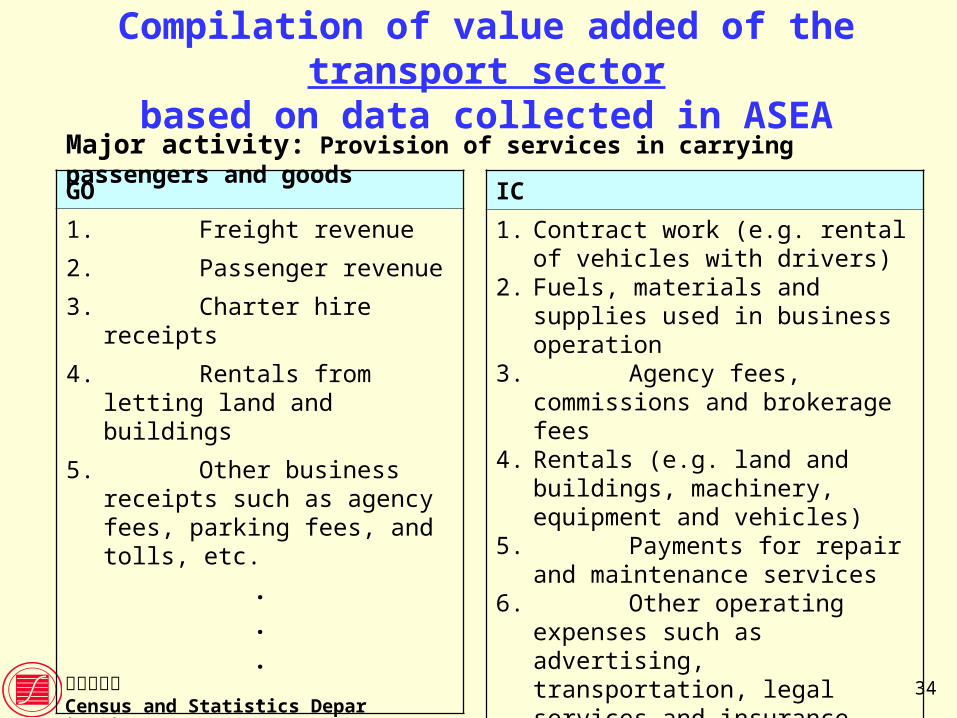
Compilation of value added of the transport sectorbased on data collected in ASEA
IC
1. Contract work (e.g. rental of vehicles with drivers)
2. Fuels, materials and supplies used in business operation
3. Agency fees, commissions and brokerage fees
4. Rentals (e.g. land and buildings, machinery, equipment and vehicles)
5. Payments for repair and maintenance services
6. Other operating expenses such as advertising, transportation, legal services and insurance etc.
.
.
GO
1. Freight revenue
2. Passenger revenue
3. Charter hire receipts
4. Rentals from letting land and buildings
5. Other business receipts such as agency fees, parking fees, and tolls, etc.
.
.
.
.
Major activity: Provision of services in carrying passengers and goods
35政府統計處Census and Statistics Department
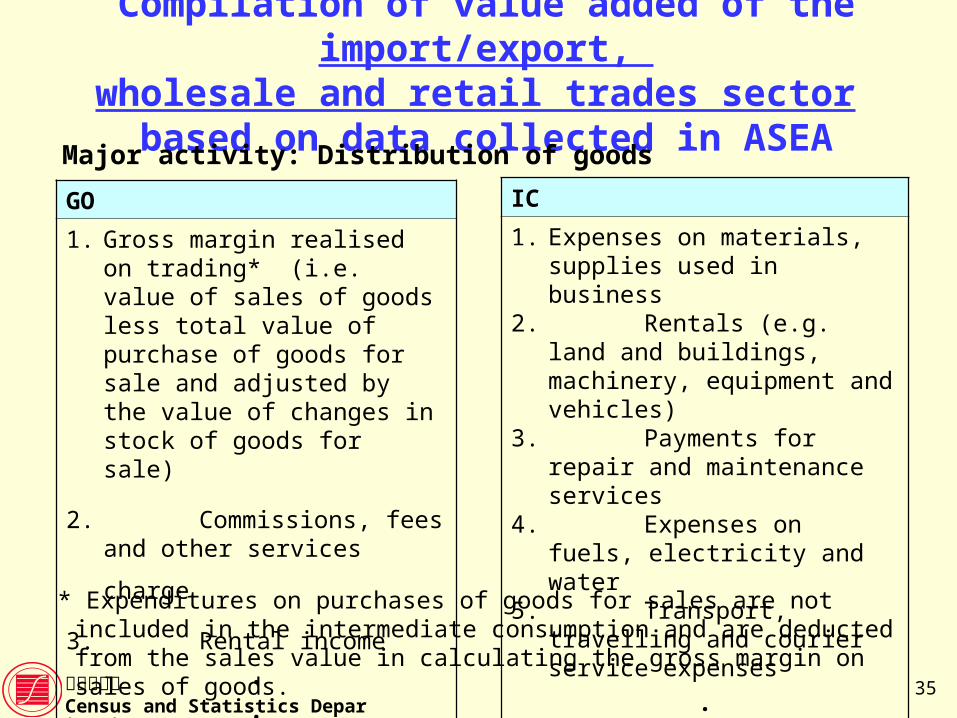
Compilation of value added of the import/export, wholesale and retail trades sector based on data collected in ASEA
Major activity: Distribution of goods
* Expenditures on purchases of goods for sales are not included in the intermediate consumption and are deducted from the sales value in calculating the gross margin on sales of goods.
GO
1. Gross margin realised on trading* (i.e. value of sales of goods less total value of purchase of goods for sale and adjusted by the value of changes in stock of goods for sale)
2. Commissions, fees and other
services charge 3. Rental income
.
.
IC
1. Expenses on materials, supplies used in business
2. Rentals (e.g. land and buildings, machinery, equipment and vehicles)
3. Payments for repair and maintenance services
4. Expenses on fuels, electricity and water
5. Transport, travelling and courier service expenses
.
.
36政府統計處Census and Statistics Department
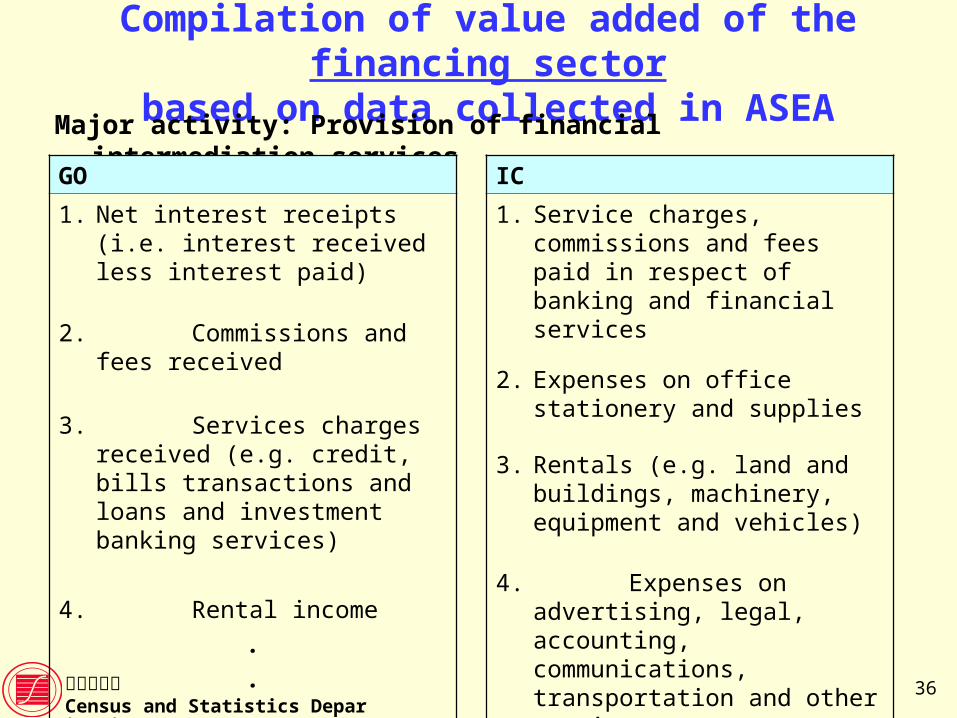
Compilation of value added of the financing sectorbased on data collected in ASEA
Major activity: Provision of financial intermediation services
GO
1. Net interest receipts (i.e. interest received less interest paid)
2. Commissions and fees received
3. Services charges received (e.g. credit, bills transactions and loans and investment banking services)
4. Rental income
.
.
.
IC
1. Service charges, commissions and fees paid in respect of banking and financial services
2. Expenses on office stationery and supplies
3. Rentals (e.g. land and buildings, machinery, equipment and vehicles)
4. Expenses on advertising, legal, accounting, communications, transportation and other services
.
.
37政府統計處Census and Statistics Department
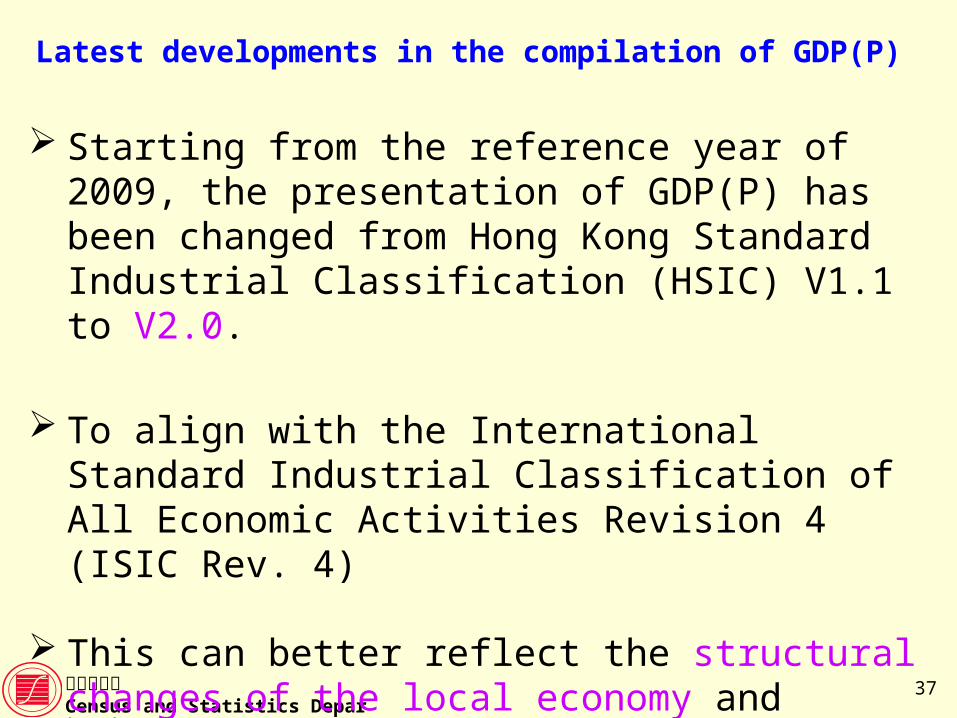
Latest developments in the compilation of GDP(P)
Starting from the reference year of 2009, the presentation of GDP(P) has been changed from Hong Kong Standard Industrial Classification (HSIC) V1.1 to V2.0.
To align with the International Standard Industrial Classification of All Economic Activities Revision 4 (ISIC Rev. 4)
This can better reflect the structural changes of the local economy and enhance international comparability of related statistics.
38政府統計處Census and Statistics Department
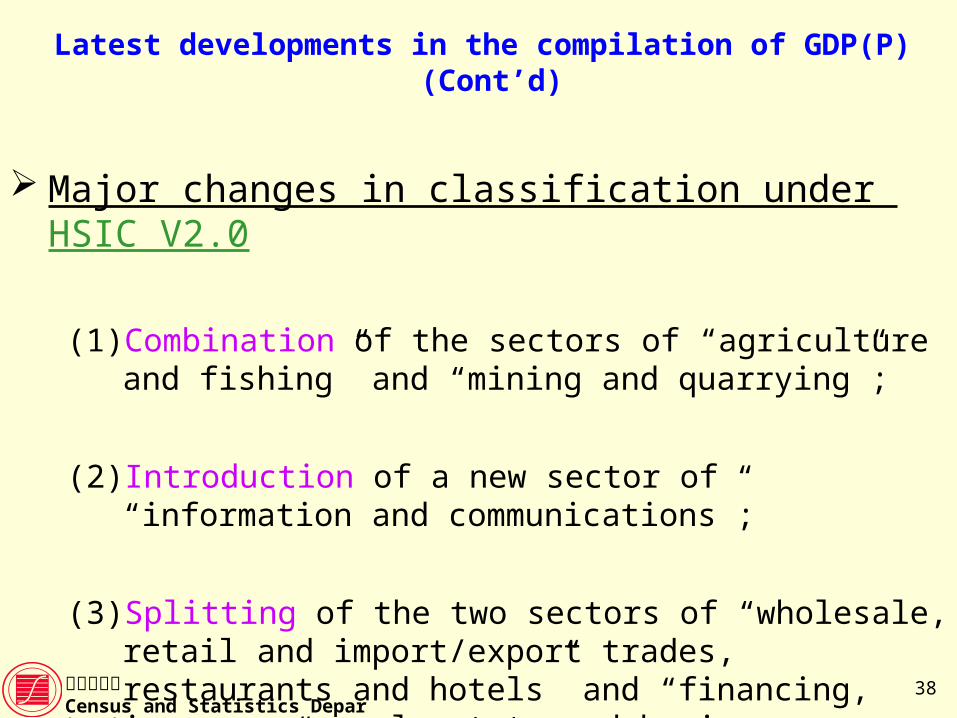
Latest developments in the compilation of GDP(P) (Cont’d)
Major changes in classification under HSIC V2.0
(1) Combination of the sectors of “agriculture and fishing” and “mining and quarrying”;
(2) Introduction of a new sector of “information and communications”;
(3) Splitting of the two sectors of “wholesale, retail and import/export trades, restaurants and hotels” and “financing, insurance, real estate and business services” into four.
39政府統計處Census and Statistics Department
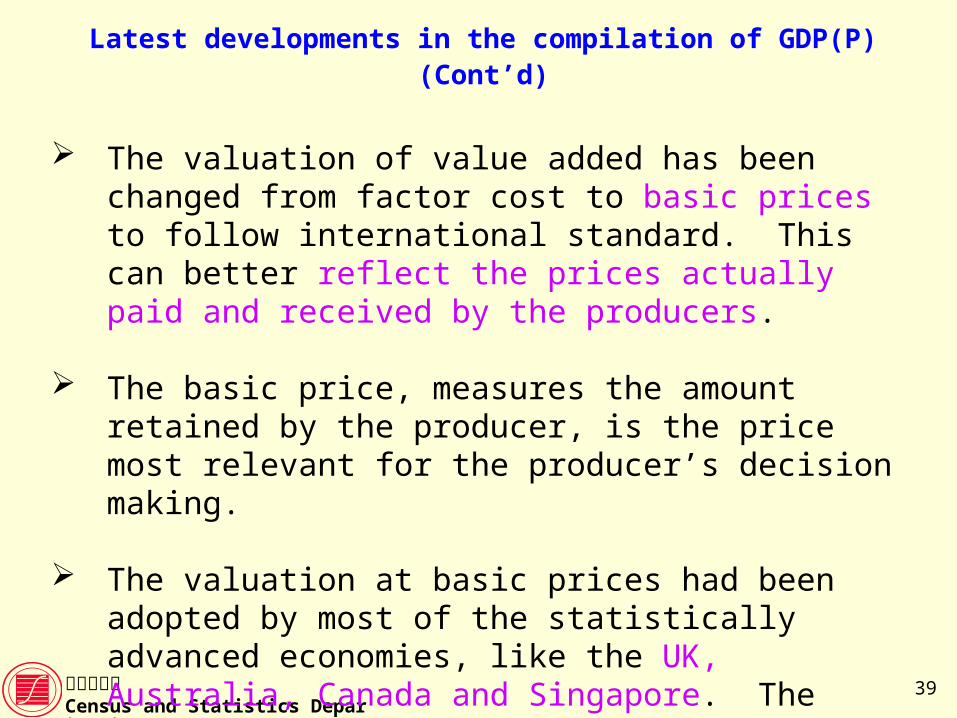
Latest developments in the compilation of GDP(P) (Cont’d)
The valuation of value added has been changed from factor cost to basic prices to follow international standard. This can better reflect the prices actually paid and received by the producers.
The basic price, measures the amount retained by the producer, is the price most relevant for the producer’s decision making.
The valuation at basic prices had been adopted by most of the statistically advanced economies, like the UK, Australia, Canada and Singapore. The adoption of such approach in Hong Kong will enhance the international comparability of Hong Kong’s estimates.
40政府統計處Census and Statistics Department
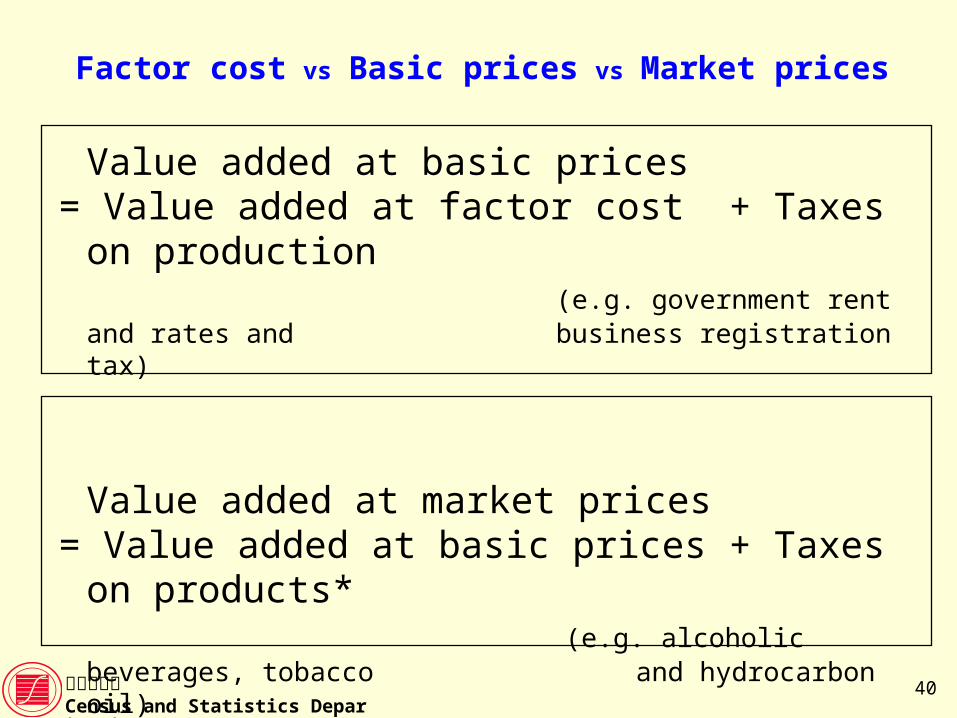
Factor cost vs Basic prices vs Market prices
Value added at basic prices = Value added at factor cost + Taxes on production (e.g. government rent and rates and business registration tax)
Value added at market prices= Value added at basic prices + Taxes on products* (e.g. alcoholic beverages,
tobacco and hydrocarbon oil)
* Payable per unit of goods and services
41政府統計處Census and Statistics Department
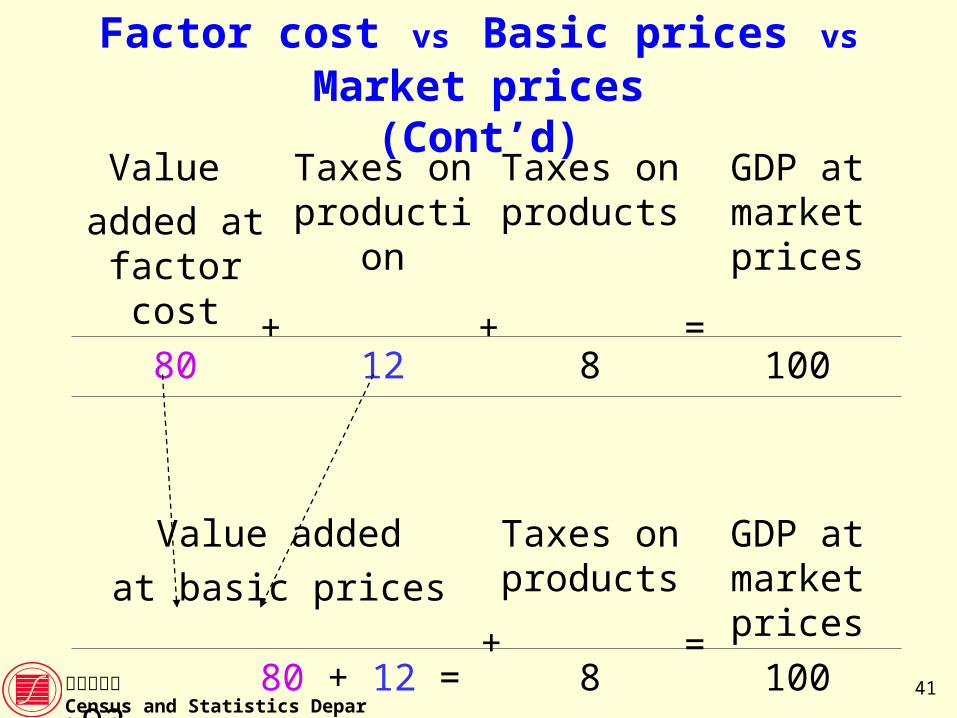
Factor cost vs Basic prices vs Market prices(Cont’d)
Value
added at factor cost
Taxes on production
Taxes on products
GDP at market prices
80 12 8 100
Value added
at basic prices
Taxes on products
GDP at market prices
80 + 12 = 92 8 100
+ + =
+ =
42政府統計處Census and Statistics Department
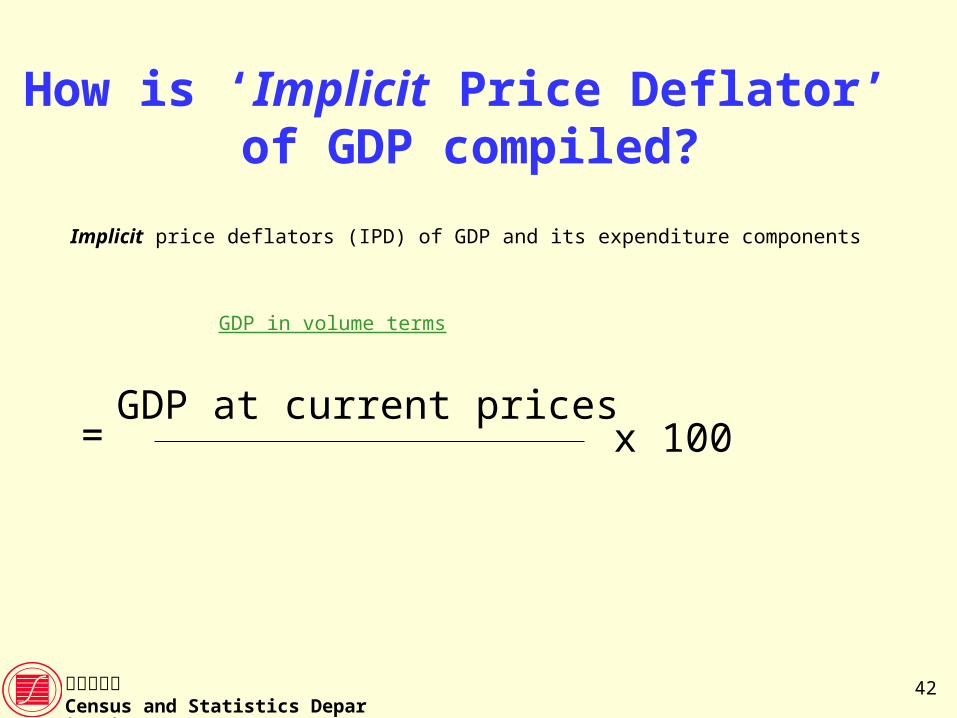
How is ‘Implicit Price Deflator’ of GDP compiled?
Implicit price deflators (IPD) of GDP and its expenditure components
GDP in volume terms
x 100=GDP at current prices
43政府統計處Census and Statistics Department
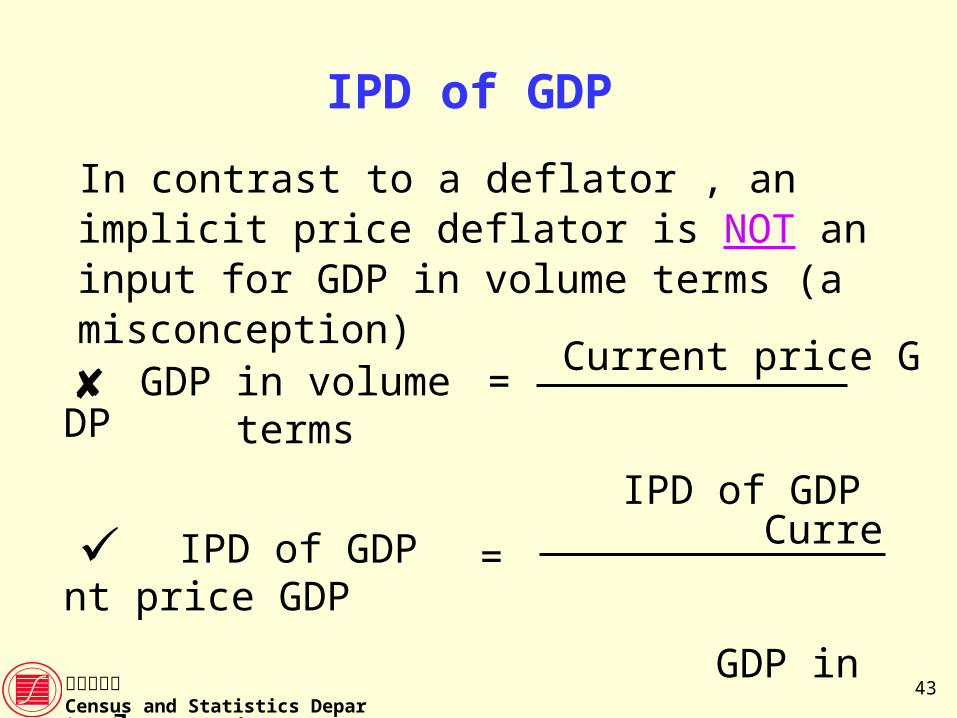
IPD of GDP
In contrast to a deflator , an implicit price deflator is NOT an input for GDP in volume terms (a misconception)
Current price GDP
IPD of GDP = GDP in volume terms
Current price GDP
GDP in volume term
s
IPD of GDP =
44政府統計處Census and Statistics Department
Implicit Price Deflator of GDP (IPD) andConsumer Price Index (CPI)
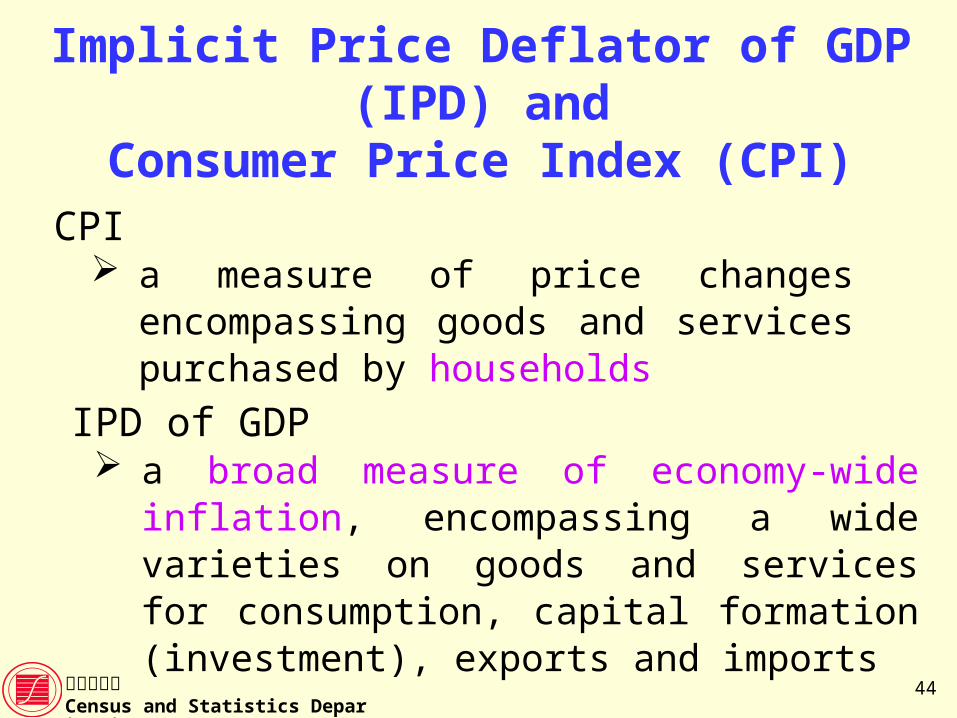
CPI a measure of price changes encompassing
goods and services purchased by households
IPD of GDP a broad measure of economy-wide inflation,
encompassing a wide varieties on goods and services for consumption, capital formation (investment), exports and imports
45政府統計處Census and Statistics Department
(III) Chain volume measures
of GDP
46政府統計處Census and Statistics Department
Chain Volume Measures of GDP
C&SD has replaced the constant price measures by the chain volume measures of GDP
Why?– Align with the latest international statistical
guidelines– Provide a better measure of the real growth rate of
the aggregate economic activity in an economy as compared with the constant price volume measure of GDP

47政府統計處Census and Statistics Department
Basic concepts of the volume measures of GDP
48政府統計處Census and Statistics Department
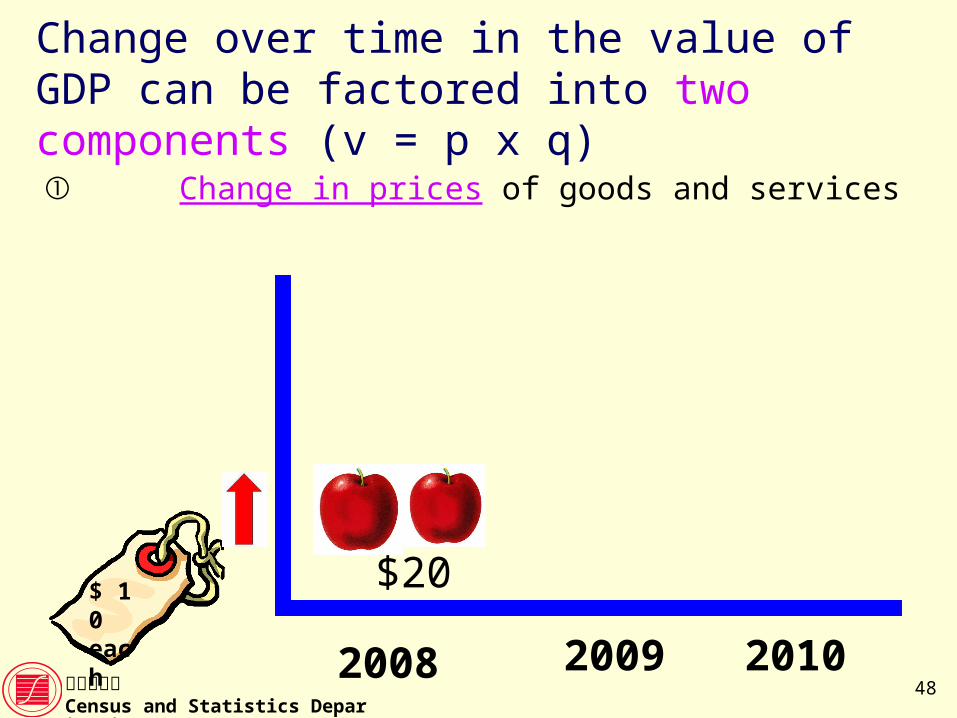
Change over time in the value of GDP can be factored into two components (v = p x q)
① Change in prices of goods and services
$ 10each
2009
2008
2010
$20
49政府統計處Census and Statistics Department
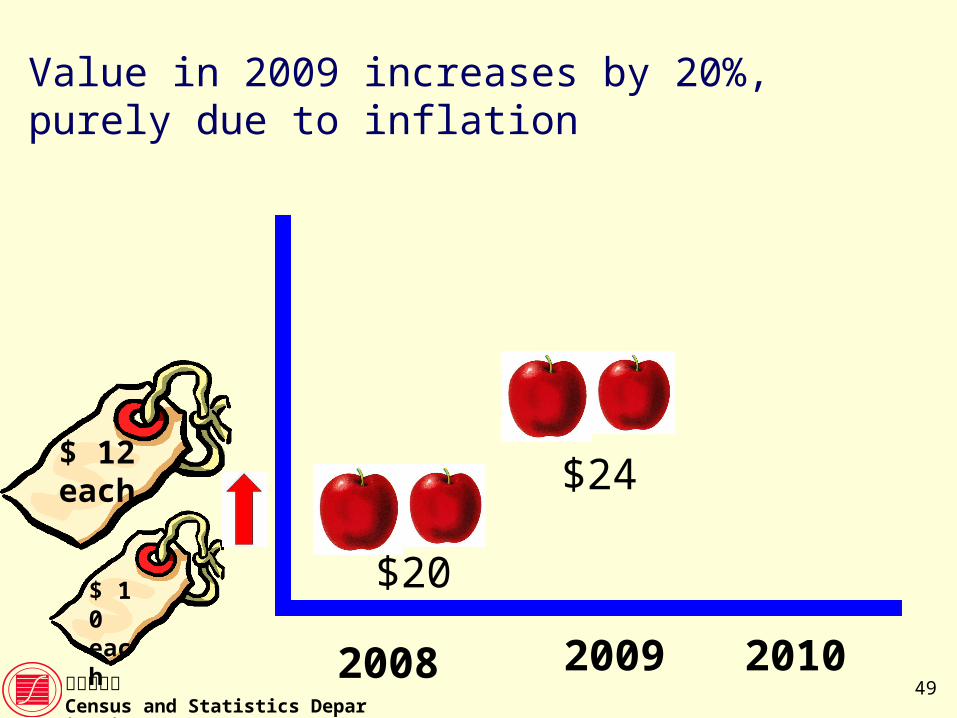
Value in 2009 increases by 20%, purely due to inflation
$ 10 each
$ 12 each
2009
2008
2010
$20
$24
50政府統計處Census and Statistics Department
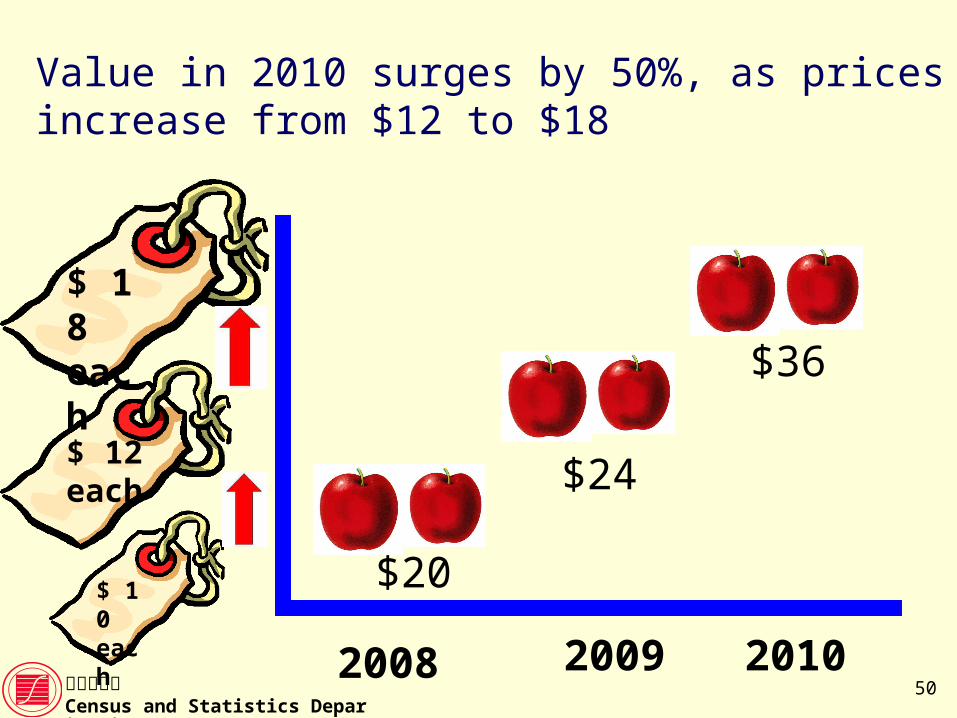
Value in 2010 surges by 50%, as prices increase from $12 to $18
$ 10 each
$ 12 each
$ 18 each
2009
2008
2010
$20
$24
$36
51政府統計處Census and Statistics Department
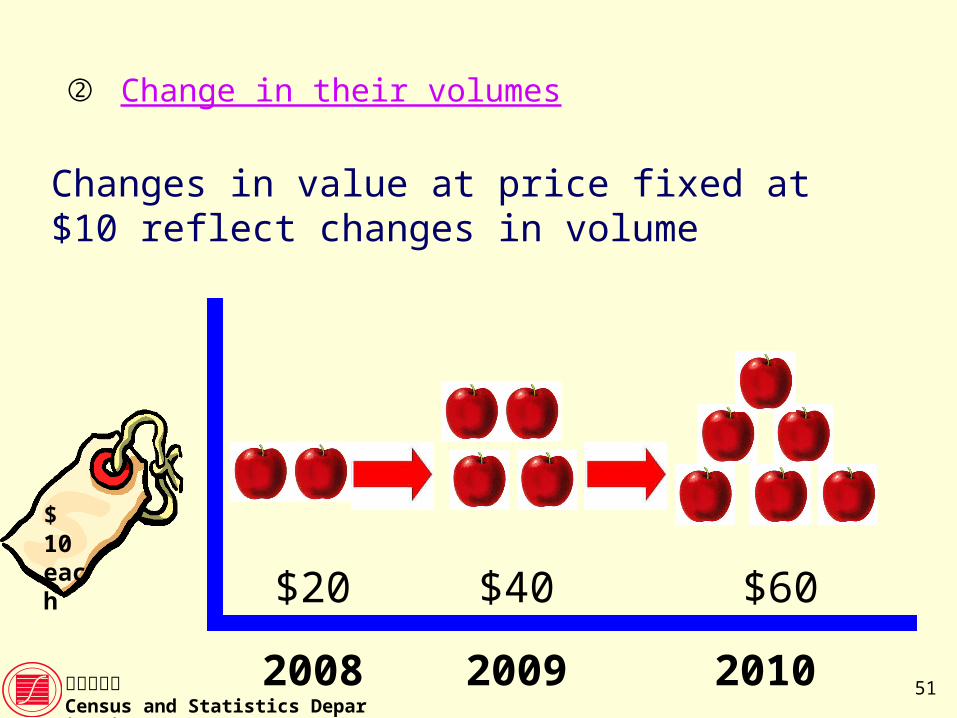
Changes in value at price fixed at $10 reflect changes in volume
② Change in their volumes
$ 10 each
2009
2008
2010
$40$20 $60
52政府統計處Census and Statistics Department
Base year vs Reference year
What is the base year?
Base year is the year from which the price structures are used as weights for deriving the aggregate volume measures
For constant price volume index, the base year is selected arbitrarily and updated at a 5-10 yearly interval
For chain volume index, the base year is always the preceding year in principle, i.e. t-1
53政府統計處Census and Statistics Department
Base year vs Reference year (Cont’d)
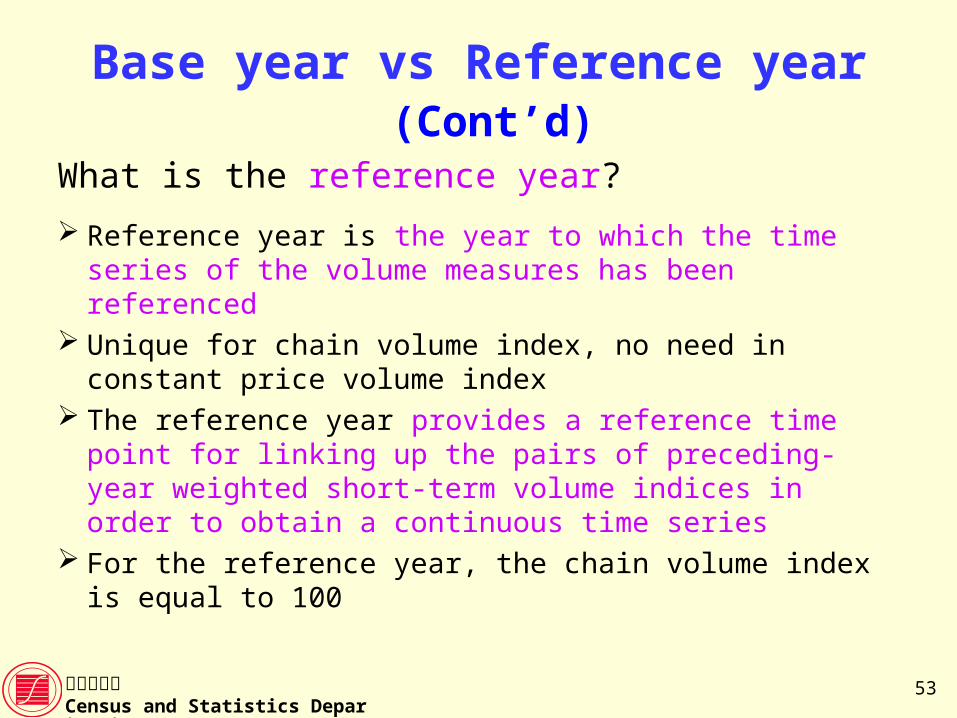
What is the reference year?
Reference year is the year to which the time series of the volume measures has been referenced
Unique for chain volume index, no need in constant price volume index
The reference year provides a reference time point for linking up the pairs of preceding-year weighted short-term volume indices in order to obtain a continuous time series
For the reference year, the chain volume index is equal to 100
54政府統計處Census and Statistics Department
Compilation ofvolume measures of GDP
55政府統計處Census and Statistics Department
International guidelines on volume measures of GDP
C&SD follows the 1993 System of National Accounts (SNA)
The 1968 SNA: fixed-weighted volume index approach – constant price measure of GDP
The 1993 SNA: annually re-weighted chain linking approach – chain volume measure of GDP
56政府統計處Census and Statistics Department
Constant price measures of GDP
Adopt the price structure of a fixed base year (say 2000) as weights for aggregating the volumes of components in compiling the volume measure of the GDP aggregate (hence the concept of “fixed-weighted”)
Update the base year (rebasing) once every 5 or 10 years
Link up the constant price series on different base years (1966, 1973, 1980, 1990 and 2000) to obtain a continuous time series of the volume measures of GDP and its components (linking or splicing method)
57政府統計處Census and Statistics Department
Chain volume measures of GDP
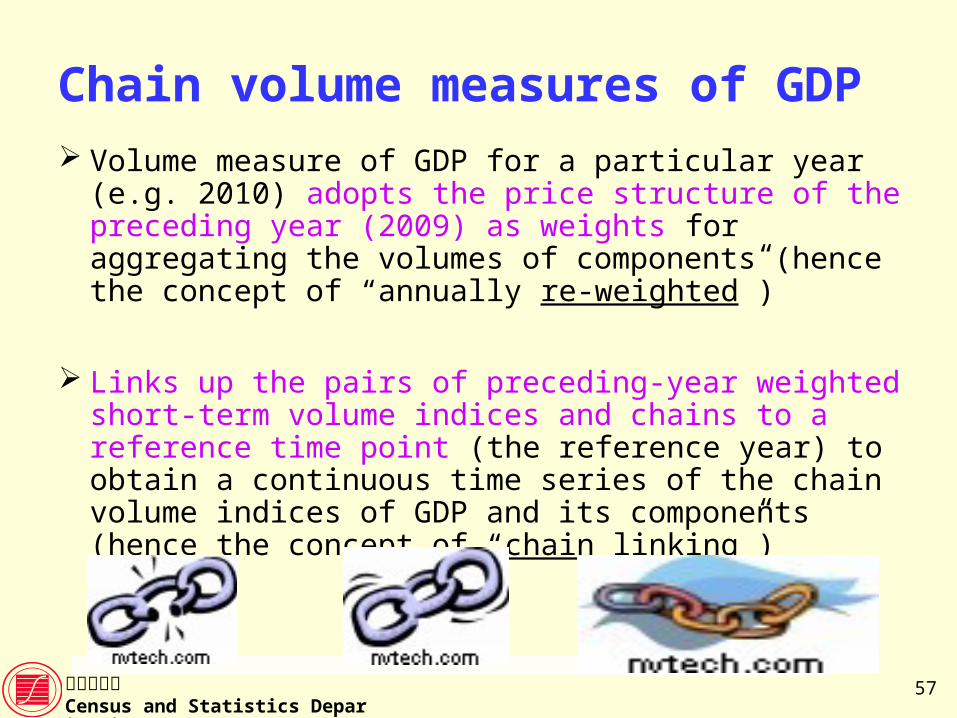
Volume measure of GDP for a particular year (e.g. 2010) adopts the price structure of the preceding year (2009) as weights for aggregating the volumes of components (hence the concept of “annually re-weighted”)
Links up the pairs of preceding-year weighted short-term volume indices and chains to a reference time point (the reference year) to obtain a continuous time series of the chain volume indices of GDP and its components (hence the concept of “chain linking”)
58政府統計處Census and Statistics Department
Chained dollar estimates of GDPand components
Further convert the chain volume index series into chained dollar series by multiplying the current price value in the reference year (e.g. 2009) by the chain volume index
The resultant series is referred to as the chained (2009) dollar estimates (i.e. chain volume measures expressed in dollar terms)
The chain linking process is carried out for GDP and its components independently in order to preserve the historical real growth rates
59政府統計處Census and Statistics Department
Illustration of compilation method of the chain volume measures of GDP
60政府統計處Census and Statistics Department
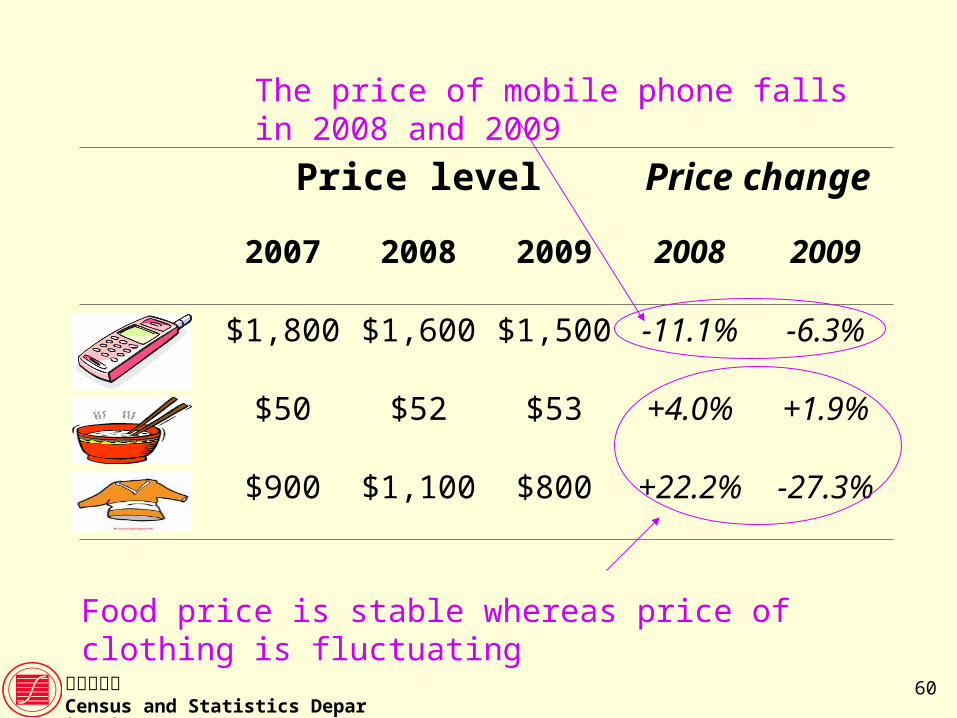
Price level Price change
2007 2008 2009 2008 2009
$1,800 $1,600 $1,500 -11.1% -6.3%
$50 $52 $53 +4.0% +1.9%
$900 $1,100 $800 +22.2% -27.3%
The price of mobile phone falls in 2008 and 2009
Food price is stable whereas price of clothing is fluctuating
61政府統計處Census and Statistics Department
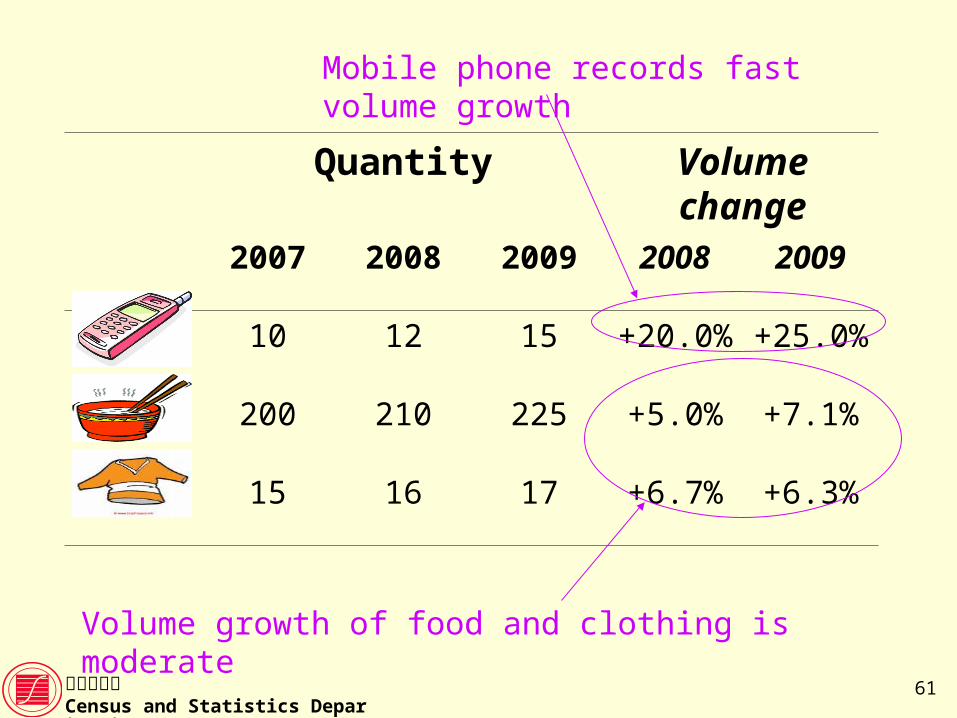
Quantity Volume change
2007 2008 2009 2008 2009
10 12 15 +20.0% +25.0%
200 210 225 +5.0% +7.1%
15 16 17 +6.7% +6.3%
Mobile phone records fast volume growth
Volume growth of food and clothing is moderate
62政府統計處Census and Statistics Department
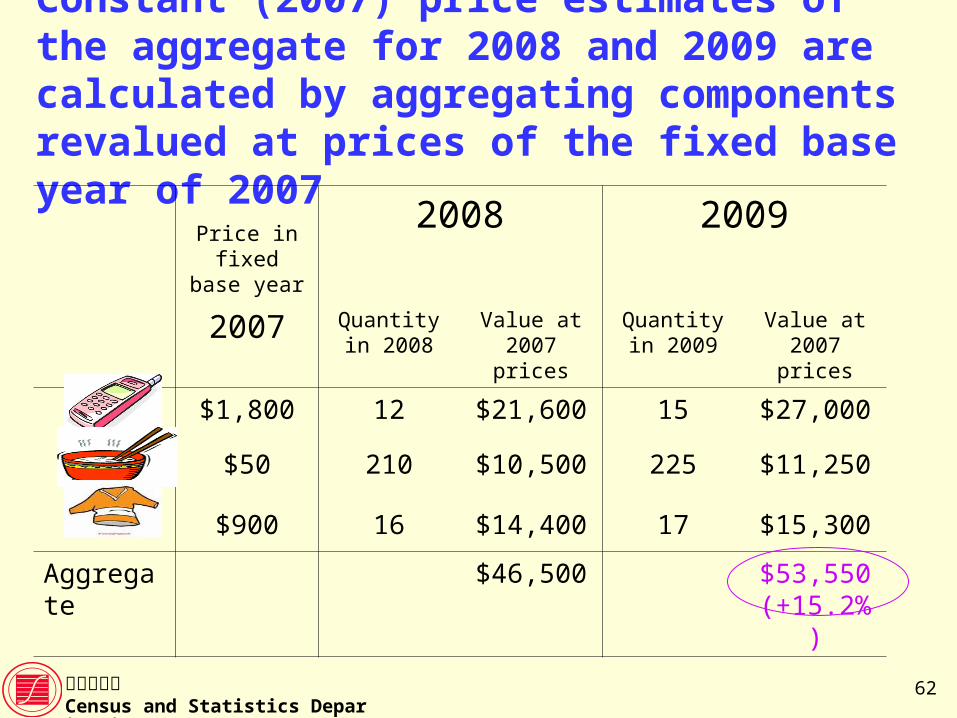
Constant (2007) price estimates of the aggregate for 2008 and 2009 are calculated by aggregating components revalued at prices of the fixed base year of 2007
Price in fixed base year
2008 2009
2007 Quantity in 2008
Value at 2007 prices
Quantity in 2009
Value at 2007 prices
$1,800 12 $21,600 15 $27,000
$50 210 $10,500 225 $11,250
$900 16 $14,400 17 $15,300
Aggregate $46,500 $53,550(+15.2%)
63政府統計處Census and Statistics Department
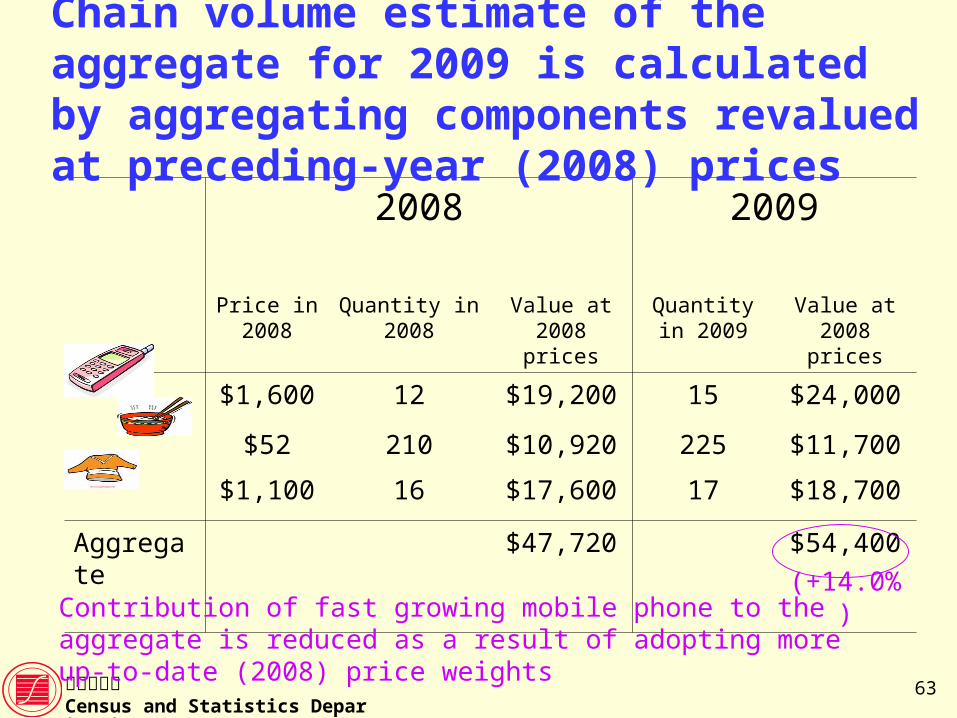
2008 2009
Price in 2008
Quantity in 2008
Value at 2008 prices
Quantity in 2009
Value at 2008 prices
$1,600 12 $19,200 15 $24,000
$52 210 $10,920 225 $11,700
$1,100 16 $17,600 17 $18,700
Aggregate $47,720 $54,400
(+14.0%)
Chain volume estimate of the aggregate for 2009 is calculated by aggregating components revalued at preceding-year (2008) prices
Contribution of fast growing mobile phone to the aggregate is reduced as a result of adopting more up-to-date (2008) price weights
64政府統計處Census and Statistics Department
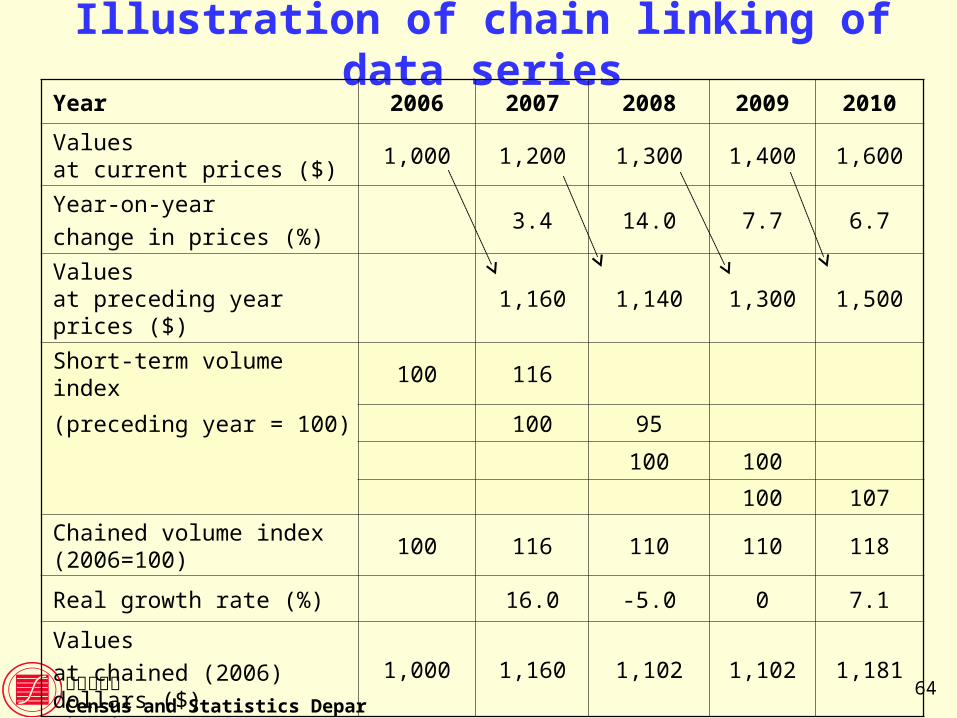
Illustration of chain linking of data seriesYear 2006 2007 2008 2009 2010
Values at current prices ($)
1,000 1,200 1,300 1,400 1,600
Year-on-year
change in prices (%)3.4 14.0 7.7 6.7
Values at preceding year prices ($)
1,160 1,140 1,300 1,500
Short-term volume index 100 116
(preceding year = 100) 100 95
100 100
100 107
Chained volume index(2006=100)
100 116 110 110 118
Real growth rate (%) 16.0 -5.0 0 7.1
Values
at chained (2006) dollars ($)1,000 1,160 1,102 1,102 1,181
65政府統計處Census and Statistics Department
Merits of the chain volume measure of GDP over the
constant price measure
66政府統計處Census and Statistics Department
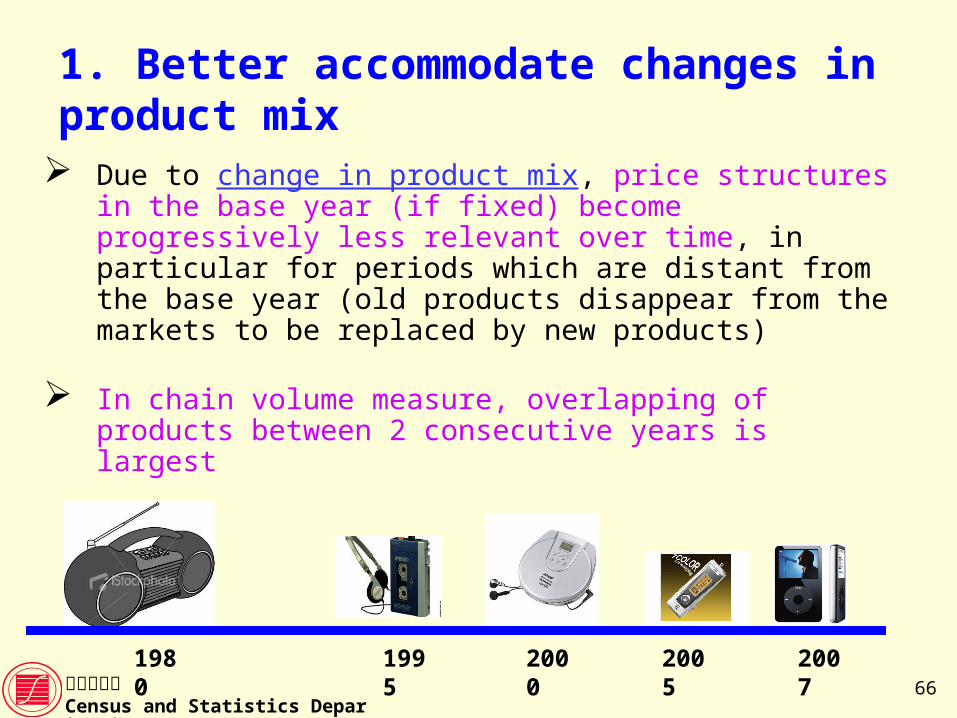
Due to change in product mix, price structures in the base year (if fixed) become progressively less relevant over time, in particular for periods which are distant from the base year (old products disappear from the markets to be replaced by new products)
In chain volume measure, overlapping of products between 2 consecutive years is largest
1980 1995 2000 2005 2007
1. Better accommodate changes in product mix
67政府統計處Census and Statistics Department
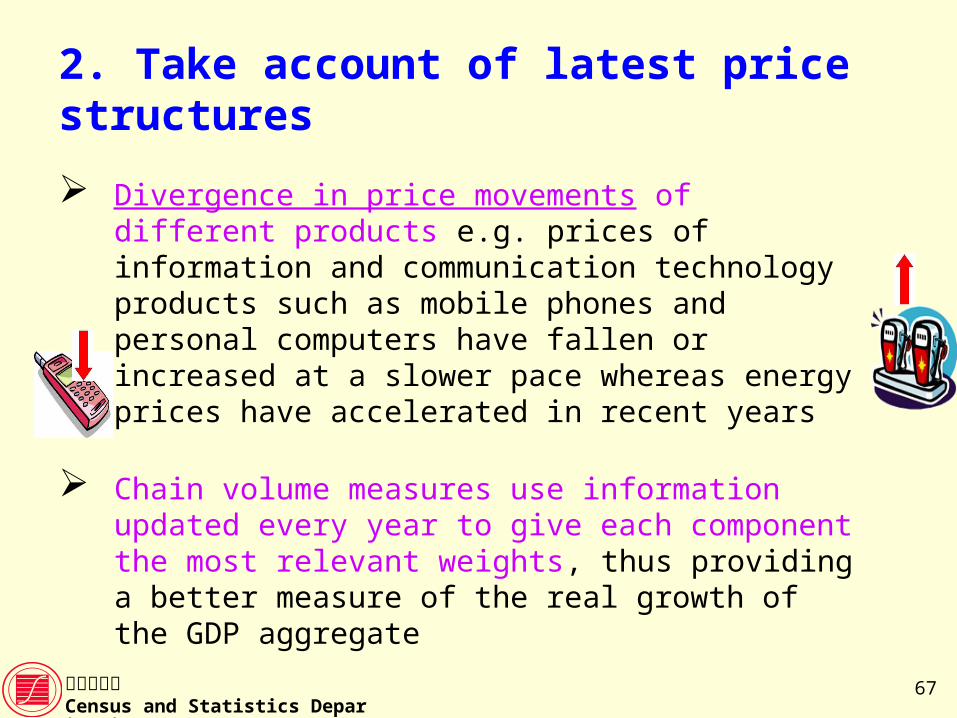
2. Take account of latest price structures
Divergence in price movements of different products e.g. prices of information and communication technology products such as mobile phones and personal computers have fallen or increased at a slower pace whereas energy prices have accelerated in recent years
Chain volume measures use information updated every year to give each component the most relevant weights, thus providing a better measure of the real growth of the GDP aggregate
68政府統計處Census and Statistics Department
3. More accurately portrait the changing economic conditions
Changes in the Hong Kong economy (and elsewhere) have speeded up in the last decade
In times of dramatic economic changes and volatility of relative prices and the associated volume changes of different components (e.g. consumption, investment, external trade etc.), updating the base year once every several years may no longer be sufficient to reflect the changing economic environment
Chain volume measures can better gauge the contributions of components to the real growth of the GDP aggregate
69政府統計處Census and Statistics Department
(IV) Commonly asked questions
on the concepts of GDP
70政府統計處Census and Statistics Department
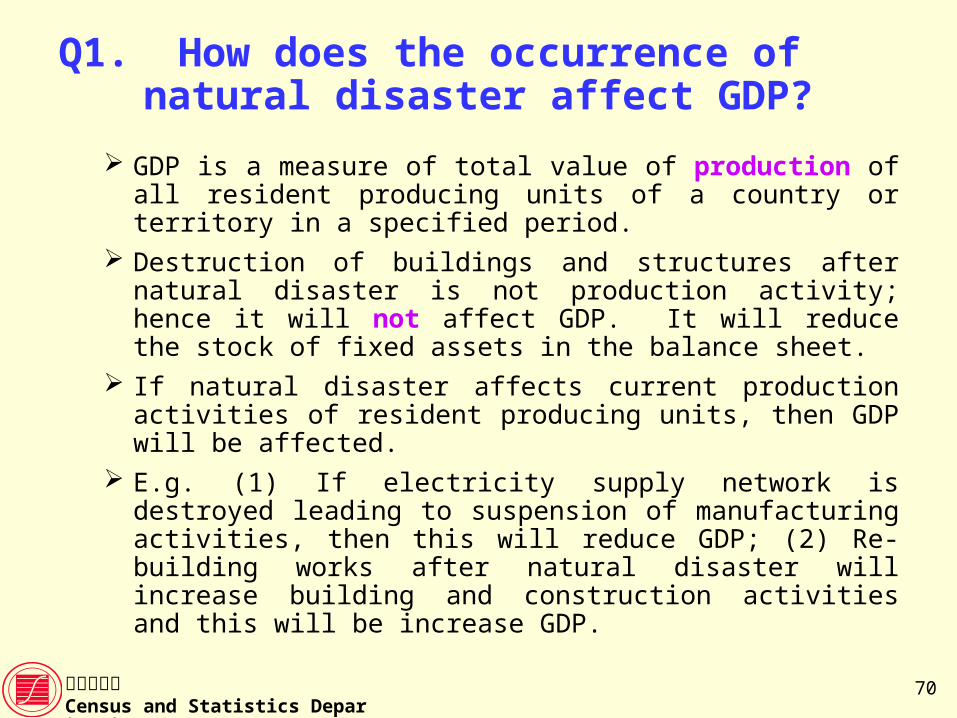
Q1. How does the occurrence of natural disaster affect GDP?
GDP is a measure of total value of production of all resident producing units of a country or territory in a specified period.
Destruction of buildings and structures after natural disaster is not production activity; hence it will not affect GDP. It will reduce the stock of fixed assets in the balance sheet.
If natural disaster affects current production activities of resident producing units, then GDP will be affected.
E.g. (1) If electricity supply network is destroyed leading to suspension of manufacturing activities, then this will reduce GDP; (2) Re-building works after natural disaster will increase building and construction activities and this will be increase GDP.
71政府統計處Census and Statistics Department
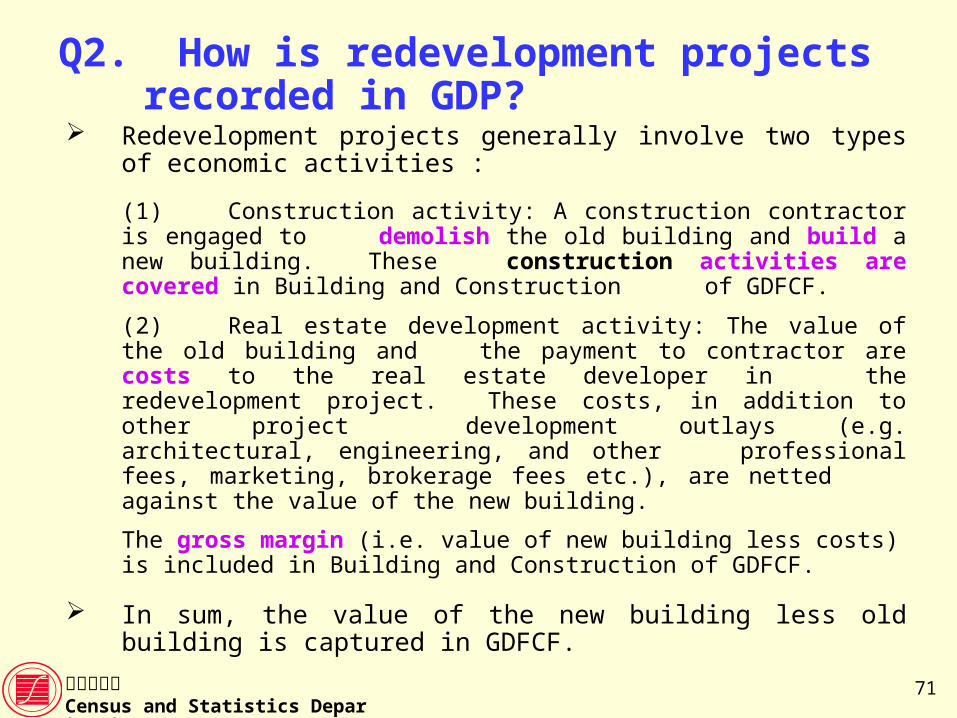
Q2. How is redevelopment projects recorded in GDP?
Redevelopment projects generally involve two types of economic activities :
(1) Construction activity: A construction contractor is engaged to demolish the old building and build a new building. These
construction activities are covered in Building and Construction of GDFCF.
(2) Real estate development activity: The value of the old building and the payment to contractor are costs to the real estate developer in the redevelopment project. These costs, in addition to other project development outlays (e.g. architectural, engineering, and other professional fees, marketing, brokerage fees etc.), are netted
against the value of the new building.
The gross margin (i.e. value of new building less costs) is included in Building and Construction of GDFCF.
In sum, the value of the new building less old building is captured in GDFCF.
72政府統計處Census and Statistics Department
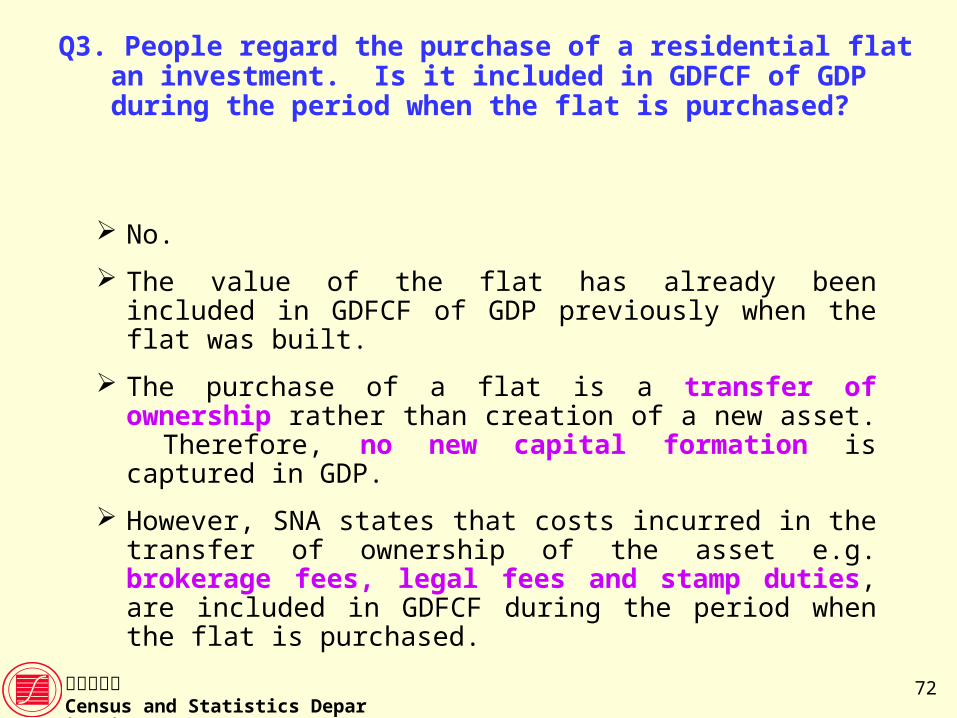
Q3. People regard the purchase of a residential flat an investment. Is it included in GDFCF of GDP during the period when the flat is purchased?
No.
The value of the flat has already been included in GDFCF of GDP previously when the flat was built.
The purchase of a flat is a transfer of ownership rather than creation of a new asset. Therefore, no new capital formation is captured in GDP.
However, SNA states that costs incurred in the transfer of ownership of the asset e.g. brokerage fees, legal fees and stamp duties, are included in GDFCF during the period when the flat is purchased.
73政府統計處Census and Statistics Department
Q4. How is donation (say to Community Chest) recorded in national accounts?
Donation is a kind of transfer payment. This means that the party receiving the donation (say Community Chest) does not provide goods and services to the donor in return for the donation. Hence, no production activity is involved and GDP is not affected.
Following this concept, GDP in a period will not increase because of more donation nor decrease because of less donation in the same period.
74政府統計處Census and Statistics Department
Q5. Is the natural growth of fish in sea included in the production boundary of GDP?
The growth of natural resources without human involvement or direction is not included in the production boundary.
According to the System of National Accounts, a necessary condition for an activity to be treated as production is that the activity should be carried out under the responsibility, control and management of a unit (SNA para. 1.20).
Therefore, the natural growth of fish in open sea is not regarded as production whereas the catching of fish in open sea and the culture of fish in fish ponds or rafts are regarded as production activities.
75政府統計處Census and Statistics Department
Q6. Should ‘Illegal Transactions’ be included in GDP?
In theory, the answer is YES (1993 SNA’s recommendation) due to the following reasons.
(1) Incomes from illegal production can be spent on purchasing legal goods and services.
(2) Illegal goods and services can be purchased using incomes from the legal sources.
(3) Discrepancies will appear in the account if such production is omitted.
Practically, reliable estimates are difficult to be produced.
In Hong Kong, only unlicenced hawkers are included in GDP.
76政府統計處Census and Statistics Department
(V) Q&As

77政府統計處Census and Statistics Department
The End