Embed Size (px)
Citation preview
supervising
scientist
report ���
�������������� ����
�� �������������������
������������������
���������� �����������
���������� ������� ����
���������

Dene Moliere – Environmental Research Institute of the Supervising Scientist,GPO Box 461, Darwin NT 0801, Australia.
This report should be cited as follows:
D Moliere 2005. Analysis of historical streamflow data to assist sampling design in GulungulCreek, Kakadu National Park, Australia. Supervising Scientist Report 183, Supervising Scientist,Darwin NT.
The Supervising Scientist is part of the Australian Government Department of theEnvironment and Heritage.
© Commonwealth of Australia 2005
Supervising ScientistDepartment of the Environment and HeritageGPO Box 461, Darwin NT 0801 Australia
ISSN 1325-1554
ISBN 0 642 24394 8
This work is copyright. Apart from any use as permitted under the Copyright Act 1968, no partmay be reproduced by any process without prior written permission from the SupervisingScientist. Requests and inquiries concerning reproduction and rights should be addressed toPublications Inquiries, Supervising Scientist, GPO Box 461, Darwin NT 0801.
e-mail: [email protected]
Internet: www.deh.gov.au/ssd (www.deh.gov.au/ssd/publications)
The views and opinions expressed in this report do not necessarily reflect those of theCommonwealth of Australia. While reasonable efforts have been made to ensure that thecontents of this report are factually correct, some essential data rely on the references cited andthe Supervising Scientist and the Commonwealth of Australia do not accept responsibility forthe accuracy, currency or completeness of the contents of this report, and shall not be liable forany loss or damage that may be occasioned directly or indirectly through the use of, or relianceon, the report. Readers should exercise their own skill and judgment with respect to their use ofthe material contained in this report.
Printed and bound in Darwin by uniprint NT

iii
Contents
Executive summary vii
Acknowledgments viii
1 Background 1
1.1 Study site 2
2 Rainfall data 4
2.1 Comparison between Jabiru airport and Tailings Dam rainfall 5
3 Runoff data 7
3.1 Annual series 7
4 Flood frequency analysis 11
4.1 Missing records 11
4.2 Analysis 14
4.3 Further work 16
5 Runoff response 17
5.1 Diurnal rainfall and runoff 17
5.2 Lag-time in peak discharge 18
5.3 Predicted lag-times at GCUS and GCDS 20
6 Implications 22
6.1 Suspended sediment sampling 23
6.2 Trace metal and contaminant sampling 24
7 References 25
Appendix A1 – Jabiru rainfall data 30
Appendix A2 – Tailings Dam rainfall data 33
Appendix B – Observed hydrographs and daily rainfall 34

iv
Tables
Table 1 A description of the rainfall data collected in the region 4
Table 2 Total runoff and annual peak discharge observed at G8210012 and G8210210 8
Table 3 Gaps in the runoff record at G8210012 8
Table 4 Mean antecedent rainfall within the Gulungul Creek catchment 10
Table 5 Summary of the fitted flood frequency distribution for G8210012 16
Table 6 Hydrological response at G8210012 20
Table 7 Lag-time and catchment characteristics for G8210012, the two current sampling sites (GCUS and GCDS) and for SC 21
Table A.1 Rainfall data collected at the Jabiru airport 30
Table A.2 Gaps in the rainfall record 30
Table A.3 Rainfall data collected at the Tailings Dam 33
Table A.4 Gaps in the rainfall record 33
Figures
Figure 1 Location of Gulungul Creek and the ERA Ranger mine within the Alligator Rivers Region 3
Figure 2 Time lines of data collection for Jabiru airport and the Tailings Dam 4
Figure 3 Mean monthly rainfall and associated confidence limits at Jabiru airport and the Tailings Dam between September 1979 and August 2003 6
Figure 4 Comparison of rainfall intensity data (on a daily basis) collected at the Tailings Dam and Jabiru airport between November 1989 and February 2000 6
Figure 5 Period of the 1975–76 wet season hydrograph where infilling procedures were adopted for periods of missing data at low flow 9
Figure 6 Fitted relationship between peak flood discharges observed at G8210012 (Gulungul) and G8210009 (Magela) 12
Figure 7 Frequency curve of annual peak discharge at G8210012 15
Figure 8 Adjusted frequency curve of annual peak discharge at G8210012 with one year omitted from the original dataset 15
Figure 9 Diurnal variation of mean rainfall at Jabiru airport and mean runoff at G8210012 18

v
Figure 10 The calculation of lag-time for a runoff event using the rainfall and discharge for the largest flood event that occurred during the 1991–92 wet season at G8210012 as an example 19
Figure 11 Relationship between observed and predicted lag-times for the Ngarradj catchment 21
Figure 12 An example of peak mud concentration occurring during the rising stage of the hydrograph 22
Figure A.1 Comparison of monthly rainfall at Jabiru airport between (i) the daily record (BoM) and the monthly record (ERA); (ii) the rainfall intensity data (BoM) and the monthly record (ERA); and (iii) the rainfall intensity data (BoM) and the daily record (BoM) 31
Figure A.2 Comparison of monthly rainfall at Jabiru airport between each dataset 32
Figure A.3 Comparison of monthly rainfall at the Tailings Dam between each dataset 33
Figure B.1 Daily rainfall collected at Jabiru airport and hydrograph at G8210012 during 1971–72 and 1972–73 35
Figure B.2 Daily rainfall collected at Jabiru airport and hydrograph at G8210012 during 1973–74 and 1974–75 36
Figure B.3 Daily rainfall collected at Jabiru airport and hydrograph at G8210012 during 1975–76 and 1976–77 37
Figure B.4 Daily rainfall collected at Jabiru airport and hydrograph at G8210012 during 1977–78 and 1978–79 38
Figure B.5 Daily rainfall collected at Jabiru airport and hydrograph at G8210012 during 1979–80 and 1980–81 39
Figure B.6 Daily rainfall collected at Jabiru airport and hydrograph at G8210012 during 1981–82 and 1982–83 40
Figure B.7 Daily rainfall collected at Jabiru airport and hydrograph at G8210012 during 1983–84 and 1984–85 41
Figure B.8 Daily rainfall collected at Jabiru airport and hydrograph at G8210012 during 1985–86 and 1986–87 42
Figure B.9 Daily rainfall collected at Jabiru airport and hydrograph at G8210012 during 1987–88 and 1988–89 43
Figure B.10 Daily rainfall collected at Jabiru airport and hydrograph at G8210012 during 1989–90 and 1990–91 44
Figure B.11 Daily rainfall collected at Jabiru airport and hydrograph at G8210012 during 1991–92 and 1992–93 45

vi

vii
Executive summary Gulungul Creek is a small left bank tributary of Magela Creek and is one of the tributaries that will be the first to receive sediment generated as a result of rehabilitation at Energy Resources of Australia’s Ranger mine. Over the next few years, a sampling regime will be established to develop an understanding of the sediment and associated contaminant transport characteristics in Gulungul Creek before rehabilitation at the mine site occurs. To guide sampling program design, an attempt has been made to estimate the hydrological characteristics of the Gulungul Creek catchment based on historical data collected within the creek between 1971 and 1993, a time period of 22 years.
Six of the 22 years of record had significant gaps in the flow data. The remaining 16 years of runoff record were used to determine an average annual runoff at the station of approximately 25 500 ML. A flood frequency curve was fitted using 19 of the 22 years of historical observed data. The fitted curve indicates that a 1:20 y, 1:50 y and 1:100 y peak discharge corresponds to flows of 168 m3 s-1, 260 m3 s-1 and 357 m3 s-1 respectively. In the historical record the 1:50 y peak discharge was exceeded only once – on 4 February 1980 (277 m3 s-1) – as a result of the most severe storm recorded in the Kakadu region.
General diurnal trends in the catchment show that peak rainfall and runoff occur late in the afternoon (~1800 h) and early in the morning (~0330 h) respectively. Analysis of some of the largest flood events that occurred showed that the average lag-time from the start of rainfall to peak discharge was 9.6 h (SD = 1.8 h), which corresponds well to the general trend in mean rainfall and runoff. The predicted lag-times, based on the geomorphological characteristics of the catchment, for two current sampling site locations along Gulungul Creek are 7.6 h and 11.7 h respectively. In general, the majority of sediment movement in streams within the region occurs during a runoff event and, therefore, it could be assumed that suspended sediment and associated contaminant movement in Gulungul Creek would primarily occur late in the evening to early in the morning. These hydrological responses must be considered when designing a monitoring regime to establish baseline characteristics against which the impact of rehabilitation earthworks at Ranger mine on suspended sediment and contaminant loads in Gulungul Creek can be assessed. For example, it is clear that a typical mid-morning grab sampling regime in Gulungul Creek may not be adequate to characterise suspended sediment (and any associated contaminant) movement in the stream.
An alternative to suspended sediment sample collection is the continuous monitoring of turbidity as an indirect measure of suspended sediment concentration. It is recommended that the relationship between suspended sediment concentration and turbidity in Gulungul Creek be investigated. A significant relationship could be applied to the continuous turbidity data to better characterise suspended sediment movement in the catchment and to estimate suspended sediment loads. It would also be important to determine if stream contaminant concentration and suspended sediment concentration are closely correlated in Gulungul Creek. A target-sampling regime, which requires an understanding of the lag-time of the stream at the sampling location, could initially be adopted over a series of rainfall-runoff events to collect metal and suspended sediment concentration data at a range of flows. Should a significant relationship exist, a continuous record of metal flux could be estimated from continuous monitoring of streamflow and suspended sediment concentration (using turbidimeters).

viii
Acknowledgments Simon Cruickshank, Department of Infrastructure, Planning and Environment, supplied stage and runoff data collected at the gauging stations located along Gulungul Creek (G8210012) and Magela Creek (G8210009). Kate Duggan, Griffin nrm Pty Ltd, is thanked for her time and effort in searching for the historical flow data collected at a second gauging station along Gulungul Creek (G8210210). Guy Boggs, Charles Darwin University, and John Lowry, eriss, assisted with the derivation of the Gulungul Creek catchment characteristics. Bob Masters, John Milsom and James Kepui, Energy Resources of Australia, supplied rainfall data from the rain gauge at the Tailings Dam. Dr Peter Bayliss, eriss, assisted with statistical analysis of the rainfall data. Dr Wayne Erskine (University of Newcastle), Dr John Tilleard (Moroka Pty Ltd), Dr Ken Evans (eriss) and Michael Saynor (eriss) constructively and comprehensively reviewed the draft report.

1
Analysis of historical streamflow data to assist sampling design in Gulungul Creek, Kakadu
National Park, Australia
D Moliere
1 Background As part of the planning to rehabilitate Energy Resources of Australia’s (ERA) Ranger mine, it is proposed to assess the impact of erosion on stream suspended sediment loads in the catchment of Magela Creek. This is based on the contention that the erosion and dispersion of cap material used to form the artificial landform of the rehabilitated mine site at Ranger mine are potential hazards (Willgoose & Riley 1998, Evans et al 1998, Evans 2000). Gulungul Creek is a small left bank tributary of Magela Creek (fig 1) and is one of the tributaries that will be the first to receive sediment generated from the rehabilitated mine site (Erskine & Saynor 2000). Given the location of the creek and the potential for erosion and sediment dispersion, the sediment transport characteristics in Gulungul Creek are being investigated before rehabilitation at the mine site occurs.
There have been earlier studies of sediment movement in Gulungul Creek. Cull et al (1992) applied regional relationships to estimate the sediment budget in Gulungul Creek; however, Erskine and Saynor (2000) suggested that there were errors in the adopted sediment yields. Evans (2000) estimated average annual sediment load in the stream under both pre- and post-mining conditions at Ranger mine using predicted erosion rates and sediment delivery. East et al (1987), Duggan (1991, 1994), East (1996) and Skeat et al (1996) reported mean suspended sediment concentration and suspended sediment yields in Gulungul Creek using data from a location downstream of the mine that were automatically collected using a flow-proportional sampling regime between 1984 and 1987. Duggan (1991) used these data to derive a significant relationship between event load and peak discharge, which could be used to predict suspended sediment yield in the short term. Despite the comprehensive datasets obtained (East et al 1987, Duggan 1991, 1994, East 1996, Skeat et al 1996), further research on suspended sediment transport within the Gulungul Creek catchment is required for the following reasons.
• Only a relatively small number of the samples collected were used to determine the sand and mud (silt and clay) component of the samples. It is now well documented that nutrients and contaminants, including heavy metals and radionuclides, are transported in association with fine sediment (Walling & Owens 2002). Therefore, it is important to determine the mud transport characteristics within the Gulungul Creek catchment for an understanding of the contaminant transport processes (Walling 1983, Walling et al 1992).
• Suspended sediment concentration data were only collected downstream of the mine. It is recommended that an understanding of the suspended sediment characteristics in Gulungul Creek be developed for a location upstream of any possible mining-related disturbance against which downstream impacts can be assessed (Erskine & Saynor 2000).

2
A monitoring regime, which would include discharge, sediment transport and water quality, at gauging stations both upstream and downstream of the mine is planned to commence in the near future (K Evans, pers comm, 2003). The hydrological response of the stream, however, should be considered before the establishment of an effective sediment monitoring regime. Therefore, the purpose of this report is:
1 To collate and assess all existing rainfall and streamflow data collected within the Gulungul Creek catchment, and
2 To determine the hydrological characteristics of the catchment, such as flood frequency and runoff response to rainfall, which could be used to aid the design of an effective monitoring program.
1.1 Study site Gulungul Creek lies within the Alligator Rivers Region (ARR) and is approximately 160 km east of Darwin. Located in the monsoon tropics climatic zone, the Alligator Rivers Region experiences a distinct wet season from October to April, and a dry season for the remainder of the year. Stream flow as a consequence is highly seasonal. The general flow period for Gulungul Creek is approximately six months (December to May).
Ranger mine lies partly within the catchment of Gulungul Creek (fig 1). Current infrastructure in the catchment includes part of the tailings dam, part of the Arnhem Highway, mine access roads and minor tracks (fig 1) and it is very likely that the final rehabilitated landform will also lie partly within the catchment (Crossing 2002).
In the past, a gauging station was operated along Gulungul Creek (G8210012) (fig 1) between November 1971 and December 1993, a period of 22 years. This gauging station was maintained and operated by the Department of Infrastructure, Planning and Environment (DIPE). Flow data were also collected by Duggan (1991) approximately 100 m upstream of the Arnhem Highway along Gulungul Creek between 1984 and 1987. Duggan’s (1991) study site is now a registered gauging station of DIPE (G8210210) (fig 1).
The two rain gauges in the region – at Jabiru airport and at the Tailings Dam, Ranger mine (fig 1) – are still in operation. The rain gauge at the Tailings Dam lies within the boundary of the Gulungul Creek catchment; the rain gauge at Jabiru airport lies just outside the boundary. However, further catchment analysis is required to establish the exact boundary of the Gulungul Creek catchment upstream of its confluence with Magela Creek. Rainfall data have been collected at Jabiru airport since September 1971 and at the Tailings Dam since September 1979.
There are currently two water quality sampling sites along Gulungul Creek - one upstream (Gulungul Creek upstream – GCUS) and one downstream of Ranger mine (Gulungul Creek downstream – GCDS) (fig 1). A weekly grab-sampling regime is conducted at these sites for chemical analysis. A gauging station was installed at GCUS in November 2003 to collect rainfall and stage data at 6-minute intervals, however, these data are not discussed in this study due to the brevity of the record period. It is also proposed that a gauging station is installed at GCDS prior to the 2004–05 wet season.

3
Figure 1 Location of Gulungul Creek and the ERA Ranger mine within the Alligator Rivers Region. The gauging stations and rain gauges in the area of interest are also shown. The image is an Ikonos satellite
image taken June 2001.
G8210009
GCUS
GCDS
G8210012
Gauging stationRain gauge
Jabiru airport
Tailings Dam
Magela Ck
Gulungul Ck
G8210210
ERA Ranger mine

4
2 Rainfall data Rain gauges were not installed at the Gulungul Creek gauging stations (G8210012 and G8210210) (Water Division 1982; Duggan 1991). The two nearest rain gauges to these stations are located at Jabiru airport and the Tailings Dam at Ranger mine (fig 1). The collection of rainfall data at Jabiru airport and the Tailings Dam commenced in 1971 and 1979 respectively, and both are still operating. A description of the rainfall data collected in the region is given in table 1. A time line of data collection for the two rain gauge locations is shown in figure 2. There are significant gaps in the daily rainfall record and the rainfall intensity dataset for Jabiru airport. The exact dates of these missing data are given in Appendix A. According to Duggan (1991), a tipping bucket rain gauge to measure rainfall intensity was operated by Ranger mine at the Tailings Dam during 1984 to 1987. However, these data are not contained within the current ERA database (B Masters, ERA, pers comm, 2004) and are therefore unavailable.
Table 1 A description of the rainfall data collected in the region
Location Data type Interval Period of record Source of data
Jabiru airport Daily – June 1971 – Sept 2003 Bureau of Meteorology
Monthly – Sept 1971 – Jan 1999 ERA*
Rainfall Intensity 30-minute Jan 1972 – Jan 1990 Bureau of Meteorology
continuous(1) Nov 1990 – Jan 2000 ERA
6-minute Mar 2001 – June 2003 Bureau of Meteorology
Tailings Dam Daily – Sept 1979 – Sept 2003 ERA
Rainfall Intensity 5-minute Nov 1989 – Mar 1991 ERA
continuous(1) Mar 1991 – Feb 2000 ERA
* Published in Bureau of Meteorology (1999)
(1) Continuous data during rainfall events (ie datalogger records a pulse signal for each tip of the tipping bucket rain gauge)
1970 1975 1980 1984 1990 1995 2000 2004
Jabi
ru a
irpor
t
Dai
lyM
onth
lyIn
tens
ity
Taili
ngs
Dam
Dai
lyIn
tens
ity
Figure 2 Time lines of data collection for Jabiru airport and the Tailings Dam

5
2.1 Comparison between Jabiru airport and Tailings Dam rainfall Part of this study includes an analysis of the runoff response at G8210012 (Section 5), which has a period of record of 22 y (1971–1993). Rainfall intensity data, collected during the period of flow, are required for this type of analysis. The rain gauge at the Tailings Dam is within the catchment area upstream of G8210012 and, therefore, it could be assumed that rainfall intensity data collected at this location best represent the rainfall over the catchment. However, the collection of rainfall intensity data at the Tailings Dam only commenced in 1989 (table 1, fig 2). Rainfall data collected at the Tailings Dam prior to 1989 is daily read (table 1, fig 2) and, as a consequence, is unsuitable for the analysis of runoff response in the catchment. The rainfall intensity data collected at Jabiru airport commenced in 1972 (table 1, fig 2) and, therefore, is more appropriate for the analysis of runoff reponse at G8210012. Consequently, there is a need to determine if the rainfall observed at Jabiru airport is not statistically different from that at the Tailings Dam and can then be used to represent the rainfall over the Gulungul Creek catchment area.
Monthly basis A two-factor analysis of variance showed that there is no statistical difference between monthly rainfall data observed at Jabiru airport and the Tailings Dam. For this test, the logarithms (base 10) of monthly rainfall observed at the two sites were analysed for the concurrent rainfall record (n = 24 years (1979–2003)). For completeness, the monthly rainfall data for Jabiru airport used in this analysis was a combination of the monthly data collected by ERA (1979–1999) and monthly totals derived from the daily rainfall record (1999–2003). The monthly data for the Tailings Dam were derived from the daily rainfall record (1979–2003). This was considered to be reasonable, given that:
1 at Jabiru airport the rainfall intensity data is very similar to both the daily rainfall record (regression coefficient, k = 0.98, r2 = 0.996, p< 0.001) and the monthly data collected by ERA (k = 0.95, r2 = 0.99, p< 0.001) on a monthly basis (Appendix A), and
2 at the Tailings Dam the rainfall intensity data are very similar to the daily rainfall record (k = 1.04, r2 = 0.997, p< 0.001) on a monthly basis (Appendix A).
Figure 3 shows the mean monthly rainfall distribution throughout the wet season is similar between the two gauges, although slightly higher at Jabiru airport.
Daily basis Daily rainfall totals, determined using rainfall intensity data, were derived for Jabiru airport and the Tailings Dam for the concurrent rainfall record (1989–2000). Regression analysis showed that there is a strong correlation between the rainfall intensity data collected at Jabiru airport and that collected at the Tailings Dam on a daily basis. The relationship was further refined by removing the outliers from the dataset. A test for outliers (using standardised residuals) was performed twice and identified approximately 9% of the data as outliers. These data points were removed and the regression analysis was conducted with the remaining data points (fig 4).
Individual event basis The rainfall totals at the two locations are similar (figs 3 & 4). However, in terms of using the rainfall intensity data at Jabiru airport to represent the rainfall that occurred over the Gulungul catchment, it is also important to determine whether there is a significant temporal difference between rainfall at Jabiru airport and the Tailings Dam. High intensity storm events usually contribute to periods of high stream discharge and sediment transport.

6
Sep Oct Nov Dec Jan Feb Mar Apr May Jun Jul Aug-2
-1
0
1
2
3
Rai
nfal
l (lo
g 10 +
0.1
)
Tailings Dam Jabiru Airport
Figure 3 Mean monthly rainfall and associated confidence limits at Jabiru airport and the Tailings Dam
between September 1979 and August 2003
0 40 80 120
Daily rainfall - Tailings Dam (mm)
0
40
80
120
Daily
rain
fall
- Jab
iru a
irpor
t (m
m)
1:1 lin
e
Y = 1.06 X (r2 = 0.94)
Figure 4 Comparison of rainfall intensity data (on a daily basis) collected at the Tailings Dam and
Jabiru airport between November 1989 and February 2000
Therefore, the times at which 20 of the largest storm events (in terms of rainfall intensity over a 1 hour duration) commenced at both stations were compared. A study within the Ngarradj catchment, which is located approximately 15 km north-east of the Gulungul Creek catchment and has a similar-sized catchment area, showed that some of the largest flood discharges observed in the catchment were a result of the most intense rainfall events over a 1 hour duration (Moliere et al 2002b).
The mean time that rainfall commenced for these 20 high intensity storm events at Jabiru airport and the Tailings Dam was 2016 h and 2012 h respectively, a mean difference of 4 min

7
(SD = 4.75 min). The largest observed difference was 16 minutes. This result indicates that there is very little temporal difference between rainfall at the two sites.
Summary The rainfall data collected at the Tailings Dam and Jabiru airport are similar, both in terms of rainfall volume and the time at which rainfall occurs for individual storm events. Therefore, rainfall data for the Jabiru airport can be used to represent the rainfall over the Gulungul Creek catchment. As a result, rainfall intensity data for Jabiru airport were used for the analysis of runoff response in Gulungul Creek (Section 5). Daily rainfall data for Jabiru airport during the period of flow at G8210012 are shown in Appendix B and were also used for part of the flood frequency analysis for G8210012 (Section 4). (Where there were gaps in the daily rainfall record (fig 2), rainfall intensity data were used to derive the daily rainfall shown in Appendix B.)
The slope of the regression equation (fig 4) was not applied to the Jabiru airport rainfall to use as rainfall data within the Gulungul Creek catchment. A reliable estimate of the rainfall volume was sufficient in this study, particularly for the analysis of runoff response within the catchment (Section 5). In the analysis of runoff response, it was considered more important to know the time that rainfall occurred, rather than the exact volume.
3 Runoff data Stage height (m) at gauging station G8210012 was collected by the Department of Infrastructure, Planning and Environment (DIPE) between November 1971 and December 1993. Stage data collected at G8210012 were converted to discharge (m3 s-1) using fitted rating tables derived (by DIPE) from a total of 107 velocity-area gaugings taken along a relatively stable cross-section at various times throughout the period of flow. At 95% confidence limits the fitted rating curves have errors in the bankfull discharge values of less than ±13%. The accuracy of high flows at most Australian stations is probably not much better than ±25% (Brown 1983, as cited in Pilgrim 2001). The annual hydrographs for the entire period of record are shown in Appendix B.
Pressure sensing probes, installed at G8210210 prior to the 1984–85 wet season by Duggan (1991), were used to collect continuous discharge data for three wet seasons before being removed during the 1987 dry season. Velocity-area gaugings were taken for a range of flows and the constructed rating curve was considered to be relatively accurate at flows less than bankfull discharge (Duggan 1991). However, the flow data collected between 1984 and 1987 at G8210210 are unavailable as the data are stored within an obsolete spreadsheet package and cannot be read (Precise Data Recovery Services Pty Ltd, pers comm., 2004). Therefore, the flow data for G8210210 will not be discussed within this study.
3.1 Annual series The annual volume of runoff and the corresponding annual peak discharge for each wet season between 1971 and 1993 at G8210012 are given in table 2.
3.1.1 Average annual runoff Of the 22 years of record at G8210012, 16 of these were used to determine average annual runoff volume (table 2). Six years of record were not used in the statistical analysis of the annual series because of significant gaps in the runoff record. Five of these six years have gaps in the runoff record of at least 3 weeks (table 3). In each case, both the rainfall record (at

8
Jabiru airport and the Tailings Dam) and the concurrent runoff record at the nearby gauging station along Magela Creek (G8210009) (fig 1) indicate that it is likely that runoff events occurred during these gaps. The remaining year (1972–73) was not included in the analysis as it has many small gaps throughout the annual hydrograph making it unreliable. These gaps all occurred at low flow and extended for periods of up to 13 days in duration. During the period of flow (December to April), only 59 days of runoff data were recorded. That is, more than three months of flow data were missing throughout the 1972–73 wet season.
Table 2 Total runoff and annual peak discharge observed at G8210012 and G8210210
Year Annual runoff (ML) Peak discharge (m3 s-1) [Date]
1971–72 12 333 34.1 [21 Mar]
1972–73 Gaps in record 38.7 [31 Jan]
1973–74 Gaps in record 50.1 [19 Mar] (2)
1974–75 Gaps in record 33.0 [15 Feb] (2)
1975–76 73 313 (1) 85.6 [9 Jan]
1976–77 26 271 (1) 65.2 [4 Mar]
1977–78 33 537 (1) 60.3 [24 Jan]
1978–79 19 820 (1) 25.0 [24 Feb]
1979–80 47 572 (1) 277.5 [4 Feb]
1980–81 43 164 85.6 [9 Mar]
1981–82 Gaps in record 49.7 [12 Mar] (2)
1982–83 15 160 69.8 [14 Mar]
1983–84 35 130 141.1 [23 Feb]
1984–85 26 691 53.8 [13 Apr]
1985–86 9 227 31.2 [24 Jan]
1986–87 16 383 46.7 [6 Feb]
1987–88 Gaps in record 5.2 [15 Mar] (2)
1988–89 17 929 28.5 [19 Mar]
1989–90 3 010 5.5 [2 Mar]
1990–91 Gaps in record 36.7 [20 Feb] (2)
1991–92 6 825 37.5 [27 Feb]
1992–93 22 404 55.1 [4 Mar]
Average annual flow 25 548
(1) Minor gaps in runoff record.
(2) Annual peak discharge may have occurred during gap in record.
Table 3 Gaps in the runoff record at G8210012
Year Missing data
1972–73 Many gaps at low flow
1973–74 3 Jan to 8 Feb
1974–75(1) 5 Mar to 26 Apr
1981–82(1) 25 Mar to 22 Apr
1987–88(1) 22 Jan to 22 Feb
1990–91(1) 9 Jan to 22 Jan; 23 Mar to 9 Apr
(1) Annual peak discharge at G8210009 (Magela) occurred during gap in runoff record.

9
Of the 16 years of record used in the statistical analysis, 11 years are complete with no gaps in the runoff record. The other five years have minor gaps in data but were still considered reliable for the statistical analysis of the annual series (table 2). For the four wet seasons between 1975 and 1979, the minor gaps in data occurred during periods of very low flow (generally during the first few weeks of flow), usually for no longer than two or three days at a time (fig 5). During these periods it is likely that runoff data were not recorded because flow dropped below instrument height. Where these gaps occurred, runoff was infilled by either: (1) estimating a discharge value at the midpoint of the gap; or (2) assuming a discharge value of zero at the midpoint of the gap (fig 5). Generally, the first infilling technique was adopted when the gap in the record was relatively short (ie a few hours) and the second technique was used when the gap was longer (ie > 24 hours) (fig 5). (These adjustments were not made within the original database at DIPE.)
0
20
40
60
80
100
Disc
harg
e (m
3 s-1)
Dec Jan Feb Mar
1975-76
Days
0
0.5
1
1.5
2
2.5
Disc
harg
e (m
3 s-1)
14 - 19 December 1975
Flow belowinstrument height
1
2
Figure 5 Period of the 1975–76 wet season hydrograph where infilling procedures (methods 1 and 2 as indicated) were adopted for periods of missing data at low flow

10
During the 1979–80 wet season, a three-day gap (5–9 February 1980) in the runoff record occurred that was not a result of flow dropping below the instrument height (Water Division 1982). The gap occurred during the receding stage of a flood hydrograph – the largest recorded flood event at the station (table 2). It is possible that the measuring equipment may have been damaged or waterlogged as a result of this large runoff event on 4 February 1980. The gap was infilled as described above and the annual flow determined (table 2).
3.1.2 Antecedent rainfall The mean antecedent rainfall, which is defined as the amount of rainfall between the start of rainfall and the start of streamflow, during the 22 y runoff record for the Gulungul Creek catchment is approximately 295 mm (SD = 85 mm) (table 4). This is the average amount of rainfall required during the first part of the wet season to fill the available soil storage. Once the storage is full, the infiltration rate becomes negligible and further rainfall results in streamflow within the catchment (Vardavas & Cannon 1991).
However, Appendix B shows that for nine of the 22 y of runoff record, a small ‘pulse’ of flow occurred well before (in terms of time and/or cumulative rainfall) the actual commencement of streamflow for the year. For example, during the 1974–75 wet season a small pulse of flow occurred on 3 November 1974 after only 110 mm of rainfall. The commencement of streamflow occurred much later on 26 December 1974 after 360 mm of rainfall (Appendix B). Vardavas and Cannon (1991) explain that pulses of runoff in streams can occur even when soil storage is relatively empty, particularly within small catchment areas, and especially when the wetting rate of the soil surface is faster than the infiltration rate.
The average amount of rainfall before the first pulse of flow occurred for these nine wet seasons was approximately 155 mm (table 4). An attempt was made to analyse the rainfall intensity of the storm events that caused these pulses to occur. However, of the nine wet seasons where a pulse was observed before streamflow commenced, only six had corresponding rainfall intensity data available for analysis. Relatively intense rainfall events (greater than a 1:1 y recurrence interval over a 1 h duration) were observed prior to two pulses, but only minor rainfall was observed prior to the remaining four pulses. It is likely that these four pulses were attributed to intense rainfall that occurred over the upper catchment area not recorded at the Tailings Dam rain gauge. This phenomenon is typical of the ‘patchy’ nature of thunderstorm events common to the wet/dry tropics, particularly during the early wet season. Clearly, it is difficult to analyse the rainfall events that contributed to these observed early wet season pulses of streamflow along Gulungul Creek given the limited rain gauge network.
Table 4 Mean antecedent rainfall within the Gulungul Creek catchment
Antecedent rainfall to commencement of streamflow (mm)
Antecedent rainfall to first ‘pulse’ (mm)
Mean [SD] 295 [85] 155 [70]
Maximum [year] 455 [1984–85] 295 [1985–86]
Minimum [year] 135 [1977–78] 70 [1986–87]
n 21(1) 9
(1) Rainfall data (both daily and intensity for Jabiru airport) were missing from September to February during the 1976–77 wet season (fig 2).

11
4 Flood frequency analysis To establish a better understanding of the hydrological characteristics of the Gulungul Creek catchment, a flood frequency curve was derived for the station G8210012. The flood frequency curve, which was fitted mathematically to the historical observed data, can be used to estimate the probability of exceedance for runoff events of a certain magnitude (Pilgrim 2001). As a consequence, the flood frequency curve has important applications for sediment transport analysis and flood risk assessment in the Gulungul Creek catchment.
As discussed above in Section 3.1, six of the 22 years of record have significant gaps in the annual runoff data (table 3). Before undertaking flood frequency analysis, it was necessary to determine whether it was likely that the annual peak discharge (Qp) for these six years occurred during the gaps in the data or not.
4.1 Missing records Rainfall records on the catchment or streamflow data from nearby catchments can be used to indicate the likelihood of a large flood having occurred during a gap (Pilgrim 2001).
The nearest gauging station to G8210012 with a significant runoff record is G8210009, which is located along Magela Creek, downstream of Ranger mine (fig 1). The catchment area upstream of G8210009 is adjacent to the Gulungul Creek catchment. The gauging station G8210009 was installed in 1971, the same year as G8210012, and is still operating today. Before the record at G8210009 can be used to indicate the likelihood of a large flood having occurred during the gap at G8210012, it is important to determine if there is a strong relationship between the two concurrent records.
4.1.1 Relationship between G8210012 and G8210009 flow data Regression analysis was conducted for concurrent flow records (1971 to 1993) to determine the strength of the correlation between the two stations. Major event peak discharges observed at G8210012 were compared to the corresponding peak discharge at G8210009 for the same storm. The storms that contributed to the observed Qp at G8210012 were used in this analysis. (For all but two of the 22 years of record, the corresponding runoff event at G8210009 was one of the largest peak discharges of the year. For the two remaining years, there was little evidence of a corresponding runoff event having occurred at G8210009, and as a result, they were not included in the regression analysis.)
Figure 6 shows that the relationship between floods that occurred in the same storm at the two adjacent catchment areas is statistically significant. The Magela Creek catchment area upstream of G8210009 (approximately 600 km2 (DIPE pers comm)) is considerably larger than the Gulungul Creek catchment area upstream of G8210012 (46 km2). Therefore, given the strong correlation between peak discharges observed at the two station locations, this analysis indicates that the annual peak discharge at G8210012 is usually a result of a very large, widespread storm event that occurs over the upper reaches of both catchment areas.
The regression analysis indicates that the streamflow data from the Magela Creek catchment may indicate the likelihood of a large flood having occurred during the gap in the runoff record at Gulungul Creek. However, figure 6 also shows that the degree of correlation is insufficient to enable a missing flood to be reliably estimated. For example, if a runoff event occurred at G8210009 with a peak discharge of approximately 500 m3 s-1 (mean annual peak discharge), the corresponding peak discharge at G8210012 is 78 m3 s-1, with a 95% probability of being between 34 m3 s-1 and 180 m3 s-1.

12
10 100 1000 10000
Magela Q (m3 s-1)
1
10
100
1000
Gul
ungu
l Q (m
3 s-1)
Y = 0.307 X 0.89 (r2 = 0.83; n = 20; p < 1x10⁻⁷)
Figure 6 Fitted relationship between peak flood discharges observed at G8210012 (Gulungul) and
G8210009 (Magela). The 95% prediction limits (dashed lines) are also shown.
4.1.2 Flow (G8210009) and rainfall during gaps in the record at G8210012 Both the runoff data observed at G8210009 and the daily rainfall data collected at Jabiru airport and the Tailings Dam were used to determine the likelihood of the annual peak discharge having occurred during a gap in the record at G8210012. Table 3 shows that there were six years with significant gaps in the runoff record at G8210012, and the likelihood of Qp occurring during each gap is discussed below.
1972–73 As discussed in Section 3.1, it is considered that during these many small gaps in the annual hydrograph, runoff data were not recorded because flow dropped below instrument height. Only very minor rainfall occurred at Jabiru airport during these gaps in the record (Appendix B). Therefore, the observed Qp (table 2) was used in the flood frequency analysis.
1973–74 The observed Qp at G8210012 occurred on 19 March 1974 (table 2). The 24 h rainfall total that preceded Qp between 1800 h on 18 March to 1800 h on 19 March was one of the largest 24 h totals for the year. The corresponding peak discharge at G8210009 was the second largest for the year.
Only relatively minor runoff events at G8210009 occurred during the gap in the record. There were no 24 h rainfall totals during the gap that exceeded that recorded on the 18–19 March. For these reasons, it is considered that the observed Qp was larger than the runoff event that may have occurred during the gap in the record.
1974–75 The observed Qp at G8210012 occurred on 15 February 1975 (table 2) and was the largest peak within a long duration, multi-peaked runoff event (Appendix B). The total rainfall for the week preceding this runoff peak was approximately 260 mm. The corresponding event at G8210009 on 15 February 1975 was the second largest peak discharge for the year.
The Qp at G8210009 occurred during the gap in the record at G8210012 on 10 April 1975, however, the daily rainfall recorded at Jabiru airport for 9 April was only relatively minor

13
(< 40 mm (Appendix B) with a maximum rainfall intensity of < 7 mm h-1). This indicates that the rainfall which contributed to the annual peak discharge at G8210009 may have primarily occurred over the upper reaches of the Magela catchment.
The largest rainfall event that occurred during the gap in the runoff record was 68 mm on 21 March 1975 (Appendix B) – the fourth largest daily total of rainfall for the year. The corresponding runoff event at G8210009 was the sixth largest peak discharge for the year.
In this case, because the observed Qp corresponded to significant rainfall at Jabiru airport and to one of the largest runoff events at G8210009 for the year, it is considered that the observed Qp was larger than the runoff event that may have occurred during the gap in the record.
1981–82 The observed Qp at G8210012, which occurred on 12 March 1982 (table 2), was a result of the largest daily rainfall recorded for the year (91 mm at the Tailings Dam and 98 mm at Jabiru airport (Appendix B)). The corresponding event at G8210009 was the third largest peak discharge for the year.
The Qp at G8210009 occurred during the gap in the record at G8210012 on 28 March 1982, however, the daily rainfall recorded at the two rain gauges for this event – the only period of rainfall to occur during the gap in the runoff record at G8210012 – was only relatively minor (< 45 mm) (Appendix B). Similar to 1974–75, this indicates that the rainfall that contributed to the annual peak discharge at G8210009 may have primarily occurred over the upper reaches of the Magela catchment.
In this case, because (1) the rainfall during the gap in the record was only relatively minor, and (2) the observed Qp corresponded to the largest daily rainfall recorded for the year at both gauges and a significant runoff event at G8210009, it is considered that the observed Qp was larger than the runoff event that may have occurred during the gap in the record.
1987–88 Both station rainfall records indicate that several significant rainfall events occurred during the gap in the runoff record at G8210012, all of which were larger than the rainfall that contributed to the observed Qp (which was less than 25 mm at both stations on 15 March 1988). One of the largest rainfall events occurred on 9 February 1988 (68 mm at the Tailings Dam and 53 mm at Jabiru airport (Appendix B)). Qp at G8210009 occurred on 13 February 1988, also during the gap in the record (table 3). However, the corresponding observed rainfall on 13 February that contributed to this event was only relatively minor at both Jabiru airport and the Tailings Dam.
The rainfall data indicate that it is likely Qp occurred during the gap in the record (although it may not have occurred on the same day Qp occurred at G8210009). Therefore, this year was omitted from the flood frequency analysis.
1990–91 The Qp at G8210009 occurred during the gap in the record at G8210012 on 12 January 1991. This event corresponds to the largest daily rainfall for the year recorded at the Tailings Dam (73 mm) and the second largest at Jabiru airport (63 mm) (Appendix B). The rainfall event on 12 January 1991 was larger than that which contributed to the observed Qp at G8210012 (< 30 mm at both stations) that occurred on 20 February 1991 (table 2).
In this case, both the streamflow data at G8210009 and the rainfall data indicate that it is likely that Qp occurred at G8210012 during the gap in the flow record on 12 January 1991. Therefore, this year was omitted from the flood frequency analysis.

14
In summary:
• The observed Qp at G8210012 during 1972–73, 1973–74, 1974–75 and 1981–82 were used in the flood frequency analysis, and
• 1987–88 and 1990–91 were omitted from the analysis.
4.2 Analysis A log Pearson III distribution was fitted for the annual peak discharges for G8210012 using annual peak discharges for 20 years of record. Previous studies in the region have used a log Pearson III distribution to fit frequency curves to annual peak discharges observed along Magela Creek at G8210009 (Water Division 1982) and several streams within the Ngarradj catchment (Moliere et al 2002a, Boggs et al 2003), which is located approximately 15 km north-east of the Gulungul Creek catchment.
The following is a brief description of the method used for fitting and plotting a log Pearson III distribution to the annual peak discharge data based on Pilgrim (2001).
• The annual peak discharges for each wet season for the period of record were ranked in order of magnitude. The mean (M), standard deviation (S) and skewness (g) of the logarithms of the annual peak discharges were calculated (fig 7).
• Peak discharges for a range of annual exceedance probabilities (AEPs) were calculated using equation (1) (Pilgrim 2001):
Ry = M + Ky S (1)
where, Ry = the logarithm of peak discharge having an AEP of 1 in y years; Ky = frequency factor found from tables in Pilgrim (2001) for the required AEP.
The fitted frequency curve is shown in figure 7.
• The plotting positions (PP(m)) of each annual peak discharge value (table 2) were calculated as a percentage using equation (2) and plotted on figure 7.
PP(m) = (m – 0.4)/(N + 0.2) x 100 (2)
where, N is the number of years of record (20); m is the rank of the annual peak discharge value.
Figure 7 shows that while the frequency curve gives an adequate fit to most of the plotted annual floods (ie most of the data fit within the 5% and 95% confidence limits), it diverges from the highest flood event which occurred on 4 February 1980. It appears that the log Pearson III distribution is unable to fit both the lower and higher annual floods and, as a result, the frequency curve is distorted at both ends of the observed range.
A test for low outliers was performed as described in Pilgrim (2001). The test indicated that there was one outlier in the data series (fig 7). This low outlier was deleted from the dataset and a revised log Pearson III distribution was fitted to the remaining data (fig 8).

15
99 98 95 90 80 70 60 50 40 30 20 10 5 2 1
Annual exceedance probability (%)
1
10
100
Peak
dis
char
ge (m
3 s-1)
Annual peak dischargeFitted LPIII distribution5% and 95% confidence limits
Statistics of the Logs of flows
MeanStandard deviationSkewness coefficient
= 1.69= 0.33= -0.54
Figure 7 Frequency curve of annual peak discharge at G8210012
99 98 95 90 80 70 60 50 40 30 20 10 5 2 1
Annual exceedance probability (%)
1
10
100
Peak
dis
char
ge (m
3 s-1)
Annual peak dischargeFitted LPIII distribution5% and 95% confidence limits
Statistics of the Logs of flows
MeanStandard deviationSkewness coefficient
= 1.74= 0.25= 1.28
Figure 8 Adjusted frequency curve of annual peak discharge at G8210012 with one year omitted from
the original dataset
Figure 8 shows that the adjusted frequency curve better fits the remainder of the observed peak discharge data compared with the frequency curve calculated for all 20 annual peak discharges. A summary of the AEPs and the corresponding peak discharges for G8210012 are shown in table 5.
1980
outlier

16
Table 5 Summary of the fitted flood frequency distribution for G8210012
Annual Recurrence Interval (y)
Annual Exceedance Probability (%)
Peak discharge (fig 8) (m3 s-1)
2 50 48.2
5 20 83.1
10 10 119
20 5 168
50 2 260
100 1 357
4.2.1 Storm event – 4 February 1980 A detailed description of this extraordinary storm event on 4 February 1980 is given in Water Division (1982). Total rainfall recorded at the Jabiru airport and the Tailings Dam for the 48 h period between 0900 h on 3 February and 0900 h on 5 February 1980 was 301 mm and 346.4 mm respectively. The storm featured a very intense 5 h period between 0700 h and 1200 h on 4 February 1980 where a total of 226 mm fell at the Tailings Dam (an average of 45.2 mm h-1) (Commonwealth Department of Housing and Construction 1980). Rainfall intensity over a 3 h, 6 h and 24 h duration corresponded to a greater than 1:100 y event (Moliere et al 2002a). Given that the period of record of flow data used in the above flood frequency analysis is only relatively short (19 y), the plotting position of this event only corresponded to a 1:34 y flood event (fig 8). However, the fitted flood frequency curve indicates that the peak discharge of this event may actually be greater than a 1:50 y event (table 5). Water Division (1982) considered that the return period for the corresponding peak discharge observed at G8210009 is likely to be 100 years. It is clear that on 4 February 1980 both the rainfall over the Gulungul Creek catchment and the resulting streamflow at G8210012 were statistically rare events.
4.3 Further work A gauging station was installed at the upstream sampling site along Gulungul Creek (GCUS) (fig 1) in November 2003. Flow measurement equipment was also re-installed at G8210012 at the same time. It is proposed that a third gauging station is installed at the downstream sampling site along Gulungul Creek (GCDS) (fig 1) prior to the 2004–05 wet season.
Flood frequency curves for these two new stations within the Gulungul Creek catchment will be used to determine the long-term trends and flood risk assessment both upstream and downstream of the Ranger mine. This is particularly important to develop before rehabilitation at the mine site commences.
The reliability and the accuracy of the flood frequency analysis is increased the larger the runoff record. It is unlikely that the two new stations will have a significant runoff record for flood frequency analysis by the time rehabilitation at Ranger mine commences. Therefore, it is important to investigate whether or not the long-term runoff record at station G8210012 can be used to extrapolate the record at the new station locations. If a regression of observed peak discharges at the two new stations on corresponding peak discharges at G8210012 can be established using the next few years of runoff data, the relationship could be used to estimate values at the two new stations for the period of record available at G8210012 (1971–1993).

17
4.3.1 Extreme flood events Little is currently known of extreme flood events on the Magela Creek system (Evans & Johnston 1997, Erskine & Saynor 2000). An understanding of these extreme events in terms of their potential effect on mining operations within the Magela catchment is particularly important. For example, it is essential that estimates of high magnitude flood events in the Gulungul Creek catchment are reliable to ensure that the rehabilitated Tailings Dam can withstand the resultant high erosional forces (Pickup et al 1987, Erskine & Saynor 2000). Therefore, it is likely that the observed runoff record used for the above flood frequency analysis (Section 4.2) will need to be extended to develop a better understanding of these extreme events. The current observed record is too short (22 y) and only includes a maximum peak discharge 4.3 times greater than the mean annual flood. (Floods at least 10 times greater than the mean annual flood have destroyed many channels and floodplains in Australia (Erskine & Saynor 2000).)
The methods that could be used to extend the runoff record at gauging stations along the Gulungul Creek are:
1 Calibrate a catchment-based rainfall-runoff model using observed gauging station data (G8210012, GCUS and GCDS) and catchment characteristics. The calibrated model can then be used to (1) extend the runoff record from long-term rainfall records to establish a more reliable flood frequency curve; and (2) determine the resultant event hydrograph of extreme rainfall events.
2 Use palaeoflood hydrology to extend hydrologic records back in time (ie Pickup et al 1987, Erskine & Saynor 2000). Pickup et al (1987) suggest that the most successful palaeoflood technique is based on the use of slackwater deposits. Sand and fine material deposited on areas of backflow or sheltered areas during flood events provide a datable stratigraphic record from which a partial flood history can be reconstructed.
5 Runoff response Using the 22-year runoff record at G8210012 and the rainfall data collected at Jabiru airport during the same period, an attempt has been made to characterise the runoff response of Gulungul Creek, both on a long-term average basis and on an individual event basis. As observed in the Ngarradj catchment (Moliere et al 2002b), the understanding of the runoff response in streams has important implications for the design of an effective sediment monitoring regime.
As discussed above (Section 2.1), the rainfall data collected from the rain gauge at the Tailings Dam, although within the Gulungul Creek catchment, were not suitable for this type of analysis and, therefore, were not used in this section. The rainfall data collected at Jabiru airport are not statistically different from rainfall at the Tailings Dam (Section 2.1) and, as a result, the rainfall intensity data collected at Jabiru airport were used in the analysis of runoff response in the Gulungul Creek catchment.
5.1 Diurnal rainfall and runoff The mean hourly runoff for the complete period of record (22 y) at G8210012 exhibits a strong diurnal cycle with a peak early in the morning (fig 9). The average peak in runoff (Qp) at G8210012 occurs at approximately 0330 h.
A small feature of the diurnal runoff cycle is that instead of a smooth curve from the Qp to the average minimum in runoff, there is a slight ‘bulge’ in the diurnal cycle at approximately

18
1000 h (fig 9). This is a result of the rainfall-runoff event on 4 February 1980, the largest event recorded in the region (as discussed in Section 4.2.1). The storm event on 4 February 1980 was not only unusual in terms of its magnitude and intensity, but also because it occurred mid-morning. If this event were ignored for the diurnal runoff analysis, this ‘bulge’ in the cycle would not be observed (fig 9). This feature indicates the influence one extraordinary event can have on the general long-term trend in data. This effect would be substantially more pronounced within a shorter term record (ie less than 10 y).
The mean hourly rainfall measured at the Jabiru airport rain gauge during the corresponding period of record was assumed to represent the diurnal rainfall cycle over the Gulungul Creek catchment (fig 9). In general, the rainfall months used for the analysis corresponded to the period of most of the flow in the stream (December to March). However, as noted in figure 2, the rainfall intensity data are incomplete during the concurrent runoff record at G8210012. As a result, only 15 of the 22 years were used to determine the diurnal rainfall cycle over the catchment during the period of flow at G8210012.
0 4 8 12 16 20 24
Hour
0
0.5
1
Ave
rage
rain
fall
(mm
)
2.4
3.2
4
Ave
rage
dis
char
ge (m
3 s-1)
Diurnal Qp
Figure 9 Diurnal variation of mean rainfall at Jabiru airport and mean runoff at G8210012. Dashed line
indicates mean hourly runoff with the event on 4 February 1980 omitted.
Figure 9 indicates a strong diurnal peak in rainfall at Jabiru airport late in the afternoon (~ 1700 to 1800 h). The diurnal rainfall pattern for Jabiru is very similar to that derived for the Ngarradj catchment (Moliere et al 2002b) and also to that found over the Darwin region (Li et al 1996, Soman et al 1995). Therefore, the diurnal rainfall pattern for Jabiru airport and the Gulungul Creek catchment could be considered to be typical of the Top End region.
5.2 Lag-time in peak discharge A selection of the largest flood events observed at G8210012 was used to characterise the runoff response to individual storm events (‘lag-time’). A usual definition of lag-time is from the centroid of effective rainfall (ie rainfall that produces runoff) to Qp. However, in this study lag-

19
time is defined as the time taken from the start of rainfall to Qp (fig 10). High magnitude flood events in the region are usually a result of relatively short, high intensity storm events. Therefore, it can be assumed that the difference in lag-times between the two definitions would be minor. (However, if we know the lag-time at G8210012, where lag-time is defined as the time taken from the start of rainfall to Qp, the application of this knowledge to, say, target sampling is relatively simple. For example, if a sampling program was established to collect data during the peak of a runoff event at G8210012 an estimate for the time Qp will occur can be obtained almost immediately once effective rainfall commences in the catchment.)
As discussed above, rainfall at Jabiru airport was assumed to represent the rainfall over the Gulungul Creek catchment area. Flood events that occurred during the gaps in the rainfall intensity record (fig 2) could not be included in the following analysis.
In total, 27 flood events were selected for analysis. Each of these events:
• were classified as independent peaks (Hoggan 1997). In this case, peaks were considered to be independent if separated by periods of approximate baseflow conditions. That is, for events separated by a period of baseflow it is interpreted that overland flow from the catchment has ceased.
• were significant flood events. In general, the largest two events of each year were selected for analysis.
• corresponded to significant peak discharges that occurred at the nearby station along Magela Creek (G8210009) (fig 1). In this respect, it can be assumed that the rainfall that contributed to the peak discharge at the two stations occurred over a large area and, therefore, was observed at Jabiru airport.
0
20
26-28 February 1992
0 12 24 36
Duration (h)
0
15
30
Dis
char
ge (m
3 s-1)
Rai
nfal
l (m
m)
[30
min
inte
rval
s]
Qp
lag-time
Figure 10 The calculation of lag-time for a runoff event using the rainfall and discharge for the largest
flood event that occurred during the 1991–92 wet season at G8210012 as an example

20
For each of these 27 runoff events, the time that effective rainfall commenced and the time that the corresponding peak discharge occurred was noted, and the resultant lag-time for that event determined. Initially, the mean lag-time for these events was 9.6 hours (SD = 2.3 h). However, there were two outliers identified (one low and one high outlier), where outliers were defined as values less than or greater than two standard deviations from the mean. These two values were removed and the revised mean lag-time remained at 9.6 h (SD = 1.8 h) (table 6).
Table 6 Hydrological response at G8210012
Station No. of events Mean start of rainfall
Mean time of peak discharge
Mean lag-time (h) [SD (h)]
G8210012 (Gulungul Ck) 25 14:50 00:25 9.6 [1.8]
The average time that rainfall commenced and the average time that peak discharge occurred at G8210012 (table 6) correspond reasonably well to the diurnal cycle of rainfall and runoff respectively (fig 8). The mean lag-time determined for individual events is very similar to the general trend in mean rainfall and runoff (fig 8).
5.3 Predicted lag-times at GCUS and GCDS As discussed above (Section 1.1 – Study site), there are currently two sampling sites along Gulungul Creek at GCUS and GCDS (fig 1). In this section, predicted lag-times at GCUS and GCDS were derived to provide a preliminary estimate of the likely runoff response along Gulungul Creek upstream and downstream of the mine site.
5.3.1 Relationship between lag-time and catchment characteristics The following relationship was derived between observed mean lag-times (tL) at six gauging stations within the Ngarradj catchment and corresponding catchment characteristics – stream length (L) and mean channel slope (SC) (eqn 4) (Moliere et al 2002b):
tL = 0.57 L0.983 SC-0.187 (r2 = 0.97; p = 0.006) (4)
The form of this equation is very similar to that developed by Espey et al (1966) from studies of many small catchments throughout the US. These lag-time equations also included an impervious area factor within the equation for developed catchment areas (which is ignored for natural catchments).
Catchment characteristics, L and SC, upstream of station G8210012 were derived to determine if the fitted relationship (eqn 4) was also applicable to the Gulungul Creek catchment. These parameters were derived from a digital elevation model (DEM) of the Gulungul Creek catchment area that was produced on a 10 m grid. Pre-processing of the DEM involved the application of pit-filling algorithms to ensure that the model was hydrologically correct. The final parameters were derived using the spatial analyst extension of the ESRI ArcView® 3.2 GIS software package and are given in table 7.
Figure 11 shows that the predicted lag-time for peak discharge at G8210012 fits well within the confidence limits associated with the relationship (eqn 4) and is similar to that observed. This result indicates that the fitted relationship (eqn 4) is a relatively robust model that is not only valid for the Ngarradj catchment, but also could be considered applicable to other small catchments within the region, such as the Gulungul Creek catchment.

21
Table 7 Lag-time and catchment characteristics for G8210012, the two current sampling sites (GCUS and GCDS) and for SC
Catchment Station Observed mean lag-time (h)
[SD (h)]
Flow length (km)
Mean channel
slope (%)
Predicted lag-time (h)
(eqn 4)
Gulungul G8210012 9.6 [1.8] 16.5 1.20 8.7
GCUS – 14.8 1.40 7.6
GCDS – 21.4 0.95 11.7
Ngarradj SC(1) 5.2 [0.9] 13.7 8.49
(1) Lag-times and catchment characteristics derived in Moliere et al (2002b)
0 2 4 6 8 10 12
Observed mean lag-time (h)
0
2
4
6
8
10
12
Pred
icte
d m
ean
lag-
time
(h)
Ngarradj GS
1:1 line
Confidence intervals
G8210012
SC
Figure 11 Relationship between observed and predicted lag-times for the Ngarradj catchment
(equation (4)). Mean lag-time at station G8210012 is also shown.
Catchment characteristics upstream of the two current sampling sites along Gulungul Creek (GCUS and GCDS) (fig 1) were also derived from the DEM (table 7). Using equation (4), the predicted lag-times in peak discharge at GCUS and GCDS are 7.6 h and 11.7 h respectively (table 7).
An interesting observation to note is the significant difference in mean lag-time between the two similar size catchment areas upstream of G8210012 (46 km2) and SC (43.6 km2) (fig 11). This difference in mean lag-times can be attributed to the difference in mean channel slope of the two catchments (table 7), which is a reflection of the percentage of Arnhem Land plateau within the catchment areas. Approximately 20% of the Gulungul Creek catchment upstream of G8210012 consists of Arnhem Land Plateau (Mt Brockman outlier) (Crossing 2002) compared to more than 50% of the Ngarradj catchment upstream of station SC (Boggs et al 2001, Erskine et al 2001). Therefore, although this relationship requires further examination, it appears that for similar size catchments in the region, the greater the proportion of Arnhem Land plateau within a catchment, the quicker the runoff response to rainfall.

22
6 Implications As discussed in Section 1, a sediment transport and water quality monitoring regime is planned to commence in the near future at gauging stations along Gulungul Creek both upstream and downstream of the mine. The hydrological characteristics of the catchment, in particular the stream runoff response to rainfall, has important implications for the future design of an effective sediment (and associated contaminant) monitoring regime.
Many studies on streams within the region have shown that suspended sediment moves through the system in pulses or waves generated by discharge events (Evans et al 2003, 2004). The suspended sediment concentration generally peaks during the rising stage of a runoff event (ie Hart et al 1982, Duggan 1991, Cull et al 1992, Moliere et al 2002b), which has been attributed to sediment depletion during runoff events (Walling & Webb 1982, Williams 1989). An example of fine suspended sediment (mud) movement during a rainfall-runoff event at one of the gauging stations along Ngarradj is shown in figure 12.
0
100
22 Feb 2001
0 4 8 12 16 20
Duration (h)
0
5
10
Dis
char
ge (m
3 s-1)
0
40
80
Mud
con
cent
ratio
n (m
g L-1
)
DischargeMud concentration
Rain
fall
(mm
/h)
[6 m
inut
e in
terv
als]
Figure 12 An example of peak mud concentration occurring during the rising stage of the hydrograph.
Data were collected at a gauging station within the Ngarradj catchment.
Studies at Magela Creek by Hart et al (1982) and Cull et al (1992) also showed that peak concentration of trace metals (such as iron, manganese and zinc) and uranium series radionuclides respectively, can be attributed to the increased concentration of suspended sediment. Given that the majority of the rainfall and runoff within the Gulungul Creek catchment occurs in the afternoon to early in the morning, it could be assumed that the majority of the suspended sediment movement in the stream, along with associated trace metals and radionuclides, would occur in the evening to early in the morning. For example, according to the lag-time of the stream (table 7), a ‘pulse’ of suspended sediment as a result of a typical afternoon storm event is likely to occur at the downstream sampling site (GCDS) early the following morning.
These hydrological responses, therefore, must be considered when establishing a monitoring regime to assess such issues as the impact of rehabilitation at Ranger mine on suspended sediment and contaminant loads in Gulungul Creek. It is clear that a typical mid-morning grab

23
sampling regime in Gulungul Creek is not adequate to characterise suspended sediment (and associated contaminant) movement in the stream – particularly in terms of estimating loads or understanding the variability in the concentrations. The unreliability of load estimates based on infrequent samples associated with typical water quality monitoring programmes has been well documented (Walling & Webb 1982, 1985, Walling et al 1992).
6.1 Suspended sediment sampling The application of either a fixed time, opportunistic or flow proportional sampling program to the examination of long-term sediment transport in Gulungul Creek would give significantly different results. For example, a study using data collected at SC, a station within the Ngarradj catchment with similar long-term rainfall and runoff trends to G8210012 (fig 9), showed that over a three year monitoring period a weekly mid-morning to mid-afternoon grab-sampling regime underestimated average background suspended sediment concentration in the stream by 35% compared to the ‘continuous’ measurements (Moliere et al 2002b). Maximum suspended sediment concentration in the stream was underestimated by almost 100%.
The best way to develop an understanding of stream suspended sediment characteristics, including load, is by measuring instantaneous discharge and instantaneous suspended sediment concentration at intervals small enough to detect variations in the discharge and concentration data. The most accurate technique for measuring suspended sediment concentration is collecting stream water samples and filtering and drying the sample. However, the collection of water samples during runoff events and during low flow periods in addition to the subsequent sample filtering process over a period of time, such as an entire wet season, is very labour intensive and expensive.
A common alternative to suspended sediment sample collection is the continuous monitoring of turbidity in streams as an indirect measure of suspended sediment concentration (ie Walling 1977, Walling et al 1992, Glysson & Gray 2002, Schoellhamer & Wright 2003). However, previous studies within the Kakadu region have shown that relationships between turbidity and suspended sediment concentration have been associated with relatively large errors (Duggan 1991, Riley 1997, 1998). This was explained by different turbidity readings being measured for various mixes of coarse and fine sediments, even if the concentration remained constant (Duggan 1991). The fact that turbidity is influenced by particle size is one of several well-known disadvantages of using turbidimeters as a surrogate for suspended sediment concentration (Rieger & Olive 1988, Lewis 2003, Schoellhamer & Wright 2003). Nevertheless, many studies have successfully used turbidimeters to monitor suspended sediment concentration, particularly if the effect of particle size does not prevent the calibration of the turbidity probe. For example, using field data collected within the Ngarradj catchment, Moliere et al (2005) showed that the removal of the sand component within the suspended sediment sample reduced the effect of particle size on the turbidity sensor calibration process. That is, there is a strong correlation between mud (silt and clay) and turbidity in streams within the Ngarradj catchment. As discussed in Section 1, it is considered that contaminant movement is most closely related to the mud component of the stream suspended sediment. Therefore, a significant relationship between mud concentration and turbidity for Gulungul Creek could have important applications for continuous monitoring of stream mud and associated contaminant concentrations. Consequently, the relationship between turbidity and suspended sediment concentration should be investigated within the Gulungul Creek catchment, and that the size distribution of suspended sediment be clearly defined.

24
An automatic pump sampler and a turbidimeter should be installed upstream and downstream of the mine (GCUS and GCDS). Suspended sediment concentration should be determined from the water samples collected by the pump sampler (using a flow proportional sampling regime) and used to calibrate a turbidity-mud concentration relationship for the stream. The calibrated relationship could be applied to the continuous turbidity data to estimate mud yields. Individual event loads could then be used to derive mud transport models, similar to that derived for the Ngarradj catchment (Evans et al 2003, Moliere et al 2004), which may then be used for assessing mine-related suspended sediment impact.
6.2 Trace metal and contaminant sampling Some samples for chemical analysis, such as trace metal concentration, cannot be simply collected by automatic pump samplers due to contamination issues. To conduct a flow proportional sampling regime using manual sampling techniques over a significant length of time in Gulungul Creek would be extremely difficult. For such sample analysis, a selective grab sampling regime is the only option.
Typically, water quality parameters are measured based on a fixed-time, weekly grab-sampling regime as part of the mining company’s Environmental Requirements. Water quality parameters, including trace metal concentrations, are currently measured both upstream and downstream of the mine along Gulungul Creek. However, the hydrological response of the stream at these sampling sites is not incorporated within the design of the sampling regime. Moliere and Boggs (2005) demonstrated the importance of applying the fitted lag-time relationship (fig 11) to a sampling regime to reliably assess mining-related impacts on stream water quality parameters associated with suspended sediment. For example, table 7 indicates that peak discharge in Gulungul Creek, as a result of a storm event, occurs at GCUS and GCDS approximately 4 hours apart. Therefore, samples should be collected at the downstream station approximately 4 hours after the upstream sample to obtain ‘matched’ water quality data. Otherwise, long-term average differences in water quality parameter values between the upstream and downstream sample sites could be significantly overestimated (Moliere & Boggs 2005).
In terms of understanding the natural variability in trace metal concentrations in Gulungul Creek, a grab sampling regime would need to adequately describe the processes that may occur during rainfall-runoff events as well as during low flow periods. As discussed above, it is likely that contaminants are primarily associated with fine sediments which travel in waves during the rising stage of the event hydrograph. These pulses of suspended sediment will generally occur in Gulungul Creek late evening to early in the morning. If the weekly sampling program is conducted from mid-morning to mid-afternoon in Gulungul Creek, which is typically baseflow conditions, the probability of sampling during a high flow or high suspended sediment transport period will be low. Therefore, in this case, an intense, manual target-sampling regime over the short term, which requires an understanding of the lag-time of the stream at the sampling location, should be adopted to collect water quality parameters during the rising and falling stages of selected event hydrographs. Furthermore, these samples should be used to determine if stream contaminant concentration (including heavy metals and uranium series radionuclides) and suspended sediment concentration are closely correlated in Gulungul Creek. Studies such as Schoellhamer (1997a,b), Whyte and Kirchner (2000) and Walling and Owens (2003) have derived significant regression relationships between stream suspended sediment concentration and contaminant concentration data, indicating that suspended sediment concentration could be used as a proxy for contaminant concentration. Should a significant relationship exist within Gulungul Creek, a continuous record of

25
contaminant flux could be estimated from continuous monitoring of streamflow and suspended sediment concentration (using turbidimeters). If a significant relationship does not exist between suspended sediment concentration and some, or all, of the mud-associated contaminants, at the very least, the target sampling regime could result in a better understanding of contaminant movement and concentration variability within the streams, particularly during periods of high suspended sediment transport.
7 References Boggs GS, Devonport CC, Evans KG, Saynor MJ & Moliere DR 2001. Development of a GIS
based approach to mining risk assessment. Supervising Scientist Report 159, Supervising Scientist, Darwin.
Boggs GS, Moliere DR, Evans KG & Devonport CC 2003. Lomg-term hydrology modelling and analysis in a data limited small catchment in the wet-dry tropics of Australia. Australian Journal of Water Resources 7(2), 71–85.
Bureau of Meteorology 1999. Hydrometeorological analyses relevant to Jabiluka. Supervising Scientist Report 140, Supervising Scientist, Canberra.
Brown JAH 1983. Australia’s surface water resources. I. Assessment of the quantity and quality of Australia’s surface water resources. II. Surface water resources data collection in Australia: its adequacy and the role of the Commonwealth. In Water 2000: Consultants Report No. I, Department of Resources and Energy, AGPS, Canberra, 26–27, 127–132.
Commonwealth Department of Housing and Construction, ACT Region 1980. Ranger Uranium Mines Pty Ltd operation at Jabiru during flood of 4th February 1980. Open file record 31, Supervising Scientist for the Alligator Rivers Region, Canberra. Unpublished paper.
Crossing KS 2002. Geomorphology and hydrology of Gulungul Creek. Internal Report 398, November, Supervising Scientist, Darwin. Unpublished paper.
Cull R, Hancock G, Johnston A, Martin P, Martin R, Murray AS, Pfitzner J, Warner RF & Wasson RJ 1992. Past, present and future sedimentation on the Magela Plain and in its Catchment. In Modern sedimentation and late Quaternary evolution of the Magela Creek plain, ed RJ Wasson. Research report 6, Supervising Scientist for the Alligator Rivers Region, AGPS, Canberra, 226–268.
Duggan K 1991. Mining and erosion in the Alligator Rivers Region of Northern Australia. Open file record 81, Supervising Scientist for the Alligator Rivers Region, Canberra. Unpublished paper.
Duggan K 1994. Erosion and sediment yields in the Kakadu region of northern Australia. In Variability in stream erosion and sediment transport, eds LJ Olive, RJ Loughran & JA Kesby, IAHS Publication 224, International Association of Hydrological Sciences, Wallingford, Oxfordshire, 373–383.
East TJ 1996. Landform evolution. In Landscape and vegetation ecology of the Kakadu Region, northern Australia, eds CM Finlayson & I Von Oertzen, Kluwer, Dordrecht, 37–55.
East TJ, Cull RF & Duggan K 1987. Surface runoff yields and sediment transport processes near Ranger. In Alligator Rivers Region Research Institute Annual Research Summary 1985–86. Australian Government Publishing Service, Canberra, 17–20.

26
Erskine WD & Saynor MJ 2000. Assessment of the off-site geomorphic impacts of uranium mining on Magela Creek, Northern Territory, Australia. Supervising Scientist Report 156, Supervising Scientist, Darwin.
Erskine WD, Saynor MJ, Evans KG & Boggs GS 2001. Geomorphic research to determine the off-site impacts of the Jabiluka Mine on Swift (Ngarradj) Creek, Northern Territory. Supervising Scientist Report 158, Supervising Scientist, Darwin.
Espey WH, Morgan CW & Masch FD 1966. Study of some effects of urbanisation on storm runoff from a small watershed. Report No. 23, Texas Water Development Board, Austin, Texas.
Evans KG 2000. Methods for assessing mine site rehabilitation design for erosion impact. Australian Journal of Soil Research 38, 231–247.
Evans KG & Johnston A 1997. A review of erosion and hydrology research at eriss. Internal report 268, Supervising Scientist, Canberra. Unpublished paper.
Evans KG, Moliere DR, Saynor MJ, Erskine WD & Bellio MG 2003. Assessing impacts of catchment disturbance on mud transport in a seasonal stream. In National Environment Conference 2003 Proceedings, Brisbane, 18–20 June 2003, Environmental Engineering Society (Queensland chapter), Brisbane, CD.
Evans KG, Moliere DR, Saynor MJ, Erskine WD & Bellio MG 2004. Baseline suspended sediment solute, pH, EC and turbidity characteristics for the Ngarradj catchment, Northern Territory. Supervising Scientist Report 179, Supervising Scientist, Canberra.
Evans KG, Willgoose GR, Saynor MJ & House T 1998. Effect of vegetation and surface amelioration on simulated landform evolution of the post-mining landscape at ERA Ranger Mine, Northern Territory. Supervising Scientist Report 134, Supervising Scientist, Canberra.
Glysson GD & Gray JR 2002. Turbidity and other sediment surrogates Proceedings of Workshop, Reno, Nevada, USA, April/May 2002, US Geological Survey Circular 1250, (http://water.usgs.gov/osw/techniques/turbidity.html)
Hart BT, Davies SHR & Thomas PA 1982. Transport of iron, manganese, cadmium, copper and zinc by Magela Creek, Northern Territory, Australia. Water Resources 16, 605–612.
Hoggan DH 1997. Computer-assisted floodplain hydrology and hydraulics. 2nd ed, McGraw-Hill, New York.
Lewis J 2003. Turbidity-controlled sampling for suspended sediment load estimation. In Erosion and sediment transport measurement in rivers: technological and methodological advances, Proceedings Oslo Workshop, June 2002, IAHS Publication 283, International Association of Hydrological Sciences, Wallingford, Oxfordshire, 13–20.
Li Q, Bras RL & Veneziano D 1996. Analysis of Darwin rainfall data: Implications on sampling strategy. Journal of Applied Meteorology 35, 372–385.
Moliere DR & Boggs GS 2005. Understanding stream lag-times – implications for water quality sampling in mining-impacted catchments of Kakadu, NT. In Water capital, Proceedings of the 29th Hydrology and Water Resources Symposium, 20–23 February 2005, Canberra, Engineers Australia (CD).

27
Moliere DR, Boggs GS, Evans KG, Saynor MJ & Erskine WD 2002a. Baseline hydrology characteristics of the Ngarradj catchment, Northern Territory. Supervising Scientist Report 172, Supervising Scientist, Darwin NT.
Moliere DR, Boggs GS, Evans KG & Saynor MJ 2002b. Hydrological response of Ngarradj – a seasonal stream in the wet-dry tropics, Northern Territory. In The structure, function and management implications of fluvial sedimentary systems, Proceedings of the Alice Springs Symposium, September 2002, IAHS Publication 276, International Association of Hydrological Sciences, Wallingford, Oxfordshire, 281–288.
Moliere DR, Evans KG, Saynor MJ & Erskine WD 2004. Estimation of suspended sediment loads in a seasonal stream in the wet-dry tropics, Northern Territory, Australia. Hydrological Processes 18, 531–544.
Moliere DR, Saynor MJ & Evans KG 2005. Suspended sediment concentration-turbidity relationships for Ngarradj – a seasonal stream in the wet-dry tropics. Australian Journal of Water Resources, in press.
Pickup G, Wasson RJ, Warner RF, Tongway D & Clark RL 1987. A feasibility study of geomorphic research for the long term management of uranium mill tailings. CSIRO Division of Water Resources Research, Division Report 87/2, Canberra.
Pilgrim DH 2001. Australian rainfall and runoff. Institution of Engineers, Australia, Barton, ACT.
Rieger WA & Olive LJ 1988. Channel sediment loads: comparisons and estimation. In Fluvial geomorphology of Australia, ed Warner RF, Academic Press, Sydney, 69–85.
Riley SJ 1997. The sediment concentration–turbidity relation: Its value in monitoring at Ranger uranium mine. Internal report 235, Supervising Scientist, Canberra. Unpublished paper.
Riley SJ 1998. The sediment concentration-turbidity relation: its value in monitoring at Ranger Uranium Mine, Northern Territory, Australia. Catena 32, 1–14.
Schoellhamer DH 1997a. Time series of trace element concentrations calculated from time series of suspended-solids concentrations and RMP water samples. In 1995 Annual Report: San Francisco Estuary Regional Monitoring Program for Trace Substances, San Francisco Estuary Institute, Oakland, CA, 53–5.
Schoellhamer DH 1997b. Time series of SSC, salinity, temperature, and total mercury concentration in San Francisco Bay during water year 1996. In 1996 Annual Report: San Francisco Estuary Regional Monitoring Program for Trace Substances, San Francisco Estuary Institute, Oakland, CA, 65–77.
Schoellhamer DH & Wright SA 2003. Continuous monitoring of suspended sediment in rivers by use of optical backscatter sensors. In Erosion and sediment transport measurement: Technological and methodological advances, Proceedings, Oslo Symposium, June 2002, IAHS Publication 283, International Association of Hydrological Sciences, Wallingford, Oxfordshire, 28–36.
Skeat AJ, East TJ & Corbett LK 1996. Impact of feral water buffalo. In Landscape and vegetation ecology of the Kakadu Region, northern Australia, eds CM Finlayson & I Von Oertzen, Kluwer, Dordrecht, 155-177.
Soman VV, Valdes JB & North GR 1995. Satellite sampling and the diurnal cycle statistics of Darwin rainfall data. Journal of Applied Meteorology 34, 2481–2490.

28
Vardavas IM & Cannon LM 1991. A simple model for monthly runoff from tropical catchments: Application to catchments in the Alligator Rivers Region. Internal report 36, Supervising Scientist for the Alligator Rivers Region, Canberra. Unpublished paper.
Walling DE 1977. Limitation of the rating curve technique for estimating suspended sediment loads, with particular reference to British rivers. In Erosion and solid matter transport in inland waters, Proceedings, Paris Symposium, July 1977, IAHS Publication 122, International Association of Hydrological Sciences, Wallingford, Oxfordshire, 34–48.
Walling DE 1983. The sediment delivery problem. Journal of Hydrology 65, 209–237.
Walling DE & Webb 1982. Sediment availability and the prediction of storm-period sediment yields. In Recent developments in the explanation and prediction of erosion and sediment yield, Proceedings, Exeter Symposium, July 1982, IAHS Publication 137, International Association of Hydrological Sciences, Wallingford, Oxfordshire, 327–337.
Walling DE & Webb BW 1985. Estimating the discharge of contaminants to coastal waters by rivers: some cautionary comments. Marine Pollution Bulletin 16(12), 488–492.
Walling DE, Webb BW & Woodward JC 1992. Some sampling considerations in the design of effective strategies for monitoring sediment-associated transport. In Erosion and sediment transport monitoring programmes in river basins, Proceedings, Oslo Symposium, August 1992, IAHS Publication 210, International Association of Hydrological Sciences, Wallingford, Oxfordshire, 279–288.
Walling DE & Owens PN 2002. The role of floodplain sedimentation in catchment sediment and contaminant budgets. In The structure, function and management implications of fluvial sedimentary systems, Proceedings, Alice Springs Symposium, September 2002, IAHS Publication 276, International Association of Hydrological Sciences, Wallingford, Oxfordshire, 407–416.
Walling DE & Owens PN 2003. The role of overbank floodplain sedimentation in catchment contaminant budgets. Hydrobiologia 494, 83–91.
Water Division 1982. Uranium Province Hydrology, Volume 12. Department of Transport and Works, Northern Territory of Australia. Unpublished Report.
Whyte DC & Kirchner JW 2000. Assessing water quality impacts and cleanup effectiveness in streams dominated by episodic mercury discharges. The Science of the Total Environment. 260, 1–9.
Willgoose G & Riley SJ 1998. Application of a catchment evolution model to the production of long-term erosion on the spoil heap at the Ranger uranium mine: Initial analysis. Supervising Scientist Report 132, Supervising Scientist, Canberra.
Williams GP 1989. Sediment concentration versus water discharge during single hydrologic events in rivers. Journal of Hydrology 111, 89–106.

29
Appendix A
Rainfall data

30
Appendix A1 – Jabiru rainfall data Daily rainfall and rainfall intensity data for Jabiru airport have been collected (primarily by the Bureau of Meteorology) since 1971 and 1972 respectively (table A.1). Significant gaps in both the daily and the rainfall intensity records have occurred during the period of data collection (tables A.1 and A.2). Complete monthly rainfall data for Jabiru airport collected by ERA since 1971 has been presented in Bureau of Meteorology (1999).
In this study, each of the three rainfall records – daily, rainfall intensity and monthly (table A.1) – were compared to ensure that these data are similar.
Table A.1 Rainfall data collected at the Jabiru airport
Data type Period of record Missing data (no. of months) [% of record]
Source of data
Monthly Sept 1971 – Jan 1999 0 [0] ERA*
Daily June 1971 – Sept 2003 63 [16] Bureau of Meteorology
Intensity Jan 1972 – June 2003 97 [26] Bureau of Meteorology(1)
* Published in Bureau of Meteorology (1999)
(1) ERA collected rainfall intensity data between November 1990 and January 2000 (table 1 within the text)
Table A.2 Gaps in the rainfall record
Data type Missing data
Daily rainfall 3 Oct 1975 – 1 Nov 1975
30 Nov 1975 – 1 Jan 1976
31 May 1976 – 1 Mar 1977
30 Jun 1990 – 1 Jan 1993
30 Jan 1993 – 7 Oct 1994
5 Dec 1997 – 17 Jan 1998
Rainfall intensity 6 Nov 1973 – 19 Nov 1973
31 Dec 1975 – 18 Feb 1977
30 Dec 1980 – 5 Jan 1984
31 Dec 1984 – 1 Jan 1986
31 Dec 1989 – 31 Oct 1990
9 Feb 1995 – 4 Jan 1996
14 Jan 2000 – 16 Mar 2001
Figure A.1 describes the regression relationships between each dataset for the Jabiru airport on a monthly basis. Outliers were then identified as points greater than two standard deviations away from the mean. These outliers were removed from the dataset and the regression analysis was revised (fig A.2). Figure A.2 shows that there is no statistical difference between each of the rainfall records for Jabiru airport. The relationships between each of the datasets are approximately 1:1, with only minor scatter about the line of best fit.

31
0 250 500 750 1000Monthly rainfall (mm)
[Collected by ERA]
0
250
500
750
1000
Mon
thly
rain
fall
(mm
)[D
eriv
ed fr
om d
aily
reco
rd]
1:1 lin
e
Y = 0.94 X (r2 = 0.95)
0 250 500 750 1000Monthly rainfall (mm)
[Collected by ERA]
0
250
500
750
1000
Mon
thly
rain
fall
(mm
)[D
eriv
ed fr
om ra
infa
ll in
tens
ity d
ata]
1:1 lin
e
Y = 0.90 X (r2 = 0.96)
0 250 500 750 1000Monthly rainfall (mm)[Derived from daily record]
0
250
500
750
1000
Mon
thly
rain
fall
(mm
)[D
eriv
ed fr
om ra
infa
ll in
tens
ity d
ata]
1:1 lin
e
Y = 0.98 X (r2 = 0.99)
Figure A.1 Comparison of monthly rainfall at Jabiru airport between (i) the daily record (BoM) and the
monthly record (ERA) (Top); (ii) the rainfall intensity data (BoM) and the monthly record (ERA) (Middle); and (iii) the rainfall intensity data (BoM) and the daily record (BoM) (Bottom).

32
0 250 500 750 1000Monthly rainfall (mm)
[Collected by ERA]
0
250
500
750
1000
Mon
thly
rain
fall
(mm
)[D
eriv
ed fr
om d
aily
reco
rd]
1:1 lin
e
Y = 0.999 X (r2 = 0.995)
0 250 500 750 1000Monthly rainfall (mm)
[Collected by ERA]
0
250
500
750
1000
Mon
thly
rain
fall
(mm
)[D
eriv
ed fr
om ra
infa
ll in
tens
ity d
ata]
1:1 lin
e
Y = 0.95 X (r2 = 0.99)
0 250 500 750 1000Monthly rainfall (mm)[Derived from daily record]
0
250
500
750
1000
Mon
thly
rain
fall
(mm
)[D
eriv
ed fr
om ra
infa
ll in
tens
ity d
ata]
1:1 lin
e
Y = 0.98 X (r2 = 0.996)
Figure A.2 Comparison of monthly rainfall at Jabiru airport between each dataset (indicated above in
figure A.1). Outliers (shown as ●) have been removed from the analysis.

33
Appendix A2 – Tailings Dam rainfall data Daily rainfall and rainfall intensity data have been collected by Ranger mine since 1979 and 1989 respectively (table A.3). Significant gaps in the rainfall intensity records have occurred during the period of data collection (tables A.3 and A.4). In this section, these two rainfall records were compared to ensure that these data are similar.
Table A.3 Rainfall data collected at the Tailings Dam
Data type Period of record Missing data (no. of months) [% of record]
Source of data
Daily Sept 1979 – Sept 2003 0 [0] ERA
Intensity Nov 1989 – Feb 2000 30 [24] ERA
Table A.4 Gaps in the rainfall record
Data type Missing data
Rainfall intensity 3 Apr 1990 – 2 Jan 1991
31 Dec 1992 – 24 Mar 1993
26 Nov 1997 – 3 Feb 1999
7 Apr 1999 – 13 Oct 1999
Figure A.3 shows that there is no statistical difference between the two rainfall records for the Tailings Dam. The relationship between the two datasets is approximately 1:1, with only minor scatter about the line of best fit. Similar to the above analysis for Jabiru rainfall (Appendix A1), the relationship was refined by removing the outliers from the dataset.
0 200 400 600 800
Monthly rainfall (mm)[Derived from daily record]
0
200
400
600
800
Mon
thly
rain
fall
(mm
)[D
eriv
ed fr
om ra
infa
ll in
tens
ity d
ata]
1:1 lin
e
Y = 1.04 X (r2 = 0.997)
Figure A.3 Comparison of monthly rainfall at the Tailings Dam between each dataset (indicated above
in figure A.1). Outliers (shown as ●) have been removed from the analysis.

34
Appendix B
Observed hydrographs and daily rainfall

25 50 750
1971
-197
2
100 0102030
Discharge (m3 s-1)Daily rainfall (mm)
Dec
Jan
Nov
Oct
Apr
May
Mar
Feb
25 50 750
1972
-197
3
100 0102030
Discharge (m3 s-1)Daily rainfall (mm)
Dec
Jan
Nov
Oct
Apr
May
Mar
Feb
Fi
gure
B.1
Dai
ly ra
infa
ll co
llect
ed a
t Jab
iru a
irpor
t and
hyd
rogr
aph
at G
8210
012
durin
g 19
71–7
2 an
d 19
72–7
3
35

25 50 75019
73-1
974
100 02040
Discharge (m3 s-1)Daily rainfall (mm)
Dec
Jan
Nov
Oct
Apr
May
Mar
Feb
25 50 750
1974
-197
5
100 0102030
Discharge (m3 s-1)Daily rainfall (mm)
Dec
Jan
Nov
Oct
Apr
May
Mar
Feb
Fi
gure
B.2
Dai
ly ra
infa
ll co
llect
ed a
t Jab
iru a
irpor
t and
hyd
rogr
aph
at G
8210
012
durin
g 19
73–7
4 an
d 19
74–7
5
36

25 50 750
1975
-197
6
100 0255075
Discharge (m3 s-1)Daily rainfall (mm)
Dec
Jan
Nov
Oct
Apr
May
Mar
Feb
25 50 750
1976
-197
7
100 0204060
Discharge (m3 s-1)Daily rainfall (mm)
Dec
Jan
Nov
Oct
Apr
May
Mar
Feb
Fi
gure
B.3
Dai
ly ra
infa
ll co
llect
ed a
t Jab
iru a
irpor
t and
hyd
rogr
aph
at G
8210
012
durin
g 19
75–7
6 an
d 19
76–7
7
37
Mis
sing
rain
fall
data

25 50 750
1977
-197
8
100 02550
Discharge (m3 s-1)Daily rainfall (mm)
Dec
Jan
Nov
Oct
Apr
May
Mar
Feb
25 50 750
1978
-197
9
100 01020
Discharge (m3 s-1)Daily rainfall (mm)
Dec
Jan
Nov
Oct
Apr
May
Mar
Feb
Fi
gure
B.4
Dai
ly ra
infa
ll co
llect
ed a
t Jab
iru a
irpor
t and
hyd
rogr
aph
at G
8210
012
durin
g 19
77–7
8 an
d 19
78–7
9
38

50019
79-1
980
100 080160
240
Discharge (m3 s-1)Daily rainfall (mm)
Dec
Jan
Nov
Oct
Apr
May
Mar
Feb
150
25019
80-1
981
50 04080
Discharge (m3 s-1)Daily rainfall (mm)
Dec
Jan
Nov
Oct
Apr
May
Mar
Feb
75 100
Fi
gure
B.5
Dai
ly ra
infa
ll co
llect
ed a
t Jab
iru a
irpor
t and
hyd
rogr
aph
at G
8210
012
durin
g 19
79–8
0 an
d 19
80–8
1
39

25 50 750
1981
-198
2
100 02040
Discharge (m3 s-1)Daily rainfall (mm)
Dec
Jan
Nov
Oct
Apr
May
Mar
Feb
25 50 750
1982
-198
3
100 02550
Discharge (m3 s-1)Daily rainfall (mm)
Dec
Jan
Nov
Oct
Apr
May
Mar
Feb
Fi
gure
B.6
Dai
ly ra
infa
ll co
llect
ed a
t Jab
iru a
irpor
t and
hyd
rogr
aph
at G
8210
012
durin
g 19
81–8
2 an
d 19
82–8
3
40

25 50 75019
83-1
984
100 050100
Discharge (m3 s-1)Daily rainfall (mm)
Dec
Jan
Nov
Oct
Apr
May
Mar
Feb
25 50 750
1984
-198
5
100 02550
Discharge (m3 s-1)Daily rainfall (mm)
Dec
Jan
Nov
Oct
Apr
May
Mar
Feb
Fi
gure
B.7
Dai
ly ra
infa
ll co
llect
ed a
t Jab
iru a
irpor
t and
hyd
rogr
aph
at G
8210
012
durin
g 19
83–8
4 an
d 19
84–8
5
41

25 50 750
1985
-198
6
100 01224
Discharge (m3 s-1)Daily rainfall (mm)
Dec
Jan
Nov
Oct
Apr
May
Mar
Feb
25 50 750
1986
-198
7
100 02040
Discharge (m3 s-1)Daily rainfall (mm)
Dec
Jan
Nov
Oct
Apr
May
Mar
Feb
Fi
gure
B.8
Dai
ly ra
infa
ll co
llect
ed a
t Jab
iru a
irpor
t and
hyd
rogr
aph
at G
8210
012
durin
g 19
85–8
6 an
d 19
86–8
7
42
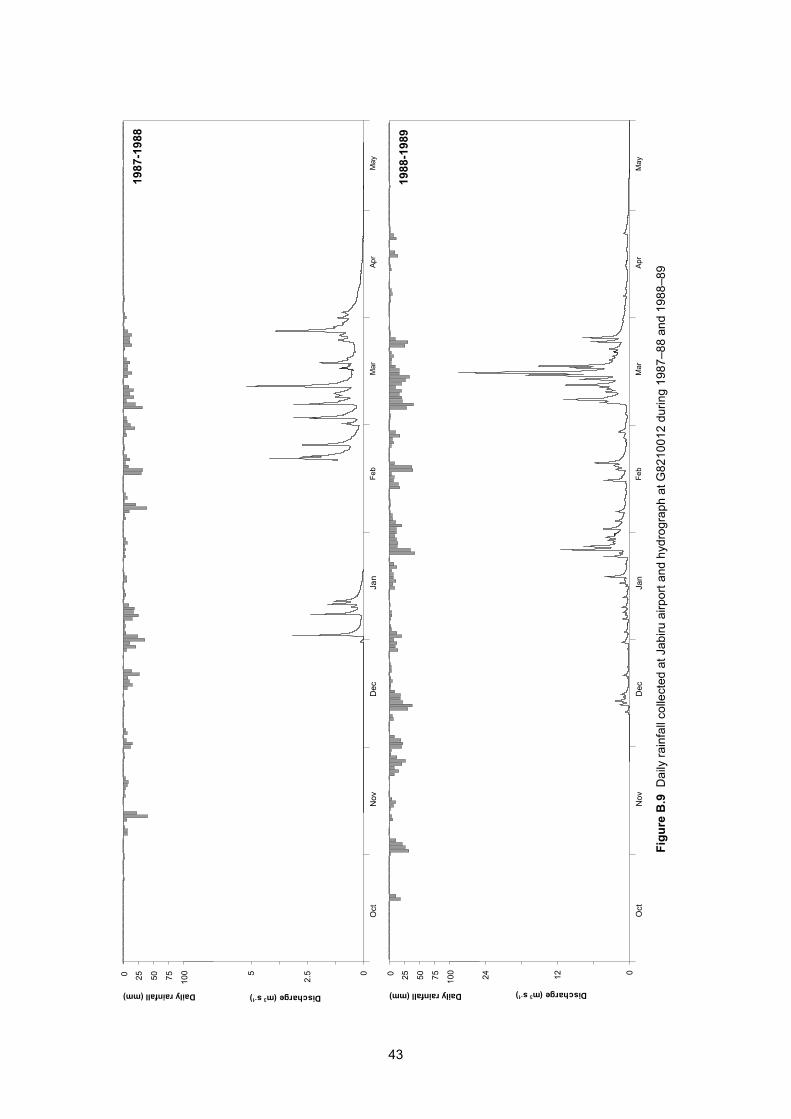
25 50 75019
87-1
988
100 0
2.55
Discharge (m3 s-1)Daily rainfall (mm)
Dec
Jan
Nov
Oct
Apr
May
Mar
Feb
25 50 750
1988
-198
9
100 01224
Discharge (m3 s-1)Daily rainfall (mm)
Dec
Jan
Nov
Oct
Apr
May
Mar
Feb
Fi
gure
B.9
Dai
ly ra
infa
ll co
llect
ed a
t Jab
iru a
irpor
t and
hyd
rogr
aph
at G
8210
012
durin
g 19
87–8
8 an
d 19
88–8
9
43

25 50 75019
89-1
990
100 0
2.55
Discharge (m3 s-1)Daily rainfall (mm)
Dec
Jan
Nov
Oct
Apr
May
Mar
Feb
25 50 750
1990
-199
1
100 01530
Discharge (m3 s-1)Daily rainfall (mm)
Dec
Jan
Nov
Oct
Apr
May
Mar
Feb
Fi
gure
B.1
0 D
aily
rain
fall
colle
cted
at J
abiru
airp
ort a
nd h
ydro
grap
h at
G82
1001
2 du
ring
1989
–90
and
1990
–91
44

25 50 750
1991
-199
2
100 01530
Discharge (m3 s-1)Daily rainfall (mm)
Dec
Jan
Nov
Oct
Apr
May
Mar
Feb
25 50 750
1992
-199
3
100 02040
Discharge (m3 s-1)Daily rainfall (mm)
Dec
Jan
Nov
Oct
Apr
May
Mar
Feb
Fi
gure
B.1
1 D
aily
rain
fall
colle
cted
at J
abiru
airp
ort a
nd h
ydro
grap
h at
G82
1001
2 du
ring
1991
–92
and
1992
–93
45


![hawaii's rainwater catchment services directory - ctahr directory... · [ Page 1 ] Hawaii’s Rainwater atchment Services Directory HAWAII’S RAINWATER CATCHMENT SERVICES DIRECTORY](https://img.pdfslide.tips/doc/110x75/5a81030c7f8b9a38478ceb57/hawaiis-rainwater-catchment-services-directory-ctahr-directory-page-1-hawaiis.jpg)