Embed Size (px)
Citation preview
WE ARE FUTURE READY
A B U D H A B I C O M M E R C I A L B A N K PJ S C
2 0 1 9 A N N U A L R E P O R T
AB
U D
HA
BI C
OM
ME
RC
IAL
BA
NK
PJ
SC
20
19
AN
NU
AL
RE
PO
RT
٢٠١٩
بنك أبوظبي التجاري، شركة مساهمة عامةالتقرير السنوي ٢٠١٩
اقرأ كيف تمّكنا نحن من مواجهة التحديات، وتعّرف على قصة
نجاح مؤسسة مالية إماراتية كبرى،يروي البنك عبر فصولها المشرفة.إنجازات حققها بالطموح واالنضباط
إننا البنك الذي يلتزم ميثاقًامن القيم المؤسسية والمعايير
االحترافية و يأخذه االنضباط ويدفعه الطموح.. لتحقيق عوائد مجزيةللمساهمين، وإطالق منتجات
مصممة على نحو متفرد للعمالءإننا نتطلع بثقة أكبر نحو المستقبلومعًا سنرسم مالمح الغد الواعد.
نحن البنك الذي يأخذه الطموح.. نحو المستقبل الواعد
SF CVR OUTER_SPINE 27.5 MM_PAN 432 C_PAN 485 C_PAN 7621 C_RED FOIL_ _L12_V1_CORR5
Discover how Discover how wewe triumphed triumphedover challenges and setover challenges and set
new records. new records. Find out why our customers Find out why our customers areare
so loyal, how our digitalso loyal, how our digitaltransformation is changingtransformation is changing
thethe way they way they bank,bank, and what and whatthatthat means for the means for theworld tomorrow.world tomorrow.
Learn about what Learn about what makesmakes us usdifferent and the many ways wedifferent and the many ways weare helping fuel the are helping fuel the ambitionambition of of
the UAE for the best the UAE for the best possiblepossible future. future.
ADCB_AR19_cover_v2_L8_SP27.5MM.indd 1-3ADCB_AR19_cover_v2_L8_SP27.5MM.indd 1-3 08/03/2020 4:55 PM08/03/2020 4:55 PM

FUTURE READY FUTURE READY FUTURE READY FUTURE READY
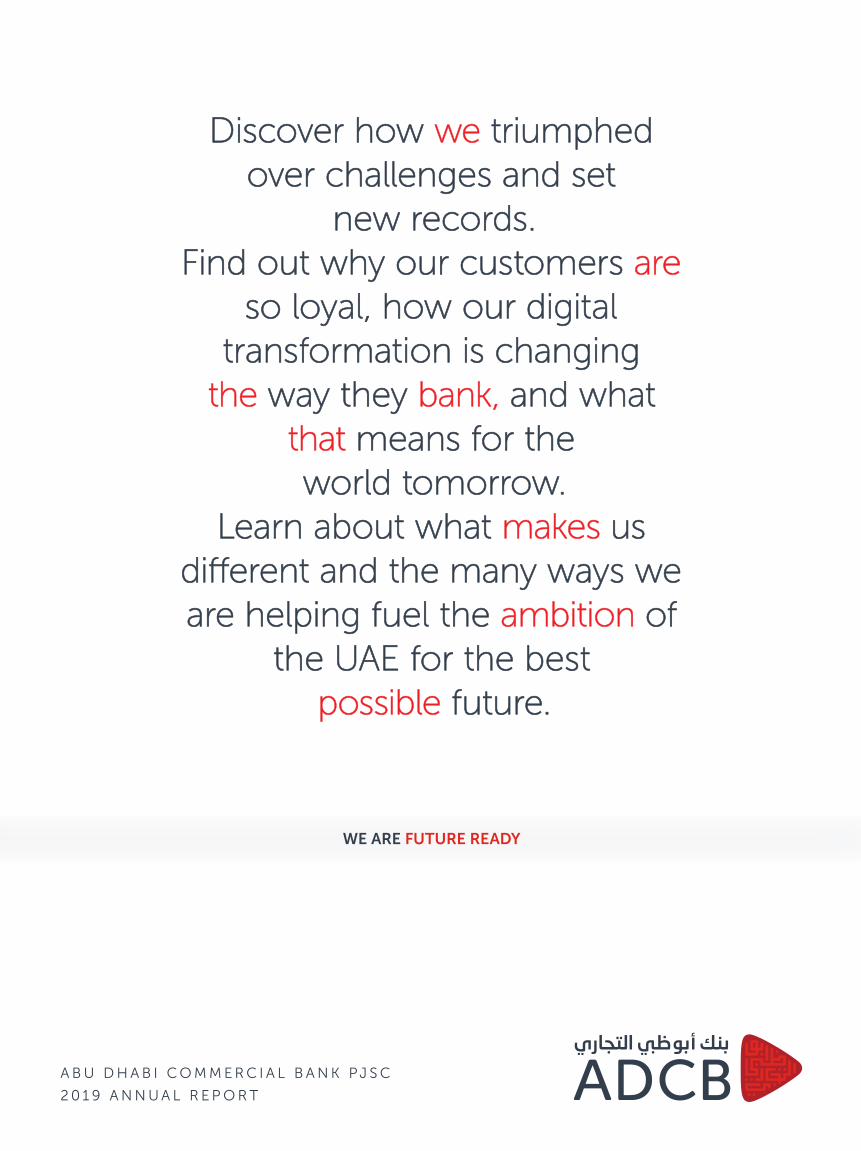
FUTURE READY 6
ADCB GROUP AT A GLANCE 16
OVERVIEW 18Chairman’s Message 20Economic Overview 24Business Model 26
STRATEGY 28Group CEO’s Message 30Group Strategy 34Al Hilal Bank 40Subsidiaries 44Risk Management 46
PERFORMANCE 56Group CFO’s Message 58Financial Overview 62Business Review
Consumer Banking Group 68Wholesale Banking Group 72Treasury and Investments Group 80Property Management 82Group Business Services 84Human Resources 90
Sustainability 942019 Awards 102
GOVERNANCE 104Chairman’s Letter 106Board of Directors 108Executive Management 114Corporate Governance Report 120
PRO FORMA FINANCIAL STATEMENTS 151
CONSOLIDATED FINANCIAL STATEMENTS 156
TABLE OF CONTENTS
FUTURE READY FUTURE READY FUTURE READY FUTURE READY

Sheikh Zayed was preparing for the future more than three decades before the UAE established its own space agency and sent a man into space. His meeting with three Apollo 17 astronauts — Eugene Cernan, Ronald Evans and Harrison Schmitt — in February 1976 was an indication of the far-reaching plans the Founding President already had for the UAE.
UAE Founding President Sheikh Zayed with US astronauts Eugene Cernan (standing), Harrison Schmitt and NASA scientist Dr. Farouk Al Baz
F U T U R E R E A D Y
2
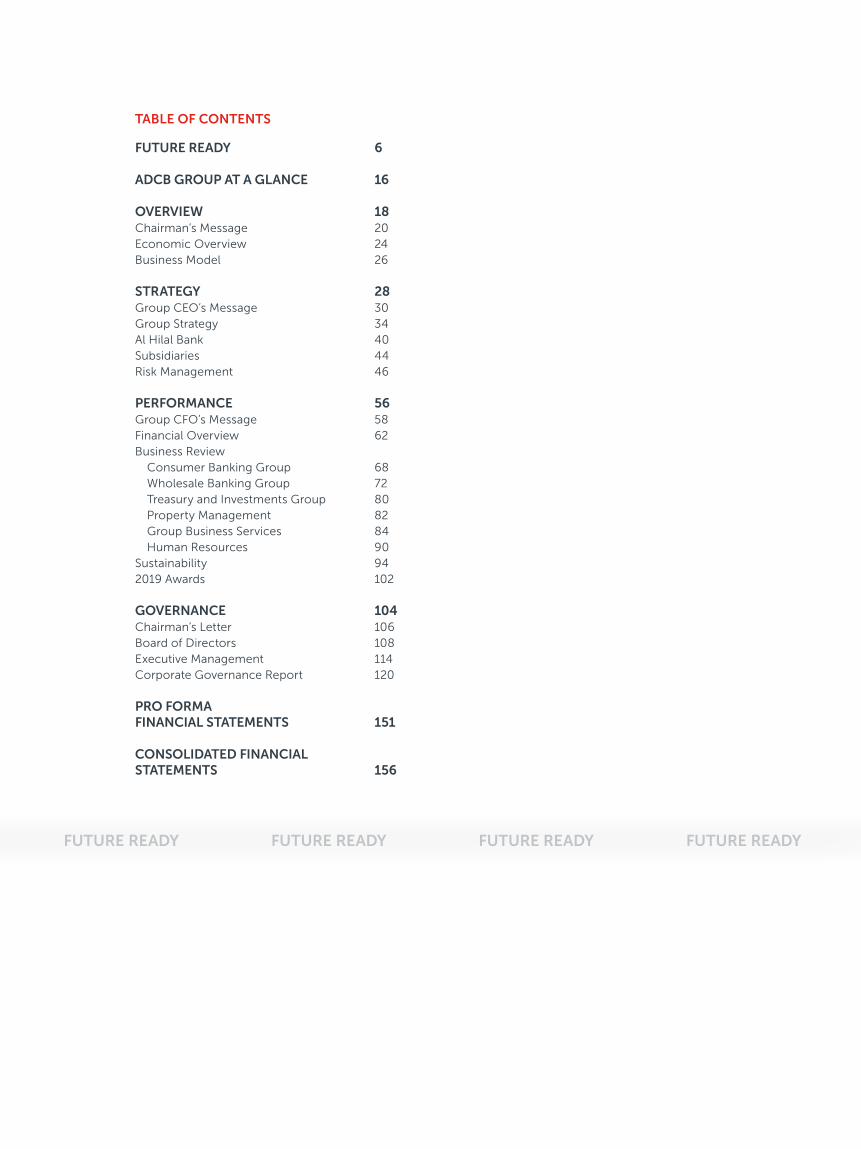
@mohamedbinzayed
“The merger of Abu Dhabi Commercial Bank, Union National Bank and Al Hilal Bank is in line with the UAE’s economic vision, to form powerful banking groups with human potentials and financial capabilities that would enhance the national economic competitiveness and its future aspirations.”
HIS HIGHNESS SHEIKH MOHAMMED BIN ZAYED AL NAHYAN
CROWN PRINCE OF ABU DHABI DEPUTY SUPREME COMMANDER OF THE UAE ARMED FORCES CHAIRMAN OF THE ABU DHABI EXECUTIVE COUNCIL
A D C B 2 0 1 9 A N N U A L R E P O R T
3

HIS HIGHNESS SHEIKH KHALIFA BIN ZAYED AL NAHYAN
PRESIDENT OF THE UNITED ARAB EMIRATES AND RULER OF ABU DHABI SUPREME COMMANDER OF THE UAE ARMED FORCES
F U T U R E R E A D Y
4

HIS HIGHNESS SHEIKH MOHAMMED BIN ZAYED AL NAHYAN
CROWN PRINCE OF ABU DHABI DEPUTY SUPREME COMMANDER OF THE UAE ARMED FORCES
CHAIRMAN OF THE ABU DHABI EXECUTIVE COUNCIL
A D C B 2 0 1 9 A N N U A L R E P O R T
5

FUTURE READY
The future belongs to those who prepare for itIn 2019, we successfully completed a landmark merger with Union National Bank (UNB) and acquired Al Hilal Bank (AHB). We set new records for the pace of integration, accelerated digital transformation and established new partnerships. We enhanced customer experience and delivered strong returns for our stakeholders. As a result, the enlarged ADCB Group has greater scale and resilience, ensuring we are ready for the future and the opportunities it brings. Today we are prepared for what is next, so tomorrow we can make ambition possible.
F U T U R E R E A D Y
6

A D C B 2 0 1 9 A N N U A L R E P O R T
7

BUSINESS AS USUAL
F U T U R E R E A D Y
8

72 BRANCHES450+ ATMS 1 MILLION+ CUSTOMERS
Delivering Customer Day One without disruptionIn October 2019, just five months after the merger became legally effective, we combined the ADCB and UNB branch and ATM networks and activated branch interoperability. This meant that any customer, whether ADCB or former UNB, could access the combined network of 72 branches and over 450 ATMs across the UAE. We also rolled out the ADCB brand across all customer channels, ensuring a unified and enhanced banking experience for our customers.
This milestone was achieved seamlessly and ahead of schedule through meticulous planning and our passion for excellence.
But no matter how much activity there was behind the scenes, we made sure it was business as usual for more than one million customers.
A D C B 2 0 1 9 A N N U A L R E P O R T
9
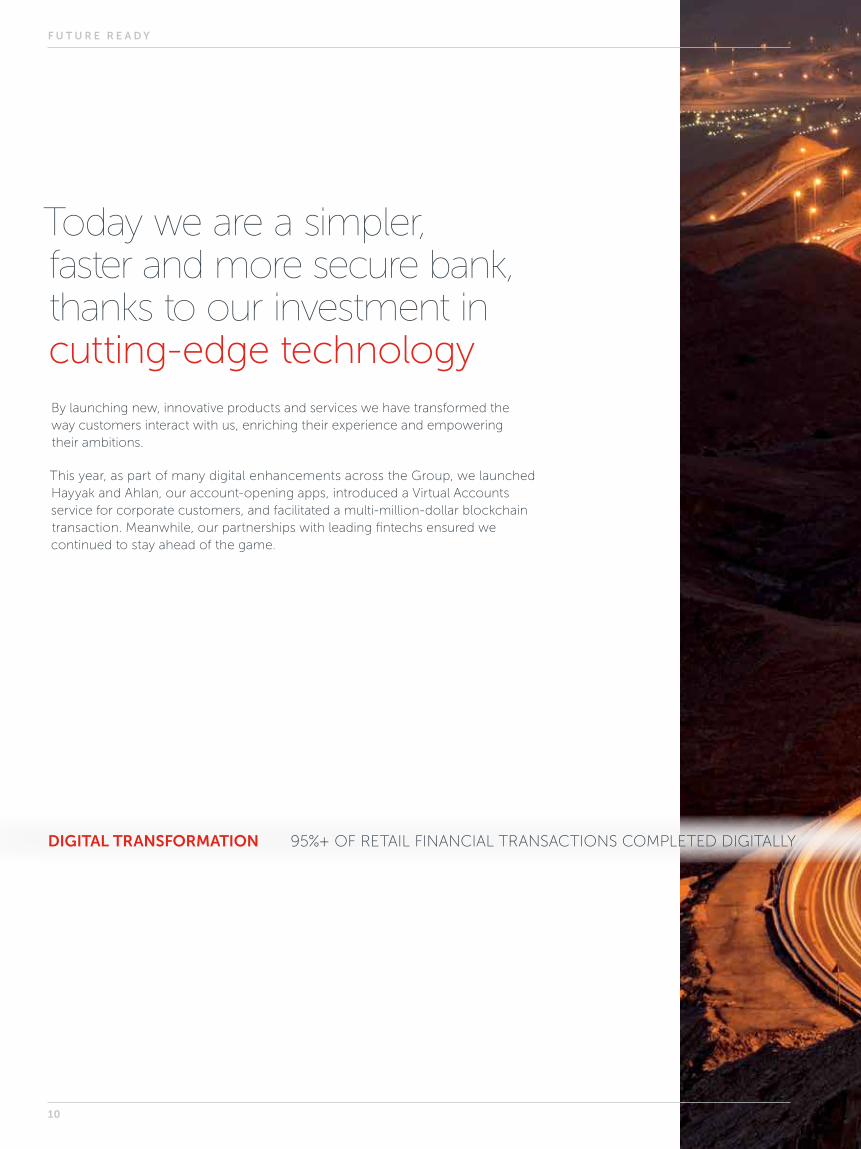
Today we are a simpler, faster and more secure bank, thanks to our investment in cutting-edge technologyBy launching new, innovative products and services we have transformed the way customers interact with us, enriching their experience and empowering their ambitions.
This year, as part of many digital enhancements across the Group, we launched Hayyak and Ahlan, our account-opening apps, introduced a Virtual Accounts service for corporate customers, and facilitated a multi-million-dollar blockchain transaction. Meanwhile, our partnerships with leading fintechs ensured we continued to stay ahead of the game.
DIGITAL TRANSFORMATION 95%+ OF RETAIL FINANCIAL TRANSACTIONS COMPLETED DIGITALLY
F U T U R E R E A D Y
10

29 DIGITAL CUSTOMER RELEASES 8 MINUTES TO OPEN AN ACCOUNT IN HAYYAK95%+ OF RETAIL FINANCIAL TRANSACTIONS COMPLETED DIGITALLY
A D C B 2 0 1 9 A N N U A L R E P O R T
11

1,479 EMIRATI EMPLOYEES IN ADCB GROUPEMIRATISATION
F U T U R E R E A D Y
12
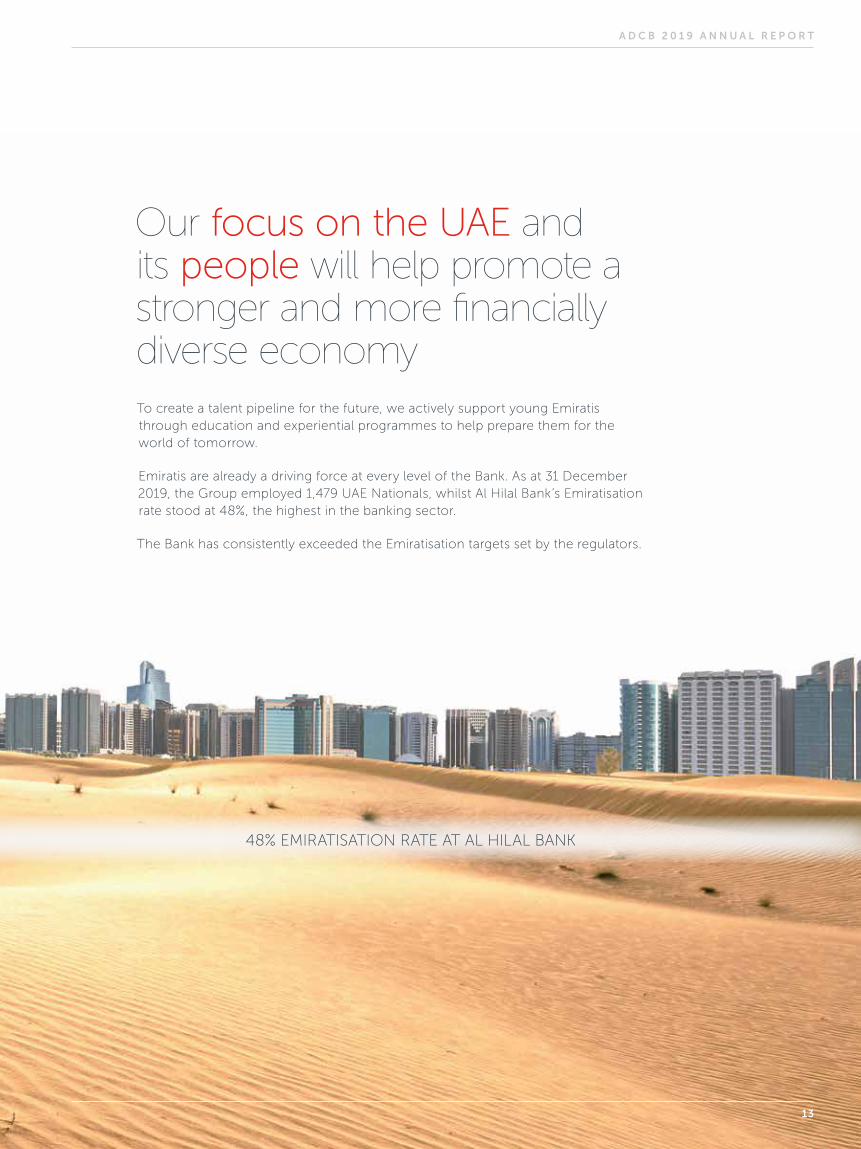
Our focus on the UAE and its people will help promote a stronger and more financially diverse economy To create a talent pipeline for the future, we actively support young Emiratis through education and experiential programmes to help prepare them for the world of tomorrow.
Emiratis are already a driving force at every level of the Bank. As at 31 December 2019, the Group employed 1,479 UAE Nationals, whilst Al Hilal Bank’s Emiratisation rate stood at 48%, the highest in the banking sector.
The Bank has consistently exceeded the Emiratisation targets set by the regulators.
48% EMIRATISATION RATE AT AL HILAL BANK
A D C B 2 0 1 9 A N N U A L R E P O R T
13
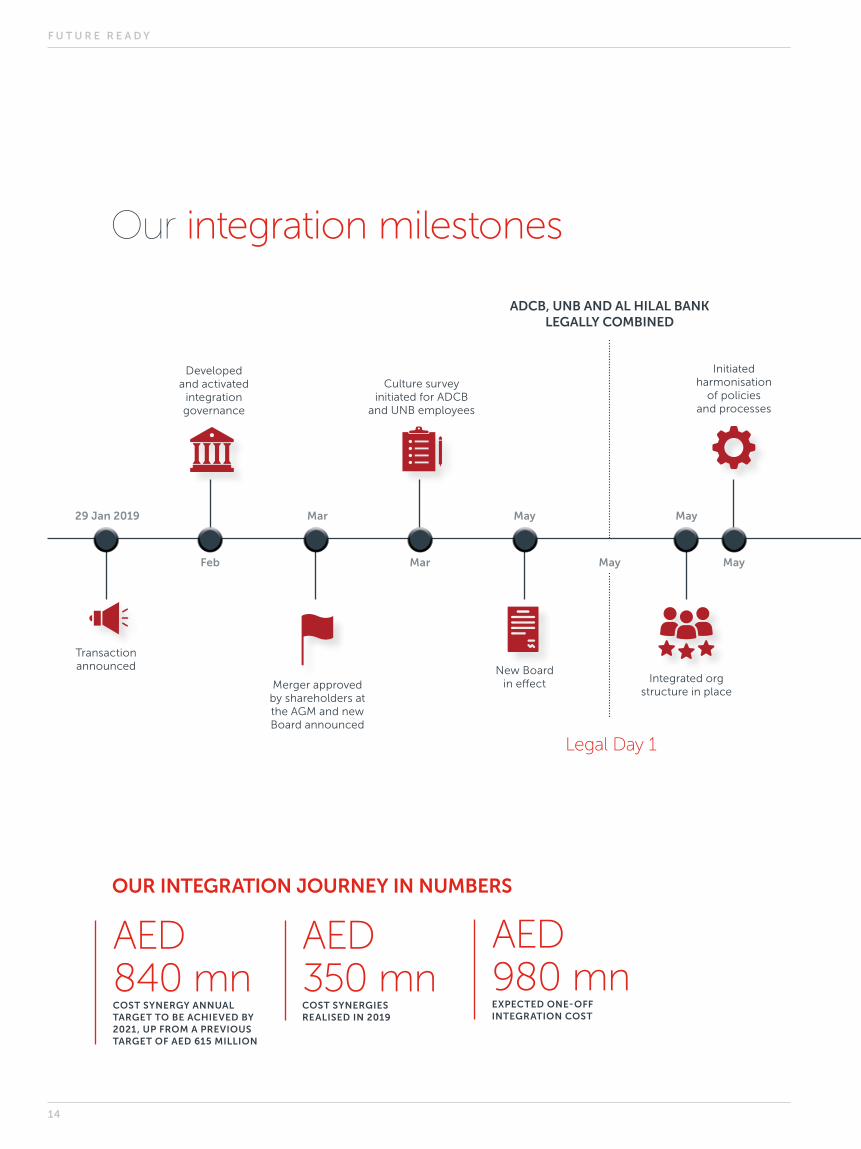
OUR INTEGRATION JOURNEY IN NUMBERS
AED 980 mnEXPECTED ONE-OFF INTEGRATION COST
AED 350 mnCOST SYNERGIES REALISED IN 2019
AED 840 mnCOST SYNERGY ANNUAL TARGET TO BE ACHIEVED BY 2021, UP FROM A PREVIOUS TARGET OF AED 615 MILLION
MarFeb May May
29 Jan 2019 Mar MayMay
Developed and activated
integration governance
Transactionannounced
Merger approved by shareholders at the AGM and new Board announced
New Board in effect
Culture survey initiated for ADCB
and UNB employees
Integrated org structure in place
Initiated harmonisation
of policies and processes
Legal Day 1
Our integration milestones
ADCB, UNB AND AL HILAL BANK LEGALLY COMBINED
F U T U R E R E A D Y
14

KEY NEXT STEPS FOR ADCB-UNB INTEGRATION
Continue IT infrastructure and applications
integration
Optimise subsidiaries and overseas branch
network
Continue implementation of cultural integration
initiatives
Oct
May July Sep OctOct
Completed integration of UNB and AHB
treasury portfolios
Completed migration of
AHB corporate portfolio
New CEO appointed for
AHB
Product range harmonised
Completed migration of AHB
SME portfolio
Branch & ATM network optimised;
and branch interoperability
activated
Rolled out the ADCB
brand across all customer
channels
Customer Day 1
A D C B 2 0 1 9 A N N U A L R E P O R T
15

ADCB Group at a glanceAn acknowledged leader in the UAE banking sector, ADCB creates value through a range of products and services that support more than a million customers.
ADCB follows a UAE-centric growth strategy, making a significant contribution to the economy and the communities we serve. Our best-in-class customer service and strong digital offerings help to propel us towards our goal, to be the number-one bank of choice in the UAE.
43%CONSUMER BANKING
GROUP
32%WHOLESALE BANKING
GROUP
23%TREASURY & INVESTMENTS
GROUP
2%PROPERTY MANAGEMENT
2019CONTRIBUTION TO
OPERATING INCOME
BUSINESS FUNCTIONS
Consumer Banking GroupWe support our retail and high-net-worth customers with a range of specialist products and services in conventional and Shari’ah-compliant banking.Read more about this on page 68
Wholesale Banking GroupOur portfolio of services includes business banking, cash management, trade finance, corporate finance, investment banking, Islamic financing, infrastructure and asset finance for clients that range from government-related entities (GREs) to financial institutions, large corporates, mid-sized corporates and small-to-medium-sized enterprises (SMEs).Read more about this on page 72
Treasury & Investments GroupWe provide central treasury operations, management of the Group’s investment portfolio and interest rate, currency and commodity derivative portfolio and Islamic financing. We undertake the Group’s funding and centralised risk management activities through borrowings, issue of debt securities and use of derivatives for risk management.Read more about this on page 81
Property ManagementOur Property Management business comprises the real estate management and engineering service operations of our subsidiaries, Abu Dhabi Commercial Properties LLC and Abu Dhabi Commercial Engineering Services LLC.Read more about this on page 82
SUPPORT FUNCTIONS
Group Business ServicesOur support and enablement service teams power the technology, operational processes, infrastructure and expertise that provides the secure and efficient environment on which our businesses depend.Read more about this on page 84
Human ResourcesWe engage our staff by facilitating a high-performing culture through our values and passion for customer service excellence. We also provide a range of training opportunities to develop the skills required to support our growing business.Read more about this on page 90
SUBSIDIARIESTo read more about our subsidiaries, please turn to page 44.
For a full list of all our subsidiaries, please turn to page 254.
F U T U R E R E A D Y
16

16.89%CAPITAL ADEQUACY RATIO
60.2%ABU DHABI
INVESTMENT COUNCIL
14.5%FREE-FLOAT FOREIGN INVESTORS
Ownership Structure
25.3%FREE-FLOAT DOMESTIC INVESTORS
By the numbers
A/A-1/StableS&P
A+/F1/StableFITCH
RATINGS:
AED 5.244 bnPRO FORMA NET PROFIT
16.89%CAPITAL ADEQUACY RATIO
72BRANCHES IN THE UAE
1mn+CUSTOMERS
AED 405 bn TOTAL ASSETS
A D C B 2 0 1 9 A N N U A L R E P O R T
17

OVERVIEW
F U T U R E R E A D Y
18

A D C B 2 0 1 9 A N N U A L R E P O R T
19
CHAIRMAN’S MESSAGE
On behalf of the ADCB Group Board of Directors, I am pleased to introduce ADCB’s Annual Report for 2019, which opened a new chapter in our history. The Bank successfully executed a complex combination without any disruption to business as usual.
EISSA MOHAMED ALSUWAIDI
CHAIRMAN
F U T U R E R E A D Y
20
The merger between ADCB and Union National Bank, and the subsequent acquisition of Al Hilal Bank was a landmark transaction. Our enlarged group has the strength and expertise to play a greater role in the country’s economic development. Within the UAE, the Bank has reinforced its position as the third-largest bank by assets, whilst we rank number five in the GCC region. With the addition of Al Hilal Bank, which is a wholly owned subsidiary, we have significantly strengthened our Islamic banking franchise.
The transaction has made ADCB a stronger, more resilient, bank with larger scale. The enlarged Bank has the capacity to invest significantly in its infrastructure and to remain at the forefront of our fast-changing industry. It will provide the excellence and convenience that customers demand, whilst staying ahead of an evolving regulatory environment.
The Bank continues to have diverse institutional ownership and has strong support from the Government. The Abu Dhabi Government, through the Abu Dhabi Investment Council, owns 60.2% of our shareholding. We also have a growing share of foreign investors. As of 31 December 2019, foreign shareholders owned almost 15% of the Bank’s share capital.
STRATEGIC FOCUSThe five pillars of our strategy are the driving force of our success. We remain focused on the UAE economy and delivering superior customer experience. We continue to promote sustainability
through liability growth and funding diversification, whilst managing risk effectively. Finally, digital transformation remains a key pillar for our growth.
Digital also plays a central part in our strategy for Al Hilal Bank. Through Al Hilal Bank, the group will expand its Islamic banking footprint and capture a growing population who want to use Shari’ah-compliant digital retail products.
Our strategy is enabled by attracting and rewarding the best talent while nurturing an agile organisation and a healthy culture.
STRONG CULTUREIt is part of our responsibility as a Board to encourage and nurture an active and healthy corporate culture across the Bank. Your Board was very pleased to note that an external assessment reported that the Bank’s culture rates favourably as against companies worldwide. We believe that, beyond any other factors within its own control, culture and organisational health is the strongest driver of a corporate’s capacity for success.
Our values remain intact following the merger and work has begun on a series of initiatives to reinforce the strength of our culture and further improve organisational health. This will include continuing to enhance our performance-oriented and merit-based culture and to continue to invest in learning and development programmes.
RECOMMENDED CASH DIVIDEND OF AED 0.38 PER SHARE1
Equivalent to 50% of pro forma net profit
1 Subject to approval by shareholders at the Annual General Meeting.
A D C B 2 0 1 9 A N N U A L R E P O R T
21

SUCCESSFUL INTEGRATIONThe smooth passage of the integration process was the result of many factors, including the strength of our governance framework. We established a solid integration governance framework and created a masterplan to ensure best practice was followed throughout the integration process.
However, the key factor, driven by our strong culture and values, was the meticulous planning and intensive efforts by the staff and consultants involved. The integration process involved all of the Bank’s staff and every employee played a part in ensuring its success.
EMIRATISATIONA core element of our strategy is to attract and reward suitable talent, with a particular focus on UAE Nationals. The Board is pleased that ADCB has consistently met the Emiratisation targets set by the UAE Central Bank and that Al Hilal Bank has the highest percentage of UAE National employees across the sector.
The Board is also pleased that, following the merger, many UAE National staff continue to occupy roles within the Bank’s senior management.
RECOMMENDED DIVIDENDDespite the challenges presented by the global economy, we delivered a creditable financial performance in 2019. The Board remains focused on creating value for shareholders and we are confident that by executing our strategy and delivering efficiencies, we will continue to drive sustainable growth. For the 2019 financial year, the Board has recommended a cash dividend of AED 0.38 per share. This translates to a payout of AED 2.644 billion, equivalent to 50% of pro forma net profit. This dividend payment is subject to approval at the Annual General Meeting.
THE BOARD This year, the composition of the Board was changed. We want to express our thanks to those Board members who stepped down during the year and to wish them good fortune in their future endeavours. They all contributed significantly to the success of the Bank over the past few years.
The Board welcomes the appointment of our new independent non-executive directors during 2019 and wishes them the very best in serving the Bank in future.
We held 54 full Board or Committee meetings in 2019. During those meetings your Directors engaged constructively with management, guiding and challenging their decisions in a spirit of openness
and transparency. The Board consistently emphasises the importance of governance and culture throughout our communication.
LOOKING AHEADAs we continue to pursue profitable growth and capitalise on the scale of our business, the local markets will remain challenging. In particular, geopolitical factors are likely to continue to influence local markets, including hydrocarbon prices. Within these conditions it is important that we follow our strategy in a disciplined manner, focusing our efforts around our core market of the UAE, and managing risk effectively.
Meanwhile, we will continue our investments in technology and infrastructure to support our digital transformation and enhance customer experience.
We will reinforce and deepen our culture and focus on governance and continue to invest in our talent, particularly UAE Nationals, to ensure ADCB remains an employer of choice in the UAE.
OUR THANKSOn behalf of the Board and all at ADCB, I extend our most sincere appreciation and gratitude to His Highness Sheikh Khalifa Bin Zayed Al Nahyan, the UAE President and Ruler of Abu Dhabi; to His Highness Sheikh Mohammed Bin Zayed Al Nahyan, Crown Prince of Abu Dhabi and Deputy Supreme Commander of the UAE Armed Forces; to His Highness Sheikh Mansour Bin Zayed Al Nahyan, Deputy Prime Minister and Minister of Presidential Affairs; and to the UAE Central Bank.
The Board would also like to thank our shareholders, every one of our valued customers — both existing and new — our incoming and outgoing Board members, the ADCB executive management team and all our staff for their continued dedication and support.
In particular, the Board extends its appreciation to everyone, including staff, senior management and consultants, who helped with the merger and integration process, creating a bank that is ready for whatever the future may hold.
EISSA MOHAMED ALSUWAIDI
CHAIRMAN
F U T U R E R E A D Y
22

“A core element of our strategy is to attract and reward suitable talent, with a particular focus on UAE Nationals.”
A D C B 2 0 1 9 A N N U A L R E P O R T
23
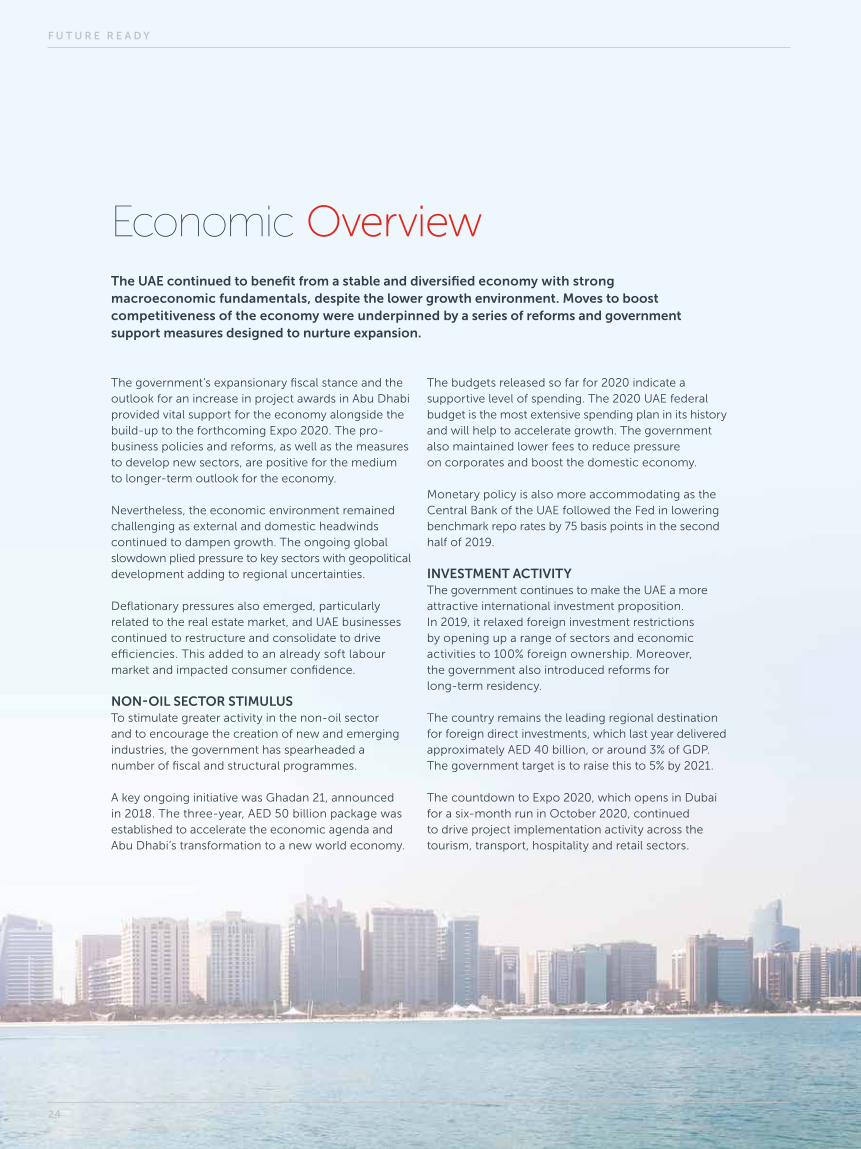
Economic OverviewThe UAE continued to benefit from a stable and diversified economy with strong macroeconomic fundamentals, despite the lower growth environment. Moves to boost competitiveness of the economy were underpinned by a series of reforms and government support measures designed to nurture expansion.
The government’s expansionary fiscal stance and the outlook for an increase in project awards in Abu Dhabi provided vital support for the economy alongside the build-up to the forthcoming Expo 2020. The pro-business policies and reforms, as well as the measures to develop new sectors, are positive for the medium to longer-term outlook for the economy.
Nevertheless, the economic environment remained challenging as external and domestic headwinds continued to dampen growth. The ongoing global slowdown plied pressure to key sectors with geopolitical development adding to regional uncertainties.
Deflationary pressures also emerged, particularly related to the real estate market, and UAE businesses continued to restructure and consolidate to drive efficiencies. This added to an already soft labour market and impacted consumer confidence.
NON-OIL SECTOR STIMULUSTo stimulate greater activity in the non-oil sector and to encourage the creation of new and emerging industries, the government has spearheaded a number of fiscal and structural programmes.
A key ongoing initiative was Ghadan 21, announced in 2018. The three-year, AED 50 billion package was established to accelerate the economic agenda and Abu Dhabi’s transformation to a new world economy.
The budgets released so far for 2020 indicate a supportive level of spending. The 2020 UAE federal budget is the most extensive spending plan in its history and will help to accelerate growth. The government also maintained lower fees to reduce pressure on corporates and boost the domestic economy.
Monetary policy is also more accommodating as the Central Bank of the UAE followed the Fed in lowering benchmark repo rates by 75 basis points in the second half of 2019.
INVESTMENT ACTIVITYThe government continues to make the UAE a more attractive international investment proposition. In 2019, it relaxed foreign investment restrictions by opening up a range of sectors and economic activities to 100% foreign ownership. Moreover, the government also introduced reforms for long-term residency.
The country remains the leading regional destination for foreign direct investments, which last year delivered approximately AED 40 billion, or around 3% of GDP. The government target is to raise this to 5% by 2021.
The countdown to Expo 2020, which opens in Dubai for a six-month run in October 2020, continued to drive project implementation activity across the tourism, transport, hospitality and retail sectors.
F U T U R E R E A D Y
24
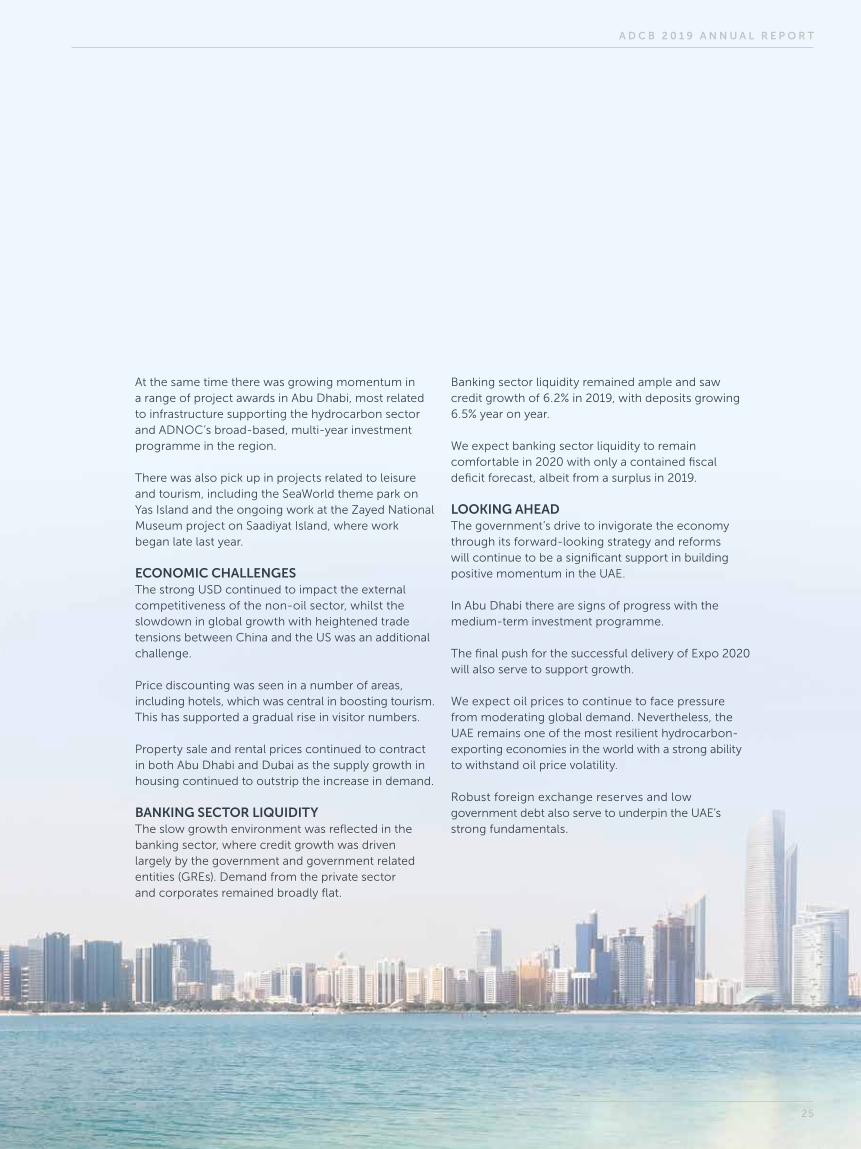
At the same time there was growing momentum in a range of project awards in Abu Dhabi, most related to infrastructure supporting the hydrocarbon sector and ADNOC’s broad-based, multi-year investment programme in the region.
There was also pick up in projects related to leisure and tourism, including the SeaWorld theme park on Yas Island and the ongoing work at the Zayed National Museum project on Saadiyat Island, where work began late last year.
ECONOMIC CHALLENGESThe strong USD continued to impact the external competitiveness of the non-oil sector, whilst the slowdown in global growth with heightened trade tensions between China and the US was an additional challenge.
Price discounting was seen in a number of areas, including hotels, which was central in boosting tourism. This has supported a gradual rise in visitor numbers.
Property sale and rental prices continued to contract in both Abu Dhabi and Dubai as the supply growth in housing continued to outstrip the increase in demand.
BANKING SECTOR LIQUIDITYThe slow growth environment was reflected in the banking sector, where credit growth was driven largely by the government and government related entities (GREs). Demand from the private sector and corporates remained broadly flat.
Banking sector liquidity remained ample and saw credit growth of 6.2% in 2019, with deposits growing 6.5% year on year.
We expect banking sector liquidity to remain comfortable in 2020 with only a contained fiscal deficit forecast, albeit from a surplus in 2019.
LOOKING AHEADThe government’s drive to invigorate the economy through its forward-looking strategy and reforms will continue to be a significant support in building positive momentum in the UAE.
In Abu Dhabi there are signs of progress with the medium-term investment programme.
The final push for the successful delivery of Expo 2020 will also serve to support growth.
We expect oil prices to continue to face pressure from moderating global demand. Nevertheless, the UAE remains one of the most resilient hydrocarbon-exporting economies in the world with a strong ability to withstand oil price volatility.
Robust foreign exchange reserves and low government debt also serve to underpin the UAE’s strong fundamentals.
A D C B 2 0 1 9 A N N U A L R E P O R T
25
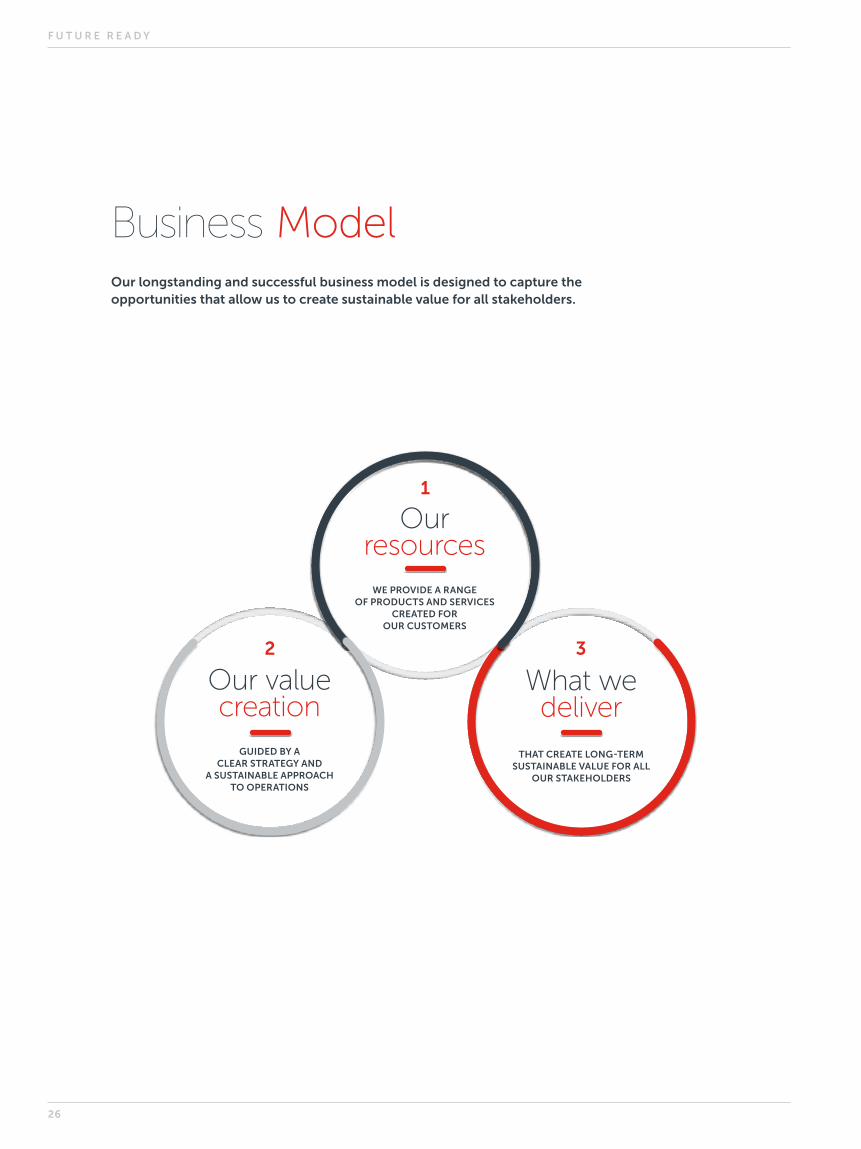
Business ModelOur longstanding and successful business model is designed to capture the opportunities that allow us to create sustainable value for all stakeholders.
Our value creation
GUIDED BY A CLEAR STRATEGY AND
A SUSTAINABLE APPROACH TO OPERATIONS
What we deliver
THAT CREATE LONG-TERM SUSTAINABLE VALUE FOR ALL
OUR STAKEHOLDERS
Our resources
WE PROVIDE A RANGE OF PRODUCTS AND SERVICES
CREATED FOR OUR CUSTOMERS
32
1
F U T U R E R E A D Y
26
OUR RESOURCES LeadershipAn experienced Board supported by a highly-skilled senior leadership team.
EmployeesWe have highly-skilled employees from 82 nations, united by shared values and an agile culture. 1,479 of our workforce are UAE Nationals.
BrandA leading UAE bank with a growing customer base and an unrivaled reputation.
ExpertiseAn in-depth knowledge of the UAE market and economy to help customers realise their ambitions.
StrengthA resilient bank, with more than AED 405 billion in total assets, robust liquidity, and top tier international ratings.
InnovationDigital technological strength and capability for an outstanding customer experience.
WHAT WE DELIVER Banking products and services for a diverse customer base through our four business segments:
Wholesale Banking Group Consumer Banking Group Treasury and Investments Group Property Management
OUR VALUE CREATION EmployeesFulfilling careers, competitive benefits and rewards with professional development.
CustomersProtecting and growing the wealth of more than a million customers, from individuals, SMEs and large corporates through to GREs and the government.
SocietyWe play a supporting role in the socio-economic development of the country. Guided by the vision of the UAE leadership, the Bank is fully committed to initiatives that create a diversified, sustainable economy.
InvestorsDelivering robust returns and long-term sustainable value. In 2019, the Bank reported AED 5.244 billion pro forma net profit with a return on average tangible equity of 11.2%.
Regulators/GovernmentEngaging with relevant authorities to support a responsible regulatory framework.
PartnersPartnering with numerous suppliers, providing them with new business opportunities and timely payments.
A D C B 2 0 1 9 A N N U A L R E P O R T
27

STRATEGY
F U T U R E R E A D Y
28

A D C B 2 0 1 9 A N N U A L R E P O R T
29
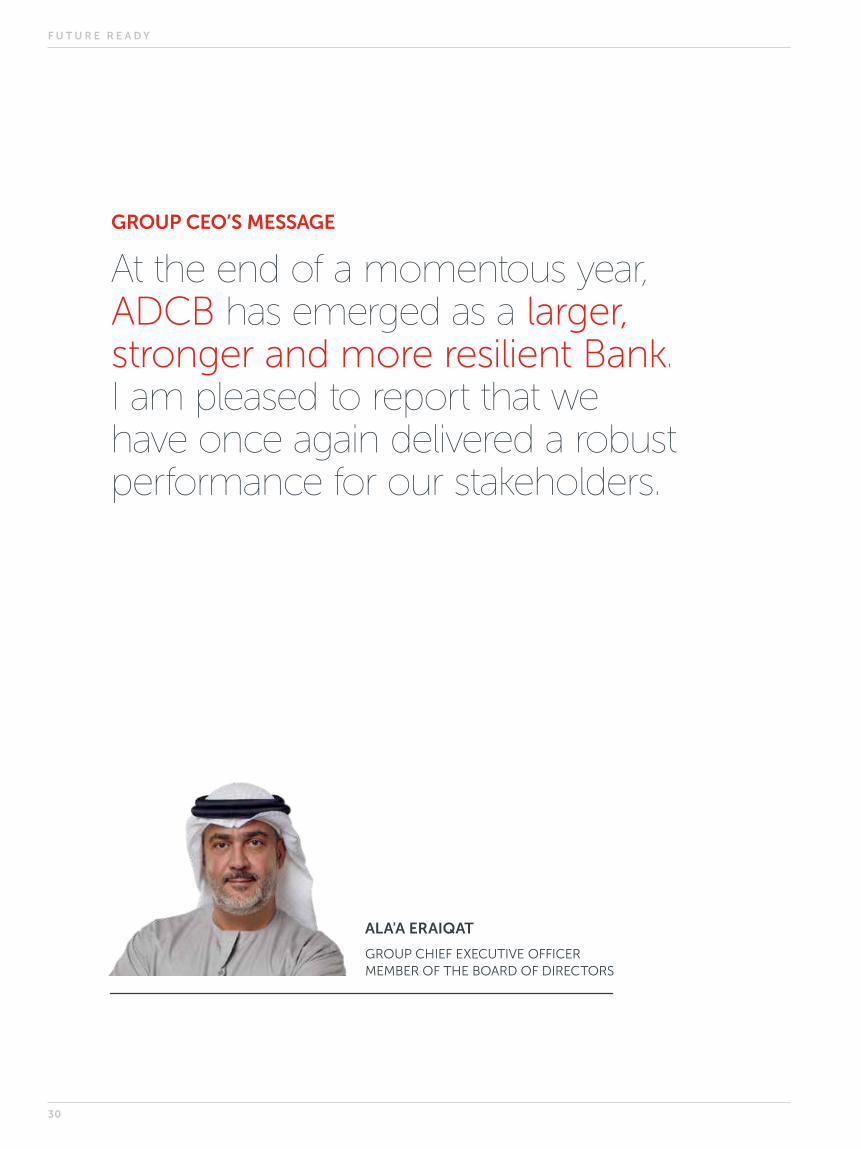
GROUP CEO’S MESSAGE
At the end of a momentous year, ADCB has emerged as a larger, stronger and more resilient Bank. I am pleased to report that we have once again delivered a robust performance for our stakeholders.
ALA'A ERAIQAT
GROUP CHIEF EXECUTIVE OFFICER MEMBER OF THE BOARD OF DIRECTORS
F U T U R E R E A D Y
30
With a full-year pro forma net profit of AED 5.244 billion, we delivered a double-digit return on average tangible equity of 11.2% and a dividend pay-out equivalent to 50% of pro forma net profit.1
These figures are only part of our story in 2019. We began the year merging with Union National Bank. Together, the combined entity acquired Al Hilal Bank, which has allowed us to build an even stronger Islamic banking franchise in the UAE.
We appointed a new CEO at Al Hilal Bank and activated a detailed strategy to create a leading digital-first Islamic retail bank. As part of this strategy, the migration of Al Hilal Bank’s Wholesale Banking and SME portfolios was fast-tracked into the ADCB Islamic Wholesale Banking platform in just a few months.
We worked on a bank-wide seamless integration process, rapidly moving ahead of schedule and driving substantial cost synergies along the way. Meanwhile, we continued to provide exceptional service standards to a growing customer base, while continuing to develop our people, businesses and technology.
The enhanced strength and scale we now have empowers us to do more to support the ambitions of the UAE and our stakeholders. It means we can provide customers with more support through our range of products and services, we can do more to help businesses to thrive, we can invest more in our people and technology, and we can deliver stronger returns to our investors.
I am proud to have been part of such a tremendous journey undertaken at such a powerful pace. It is a true demonstration of what can be achieved through a clear strategy, hard work and ambition.
EMIRATI EXCELLENCE Empowering UAE Nationals is a top priority at the Bank. We are dedicated to making our organisation a centre of excellence for Emiratis, providing a pathway to senior leadership positions. Today, the ADCB Group employs 1,479 UAE Nationals, who occupy roles at every level. Meanwhile, at Al Hilal Bank, 48% of the staff are Emirati — the highest among all UAE banks.
ADCB has consistently exceeded the Emiratisation targets set by the UAE Central Bank. We believe that by nurturing our national talent, we are also nurturing the Bank and the UAE economy.
UNIFIED AND ENHANCEDThe integration process that followed our merger in May set new records compared to regional peer benchmarks. Working together, we achieved branch interoperability and completed a significant rebranding exercise in just five months. It was a stellar performance.
Through detailed planning and preparation, we were able to seamlessly combine and optimise the entire ADCB and UNB branch and ATM networks in early October. We also rolled out the ADCB brand across all physical and digital channels. This was achieved in a window of just 40 hours, enabling us to provide a unified and enhanced experience to more than one million customers.
1,479EMIRATIS EMPLOYED ACROSS THE GROUP
48%EMIRATISATION RATE AT AL HILAL BANK
1 Subject to approval by shareholders at the Annual General Meeting.
A D C B 2 0 1 9 A N N U A L R E P O R T
31

The speed and efficiency of the transition were helped by strong collaboration between teams and disciplined governance. It was empowered by our people and a deep-seated commitment to our exceptional culture and strong values of integrity, care, discipline, respect and ambition. Teams from across the Bank came together like never before, smashing silos and overcoming each new challenge that came their way.
We all had a role to play. For some, it was about calling on their considerable skills and experience to manage unprecedented change at a rapid pace. For others, it was about harmonising systems, processes and policies to pave the way for a flawless integration process. For others still, it was about ensuring that no matter what else was happening, it was business as usual for all our customers who have come to expect exceptional service as standard.
EMPOWERING SUSTAINABLE GROWTHOur success has been driven by our commitment to a strategy that remains consistent, clear and compelling. Our five powerful strategic pillars support our enduring growth. ADCB remains a UAE-centric Bank, providing long-term sustainability through liability growth and an outstanding customer experience.
This is reflected in the AED 7.3 billion increase in our current and savings account (CASA) deposits over 2018, which totalled AED 102 billion in 2019. In a highly-competitive market with declining interest rates, this was a significant achievement, and testament to the confidence that customers continue to place in ADCB.
By continuing to be risk-aware and harnessing the power of digitisation, we will create the most valuable and resilient bank in the UAE and achieve our ambition of becoming the number-one bank of choice.
CUSTOMER EXCELLENCE We lead the way in our collective passion for customer experience, delivered through service excellence. That is one of the reasons that, despite the enormous challenges the integration process brought, we never lost sight of our customers and their needs.
It is important to acknowledge that while the Bank has relished and embraced the multitude of changes that have come with transformation, some things remain the same.
Our ambition to continue to do more for our customers and to make banking simpler, easier and more secure remains unchanged. We are committed to helping them by delivering outstanding customer service, world-class products and cutting-edge digital access.
PRO FORMA NET PROFIT
AED 5.244 bn
TOTAL ASSETS
AED 405 bn
F U T U R E R E A D Y
32
DIGITAL STRENGTHA core pillar of our successful strategy is to exploit digital for growth and efficiency. The progress of our transformation remains strong, and we continued to enhance existing platforms as well as launching new initiatives in 2019.
We unveiled Hayyak, our intuitive onboarding app that makes account opening simpler and faster. We were the first bank in the UAE to introduce a Virtual Accounts service to help companies reduce the costs and complexities of cash management, and the first to run an end-to-end blockchain trade finance transaction in the country.
Our collaboration with a range of fintechs and their ecosystems has also stimulated digital innovation, helping us to bring added value and efficiencies through these strategic partnerships.
ETHICAL AND SOCIAL BANKINGAs a responsible bank, we believe in clear communication and being open and honest with our customers and our staff. Our group-wide ethical banking initiative has delivered greater clarity and transparency in areas such as terms and conditions, fees and charges, and our processes.
This has already changed the way we communicate with customers. Many physical letters were replaced with more concise and tailored emails and SMS messages, which bring greater transparency for customers to enable faster and easier banking.
We are committed to raising financial literacy and awareness amongst young adults in the UAE, encouraging the adoption of responsible lending and sound fiscal management practices. In doing so, we hope to ensure a stronger economic future for generations to come. Our longstanding partnership with local organisations continues to support this vital objective, as does the success of our MoneySense programme.
FUTURE READYThis year was a powerful demonstration of what we can achieve by working together, and I am proud of our accomplishments. We are now better placed than ever to meet the challenges and to capture the opportunities that the future holds.
The long-term outlook for the UAE economy is positive and will be driven by continued investment in social and economic initiatives to promote sustainable growth. As a significant financial institution in the UAE, ADCB fully supports these developments to create lasting positive change for the benefit of our stakeholders and the wider community.
I want to thank the Chairman, members of the Board and the executive management team for their support this year. I also want to acknowledge all of our employees who have worked so hard at every level to achieve our success.
IN MEMORY OF SIDDIQA ABBASIt is with great sadness that I also report our colleague Siddiqa Abbas, Group Chief Operations Officer, passed away in February 2020. She was a key member of the senior leadership team, who made a significant contribution to ADCB for more than 15 years. During her time with the Bank, she served in a variety of roles and was an inspiration to everyone she worked with. We all pray for the eternal peace of her departed soul.
ALA'A ERAIQATGROUP CHIEF EXECUTIVE OFFICER MEMBER OF THE BOARD OF DIRECTORS
A D C B 2 0 1 9 A N N U A L R E P O R T
33

Group StrategyOur long-term strategy is a critical component of our robust performance as the ADCB Group continues to grow in scale. The five core pillars which support this strategy remain clear and consistent.
By retaining our focus on delivering these strategic goals, living our shared values, and capitalising on our enablers, we have created a resilient organisation, empowered by innovation, excellence, and outstanding customer service.
F U T U R E R E A D Y
34
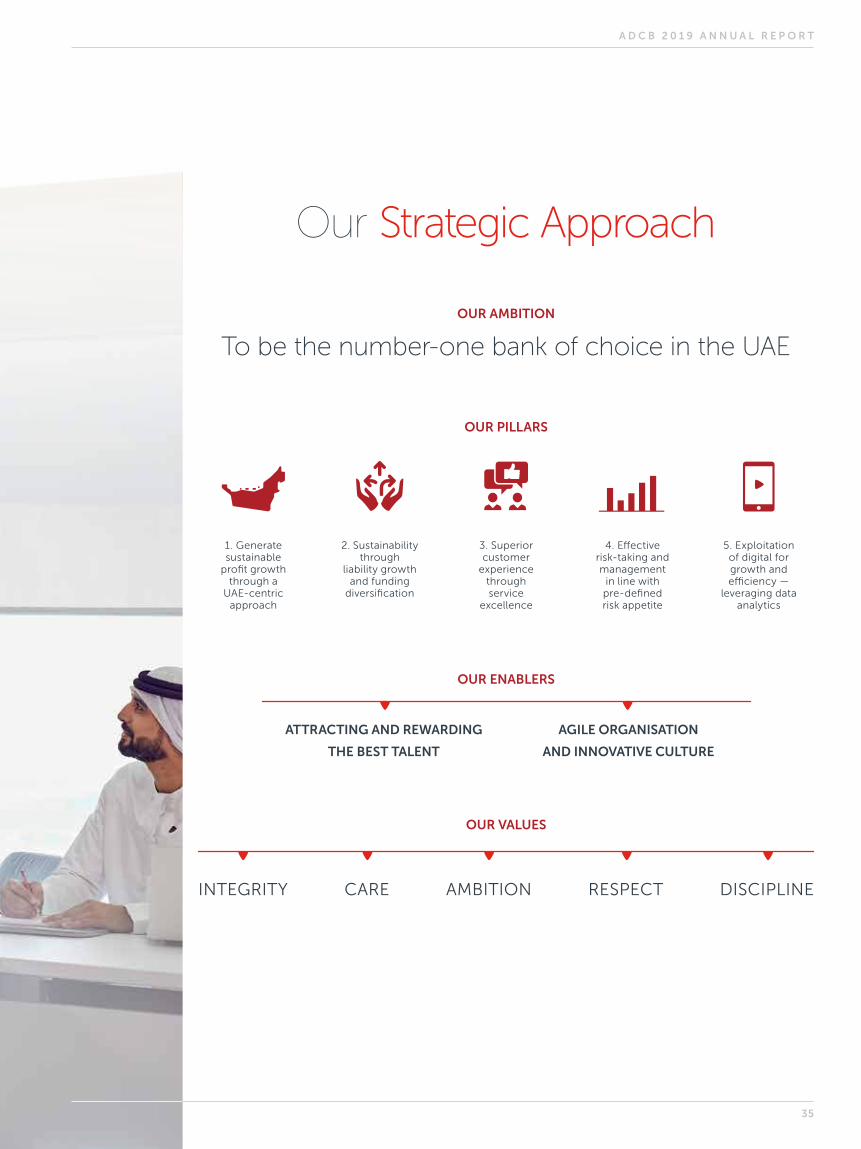
Our Strategic Approach
OUR AMBITION
OUR PILLARS
1. Generate sustainable
profit growth through a
UAE-centric approach
4. Effective risk-taking and management
in line with pre-defined risk appetite
3. Superior customer
experience through service
excellence
5. Exploitation of digital for growth and efficiency —
leveraging data analytics
2. Sustainability through
liability growth and funding
diversification
To be the number-one bank of choice in the UAE
OUR ENABLERS
ATTRACTING AND REWARDING
THE BEST TALENT
AGILE ORGANISATION
AND INNOVATIVE CULTURE
OUR VALUES
INTEGRITY CARE AMBITION RESPECT DISCIPLINE
A D C B 2 0 1 9 A N N U A L R E P O R T
35
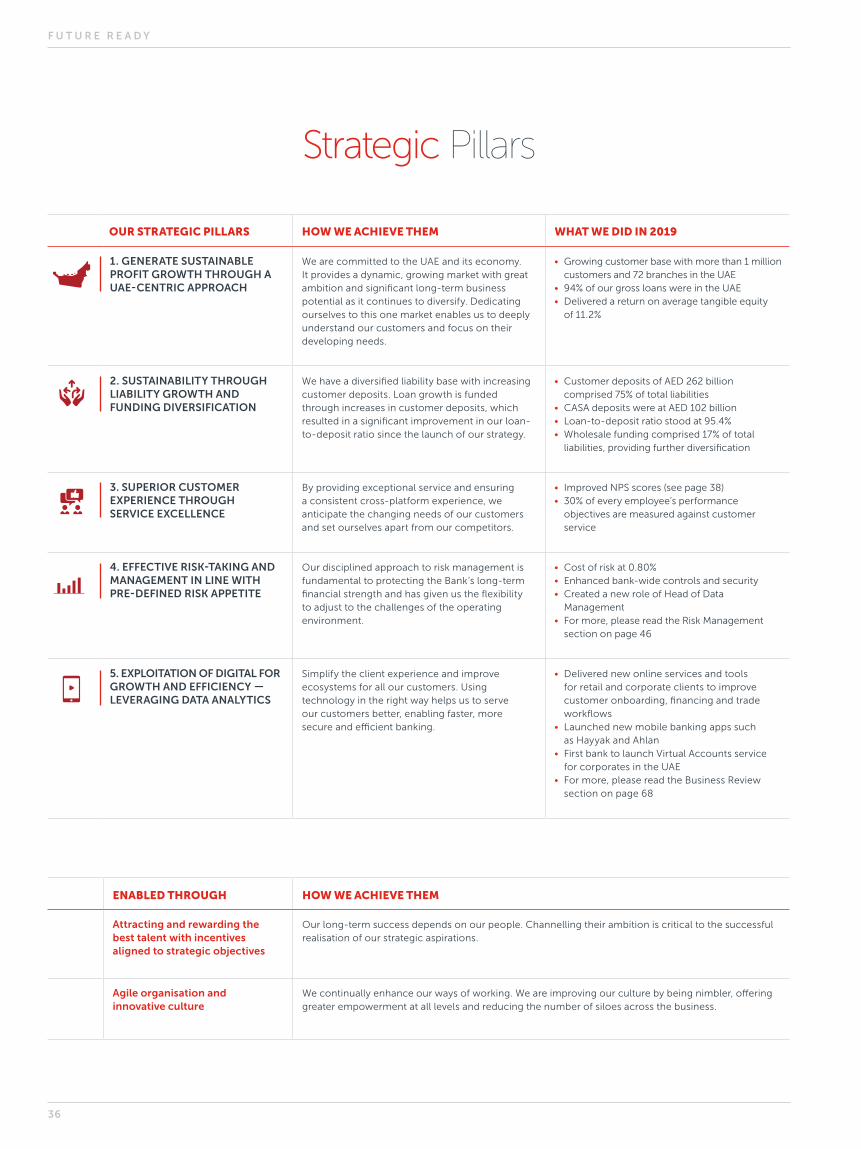
Strategic Pillars
OUR STRATEGIC PILLARS HOW WE ACHIEVE THEM WHAT WE DID IN 2019
1. GENERATE SUSTAINABLE PROFIT GROWTH THROUGH A UAE-CENTRIC APPROACH
We are committed to the UAE and its economy. It provides a dynamic, growing market with great ambition and significant long-term business potential as it continues to diversify. Dedicating ourselves to this one market enables us to deeply understand our customers and focus on their developing needs.
• Growing customer base with more than 1 million customers and 72 branches in the UAE
• 94% of our gross loans were in the UAE• Delivered a return on average tangible equity
of 11.2%
2. SUSTAINABILITY THROUGH LIABILITY GROWTH AND FUNDING DIVERSIFICATION
We have a diversified liability base with increasing customer deposits. Loan growth is funded through increases in customer deposits, which resulted in a significant improvement in our loan-to-deposit ratio since the launch of our strategy.
• Customer deposits of AED 262 billion comprised 75% of total liabilities
• CASA deposits were at AED 102 billion• Loan-to-deposit ratio stood at 95.4%• Wholesale funding comprised 17% of total
liabilities, providing further diversification
3. SUPERIOR CUSTOMER EXPERIENCE THROUGH SERVICE EXCELLENCE
By providing exceptional service and ensuring a consistent cross-platform experience, we anticipate the changing needs of our customers and set ourselves apart from our competitors.
• Improved NPS scores (see page 38)• 30% of every employee’s performance
objectives are measured against customer service
4. EFFECTIVE RISK-TAKING AND MANAGEMENT IN LINE WITH PRE-DEFINED RISK APPETITE
Our disciplined approach to risk management is fundamental to protecting the Bank’s long-term financial strength and has given us the flexibility to adjust to the challenges of the operating environment.
• Cost of risk at 0.80% • Enhanced bank-wide controls and security• Created a new role of Head of Data
Management• For more, please read the Risk Management
section on page 46
5. EXPLOITATION OF DIGITAL FOR GROWTH AND EFFICIENCY — LEVERAGING DATA ANALYTICS
Simplify the client experience and improve ecosystems for all our customers. Using technology in the right way helps us to serve our customers better, enabling faster, more secure and efficient banking.
• Delivered new online services and tools for retail and corporate clients to improve customer onboarding, financing and trade workflows
• Launched new mobile banking apps such as Hayyak and Ahlan
• First bank to launch Virtual Accounts service for corporates in the UAE
• For more, please read the Business Review section on page 68
ENABLED THROUGH HOW WE ACHIEVE THEM
Attracting and rewarding the best talent with incentives aligned to strategic objectives
Our long-term success depends on our people. Channelling their ambition is critical to the successful realisation of our strategic aspirations.
Agile organisation and innovative culture
We continually enhance our ways of working. We are improving our culture by being nimbler, offering greater empowerment at all levels and reducing the number of siloes across the business.
F U T U R E R E A D Y
36
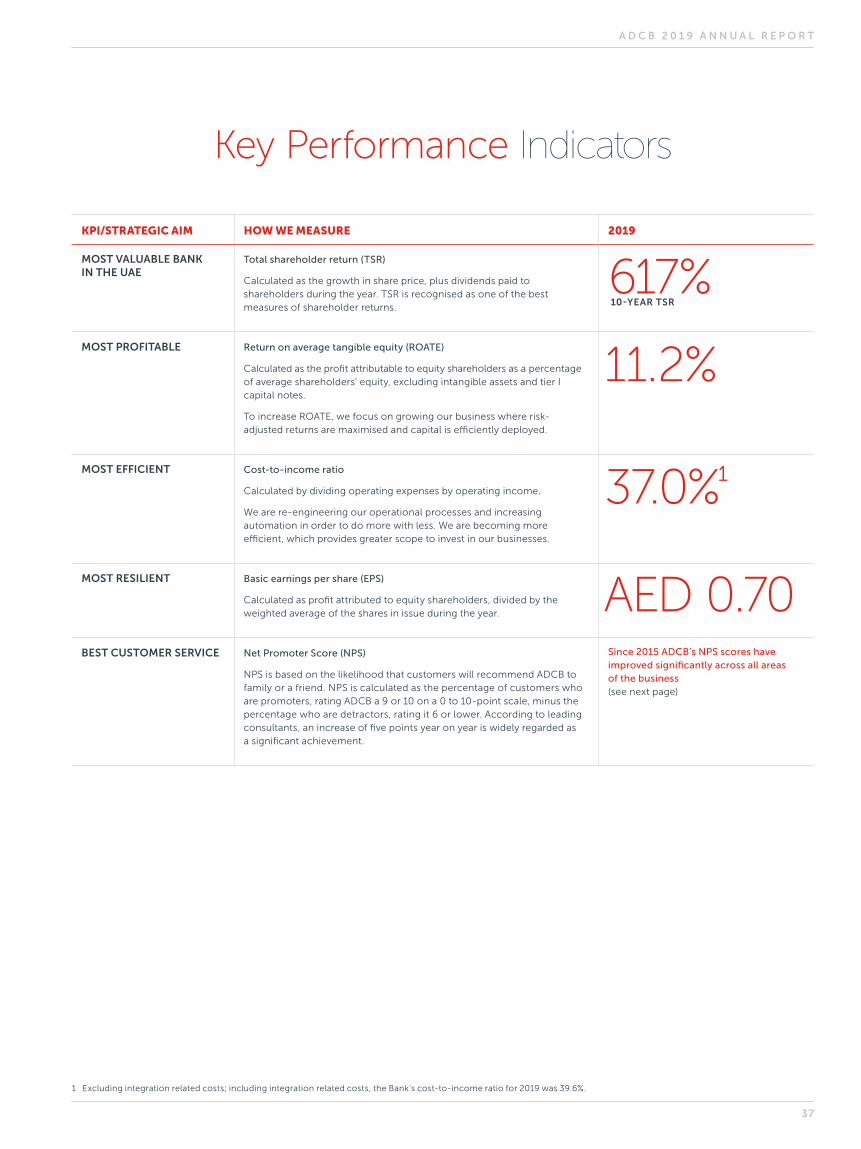
Key Performance Indicators
KPI/STRATEGIC AIM HOW WE MEASURE 2019
MOST VALUABLE BANK IN THE UAE
Total shareholder return (TSR)
Calculated as the growth in share price, plus dividends paid to shareholders during the year. TSR is recognised as one of the best measures of shareholder returns.
617% 10-YEAR TSR
MOST PROFITABLE Return on average tangible equity (ROATE)
Calculated as the profit attributable to equity shareholders as a percentage of average shareholders’ equity, excluding intangible assets and tier I capital notes.
To increase ROATE, we focus on growing our business where risk-adjusted returns are maximised and capital is efficiently deployed.
11.2%
MOST EFFICIENT Cost-to-income ratio
Calculated by dividing operating expenses by operating income.
We are re-engineering our operational processes and increasing automation in order to do more with less. We are becoming more efficient, which provides greater scope to invest in our businesses.
37.0%1
MOST RESILIENT Basic earnings per share (EPS)
Calculated as profit attributed to equity shareholders, divided by the weighted average of the shares in issue during the year. AED 0.70
BEST CUSTOMER SERVICE Net Promoter Score (NPS)
NPS is based on the likelihood that customers will recommend ADCB to family or a friend. NPS is calculated as the percentage of customers who are promoters, rating ADCB a 9 or 10 on a 0 to 10-point scale, minus the percentage who are detractors, rating it 6 or lower. According to leading consultants, an increase of five points year on year is widely regarded as a significant achievement.
Since 2015 ADCB’s NPS scores have improved significantly across all areas of the business (see next page)
1 Excluding integration related costs; including integration related costs, the Bank's cost-to-income ratio for 2019 was 39.6%.
A D C B 2 0 1 9 A N N U A L R E P O R T
37
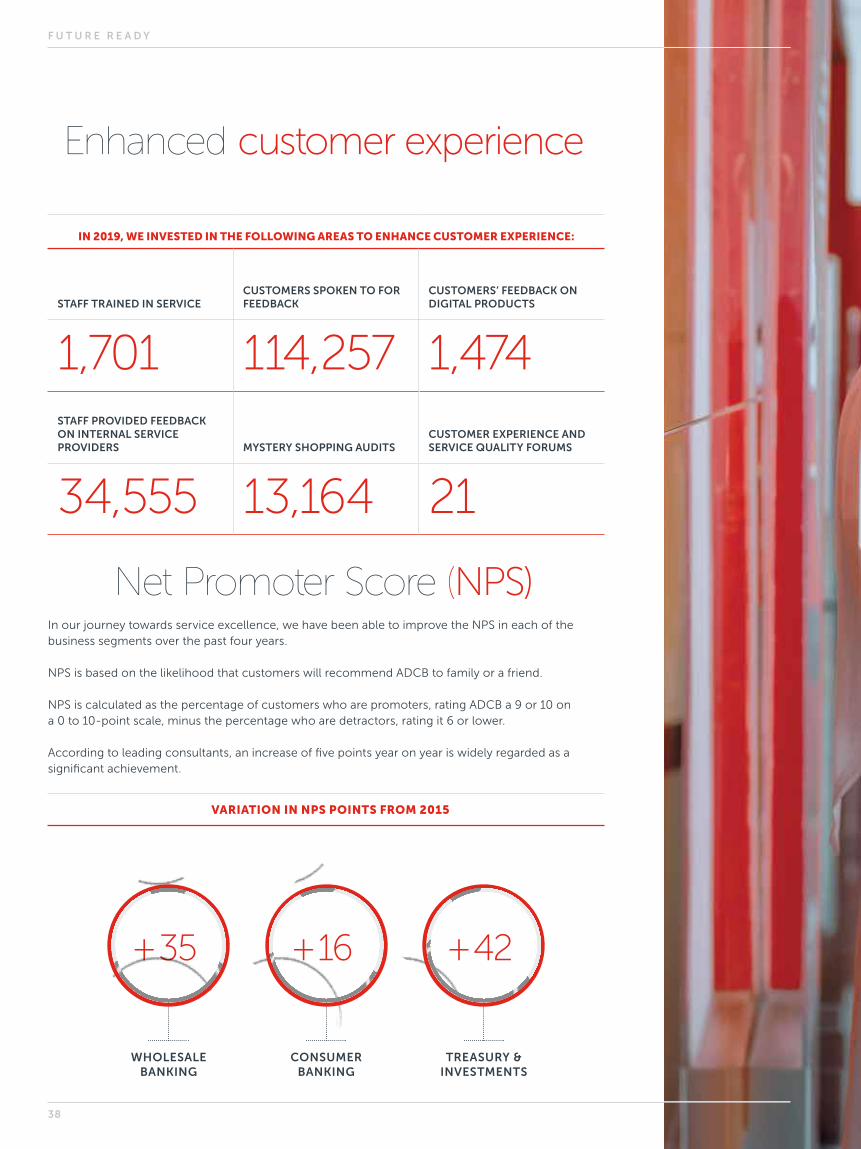
Enhanced customer experience
Net Promoter Score (NPS)
IN 2019, WE INVESTED IN THE FOLLOWING AREAS TO ENHANCE CUSTOMER EXPERIENCE:
STAFF TRAINED IN SERVICECUSTOMERS SPOKEN TO FOR FEEDBACK
CUSTOMERS’ FEEDBACK ON DIGITAL PRODUCTS
1,701 114,257 1,474STAFF PROVIDED FEEDBACK ON INTERNAL SERVICE PROVIDERS MYSTERY SHOPPING AUDITS
CUSTOMER EXPERIENCE AND SERVICE QUALITY FORUMS
34,555 13,164 21
VARIATION IN NPS POINTS FROM 2015
In our journey towards service excellence, we have been able to improve the NPS in each of the business segments over the past four years.
NPS is based on the likelihood that customers will recommend ADCB to family or a friend.
NPS is calculated as the percentage of customers who are promoters, rating ADCB a 9 or 10 on a 0 to 10-point scale, minus the percentage who are detractors, rating it 6 or lower.
According to leading consultants, an increase of five points year on year is widely regarded as a significant achievement.
WHOLESALE BANKING
CONSUMER BANKING
TREASURY & INVESTMENTS
+ 35 + 16 + 42
F U T U R E R E A D Y
38

39
A D C B 2 0 1 9 A N N U A L R E P O R T
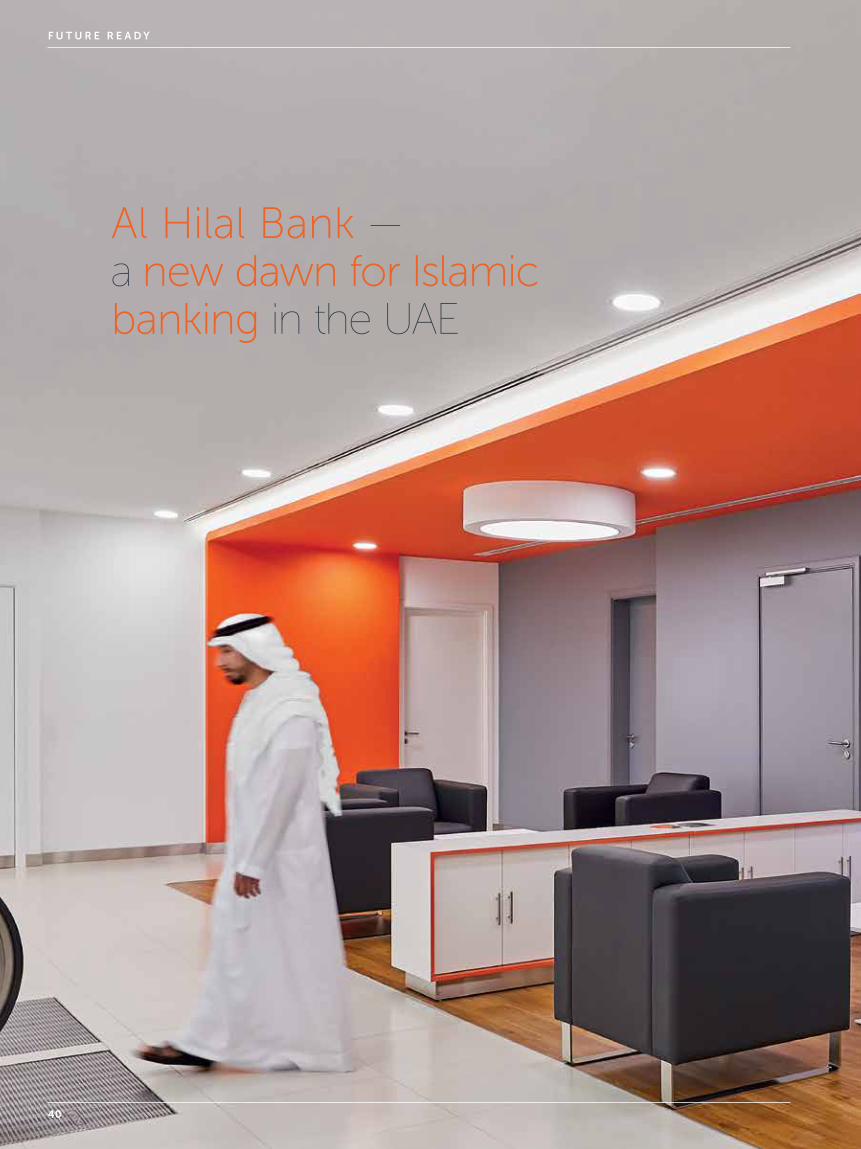
Al Hilal Bank — a new dawn for Islamic banking in the UAE
40
F U T U R E R E A D Y
41
A D C B 2 0 1 9 A N N U A L R E P O R T
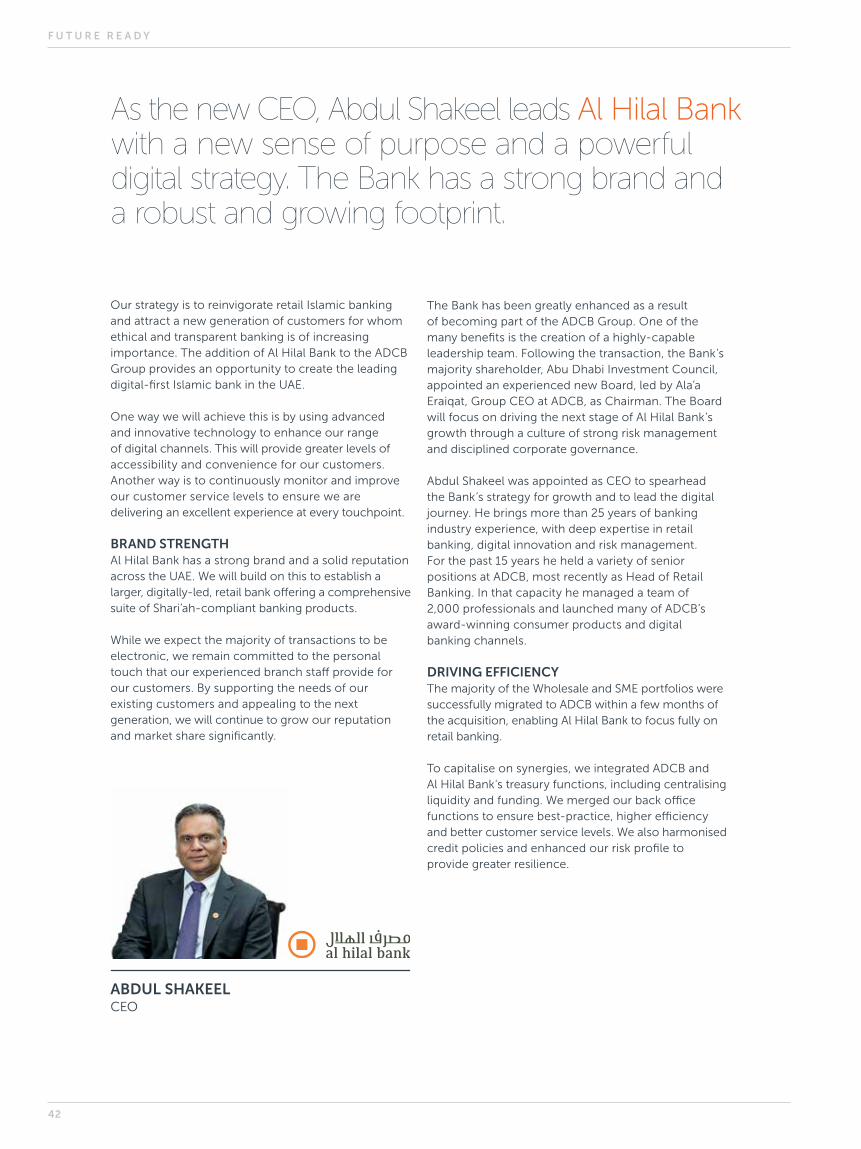
ABDUL SHAKEELCEO
Our strategy is to reinvigorate retail Islamic banking and attract a new generation of customers for whom ethical and transparent banking is of increasing importance. The addition of Al Hilal Bank to the ADCB Group provides an opportunity to create the leading digital-first Islamic bank in the UAE.
One way we will achieve this is by using advanced and innovative technology to enhance our range of digital channels. This will provide greater levels of accessibility and convenience for our customers. Another way is to continuously monitor and improve our customer service levels to ensure we are delivering an excellent experience at every touchpoint.
BRAND STRENGTHAl Hilal Bank has a strong brand and a solid reputation across the UAE. We will build on this to establish a larger, digitally-led, retail bank offering a comprehensive suite of Shari’ah-compliant banking products.
While we expect the majority of transactions to be electronic, we remain committed to the personal touch that our experienced branch staff provide for our customers. By supporting the needs of our existing customers and appealing to the next generation, we will continue to grow our reputation and market share significantly.
The Bank has been greatly enhanced as a result of becoming part of the ADCB Group. One of the many benefits is the creation of a highly-capable leadership team. Following the transaction, the Bank’s majority shareholder, Abu Dhabi Investment Council, appointed an experienced new Board, led by Ala’a Eraiqat, Group CEO at ADCB, as Chairman. The Board will focus on driving the next stage of Al Hilal Bank’s growth through a culture of strong risk management and disciplined corporate governance.
Abdul Shakeel was appointed as CEO to spearhead the Bank’s strategy for growth and to lead the digital journey. He brings more than 25 years of banking industry experience, with deep expertise in retail banking, digital innovation and risk management. For the past 15 years he held a variety of senior positions at ADCB, most recently as Head of Retail Banking. In that capacity he managed a team of 2,000 professionals and launched many of ADCB’s award-winning consumer products and digital banking channels.
DRIVING EFFICIENCYThe majority of the Wholesale and SME portfolios were successfully migrated to ADCB within a few months of the acquisition, enabling Al Hilal Bank to focus fully on retail banking.
To capitalise on synergies, we integrated ADCB and Al Hilal Bank's treasury functions, including centralising liquidity and funding. We merged our back office functions to ensure best-practice, higher efficiency and better customer service levels. We also harmonised credit policies and enhanced our risk profile to provide greater resilience.
As the new CEO, Abdul Shakeel leads Al Hilal Bank with a new sense of purpose and a powerful digital strategy. The Bank has a strong brand and a robust and growing footprint.
F U T U R E R E A D Y
42
Elsewhere, we worked hard to develop our organisational culture and values to more closely align with those of ADCB.
As a result Al Hilal Bank is now a leaner, more efficient, organisation with a focus on promoting local talent — 48% of all employees are UAE Nationals, the highest in the UAE banking industry.
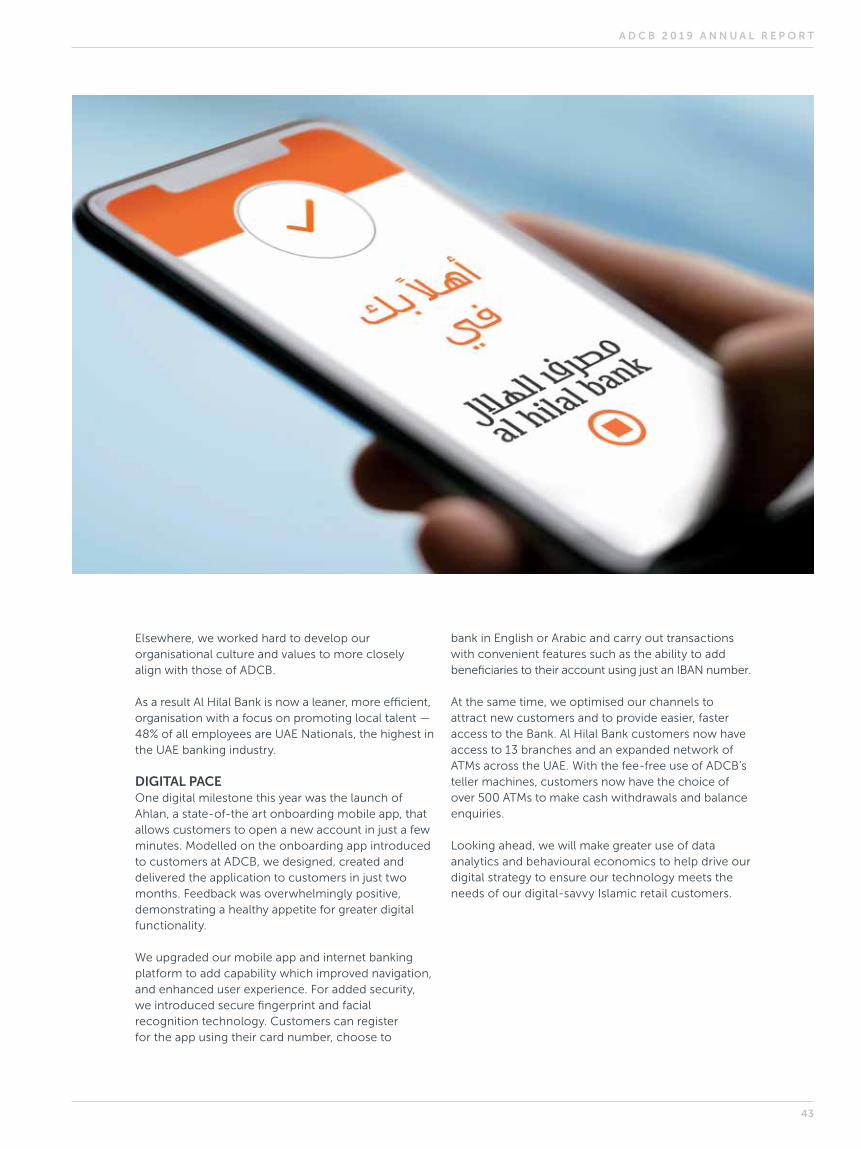
DIGITAL PACEOne digital milestone this year was the launch of Ahlan, a state-of-the art onboarding mobile app, that allows customers to open a new account in just a few minutes. Modelled on the onboarding app introduced to customers at ADCB, we designed, created and delivered the application to customers in just two months. Feedback was overwhelmingly positive, demonstrating a healthy appetite for greater digital functionality.
We upgraded our mobile app and internet banking platform to add capability which improved navigation, and enhanced user experience. For added security, we introduced secure fingerprint and facial recognition technology. Customers can register for the app using their card number, choose to
bank in English or Arabic and carry out transactions with convenient features such as the ability to add beneficiaries to their account using just an IBAN number.
At the same time, we optimised our channels to attract new customers and to provide easier, faster access to the Bank. Al Hilal Bank customers now have access to 13 branches and an expanded network of ATMs across the UAE. With the fee-free use of ADCB’s teller machines, customers now have the choice of over 500 ATMs to make cash withdrawals and balance enquiries.
Looking ahead, we will make greater use of data analytics and behavioural economics to help drive our digital strategy to ensure our technology meets the needs of our digital-savvy Islamic retail customers.
A D C B 2 0 1 9 A N N U A L R E P O R T
43

SubsidiariesIn addition to our core banking businesses, ADCB Group is supported by a number of subsidiaries which help us to add even greater value to our customers and the UAE economy. The four featured here provide a snapshot of the success they drive.
550+PROJECTS
3,600 TECHNICAL MEMOS
ISSUED
670VENDORS ADDED IN 2019
WORKING WITH
1,175CONTRACTORS AND
SUB-CONTRACTORS
1,700LANDLORDS
HAZEM JABERGENERAL MANAGER
Created in 2007 as the engineering arm of ADCB, ADCE provides engineering-related project management services, from design conception to completion. Our modern and innovative buildings are situated throughout the city. We employ a team of experienced professionals, who have developed lasting relationships with our clients.
57,000 INDIVIDUAL LEASEHOLD
TENANCIES ADMINISTERED
18,000PROPERTY OWNER ENQUIRIES
SERVICED
260,000CHILD LOCKS FITTED ON
WINDOWS IN HIGH RISE
PROPERTIES
4,000 UNITS ADDED TO OUR
PORTFOLIO IN 2019
MOHAMED BINBREKGENERAL MANAGER
Established in 2007, ADCP operates one of the largest mixed-use real estate portfolios within the region. ADCP provides tailored property management solutions representing public, private and corporate landlords across the UAE. Following the merger in 2019, UNB's Al Wifaq Properties and the real estate division of Al Hilal Bank, were successfully integrated into ADCP, further enhancing customer reach and offering a broader portfolio.
Abu Dhabi Commercial Properties
F U T U R E R E A D Y
44

AED 462 mn TOTAL LENDING THROUGH
MARGIN ACCOUNTS
16,000+TOTAL CLIENT BASE
AED 25 bnTOTAL ASSETS UNDER
CUSTODY
AED 1.1 bnTOTAL TRADE VALUE
THROUGH ONLINE
TRADING CHANNELS
HASAN SALEM AL HOSANIGENERAL MANAGER
ADCB Securities, founded in 2005, is our brokerage house which offers customers full access to trade through the UAE's stock exchanges. With capital of AED 71 million, it is regulated by the SCA (Securities & Commodities Authority) to trade in ADX (Abu Dhabi Securities Exchange), DFM (Dubai Financial Market), and NASDAQ Dubai. In 2019, we successfully integrated with Union Brokerage Company (UBC) and received an award from DFM for being the most active brokerage firm in trading via a mobile app.
34%CONSUMER BANKING
ACCOUNTS OPENED
THROUGH HAYYAK
96%+COMPLIANCE WITH ADCB
PROMISE AND SERVICE
STANDARDS IN MYSTERY
SHOPPING AUDITS
98.4%OVERALL SERVICE LEVEL
TARGETS ACHIEVED
10%INCREASE IN TOTAL
VOLUMES
ASHOK LUHARUWALLAGENERAL MANAGER
ITMAM, meaning “We Get things Done” in Arabic, was established in 2014 to provide operational support to the ADCB Group. This includes account opening, transaction processing, credit underwriting and contact centre operations among others. We use a Net Promoter Score framework to assess customer satisfaction to deliver an outstanding customer experience.
A D C B 2 0 1 9 A N N U A L R E P O R T
45

Risk ManagementRisk is a fundamental part of our business and underpins every decision we make. Our proactive approach is driven by our values, which play an integral role in enforcing the discipline needed to protect the Bank, its customers and our reputation.
We remain a systemically important Bank and a consistent and sustainable performance depends on our ability to mitigate and manage risk at every level successfully.
Guided by our values of Integrity, Care, Ambition, Respect and Discipline every employee is expected to play an active part in our risk management.
F U T U R E R E A D Y
46

This year we have made substantial progress in enhancing our approach to risk by strengthening our robust risk management governance structure and framework. As a result of the merger and the increase in our scale, we have established matrix reporting for the various risk functions based in our subsidiaries and overseas branches. They now report into their respective ADCB Head Office functional Heads which ensures alignment with and consistency in processes and procedures.
ACTIVITY IN 2019The strength of this framework was crucial in delivering the successful integration of UNB and Al Hilal Bank into the ADCB Group in 2019. Following the merger, we reviewed our entire risk management framework, updating and harmonising policies and processes to ensure every element continued to comply with international best-practices and the standards and regulations set out by the UAE Central Bank.
In particular, we reviewed our risk profile and appetites, compliance, operational risk, and information security.
RISK PROFILE REVIEWEDThe Bank regularly reviews its risk appetite to ensure it aligns with macro-economic scenarios, shareholder objectives, regulatory changes and best-practice. As a result of the merger, we made some adjustments to our risk appetite.
Four principles are inherent in the Bank’s framework — business models, organisational capabilities and skills, financial strength, and monitoring. Our Risk Appetite Statement encompasses all of ADCB’s capabilities and uses realistically achievable parameters.
Each year we evaluate our risk appetite through a process of systematic self-assurance, bank-wide surveys and a comprehensive stress test exercise. Alongside the Basel Accord’s three lines of defence model, this provides an overview of our current status. The framework guides other metrics set by management at line, business and portfolio levels which must be consistent with the overall Group appetite.
This year, we added 10 new metrics and enhanced the measurements of a further 13 across seven of the 10 Principal Risks. These changes are better aligned with regulatory, stakeholder, and investor expectations — for example, they consider real estate concentrations, IFRS 9 stage distribution, and portfolio NPLs.
Internally-developed metrics provide proxy parameters for previously not measured risks, such as Compliance, Conduct, Financial Crime, Technology, and Reputation. They ensure the Bank’s full enterprise risk profile is measured, monitored and aligned with our overall Group strategy.
Our risk appetite is established by identifying the amount and type of risks considered reasonable to deliver on our business strategy and to ensure that ADCB can maintain its activity in the event of unexpected circumstances. They set our tolerance for:
Capital adequacy (normal and stress scenarios) and earnings volatility, including return on risk and shareholder returns
Compliance and regulatory risks
Employee conduct
Credit concentrations in geographies, large groups, individual entities, economic sectors, revenues, the shape of the portfolio, enterprise-wide cost of risk, delinquencies and provision levels
Default risk and credit losses
ENHANCED METRICS This year, we added 10 new metrics and enhanced the measurements of a further 13 across seven of the 10 Principal Risks.
A D C B 2 0 1 9 A N N U A L R E P O R T
47

Financial crime and resolution, anti-money laundering and political exposure
Information and technology risks
Market and price valuations
Liquidity and funding gaps, liability concentrations, liquidity under stress conditions
Market risks in the Trading, Investment and Banking books covering movements in interest rates, foreign exchange, equity exposures, commodities and market volatility
Operational and reputational risks, including human resources
External and internal ratings (which affect pricing and investor appetite)
Stress testing is also an integral part of ADCB’s Risk Appetite and the Bank sets in absolute terms the minimum capital ratio in case of pre-defined stress scenarios.
ADCB’s risk profile and appetite are approved by the Board and Risk and Credit Committee and then cascaded down to every department and individual throughout the organisation.
OPERATIONAL RISK ENHANCEDIn 2019, we reinforced our approach to operational risk and implemented it across the enlarged group. We reviewed and enhanced our operational risk policy and framework, aligned our business continuity management policy and tools, and agreed on crisis management protocols.
The safety of our employees and the ability to withstand a crisis are vital to the Bank. To ensure this, we enhanced our emergency response procedures and business continuity plans to enable us to continue to achieve our business objectives in the face of an unexpected disruptive event. These plans are tested regularly, and we hold an ISO22301:2012 certification which illustrates the high standards we employ.
As well as regular training to ensure wide-spread risk awareness, this year we implemented a new process for the escalation of operational risk events across the entire network.
Meanwhile, to help drive a more deep-rooted data culture across the Bank — where we collect, analyse, and deploy data to make better decisions — we appointed a Head of Data Management. The role is designed to help to develop further and embed the set of principles we use to govern the management of our data. This is particularly significant with the growth of digital channels both into and out of the Bank, and as we increase our use of data analytics to serve customers better.
The Head of Data Management will also help in the development of APIs and open banking. In addition, he will ensure we are fully compliant with the new regulations around general data protection to mirror the GDPR requirements brought in by the EU in May 2018.
INFORMATION SECURITY UPGRADEDWe enhanced our information security risk framework, providing improved detection, protection and response times. We focused on improving security operations efficiency, while incorporating security resilience across the Bank, upgrading our threat hunting capabilities, and enhancing our reporting processes.
We take a proactive approach to cybersecurity, using advanced analytics and machine learning to detect potential breaches before they happen.
As part of this programme, we integrated Security Automation and Orchestration (SOAR) into our systems for better protection. SOAR, a machine-driven technology, enables us to collect security threats data and alerts from different sources, then immediately analyse them to define, prioritise and act on them instantly.
At the same time, we established a Managed Detection and Response (MDR) network monitoring capability across all internet gateways, including scans of email traffic, which is also capable of detecting threats that have passed other traditional perimeter security tools. We also reviewed payments systems access and carried out an extensive physical security review of all 72 branches.
Fraud continues to be a concern as the number of attacks grow and increase in their sophistication. This year we introduced several new measures across the group to strengthen our protection and to raise awareness amongst our employees and our customers.
We look forward to the results of the Financial Action Task Force’s (FATF) mutual evaluation process carried out in the UAE in July. FATF carried out interviews across ministries, financial sector bodies and a range of non-financial businesses to examine the strength of the country’s anti-money laundering (AML) and combating the financing of terrorism (CFT) laws and their effectiveness in practice. This report is due in early 2020 and the Bank will respond to support any actions required by the Central Bank of the UAE.
This year we also engaged a team of independent external consultants to validate our compliance with the UAE Information Assurance Standard issued by the Central Bank in September 2018. Our compliance levels were confirmed to be 97% — with detailed action plans and delivery dates in place for full compliance by early 2020.
F U T U R E R E A D Y
48
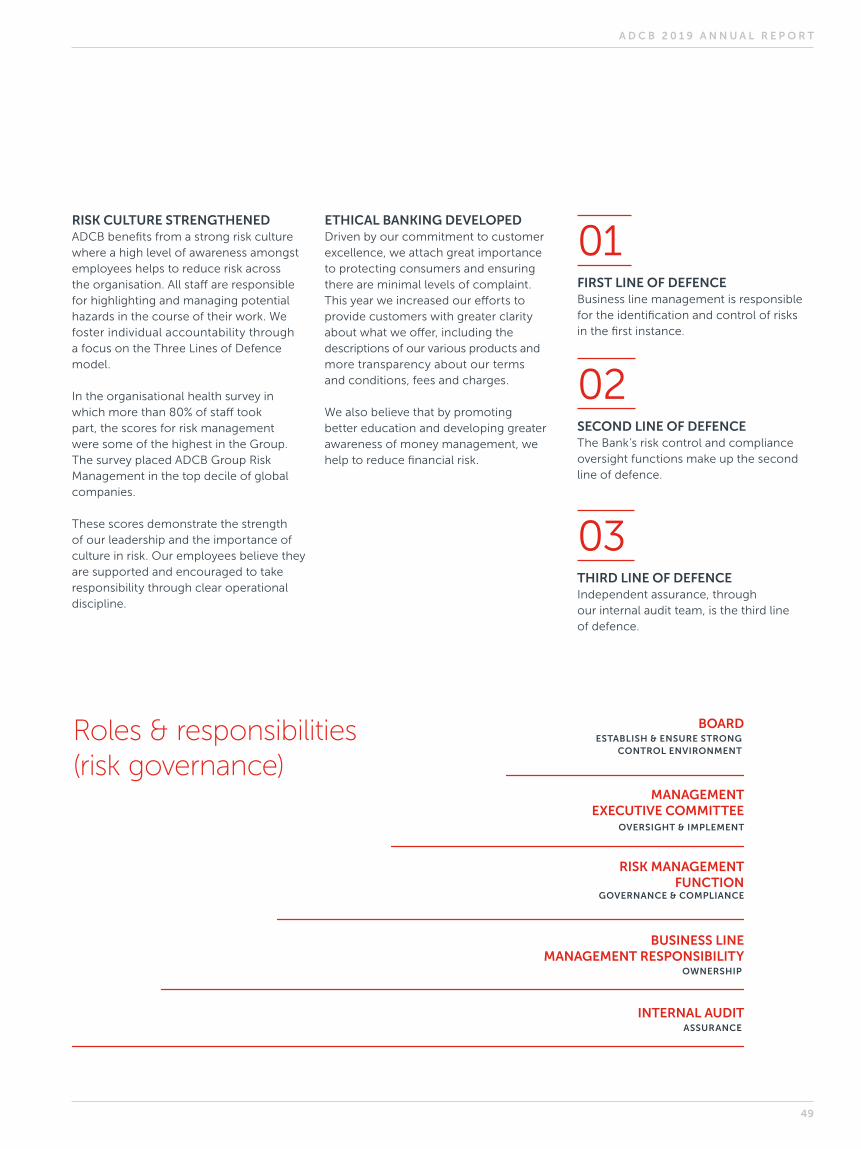
RISK CULTURE STRENGTHENEDADCB benefits from a strong risk culture where a high level of awareness amongst employees helps to reduce risk across the organisation. All staff are responsible for highlighting and managing potential hazards in the course of their work. We foster individual accountability through a focus on the Three Lines of Defence model.
In the organisational health survey in which more than 80% of staff took part, the scores for risk management were some of the highest in the Group. The survey placed ADCB Group Risk Management in the top decile of global companies.
These scores demonstrate the strength of our leadership and the importance of culture in risk. Our employees believe they are supported and encouraged to take responsibility through clear operational discipline.
ETHICAL BANKING DEVELOPEDDriven by our commitment to customer excellence, we attach great importance to protecting consumers and ensuring there are minimal levels of complaint. This year we increased our efforts to provide customers with greater clarity about what we offer, including the descriptions of our various products and more transparency about our terms and conditions, fees and charges.
We also believe that by promoting better education and developing greater awareness of money management, we help to reduce financial risk.
01 FIRST LINE OF DEFENCEBusiness line management is responsible for the identification and control of risks in the first instance.
02 SECOND LINE OF DEFENCEThe Bank’s risk control and compliance oversight functions make up the second line of defence.
03 THIRD LINE OF DEFENCEIndependent assurance, through our internal audit team, is the third line of defence.
Roles & responsibilities (risk governance)
BOARDESTABLISH & ENSURE STRONG
CONTROL ENVIRONMENT
MANAGEMENT EXECUTIVE COMMITTEE
OVERSIGHT & IMPLEMENT
RISK MANAGEMENT FUNCTION
GOVERNANCE & COMPLIANCE
BUSINESS LINE MANAGEMENT RESPONSIBILITY
OWNERSHIP
INTERNAL AUDITASSURANCE
A D C B 2 0 1 9 A N N U A L R E P O R T
49
CAPITAL PLANNING PROCESSRegulators view the systemic risk of bank failures very seriously. The loss they can cause to depositors and the costs of bailouts by the government can be substantial, and as a result, the capital structure of banks is subject to rigorous regulation. The Basel Accords focus on risk management in banks and link the business profile of banks to their risk profiles and subsequently to regulatory capital. Hence, the Bank places a high emphasis on capital structure, capital planning and capital allocation as part of strategic decision-making.
CAPITAL PLANNING IN ACTIONIn practical terms, the role of capital in any bank is to provide creditor protection. Capital acts as a buffer against potential losses, thereby protecting depositors and other creditors. Provisions offer a cushion against expected losses. For a more detailed study of our Risk management, please see our separate Basel III — Pillar III report.
EXTERNAL RISK SCENARIOSWe regularly identify and monitor specific external risks. These are events that could lead to a significant, unexpected adverse outcome with the potential to cause ADCB, or one of its divisions, to fail to meet its strategic objectives.
We consider the financial and reputational implications of each risk. On the next page, we identify the types of external threats that could materially affect the UAE banking system and ADCB itself. These include macroeconomic conditions, geopolitical risks, the additional costs and rigours imposed by enhanced regulatory requirements, risks related to information technology and data security, and concentration risks.
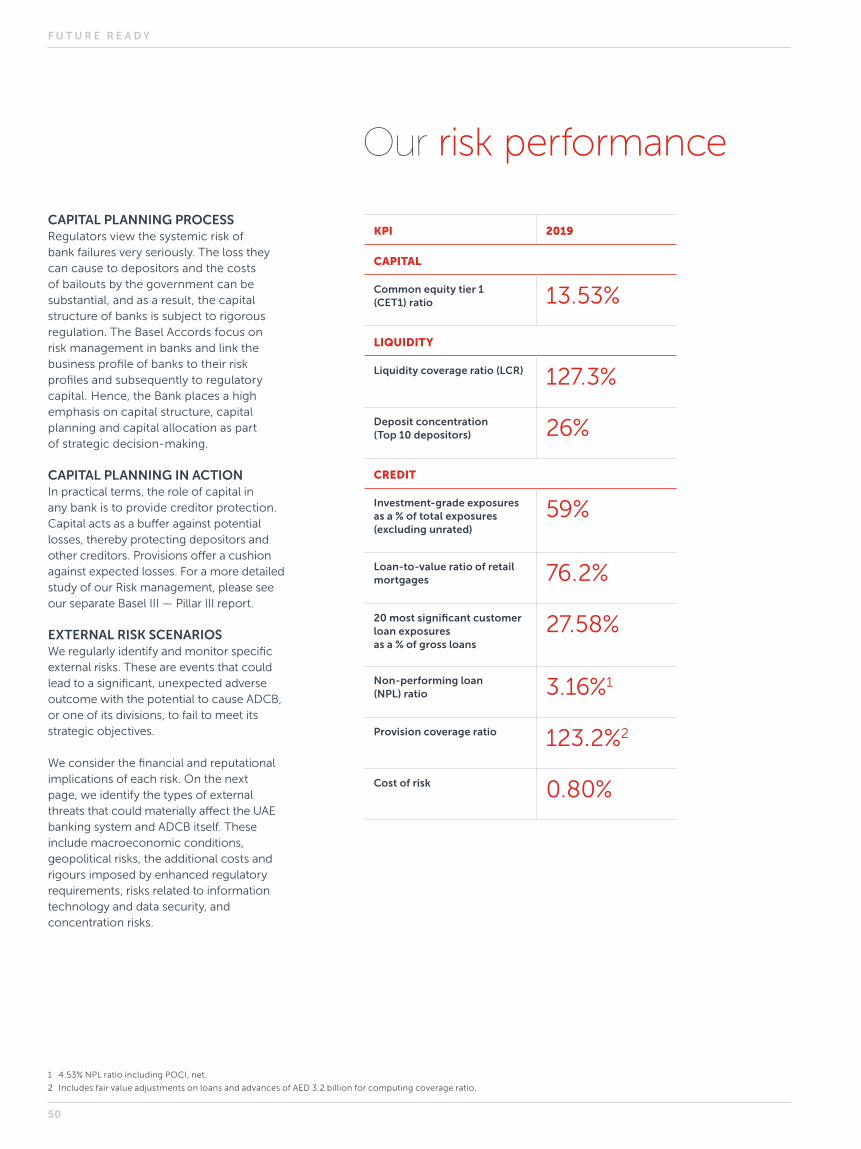
Our risk performance
KPI 2019
CAPITAL
Common equity tier 1 (CET1) ratio 13.53%
LIQUIDITY
Liquidity coverage ratio (LCR) 127.3%
Deposit concentration (Top 10 depositors) 26%
CREDIT
Investment-grade exposures as a % of total exposures (excluding unrated)
59%
Loan-to-value ratio of retail mortgages 76.2%
20 most significant customer loan exposures as a % of gross loans
27.58%
Non-performing loan (NPL) ratio 3.16%1
Provision coverage ratio 123.2%2
Cost of risk 0.80%
1 4.53% NPL ratio including POCI, net.
2 Includes fair value adjustments on loans and advances of AED 3.2 billion for computing coverage ratio.
F U T U R E R E A D Y
50

EXTERNAL RISK DEFINITION AND POTENTIAL IMPACT MITIGATION STRATEGY
Macroeconomic conditions in the operating markets
Prolonged volatility in the price of oil will affect the UAE economy and those of other GCC countries.
Forecasts are for GDP growth rates to remain low with limited credit growth.
The Bank will refine its Risk Appetite to the variety of industries with which it deals and will continue to adhere to the credit risk metrics already in place that address various portfolio dimensions.
Geopolitical risk This risk could stem from one of many sources unrelated to the Bank and its business. Geopolitical tension remains a persistent issue in the region.
We regularly monitor geopolitical and economic situations around the world.
As part of our Asset and Liability Committee (ALCO) deliberations, we factor in geopolitical risks as part of overall liquidity considerations. ADCB’s Chief Economist assesses the economic impact of changing geopolitical risks and provides vital inputs to drive our strategy. Where necessary, we adjust our country limits and exposures to reflect our appetite and to mitigate these risks.
Regulatory and legal risks to our business model
New regulatory requirements may affect our business model and profitability. Should a regulatory change reduce our ability to meet any of our customers’ needs or to achieve fair customer outcomes, we may experience increased costs and reputational damage.
Moreover, the inability to satisfy our customers would cause the Bank to fall short of its strategic objectives, which could hurt earnings, liquidity, capital and shareholder confidence.
The risk of failure due to external unanticipated regulatory and legal changes affects all our businesses.
We strive to ensure that the Bank’s views are considered when UAE regulatory policy is developed. ADCB chairs, or is a member of, several UAE Banks Federation forums. Internally, we analyse all new draft regulations or circulars to measure their impact as well as to ensure they can be implemented effectively.
We also confirm that our capital and liquidity plans anticipate the potential effects of any changes.
We continuously monitor and expand our capital allocation and liquidity management disciplines to incorporate future increased capital and liquidity requirements and to drive appropriate risk management and mitigating actions.
In the past few years, the Bank has launched several initiatives to reduce reputational risk to our business model. For example, our Customer Experience Committee ensures that customers enjoy a superior and consistent experience. We have well-developed policies and procedures to deal with customer complaints, and all front-office staff and officers are trained to deal with customer concerns promptly.
Integration Risk The impact of our merger with UNB and the acquisition of Al Hilal Bank could result in lack of oversight, process lapses or inadequate policy/portfolio amalgamation.
The impact of the merger and integration process is reviewed and assessed each week by a steering committee chaired by the Group Chief Executive Officer. Each area has a working group, with a documented action plan and an operational readiness plan to ensure seamless integration. The Bank has identified and adopted target operating models for all risk areas, rolled out enterprise-wide risk appetite, harmonised its risk models and portfolio monitoring reports, and adopted a unified approach to ECL and risk practices. The teams are fully integrated and cross-trained on the new policies and procedures. ADCB’s Group risk policies are based on the core tenet of responsible growth within a pre-defined risk appetite.
External risk scenarios
A D C B 2 0 1 9 A N N U A L R E P O R T
51
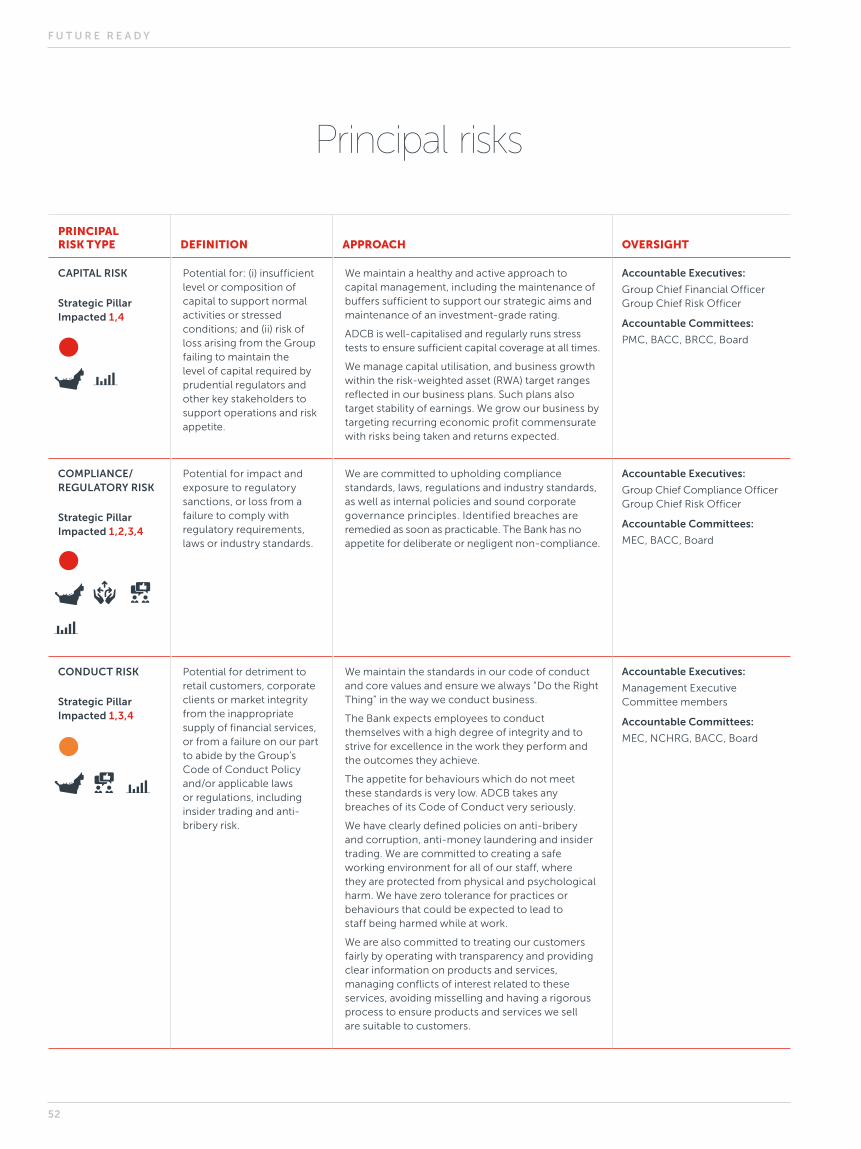
PRINCIPAL RISK TYPE DEFINITION APPROACH OVERSIGHT
CAPITAL RISK
Strategic Pillar Impacted 1,4
Potential for: (i) insufficient level or composition of capital to support normal activities or stressed conditions; and (ii) risk of loss arising from the Group failing to maintain the level of capital required by prudential regulators and other key stakeholders to support operations and risk appetite.
We maintain a healthy and active approach to capital management, including the maintenance of buffers sufficient to support our strategic aims and maintenance of an investment-grade rating.
ADCB is well-capitalised and regularly runs stress tests to ensure sufficient capital coverage at all times.
We manage capital utilisation, and business growth within the risk-weighted asset (RWA) target ranges reflected in our business plans. Such plans also target stability of earnings. We grow our business by targeting recurring economic profit commensurate with risks being taken and returns expected.
Accountable Executives:
Group Chief Financial Officer Group Chief Risk Officer
Accountable Committees:
PMC, BACC, BRCC, Board
COMPLIANCE/REGULATORY RISK
Strategic Pillar Impacted 1,2,3,4
Potential for impact and exposure to regulatory sanctions, or loss from a failure to comply with regulatory requirements, laws or industry standards.
We are committed to upholding compliance standards, laws, regulations and industry standards, as well as internal policies and sound corporate governance principles. Identified breaches are remedied as soon as practicable. The Bank has no appetite for deliberate or negligent non-compliance.
Accountable Executives:
Group Chief Compliance Officer Group Chief Risk Officer
Accountable Committees:
MEC, BACC, Board
CONDUCT RISK
Strategic Pillar Impacted 1,3,4
Potential for detriment to retail customers, corporate clients or market integrity from the inappropriate supply of financial services, or from a failure on our part to abide by the Group’s Code of Conduct Policy and/or applicable laws or regulations, including insider trading and anti-bribery risk.
We maintain the standards in our code of conduct and core values and ensure we always “Do the Right Thing” in the way we conduct business.
The Bank expects employees to conduct themselves with a high degree of integrity and to strive for excellence in the work they perform and the outcomes they achieve.
The appetite for behaviours which do not meet these standards is very low. ADCB takes any breaches of its Code of Conduct very seriously.
We have clearly defined policies on anti-bribery and corruption, anti-money laundering and insider trading. We are committed to creating a safe working environment for all of our staff, where they are protected from physical and psychological harm. We have zero tolerance for practices or behaviours that could be expected to lead to staff being harmed while at work.
We are also committed to treating our customers fairly by operating with transparency and providing clear information on products and services, managing conflicts of interest related to these services, avoiding misselling and having a rigorous process to ensure products and services we sell are suitable to customers.
Accountable Executives:
Management Executive Committee members
Accountable Committees:
MEC, NCHRG, BACC, Board
Principal risks
F U T U R E R E A D Y
52

PRINCIPAL RISK TYPE DEFINITION APPROACH OVERSIGHT
CREDIT RISK
Strategic Pillar Impacted 1,4
Potential for financial loss due to the failure of a customer to meet the agreed obligations to pay the Bank. It also includes concentration risk (increased exposure to large client groups, sectors or geographies) and decreases in credit quality.
We manage our credit exposures by having a sound analytical framework, focusing on analysis of cashflows and considering the legal framework in which the Bank and borrower operate. We apply a set of criteria and policies to lending that means we only deal with clients with good creditworthiness. This ensures facilities are appropriately secured, wherever feasible.
ADCB Group submitted a special ICAAP and stress test report post-merger to the UAE CB. The results were above the regulatory thresholds.
We have a greater appetite for risk in industries we better understand and have the insights, capability and capacity to manage and monitor.
We remain a relationship-driven business rather than pursuing opportunistic transactions. Wherever possible, collateral is taken to reduce unsecured lending.
Accountable Executives:
Group Chief Credit Officer, Business Heads for Consumer & Wholesale Banking, Group Chief Risk Officer
Accountable Committees:
MRCC, BACC, SBRCC, Board
FINANCIAL CRIME RISK
Strategic Pillar Impacted 1,2,3,4
Potential for legal or regulatory penalties, material financial loss or reputational damage resulting from the failure to comply with applicable laws and regulations relating, but not limited to, international sanctions, anti-money laundering and anti-bribery and corruption.
We have no tolerance for breaches in laws and regulations related to financial crime, recognising that while incidents are unwanted, they cannot be entirely avoided. The Bank has no appetite for any fraud or corruption perpetrated by its staff. Any and all allegations of suspected fraud or corruption are taken seriously as set out in the Code of Conduct.
Accountable Executives:
Chief Compliance Officer, Group Chief Risk Officer, Head of Fraud & Investigations
Accountable Committees:
MEC, BACC, Board
KEY: Change from 2018
Low Medium High
1. GENERATE SUSTAINABLE PROFIT GROWTH THROUGH A UAE-CENTRIC APPROACH
4. EFFECTIVE RISK-TAKING AND MANAGEMENT IN LINE WITH PRE-DEFINED RISK APPETITE
5. EXPLOITATION OF DIGITAL FOR GROWTH AND EFFICIENCY — LEVERAGING DATA ANALYTICS
2. SUSTAINABILITY THROUGH LIABILITY GROWTH AND FUNDING DIVERSIFICATION
3. SUPERIOR CUSTOMER EXPERIENCE THROUGH SERVICE EXCELLENCE
A D C B 2 0 1 9 A N N U A L R E P O R T
53
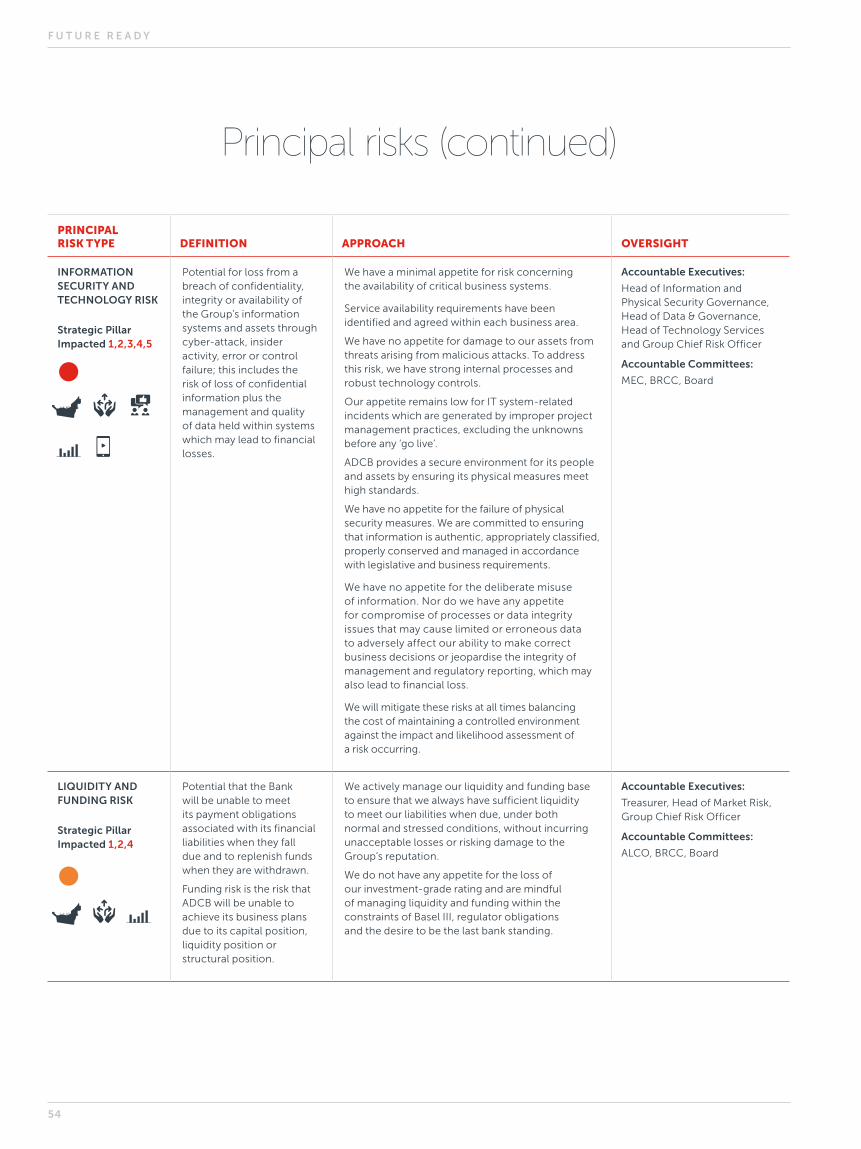
PRINCIPAL RISK TYPE DEFINITION APPROACH OVERSIGHT
INFORMATION SECURITY AND TECHNOLOGY RISK
Strategic Pillar Impacted 1,2,3,4,5
Potential for loss from a breach of confidentiality, integrity or availability of the Group’s information systems and assets through cyber-attack, insider activity, error or control failure; this includes the risk of loss of confidential information plus the management and quality of data held within systems which may lead to financial losses.
We have a minimal appetite for risk concerning the availability of critical business systems.
Service availability requirements have been identified and agreed within each business area.
We have no appetite for damage to our assets from threats arising from malicious attacks. To address this risk, we have strong internal processes and robust technology controls.
Our appetite remains low for IT system-related incidents which are generated by improper project management practices, excluding the unknowns before any ‘go live’.
ADCB provides a secure environment for its people and assets by ensuring its physical measures meet high standards.
We have no appetite for the failure of physical security measures. We are committed to ensuring that information is authentic, appropriately classified, properly conserved and managed in accordance with legislative and business requirements.
We have no appetite for the deliberate misuse of information. Nor do we have any appetite for compromise of processes or data integrity issues that may cause limited or erroneous data to adversely affect our ability to make correct business decisions or jeopardise the integrity of management and regulatory reporting, which may also lead to financial loss.
We will mitigate these risks at all times balancing the cost of maintaining a controlled environment against the impact and likelihood assessment of a risk occurring.
Accountable Executives:
Head of Information and Physical Security Governance, Head of Data & Governance, Head of Technology Services and Group Chief Risk Officer
Accountable Committees:
MEC, BRCC, Board
LIQUIDITY AND FUNDING RISK
Strategic Pillar Impacted 1,2,4
Potential that the Bank will be unable to meet its payment obligations associated with its financial liabilities when they fall due and to replenish funds when they are withdrawn.
Funding risk is the risk that ADCB will be unable to achieve its business plans due to its capital position, liquidity position or structural position.
We actively manage our liquidity and funding base to ensure that we always have sufficient liquidity to meet our liabilities when due, under both normal and stressed conditions, without incurring unacceptable losses or risking damage to the Group’s reputation.
We do not have any appetite for the loss of our investment-grade rating and are mindful of managing liquidity and funding within the constraints of Basel III, regulator obligations and the desire to be the last bank standing.
Accountable Executives:
Treasurer, Head of Market Risk, Group Chief Risk Officer
Accountable Committees:
ALCO, BRCC, Board
Principal risks (continued)
F U T U R E R E A D Y
54
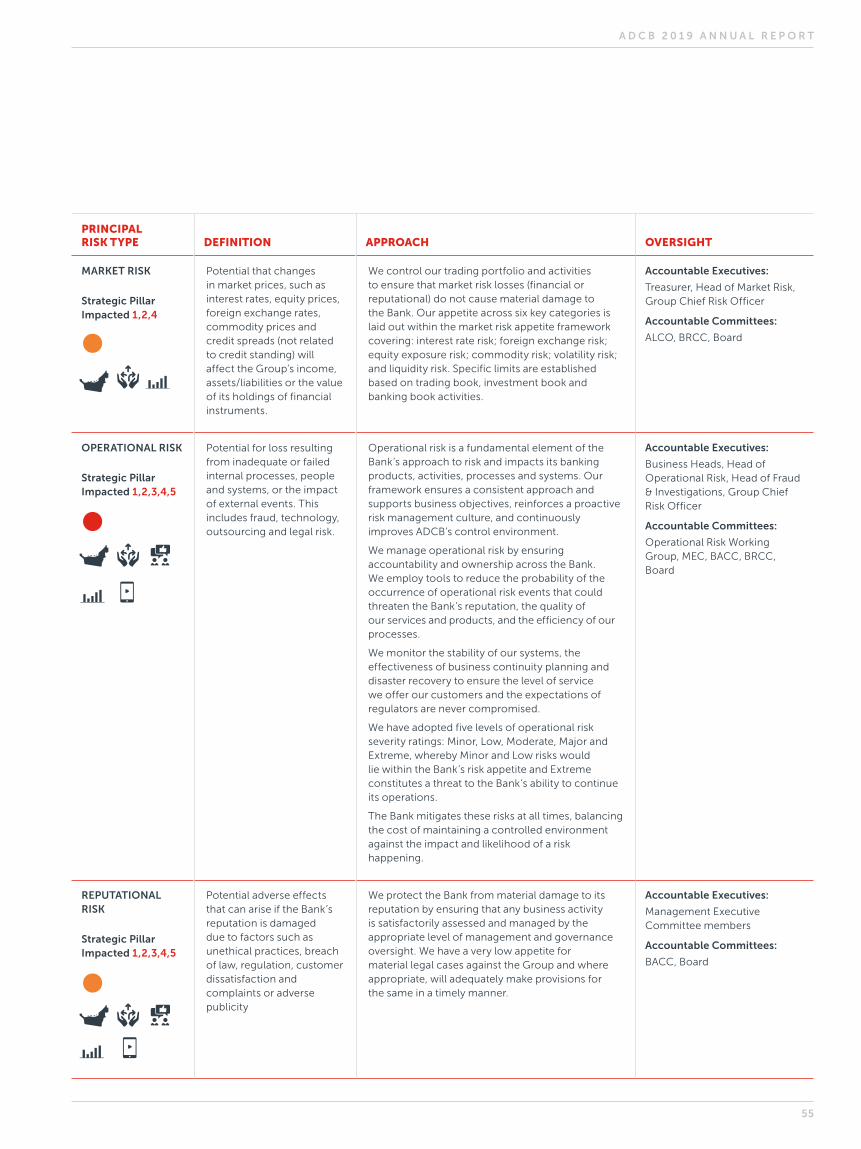
PRINCIPAL RISK TYPE DEFINITION APPROACH OVERSIGHT
MARKET RISK
Strategic Pillar Impacted 1,2,4
Potential that changes in market prices, such as interest rates, equity prices, foreign exchange rates, commodity prices and credit spreads (not related to credit standing) will affect the Group’s income, assets/liabilities or the value of its holdings of financial instruments.
We control our trading portfolio and activities to ensure that market risk losses (financial or reputational) do not cause material damage to the Bank. Our appetite across six key categories is laid out within the market risk appetite framework covering: interest rate risk; foreign exchange risk; equity exposure risk; commodity risk; volatility risk; and liquidity risk. Specific limits are established based on trading book, investment book and banking book activities.
Accountable Executives:
Treasurer, Head of Market Risk, Group Chief Risk Officer
Accountable Committees:
ALCO, BRCC, Board
OPERATIONAL RISK
Strategic Pillar Impacted 1,2,3,4,5
Potential for loss resulting from inadequate or failed internal processes, people and systems, or the impact of external events. This includes fraud, technology, outsourcing and legal risk.
Operational risk is a fundamental element of the Bank’s approach to risk and impacts its banking products, activities, processes and systems. Our framework ensures a consistent approach and supports business objectives, reinforces a proactive risk management culture, and continuously improves ADCB’s control environment.
We manage operational risk by ensuring accountability and ownership across the Bank. We employ tools to reduce the probability of the occurrence of operational risk events that could threaten the Bank’s reputation, the quality of our services and products, and the efficiency of our processes.
We monitor the stability of our systems, the effectiveness of business continuity planning and disaster recovery to ensure the level of service we offer our customers and the expectations of regulators are never compromised.
We have adopted five levels of operational risk severity ratings: Minor, Low, Moderate, Major and Extreme, whereby Minor and Low risks would lie within the Bank’s risk appetite and Extreme constitutes a threat to the Bank’s ability to continue its operations.
The Bank mitigates these risks at all times, balancing the cost of maintaining a controlled environment against the impact and likelihood of a risk happening.
Accountable Executives:
Business Heads, Head of Operational Risk, Head of Fraud & Investigations, Group Chief Risk Officer
Accountable Committees:
Operational Risk Working Group, MEC, BACC, BRCC, Board
REPUTATIONAL RISK
Strategic Pillar Impacted 1,2,3,4,5
Potential adverse effects that can arise if the Bank’s reputation is damaged due to factors such as unethical practices, breach of law, regulation, customer dissatisfaction and complaints or adverse publicity
We protect the Bank from material damage to its reputation by ensuring that any business activity is satisfactorily assessed and managed by the appropriate level of management and governance oversight. We have a very low appetite for material legal cases against the Group and where appropriate, will adequately make provisions for the same in a timely manner.
Accountable Executives:
Management Executive Committee members
Accountable Committees:
BACC, Board
A D C B 2 0 1 9 A N N U A L R E P O R T
55

PERFORMANCE
F U T U R E R E A D Y
56

A D C B 2 0 1 9 A N N U A L R E P O R T
57
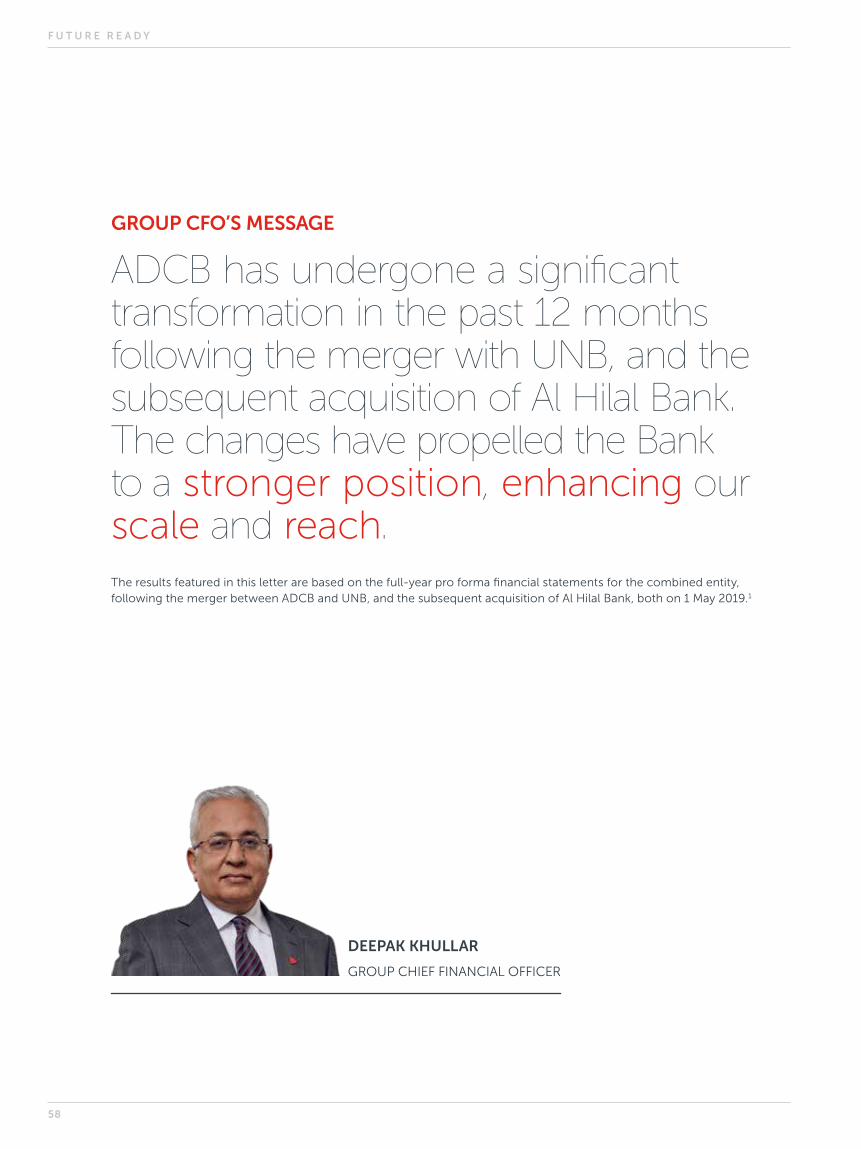
GROUP CFO’S MESSAGE
ADCB has undergone a significant transformation in the past 12 months following the merger with UNB, and the subsequent acquisition of Al Hilal Bank. The changes have propelled the Bank to a stronger position, enhancing our scale and reach. The results featured in this letter are based on the full-year pro forma financial statements for the combined entity, following the merger between ADCB and UNB, and the subsequent acquisition of Al Hilal Bank, both on 1 May 2019.1
DEEPAK KHULLAR
GROUP CHIEF FINANCIAL OFFICER
F U T U R E R E A D Y
58
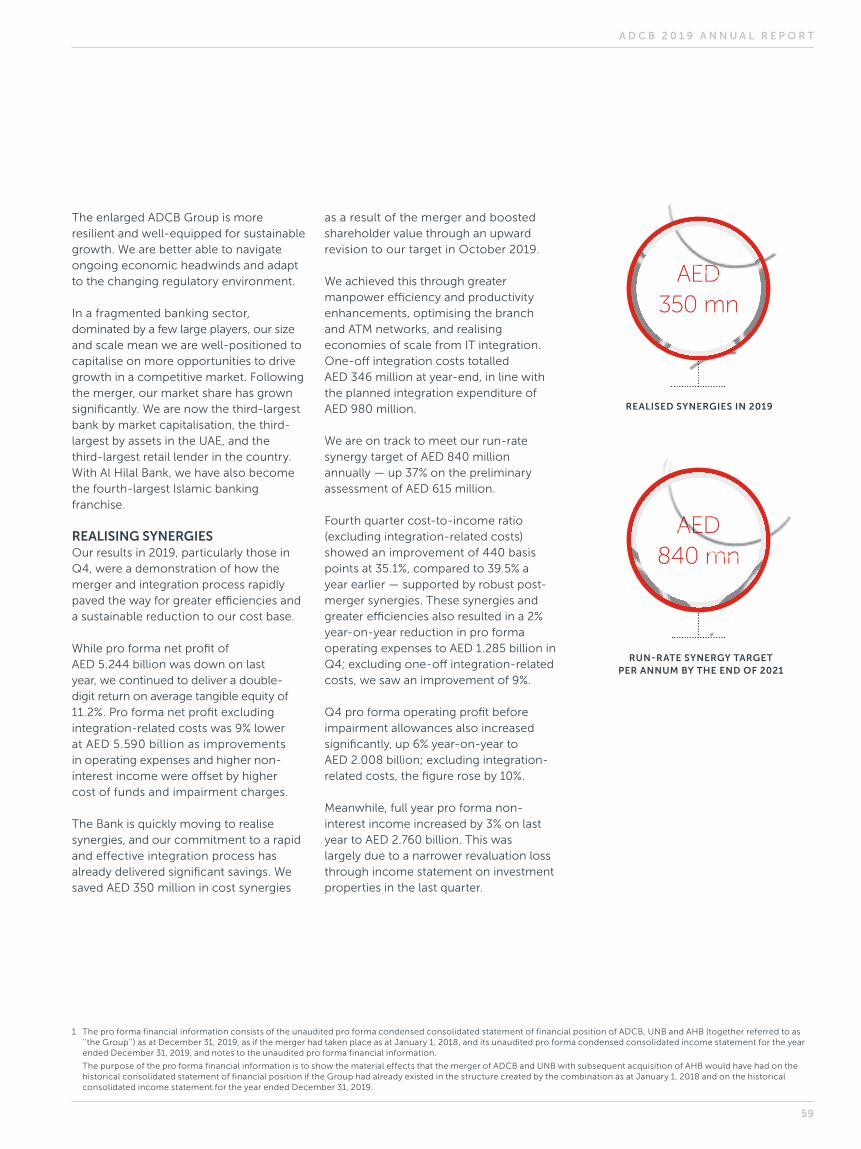
The enlarged ADCB Group is more resilient and well-equipped for sustainable growth. We are better able to navigate ongoing economic headwinds and adapt to the changing regulatory environment.
In a fragmented banking sector, dominated by a few large players, our size and scale mean we are well-positioned to capitalise on more opportunities to drive growth in a competitive market. Following the merger, our market share has grown significantly. We are now the third-largest bank by market capitalisation, the third-largest by assets in the UAE, and the third-largest retail lender in the country. With Al Hilal Bank, we have also become the fourth-largest Islamic banking franchise.
REALISING SYNERGIESOur results in 2019, particularly those in Q4, were a demonstration of how the merger and integration process rapidly paved the way for greater efficiencies and a sustainable reduction to our cost base.
While pro forma net profit of AED 5.244 billion was down on last year, we continued to deliver a double- digit return on average tangible equity of 11.2%. Pro forma net profit excluding integration-related costs was 9% lower at AED 5.590 billion as improvements in operating expenses and higher non-interest income were offset by higher cost of funds and impairment charges.
The Bank is quickly moving to realise synergies, and our commitment to a rapid and effective integration process has already delivered significant savings. We saved AED 350 million in cost synergies
as a result of the merger and boosted shareholder value through an upward revision to our target in October 2019.
We achieved this through greater manpower efficiency and productivity enhancements, optimising the branch and ATM networks, and realising economies of scale from IT integration. One-off integration costs totalled AED 346 million at year-end, in line with the planned integration expenditure of AED 980 million.
We are on track to meet our run-rate synergy target of AED 840 million annually — up 37% on the preliminary assessment of AED 615 million.
Fourth quarter cost-to-income ratio (excluding integration-related costs) showed an improvement of 440 basis points at 35.1%, compared to 39.5% a year earlier — supported by robust post-merger synergies. These synergies and greater efficiencies also resulted in a 2% year-on-year reduction in pro forma operating expenses to AED 1.285 billion in Q4; excluding one-off integration-related costs, we saw an improvement of 9%.
Q4 pro forma operating profit before impairment allowances also increased significantly, up 6% year-on-year to AED 2.008 billion; excluding integration-related costs, the figure rose by 10%.
Meanwhile, full year pro forma non-interest income increased by 3% on last year to AED 2.760 billion. This was largely due to a narrower revaluation loss through income statement on investment properties in the last quarter.
1 The pro forma financial information consists of the unaudited pro forma condensed consolidated statement of financial position of ADCB, UNB and AHB (together referred to as ‘‘the Group’’) as at December 31, 2019, as if the merger had taken place as at January 1, 2018, and its unaudited pro forma condensed consolidated income statement for the year ended December 31, 2019, and notes to the unaudited pro forma financial information.
The purpose of the pro forma financial information is to show the material effects that the merger of ADCB and UNB with subsequent acquisition of AHB would have had on the historical consolidated statement of financial position if the Group had already existed in the structure created by the combination as at January 1, 2018 and on the historical consolidated income statement for the year ended December 31, 2019.
RUN-RATE SYNERGY TARGET PER ANNUM BY THE END OF 2021
AED 840 mn
REALISED SYNERGIES IN 2019
AED 350 mn
A D C B 2 0 1 9 A N N U A L R E P O R T
59

The Bank’s loan-to-deposit ratio remained healthy at 95.4%, and our liquidity coverage ratio of 127.3% was well above the minimum of 100% set by the UAE Central Bank. In the interbank markets, ADCB continued to be a net lender of AED 10 billion in 2019.
Non-performing loans declined to AED 8.491 billion and net purchase or originated credit impaired (POCI) assets (loans only) were AED 3.710 billion at year end. Our non-performing loan ratio (NPL) fell to 3.16%, while NPL ratio including net POCI assets stood at 4.53%. As at 31 December 2019, cost of risk was 0.80%, compared to 0.74% a year earlier.
CAPITAL STRENGTHAs a Domestic Systemically Important Bank (DSIB) in the UAE, we continue to be well-placed to meet regulatory requirements and have a robust Basel III capital adequacy ratio of 16.9%, with a common equity tier 1 (CET1) ratio of 13.5%.
Our credit ratings are solid. International ratings agencies Fitch and Standard & Poor’s reaffirmed our credit ratings following the merger at A+ and A respectively — a reflection of ADCB’s strong fundamentals.
STRONG BALANCE SHEETOur balance sheet remains resilient and the Bank maintains a strong liquidity profile and capital position.
Our total assets reached AED 405 billion in 2019. Net loans to customers were at AED 250 billion. In line with our UAE-centric strategy, 94% of our loan portfolio was within the country and remained well-diversified across both business segments and economic sectors.
Total customer deposits stood at AED 262 billion, falling by 8% as a result of the Bank’s decision to exit more expensive time deposits to focus on growing low-cost current and savings account (CASA) deposits.
In 2019 our CASA crossed the AED 100 billion mark for the first time in the Bank’s history, to a total of AED 102 billion. This was a significant achievement and represented an increase of AED 7 billion year- on-year. CASA deposits comprised 39% of total customer deposits, compared to 33% a year ago.
CASA CONTRIBUTION
TO TOTAL CUSTOMER
DEPOSITS
39%CASA
CUSTOMER DEPOSITS
AED262 bn
NET LOANS
AED250 bn
F U T U R E R E A D Y
60
FAST-PACED INTEGRATIONThe pace of our merger and integration set new records, well ahead of previous industry precedents.
We made significant progress in aligning our governance framework, organisational structure, customer experience, systems and culture. Immediately after the legal completion of the transaction in May, we implemented an end-state organisational structure, establishing a leaner franchise. Also, within one month of legal completion of the transaction, we harmonised credit policies to ensure best practice across the Group, and fully integrated the treasury functions, with centralised management of liquidity and funding.
The full integration of Al Hilal Bank into the ADCB Group was completed in the third quarter, which included the migration of the corporate and SME portfolios to the ADCB platform.
In October 2019, we combined and optimised the entire ADCB and UNB branch and ATM networks, and rolled out the ADCB brand across all physical and digital channels. This major milestone was achieved in a highly ambitious timeframe of five months.
While integration work continues at a rapid pace to deliver key milestones on schedule, the Group remains focused on protecting and growing its businesses through an unwavering commitment to excellent customer service.
2020 VISIONWe are now midway through the final phase of integration. IT systems and infrastructure will be fully integrated in the second quarter of 2020 and all former UNB customers will have had their accounts migrated to the ADCB platform.
In 2019, the pace of our transformation was powerful and we are committed to continuing the momentum we built.
We will capitalise on the synergies and operating efficiencies that the merger has delivered to ensure greater value for shareholders.
I would like to extend my thanks to our employees for all their hard work and dedication throughout the year. The Bank is future-ready, better placed than ever to rise to tomorrow’s challenges, and grasp the opportunities we are seeing in a rapidly transforming UAE economy.
DEEPAK KHULLAR
GROUP CHIEF FINANCIAL OFFICER
A D C B 2 0 1 9 A N N U A L R E P O R T
61

Financial OverviewThe past year was a powerful demonstration of what the ADCB Group can accomplish with a clear strategy, a robust governance framework, and close collaboration. This financial overview is part of that demonstration, reflecting our adherence to financial discipline and a prudent approach to risk management.
The figures and charts that feature in the following pages provide a more detailed insight into our financial performance this year. These results are based on the full year pro forma financial statements for the combined entity, following the merger between ADCB and UNB, and the subsequent acquisition of Al Hilal Bank on 1 May 2019.
The results show we are well-placed to grasp the opportunities we are seeing in a rapidly transforming UAE economy.
F U T U R E R E A D Y
62
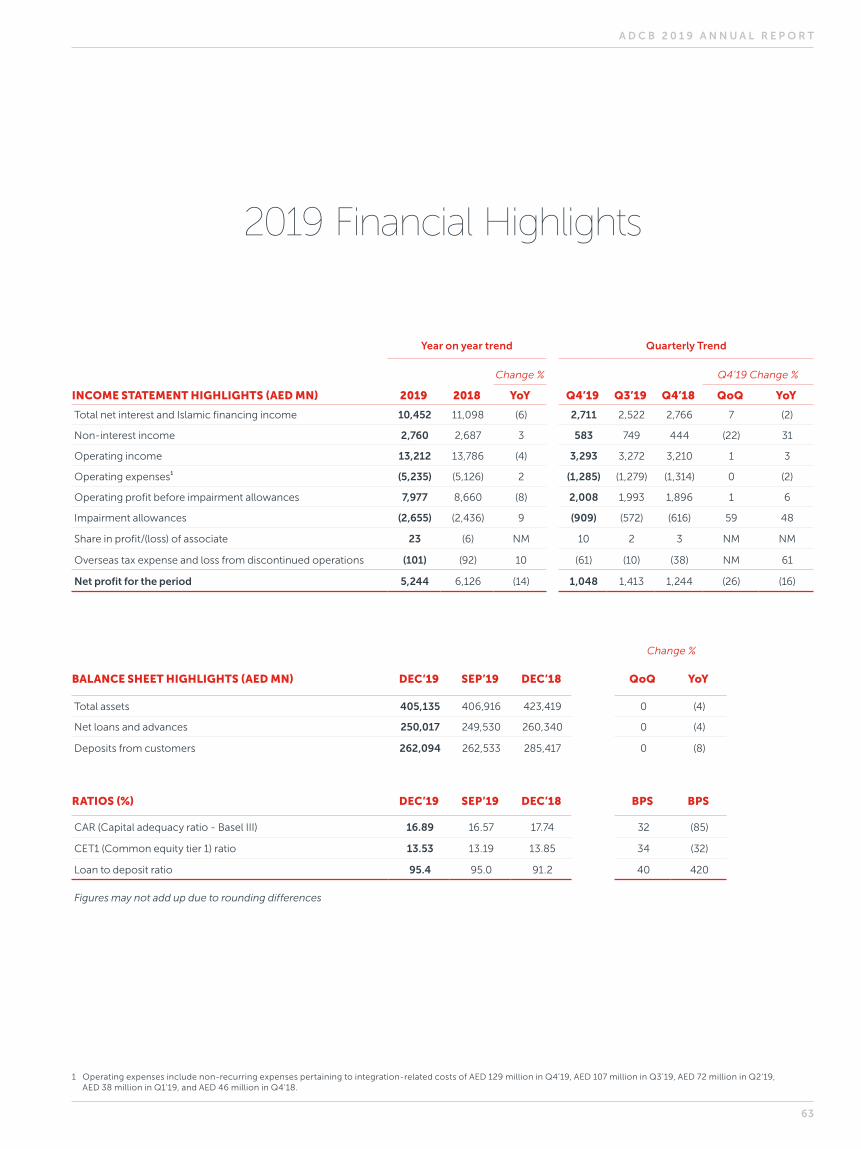
2019 Financial Highlights
Year on year trend Quarterly Trend
Change % Q4’19 Change %
INCOME STATEMENT HIGHLIGHTS (AED MN) 2019 2018 YoY Q4’19 Q3’19 Q4’18 QoQ YoY
Total net interest and Islamic financing income 10,452 11,098 (6) 2,711 2,522 2,766 7 (2)
Non-interest income 2,760 2,687 3 583 749 444 (22) 31
Operating income 13,212 13,786 (4) 3,293 3,272 3,210 1 3
Operating expenses1 (5,235) (5,126) 2 (1,285) (1,279) (1,314) 0 (2)
Operating profit before impairment allowances 7,977 8,660 (8) 2,008 1,993 1,896 1 6
Impairment allowances (2,655) (2,436) 9 (909) (572) (616) 59 48
Share in profit/(loss) of associate 23 (6) NM 10 2 3 NM NM
Overseas tax expense and loss from discontinued operations (101) (92) 10 (61) (10) (38) NM 61
Net profit for the period 5,244 6,126 (14) 1,048 1,413 1,244 (26) (16)
Change %
BALANCE SHEET HIGHLIGHTS (AED MN) DEC‘19 SEP’19 DEC’18 QoQ YoY
Total assets 405,135 406,916 423,419 0 (4)
Net loans and advances 250,017 249,530 260,340
0 (4)
Deposits from customers 262,094 262,533 285,417 0 (8)
RATIOS (%) DEC’19 SEP’19 DEC’18 BPS BPS
CAR (Capital adequacy ratio - Basel III) 16.89 16.57 17.74 32 (85)
CET1 (Common equity tier 1) ratio 13.53 13.19 13.85 34 (32)
Loan to deposit ratio 95.4 95.0 91.2 40 420
Figures may not add up due to rounding differences
1 Operating expenses include non-recurring expenses pertaining to integration-related costs of AED 129 million in Q4’19, AED 107 million in Q3’19, AED 72 million in Q2’19, AED 38 million in Q1’19, and AED 46 million in Q4’18.
A D C B 2 0 1 9 A N N U A L R E P O R T
63
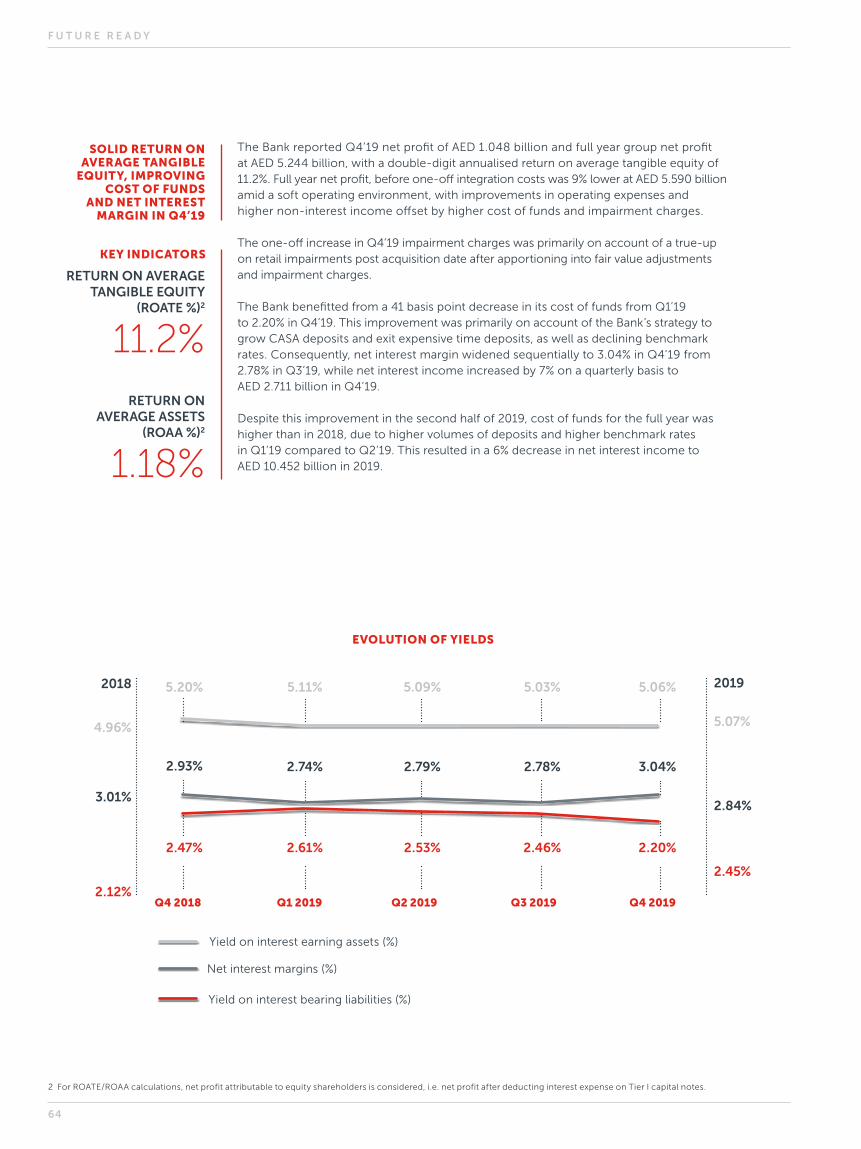
EVOLUTION OF YIELDS
Yield on interest earning assets (%)
Yield on interest bearing liabilities (%)
Net interest margins (%)
5.07%
2.84%
2.45%
2019
4.96%
3.01%
2.12%
2018
Q4 2018 Q1 2019 Q2 2019 Q3 2019 Q4 2019
5.20%
2.93%
2.47%
5.11%
2.74%
2.61%
5.09%
2.79%
2.53%
5.03%
2.78%
2.46%
5.06%
3.04%
2.20%
2 For ROATE/ROAA calculations, net profit attributable to equity shareholders is considered, i.e. net profit after deducting interest expense on Tier I capital notes.
The Bank reported Q4’19 net profit of AED 1.048 billion and full year group net profit at AED 5.244 billion, with a double-digit annualised return on average tangible equity of 11.2%. Full year net profit, before one-off integration costs was 9% lower at AED 5.590 billion amid a soft operating environment, with improvements in operating expenses and higher non-interest income offset by higher cost of funds and impairment charges.
The one-off increase in Q4’19 impairment charges was primarily on account of a true-up on retail impairments post acquisition date after apportioning into fair value adjustments and impairment charges.
The Bank benefitted from a 41 basis point decrease in its cost of funds from Q1’19 to 2.20% in Q4’19. This improvement was primarily on account of the Bank’s strategy to grow CASA deposits and exit expensive time deposits, as well as declining benchmark rates. Consequently, net interest margin widened sequentially to 3.04% in Q4’19 from 2.78% in Q3’19, while net interest income increased by 7% on a quarterly basis to AED 2.711 billion in Q4’19.
Despite this improvement in the second half of 2019, cost of funds for the full year was higher than in 2018, due to higher volumes of deposits and higher benchmark rates in Q1’19 compared to Q2’19. This resulted in a 6% decrease in net interest income to AED 10.452 billion in 2019.
SOLID RETURN ON AVERAGE TANGIBLE
EQUITY, IMPROVING COST OF FUNDS
AND NET INTEREST MARGIN IN Q4’19
RETURN ON AVERAGE ASSETS
(ROAA %)2
1.18%
RETURN ON AVERAGE TANGIBLE EQUITY
(ROATE %)2
11.2%
KEY INDICATORS
F U T U R E R E A D Y
64

COST-TO-INCOME RATIO EXCLUDING INTEGRATION-RELATED COSTS
Q4 2018 Q3 2019 Q4 2019
39.5%35.8%
35.1%
-440 BPS
Full year non-interest income of AED 2.760 billion was up 3% year on year, largely due to a narrower revaluation loss on investment properties over 2018. Net fees and commission income was 4% lower at AED 1.996 billion, primarily attributable to lower loan processing fees. Trading income also decreased due to lower gains from foreign exchange and securities trading.
Q4‘19 results reflect the positive impact of the merger, with synergies and greater efficiencies resulting in a year-on-year decrease in operating expenses and a rise in operating profit. Operating expenses for Q4’19 were 2% lower year on year at AED 1.285 billion, and 9% lower when excluding one-off integration related costs. Cost to income ratio for the quarter, excluding integration-related costs, stood at 35.1% compared to 39.5% for the same period last year — an improvement of 440 basis points. Operating profit before impairment allowances increased by 6% to AED 2.008 billion year on year in Q4, and was up 10% when excluding integration-related costs.
In October 2019, the Group made an upward revision of run-rate synergy targets to AED 840 million, from the initial assessment of AED 615 million. The Bank has realised synergies of AED 350 million to date, while integration costs — at AED 346 million to date — are in line with the planned one-off integration expenditure of AED 980 million.
MERGER BENEFITS MATERIALISING THROUGH
SUSTAINABLE REDUCTION OF COST BASE, Q4’19 COST TO
INCOME RATIO IMPROVED
440 BASIS POINTS YEAR-ON-YEAR
A D C B 2 0 1 9 A N N U A L R E P O R T
65

The Group’s balance sheet remains strong, with total assets standing at AED 405 billion as at 31 December 2019. Following the merger with Union National Bank and acquisition of Al Hilal Bank, the Bank is continuing with a comprehensive purchase price allocation (PPA) process, which is expected to be completed by the first quarter of 2020.
Net loans to customers were at AED 250 billion, a decline of 4% from 31 December 2018, mainly on account of a rise in corporate repayments and fair value adjustments. Total customer deposits decreased 8% to AED 262 billion, driven by the Bank’s strategic decision to exit expensive time deposits. Year-on-year, time deposits decreased by 16% to AED 160 billion, while CASA balances increased by AED 7 billion (8%) to AED 102 billion. CASA deposits comprised 39% of total customer deposits compared to 33.1% as at 31 December 2018.
As at 31 December 2019, the non-performing loan ratio (NPL) was 3.16%, while NPL ratio including net POCI (purchase or originated credit impaired) assets stood at 4.53%. Total impairment allowances were AED 10.464 billion, while the provision coverage ratio improved to 123.2%3 from 112.7% at the prior year end. Non-performing loans declined to AED 8.491 billion and net POCI assets (loans only) were AED 3.710 billion. As at 31 December 2019, cost of risk was 0.80%, compared to 0.74% a year earlier.
RESILIENT BALANCE SHEET, SIGNIFICANT INCREASE IN LOW-COST
CASA DEPOSITS
3 Includes fair value adjustments on loans and advances of AED 3.2 billion for computing coverage ratio.
4.53% NPL ratio including POCI, net
2018 2018 2018
NPL RATIO PROVISION COVERAGE RATIO COST OF RISK
3.84%
112.7%
0.74%
2019 2019 2019
3.16% 123.2%3
0.80%
F U T U R E R E A D Y
66
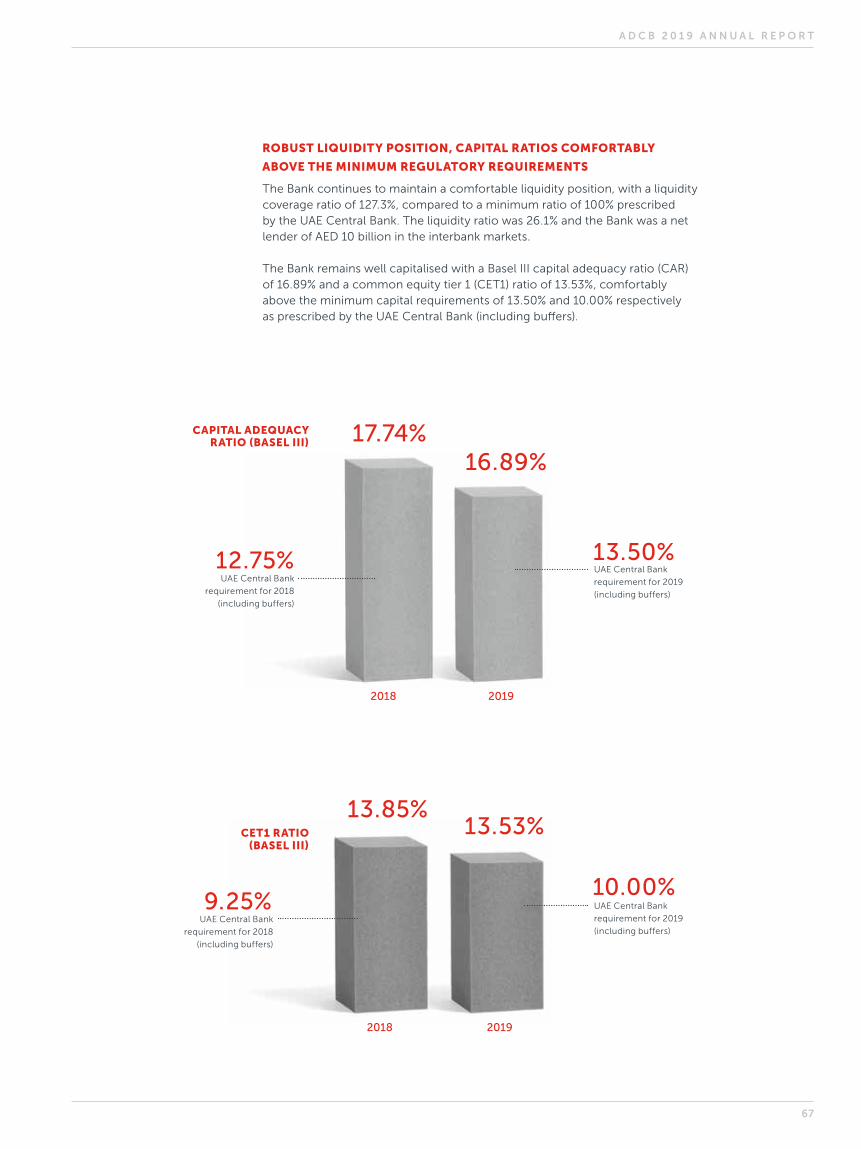
2018
2018
2019
2019
CAPITAL ADEQUACY RATIO (BASEL III)
CET1 RATIO (BASEL III)
ROBUST LIQUIDITY POSITION, CAPITAL RATIOS COMFORTABLY
ABOVE THE MINIMUM REGULATORY REQUIREMENTS
The Bank continues to maintain a comfortable liquidity position, with a liquidity coverage ratio of 127.3%, compared to a minimum ratio of 100% prescribed by the UAE Central Bank. The liquidity ratio was 26.1% and the Bank was a net lender of AED 10 billion in the interbank markets.
The Bank remains well capitalised with a Basel III capital adequacy ratio (CAR) of 16.89% and a common equity tier 1 (CET1) ratio of 13.53%, comfortably above the minimum capital requirements of 13.50% and 10.00% respectively as prescribed by the UAE Central Bank (including buffers).
12.75%
17.74%
13.85%
9.25%
16.89%
13.50%
13.53%
10.00%
UAE Central Bank
requirement for 2019
(including buffers)
UAE Central Bank
requirement for 2019
(including buffers)UAE Central Bank
requirement for 2018
(including buffers)
UAE Central Bank
requirement for 2018
(including buffers)
A D C B 2 0 1 9 A N N U A L R E P O R T
67
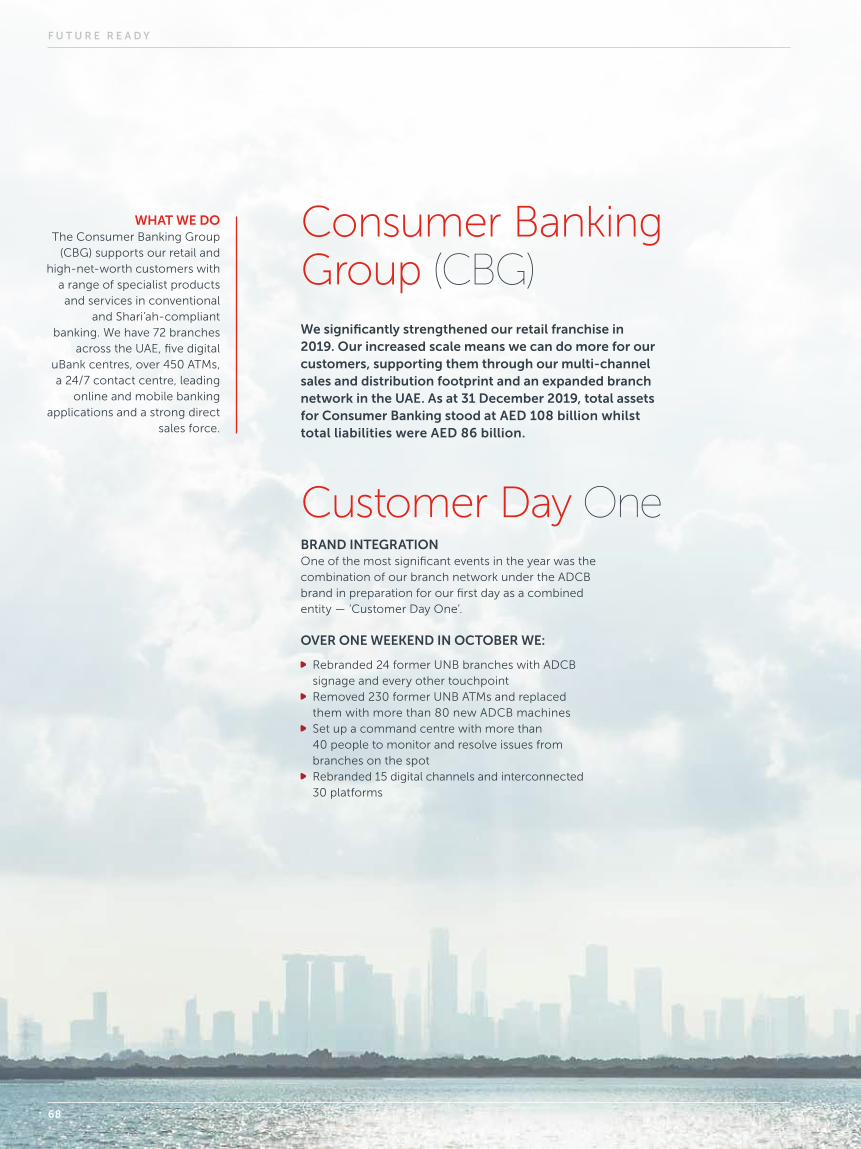
Consumer Banking Group (CBG)We significantly strengthened our retail franchise in 2019. Our increased scale means we can do more for our customers, supporting them through our multi-channel sales and distribution footprint and an expanded branch network in the UAE. As at 31 December 2019, total assets for Consumer Banking stood at AED 108 billion whilst total liabilities were AED 86 billion.
Customer Day OneBRAND INTEGRATIONOne of the most significant events in the year was the combination of our branch network under the ADCB brand in preparation for our first day as a combined entity — ‘Customer Day One’.
OVER ONE WEEKEND IN OCTOBER WE:
Rebranded 24 former UNB branches with ADCB signage and every other touchpoint
Removed 230 former UNB ATMs and replaced them with more than 80 new ADCB machines
Set up a command centre with more than 40 people to monitor and resolve issues from branches on the spot
Rebranded 15 digital channels and interconnected 30 platforms
WHAT WE DOThe Consumer Banking Group
(CBG) supports our retail and high-net-worth customers with
a range of specialist products and services in conventional
and Shari’ah-compliant banking. We have 72 branches
across the UAE, five digital uBank centres, over 450 ATMs, a 24/7 contact centre, leading
online and mobile banking applications and a strong direct
sales force.
F U T U R E R E A D Y
68

Within only five months of the legal merger of ADCB and UNB on 1 May 2019, we combined the branch and ATM networks in the UAE and rolled out the ADCB brand across all customer channels. Since early October, we have served all of our customers, whether ADCB or former UNB, at an expanded network of 72 branches and more than 450 ATMs, providing consistent and high-quality service. This was a key milestone in delivering a unified and enhanced banking experience to over one million customers under the ADCB brand.
We spent months carefully planning and preparing for the switch, working with teams from across the two banks to accelerate our progress towards full integration. It was essential to provide seamless interoperability between ADCB and former UNB branches to ensure that customers could continue to carry out their daily transactions without disruption.
Interoperability ensured that ADCB customers could be served at former UNB branches and ATMs, and UNB customers could do the same at ADCB. Customers welcomed the transition, with interoperable transactions immediately accounting for a high proportion of total branch transactions.
This success was the result of detailed planning, close cross-functional coordination and rigorous operational implementation. Extensive staff training ensured consistent service standards across the Bank, while a phased communication campaign provided customers with timely information on all changes and new banking opportunities.
A D C B 2 0 1 9 A N N U A L R E P O R T
69
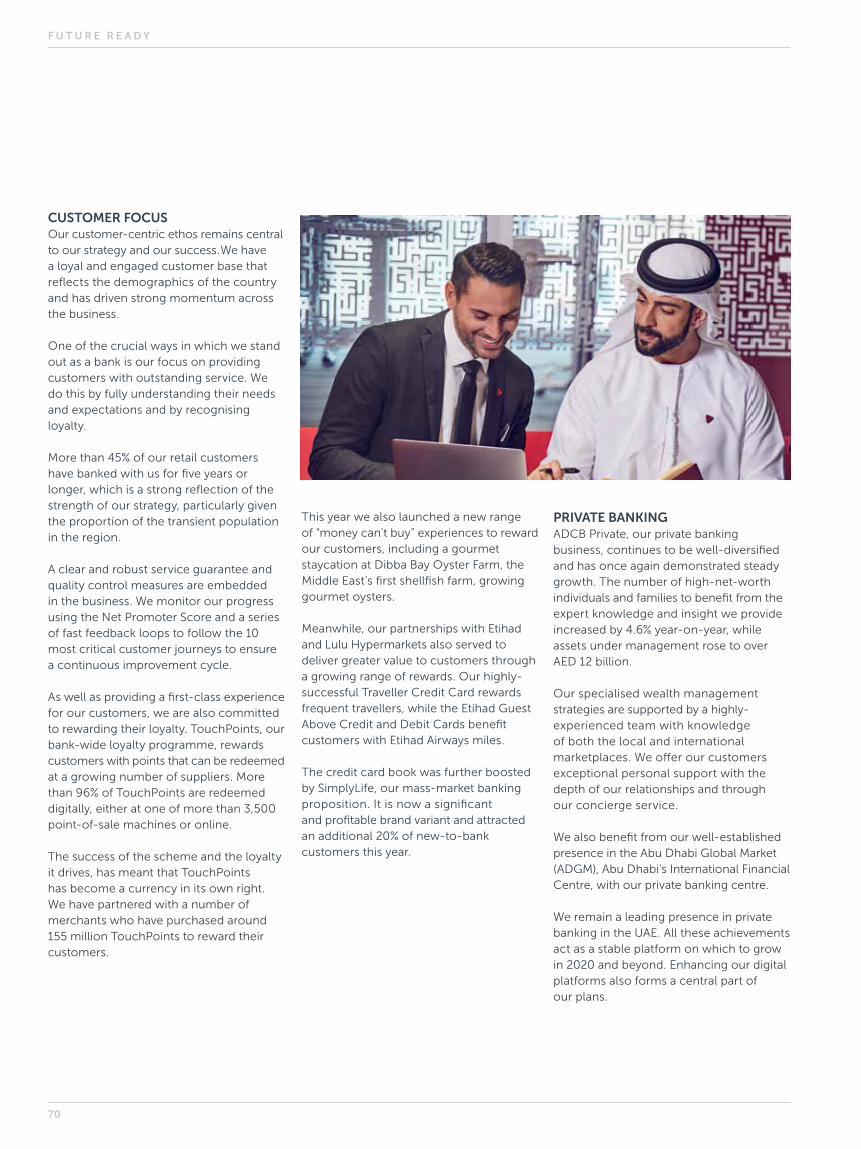
CUSTOMER FOCUSOur customer-centric ethos remains central to our strategy and our success. We have a loyal and engaged customer base that reflects the demographics of the country and has driven strong momentum across the business.
One of the crucial ways in which we stand out as a bank is our focus on providing customers with outstanding service. We do this by fully understanding their needs and expectations and by recognising loyalty.
More than 45% of our retail customers have banked with us for five years or longer, which is a strong reflection of the strength of our strategy, particularly given the proportion of the transient population in the region.
A clear and robust service guarantee and quality control measures are embedded in the business. We monitor our progress using the Net Promoter Score and a series of fast feedback loops to follow the 10 most critical customer journeys to ensure a continuous improvement cycle.
As well as providing a first-class experience for our customers, we are also committed to rewarding their loyalty. TouchPoints, our bank-wide loyalty programme, rewards customers with points that can be redeemed at a growing number of suppliers. More than 96% of TouchPoints are redeemed digitally, either at one of more than 3,500 point-of-sale machines or online.
The success of the scheme and the loyalty it drives, has meant that TouchPoints has become a currency in its own right. We have partnered with a number of merchants who have purchased around 155 million TouchPoints to reward their customers.
This year we also launched a new range of “money can’t buy” experiences to reward our customers, including a gourmet staycation at Dibba Bay Oyster Farm, the Middle East’s first shellfish farm, growing gourmet oysters.
Meanwhile, our partnerships with Etihad and Lulu Hypermarkets also served to deliver greater value to customers through a growing range of rewards. Our highly-successful Traveller Credit Card rewards frequent travellers, while the Etihad Guest Above Credit and Debit Cards benefit customers with Etihad Airways miles.
The credit card book was further boosted by SimplyLife, our mass-market banking proposition. It is now a significant and profitable brand variant and attracted an additional 20% of new-to-bank customers this year.
PRIVATE BANKINGADCB Private, our private banking business, continues to be well-diversified and has once again demonstrated steady growth. The number of high-net-worth individuals and families to benefit from the expert knowledge and insight we provide increased by 4.6% year-on-year, while assets under management rose to over AED 12 billion.
Our specialised wealth management strategies are supported by a highly-experienced team with knowledge of both the local and international marketplaces. We offer our customers exceptional personal support with the depth of our relationships and through our concierge service.
We also benefit from our well-established presence in the Abu Dhabi Global Market (ADGM), Abu Dhabi’s International Financial Centre, with our private banking centre.
We remain a leading presence in private banking in the UAE. All these achievements act as a stable platform on which to grow in 2020 and beyond. Enhancing our digital platforms also forms a central part of our plans.
F U T U R E R E A D Y
70

DIGITAL ENHANCEMENTBuilding on our success, we continued the pace of our digital transformation initiatives that focused on customer acquisition and engagement as well as asset penetration and wealth management.
With the launch of Hayyak, a new onboarding application, we gave customers an easier and faster way to open a new account, cutting the time it takes from days to just a few minutes. 34% of all new accounts opened this year have been through this platform. We are already working on introducing a new loan facility that will give successful applicants access to cash in less than 15 minutes on their smartphone.
MoneyBuddy, launched last year, remains our fastest-growing mobile application ever. The personal finance management tool enables customers to analyse their spending, manage expenses, and set savings goals with ease. More than 20,000 users signed up in the first four months after launch and numbers have been increasing steadily every month.
More than 75% of our customers now connect to the Bank via digital channels and the number continues to grow. Digital banking is the first choice for customers and is driving a substantial increase in the number of transactions. Mobile Banking is also the preferred channel for cross-border remittances, where we have a healthy share in a growing market.
To support this, we made enhancements across our mobile banking applications, adding functionality and dual-language support in Arabic and English. At the same time, we introduced Apple Pay and Samsung Pay digital wallets, and increased personal controls on credit card usage. This has helped us to improve our market share of digital wallet transactions, while boosting our share of credit card spend to 14.5%.
MERCHANT SERVICESThrough our highly-successful merchant acquiring business, we supported almost 4,500 companies with flexible, secure and comprehensive payment solutions — an increase of 80% over 2018.
Set up just three years ago, the business has already established a 4% market share. It supports a range of merchants across the UAE with secure, end-to-end solutions for a broad range of products and services across sectors that include education, transportation, government and retail.
This year alone, there were more than 40 million transactions through some 15,000 terminals in 6,500 locations across the country, driven predominantly by our existing customers.
We are positive about our growth in 2020 as we continue to lead the way in consumer banking in the UAE. We will maintain our focus on providing our customers with the best products and services to help drive their ambition.
ISLAMIC BANKINGADCB is now the fourth-largest Islamic banking franchise in the UAE, offering a wide range of Shari’ah-compliant products and services. With the acquisition of Al Hilal Bank, which is dedicated exclusively to digital retail Islamic banking products and services, the Group now has a strong market share and is well-positioned for greater growth. You can read more about Al Hilal Bank on page 40.
Demand for Islamic banking products and services continue to grow as customers look for more ethical ways to deposit or to borrow money.
In 2019, we continued to build on our strong platform with a sustained focus on providing greater innovation and an enhanced customer experience. All this is designed to give customers frictionless access to a set of robust Islamic banking products and services.
To underpin our expertise, our Islamic banking team benefits from an extensive training and development programme. This year our Islamic Banking Academy enrolled more than 1,600 employees in face-to-face classroom sessions as well as a full range of online courses. This training helps to raise awareness of the benefits of Shari’ah-compliant banking and ensures we are better able to provide our customers with the support and advice they need.
Next year, we will further consolidate our position as a leading Islamic banking franchise by offering more innovative products, delivering a superior customer experience and providing omnichannel access. Using data-driven customer insights and digital delivery, we will also focus on expanding our share in the finance, cards and deposit space.
A D C B 2 0 1 9 A N N U A L R E P O R T
71
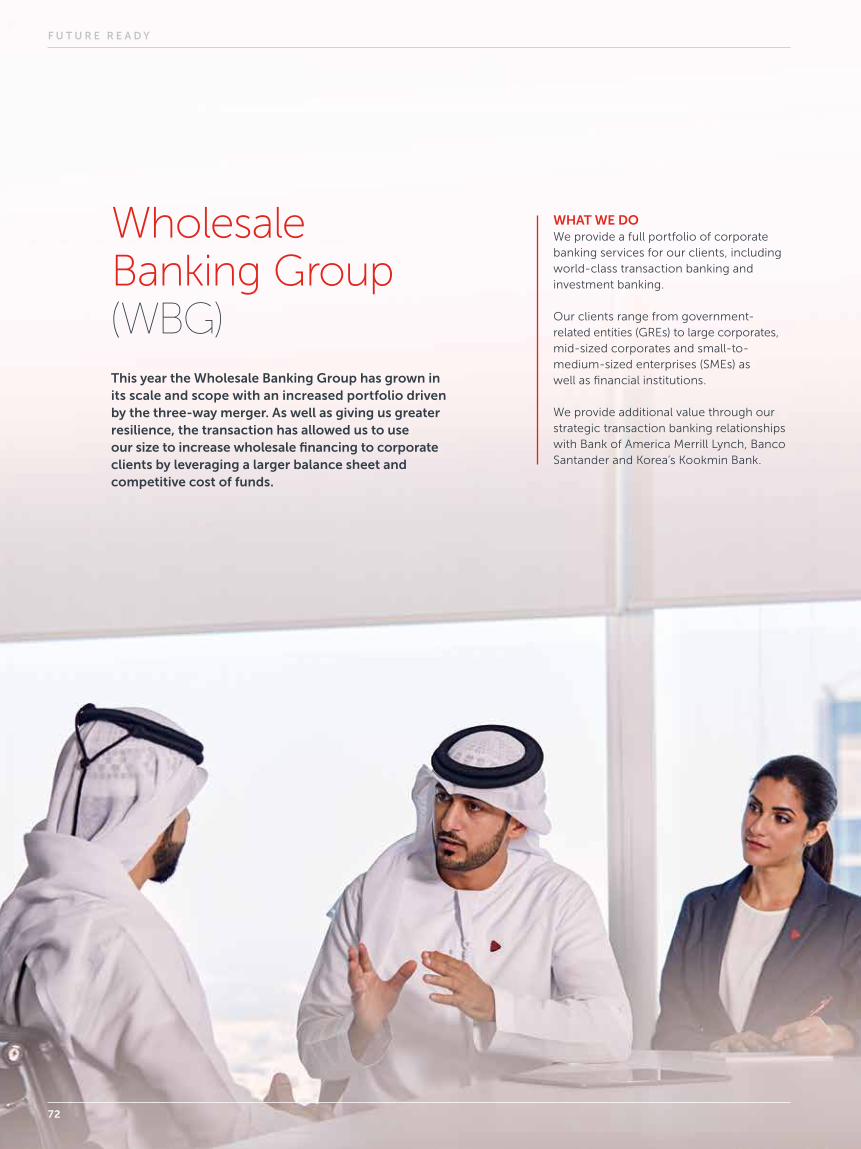
WHAT WE DOWe provide a full portfolio of corporate banking services for our clients, including world-class transaction banking and investment banking.
Our clients range from government-related entities (GREs) to large corporates, mid-sized corporates and small-to-medium-sized enterprises (SMEs) as well as financial institutions.
We provide additional value through our strategic transaction banking relationships with Bank of America Merrill Lynch, Banco Santander and Korea’s Kookmin Bank.
Wholesale Banking Group (WBG)This year the Wholesale Banking Group has grown in its scale and scope with an increased portfolio driven by the three-way merger. As well as giving us greater resilience, the transaction has allowed us to use our size to increase wholesale financing to corporate clients by leveraging a larger balance sheet and competitive cost of funds.
F U T U R E R E A D Y
72

As at 31 December 2019, total assets for Wholesale Banking stood at AED 171 billion, whilst total liabilities were AED 129 billion.
We have boosted our deposit and CASA business by delivering our distinctive cash management proposition to a broader base. We have also been able to provide more support to mid-sized corporates and SMEs.
Driven by our strategic focus on the UAE market, we have exited our operations in India. In 2019, our banking portfolio, which comprised AED 355 million in assets and AED 601 million in liabilities, was sold to DCB Bank, a private commercial bank based in India, at par. The deal had no impact on the Bank’s profitability.
SEAMLESS INTEGRATION The migration of Al Hilal Bank’s Wholesale Banking and SME portfolios was fast-tracked into the ADCB Islamic Wholesale Banking platform just a few months after the legal merger. This was achieved without any disruption to clients and paved the way for growth across an enlarged loan book, in line with our plan.
The migration was delivered seamlessly thanks to excellent forward-planning and a highly-motivated team who were well-prepared. The experience meant we were better equipped for the integration of the UNB wholesale book. We successfully migrated half of the total portfolio in 2019, with full migration expected in the first quarter in 2020.
LEADING THE WAYOur performance is underpinned by the power and depth of our client relationships and the strength of our industry knowledge. We also provide a diverse range of wholesale products and services and industry-leading advice. This provides the Bank with a distinct advantage and sets us apart from our competitors.
Our award-winning cash management business leads the way in the UAE, supporting a growing number of customers with their collection, payment, and reporting and reconciliation needs.
By offering outstanding customer service and innovation across our digital channels, we are continuing to make banking more straightforward and secure for our clients.
This year, we were the first Bank to roll out a new Virtual Accounts service — one of the biggest developments in cash management technology in banking in recent years. The solution provides support for any company which deals with numerous clients and suppliers who want to improve the reconciliation of financial statements.
Under just one physical account, we can create an unlimited number of virtual accounts that link to it. By reducing the need for physical accounts, the service promotes clarity and saves cost without compromising on functionality or reporting.
We already have a growing number of customers who have benefitted from the solution. These include Etihad Aviation Group and Abu Dhabi National Oil Company (ADNOC), the leading distributor of fuels to commercial, industrial and government customers throughout the UAE. You can read more about our partnership with ADNOC on page 76.
A D C B 2 0 1 9 A N N U A L R E P O R T
73
Against a backdrop of ongoing challenges in the economy and stricter credit criteria, we continued our strong support for the mid-corporate and SME sectors.
In 2019, we onboarded 2,938 new SME customers and provided 10,800 new loan facilities. In our mid-corporate business, we onboarded 371 new customers. An average of 91% of mid-corporate and 89% of SME transactions were performed on automated platforms and channels, reflecting our advanced digital capabilities.
The Bank was also very active in its support for the Government and GRE sector, where we continued to deepen our involvements, while enhancing our performance.
We have a strong relationship with the Real Estate Regulatory Agency. Driven by the real estate sector, we are now the largest Escrow bank in the country, operating in four of the seven Emirates. With more than a decade of experience in Escrow management, we provide end-to-end solutions to protect the funds of both buyers and developers. This growth has been as a result of the service and technology we have been able to provide.
The customer experience is an essential part of our strategic drive, and we regularly monitor our Net Promoter Score, which measures how likely customers are to recommend us. Our scores are some of the highest in the Bank, clearly demonstrating the level of service and support we provide our customers.
In 2019, we played a significant part in many deals that helped to support and strengthen the economy and infrastructure across the UAE. Our financing activities continued to play a critical role in how we supported our larger transactions and added significant value to the Bank.
We worked on a number of mandates across all sectors in 2019. These included:
Working with National Paints, the largest paint business in the UAE, to underwrite a loan for a restructure of the company
Acting as the sole initial mandated lead arranger, bookrunner and underwriter for a USD 300 million seven-year unsecured term loan for Dubai Aerospace
Refinancing support for Tecom worth AED 650 million of the overall AED 7 billion refinancing package
Supporting Meraas Holdings in their AED 4.7 billion syndicated loan transaction
This year we also broadened the scope of our investment bank to provide a greater focus on our strategy to ‘originate to distribute’ by underwriting transactions, which are subsequently syndicated. This invaluable support helps our clients to grow.
Transactions range from landmark deals to local mid-corporates, as well as financial institutions. The expansion of this capability has enabled the Bank to become an active and influential player in the domestic market with a distribution network that spans the GCC, wider Asia, Europe, Africa and the Americas.
F U T U R E R E A D Y
74
DIGITAL ENHANCEMENTThe ongoing investment we make in technology and our digital channels continued to attract new clients who appreciate the ease and security that we provide. We are committed to incorporating technology that creates value for customers and the business.
We continued our efforts to automate how clients engage with us from a transaction perspective. This has been driven by ProCash, our cash management platform. It offers businesses an efficient, convenient and safe way to manage money online and now services over 25,000 users. For example, well over half of all documentary trade is now processed online, straight-through on our ProCash platform.
In 2019, we launched a new service into the market called Trade Booster. This is an alliance with 12 global banks, led by Banco Santander, which provides our SME and mid-corporate clients with a portal through which they can link to customers and suppliers across the world.
The platform has already helped to further empower the UAE economy by making it easier and faster for companies to connect with new markets and suppliers and to create seamless supply chains.
This year we also became the first Bank in the UAE to run an end-to-end blockchain trade finance transaction worth USD 6.5 million. The deal involved moving goods for Western Red Spring Canadian Wheat from Canada to Bangladesh. ADCB’s private network provided end-to-end trade visibility across the entire life cycle of the transaction with authenticated and consented digitised documents at every step.
The efficiencies stem from using a single blockchain network for all participants, instead of relying on multiple systems. As global trades intertwine and evolve, demands for a networked and collaborative model will intensify. Not only do transactions need to be seamless and safe, but clients are also increasingly looking for innovative solutions that save them time and costs.
Elsewhere, we partnered with “noqodi”, a leading payment gateway and financial service provider in the UAE by emaratech, to extend their digital footprint in the payment domain. The partnership allows multiple payment channels from ADCB for businesses and individuals. In addition it includes a top-up facility for their noqodi wallet through ProCash.
PARTNERSHIPSWe enjoy strong strategic banking partnerships with Bank of America, Banco Santander and Kookmin Bank, which continue to add value to our business. These relationships add to our reach and have attracted higher flows of revenue into the UAE. This year’s successful launch of Trade Booster was a direct result of this partnership.
Meanwhile, our multinational banking unit is the fastest-growing part of WBG. Driven by the two bankers seconded to us from Kookmin Bank, we have rapidly gained market share in Korea and delivered growing revenues. We are working on similar initiatives elsewhere.
FUTURE FOCUSNext year we will continue with the momentum we have built up, leveraging our scale and capitalising on a reinvigorated SME and mid-corporate franchise. We remain committed and extremely active in developing our partnerships in the Government and GRE sectors, helping the UAE to flourish and thrive.
We will also focus on creating the right mix of business, particularly on the liabilities side and driving that through enhanced capabilities across all our digital platforms.
We expect to further grow our trade business by keeping up the pace of digitisation in cash, trade, lending, onboarding and by our commitment to best-in-class customer service. We expect virtual accounts to grow, attracting higher numbers of clients across the UAE.
75
A D C B 2 0 1 9 A N N U A L R E P O R T
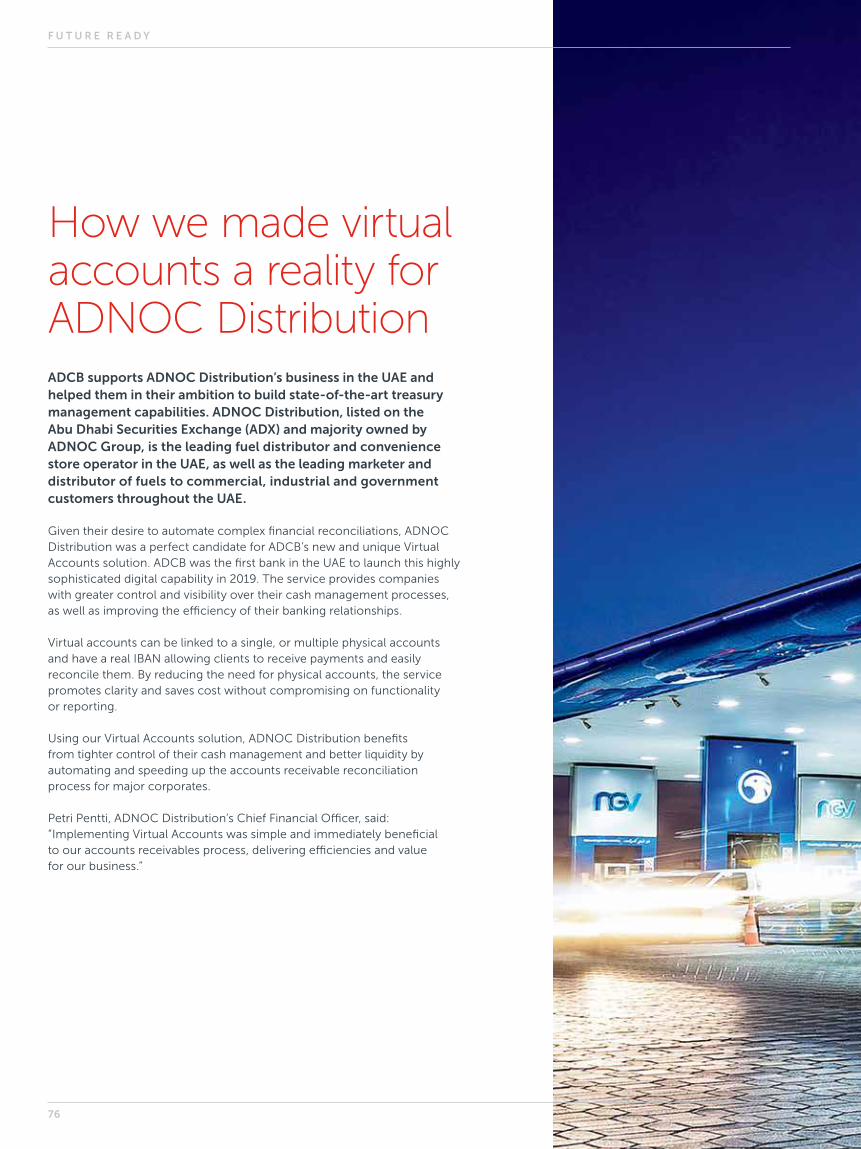
How we made virtual accounts a reality for ADNOC DistributionADCB supports ADNOC Distribution’s business in the UAE and helped them in their ambition to build state-of-the-art treasury management capabilities. ADNOC Distribution, listed on the Abu Dhabi Securities Exchange (ADX) and majority owned by ADNOC Group, is the leading fuel distributor and convenience store operator in the UAE, as well as the leading marketer and distributor of fuels to commercial, industrial and government customers throughout the UAE.
Given their desire to automate complex financial reconciliations, ADNOC Distribution was a perfect candidate for ADCB’s new and unique Virtual Accounts solution. ADCB was the first bank in the UAE to launch this highly sophisticated digital capability in 2019. The service provides companies with greater control and visibility over their cash management processes, as well as improving the efficiency of their banking relationships.
Virtual accounts can be linked to a single, or multiple physical accounts and have a real IBAN allowing clients to receive payments and easily reconcile them. By reducing the need for physical accounts, the service promotes clarity and saves cost without compromising on functionality or reporting.
Using our Virtual Accounts solution, ADNOC Distribution benefits from tighter control of their cash management and better liquidity by automating and speeding up the accounts receivable reconciliation process for major corporates.
Petri Pentti, ADNOC Distribution’s Chief Financial Officer, said: “Implementing Virtual Accounts was simple and immediately beneficial to our accounts receivables process, delivering efficiencies and value for our business.”
F U T U R E R E A D Y
76

A D C B 2 0 1 9 A N N U A L R E P O R T
77
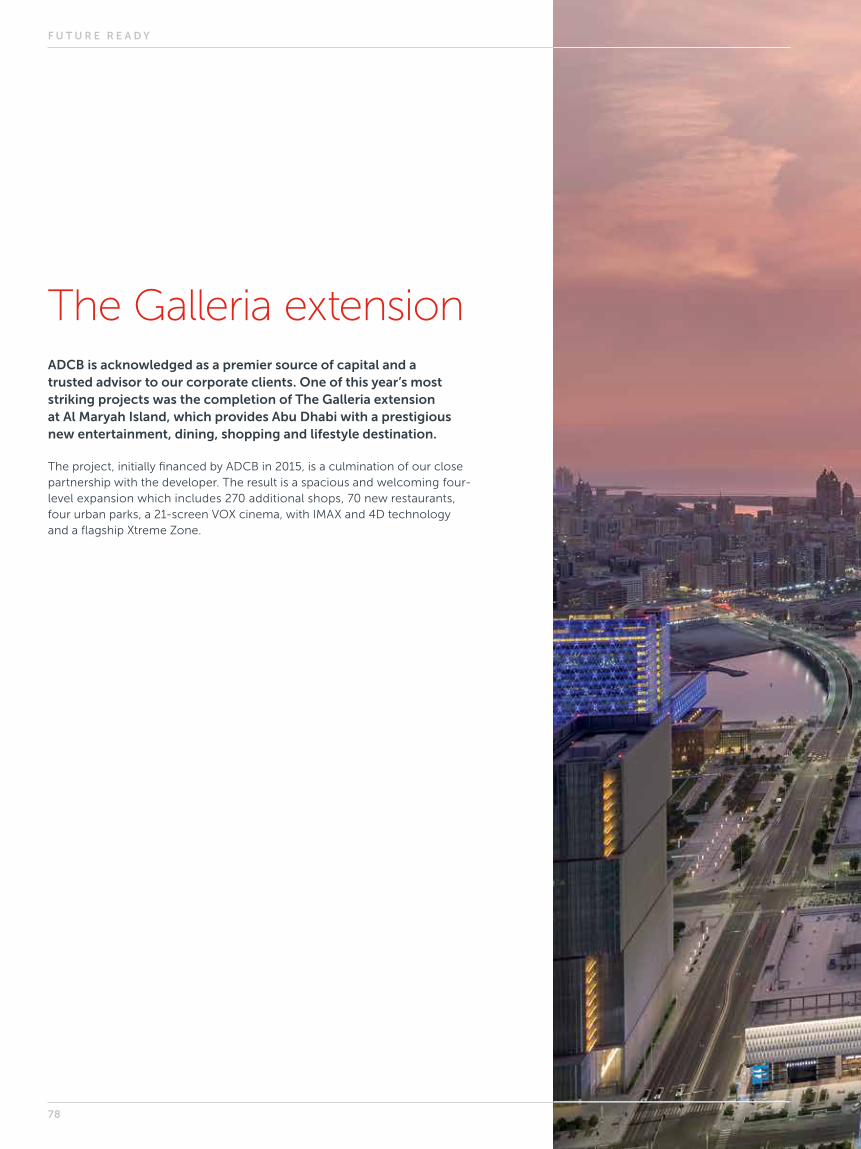
The Galleria extensionADCB is acknowledged as a premier source of capital and a trusted advisor to our corporate clients. One of this year’s most striking projects was the completion of The Galleria extension at Al Maryah Island, which provides Abu Dhabi with a prestigious new entertainment, dining, shopping and lifestyle destination.
The project, initially financed by ADCB in 2015, is a culmination of our close partnership with the developer. The result is a spacious and welcoming four-level expansion which includes 270 additional shops, 70 new restaurants, four urban parks, a 21-screen VOX cinema, with IMAX and 4D technology and a flagship Xtreme Zone.
F U T U R E R E A D Y
78

A D C B 2 0 1 9 A N N U A L R E P O R T
79
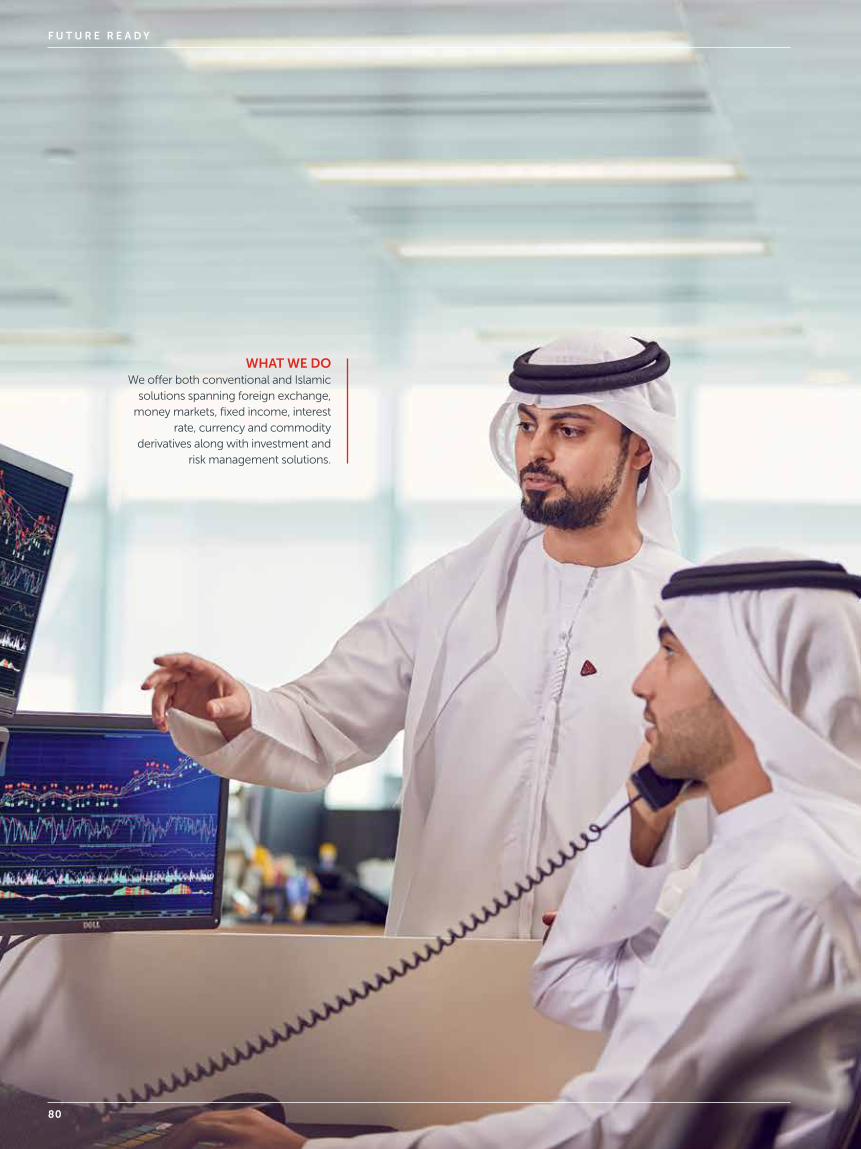
WHAT WE DOWe offer both conventional and Islamic
solutions spanning foreign exchange, money markets, fixed income, interest
rate, currency and commodity derivatives along with investment and
risk management solutions.
80
F U T U R E R E A D Y

The impact of this year’s merger did not distract us from our task. Advanced diligent planning, seamless execution and strong industry expertise meant we were able to integrate the Treasury functions of Al Hilal Bank and Union National Bank (UNB) just days after the legal merger in May. The process, which involved migrating around 30% of UNB’s balance sheet, was seamless with no disruption to business as usual for any of our customers. It also allowed the Bank to achieve greater synergies.
In the capital markets, Treasury celebrated a stellar year recording the highest wholesale funding in ADCB Group’s history with a total of USD 3.8 billion raised in one calendar year. This was achieved by further diversifying funding formats and enlarging the Bank’s geographical coverage. The major deals completed this year were:
Three Formosa issuances totalling USD 385 million
First Indonesian Rupiah (IDR) bond issuance cash settled in US dollars (USD 140 million)
A 5.5-year CHF 200 million bond
Three five-year bond issuances totalling USD 715 million
Loan facilities totalling USD 975 million
In 2019, Treasury improved on its Net Promoter Score for the fifth consecutive year, which is a testament to the success of our client-centric culture and our aspiration to provide the best customer experience. In a time of transformation driven mainly by the information technology revolution, digital is one of the ways we are enhancing the customer experience and making banking easier, more efficient, and safer in Treasury. This year we added capabilities to Go Trade, our FX platform, providing clients with greater functionality. The platform continued to attract a growing number of customers, with users increasing by 24% at 31 December 2019. The bulk of transactions — around 95% — are now straight-through processing, reducing time and cost for clients and the Bank.
While plans for the LIBOR transition are likely to be a significant task for banks across the spectrum, our plans are already well-advanced, and we are considering the impact not only from a Treasury perspective but also that of the balance sheet.
As we move into 2020, we will continue to adapt our strategy to navigate the headline-driven volatility from emerging global trends.
Treasury and Investments GroupTreasury once again demonstrated a strong performance in 2019. Prudent balance sheet management, a healthy investment book and tactical interest rate views served to protect our profitability against a backdrop of falling interest rates and helped us navigate the headwinds of a volatile global marketplace.
A D C B 2 0 1 9 A N N U A L R E P O R T
81

WHAT WE DOProperty Management
operates through our wholly-owned subsidiaries, Abu Dhabi
Commercial Engineering Services (ADCE) and Abu Dhabi
Commercial Properties (ADCP). In addition, Property
Management oversees ADCB’s investment properties
and returns.
Property ManagementThis year we strengthened our position as a leading player in the UAE real estate sector, both in terms of our property management capabilities and our service proposition.
F U T U R E R E A D Y
82
ADCEADCE continued to deliver high-quality commercial buildings, within time and on budget, working closely with authorities to maintain and improve the highest standards of construction in Abu Dhabi.
The unique nature of the ADCE business model, coupled with ADCB’s governance principles have helped foster industry best practice. ADCE’s constant focus on adherence to policies and procedures help reinforce our high standards of professionalism, accountability and due diligence. This is further magnified by frequent audit efforts that reinforce our commitment to a continued level of service excellence.
ADCE remains the partner of choice for sizable and complex regional development projects. We deliver a full range of building design and construction development services, with a particular focus on efficiency. We have three core portfolios — government, private and technical services. Our projects range in value from AED 50 million to AED 1 billion.
By capitalising on the diverse fields of expertise of a skilled team of evaluators, engineers and architects, we deliver added value to our customers.
ADCPADCP is recognised as one of the largest property management service providers in the UAE, overseeing an extensive property portfolio. ADCP manages more than 2,100 buildings, comprising more than 57,000 residential and commercial units throughout the UAE.
Our team of more than 230 experienced real estate professionals delivers a comprehensive suite of tenant management, leasing, facilities management, and project management services.
Throughout 2019, ADCP continued to grow business lines and supported stakeholders through new initiatives. We also enhanced our partnerships with clients by broadening our digital reach through new technology platforms.
Key achievements for ADCP in 2019 included:
Fire & Life Safety Digital Solutions ADCP contributed to Hassantuk (a strategic initiative by the UAE Ministry of Interior) to oversee the installation of over 950 Alarm Transmission Equipment (ATEs) across multiple mixed-use buildings within the Emirate of Abu Dhabi. ADCP proactively supports the Civil Defense in attending to emergency incidents.
Social Care and Minors Affairs Foundation (SCMAF) We signed a new property services agreement with SCMAF to provide real estate services for their administered property portfolio across the Emirates. This was a significant achievement for ADCP, secured following a period of extensive tendering.
Abu Dhabi Distribution Company (ADDC) and Abu Dhabi Quality and Conformity Council (QCC) Collaborations — New Certification Standards In coordination with ADDC, we focused on reducing inefficient power usage. As part of this initiative, our technicians attended a new pilot training and skills certification programme through the QCC.
Sandooq Al Watan and Emirates Foundation ADCP is delighted to have retained two of the UAE’s established philanthropic charitable organisations as clients; both Sandooq Al Watan and Emirates Foundation have appointed ADCP to deliver real estate management services.
A D C B 2 0 1 9 A N N U A L R E P O R T
83

Group Business Services (GBS)2019 was a significant year for GBS, driven by growth and new opportunities at almost every level. The merger and the record-setting timeframe of the integration process was a key focus throughout the year, but did not stop us from delivering a superior customer experience.
WHAT WE DOOur support, enablement and service
teams are the engine room of the Bank, powering the technology and
operational processes, infrastructure and expertise that provide the secure
and efficient environment on which our businesses depend. In addition, Group
Business Services is responsible for preparing the Bank for the future through
digital transformation, operational, technological and service excellence.
F U T U R E R E A D Y
84
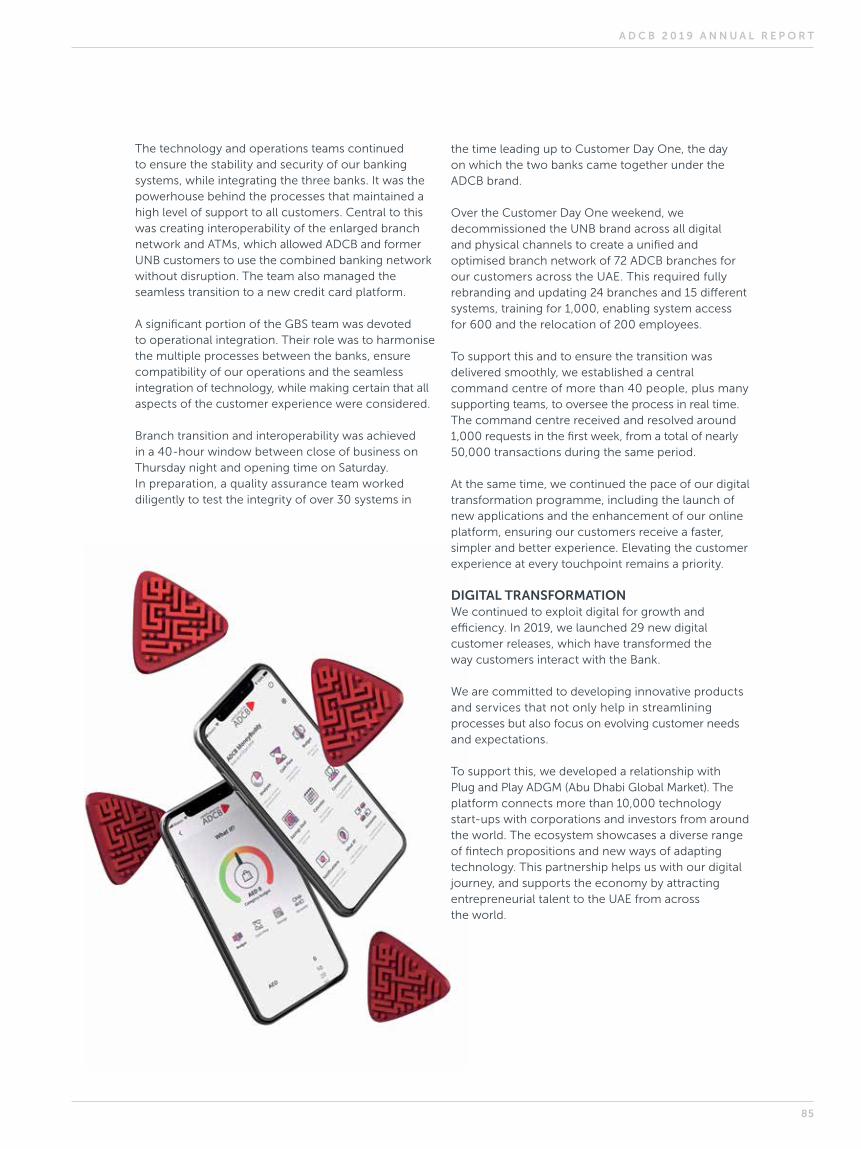
the time leading up to Customer Day One, the day on which the two banks came together under the ADCB brand.
Over the Customer Day One weekend, we decommissioned the UNB brand across all digital and physical channels to create a unified and optimised branch network of 72 ADCB branches for our customers across the UAE. This required fully rebranding and updating 24 branches and 15 different systems, training for 1,000, enabling system access for 600 and the relocation of 200 employees.
To support this and to ensure the transition was delivered smoothly, we established a central command centre of more than 40 people, plus many supporting teams, to oversee the process in real time. The command centre received and resolved around 1,000 requests in the first week, from a total of nearly 50,000 transactions during the same period.
At the same time, we continued the pace of our digital transformation programme, including the launch of new applications and the enhancement of our online platform, ensuring our customers receive a faster, simpler and better experience. Elevating the customer experience at every touchpoint remains a priority.
DIGITAL TRANSFORMATIONWe continued to exploit digital for growth and efficiency. In 2019, we launched 29 new digital customer releases, which have transformed the way customers interact with the Bank.
We are committed to developing innovative products and services that not only help in streamlining processes but also focus on evolving customer needs and expectations.
To support this, we developed a relationship with Plug and Play ADGM (Abu Dhabi Global Market). The platform connects more than 10,000 technology start-ups with corporations and investors from around the world. The ecosystem showcases a diverse range of fintech propositions and new ways of adapting technology. This partnership helps us with our digital journey, and supports the economy by attracting entrepreneurial talent to the UAE from across the world.
The technology and operations teams continued to ensure the stability and security of our banking systems, while integrating the three banks. It was the powerhouse behind the processes that maintained a high level of support to all customers. Central to this was creating interoperability of the enlarged branch network and ATMs, which allowed ADCB and former UNB customers to use the combined banking network without disruption. The team also managed the seamless transition to a new credit card platform.
A significant portion of the GBS team was devoted to operational integration. Their role was to harmonise the multiple processes between the banks, ensure compatibility of our operations and the seamless integration of technology, while making certain that all aspects of the customer experience were considered.
Branch transition and interoperability was achieved in a 40-hour window between close of business on Thursday night and opening time on Saturday. In preparation, a quality assurance team worked diligently to test the integrity of over 30 systems in
A D C B 2 0 1 9 A N N U A L R E P O R T
85
ADCB fully participates in and embraces the vision of the leadership of the country to create a technology hub. As a founding member of Mubadala’s Hub 71 and a founding member of the ADGM Digital Lab, ADCB plays a pivotal role at the centre of an expanded and innovative ecosystem.
Other major digital initiatives this year included Hayyak, our bespoke onboarding app that fully launched in February, allowing customers to open an account and receive a card in eight minutes. In just 10 months, more than one-third of new consumer banking accounts were onboarded through the app.
Leveraging our experience of building Hayyak, we also created and launched Ahlan, an onboarding app specifically designed for Al Hilal Bank, in just six weeks.
This year we established a social media presence on Instagram, Facebook, Twitter, YouTube and LinkedIn. We created an in-house Social Command Centre to monitor and respond to queries. The command centre is also responsible for sharing engaging content across the channels.
Our growing social media presence served us well during the merger and also strengthened customer acquisitions. More than 70% of customers onboarded through Hayyak were as a result of leads generated through our social media channels.
Working with the Wholesale Banking Group we were the first in the UAE to launch a Virtual Accounts service, which helps corporates to manage and reconcile incoming payments from multiple sources.
Meanwhile, we upgraded our mobile internet banking platform and added capability to our SME financing and Trade Workflow applications, making it easier for our customers to transact and access funding.
We are making more use of Robotic Process Automation (RPA) across the Bank. Using software with artificial intelligence machine learning capabilities, we now process up to 13,000 transactions every day, saving us around 28,000 hours each year. As a result, we significantly increased our efficiency while reducing costs.
LISTENING TO OUR CUSTOMERSEvery year we engage with hundreds of customers through face-to-face qualitative focus group sessions. This allows us to understand more about their experience in dealing with ADCB’s products and services. In line with our digital journey, we conduct user testing and needs assessment studies for digital assets across all stages of development. We also use other methodologies to collect regular feedback on each and every touchpoint of the Bank by calling the customers and by conducting online surveys.
Insights from our customers provide a comprehensive understanding of our strengths and weaknesses and help us to improve the experience we give. All customer feedback is tracked and reported on a weekly basis.
Our Net Promoter Score, which measures the willingness of customers to recommend our brand, products or services to others, continued to rise across the Bank and has increased by 26 NPS points from 2014. This industry-leading figure is a strong demonstration of our leadership in the banking sector when it comes to serving our customers.
FUTURE READYOne of the key measures of our success is the ability and speed with which we deliver our digital transformation agenda. In 2020, we will continue the pace we have set.
Our goal is not just to provide a better customer experience, but also to enable and empower our teams internally to be able to do their job better on systems that are safer, faster and more efficient. The teams adopt an agile way of working with squads co-located in our Digital Studio.
Our focus on providing banking services through mobile will ensure customers are able to open an account, apply for a variety of loans, and resolve any service requests on their device of choice.
We will also scale up our data and analytics capabilities to provide a hyper-personalised experience for our customers. We will continue to develop our partnerships with technology start-ups in the market that are offering finance alongside banks. We will also increase our involvement in the Automated Programming Interface (API) space, and expand our product offering and ecosystem to offer more for our customers.
As we keep pace with emerging technology and new trends, we continue to invest in our people to ensure we can attract, develop and retain the best talent in the industry and better support our customers.
We continuously explore and exploit new ways to do more with less. Whether it is using the latest technology, optimising a process, retraining our people, or thinking differently about a problem, GBS will continue to remain cost-conscious and productivity focused.
F U T U R E R E A D Y
86
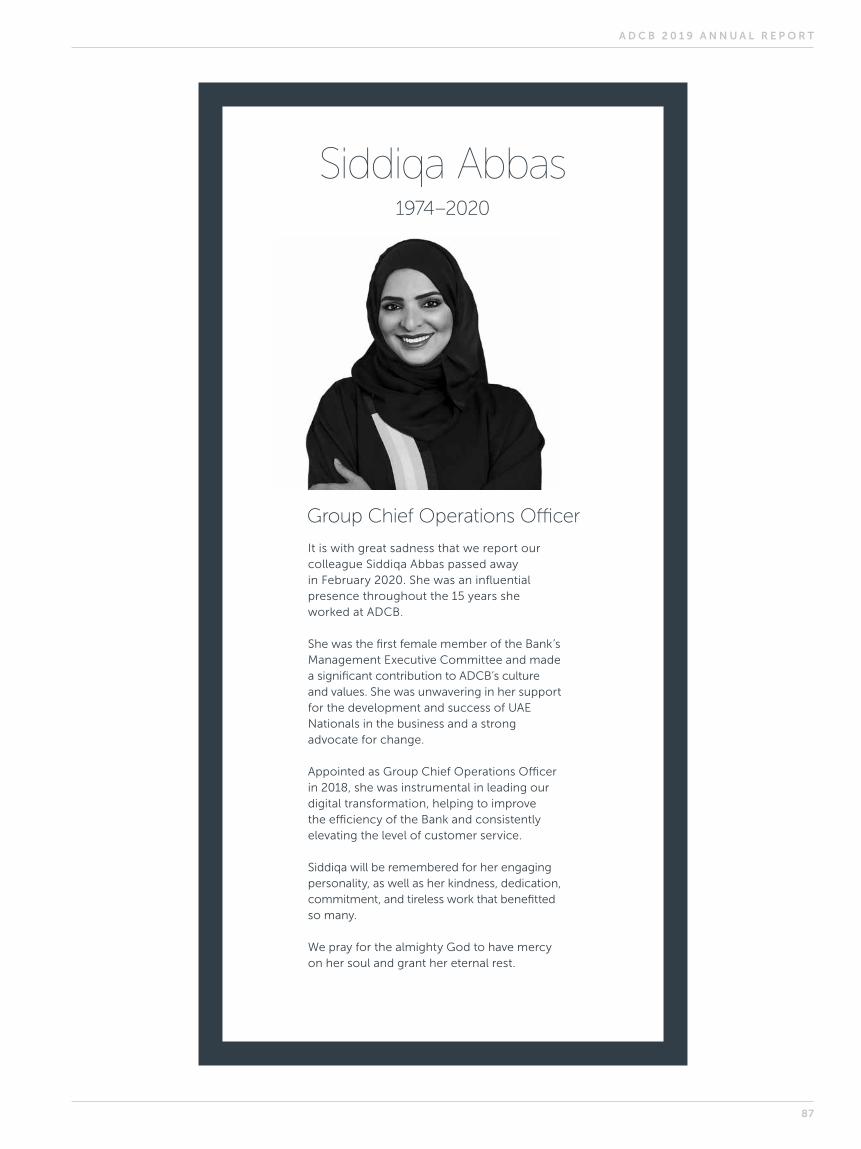
Siddiqa Abbas1974–2020
It is with great sadness that we report our colleague Siddiqa Abbas passed away in February 2020. She was an influential presence throughout the 15 years she worked at ADCB.
She was the first female member of the Bank’s Management Executive Committee and made a significant contribution to ADCB’s culture and values. She was unwavering in her support for the development and success of UAE Nationals in the business and a strong advocate for change.
Appointed as Group Chief Operations Officer in 2018, she was instrumental in leading our digital transformation, helping to improve the efficiency of the Bank and consistently elevating the level of customer service.
Siddiqa will be remembered for her engaging personality, as well as her kindness, dedication, commitment, and tireless work that benefitted so many.
We pray for the almighty God to have mercy on her soul and grant her eternal rest.
Group Chief Operations Officer
A D C B 2 0 1 9 A N N U A L R E P O R T
87
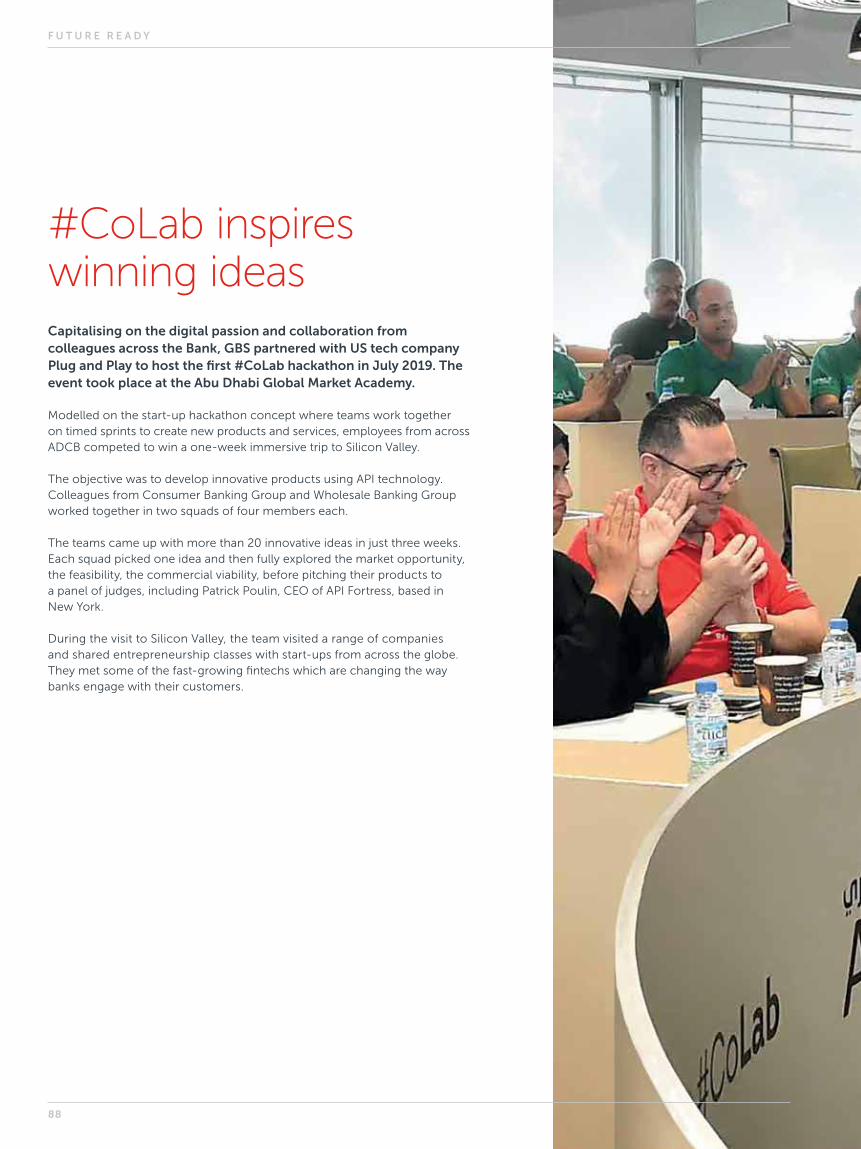
#CoLab inspires winning ideasCapitalising on the digital passion and collaboration from colleagues across the Bank, GBS partnered with US tech company Plug and Play to host the first #CoLab hackathon in July 2019. The event took place at the Abu Dhabi Global Market Academy.
Modelled on the start-up hackathon concept where teams work together on timed sprints to create new products and services, employees from across ADCB competed to win a one-week immersive trip to Silicon Valley.
The objective was to develop innovative products using API technology. Colleagues from Consumer Banking Group and Wholesale Banking Group worked together in two squads of four members each.
The teams came up with more than 20 innovative ideas in just three weeks. Each squad picked one idea and then fully explored the market opportunity, the feasibility, the commercial viability, before pitching their products to a panel of judges, including Patrick Poulin, CEO of API Fortress, based in New York.
During the visit to Silicon Valley, the team visited a range of companies and shared entrepreneurship classes with start-ups from across the globe. They met some of the fast-growing fintechs which are changing the way banks engage with their customers.
F U T U R E R E A D Y
88

A D C B 2 0 1 9 A N N U A L R E P O R T
89

WHAT WE DOHuman Resources plays an
integral role in driving ADCB’s strategy. By delivering a high-
end employee value proposition, we strive to build a distinctive competitive advantage to our
organisation through our people and our culture.
As part of this, and building on our core values, we are
committed to promoting Emiratisation throughout the
organisation, encouraging UAE Nationals to thrive in the Bank.
Human Resources (HR)In 2019, the HR team was focused on serving the needs of the business on two fronts; integration and maintaining business as usual. We played an integral role in promoting the Bank’s culture and values while enabling our employees to work in harmony as part of one entity.
We capitalised on our high-performance culture to drive change during the merger and integration, while ensuring there was no disruption to the outstanding service our customers expect from the Bank. To achieve this, employees were given additional support with dedicated points of contact and bespoke training where required.
F U T U R E R E A D Y
90
COLLABORATIVE CULTUREWe have an experienced and robust HR team whose skills enabled us to manage the professional and personal requirements of our employees. By remaining true to our strategy and harnessing the power of our values, we helped to ensure the success of the integration project.
We worked closely with other teams from across the business to ensure they were fully supported and aligned.
In the five months from the announcement of the merger to Customer Day One1, we:
Reviewed, benchmarked and harmonised job titles
Benchmarked and aligned salaries
Updated and aligned policies
Revised contracts
Throughout the integration, the Bank’s organisational health has remained one of its key strengths. A comprehensive survey of the combined businesses was carried out to assess corporate values, practices and culture. The results showed a positive organisational health compared to global benchmarks.More than 80% of employees took part in the survey, which revealed that both objective setting and appraisals were clear and robust.
To build on these encouraging results, we are developing a set of initiatives to further enhance organisational and cultural health. Our aim is to implement a holistic approach, starting by reinforcing our corporate values and behaviours. We will
continue to create a tailored learning approach for each business line, embedding new digital skills and competencies needed to achieve our goals.
Investing in the training and development of our employees will remain a key focus for the Bank.
EMPOWERING EMIRATISATIONIncreasing the participation of UAE Nationals remains a priority and HR has been proactive in supporting the Abu Dhabi Government’s strategy and economic vision in this ambition. We employ 1,479 UAE Nationals across the Group and we are proud that almost 80% of our Emirati workforce are women.
Al Hilal Bank’s Emiratisation rate stood at 48%, the highest among all UAE banks.
Recognising the value of our Emirati employees, we continuously invest in initiatives to promote growth and encourage development. Across our robust, fully customised Emirati Academy, we have successfully supported UAE Nationals in a variety of training programmes.
In addition, we also offer specialist schemes for Emirati graduates, and continue to partner with leading international and regional learning centres to create different programmes to deliver high-end learning experiences.
As a result of these measures, we have increased financial dexterity among UAE Nationals, focusing on boosting competencies and confidence.
82DIFFERENT NATIONALITIES
1 Customer Day One involved the combination of the entire ADCB and UNB branch and ATM networks, as well as the roll-out of the ADCB brand across all physical and digital channels.
A D C B 2 0 1 9 A N N U A L R E P O R T
91

To further develop young Emirati talent for a future career in the financial services industry, we have employed UAE Nationals as part of the 'Train For Work' initiative. This important programme is a collaboration with the Abu Dhabi Human Resources Authority, Ministry of Human Resources & Emiratisation and Mubadala.
Through our end-to-end UAE National talent journey, we are committed to supporting talented Emiratis with key initiatives that encourage retention, sourcing and development.
TAMOOHA GROWTHTamooha, our award-winning inclusivity initiative for Emirati women, celebrated its fifth anniversary this year. The centre continues to grow, attracting more than 350 Emirati women, who view ADCB as an employer of choice. The programme facilitates job opportunities and career development, providing an appropriate environment that suits social norms, family responsibilities and overcomes regional barriers such as geographical remoteness.
DRIVING DIVERSITYAs workforce demographics shift, workplace diversity has become a business necessity. We are proud to have 82 nationalities in ADCB. This helps to enrich our culture and to progress working in an open-minded environment. The Bank scores highly in gender diversity as well, with women comprising 39% of the Group’s employees with 31% of middle and senior roles held by women.
Focusing on diversity helps us to attract, develop and retain top performers and create a robust pipeline for future talent.
LEARNING AND DEVELOPMENTOur success, particularly in providing our customers with an outstanding banking experience, is enabled by training. Throughout the year, we delivered training to employees across a diverse range of important topics. This helped them to develop both personally and professionally.
In 2019, we delivered over 200,000 training hours within more than 500 classroom courses and e-learning modules. This covered both technical and soft skills to build employee capability to sustain the business and support career aspirations.
To ensure the Bank is well-prepared for the future, we also created different learning opportunities and experiences, matching the trends in the market. These included blockchain training and support for our ongoing digital transformation, agile leadership and fintech partnerships. In 2020 we will continue to implement the best solutions, through designing new experiential learning programmes.
F U T U R E R E A D Y
92

FUTURE FOCUSLooking into 2020, our objectives are clear; to nurture our people and further digitalise our processes. To build on the strength of our organisational health, we are committed to developing a high-performance culture where ability, motivation and engagement are part of our corporate DNA.
Meanwhile, we will continue to build our approach to Emiratisation. By doing so we will remain an employer of choice, able to attract the best talent, while making sure we are future-ready and able to provide a premium employee experience at every turn.
A D C B 2 0 1 9 A N N U A L R E P O R T
93
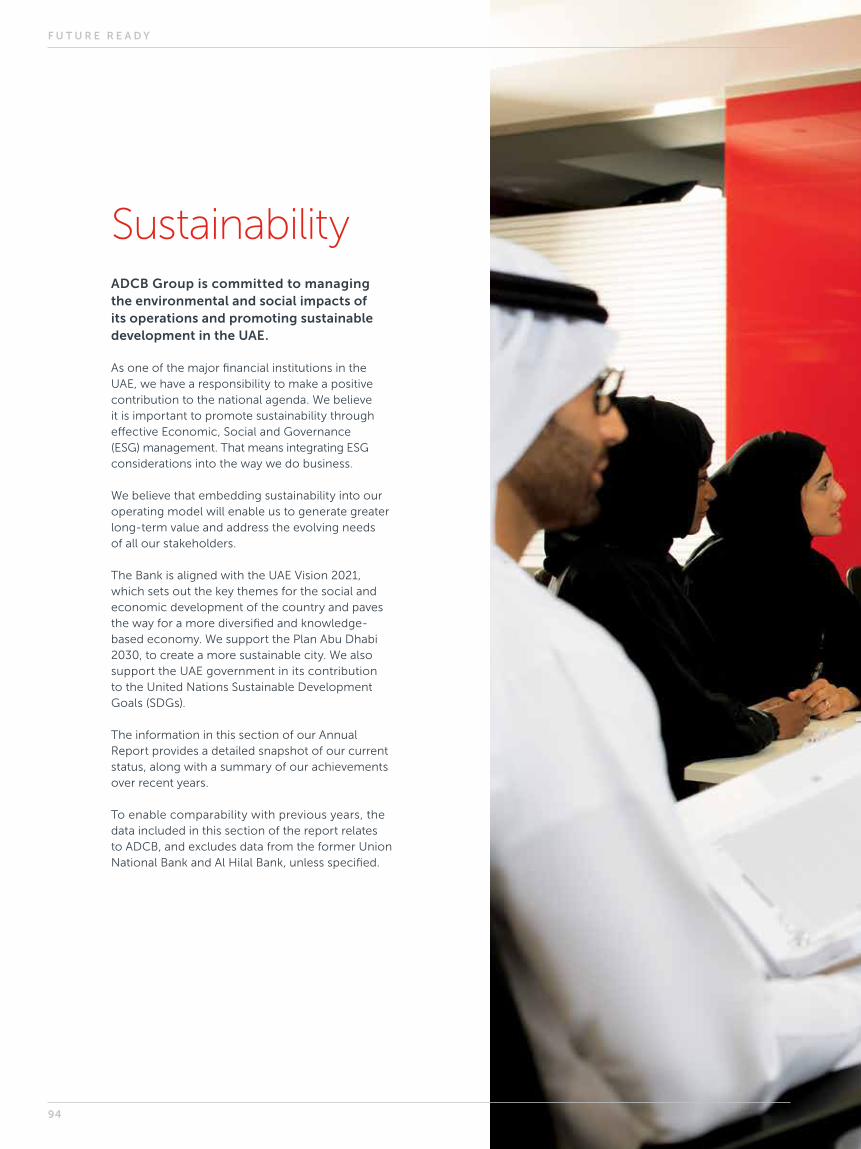
SustainabilityADCB Group is committed to managing the environmental and social impacts of its operations and promoting sustainable development in the UAE.
As one of the major financial institutions in the UAE, we have a responsibility to make a positive contribution to the national agenda. We believe it is important to promote sustainability through effective Economic, Social and Governance (ESG) management. That means integrating ESG considerations into the way we do business.
We believe that embedding sustainability into our operating model will enable us to generate greater long-term value and address the evolving needs of all our stakeholders.
The Bank is aligned with the UAE Vision 2021, which sets out the key themes for the social and economic development of the country and paves the way for a more diversified and knowledge-based economy. We support the Plan Abu Dhabi 2030, to create a more sustainable city. We also support the UAE government in its contribution to the United Nations Sustainable Development Goals (SDGs).
The information in this section of our Annual Report provides a detailed snapshot of our current status, along with a summary of our achievements over recent years.
To enable comparability with previous years, the data included in this section of the report relates to ADCB, and excludes data from the former Union National Bank and Al Hilal Bank, unless specified.
F U T U R E R E A D Y
94

A D C B 2 0 1 9 A N N U A L R E P O R T
95
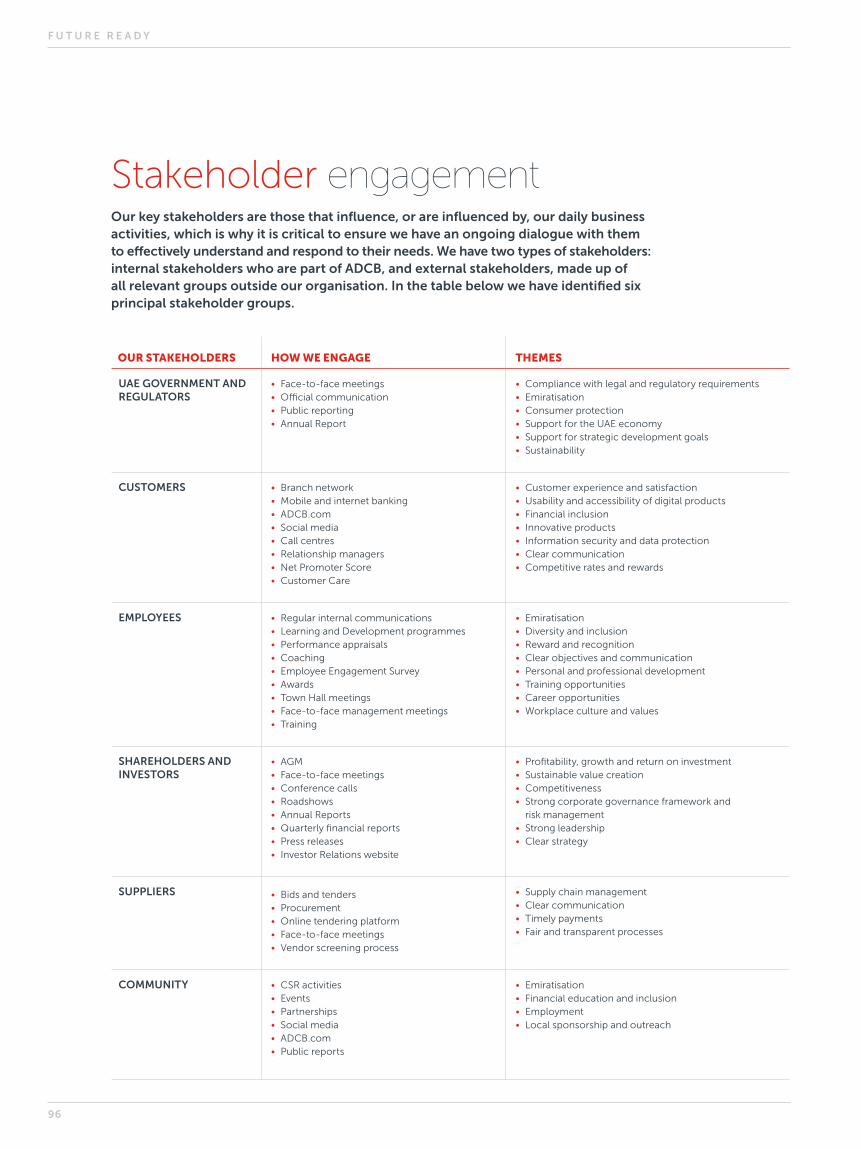
OUR STAKEHOLDERS HOW WE ENGAGE THEMES
UAE GOVERNMENT AND REGULATORS
• Face-to-face meetings• Official communication• Public reporting• Annual Report
• Compliance with legal and regulatory requirements• Emiratisation• Consumer protection• Support for the UAE economy• Support for strategic development goals• Sustainability
CUSTOMERS • Branch network• Mobile and internet banking• ADCB.com• Social media• Call centres• Relationship managers• Net Promoter Score• Customer Care
• Customer experience and satisfaction• Usability and accessibility of digital products• Financial inclusion• Innovative products• Information security and data protection• Clear communication• Competitive rates and rewards
EMPLOYEES • Regular internal communications• Learning and Development programmes• Performance appraisals• Coaching• Employee Engagement Survey• Awards• Town Hall meetings• Face-to-face management meetings• Training
• Emiratisation • Diversity and inclusion• Reward and recognition • Clear objectives and communication• Personal and professional development • Training opportunities• Career opportunities• Workplace culture and values
SHAREHOLDERS AND INVESTORS
• AGM• Face-to-face meetings• Conference calls• Roadshows• Annual Reports• Quarterly financial reports• Press releases• Investor Relations website
• Profitability, growth and return on investment• Sustainable value creation• Competitiveness• Strong corporate governance framework and
risk management• Strong leadership• Clear strategy
SUPPLIERS • Bids and tenders• Procurement• Online tendering platform• Face-to-face meetings• Vendor screening process
• Supply chain management• Clear communication• Timely payments• Fair and transparent processes
COMMUNITY • CSR activities• Events• Partnerships• Social media• ADCB.com• Public reports
• Emiratisation • Financial education and inclusion• Employment• Local sponsorship and outreach
Stakeholder engagementOur key stakeholders are those that influence, or are influenced by, our daily business activities, which is why it is critical to ensure we have an ongoing dialogue with them to effectively understand and respond to their needs. We have two types of stakeholders: internal stakeholders who are part of ADCB, and external stakeholders, made up of all relevant groups outside our organisation. In the table below we have identified six principal stakeholder groups.
F U T U R E R E A D Y
96
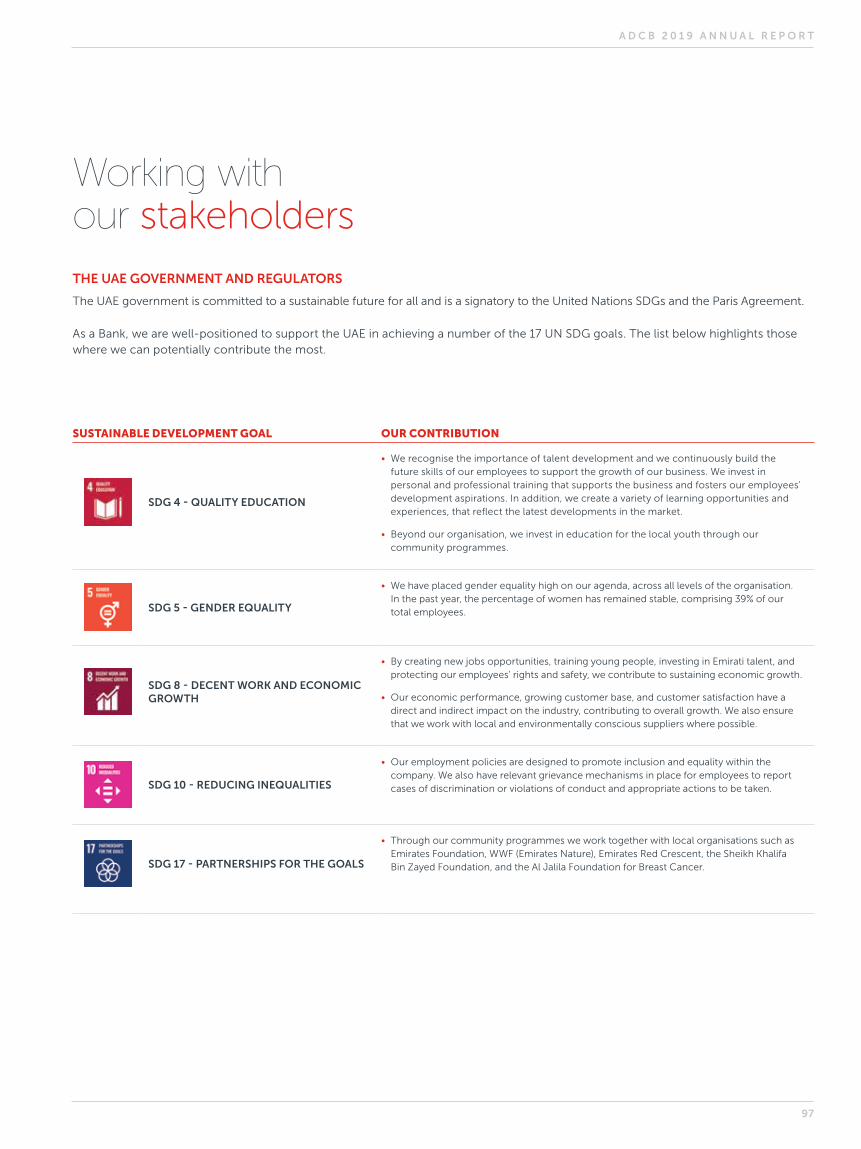
SUSTAINABLE DEVELOPMENT GOAL OUR CONTRIBUTION
SDG 4 - QUALITY EDUCATION
• We recognise the importance of talent development and we continuously build the future skills of our employees to support the growth of our business. We invest in personal and professional training that supports the business and fosters our employees’ development aspirations. In addition, we create a variety of learning opportunities and experiences, that reflect the latest developments in the market.
• Beyond our organisation, we invest in education for the local youth through our community programmes.
SDG 5 - GENDER EQUALITY
• We have placed gender equality high on our agenda, across all levels of the organisation. In the past year, the percentage of women has remained stable, comprising 39% of our total employees.
SDG 8 - DECENT WORK AND ECONOMIC GROWTH
• By creating new jobs opportunities, training young people, investing in Emirati talent, and protecting our employees’ rights and safety, we contribute to sustaining economic growth.
• Our economic performance, growing customer base, and customer satisfaction have a direct and indirect impact on the industry, contributing to overall growth. We also ensure that we work with local and environmentally conscious suppliers where possible.
SDG 10 - REDUCING INEQUALITIES
• Our employment policies are designed to promote inclusion and equality within the company. We also have relevant grievance mechanisms in place for employees to report cases of discrimination or violations of conduct and appropriate actions to be taken.
SDG 17 - PARTNERSHIPS FOR THE GOALS
• Through our community programmes we work together with local organisations such as Emirates Foundation, WWF (Emirates Nature), Emirates Red Crescent, the Sheikh Khalifa Bin Zayed Foundation, and the Al Jalila Foundation for Breast Cancer.
THE UAE GOVERNMENT AND REGULATORS
The UAE government is committed to a sustainable future for all and is a signatory to the United Nations SDGs and the Paris Agreement.
As a Bank, we are well-positioned to support the UAE in achieving a number of the 17 UN SDG goals. The list below highlights those where we can potentially contribute the most.
Working with our stakeholders
A D C B 2 0 1 9 A N N U A L R E P O R T
97

Tamooha, which celebrated its fifth anniversary in 2019, helps to facilitate job opportunities and career development for Emirati women. It provides an appropriate environment that suits social norms, family responsibilities and overcomes regional barriers, such as geographical remoteness. Since it began, more than 350 women have benefitted from this innovative programme.
To empower Emirati women at all levels, we launched a new training programme for our receptionists, to support them in achieving their career aspirations.
Across our diverse Emirati Academy customised curriculum (Mahara, Specialised, Management and Leadership Track), we have successfully developed more than 1,100 UAE National employees.
DATA SECURITY AND PRIVACYData security and privacy are of vital importance to ADCB and we have a robust framework in place to ensure the highest standards of protection. We believe this is a key component to building lasting relationships with our customers.
Data security concerns the protection of clients’ personal information. Data privacy, on the other hand, is focused on the ethical handling of customers' personal data. We have a dedicated department that handles data security, ensuring sufficient safeguards and security controls are always in place (see page 46 of the Risk Management section).
In order to further underline the importance of data privacy within ADCB, both from a regulatory perspective and customer expectations, we have established a dedicated Data Privacy Office. The Data Privacy Office is also responsible for making sure that ADCB is well-positioned for any upcoming local legislation or regulatory requirements as well as closely monitoring
PROGRAMME DESCRIPTION
MAHARA CERTIFIED PROGRAMME • This programme is designed to increase the financial dexterity of our new Emirati employees, focusing
on enhancing their competencies and confidence as individual and team contributors. This year we supported more than 140 UAE Nationals who received a tailored learning programme.
SPECIALISED CERTIFIED PROGRAMME
• Helping new Emirati graduates with their career aspirations is the aim of this programme.
• By creating different learning opportunities and experiences tailored to individual needs, we enrich their professional identity and behaviours to help their career progression through the Bank. Now in its third year, the programme continues to attract a growing number of graduates.
MANAGEMENT AND LEADERSHIP TRACK
• We continue to invest in competency-based solutions, offering customised management and leadership development journeys. These solutions have enabled promising UAE National employees to make a valuable contribution to the organisation through developing core managerial and leadership competencies, whilst also achieving personal and professional fulfillment and growth.
COMMITTED TO EMIRATISATION1
Emiratisation is an integral part of our talent management strategy at the Bank. By striving to attract, develop, retain and promote UAE Nationals we are helping to empower the business and to support the development of our nation. As a result of our strategy we once again exceeded the Emiratisation targets set by the Central Bank in 2019.
Our approach has also helped to empower Emirati women in the Banking industry. We are proud that ADCB scores highly in gender diversity and that almost 80% of our Emirati workforce are women. A strong illustration of our approach is our award-winning Tamooha programme.
CUSTOMERSOur vision is to be the number-one bank of choice in the UAE and to support this ambition our strategy is to ensure our customers are always at the centre of our decision-making. Providing an exceptional and outstanding customer experience is what drives our business.
We are proud to have consistently improved our Net Promoter Score, indicating a high level of loyalty from our customers. In 2019, we received significantly fewer complaints and have continued to resolve them in less than three days.
1 Data for ADCB Group — including former UNB and Al Hilal Bank employees.
CUSTOMER EXPERIENCE 2017 2018 2019
Total customer complaints resolved 100% 100% 100%
% of complaints resolved within 3 days 94% 92% 92%
F U T U R E R E A D Y
98
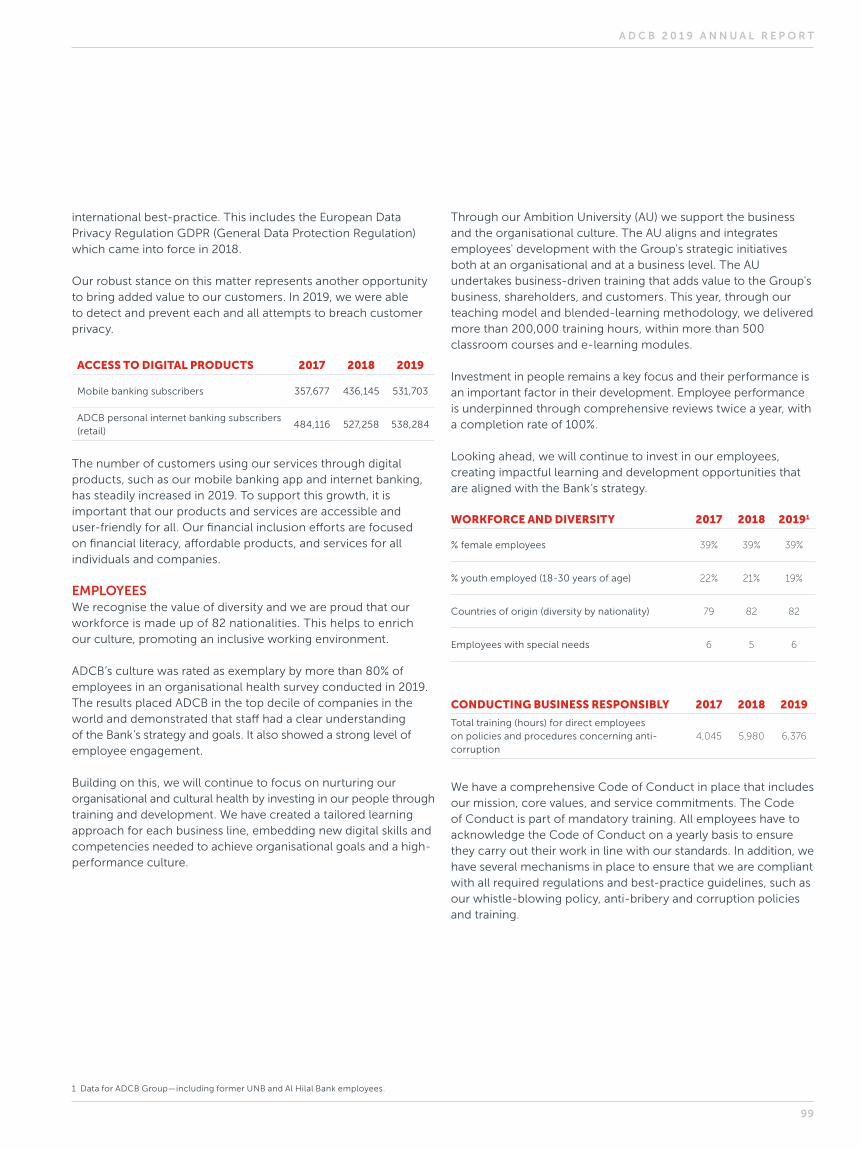
international best-practice. This includes the European Data Privacy Regulation GDPR (General Data Protection Regulation) which came into force in 2018.
Our robust stance on this matter represents another opportunity to bring added value to our customers. In 2019, we were able to detect and prevent each and all attempts to breach customer privacy.
ACCESS TO DIGITAL PRODUCTS 2017 2018 2019
Mobile banking subscribers 357,677 436,145 531,703
ADCB personal internet banking subscribers (retail)
484,116 527,258 538,284
The number of customers using our services through digital products, such as our mobile banking app and internet banking, has steadily increased in 2019. To support this growth, it is important that our products and services are accessible and user-friendly for all. Our financial inclusion efforts are focused on financial literacy, affordable products, and services for all individuals and companies.
EMPLOYEESWe recognise the value of diversity and we are proud that our workforce is made up of 82 nationalities. This helps to enrich our culture, promoting an inclusive working environment.
ADCB’s culture was rated as exemplary by more than 80% of employees in an organisational health survey conducted in 2019. The results placed ADCB in the top decile of companies in the world and demonstrated that staff had a clear understanding of the Bank’s strategy and goals. It also showed a strong level of employee engagement.
Building on this, we will continue to focus on nurturing our organisational and cultural health by investing in our people through training and development. We have created a tailored learning approach for each business line, embedding new digital skills and competencies needed to achieve organisational goals and a high-performance culture.
1 Data for ADCB Group — including former UNB and Al Hilal Bank employees.
Through our Ambition University (AU) we support the business and the organisational culture. The AU aligns and integrates employees' development with the Group's strategic initiatives both at an organisational and at a business level. The AU undertakes business-driven training that adds value to the Group's business, shareholders, and customers. This year, through our teaching model and blended-learning methodology, we delivered more than 200,000 training hours, within more than 500 classroom courses and e-learning modules.
Investment in people remains a key focus and their performance is an important factor in their development. Employee performance is underpinned through comprehensive reviews twice a year, with a completion rate of 100%.
Looking ahead, we will continue to invest in our employees, creating impactful learning and development opportunities that are aligned with the Bank’s strategy.
WORKFORCE AND DIVERSITY 2017 2018 20191
% female employees 39% 39% 39%
% youth employed (18-30 years of age) 22% 21% 19%
Countries of origin (diversity by nationality) 79 82 82
Employees with special needs 6 5 6
CONDUCTING BUSINESS RESPONSIBLY 2017 2018 2019
Total training (hours) for direct employees on policies and procedures concerning anti-corruption
4,045 5,980 6,376
We have a comprehensive Code of Conduct in place that includes our mission, core values, and service commitments. The Code of Conduct is part of mandatory training. All employees have to acknowledge the Code of Conduct on a yearly basis to ensure they carry out their work in line with our standards. In addition, we have several mechanisms in place to ensure that we are compliant with all required regulations and best-practice guidelines, such as our whistle-blowing policy, anti-bribery and corruption policies and training.
A D C B 2 0 1 9 A N N U A L R E P O R T
99
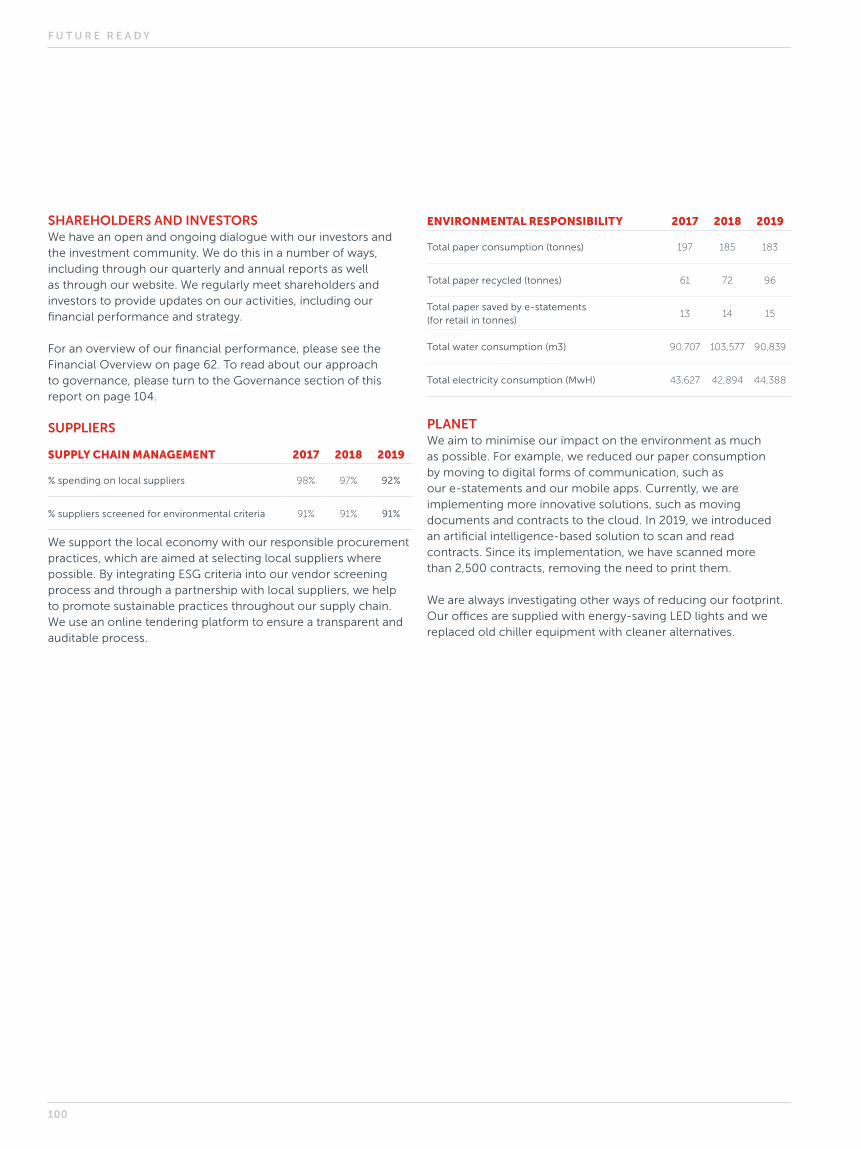
SHAREHOLDERS AND INVESTORSWe have an open and ongoing dialogue with our investors and the investment community. We do this in a number of ways, including through our quarterly and annual reports as well as through our website. We regularly meet shareholders and investors to provide updates on our activities, including our financial performance and strategy.
For an overview of our financial performance, please see the Financial Overview on page 62. To read about our approach to governance, please turn to the Governance section of this report on page 104.
SUPPLIERS SUPPLY CHAIN MANAGEMENT 2017 2018 2019
% spending on local suppliers 98% 97% 92%
% suppliers screened for environmental criteria 91% 91% 91%
We support the local economy with our responsible procurement practices, which are aimed at selecting local suppliers where possible. By integrating ESG criteria into our vendor screening process and through a partnership with local suppliers, we help to promote sustainable practices throughout our supply chain. We use an online tendering platform to ensure a transparent and auditable process.
ENVIRONMENTAL RESPONSIBILITY 2017 2018 2019
Total paper consumption (tonnes) 197 185 183
Total paper recycled (tonnes) 61 72 96
Total paper saved by e-statements (for retail in tonnes)
13 14 15
Total water consumption (m3) 90,707 103,577 90,839
Total electricity consumption (MwH) 43,627 42,894 44,388
PLANETWe aim to minimise our impact on the environment as much as possible. For example, we reduced our paper consumption by moving to digital forms of communication, such as our e-statements and our mobile apps. Currently, we are implementing more innovative solutions, such as moving documents and contracts to the cloud. In 2019, we introduced an artificial intelligence-based solution to scan and read contracts. Since its implementation, we have scanned more than 2,500 contracts, removing the need to print them.
We are always investigating other ways of reducing our footprint. Our offices are supplied with energy-saving LED lights and we replaced old chiller equipment with cleaner alternatives.
F U T U R E R E A D Y
100
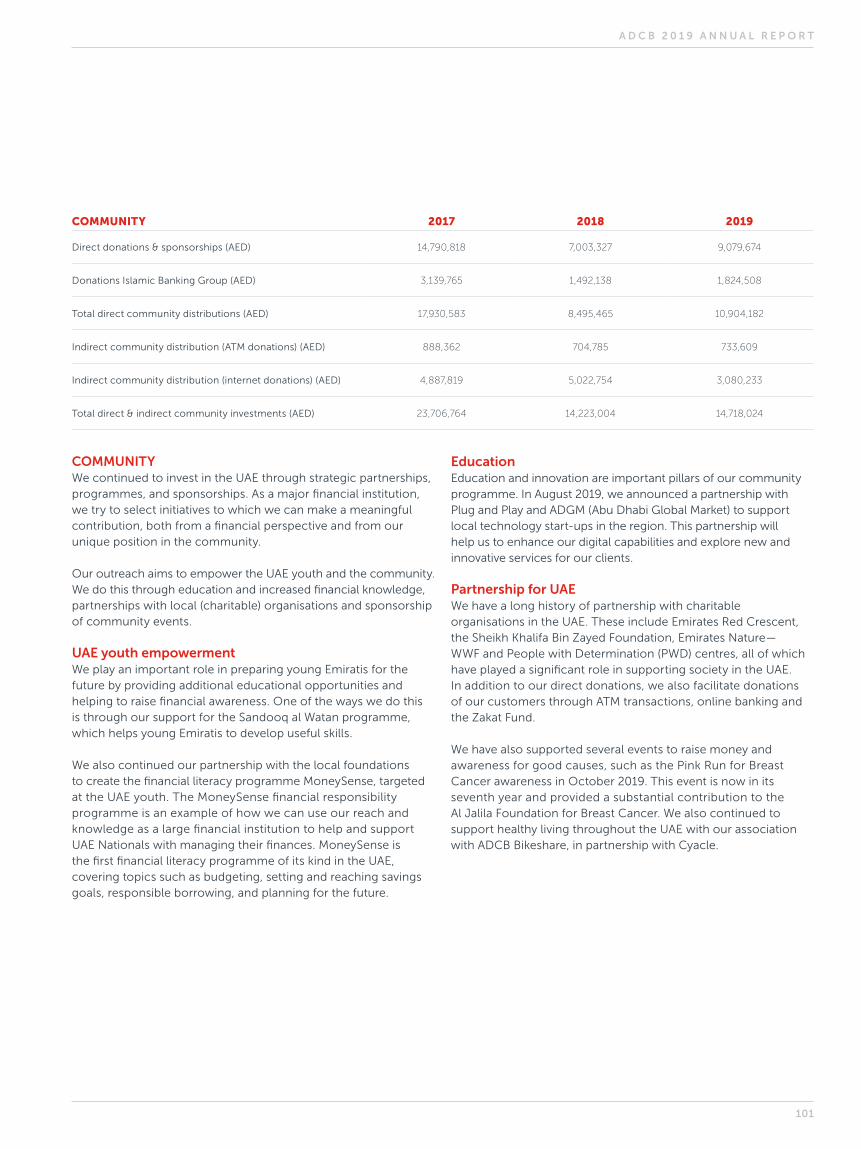
COMMUNITY We continued to invest in the UAE through strategic partnerships, programmes, and sponsorships. As a major financial institution, we try to select initiatives to which we can make a meaningful contribution, both from a financial perspective and from our unique position in the community.
Our outreach aims to empower the UAE youth and the community. We do this through education and increased financial knowledge, partnerships with local (charitable) organisations and sponsorship of community events.
UAE youth empowermentWe play an important role in preparing young Emiratis for the future by providing additional educational opportunities and helping to raise financial awareness. One of the ways we do this is through our support for the Sandooq al Watan programme, which helps young Emiratis to develop useful skills.
We also continued our partnership with the local foundations to create the financial literacy programme MoneySense, targeted at the UAE youth. The MoneySense financial responsibility programme is an example of how we can use our reach and knowledge as a large financial institution to help and support UAE Nationals with managing their finances. MoneySense is the first financial literacy programme of its kind in the UAE, covering topics such as budgeting, setting and reaching savings goals, responsible borrowing, and planning for the future.
EducationEducation and innovation are important pillars of our community programme. In August 2019, we announced a partnership with Plug and Play and ADGM (Abu Dhabi Global Market) to support local technology start-ups in the region. This partnership will help us to enhance our digital capabilities and explore new and innovative services for our clients.
Partnership for UAE We have a long history of partnership with charitable organisations in the UAE. These include Emirates Red Crescent, the Sheikh Khalifa Bin Zayed Foundation, Emirates Nature — WWF and People with Determination (PWD) centres, all of which have played a significant role in supporting society in the UAE. In addition to our direct donations, we also facilitate donations of our customers through ATM transactions, online banking and the Zakat Fund.
We have also supported several events to raise money and awareness for good causes, such as the Pink Run for Breast Cancer awareness in October 2019. This event is now in its seventh year and provided a substantial contribution to the Al Jalila Foundation for Breast Cancer. We also continued to support healthy living throughout the UAE with our association with ADCB Bikeshare, in partnership with Cyacle.
COMMUNITY 2017 2018 2019
Direct donations & sponsorships (AED) 14,790,818 7,003,327 9,079,674
Donations Islamic Banking Group (AED) 3,139,765 1,492,138 1,824,508
Total direct community distributions (AED) 17,930,583 8,495,465 10,904,182
Indirect community distribution (ATM donations) (AED) 888,362 704,785 733,609
Indirect community distribution (internet donations) (AED) 4,887,819 5,022,754 3,080,233
Total direct & indirect community investments (AED) 23,706,764 14,223,004 14,718,024
A D C B 2 0 1 9 A N N U A L R E P O R T
101
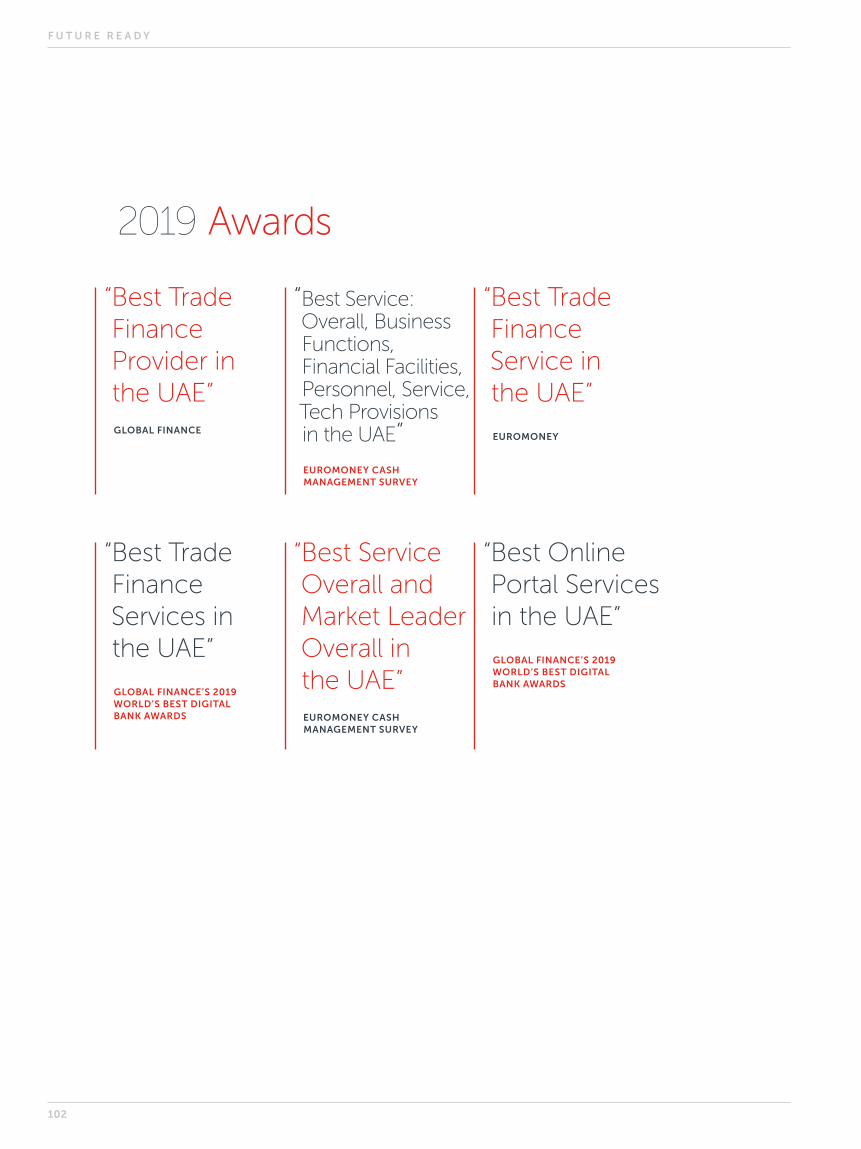
2019 Awards
“Best Trade Finance Provider in the UAE”GLOBAL FINANCE
“Best Trade Finance Services in the UAE”
GLOBAL FINANCE’S 2019 WORLD’S BEST DIGITAL BANK AWARDS
“Best Service: Overall, Business Functions, Financial Facilities, Personnel, Service, Tech Provisions in the UAE”EUROMONEY CASH MANAGEMENT SURVEY
“Best Service Overall and Market Leader Overall in the UAE”EUROMONEY CASH MANAGEMENT SURVEY
“Best Trade Finance Service in the UAE”
EUROMONEY
“Best Online Portal Services in the UAE”
GLOBAL FINANCE’S 2019 WORLD’S BEST DIGITAL BANK AWARDS
F U T U R E R E A D Y
102

“The Middle East’s Best Bank for SMEs”EUROMONEY AWARDS FOR EXCELLENCE
“The Most Recruiting Bank Award in the UAE”
MINISTRY OF HUMAN RESOURCES & EMIRATISATION
“The Most Vacancy Offering Bank Award in the UAE”MINISTRY OF HUMAN RESOURCES & EMIRATISATION
“Trade Finance Market Leader in the UAE”EUROMONEY
“UAE Domestic Trade Finance Bank of the Year”
ASIAN BANKING AND FINANCE MAGAZINE
“Best Islamic Banking Window Award 2019”
ISLAMIC RETAIL BANKING AWARDS BY CAMBRIDGE IFA, UK
A D C B 2 0 1 9 A N N U A L R E P O R T
103

GOVERNANCE
F U T U R E R E A D Y
104

A D C B 2 0 1 9 A N N U A L R E P O R T
105

CHAIRMAN’S LETTER
I am pleased to present the Corporate Governance Report for 2019, which demonstrates our commitment to maintaining a governance framework of the highest international standard. Strong and effective governance is vital to the long-term success of ADCB and to our goal of becoming the bank of choice in the UAE. It protects our customers, the Bank and our reputation and safeguards the interests of our shareholders.
EISSA MOHAMED ALSUWAIDI
CHAIRMAN
F U T U R E R E A D Y
106
At the start of 2019, your Board had four standing Committees, which covered: Audit & Compliance, Corporate Governance, Risk & Credit, and Nomination, Compensation & Human Resources. During the year, the Nomination, Compensation & HR Committee merged with the Corporate Governance Committee to form the Nomination, Compensation, HR and Governance Committee (NCHRG). During 2019, the Board met 8 times and the Board Committees met 46 times.
The Committees made positive progress during 2019, maintaining high standards of discussion and continuing to enhance our governance framework.
Following a gap analysis, the NCHRG Committee was pleased to note that the Bank had already implemented most of the requirements of the new UAECB Governance Regulations into its corporate governance framework.
The NCHRG Committee also reviewed ADCB’s remuneration framework alongside those of Union National Bank (UNB) and Al Hilal Bank (AHB) to harmonise and ensure best-practice across the Bank. Finally, it continued to prioritise UAE National development, focusing on the recruitment, retention and training of talented UAE National staff.
The Audit & Compliance Committee considered purchase price adjustments recommended by management following the merger with UNB and the subsequent acquisition of AHB. It also reviewed and discussed the Bank’s IFRS 9 governance process, models, and implications for the Bank’s financial statements and ensured our compliance with UAE Central Bank regulations.
The Risk & Credit Committee also looked at the implications of the Bank’s ongoing application of IFRS 9. In particular, it reviewed the Bank’s expected credit loss (ECL) levels and reporting process and staging of its most significant accounts before and after the merger to ensure adherence to the Bank’s IFRS 9 models. It also continued to regularly review the risks associated with the Bank’s various product portfolios, and to ensure that the Bank’s capital and liquidity positions are suitably stress tested.
In the pages which follow, you will find more details of the work carried out by your Board in 2019. As well as outlining how we continued to strengthen corporate governance in 2019, the report illustrates the most significant issues with which we have dealt, and some of the principal activities that have engaged us. It also includes the reports from each of the Board’s principal Committees.
REGULATIONThe Bank welcomed the release of the UAE Central Bank’s new regulations on corporate governance in 2019. The regulations will strengthen risk and governance across the banking sector in the UAE. They justify our long-term commitment to governance, as a result of which ADCB has consistently led the way in adopting and embedding international standards and best practice in governance.
BOARD EFFECTIVENESSWe have a reliable and effective Board. It is our collective responsibility to ensure the long-term success of ADCB and that we continue to generate sustainable value and solid returns for our shareholders.
As I mentioned in my introduction to this Annual Report on page 20, following our merger, we have welcomed a number of new members to the Board this year as others have stepped down. This has provided us with fresh perspectives and bolstered our objectivity. I am confident that we have the right mix of skills, knowledge and experience necessary to successfully deliver our objectives in 2020 and beyond.
Our focus on enhancing Board effectiveness is continuous, and we are grateful for the valuable support and advice of Sir Gerry Grimstone, Board Adviser. Sir Gerry’s significant international governance expertise and experience serve to strengthen the Board.
Meanwhile, we remain dedicated to promoting greater clarity and transparency in our communications with management and to ensuring that communication between the Board and management is as effective as possible.
STAKEHOLDER ENGAGEMENTBy understanding the issues that most concern our internal and external stakeholders, we are better able to make informed decisions that help to address these subjects. Listening to what is being said by our investors, customers, regulators, employees, and shareholders provides valuable insight, and that is why we take every opportunity to engage with our stakeholders.
Our AGM is particularly important in this regard and allows us to meet many of our investors face-to-face. We also engage with them in a variety of other ways, which you can read about in more detail on page 96.
THANK YOUFinally, I want to take this opportunity to thank all my colleagues on the Board for their support in this landmark year. I am confident that the strength of our commitment to corporate governance, our well-established framework, and our proven culture of accountability provide a robust foundation upon which we will continue to build.
EISSA MOHAMED ALSUWAIDI
CHAIRMAN
A D C B 2 0 1 9 A N N U A L R E P O R T
107

Board of Directors
Eissa Mohamed AlsuwaidiCHAIRMANINDEPENDENT*, NON-EXECUTIVE DIRECTOR
Eissa Mohamed Alsuwaidi was appointed by the Abu Dhabi Investment Council (ADIC) to join the ADCB Board of Directors and was elected as Chairman of ADCB in September 2008. He has more than 20 years of experience in asset management and banking.
Bachelor of Economics (Northeastern University, USA)
EXTERNAL APPOINTMENTS:
• Chief Executive Officer — Abu Dhabi Investment Council• Board Member — Emirates Investment Authority
Mohamed Dhaen Mahasoon AlhamliVICE CHAIRMANINDEPENDENT*, NON-EXECUTIVE DIRECTOR
Mohamed Dhaen Mahasoon Alhamli joined the ADCB Board of Directors in 2019. He is the former Minister of Energy for UAE (2004–2013) and is currently Chairman of UNB Egypt Board of Directors.
Advanced Management Program (Harvard Business School, USA)
Member of the Association of Chartered Accountants
Higher National Diploma in Business Studies (Portsmouth University, UK)
EXTERNAL APPOINTMENTS:
Previously held the following positions:
• Member, Supreme Petroleum Council Advisory Committee (SPC)• Vice Chairman, Abu Dhabi National Chemicals Company
(ChemaWeyaat)• Board Member, Cosmo Oil, Japan• Chairman, Internal Audit Committee, Abu Dhabi Investment Council• Chairman, Internal Audit Committee, Abu Dhabi National Oil Company
F U T U R E R E A D Y
108
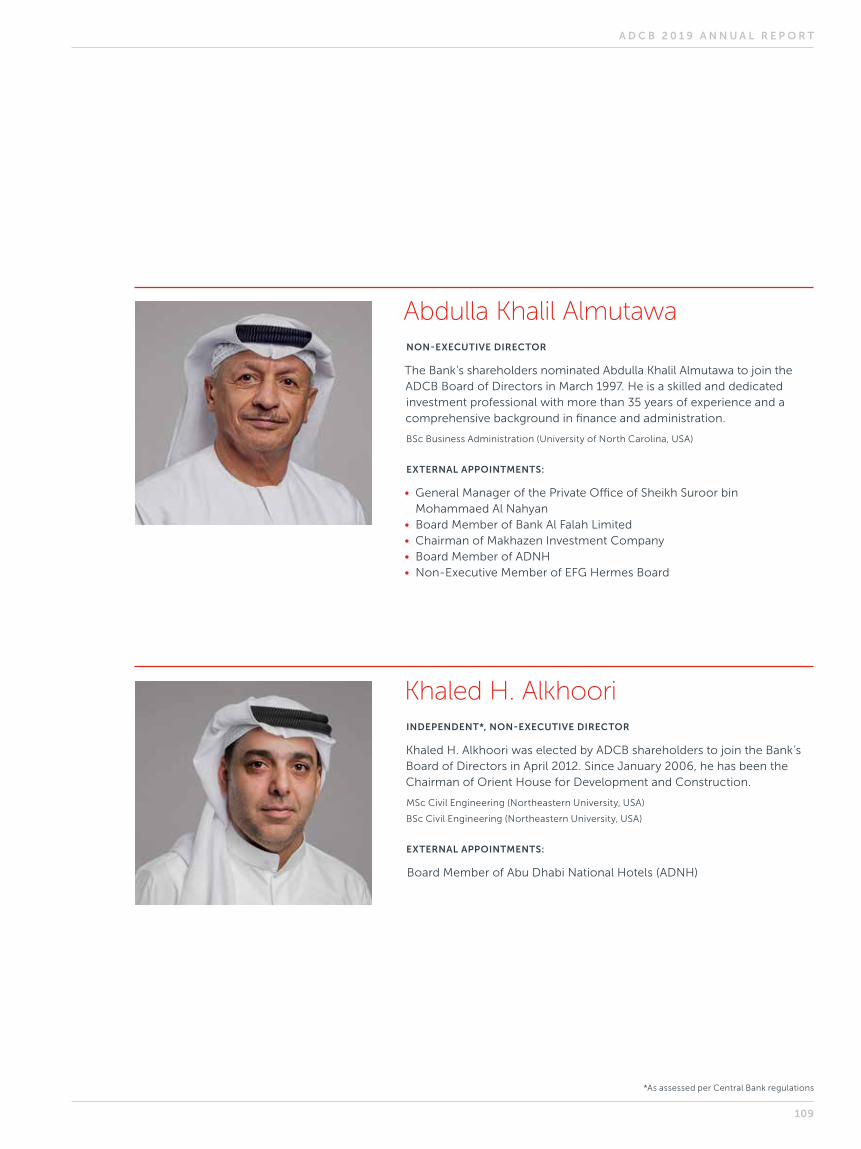
Abdulla Khalil AlmutawaNON-EXECUTIVE DIRECTOR
The Bank’s shareholders nominated Abdulla Khalil Almutawa to join the ADCB Board of Directors in March 1997. He is a skilled and dedicated investment professional with more than 35 years of experience and a comprehensive background in finance and administration.
BSc Business Administration (University of North Carolina, USA)
EXTERNAL APPOINTMENTS:
• General Manager of the Private Office of Sheikh Suroor bin Mohammaed Al Nahyan
• Board Member of Bank Al Falah Limited • Chairman of Makhazen Investment Company• Board Member of ADNH• Non-Executive Member of EFG Hermes Board
Khaled H. AlkhooriINDEPENDENT*, NON-EXECUTIVE DIRECTOR
Khaled H. Alkhoori was elected by ADCB shareholders to join the Bank’s Board of Directors in April 2012. Since January 2006, he has been the Chairman of Orient House for Development and Construction.
MSc Civil Engineering (Northeastern University, USA)
BSc Civil Engineering (Northeastern University, USA)
EXTERNAL APPOINTMENTS:
Board Member of Abu Dhabi National Hotels (ADNH)
*As assessed per Central Bank regulations
A D C B 2 0 1 9 A N N U A L R E P O R T
109

Board of Directors (continued)
Khalid Deemas AlsuwaidiINDEPENDENT*, NON-EXECUTIVE DIRECTOR
Khalid Deemas Alsuwaidi was appointed by ADIC to join the ADCB Board of Directors in March 2009. In 2012, he was nominated and elected by ADCB shareholders to act as a Director and, in March 2015, he was again nominated and elected by ADIC to act as a Director. He has more than 15 years of banking experience, having held senior management positions in National Bank of Abu Dhabi and First Gulf Bank.
MSc Business Administration, minor in Management Information Systems and Strategic Planning (Widener University, USA)
BSc Computer Information Systems (Bethune Cookman College, USA)
EXTERNAL APPOINTMENTS:
• Board Member — Manazel Real Estate Company • Vice Chairman — Abu Dhabi National Takaful Company • Chairman — Emirates Strategic Investment Co. (ESIC)• Group Chief Executive Officer — Das Holding
Aysha Al HallamiINDEPENDENT*, NON-EXECUTIVE DIRECTOR
Aysha Al Hallami was elected by ADIC to join the ADCB Board of Directors in April 2013. She is a Research Specialist in the Strategy and Planning Department at Abu Dhabi Investment Authority, where she has served for more than nine years.
Chartered Financial Analyst (CFA Institute, UAS)
Private Equity and Venture Capital (Harvard Business School, USA)
MSc Finance & Banking (British University in Dubai in association with Cass Business School, City University, UK)
BSc Business Sciences: major in Finance (Zayed University, UAE)
F U T U R E R E A D Y
110
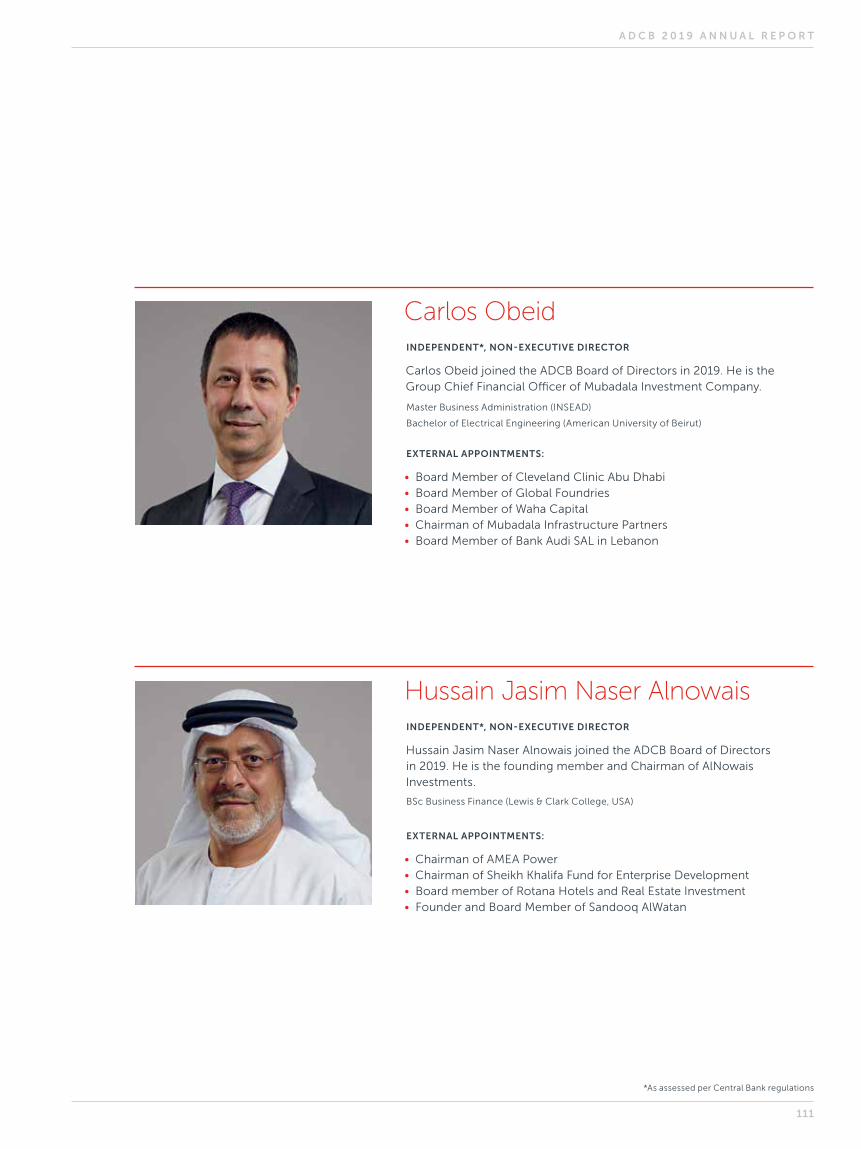
Carlos ObeidINDEPENDENT*, NON-EXECUTIVE DIRECTOR
Carlos Obeid joined the ADCB Board of Directors in 2019. He is the Group Chief Financial Officer of Mubadala Investment Company.
Master Business Administration (INSEAD)
Bachelor of Electrical Engineering (American University of Beirut)
EXTERNAL APPOINTMENTS:
• Board Member of Cleveland Clinic Abu Dhabi • Board Member of Global Foundries• Board Member of Waha Capital• Chairman of Mubadala Infrastructure Partners• Board Member of Bank Audi SAL in Lebanon
Hussain Jasim Naser AlnowaisINDEPENDENT*, NON-EXECUTIVE DIRECTOR
Hussain Jasim Naser Alnowais joined the ADCB Board of Directors in 2019. He is the founding member and Chairman of AlNowais Investments.
BSc Business Finance (Lewis & Clark College, USA)
EXTERNAL APPOINTMENTS:
• Chairman of AMEA Power• Chairman of Sheikh Khalifa Fund for Enterprise Development• Board member of Rotana Hotels and Real Estate Investment• Founder and Board Member of Sandooq AlWatan
*As assessed per Central Bank regulations
A D C B 2 0 1 9 A N N U A L R E P O R T
111
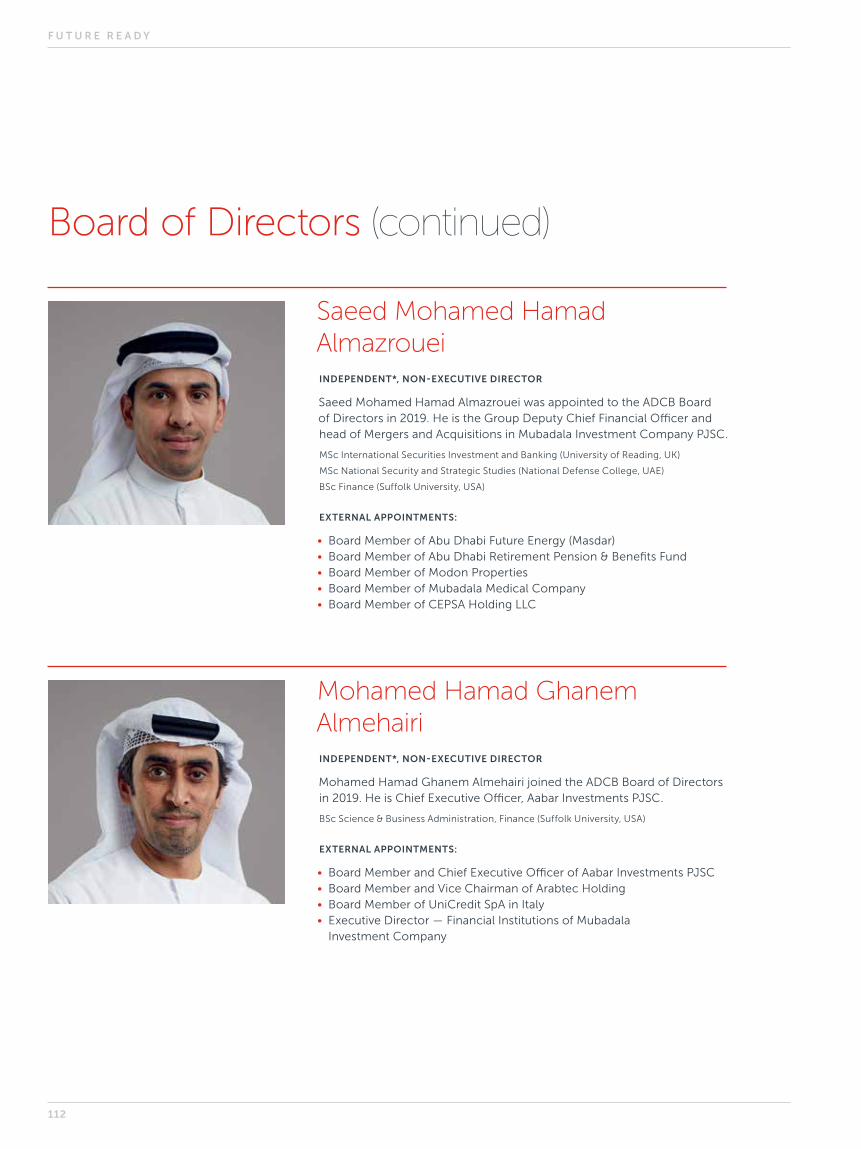
Board of Directors (continued)
Saeed Mohamed Hamad AlmazroueiINDEPENDENT*, NON-EXECUTIVE DIRECTOR
Saeed Mohamed Hamad Almazrouei was appointed to the ADCB Board of Directors in 2019. He is the Group Deputy Chief Financial Officer and head of Mergers and Acquisitions in Mubadala Investment Company PJSC.
MSc International Securities Investment and Banking (University of Reading, UK)
MSc National Security and Strategic Studies (National Defense College, UAE)
BSc Finance (Suffolk University, USA)
EXTERNAL APPOINTMENTS:
• Board Member of Abu Dhabi Future Energy (Masdar)• Board Member of Abu Dhabi Retirement Pension & Benefits Fund• Board Member of Modon Properties • Board Member of Mubadala Medical Company• Board Member of CEPSA Holding LLC
Mohamed Hamad Ghanem AlmehairiINDEPENDENT*, NON-EXECUTIVE DIRECTOR
Mohamed Hamad Ghanem Almehairi joined the ADCB Board of Directors in 2019. He is Chief Executive Officer, Aabar Investments PJSC.
BSc Science & Business Administration, Finance (Suffolk University, USA)
EXTERNAL APPOINTMENTS:
• Board Member and Chief Executive Officer of Aabar Investments PJSC• Board Member and Vice Chairman of Arabtec Holding• Board Member of UniCredit SpA in Italy• Executive Director — Financial Institutions of Mubadala
Investment Company
F U T U R E R E A D Y
112
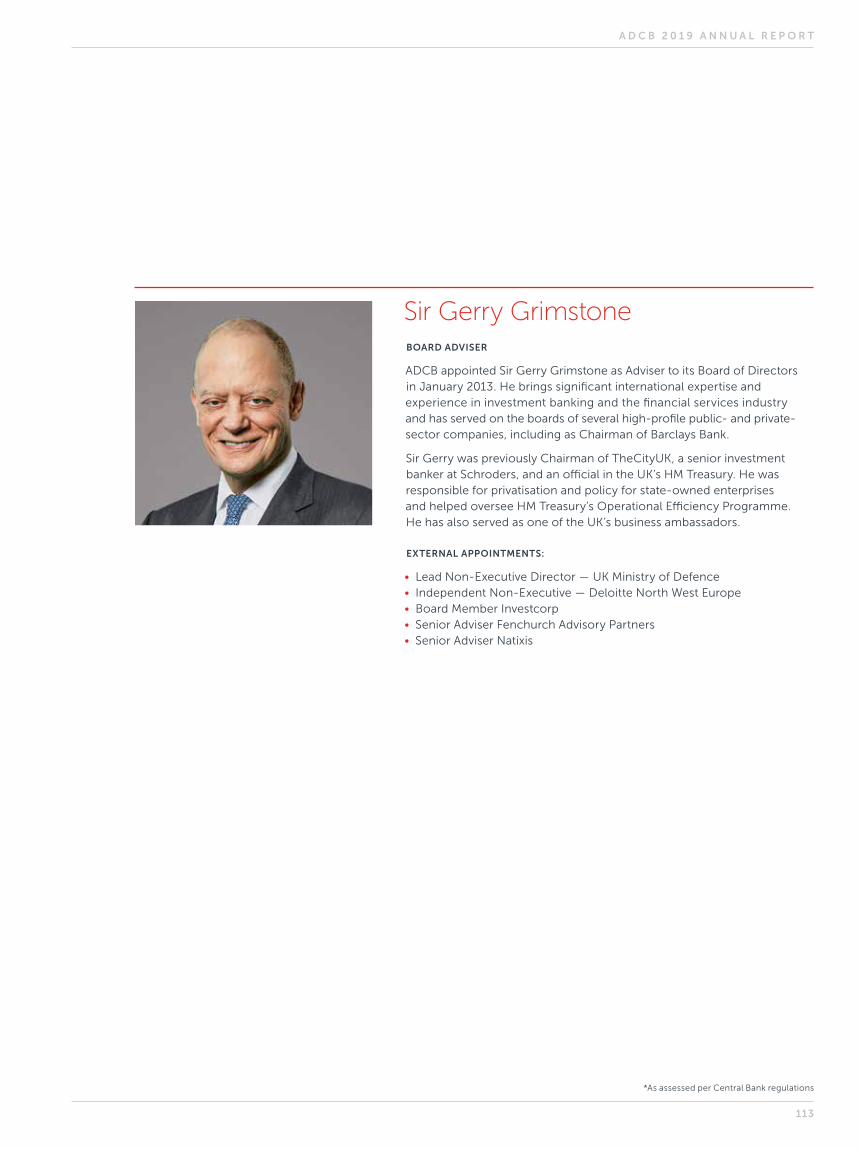
Sir Gerry GrimstoneBOARD ADVISER
ADCB appointed Sir Gerry Grimstone as Adviser to its Board of Directors in January 2013. He brings significant international expertise and experience in investment banking and the financial services industry and has served on the boards of several high-profile public- and private-sector companies, including as Chairman of Barclays Bank.
Sir Gerry was previously Chairman of TheCityUK, a senior investment banker at Schroders, and an official in the UK’s HM Treasury. He was responsible for privatisation and policy for state-owned enterprises and helped oversee HM Treasury’s Operational Efficiency Programme. He has also served as one of the UK’s business ambassadors.
EXTERNAL APPOINTMENTS:
• Lead Non-Executive Director — UK Ministry of Defence• Independent Non-Executive — Deloitte North West Europe• Board Member Investcorp• Senior Adviser Fenchurch Advisory Partners• Senior Adviser Natixis
*As assessed per Central Bank regulations
A D C B 2 0 1 9 A N N U A L R E P O R T
113
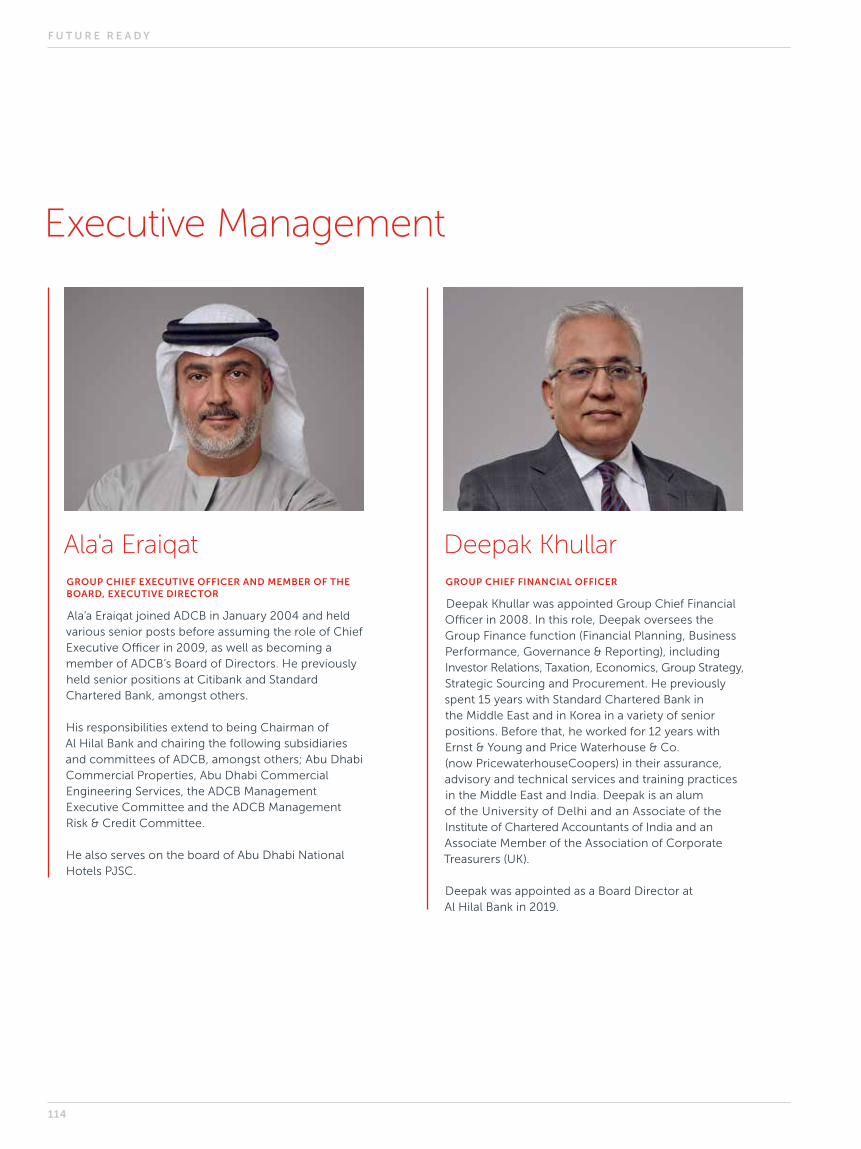
Ala'a Eraiqat GROUP CHIEF EXECUTIVE OFFICER AND MEMBER OF THE BOARD, EXECUTIVE DIRECTOR
Ala’a Eraiqat joined ADCB in January 2004 and held various senior posts before assuming the role of Chief Executive Officer in 2009, as well as becoming a member of ADCB’s Board of Directors. He previously held senior positions at Citibank and Standard Chartered Bank, amongst others.
His responsibilities extend to being Chairman of Al Hilal Bank and chairing the following subsidiaries and committees of ADCB, amongst others; Abu Dhabi Commercial Properties, Abu Dhabi Commercial Engineering Services, the ADCB Management Executive Committee and the ADCB Management Risk & Credit Committee.
He also serves on the board of Abu Dhabi National Hotels PJSC.
Deepak Khullar GROUP CHIEF FINANCIAL OFFICER
Deepak Khullar was appointed Group Chief Financial Officer in 2008. In this role, Deepak oversees the Group Finance function (Financial Planning, Business Performance, Governance & Reporting), including Investor Relations, Taxation, Economics, Group Strategy, Strategic Sourcing and Procurement. He previously spent 15 years with Standard Chartered Bank in the Middle East and in Korea in a variety of senior positions. Before that, he worked for 12 years with Ernst & Young and Price Waterhouse & Co. (now PricewaterhouseCoopers) in their assurance, advisory and technical services and training practices in the Middle East and India. Deepak is an alum of the University of Delhi and an Associate of the Institute of Chartered Accountants of India and an Associate Member of the Association of Corporate Treasurers (UK).
Deepak was appointed as a Board Director at Al Hilal Bank in 2019.
Executive Management
F U T U R E R E A D Y
114

Siddiqa AbbasGROUP CHIEF OPERATIONS OFFICER
We are saddened by the loss of Siddiqa Abbas, who passed away in February 2020.
She was appointed as ADCB’s Group Chief Operations Officer in 2018 and led the Bank’s Group Business Services (GBS) division, which includes the Technology, Operations, Customer Experience and Property Management teams. Siddiqa was responsible for ensuring the Bank had the operational, technological and property management capabilities and systems infrastructure to ensure reliable and agile business operations. With over 20 years of banking experience, she held a number of senior operational management positions at ADCB including Head of Branch Operations and Head of Consumer Banking Operations. Prior to her appointment as Group Chief Operations Officer, Siddiqa was the General Manager, ITMAM (ADCB’s shared services subsidiary) from 2016–2018. Siddiqa held a Bachelor’s degree in Mass Media from the UAE University in Al Ain.
Siddiqa was appointed as a Board Director at Al Hilal Bank in 2019.
Colin FraserGROUP HEAD OF WHOLESALE BANKING
Colin Fraser was appointed as Group Head of Wholesale Banking at ADCB in 2008. He is responsible for Cash Management, Trade Finance, Corporate Finance and Investment Banking across the Group. He is an Associate of the Chartered Institute of Bankers and a Fellow of the Royal Society for the Arts. Colin joined Barclays Bank in 1992 and undertook various roles as an international banker, including Corporate Banking Director, GCC. He completed his Master of Arts in Financial Economics at the University of Dundee, receiving the Bowie Memorial Prize for top economics graduates.
A D C B 2 0 1 9 A N N U A L R E P O R T
115

Arup MukhopadhyayGROUP HEAD OF CONSUMER BANKING
Arup Mukhopadhyay joined ADCB in 2005 and is Head of the Consumer Banking Group. He had previously spent seven years with Citibank, becoming Head of Wealth Management products and Marketing Director for its UAE Consumer Business. Before that, he worked with Unilever in India in several sales and marketing roles. Arup is a mechanical engineering graduate and holds an MBA from the Indian Institute of Management, Lucknow.
Arup was appointed as a Board Director at Al Hilal Bank in 2019.
Kevin Taylor GROUP TREASURER
Kevin Taylor joined ADCB in 2009 as Head of the Treasury & Investments Group. He has held significant treasury and risk positions in global organisations such as ALICO, Citigroup, Westpac Bank and Merrill Lynch. At ADCB, he is responsible for FX trading and sales, derivative trading and sales, fixed income and investments personnel and the balance sheet analytics teams. Kevin has more than 30 years of global experience in banking and finance and is a member of the UAE Banks Federation Financial Markets Committee. He holds an MBA from Macquarie University in Australia and a Master of Science in Risk Management from the Stern School of Business, New York University.
Kevin was appointed as a Board Director at Al Hilal Bank in 2019.
.
Executive Management (continued)
F U T U R E R E A D Y
116
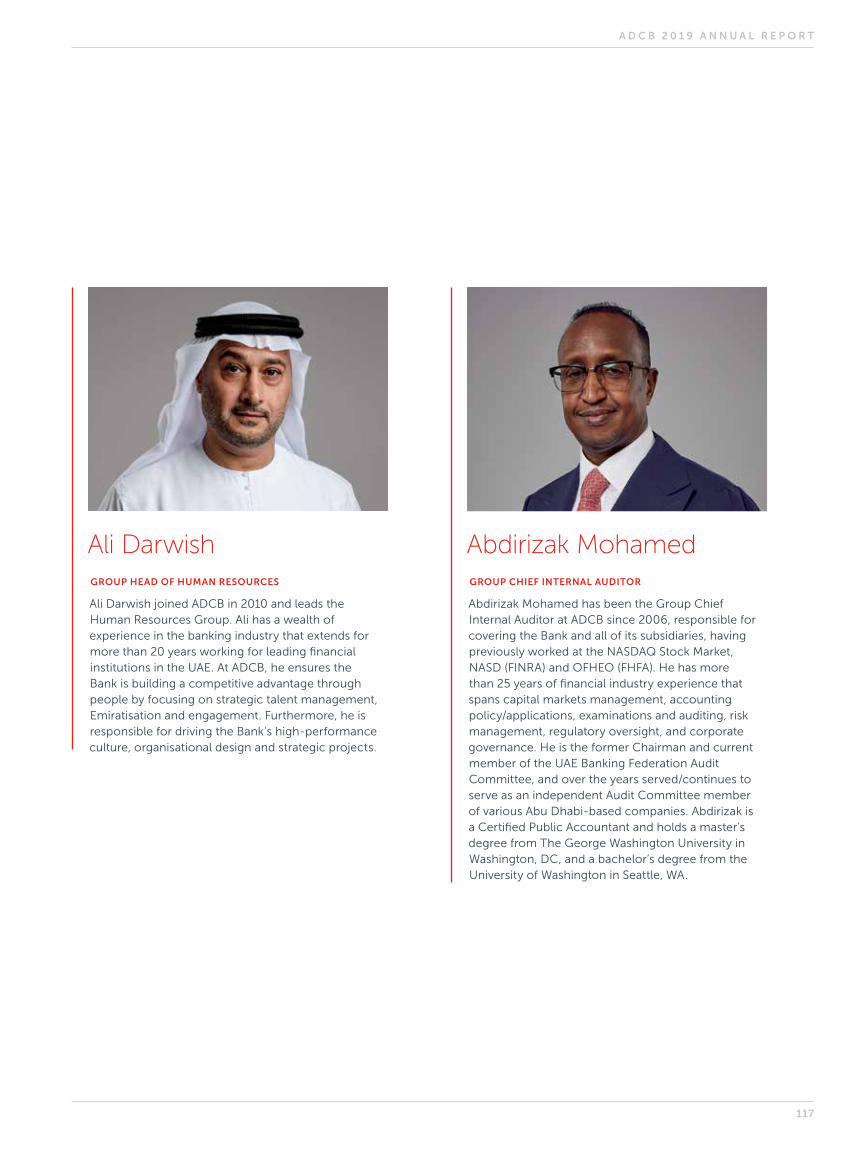
Ali DarwishGROUP HEAD OF HUMAN RESOURCES
Ali Darwish joined ADCB in 2010 and leads the Human Resources Group. Ali has a wealth of experience in the banking industry that extends for more than 20 years working for leading financial institutions in the UAE. At ADCB, he ensures the Bank is building a competitive advantage through people by focusing on strategic talent management, Emiratisation and engagement. Furthermore, he is responsible for driving the Bank's high-performance culture, organisational design and strategic projects.
Abdirizak MohamedGROUP CHIEF INTERNAL AUDITOR
Abdirizak Mohamed has been the Group Chief Internal Auditor at ADCB since 2006, responsible for covering the Bank and all of its subsidiaries, having previously worked at the NASDAQ Stock Market, NASD (FINRA) and OFHEO (FHFA). He has more than 25 years of financial industry experience that spans capital markets management, accounting policy/applications, examinations and auditing, risk management, regulatory oversight, and corporate governance. He is the former Chairman and current member of the UAE Banking Federation Audit Committee, and over the years served/continues to serve as an independent Audit Committee member of various Abu Dhabi-based companies. Abdirizak is a Certified Public Accountant and holds a master’s degree from The George Washington University in Washington, DC, and a bachelor’s degree from the University of Washington in Seattle, WA.
A D C B 2 0 1 9 A N N U A L R E P O R T
117

Simon CoplestonGROUP GENERAL COUNSEL AND BOARD SECRETARY
Simon Copleston has been Group General Counsel and Board Secretary at ADCB since 2008. After graduating from Durham University in the UK, he practiced corporate law in the City of London for eight years. He joined Abu Dhabi Investment Authority in 2006, acting as a lawyer to the Emerging Markets Department and the Strategic Investment and Infrastructure teams. He has more than 20 years of experience in banking, finance, and corporate law. Simon is a UK-qualified solicitor and has been instrumental in helping ADCB to become an acknowledged regional leader in corporate governance.
Paul KeatingGROUP CHIEF RISK OFFICER
Paul Keating was appointed as ADCB’s Group Chief Risk Officer in 2018. He previously worked for the Australia and New Zealand Banking (ANZ) Group for over 30 years, where he served in various capacities across the world. Paul’s previous role at ANZ was the Chief Risk Officer and Head of Credit for the Pacific division, which was responsible for 11 countries.
Paul is responsible for Compliance, Operational Risk, Market Risk, Fraud Risk, Data Management, Credit Policy, and Information Security.
He sits on various management and board sub committees to provide an enterprise-wide risk management perspective. Paul holds a Bachelor of Commerce and Administration from Victoria University in New Zealand and a Post Graduate Diploma in Banking Management from Massey University in New Zealand. Paul has also completed the Australian Institute of Company Directors course.
Executive Management (continued)
F U T U R E R E A D Y
118
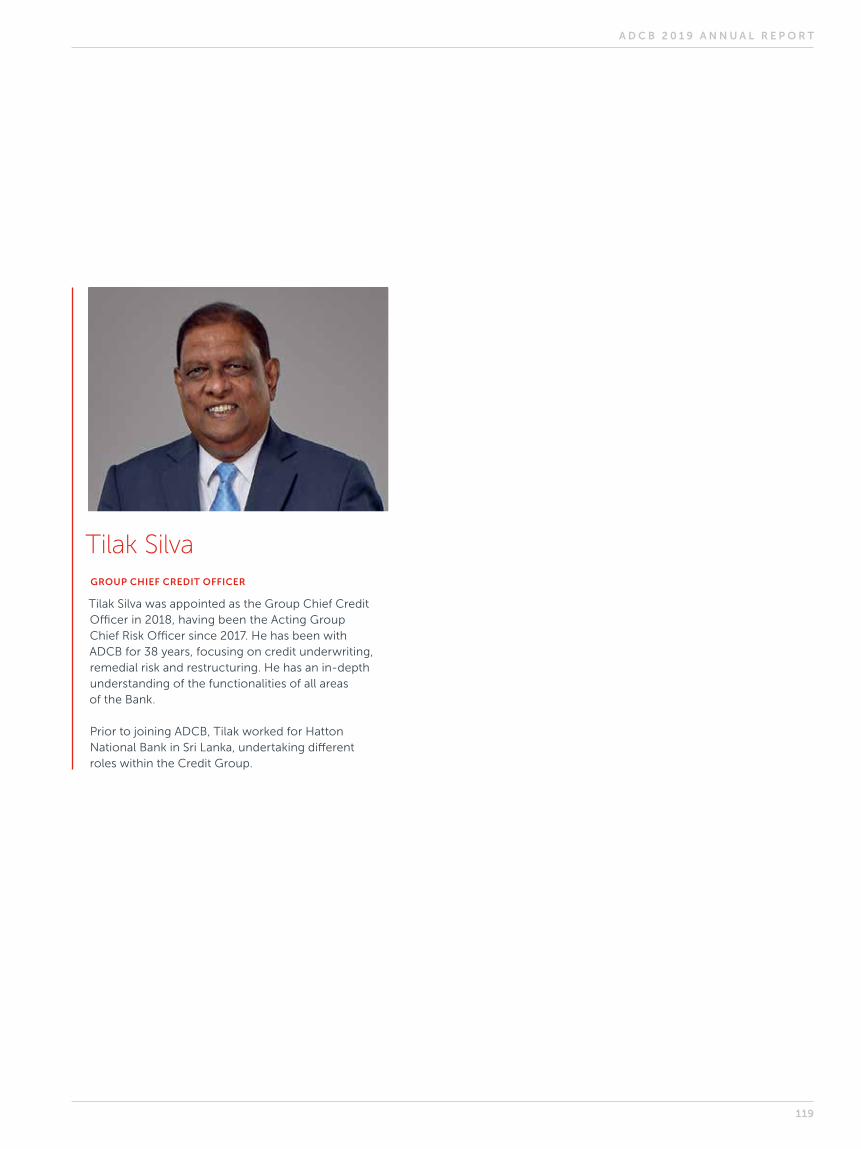
Tilak SilvaGROUP CHIEF CREDIT OFFICER
Tilak Silva was appointed as the Group Chief Credit Officer in 2018, having been the Acting Group Chief Risk Officer since 2017. He has been with ADCB for 38 years, focusing on credit underwriting, remedial risk and restructuring. He has an in-depth understanding of the functionalities of all areas of the Bank.
Prior to joining ADCB, Tilak worked for Hatton National Bank in Sri Lanka, undertaking different roles within the Credit Group.
A D C B 2 0 1 9 A N N U A L R E P O R T
119
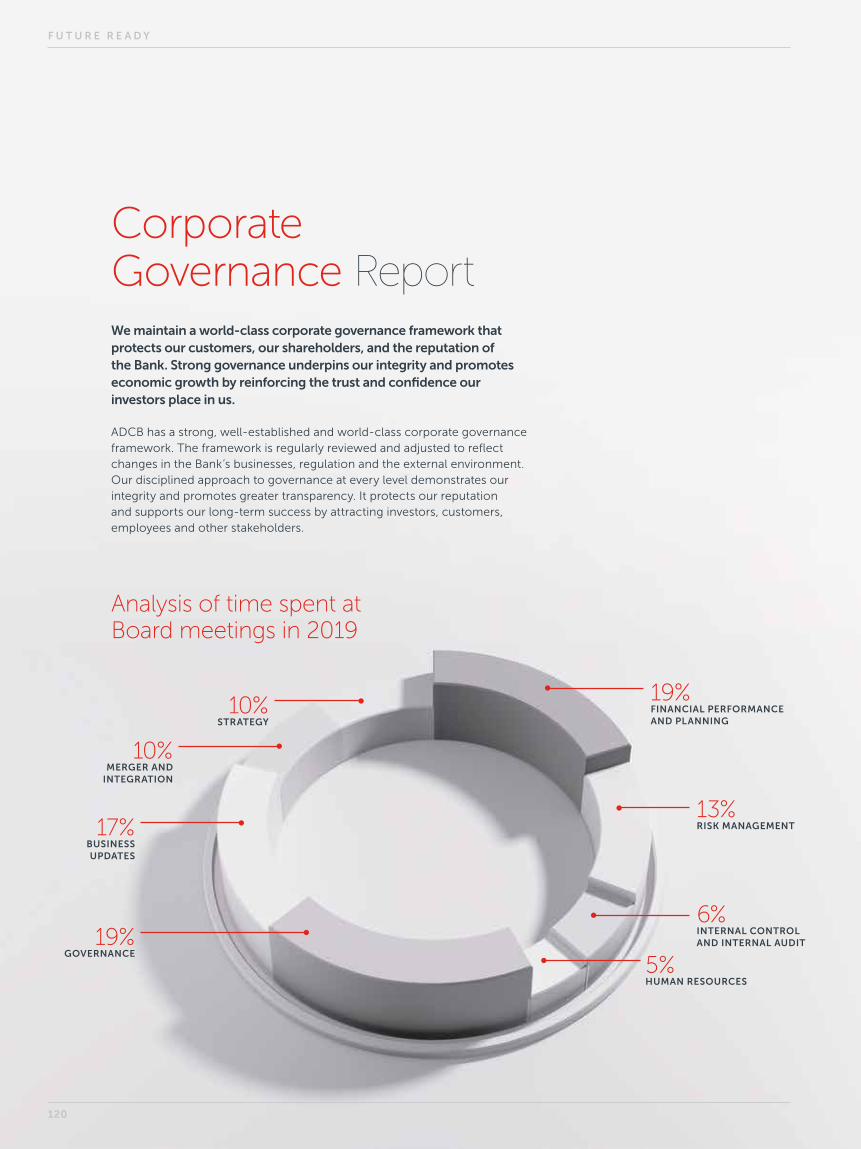
Corporate Governance ReportWe maintain a world-class corporate governance framework that protects our customers, our shareholders, and the reputation of the Bank. Strong governance underpins our integrity and promotes economic growth by reinforcing the trust and confidence our investors place in us.
ADCB has a strong, well-established and world-class corporate governance framework. The framework is regularly reviewed and adjusted to reflect changes in the Bank’s businesses, regulation and the external environment. Our disciplined approach to governance at every level demonstrates our integrity and promotes greater transparency. It protects our reputation and supports our long-term success by attracting investors, customers, employees and other stakeholders.
Analysis of time spent at Board meetings in 2019
10%STRATEGY
10%MERGER AND
INTEGRATION
17%BUSINESS UPDATES
19%GOVERNANCE
19%FINANCIAL PERFORMANCE AND PLANNING
13%RISK MANAGEMENT
6%INTERNAL CONTROL AND INTERNAL AUDIT
5%HUMAN RESOURCES
F U T U R E R E A D Y
120

THE BOARD: MEMBERSHIP, COMMITTEES AND MEETINGSThe Board, which consists of 11 members, met eight times in 2019. In addition, Directors received information between meetings about the activities of Board and Management Committees and developments in the Group’s business.
Members of Senior Management were invited to all these meetings to enhance the Board’s engagement with management and deepen their understanding of the business. In addition, Board members made regular visits to various divisions of the Bank to enrich their knowledge of our operations.
At the start of 2019, the Board had four standing Committees, which covered: Audit & Compliance, Corporate Governance, Risk & Credit, and Nomination, Compensation & Human Resources. During 2019, we merged Corporate Governance into the Nomination, Compensation & Human Resources Committee to create the Nomination, Compensation, Human Resources & Governance Committee.
Each member of the Board, with the exception of Ala’a Eraiqat, the Group Chief Executive Officer, serves on at least one standing Committee. The Committees met a total of 46 times in 2019. Chairmanships and memberships of the Board Committees are reviewed on a regular basis to ensure suitability. Membership is rotated as needed.
DIRECTORS’ INDEPENDENCE AND MANAGEMENT REPORTINGIndependence is an important factor in our ability to serve in the best interest of the Bank and all its stakeholders. All non-executive Directors are considered independent, according to the UAE Central Bank’s regulations on corporate governance.
On the management side, the Group Chief Internal Auditor reports to the Board’s Audit & Compliance Committee, and the Board Secretary reports to the Board. The Group Chief Risk Officer has direct access to the Board Risk & Credit Committee and the Group Chief Compliance Officer has direct access to the Board Audit & Compliance Committee.
To ensure that the Board has the benefit of independent thinking and international governance expertise, Sir Gerry Grimstone was appointed as Independent Adviser to the Board in 2013. In 2019, Sir Gerry attended five Board meetings and the Board strategy session. His background and experience continue to enrich the Board’s deliberations, particularly in the areas of strategy, governance, Board reporting and effectiveness, performance assessments for Senior Management, succession planning, and evaluation of risk appetite and rewards.
THE BOARD’S AGENDA IN 2019The Board of Directors regularly discusses items that are fundamental to the direction of the Bank, including business performance, long-term planning, strategy, risk appetite and management, succession planning, and human resources. Details of the agenda items discussed by the Board and its Committees during 2019 are set out on pages 122–124.
Corporate governance framework
A D C B 2 0 1 9 A N N U A L R E P O R T
121
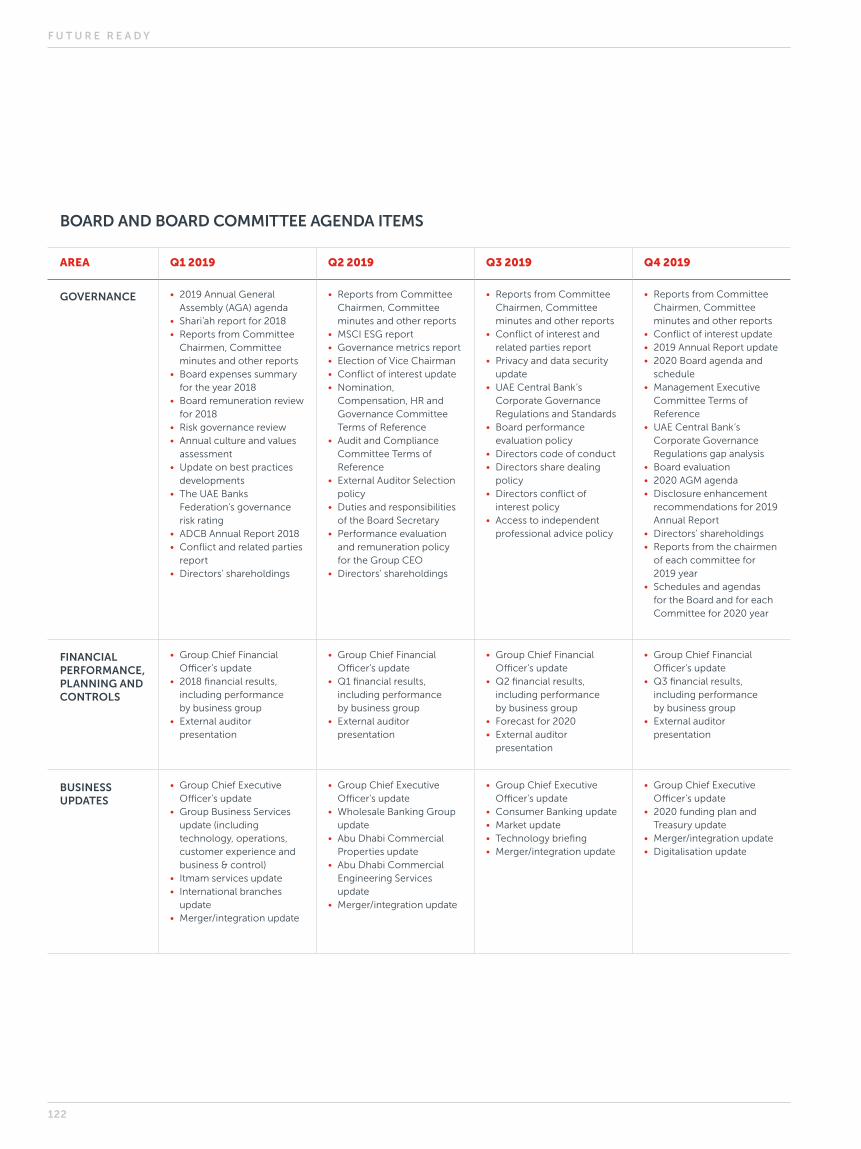
AREA Q1 2019 Q2 2019 Q3 2019 Q4 2019
GOVERNANCE • 2019 Annual General Assembly (AGA) agenda
• Shari’ah report for 2018• Reports from Committee
Chairmen, Committee minutes and other reports
• Board expenses summary for the year 2018
• Board remuneration review for 2018
• Risk governance review• Annual culture and values
assessment• Update on best practices
developments• The UAE Banks
Federation’s governance risk rating
• ADCB Annual Report 2018• Conflict and related parties
report• Directors’ shareholdings
• Reports from Committee Chairmen, Committee minutes and other reports
• MSCI ESG report• Governance metrics report• Election of Vice Chairman• Conflict of interest update• Nomination,
Compensation, HR and Governance Committee Terms of Reference
• Audit and Compliance Committee Terms of Reference
• External Auditor Selection policy
• Duties and responsibilities of the Board Secretary
• Performance evaluation and remuneration policy for the Group CEO
• Directors’ shareholdings
• Reports from Committee Chairmen, Committee minutes and other reports
• Conflict of interest and related parties report
• Privacy and data security update
• UAE Central Bank’s Corporate Governance Regulations and Standards
• Board performance evaluation policy
• Directors code of conduct• Directors share dealing
policy• Directors conflict of
interest policy• Access to independent
professional advice policy
• Reports from Committee Chairmen, Committee minutes and other reports
• Conflict of interest update• 2019 Annual Report update• 2020 Board agenda and
schedule• Management Executive
Committee Terms of Reference
• UAE Central Bank’s Corporate Governance Regulations gap analysis
• Board evaluation• 2020 AGM agenda• Disclosure enhancement
recommendations for 2019 Annual Report
• Directors’ shareholdings• Reports from the chairmen
of each committee for 2019 year
• Schedules and agendas for the Board and for each Committee for 2020 year
FINANCIAL PERFORMANCE, PLANNING AND CONTROLS
• Group Chief Financial Officer’s update
• 2018 financial results, including performance by business group
• External auditor presentation
• Group Chief Financial Officer’s update
• Q1 financial results, including performance by business group
• External auditor presentation
• Group Chief Financial Officer’s update
• Q2 financial results, including performance by business group
• Forecast for 2020• External auditor
presentation
• Group Chief Financial Officer’s update
• Q3 financial results, including performance by business group
• External auditor presentation
BUSINESS UPDATES
• Group Chief Executive Officer’s update
• Group Business Services update (including technology, operations, customer experience and business & control)
• Itmam services update• International branches
update• Merger/integration update
• Group Chief Executive Officer’s update
• Wholesale Banking Group update
• Abu Dhabi Commercial Properties update
• Abu Dhabi Commercial Engineering Services update
• Merger/integration update
• Group Chief Executive Officer’s update
• Consumer Banking update• Market update• Technology briefing• Merger/integration update
• Group Chief Executive Officer’s update
• 2020 funding plan and Treasury update
• Merger/integration update• Digitalisation update
BOARD AND BOARD COMMITTEE AGENDA ITEMS
F U T U R E R E A D Y
122
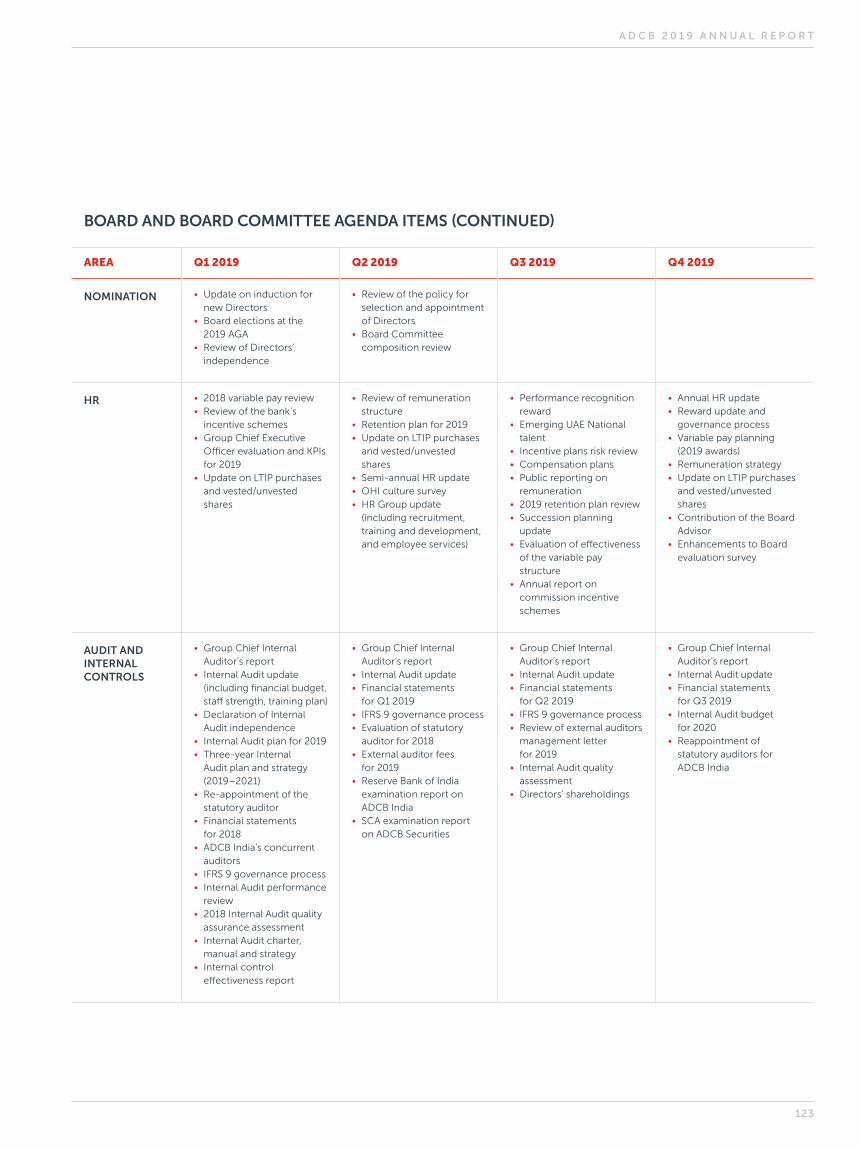
AREA Q1 2019 Q2 2019 Q3 2019 Q4 2019
NOMINATION • Update on induction for new Directors
• Board elections at the 2019 AGA
• Review of Directors’ independence
• Review of the policy for selection and appointment of Directors
• Board Committee composition review
HR • 2018 variable pay review• Review of the bank’s
incentive schemes• Group Chief Executive
Officer evaluation and KPIs for 2019
• Update on LTIP purchases and vested/unvested shares
• Review of remuneration structure
• Retention plan for 2019• Update on LTIP purchases
and vested/unvested shares
• Semi-annual HR update• OHI culture survey• HR Group update
(including recruitment, training and development, and employee services)
• Performance recognition reward
• Emerging UAE National talent
• Incentive plans risk review• Compensation plans• Public reporting on
remuneration• 2019 retention plan review• Succession planning
update• Evaluation of effectiveness
of the variable pay structure
• Annual report on commission incentive schemes
• Annual HR update• Reward update and
governance process• Variable pay planning
(2019 awards)• Remuneration strategy• Update on LTIP purchases
and vested/unvested shares
• Contribution of the Board Advisor
• Enhancements to Board evaluation survey
AUDIT AND INTERNAL CONTROLS
• Group Chief Internal Auditor’s report
• Internal Audit update (including financial budget, staff strength, training plan)
• Declaration of Internal Audit independence
• Internal Audit plan for 2019• Three-year Internal
Audit plan and strategy (2019–2021)
• Re-appointment of the statutory auditor
• Financial statements for 2018
• ADCB India’s concurrent auditors
• IFRS 9 governance process• Internal Audit performance
review• 2018 Internal Audit quality
assurance assessment• Internal Audit charter,
manual and strategy• Internal control
effectiveness report
• Group Chief Internal Auditor’s report
• Internal Audit update• Financial statements
for Q1 2019• IFRS 9 governance process• Evaluation of statutory
auditor for 2018• External auditor fees
for 2019• Reserve Bank of India
examination report on ADCB India
• SCA examination report on ADCB Securities
• Group Chief Internal Auditor’s report
• Internal Audit update• Financial statements
for Q2 2019• IFRS 9 governance process• Review of external auditors
management letter for 2019
• Internal Audit quality assessment
• Directors’ shareholdings
• Group Chief Internal Auditor’s report
• Internal Audit update• Financial statements
for Q3 2019• Internal Audit budget
for 2020• Reappointment of
statutory auditors for ADCB India
BOARD AND BOARD COMMITTEE AGENDA ITEMS (CONTINUED)
A D C B 2 0 1 9 A N N U A L R E P O R T
123
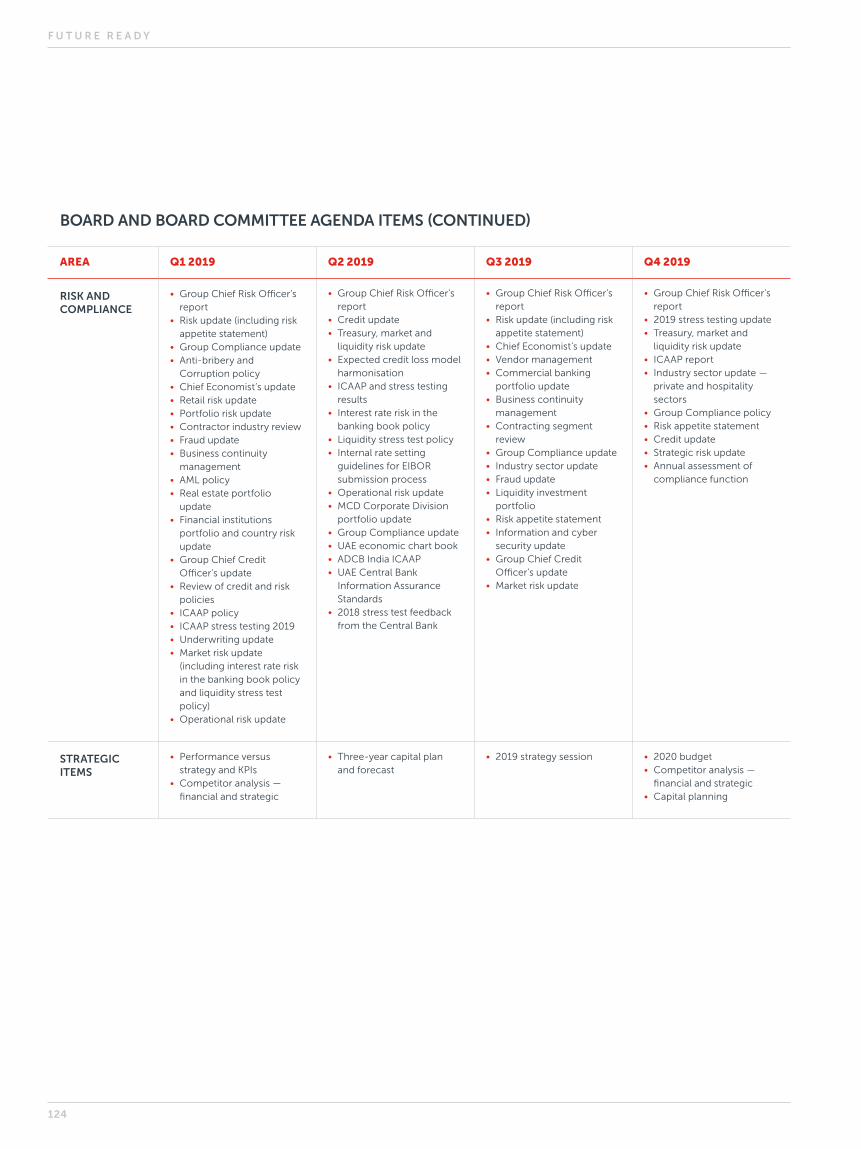
AREA Q1 2019 Q2 2019 Q3 2019 Q4 2019
RISK AND COMPLIANCE
• Group Chief Risk Officer’s report
• Risk update (including risk appetite statement)
• Group Compliance update• Anti-bribery and
Corruption policy • Chief Economist’s update• Retail risk update• Portfolio risk update• Contractor industry review• Fraud update• Business continuity
management• AML policy• Real estate portfolio
update• Financial institutions
portfolio and country risk update
• Group Chief Credit Officer’s update
• Review of credit and risk policies
• ICAAP policy• ICAAP stress testing 2019• Underwriting update• Market risk update
(including interest rate risk in the banking book policy and liquidity stress test policy)
• Operational risk update
• Group Chief Risk Officer’s report
• Credit update• Treasury, market and
liquidity risk update• Expected credit loss model
harmonisation• ICAAP and stress testing
results• Interest rate risk in the
banking book policy• Liquidity stress test policy• Internal rate setting
guidelines for EIBOR submission process
• Operational risk update• MCD Corporate Division
portfolio update• Group Compliance update• UAE economic chart book• ADCB India ICAAP• UAE Central Bank
Information Assurance Standards
• 2018 stress test feedback from the Central Bank
• Group Chief Risk Officer’s report
• Risk update (including risk appetite statement)
• Chief Economist’s update• Vendor management• Commercial banking
portfolio update• Business continuity
management• Contracting segment
review• Group Compliance update • Industry sector update• Fraud update• Liquidity investment
portfolio • Risk appetite statement• Information and cyber
security update• Group Chief Credit
Officer’s update• Market risk update
• Group Chief Risk Officer’s report
• 2019 stress testing update• Treasury, market and
liquidity risk update• ICAAP report• Industry sector update —
private and hospitality sectors
• Group Compliance policy• Risk appetite statement• Credit update• Strategic risk update• Annual assessment of
compliance function
STRATEGIC ITEMS
• Performance versus strategy and KPIs
• Competitor analysis — financial and strategic
• Three-year capital plan and forecast
• 2019 strategy session • 2020 budget• Competitor analysis —
financial and strategic• Capital planning
BOARD AND BOARD COMMITTEE AGENDA ITEMS (CONTINUED)
F U T U R E R E A D Y
124
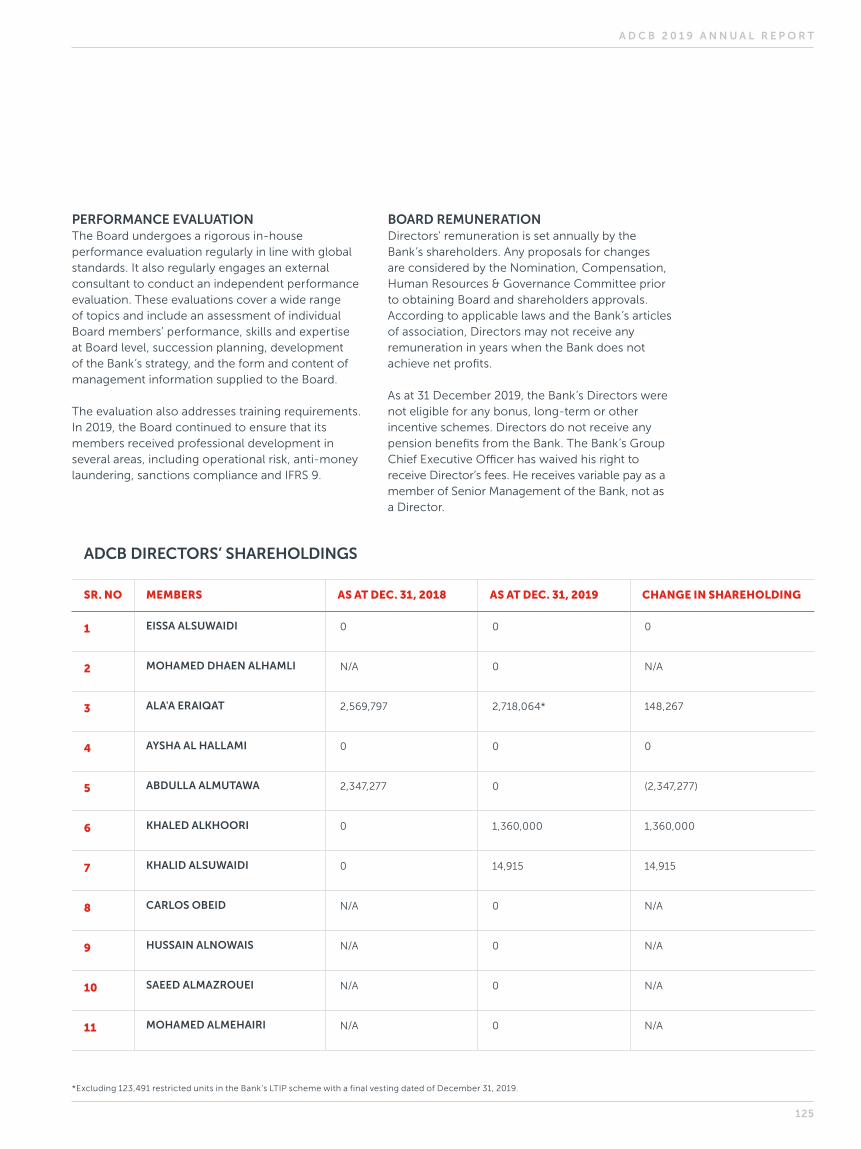
SR. NO MEMBERS AS AT DEC. 31, 2018 AS AT DEC. 31, 2019 CHANGE IN SHAREHOLDING
1 EISSA ALSUWAIDI 0 0 0
2 MOHAMED DHAEN ALHAMLI N/A 0 N/A
3 ALA'A ERAIQAT 2,569,797 2,718,064* 148,267
4 AYSHA AL HALLAMI 0 0 0
5 ABDULLA ALMUTAWA 2,347,277 0 (2,347,277)
6 KHALED ALKHOORI 0 1,360,000 1,360,000
7 KHALID ALSUWAIDI 0 14,915 14,915
8 CARLOS OBEID N/A 0 N/A
9 HUSSAIN ALNOWAIS N/A 0 N/A
10 SAEED ALMAZROUEI N/A 0 N/A
11 MOHAMED ALMEHAIRI N/A 0 N/A
*Excluding 123,491 restricted units in the Bank’s LTIP scheme with a final vesting dated of December 31, 2019.
PERFORMANCE EVALUATIONThe Board undergoes a rigorous in-house performance evaluation regularly in line with global standards. It also regularly engages an external consultant to conduct an independent performance evaluation. These evaluations cover a wide range of topics and include an assessment of individual Board members’ performance, skills and expertise at Board level, succession planning, development of the Bank’s strategy, and the form and content of management information supplied to the Board.
The evaluation also addresses training requirements. In 2019, the Board continued to ensure that its members received professional development in several areas, including operational risk, anti-money laundering, sanctions compliance and IFRS 9.
BOARD REMUNERATIONDirectors’ remuneration is set annually by the Bank’s shareholders. Any proposals for changes are considered by the Nomination, Compensation, Human Resources & Governance Committee prior to obtaining Board and shareholders approvals. According to applicable laws and the Bank’s articles of association, Directors may not receive any remuneration in years when the Bank does not achieve net profits.
As at 31 December 2019, the Bank’s Directors were not eligible for any bonus, long-term or other incentive schemes. Directors do not receive any pension benefits from the Bank. The Bank’s Group Chief Executive Officer has waived his right to receive Director’s fees. He receives variable pay as a member of Senior Management of the Bank, not as a Director.
ADCB DIRECTORS’ SHAREHOLDINGS
A D C B 2 0 1 9 A N N U A L R E P O R T
125
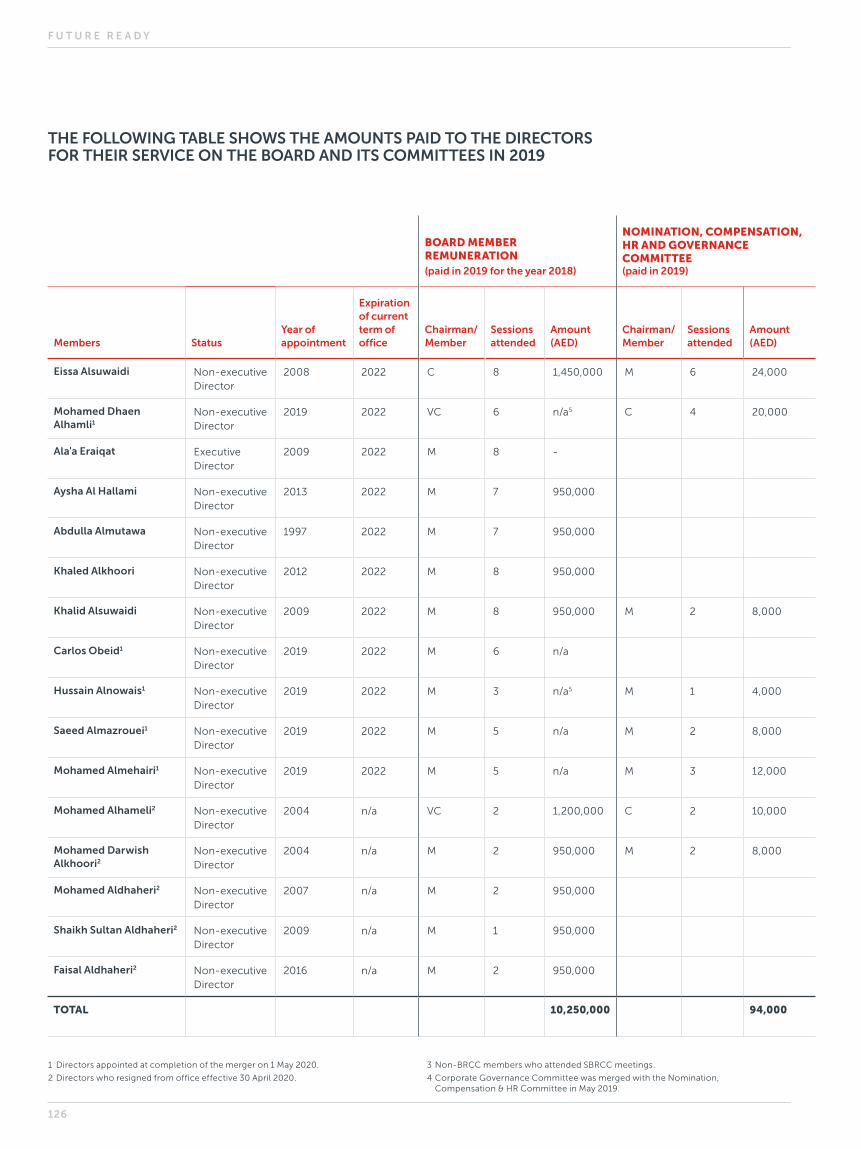
BOARD MEMBER REMUNERATION (paid in 2019 for the year 2018)
NOMINATION, COMPENSATION, HR AND GOVERNANCE COMMITTEE (paid in 2019)
Members StatusYear of appointment
Expiration of current term of office
Chairman/ Member
Sessions attended
Amount (AED)
Chairman/ Member
Sessions attended
Amount (AED)
Eissa Alsuwaidi Non-executive Director
2008 2022 C 8 1,450,000 M 6 24,000
Mohamed Dhaen Alhamli1
Non-executive Director
2019 2022 VC 6 n/a5 C 4 20,000
Ala'a Eraiqat Executive Director
2009 2022 M 8 -
Aysha Al Hallami Non-executive Director
2013 2022 M 7 950,000
Abdulla Almutawa Non-executive Director
1997 2022 M 7 950,000
Khaled Alkhoori Non-executive Director
2012 2022 M 8 950,000
Khalid Alsuwaidi Non-executive Director
2009 2022 M 8 950,000 M 2 8,000
Carlos Obeid1 Non-executive Director
2019 2022 M 6 n/a
Hussain Alnowais1 Non-executive Director
2019 2022 M 3 n/a5 M 1 4,000
Saeed Almazrouei1 Non-executive Director
2019 2022 M 5 n/a M 2 8,000
Mohamed Almehairi1 Non-executive Director
2019 2022 M 5 n/a M 3 12,000
Mohamed Alhameli2 Non-executive Director
2004 n/a VC 2 1,200,000 C 2 10,000
Mohamed Darwish Alkhoori2
Non-executive Director
2004 n/a M 2 950,000 M 2 8,000
Mohamed Aldhaheri2 Non-executive Director
2007 n/a M 2 950,000
Shaikh Sultan Aldhaheri2 Non-executive Director
2009 n/a M 1 950,000
Faisal Aldhaheri2 Non-executive Director
2016 n/a M 2 950,000
TOTAL 10,250,000 94,000
3 Non-BRCC members who attended SBRCC meetings.
4 Corporate Governance Committee was merged with the Nomination, Compensation & HR Committee in May 2019.
1 Directors appointed at completion of the merger on 1 May 2020.
2 Directors who resigned from office effective 30 April 2020.
THE FOLLOWING TABLE SHOWS THE AMOUNTS PAID TO THE DIRECTORS FOR THEIR SERVICE ON THE BOARD AND ITS COMMITTEES IN 2019
F U T U R E R E A D Y
126
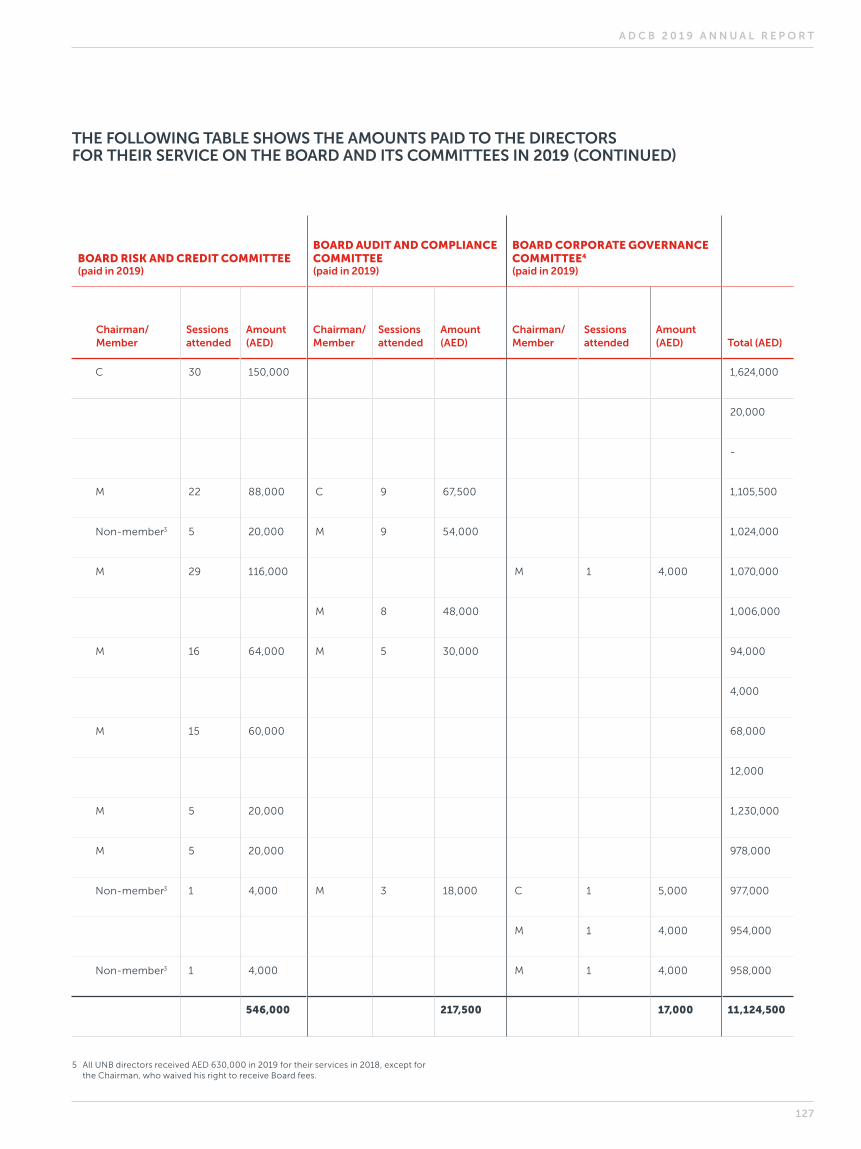
BOARD RISK AND CREDIT COMMITTEE (paid in 2019)
BOARD AUDIT AND COMPLIANCE COMMITTEE (paid in 2019)
BOARD CORPORATE GOVERNANCE COMMITTEE4
(paid in 2019)
Chairman/ Member
Sessions attended
Amount (AED)
Chairman/ Member
Sessions attended
Amount (AED)
Chairman/ Member
Sessions attended
Amount (AED) Total (AED)
C 30 150,000 1,624,000
20,000
-
M 22 88,000 C 9 67,500 1,105,500
Non-member3 5 20,000 M 9 54,000 1,024,000
M 29 116,000 M 1 4,000 1,070,000
M 8 48,000 1,006,000
M 16 64,000 M 5 30,000 94,000
4,000
M 15 60,000 68,000
12,000
M 5 20,000 1,230,000
M 5 20,000 978,000
Non-member3 1 4,000 M 3 18,000 C 1 5,000 977,000
M 1 4,000 954,000
Non-member3 1 4,000 M 1 4,000 958,000
546,000 217,500 17,000 11,124,500
5 All UNB directors received AED 630,000 in 2019 for their services in 2018, except for the Chairman, who waived his right to receive Board fees.
THE FOLLOWING TABLE SHOWS THE AMOUNTS PAID TO THE DIRECTORS FOR THEIR SERVICE ON THE BOARD AND ITS COMMITTEES IN 2019 (CONTINUED)
A D C B 2 0 1 9 A N N U A L R E P O R T
127
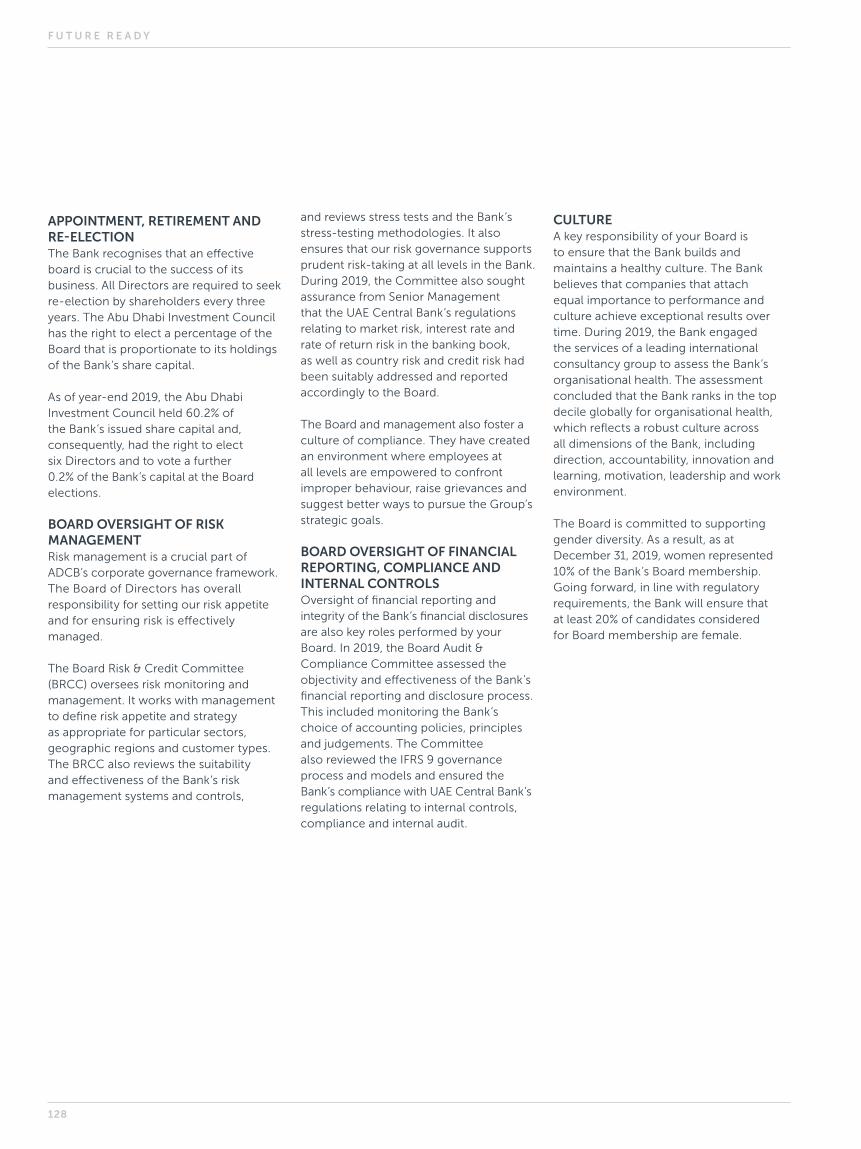
APPOINTMENT, RETIREMENT AND RE-ELECTIONThe Bank recognises that an effective board is crucial to the success of its business. All Directors are required to seek re-election by shareholders every three years. The Abu Dhabi Investment Council has the right to elect a percentage of the Board that is proportionate to its holdings of the Bank’s share capital.
As of year-end 2019, the Abu Dhabi Investment Council held 60.2% of the Bank’s issued share capital and, consequently, had the right to elect six Directors and to vote a further 0.2% of the Bank’s capital at the Board elections.
BOARD OVERSIGHT OF RISK MANAGEMENTRisk management is a crucial part of ADCB’s corporate governance framework. The Board of Directors has overall responsibility for setting our risk appetite and for ensuring risk is effectively managed.
The Board Risk & Credit Committee (BRCC) oversees risk monitoring and management. It works with management to define risk appetite and strategy as appropriate for particular sectors, geographic regions and customer types. The BRCC also reviews the suitability and effectiveness of the Bank’s risk management systems and controls,
and reviews stress tests and the Bank’s stress-testing methodologies. It also ensures that our risk governance supports prudent risk-taking at all levels in the Bank. During 2019, the Committee also sought assurance from Senior Management that the UAE Central Bank’s regulations relating to market risk, interest rate and rate of return risk in the banking book, as well as country risk and credit risk had been suitably addressed and reported accordingly to the Board.
The Board and management also foster a culture of compliance. They have created an environment where employees at all levels are empowered to confront improper behaviour, raise grievances and suggest better ways to pursue the Group’s strategic goals.
BOARD OVERSIGHT OF FINANCIAL REPORTING, COMPLIANCE AND INTERNAL CONTROLSOversight of financial reporting and integrity of the Bank’s financial disclosures are also key roles performed by your Board. In 2019, the Board Audit & Compliance Committee assessed the objectivity and effectiveness of the Bank’s financial reporting and disclosure process. This included monitoring the Bank’s choice of accounting policies, principles and judgements. The Committee also reviewed the IFRS 9 governance process and models and ensured the Bank’s compliance with UAE Central Bank’s regulations relating to internal controls, compliance and internal audit.
CULTUREA key responsibility of your Board is to ensure that the Bank builds and maintains a healthy culture. The Bank believes that companies that attach equal importance to performance and culture achieve exceptional results over time. During 2019, the Bank engaged the services of a leading international consultancy group to assess the Bank’s organisational health. The assessment concluded that the Bank ranks in the top decile globally for organisational health, which reflects a robust culture across all dimensions of the Bank, including direction, accountability, innovation and learning, motivation, leadership and work environment.
The Board is committed to supporting gender diversity. As a result, as at December 31, 2019, women represented 10% of the Bank’s Board membership. Going forward, in line with regulatory requirements, the Bank will ensure that at least 20% of candidates considered for Board membership are female.
F U T U R E R E A D Y
128
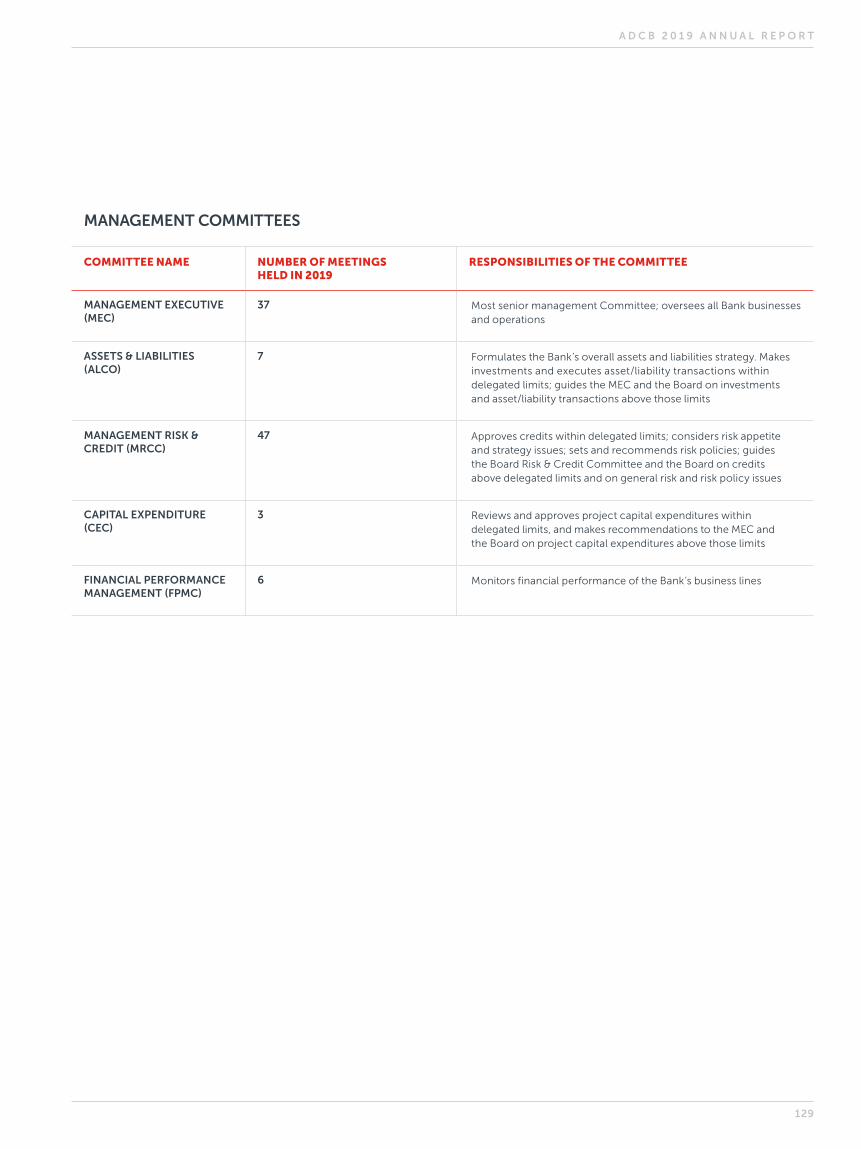
COMMITTEE NAME NUMBER OF MEETINGS HELD IN 2019
RESPONSIBILITIES OF THE COMMITTEE
MANAGEMENT EXECUTIVE (MEC)
37 Most senior management Committee; oversees all Bank businesses and operations
ASSETS & LIABILITIES (ALCO)
7 Formulates the Bank’s overall assets and liabilities strategy. Makes investments and executes asset/liability transactions within delegated limits; guides the MEC and the Board on investments and asset/liability transactions above those limits
MANAGEMENT RISK & CREDIT (MRCC)
47 Approves credits within delegated limits; considers risk appetite and strategy issues; sets and recommends risk policies; guides the Board Risk & Credit Committee and the Board on credits above delegated limits and on general risk and risk policy issues
CAPITAL EXPENDITURE (CEC)
3 Reviews and approves project capital expenditures within delegated limits, and makes recommendations to the MEC and the Board on project capital expenditures above those limits
FINANCIAL PERFORMANCE MANAGEMENT (FPMC)
6 Monitors financial performance of the Bank’s business lines
MANAGEMENT COMMITTEES
A D C B 2 0 1 9 A N N U A L R E P O R T
129
BOARD OVERSIGHT OF RELATED PARTY TRANSACTIONSThe Bank has robust processes in place to identify, assess, monitor and report the Bank’s exposures to related parties. Upon appointment, and every quarter thereafter, all Directors are required to disclose their related parties. The Board Secretariat maintains a conflicts of interest and related parties register, which is reviewed by the Board Nomination, Compensation, HR and Governance Committee every quarter.
During 2019, all related party transactions were conducted on an arm’s-length basis and approved by the Board. Directors with potential conflicts did not participate in relevant discussions or votes. The details of related party transactions are disclosed in Note 36 to the Financial Statements on page 214. These transactions were undertaken as part of the Bank’s day-to-day operations.
BOARD OVERSIGHT OF THE GROUP STRUCTUREThe Bank has robust processes for establishing and dissolving entities within the Group. The Board ensures that the Group’s legal, organisational and operational structure is suitable for its needs. During 2020, following the enlargement of the Group in 2019, the Board will address subsidiary governance, with the aim of ensuring that a framework is in place to effectively govern the enlarged Group.
The number and purpose of the Group’s subsidiaries are disclosed in Note 48 to the Financial Statements on page 254.
AUDIT ARRANGEMENTSDeloitte & Touche, the external auditors, were appointed at the 2015 Annual General Meeting (AGM) and reappointed at the 2016, 2017, 2018, and (exceptionally due to the merger) 2019 AGMs. While local laws and Bank policy restrict the external auditors’ tenure to no more than three consecutive renewals, they allow for certain exceptions. Deloitte & Touche is paid on a fixed annual fee basis, as
approved by the shareholders at the AGM. New external auditors will be appointed for the 2020 financial year.
In 2019, the audit fees for the Bank and its subsidiaries, excluding India and Egypt operations, amounted to AED 4,242,476, and fees for non-audit work amounted to AED 1,363,690. Non-audit work comprised: a comfort letter related to the Bank’s Global Medium Term Note Programme, review of IFRS 9 model, ICFR audit, prudential returns review for the Bank’s Jersey Branch, due diligence services and consultancy on tax matters.
THE BANK’S APPROACH TO DISCLOSUREThe Bank is committed to high standards of transparency and to enhancing our disclosures regularly to reflect local and international best-practice. In this year’s Annual Report, we have sought to further improve clarity around the Bank’s culture, the Group structure, and the Board’s oversight of related party transactions to align with the requirements of the UAE Central Bank’s regulations on corporate governance.
We are confident that the Bank is one of the most transparent institutions in the region. We publicly communicate relevant financial and non-financial information in a timely manner to all our stakeholder groups through several channels. As well as this Annual Report, we provide quarterly market updates, issue regular press releases, and ensure the Bank’s website is up to date. The Bank’s Investor Relations department ensures strong communication with our shareholders and potential investors.
Finally, recognising the importance of effective internal communication, we ensure all employees are kept aware of all new developments. These include the Bank’s strategic direction, objectives, ethics, risk policies, general policies and procedures, new regulations, and other relevant information.
REMUNERATION AND REWARD — GUIDING PRINCIPLESADCB supports levels of remuneration necessary to attract, retain and motivate employees capable of leading, managing and delivering quality service in a competitive environment.
However, our remuneration structure is conservative, and we have practices and policies that promote effective risk management. Our remuneration packages are structured to reflect duties and responsibilities that are fair and equitable, and incorporate clear and measurable rewards linked to corporate and individual performance. Rewards are based only on the results of a rigorous performance appraisal system with a robust management decision-making, review and approvals process.
Considering market trends and constraints, our remuneration programme incorporates both short- and long-term incentives that align the interests of ADCB’s employees with the interests of shareholders and other stakeholders.
Performance-related elements are designed to minimise employee turnover and to inspire employees to perform at the highest levels, consistent with effective risk management.
TOTAL REWARD — KEY COMPONENTSAs shown in the following table, employees can receive three types of reward at ADCB: fixed pay, variable pay and retention scheme.
BANK-WIDE VARIABLE PAY FRAMEWORKThe Variable Pay Framework has been designed to align employees’ interests with the long-term interests of the Bank’s shareholders and to incentivise higher performance while avoiding excessive risk-taking. It also distinguishes amongst different functions of the Bank, to ensure alignment to the relevant market.
F U T U R E R E A D Y
130
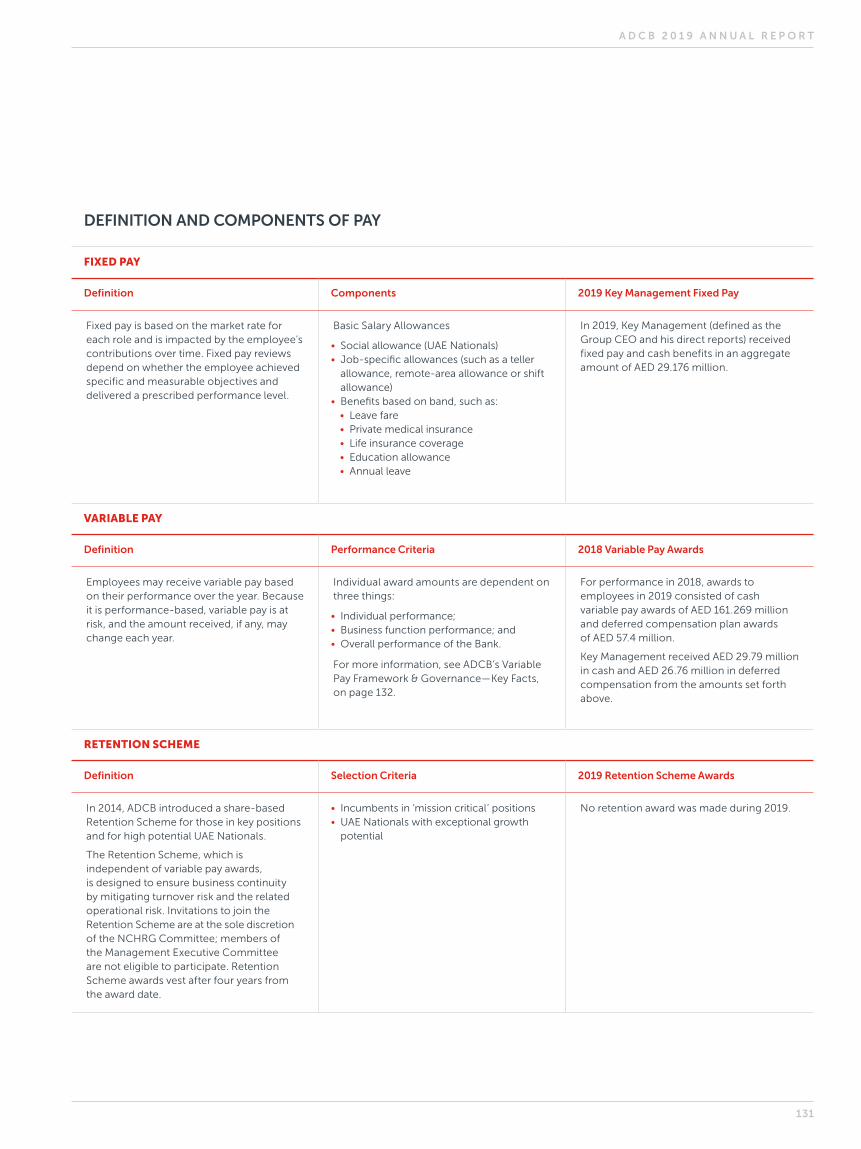
FIXED PAY
Definition Components 2019 Key Management Fixed Pay
Fixed pay is based on the market rate for each role and is impacted by the employee’s contributions over time. Fixed pay reviews depend on whether the employee achieved specific and measurable objectives and delivered a prescribed performance level.
Basic Salary Allowances
• Social allowance (UAE Nationals)• Job-specific allowances (such as a teller
allowance, remote-area allowance or shift allowance)
• Benefits based on band, such as:• Leave fare• Private medical insurance• Life insurance coverage• Education allowance• Annual leave
In 2019, Key Management (defined as the Group CEO and his direct reports) received fixed pay and cash benefits in an aggregate amount of AED 29.176 million.
VARIABLE PAY
Definition Performance Criteria 2018 Variable Pay Awards
Employees may receive variable pay based on their performance over the year. Because it is performance-based, variable pay is at risk, and the amount received, if any, may change each year.
Individual award amounts are dependent on three things:
• Individual performance;• Business function performance; and• Overall performance of the Bank.
For more information, see ADCB’s Variable Pay Framework & Governance—Key Facts, on page 132.
For performance in 2018, awards to employees in 2019 consisted of cash variable pay awards of AED 161.269 million and deferred compensation plan awards of AED 57.4 million.
Key Management received AED 29.79 million in cash and AED 26.76 million in deferred compensation from the amounts set forth above.
RETENTION SCHEME
Definition Selection Criteria 2019 Retention Scheme Awards
In 2014, ADCB introduced a share-based Retention Scheme for those in key positions and for high potential UAE Nationals.
The Retention Scheme, which is independent of variable pay awards, is designed to ensure business continuity by mitigating turnover risk and the related operational risk. Invitations to join the Retention Scheme are at the sole discretion of the NCHRG Committee; members of the Management Executive Committee are not eligible to participate. Retention Scheme awards vest after four years from the award date.
• Incumbents in ‘mission critical’ positions• UAE Nationals with exceptional growth
potential
No retention award was made during 2019.
DEFINITION AND COMPONENTS OF PAY
A D C B 2 0 1 9 A N N U A L R E P O R T
131
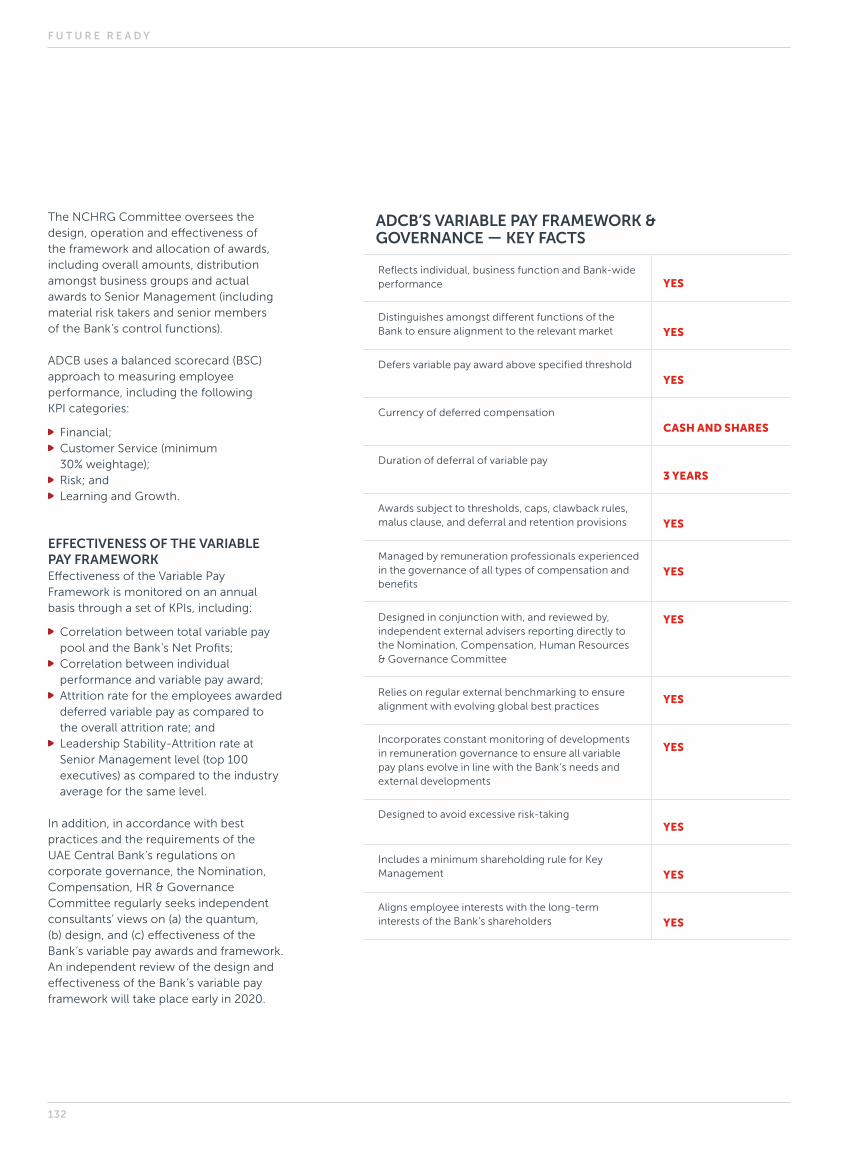
ADCB’S VARIABLE PAY FRAMEWORK & GOVERNANCE — KEY FACTS
Reflects individual, business function and Bank-wide performance YES
Distinguishes amongst different functions of the Bank to ensure alignment to the relevant market YES
Defers variable pay award above specified threshold
YES
Currency of deferred compensation
CASH AND SHARES
Duration of deferral of variable pay
3 YEARS
Awards subject to thresholds, caps, clawback rules, malus clause, and deferral and retention provisions YES
Managed by remuneration professionals experienced in the governance of all types of compensation and benefits
YES
Designed in conjunction with, and reviewed by, independent external advisers reporting directly to the Nomination, Compensation, Human Resources & Governance Committee
YES
Relies on regular external benchmarking to ensure alignment with evolving global best practices
YES
Incorporates constant monitoring of developments in remuneration governance to ensure all variable pay plans evolve in line with the Bank’s needs and external developments
YES
Designed to avoid excessive risk-takingYES
Includes a minimum shareholding rule for Key Management YES
Aligns employee interests with the long-term interests of the Bank’s shareholders YES
The NCHRG Committee oversees the design, operation and effectiveness of the framework and allocation of awards, including overall amounts, distribution amongst business groups and actual awards to Senior Management (including material risk takers and senior members of the Bank’s control functions).
ADCB uses a balanced scorecard (BSC) approach to measuring employee performance, including the following KPI categories:
Financial; Customer Service (minimum 30% weightage);
Risk; and Learning and Growth.
EFFECTIVENESS OF THE VARIABLE PAY FRAMEWORKEffectiveness of the Variable Pay Framework is monitored on an annual basis through a set of KPIs, including:
Correlation between total variable pay pool and the Bank’s Net Profits;
Correlation between individual performance and variable pay award;
Attrition rate for the employees awarded deferred variable pay as compared to the overall attrition rate; and
Leadership Stability-Attrition rate at Senior Management level (top 100 executives) as compared to the industry average for the same level.
In addition, in accordance with best practices and the requirements of the UAE Central Bank’s regulations on corporate governance, the Nomination, Compensation, HR & Governance Committee regularly seeks independent consultants’ views on (a) the quantum, (b) design, and (c) effectiveness of the Bank’s variable pay awards and framework. An independent review of the design and effectiveness of the Bank’s variable pay framework will take place early in 2020.
F U T U R E R E A D Y
132
ADCB Islamic Banking is the brand under which we offer retail and corporate Shari’ah-compliant financial solutions to our Consumer, Wholesale and Treasury clients.
ADCB is regulated by the Central Bank of the UAE, and its Islamic Banking activities are supervised by an independent Internal Shari’ah Supervision Committee (ISSC). The ISSC is the final authority within ADCB regarding all Shari’ah-related matters. It operates in accordance with the resolutions, standards and guidelines issued by the Higher Shari’ah Authority of the Central Bank of the UAE (HSA). HSA follows the Shari’ah Standards issued by the Accounting & Auditing Organization for Islamic Financial Institutions (AAOIFI) and Islamic Financial Services Board (IFSB).
ISSC functions in line with the Shari’ah governance framework provided within the terms of reference (TOR) of the ISSC that are approved by the members of the ISSC. The TOR set out the procedures for the functioning of the ISSC such as holding of meetings, issuing of Fatawas and Shari’ah review.
ADCB Islamic Banking’s Shari’ah governance is implemented and overseen by the internal Shari’ah Advisor. Fatwas (pronouncements and approvals) are issued by the ISSC to certify compliance with principles of Shari’ah for all products and services as well as for bespoke structured deals. The ISSC’s review covers the product structure, the underlying Shari’ah contract, legal documentation, operational process flow and all associated product literature. Fatwas issued by the ISSC are published on the Bank’s website and are available at all branches.
ADCB Islamic Banking maintains a separate set of financial records to ensure that the accounts for the Islamic business are completely segregated from ADCB’s conventional funds. The Bank’s consolidated accounts include the results of ADCB Islamic Banking and are separately disclosed in the notes.
The respected Shari’ah scholars listed below make up the ISSC of ADCB Islamic Banking.
PROFESSOR DR. JASSIM AL SHAMSI, CHAIRMANProfessor Jassim is the first Emirati Shari’ah scholar to lead the ISSC of ADCB Islamic Banking. He previously served as Dean of the College of Shari’ah and Law, UAE University. In addition, he chairs or is a member of many other ISSCs for Islamic banks/windows and financial institutions.
SHEIKH DR. NIZAM YAQUBY, EXECUTIVE MEMBERSheikh Dr. Nizam is one of the most prominent Shari’ah scholars in the world and chairs, or is a member of, the ISSC at several regional and global Islamic banks and financial institutions. He has a strong international reputation for his in-depth knowledge of banking and Shari’ah coupled with a progressive approach towards modern banking solutions.
MR. KAMRAN KHALID SHERWANI, ISSC SECRETARYMr. Kamran is Shari’ah Advisor at ADCB Islamic Banking. He provides Shari’ah guidance on all day-to-day Shari’ah-related matters and obtains ISSC guidance and approvals in respect of each product, service, process and transaction and other Shari’ah-related matters. Mr. Kamran received a degree in Shari’ah and Law from the International Islamic University and is an AAOIFI certified Shari’ah Advisor and Auditor. He has served as Shari’ah advisor to several major Islamic banks and other financial institutions.
Islamic banking governance
A D C B 2 0 1 9 A N N U A L R E P O R T
133
_________________________________________________Sheikh Dr. Nizam YaqubyExecutive Member
_________________________________________________Professor Dr. Jassim Al Shamsi Chairman of the Committee
ANNUAL REPORT OF THE INTERNAL SHARI’AH SUPERVISION COMMITTEE OF ABU DHABI COMMERCIAL BANK ISLAMIC BANKING DIVISION
Issued on: 09 February 2020
To: Shareholders of Abu Dhabi Commercial Bank PJSC (“the Institution”)
After greetings,
Pursuant to the requirements stipulated in the relevant laws, regulations and standards (“Regulatory Requirements”), the Internal Shari’ah Supervision Committee of the Institution (“ISSC”) presents to you the ISSC’s Annual Report regarding Shari’ah compliant businesses and operations of the Institution for the financial year ending on 31 December 2019 (“Financial Year”).
1. Responsibility of the ISSCIn accordance with the Regulatory Requirements and the ISSC’s charter, the ISSC’s responsibility is stipulated as to:
a. undertake Shari’ah supervision of all businesses, activities, products, services, contracts, documents and business charters of the Institution; and the Institution’s policies, accounting standards, operations and activities in general, memorandum of association, charter, financial statements, allocation of expenditures and costs, and distribution of profits between holders of investment accounts and shareholders (“Institution’s Activities”) and issue Shari’ah resolutions in this regard, and
b. to determine Shari’ah parameters necessary for the Institution’s Activities, and the Institution compliance with Islamic Shari’ah within the framework of the rules, principles, and standards set by the Higher Shari’ah Authority (“HSA”) to ascertain compliance of the Institution with Islamic Shari’ah.
The senior management is responsible for compliance of the Institution with Islamic Shari’ah in accordance with the HSA’s resolutions, fatwas, and opinions, and the ISSC’s resolutions within the framework of the rules, principles, and standards set by the HSA (“Compliance with Islamic Shari’ah”) regarding the Institution’s Activities, and the Board bears the ultimate responsibility in this regard.
2. Shari’ah StandardsIn accordance with the HSA’s resolution (No. 18/3/2018), and with effect from 01/09/2018, the ISSC has abided by the Shari’ah standards issued by the Accounting and Auditing Organization for Islamic Financial Institutions (AAOIFI) as minimum Shari’ah requirements, in all fatwas, approvals, endorsements and recommendations, relating to the Institution’s Activities without exception.
3. Works Undertaken by the ISSC During the Financial YearThe ISSC undertook Shari’ah supervision of the Institution’s Activities through review of those Activities, and monitoring through division or internal section of internal Shari’ah control, internal Shari’ah audit, in accordance with the ISSC’s authorities and responsibilities, and pursuant to the Regulatory Requirements in this regard. Works of the ISSC included the following:
F U T U R E R E A D Y
134
a. Convening (4) meetings during the year.
b. Providing fatwas, opinions and resolutions on matters presented to the ISSC in relation to the Institution’s Activities.
c. Monitoring compliance of policies, procedures, accounting standards, product structures, contracts, documentation, business charters, and other documentation submitted by the Institution to the ISSC for approval.
d. Ascertaining the level of compliance of allocation of expenditures and costs, and distribution of profits between holders of investment accounts and shareholders with parameters set by the ISSC.
e. Supervision through division or section of internal Shari’ah Control, internal Shari’ah Audit, of the Institution’s Activities including executed transactions, adopted procedures on the basis of samples selected from executed transactions, and reviewing reports submitted in this regard.
f. Providing direction to relevant parties of the Institution to rectify (where possible) findings cited in the reports submitted by division of section of the internal Shari’ah control, internal Shari’ah audit, and issuance of resolutions to set aside revenue derived from transactions in which non-compliance were identified to be disposed towards charitable purposes.
g. Approving remedial rectification and preventive measures related to identified errors to prevent their reoccurrence in the future.
h. Communicating with the Board and its subcommittees, and the senior management of the Institution (as needed) concerning compliance of the Institution with Islamic Shari’ah.
The ISSC sought to obtain all information and interpretations deemed necessary in order to reach a reasonable degree of certainty that the Institution is compliant with Islamic Shari’ah.
4. Independence of the ISSCThe ISSC acknowledges that it has carried out all of its duties independently and with the support and cooperation of the senior management and the Board of the Institution. The ISSC received the required assistance to access all documents and data, and to discuss all amendments and Shari’ah requirements.
5. The ISSC’s Opinion on the Shari’ah Compliance Status of the InstitutionPremised on information and explanations that were provided to us with the aim of ascertaining compliance with Islamic Shari’ah, the ISSC has concluded with a reasonable level of confidence, that the Institution’s Activities are in compliance with Islamic Shari’ah, except for the incidents of non-compliance observed, as highlighted in the relevant reports, including (47) of breaches that did not result in setting aside revenue. The ISSC also issued directions to take appropriate measure in this regard.
The ISSC formed its opinion, as outlined above, exclusively on the basis of information perused by the ISSC during the financial year.
Signatures of members of the Internal Shari’ah Supervision Committee of the Institution
_________________________________________________Sheikh Dr. Nizam YaqubyExecutive Member
_________________________________________________Professor Dr. Jassim Al Shamsi Chairman of the Committee
A D C B 2 0 1 9 A N N U A L R E P O R T
135
BOARD OF DIRECTORS (AS AT DECEMBER 31, 2019)
• Ala’a Eraiqat*• Siddiqa Abbas*• Saoud Al Jassem• Mohamed Al Jayyash• Kevin Taylor*• Arup Mukhopadhyay*• Deepak Khullar*
*Please refer to pages 108–113 for the profiles of these Directors.
BOARD MEMBERS
MOHAMED AL JAYYASHMohamed Al Jayyash was appointed ADCB’s Acting Group Chief Operations Officer in December 2019. He has held senior operational management positions at ADCB, including Chief Service Officer and Branch Operations Manager. With over 15 years of experience in banking, he now leads the Group Business Services (GBS) division which includes the Operations, Customer Experience, Technology and Property Management teams. GBS is responsible for ensuring the Group has the operational, technological and property management capabilities and systems infrastructure to ensure reliable and agile business operations across the Group.
He is the Chairperson of several ADCB subsidiary companies including ITMAM Services L.L.C., Abu Dhabi Commercial Engineering Services L.L.C. and Abu Dhabi Commercial Properties L.L.C., and a Board Member of Al Hilal Bank PJSC. He is the Chairman of the Board of Directors of Emirates Digital Wallet L.L.C.
Mohamed holds a bachelor’s degree in Business Administration from Al Ghurair University in the UAE. He also holds a postgraduate certificate in Management from Ashridge Executive Education HULT in the UK and a diploma in Banking from
the Emirates Institute for Banking and Financial Studies in Sharjah.
SAOUD AL JASSEMSaoud Al Jassem was appointed to join the Board of Directors of Al Hilal Bank in February 2019 and was elected by the shareholders as Chairman of Al Hilal Bank Kazakhstan.
Saoud has over 17 years of experience in Corporate Banking, Wealth Management, Trade Finance and Internal Audit.
Saoud has been employed by ADCB since June 2013. He currently leads the development of ADCB’s relationship with the various local and federal governments in UAE for all their banking services and funding requirements as Head of Government Banking. Prior to this role, he managed government banking in Dubai & Northern Emirates as well as heading Strategic Accounts within Transaction Banking in the region.
Previously, at Emirates NBD, he was part of Wealth Management and Client Relationship Management. He also held various positions at Standard Chartered Bank within the Global Internal Audit Department in MENA/SA as well as Global Corporate where he started his career and spent over seven years in various assignments.
Saoud holds a Master of Business Administration degree from London Business School (UK) and a bachelor’s degree in Finance from Drexel University, Philadelphia, USA.
EXECUTIVE MANAGEMENT
1. ABDUL SHAKEEL AIDAROOS (CHIEF EXECUTIVE OFFICER)As CEO, Abdul Shakeel is responsible for working closely with the Board of
Directors of the Bank to set and implement the strategic direction of the organisation.
Abdul Shakeel has over 25 years of banking industry experience, with deep expertise in retail banking, digital innovation and risk management. He has held senior positions at ADCB for 15 years, including the last five years as Head of Retail Banking, where he managed a team of 2,000 professionals and launched many of ADCB’s award-winning consumer products and digital banking channels. Prior to joining ADCB, he spent over 10 years with Citibank in the UAE. Abdul Shakeel holds a Master of Science degree in Risk Management from NYU Stern School of Business, New York, USA.
2. ROSS BARANET (CHIEF RISK OFFICER)Ross Baranet is Chief Risk Officer at Al Hilal Bank. He has spent 25 years in the field of risk management across nine countries and is responsible for identifying and mitigating current and emerging risks at the Bank. Before joining Al Hilal Bank and the ADCB Group, Ross held executive roles in HSBC’s global operations, including Chief Risk Officer (Philippines), Director of HSBC Retail Savings Bank (Philippines), Chief Risk Operating Officer (Middle East), and Chief Risk Officer (Korea). Previous roles include operational risk, approvals, collections, policy, audit, and governance.
3. IAN HODGES (SENIOR MANAGING DIRECTOR, PERSONAL BANKING GROUP)Ian Hodges is the Senior Managing Director, Personal Banking Group at Al Hilal Bank. With over 30 years of experience across retail and digital banking, Ian is responsible for leading frontline delivery across Branches, Executive Banking and Digital; the development of products and services to enhance the customer experience; and Investment Banking, in line with
AL HILAL BANK PJSC
F U T U R E R E A D Y
136

the strategic objectives of Al Hilal Bank and the ADCB Group. Before joining the Bank, Ian served as the Head of Business Development at the Al Etihad Credit Bureau. He also held the roles of Managing Director, Retail Banking at the National Bank of Ras Al Khaimah, and Director, Branch Network for the UK-based Cooperative Bank. In his early career, Ian worked as Head of Call Centre at the Cooperative Bank and in a number of management roles at Lloyds TSB in the UK.
4. SULTAN AL MAHMOOD (CHIEF HUMAN RESOURCES OFFICER)Sultan Al Mahmood is Chief Human Resources Officer at Al Hilal Bank. With almost 20 years of experience in the field of Human Resources and Relationship Management, Sultan is responsible for HR development, transformation, and strategic HR activities. Before joining the Bank, Sultan served as Senior Vice-President Human Resources at Etihad Airways. He also held the roles of Executive Director of Strategic Performance at Tourism Development and Investment Company (TDIC), and Executive Vice President and Head of Human Resources at Abu Dhabi Commercial Bank. In his early career, he worked as a Compensation and Employee Relations Manager at Amiri Flight (now Presidential Flight) and as a Relationship Manager at Citibank, UAE. Sultan holds a bachelor’s degree in Business Administration and a master’s degree in Human Resources Development from Webster University in Geneva, Switzerland. Sultan also holds a Master of Business Administration in Strategic and Security Studies from National Defense College, Abu Dhabi.
5. ABDEL KARIM TAHA (CHIEF INFORMATION OFFICER)Abdel Karim Taha is the Chief Information Officer at Al Hilal Bank. With more than 22 years of experience in the field of Information Technology and Consulting, Abdel Karim leads the Information Technology team and is responsible for implementing future technologies and delivering the transformation initiatives
in line with the Bank’s objectives and strategy. Before joining the Bank, Abdel Karim served as Chief Information Officer at Union National Bank. He also held senior consulting positions at Accenture. In his early career, Abdel Karim worked as a specialist in Geographic Information Systems. Abdel Karim holds a bachelor’s degree in Electrical Engineering from Jordan University of Science and Technology, and holds several Executive Certificates from MIT and other institutions.
6. DR. MOHAMED OBADAH (HEAD OF SHARI’AH SUPERVISION)Dr. Mohamed Obadah Adi is Head of Shariah Supervision at Al Hilal Bank. With almost 23 years of experience in the field of Shari’ah and banking, Dr. Mohamed is responsible for monitoring and supervising activities to maintain Shari’ah compliance and assist in developing and creating innovative Shari’ah investment and financing products and services. Before joining the Bank, Dr. Mohamed was a Supervisor of Islamic Studies and Arabic Language at ADNOC’s Technical Institute. Dr. Mohamed holds a Doctorate Degree (PhD) in Islamic Studies from the University of Wales in the UK and master’s degree from Al Azhar University’s Faculty of Islamic and Arabic Studies. He received his bachelor’s degree in Islamic Studies from United Arab Emirates University.
7. RAJESH ARORA (HEAD OF FINANCE)Rajesh Arora was appointed as the Head of Finance for Al Hilal Bank in November 2019, prior to which he was the Head of Finance for UNB. He has over 23 years of experience in the banking industry spread across various geographies. Before joining UNB, Rajesh was with Standard Chartered Bank for more than 18 years where he performed various roles, including Chief Financial Officer, UAE. His last role in Standard Chartered Bank was as the Global Head of Finance Transformation for financial reporting based in Singapore. Rajesh completed his ICWA in India and holds a Postgraduate
Diploma in Management (Finance) from Symbiosis Centre for Management and HRD, India.
8. NADA SHADID (HEAD OF TREASURY)Nada Mohamed Shadid is the Head of Treasury at Al Hilal Bank. She is responsible for the management of liquidity, gaps, and regulatory ratios, as well as money markets funding, foreign exchange and Sukuk investment portfolios of the Bank. Nada joined the Bank in 2019 and has 10 years of experience in Treasury and Investments. Previously, Nada held significant Treasury positions in ADCB, where she was responsible for running the short-term investments portfolio, as well as generating liabilities from strategically important clients and markets. Nada holds a bachelor’s degree in International Management from Franklin University in Lugano, Switzerland.
9. ZSOMBOR BROMMER (CHIEF COMPLIANCE OFFICER)Zsombor Brommer is the Chief Compliance Officer at Al Hilal Bank. With more than 20 years of experience in global banking as a compliance and digital risk management professional, Zsombor is responsible for overseeing and managing regulatory compliance, money-laundering, terrorism financing, and sanctions compliance risks within the organisation. He ensures the Bank meets applicable regulations and policies, leading compliance activities in line with its strategy. Before joining the Bank, Zsombor served as Group Senior Compliance Manager in HSBC. Previously he worked as Head of Compliance in Citibank Hungary and had compliance responsibilities as EMEA Regional Commercial Banking Compliance Officer. He was also Chairman of the Hungarian Banking Association AML Working Group. Zsombor holds bachelor’s degrees both in Economics and Communication from Kodolanyi Janos University, Hungary.
A D C B 2 0 1 9 A N N U A L R E P O R T
137
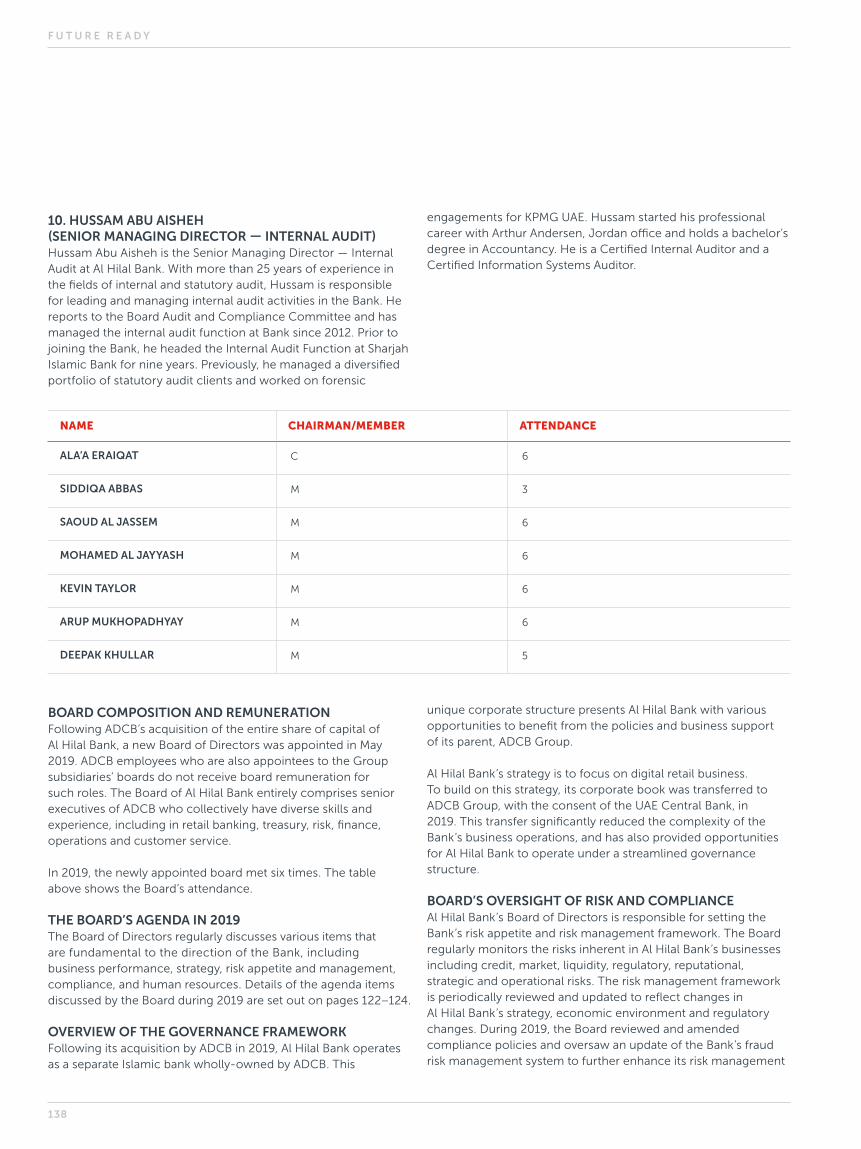
BOARD COMPOSITION AND REMUNERATION Following ADCB’s acquisition of the entire share of capital of Al Hilal Bank, a new Board of Directors was appointed in May 2019. ADCB employees who are also appointees to the Group subsidiaries’ boards do not receive board remuneration for such roles. The Board of Al Hilal Bank entirely comprises senior executives of ADCB who collectively have diverse skills and experience, including in retail banking, treasury, risk, finance, operations and customer service.
In 2019, the newly appointed board met six times. The table above shows the Board’s attendance.
THE BOARD’S AGENDA IN 2019The Board of Directors regularly discusses various items that are fundamental to the direction of the Bank, including business performance, strategy, risk appetite and management, compliance, and human resources. Details of the agenda items discussed by the Board during 2019 are set out on pages 122–124.
OVERVIEW OF THE GOVERNANCE FRAMEWORKFollowing its acquisition by ADCB in 2019, Al Hilal Bank operates as a separate Islamic bank wholly-owned by ADCB. This
NAME CHAIRMAN/MEMBER ATTENDANCE
ALA’A ERAIQAT C 6
SIDDIQA ABBAS M 3
SAOUD AL JASSEM M 6
MOHAMED AL JAYYASH M 6
KEVIN TAYLOR M 6
ARUP MUKHOPADHYAY M 6
DEEPAK KHULLAR M 5
10. HUSSAM ABU AISHEH (SENIOR MANAGING DIRECTOR — INTERNAL AUDIT)Hussam Abu Aisheh is the Senior Managing Director — Internal Audit at Al Hilal Bank. With more than 25 years of experience in the fields of internal and statutory audit, Hussam is responsible for leading and managing internal audit activities in the Bank. He reports to the Board Audit and Compliance Committee and has managed the internal audit function at Bank since 2012. Prior to joining the Bank, he headed the Internal Audit Function at Sharjah Islamic Bank for nine years. Previously, he managed a diversified portfolio of statutory audit clients and worked on forensic
engagements for KPMG UAE. Hussam started his professional career with Arthur Andersen, Jordan office and holds a bachelor’s degree in Accountancy. He is a Certified Internal Auditor and a Certified Information Systems Auditor.
unique corporate structure presents Al Hilal Bank with various opportunities to benefit from the policies and business support of its parent, ADCB Group.
Al Hilal Bank’s strategy is to focus on digital retail business. To build on this strategy, its corporate book was transferred to ADCB Group, with the consent of the UAE Central Bank, in 2019. This transfer significantly reduced the complexity of the Bank’s business operations, and has also provided opportunities for Al Hilal Bank to operate under a streamlined governance structure.
BOARD’S OVERSIGHT OF RISK AND COMPLIANCEAl Hilal Bank’s Board of Directors is responsible for setting the Bank’s risk appetite and risk management framework. The Board regularly monitors the risks inherent in Al Hilal Bank’s businesses including credit, market, liquidity, regulatory, reputational, strategic and operational risks. The risk management framework is periodically reviewed and updated to reflect changes in Al Hilal Bank’s strategy, economic environment and regulatory changes. During 2019, the Board reviewed and amended compliance policies and oversaw an update of the Bank’s fraud risk management system to further enhance its risk management
F U T U R E R E A D Y
138
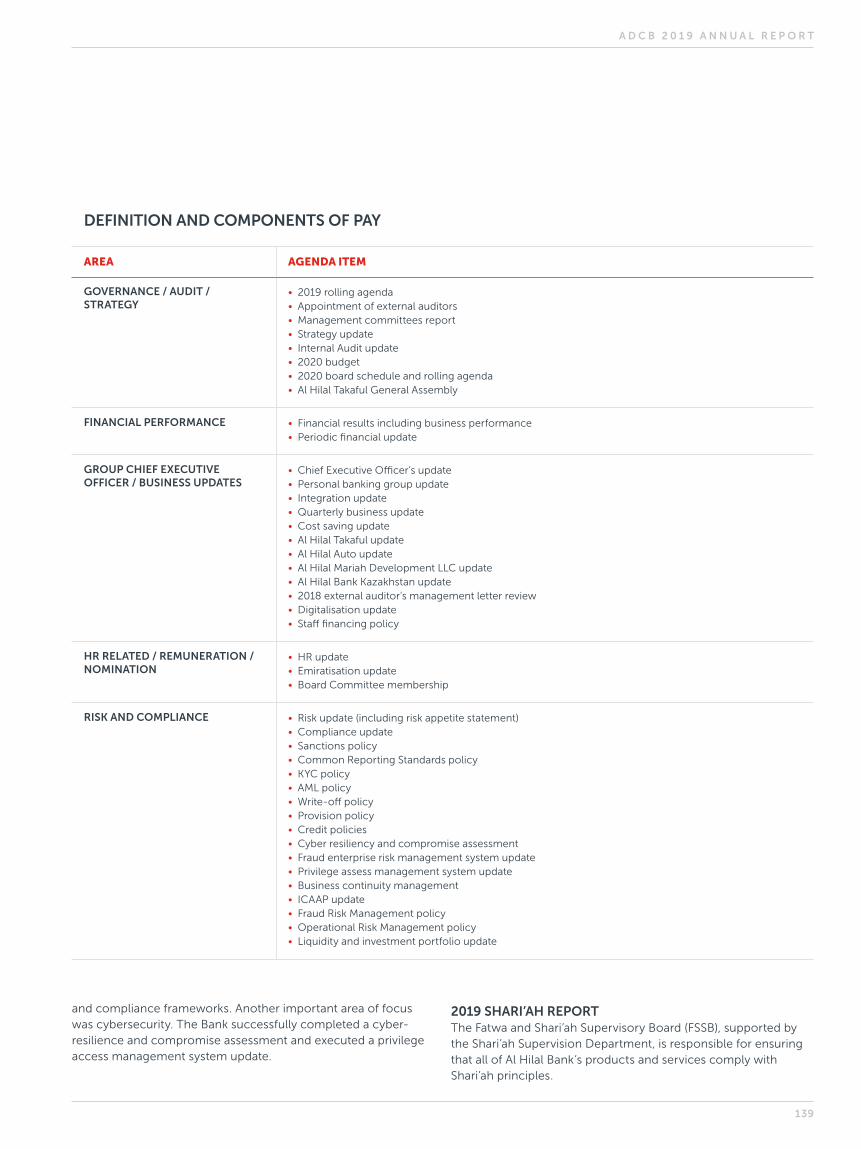
AREA AGENDA ITEM
GOVERNANCE / AUDIT / STRATEGY
• 2019 rolling agenda• Appointment of external auditors• Management committees report• Strategy update• Internal Audit update• 2020 budget• 2020 board schedule and rolling agenda• Al Hilal Takaful General Assembly
FINANCIAL PERFORMANCE • Financial results including business performance• Periodic financial update
GROUP CHIEF EXECUTIVE OFFICER / BUSINESS UPDATES
• Chief Executive Officer’s update• Personal banking group update• Integration update• Quarterly business update• Cost saving update• Al Hilal Takaful update• Al Hilal Auto update• Al Hilal Mariah Development LLC update• Al Hilal Bank Kazakhstan update• 2018 external auditor’s management letter review• Digitalisation update• Staff financing policy
HR RELATED / REMUNERATION / NOMINATION
• HR update• Emiratisation update• Board Committee membership
RISK AND COMPLIANCE • Risk update (including risk appetite statement)• Compliance update• Sanctions policy• Common Reporting Standards policy• KYC policy• AML policy• Write-off policy• Provision policy• Credit policies• Cyber resiliency and compromise assessment• Fraud enterprise risk management system update• Privilege assess management system update• Business continuity management• ICAAP update• Fraud Risk Management policy• Operational Risk Management policy• Liquidity and investment portfolio update
2019 SHARI’AH REPORTThe Fatwa and Shari’ah Supervisory Board (FSSB), supported by the Shari’ah Supervision Department, is responsible for ensuring that all of Al Hilal Bank’s products and services comply with Shari’ah principles.
DEFINITION AND COMPONENTS OF PAY
and compliance frameworks. Another important area of focus was cybersecurity. The Bank successfully completed a cyber-resilience and compromise assessment and executed a privilege access management system update.
A D C B 2 0 1 9 A N N U A L R E P O R T
139
ANNUAL REPORT OF THE INTERNAL SHARI’AH SUPERVISION COMMITTEE OF AL HILAL BANK
Issued on: Thursday, 5th Jumada Al Akhirah 1441 AH, corresponding to 30th Jan 2020
To: Shareholders of Al Hilal Bank (“the Bank”)
After greetings,
Pursuant to the requirements stipulated in the relevant laws, regulations and standards (“Regulatory Requirements”), the Internal Shari’ah Supervision Committee of the bank (“ISSC”) presents to you its Annual Report for the financial year ending on 31 December 2019 (“Financial Year”).
1. Responsibility of the ISSC In accordance with the Regulatory Requirements and the ISSC’s charter, the ISSC’s responsibility is stipulated as to: undertake Shari’ah supervision of all businesses, activities, products, services, contracts, documents and business charters of the Bank; and the Bank’s policies, accounting standards, operations and activities in general, memorandum of association, charter, financial statements, allocation of expenditures and costs, and distribution of profits between holders of investment accounts and shareholders (“Bank’s Activities”) and issue Shari’ah resolutions in this regard, and to determine Shari’ah parameters necessary for the Bank’s Activities, and the Bank’s compliance with Islamic Shari’ah within the framework of the rules, principles, and standards set by the Higher Shari’ah Authority (“HSA”) to ascertain compliance of the Bank with Islamic Shari’ah. The senior management is responsible for compliance of the Bank with Islamic Shari’ah in accordance with the HSA’s resolutions, fatwas, and opinions, and the ISSC’s resolutions within the framework of the rules, principles, and standards set by the HSA (“Compliance with Islamic Shari’ah”) regarding the Bank’s Activities, and the Board bears the ultimate responsibility in this regard.
2. Shari’ah Standards In accordance with the HSA‘s resolution (No. 18/3/2018), and with effect from 01/09/2018, the ISSC has abided by the Shari’ah standards issued by the Accounting and Auditing Organization for Islamic Financial Institutions (AAOIFI) as minimum Shari’ah requirements, in all fatwas, approvals, endorsements and recommendations, relating to the Bank’s Activities without exception.
3. Works Undertaken by the ISSC During the Financial Year The ISSC undertook Shari’ah supervision of the Bank’s Activities through review of those Activities, and monitoring through internal Shari’ah supervision department and internal Shari’ah audit in accordance with the ISSC’s authorities and responsibilities, and pursuant to the Regulatory Requirements in this regard. Works of the ISSC included the following:
a. Convening eight meetings during the financial year.
b. Providing fatwas, opinions and resolutions on matters presented to the ISSC in relation to the Bank’s Activities.
c. Monitoring compliance of policies, procedures, accounting standards, product structures, contracts, documentation, business charters, and other documentation submitted by the Bank and its subsidiaries to the ISSC for approval.
d. Ascertaining the level of compliance of allocation of expenditures and costs, and distribution of profits between holders of investment accounts and shareholders with parameters set by the ISSC.
F U T U R E R E A D Y
140

e. Supervision through internal Shari’ah supervision department and internal Shari’ah Audit of the Bank’s Activities including executed transactions, adopted procedures on the basis of samples selected from executed transactions, and reviewing reports submitted in this regard.
f. Providing direction to relevant parties of the Bank and its subsidiaries to rectify (where possible) findings cited in the reports submitted by internal Shari’ah supervision department and internal Shari’ah audit, and issuance of resolutions to set aside revenue derived from transactions in which non-compliance were identified to be disposed towards charitable purposes.
g. Approving remedial rectification and preventive measures related to identified errors to prevent their reoccurrence in the future.
h. Specifying the amount of Zakat due on each of the Bank’s shares.
i. Specifying the amount of Zakat due on the depositor’s reserves.
j. Monitoring charity account sources and payments.
k. Communicating with the Board, and the senior management of the Bank concerning compliance of the Bank with Islamic Shari’ah.
The ISSC sought to obtain all information and interpretations deemed necessary in order to reach a reasonable degree of certainty that the Bank is compliant with Islamic Shari’ah.
4. Independence of the ISSC The ISSC acknowledges that it has carried out all of its duties independently and with the support and cooperation of the senior management and the Board of the Bank. The ISSC received the required assistance to access all documents and data, and to discuss all amendments and Shari’ah requirements.
5. The ISSC’s Opinion on the Shari’ah Compliance Status of the Bank Premised on information and explanations that were provided to us with the aim of ascertaining compliance with Islamic Shari’ah, the ISSC has concluded with a reasonable level of confidence, that the Bank’s Activities are in compliance with Islamic Shari’ah, except for the incidents of non-compliance observed, as highlighted in the relevant reports, including ten breaches that did not result in setting aside revenue. The ISSC also issued directions to take appropriate measures in this regard.
The ISSC formed its opinion, as outlined above, exclusively on the basis of information perused by the ISSC during the financial year.
Signatures of members of the Internal Shari‘ah Supervision Committee
_____________________________Dr. Ibrahim Ali Al Mansoori Chairman
_____________________________Dr. Ali Husain Al Junaidi Member
_____________________________Dr. Salim Ali Al Ali Member
A D C B 2 0 1 9 A N N U A L R E P O R T
141
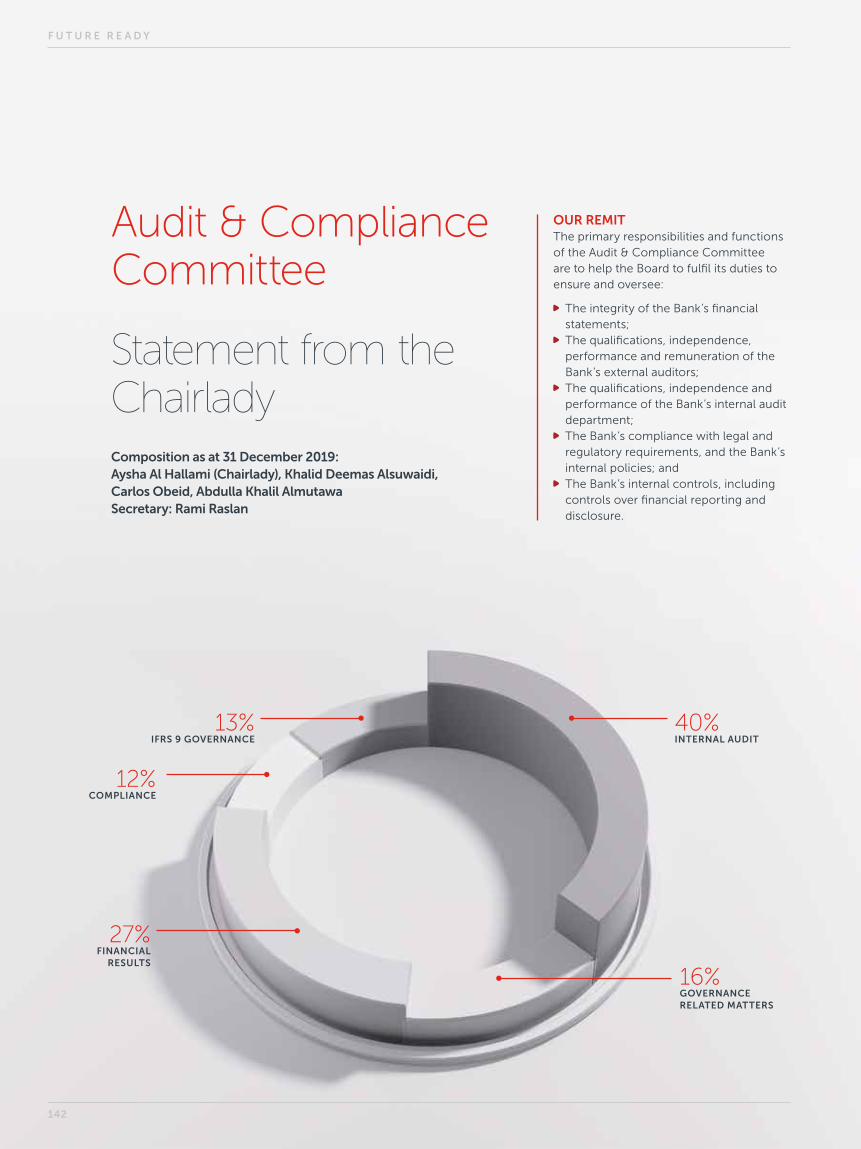
OUR REMITThe primary responsibilities and functions of the Audit & Compliance Committee are to help the Board to fulfil its duties to ensure and oversee:
The integrity of the Bank’s financial statements;
The qualifications, independence, performance and remuneration of the Bank’s external auditors;
The qualifications, independence and performance of the Bank’s internal audit department;
The Bank’s compliance with legal and regulatory requirements, and the Bank’s internal policies; and
The Bank’s internal controls, including controls over financial reporting and disclosure.
27%FINANCIAL
RESULTS
12%COMPLIANCE
13%IFRS 9 GOVERNANCE
16%GOVERNANCE RELATED MATTERS
40%INTERNAL AUDIT
Audit & Compliance Committee
Statement from the ChairladyComposition as at 31 December 2019: Aysha Al Hallami (Chairlady), Khalid Deemas Alsuwaidi, Carlos Obeid, Abdulla Khalil Almutawa Secretary: Rami Raslan
F U T U R E R E A D Y
142
Dear Shareholders,
During 2019, the Audit & Compliance Committee held nine meetings, during which the Committee:
Assessed the objectivity and effectiveness of the Bank’s financial reporting and disclosure process. This included monitoring of the Bank’s choice of accounting policies, principles and judgements;
Reviewed and discussed the Bank’s IFRS 9 governance process, models, and implications for the Bank’s financial statements (before and after the merger with UNB) and ensured the Bank’s compliance with UAE Central Bank’s regulations relating to IFRS 9;
Evaluated the external auditors’ qualifications, performance, independence and objectivity, reviewed the scope of work proposed by the external auditors for 2019, and exercised oversight of all non-audit work carried out by the external audit firm;
Considered purchase price adjustments recommended by management following the merger with UNB and acquisition of Al Hilal Bank;
Considered the performance, effectiveness and activities of the Bank’s Internal Audit function (and separately, the performance of the Head of Internal Audit) and reviewed updates to its audit plan, staffing plan, training plan, charter, manual, and strategy taking note of the new UAE Central Bank’s regulations on Internal Control, Compliance & Internal Audit;
Oversaw the activities and assessed the performance of the Bank’s Group Compliance function and considered updates to relevant policies (including the Bank’s Group Compliance Policy) to ensure the robustness of the Bank's compliance framework taking into account the new UAE Central Bank Corporate Governance regulations;
Received regulatory, conduct compliance, fraud and operational risk management updates;
Reviewed the effectiveness of the Bank’s internal controls framework and ensured the existence of an effective system of internal controls taking note of the new UAE Central Bank regulations on Internal Control, Compliance & Internal Audit;
Reviewed the Bank’s quarterly and annual audited financial statements;
Reviewed and ensured appropriate action against audit and review observations raised by the internal and external auditors, the UAE Central Bank, the Abu Dhabi Accountability Authority and other regulators;
Reviewed the Committee’s terms of reference and the policies sponsored by the Committee, and ensured that new regulations were reflected in those terms of reference and policies, as appropriate;
Received and considered Internal Audit’s report for 2018;
Received and considered an external and independent quality assurance and assessment of the Bank’s Internal Audit function;
Rreceived detailed reports on certain non-performing loans and business segments and recommended suitable provisioning for those loans;
Reviewed quarterly reports on the Directors’ shareholdings in the Bank’s shares; and
Reported regularly to the Bank’s Board of Directors.
During 2019, the Committee continued to assess the Bank’s implementation of IFRS 9. The Committee regularly met with the Bank’s management and external auditors to ensure that the Bank’s models, methodologies, critical accounting judgements, and financial disclosures remained in compliance with IFRS 9 requirements, and to ensure that any subjective judgments had been made appropriately. We also considered the suitability of purchase price adjustments following the Bank’s merger with UNB and acquisition of Al Hilal Bank.
The Bank’s external auditor was due to be rotated in 2019. However, due to the complex accounting adjustments required by the merger, the Committee recommended that Deloitte continue as the Bank’s external auditor for the 2019 year. A new firm will be appointed for the 2020 financial year.
The Committee regularly met with the external and internal auditors without the presence of the Bank’s management to discuss issues arising. In addition, Committee members attended meetings of the Risk & Credit Committee to ensure an adequate flow of information between the two Committees.
We received confirmation from the Bank’s Internal Audit Group and external auditors that the Bank’s internal controls were assessed for effectiveness. The Committee ensured that the Bank’s internal audit plan in 2019 focused on providing assurance that, following the merger, the expanded Group’s internal controls remain robust.
The Committee considers that it made positive progress during 2019 towards meeting its responsibilities.
A D C B 2 0 1 9 A N N U A L R E P O R T
143
LOOKING INTO 2020Our schedule in 2020 contemplates nine meetings focused on a range of key issues. These include the integrity of the Bank’s financial statements, the Bank’s provisioning and ECL models (and their appropriateness following the merger), merger-related purchase price adjustments, assessment and oversight of the Group’s Internal Audit and Compliance functions’ activities and performance, and the performance of the Bank’s External auditors.
We will also oversee the adoption and implementation of new UAE Central Bank regulations and continue to work with management and external auditors to assess the effectiveness of the Bank’s IFRS 9-related policies, governance practices, models and controls — including oversight of staging of key accounts and overrides.
The Committee will continue to coordinate its activities with those of the Board Risk & Credit Committee to ensure a free-flow of information between the two Committees. We will recommend a new external auditor for the Board’s and the shareholders’ approval, in line with local and international best practices and regulatory requirements concerning external auditor rotation.
Finally, we will also continue to ensure that the Bank’s internal audit team continues to review the controls of the enlarged Group following the merger.
AYSHA AL HALLAMI
CHAIRLADY OF THE BOARD’S AUDIT & COMPLIANCE COMMITTEE
F U T U R E R E A D Y
144

Nomination, Compensation, HR and Governance Committee
Statement from the Chairman Composition as at 31 December 2019: Mohamed Dhaen Mahasoon Alhamli (Chairman), Eissa Mohamed Alsuwaidi, Mohamed Hamad Ghanem Almehairi, Saeed Mohamed Hamad Almazrouei, Hussain Jasim Naser Alnowais Secretary: Rami Raslan
OUR REMITThe Nomination, Compensation, HR and Governance Committee is responsible for:
Ensuring the appropriate composition and skillset of the Board and the Board Committees
Ensuring the appropriate diversity of the Board of Directors
Ensuring Independent Directors remain independent on a continuous basis
Selecting and appointing Directors Orienting and training new and existing Directors
Planning the succession of Board members and Senior Management
Selecting and appointing Senior Management
Assessing the performance of the Board, individual Directors and Senior Management and overseeing implementation of recommendations arising from the performance review
Developing, applying and reviewing human resources and training policies
31%COMPENSATION
10%NOMINATION
9%SUCCESSION PLANNING
16%HUMAN RESOURCES AND EMERGING UAE
NATIONAL TALENT
6%BOARD EVALUATION
AND TRAINING
4%CONFLICT OF INTEREST UPDATE
5%BEST PRACTICES DEVELOPMENTS
19%GOVERNANCE FRAMEWORK
REVIEW INCLUDING CULTURE AND SUSTAINABILITY
A D C B 2 0 1 9 A N N U A L R E P O R T
145
Dear Shareholders,
During 2019, the Nomination, Compensation & HR Committee merged with the Corporate Governance Committee to form the Nomination, Compensation, HR and Governance Committee. The Committee focuses on the Bank’s Human Resources and remuneration strategies, the Board’s composition and diversity, various governance and compliance matters, and — following the Bank’s merger with Union National Bank (UNB) and its acquisition of Al Hilal Bank (AHB) — post-merger integration matters.
The Committee met six times during 2019 and we:
Received regular updates from the Bank’s Human Resources team;
Considered an internal and external assessment of the Bank’s culture and values;
Considered a gap analysis of the Bank’s compliance with newly released corporate governance regulations issued by the UAE Central Bank;
Assessed the Board’s selection, appointment and induction processes;
Reviewed the Board’s composition, including its diversity and mix of skills, in relation to the UAE Central Bank’s regulations on corporate governance;
Evaluated the Directors’ remuneration and fees;
Evaluated the Directors’ contributions over the year;
Assessed Board members’ independence status as per the UAE Central Bank’s regulations on corporate governance and considered institutional investors’ views about the independence of the Bank’s Board members;
Considered the performance evaluation, key performance indicators, and remuneration of the Bank’s Group Chief Executive Officer;
Reviewed and supervised the operation of the Bank’s remuneration framework including its fixed and variable pay schemes, retention awards and performance recognition;
Considered the Bank’s remuneration plans and assessed the effectiveness of the Bank’s remuneration strategy following the merger;
Approved the compensation of Senior Management;
Reviewed the framework for, and operation of, the Bank’s incentive, commission and share schemes and considered a risk assessment of these schemes;
Considered the Bank’s disclosure and transparency practices in relation to the UAE Central Bank’s regulations on corporate governance;
Managed the Bank’s long-term succession strategy, assessed succession plans for key executives, and focused on talent management;
Remained focused on the Bank’s Emiratisation strategy and emerging UAE National talent. In particular, the Committee ensured that the Bank exceeded the target set by the Central Bank in this regard for the year 2019;
Considered and assessed the contributions of the Board Adviser to the Board’s activities;
Engaged the Bank’s divisions and various businesses on the governance framework and provided guidance on enhancing governance practices;
Assessed the Bank’s risk governance framework against the UAE Central Bank’s regulations on corporate governance and Basel guidelines;
Ensured the publishing of corporate governance information, including information included in the Bank’s Annual Report and on the Bank’s website;
Ensured adequate corporate governance disclosures were made across various disclosure channels;
Reviewed and considered enhancements and best practices in corporate governance and made recommendations to the Board and Board Committees on governance matters;
Assessed the Bank’s governance against the UAE Bank’s Federation (UBF) governance risk rating criteria;
Developing and overseeing implementation of the Group’s HR strategy (including Emiratisation)
Determining ADCB’s requirements for executive managers and employees
Considering remuneration policies for management and the Board, and the Bank’s remuneration and incentive plans
Reporting publicly on ADCB’s remuneration and governance matters
Implementing ADCB’s governance framework and ensuring it is maintained and complies with applicable governance regulations
Operating a framework that addresses conflict of interest and related parties transactions
Establishing and monitoring the Bank’s corporate culture and values, including its risk culture
Establishing the Bank’s corporate sustainability strategy
Ensuring compliance with regulatory requirements relating to corporate governance and the Bank’s Code of Corporate Governance
Developing corporate governance procedures and best practices within the Bank
F U T U R E R E A D Y
146
Finally, the Committee reviewed the overall culture of the Bank. The Committee was pleased to note that based on a survey conducted by external consultants, the Bank ranks in the top decile globally for organisational health.
The Committee considers that it made positive progress during 2019 towards meeting its responsibilities.
LOOKING INTO 2020In 2020 we will continue to focus on the Bank’s Emiratisation strategy and HR activities. We will also review the Bank’s culture, and oversee efforts to ensure that culture is fully integrated following the merger. We will also focus on succession planning, particularly at a senior level, as well as talent acquisition and staff training.
During 2020, following the enlargement of the Group in 2019, we will also focus on subsidiary governance, with the aim of ensuring that a framework is in place which is suitable for the enlarged Group.
The Committee will continue to consider Board Committees’ memberships, the design of incentive and compensation schemes, and the Bank’s diversity policies. It will engage an independent review of the Bank’s remuneration framework in accordance with the UAE Central Bank’s regulations on corporate governance and will ensure that the Bank’s governance policies and processes are brought into full compliance with those regulations.
MOHAMED DHAEN MAHASOON ALHAMLI
CHAIRMAN OF THE BOARD’S NOMINATION, COMPENSATION & HR COMMITTEE
Reviewed the Bank’s key Human Resources and Corporate Governance policies and processes including, amongst others, the Bank’s ethics and compliance policy, privacy and data security policy and sustainability policy.
During 2019, the Bank’s remuneration schemes, and Emiratisation strategy remained key focus areas for the Committee.
We continued to develop KPIs to assess the effectiveness of the Bank’s variable remuneration schemes and noted that these schemes continue to deliver the desired objectives. We also considered the post-merger alignment of the Bank’s remuneration framework with those of UNB and AHB. We continue to believe that the Bank’s remuneration policies remain appropriate for the Bank’s current size and status and that its remuneration framework is in line with international best practices. In addition, in accordance with best practices and the requirements of the UAE Central Bank’s regulations on corporate governance, the Nomination, Compensation, HR & Governance Committee will seek an independent review of the design and effectiveness of the Bank’s variable pay framework early in 2020.
The Committee also continued to prioritise UAE National development, focusing on the recruitment, retention and training of talented UAE National staff. With regard to corporate governance, the Committee continued to monitor international best practices for governance and benchmark the Bank against these. We considered a gap analysis of the Bank’s compliance with the UAE Central Bank’s regulations on corporate governance, and were pleased to note that the Bank has already implemented into its corporate governance framework many of the UAE Central Bank’s regulations on corporate governance. We also considered compliance plans submitted to the Central Bank to further implement the UAE Central Bank’s regulations on corporate governance.
A D C B 2 0 1 9 A N N U A L R E P O R T
147
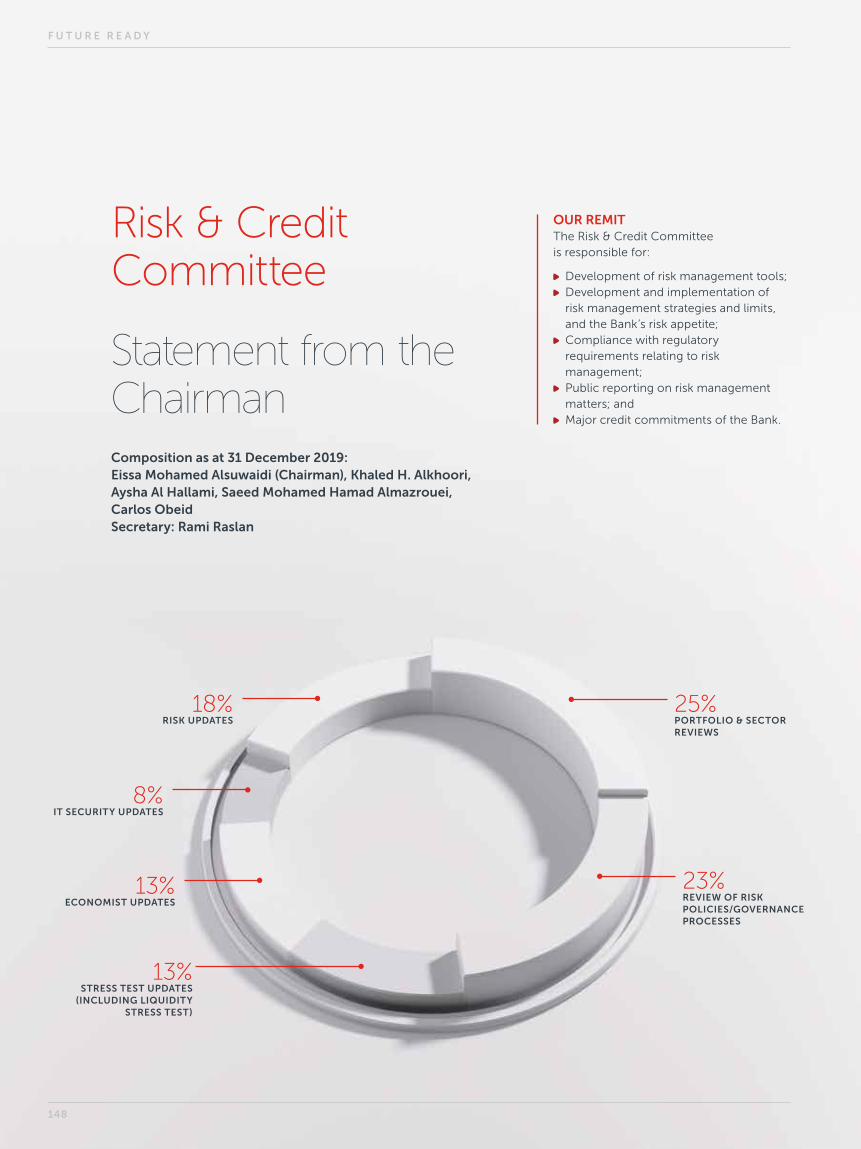
Risk & Credit Committee
Statement from the ChairmanComposition as at 31 December 2019: Eissa Mohamed Alsuwaidi (Chairman), Khaled H. Alkhoori, Aysha Al Hallami, Saeed Mohamed Hamad Almazrouei, Carlos Obeid Secretary: Rami Raslan
OUR REMITThe Risk & Credit Committee is responsible for:
Development of risk management tools; Development and implementation of risk management strategies and limits, and the Bank’s risk appetite;
Compliance with regulatory requirements relating to risk management;
Public reporting on risk management matters; and
Major credit commitments of the Bank.
25%PORTFOLIO & SECTOR REVIEWS
23%REVIEW OF RISK POLICIES/ GOVERNANCE PROCESSES
18%RISK UPDATES
8%IT SECURITY UPDATES
13%ECONOMIST UPDATES
13%STRESS TEST UPDATES
(INCLUDING LIQUIDITY STRESS TEST)
F U T U R E R E A D Y
148
Dear Shareholders,
During 2019, the Risk & Credit Committee held seven meetings focused on risk and 23 meetings focused on credit, during which the Committee:
Assisted the Board in defining the Bank’s risk appetite and risk strategy and ensured that the Bank’s risk exposures conform to the risk appetite approved by the Board;
Considered risks assumed as a result of the merger with UNB and acquisition of Al Hilal Bank and how to align these with the Bank’s risk appetite;
Reviewed the Bank’s key risk limits and exposures (including combined limits and exposures resulting from the merger with UNB and acquisition of Al Hilal Bank) including liquidity, credit, market, and operational risk limits and exposures, and ensured that these were managed within the Bank’s risk framework and in compliance with UAE Central Bank’s regulations;
Considered the Bank’s concentrations and sectoral credit exposures, and ensured that the Bank’s overall concentration and sectoral credit exposures were in line with UAE Central Bank’s regulations;
Reviewed the effectiveness of the Bank’s market risk framework and related policies, including the Bank’s interest rate risk in banking book (IRRBB) policy;
Reviewed the Bank’s Investment and Liquidity portfolio;
Reviewed the Bank’s Operational Risk framework and associated policies;
Received an update on fraud committed against the Bank and associated policies;
Reviewed management decisions on credit exposures;
Received and considered updates from the Bank’s Chief Credit Officer on the Bank’s credit exposures;
Reviewed and discussed the Bank’s IFRS 9 governance policies and processes (before and following the merger with UNB and acquisition of Al Hilal Bank) to ensure that these remain prudent and in line with the UAE Central Bank’s requirements and to ensure that any subjective judgments are made appropriately;
Reviewed the Bank’s IT, physical security and cyber risks and ensured that the Bank had implemented a proactive approach towards managing these risks;
Kept abreast of UAE’s micro and macro-economic developments and analysed related geographic and geopolitical risks;
Monitored the effectiveness of the Bank’s risk management functions;
Reviewed the Bank’s vendor management practices;
Considered the outcome of stress tests and reverse stress tests conducted on various key portfolios both before and after the merger with UNB and acquisition of Al Hilal Bank, and ensured that the outcomes of such tests were reflected in the Bank’s risk appetite, capital adequacy assessments, budgets and capital and liquidity plans. The Committee also considered the UAE Central Bank’s feedback on the Bank’s stress testing methodology;
Considered the Bank’s enterprise-wide liquidity stress testing results;
Reviewed the Bank’s business continuity plan and received an independent third party assessment on its adequacy; and
Approved and oversaw the implementation or updating of key policies, including, but not limited to, the internal capital adequacy assessment policy (ICAAP) and operational risk policy, whilst ensuring that new regulations were reflected as appropriate.
During 2019, the Committee continued to focus on the Bank’s adherence to its risk appetite and strategy. In particular, the Committee reviewed the Bank’s risk appetite metrics in light of changing market conditions, regulatory requirements and the nature, size and complexity of the Group after the merger.
We regularly received updates on business sectors (including hospitality, real estate, construction and retail) and the Bank’s portfolios (including retail, commercial, mid-corporate and financial institutions) to maintain awareness of the business environment.
Along with the Board’s Audit and Compliance Committee, we oversaw the Bank’s ongoing application of IFRS 9. In particular, we assessed the Bank’s IFRS 9 expected credit loss (ECL) estimates and the reporting process and staging of its most significant accounts before and after the merger to ensure adherence to the Bank’s IFRS 9 models.
The Committee also continued to focus on ensuring that the UAE Central Bank’s requirements on stress testing were met. In collaboration with the Bank’s management, we ensured that the Bank’s stress testing methodologies and models were reviewed and remained adequate following the merger.
The Committee considers that it made positive progress during 2019 towards meeting its responsibilities.
A D C B 2 0 1 9 A N N U A L R E P O R T
149
LOOKING INTO 2020Our schedule in 2020 contemplates seven meetings focused on the Bank’s risk strategy, appetite, and stress testing. Separately, the Committee will continue to meet to consider high value or sensitive credit decisions.
In compliance with recent UAE Central Bank’s regulations on corporate governance, the Committee will assess the performance of the Bank’s compliance function together with the Board Audit and Compliance Committee. We will also continue to ensure that effective communication between the two committees is facilitated to manage risk.
We will continue to assess the effectiveness and suitability of the Bank’s IFRS 9 policies and governance. We will also continue to dynamically review the appropriateness of the Bank’s risk strategy and limits, considering the nature, size, and complexity of the Group’s business following the merger. Finally, we will bring all of the Bank’s risk governance policies, procedures, practices and documents into a centralised Group-wide risk governance framework.
EISSA MOHAMED ALSUWAIDI
CHAIRMAN OF THE BOARD’S RISK & CREDIT COMMITTEE
GOVERNANCE DOCUMENTS AVAILABLE ON OUR WEBSITE
Articles of Association Code of Corporate Governance Codes of Conduct for our employees and our Directors External Auditor’s Appointment Policy Board Performance Evaluation Policy Procedures for selecting and appointing the Bank’s Directors Conflicts of Interest Policy for Directors Directors’ Share Dealing Policy Committee terms of reference
OUR WEBSITE ALSO CONTAINS INFORMATION ABOUT THE FOLLOWING SUBJECTS:
Our disclosure standards, communications with shareholders, and investor relations
Our strategy-setting process The structure and composition of our Board Board oversight of risk management Our process for inducting new Directors and ensuring the professional development of all Board members
Matters reserved for the Board How we ensure Board members are updated about important developments
Retirement and re-election of Directors Remuneration of Directors for service on the Board and Board Committees
The Board’s Adviser Directors’ independence Role of the Board Secretary Management Committees Internal controls Audit arrangements Internal audits, regulation and supervision Diversity Succession planning Codes, standards and communications Our Variable Pay Framework
F U T U R E R E A D Y
150
Pro Forma consolidated financial statement
F U T U R E R E A D Y
ABU DHABI COMMERCIAL BANK PJSCPRO FORMA CONSOLIDATED FINANCIAL INFORMATION
The following pro forma consolidated financial informa-
tion and related notes (‘‘pro forma financial information’’)
illustrates the effects on the statement of financial posi-
tion of the combination (merger) between Abu Dhabi
Commercial Bank PJSC and its subsidiaries (together
referred to as ‘‘ADCB’’) and Union National Bank PJSC
and its subsidiaries (together referred to as ‘‘UNB’’)
along with the subsequent acquisition of Al Hilal Bank
PJSC and its subsidiaries (together referred to as ‘‘AHB’’).
Further, ADCB, UNB and AHB are together referred to as
the “Group”.
The pro forma financial information consists of the
unaudited pro forma consolidated income statement for
the year ended December 31, 2019 and December 31,
2018 which give effect to the merger and acquisition as
if it had occurred on January 1, 2018, the unaudited pro
forma consolidated statement of financial position as
at December 31, 2018 which give effect to the merger
and acquisition as if it had occurred on December 31,
2018 and the audited consolidated statement of financial
position as at December 31, 2019.
The purpose of the pro forma financial information is to
illustrate the material effects that ADCB and UNB merger
with subsequent acquisition of AHB would have had on
the historical consolidated statement of financial position
and on the historical consolidated income statement.
They are not representative of the financial situation
and performance that could have been observed if the
indicated business combination had been undertaken at
an earlier date.
The presentation of the pro forma financial information
of the Group is based on certain pro forma assumptions
and has been prepared for illustrative purposes only
and, because of its nature, the pro forma consolidated
statement of financial position and consolidated income
statement addresses a hypothetical situation and, there-
fore may not give a true picture of the financial position of
the Group. Furthermore, the pro forma financial informa-
tion is only meaningful in conjunction with the historical
consolidated financial statements of ADCB, UNB and
AHB for the financial year ended December 31, 2018 and
consolidated financial statements of the Group for the
year ended December 31, 2019.
The pro forma financial information has been prepared
based on figures extracted from the audited consolidated
financial statements for the year ended December 31,
2019 and December 31, 2018 of ADCB, UNB and AHB,
all prepared in line with International Financial Reporting
Standards.
The pro forma financial information has been compiled
based on the accounting policies of ADCB, being the
accounting acquirer, as disclosed in its consolidated finan-
cial statements for the year ended December 31, 2019.
Under IFRS 3 Business Combinations, ADCB has been
identified as the acquirer and the Group has adopted
the acquisition method of accounting for the merger
and acquisition and is required to fair value the assets,
liabilities and contingent liabilities acquired at the date
of acquisition and to reflect the difference between their
fair value and the purchase consideration as goodwill or
gain on acquisition. The fair value exercise (‘‘purchase
price allocation’’) is not completed as at the date of
this document.
Under the terms of the merger, ADCB issued 0.5966
ADCB shares for every UNB share, corresponding to a
total of 1,641,501,087 new shares issued to UNB share-
holders. Based on ADCB’s closing share price of AED 9.88
on April 30, 2019, this translates to a consideration of AED
16,218 million.
AHB was acquired by the combined entity (ADCB and
UNB) for a consideration of AED 1,000 million by issuing
mandatory convertible bond which was converted to
117,647,058 post- merger ADCB shares.
The Group is in the process of undertaking compre-
hensive purchase price allocation which is expected to
complete within twelve months from the date of business
combinations and may result in different values being
attributed to the assets, liabilities and contingent liabilities
acquired than those that are shown in the pro forma
financial information that may or may not result in signif-
icant variances.
152
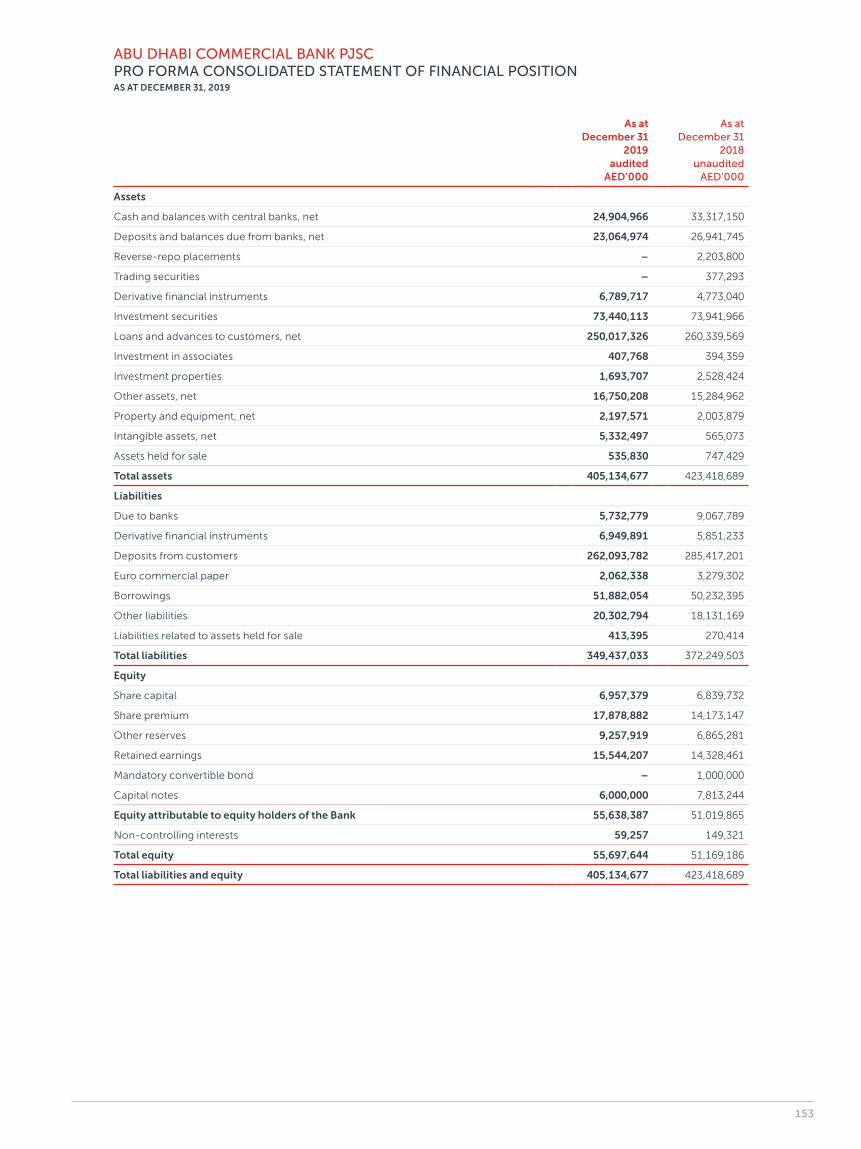
As at December 31
2019 audited
AED’000
As at December 31
2018 unaudited
AED’000
Assets
Cash and balances with central banks, net 24,904,966 33,317,150
Deposits and balances due from banks, net 23,064,974 26,941,745
Reverse-repo placements – 2,203,800
Trading securities – 377,293
Derivative financial instruments 6,789,717 4,773,040
Investment securities 73,440,113 73,941,966
Loans and advances to customers, net 250,017,326 260,339,569
Investment in associates 407,768 394,359
Investment properties 1,693,707 2,528,424
Other assets, net 16,750,208 15,284,962
Property and equipment, net 2,197,571 2,003,879
Intangible assets, net 5,332,497 565,073
Assets held for sale 535,830 747,429
Total assets 405,134,677 423,418,689
Liabilities
Due to banks 5,732,779 9,067,789
Derivative financial instruments 6,949,891 5,851,233
Deposits from customers 262,093,782 285,417,201
Euro commercial paper 2,062,338 3,279,302
Borrowings 51,882,054 50,232,395
Other liabilities 20,302,794 18,131,169
Liabilities related to assets held for sale 413,395 270,414
Total liabilities 349,437,033 372,249,503
Equity
Share capital 6,957,379 6,839,732
Share premium 17,878,882 14,173,147
Other reserves 9,257,919 6,865,281
Retained earnings 15,544,207 14,328,461
Mandatory convertible bond – 1,000,000
Capital notes 6,000,000 7,813,244
Equity attributable to equity holders of the Bank 55,638,387 51,019,865
Non- controlling interests 59,257 149,321
Total equity 55,697,644 51,169,186
Total liabilities and equity 405,134,677 423,418,689
ABU DHABI COMMERCIAL BANK PJSCPRO FORMA CONSOLIDATED STATEMENT OF FINANCIAL POSITIONAS AT DECEMBER 31, 2019
153
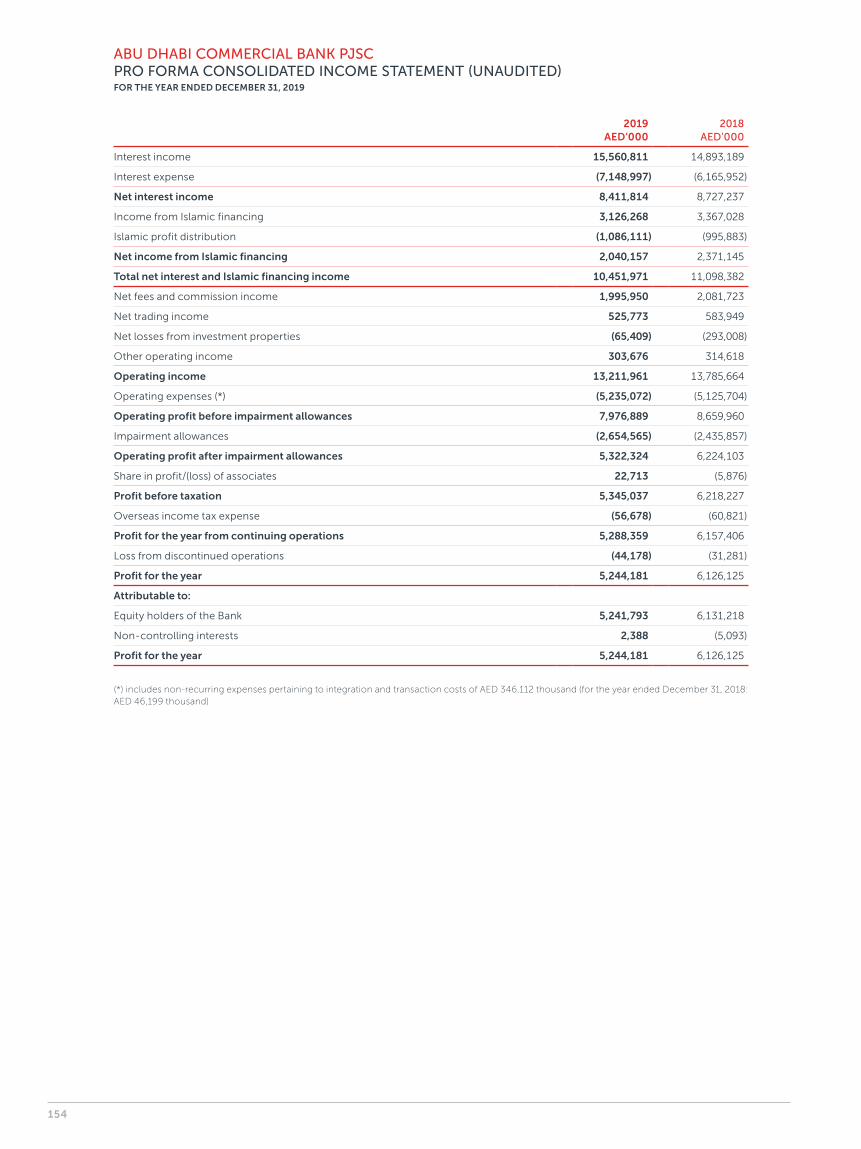
2019 AED’000
2018 AED’000
Interest income 15,560,811 14,893,189
Interest expense (7,148,997) (6,165,952)
Net interest income 8,411,814 8,727,237
Income from Islamic financing 3,126,268 3,367,028
Islamic profit distribution (1,086,111) (995,883)
Net income from Islamic financing 2,040,157 2,371,145
Total net interest and Islamic financing income 10,451,971 11,098,382
Net fees and commission income 1,995,950 2,081,723
Net trading income 525,773 583,949
Net losses from investment properties (65,409) (293,008)
Other operating income 303,676 314,618
Operating income 13,211,961 13,785,664
Operating expenses (*) (5,235,072) (5,125,704)
Operating profit before impairment allowances 7,976,889 8,659,960
Impairment allowances (2,654,565) (2,435,857)
Operating profit after impairment allowances 5,322,324 6,224,103
Share in profit/(loss) of associates 22,713 (5,876)
Profit before taxation 5,345,037 6,218,227
Overseas income tax expense (56,678) (60,821)
Profit for the year from continuing operations 5,288,359 6,157,406
Loss from discontinued operations (44,178) (31,281)
Profit for the year 5,244,181 6,126,125
Attributable to:
Equity holders of the Bank 5,241,793 6,131,218
Non- controlling interests 2,388 (5,093)
Profit for the year 5,244,181 6,126,125
(*) includes non- recurring expenses pertaining to integration and transaction costs of AED 346,112 thousand (for the year ended December 31, 2018: AED 46,199 thousand)
ABU DHABI COMMERCIAL BANK PJSCPRO FORMA CONSOLIDATED INCOME STATEMENT (UNAUDITED)FOR THE YEAR ENDED DECEMBER 31, 2019
154
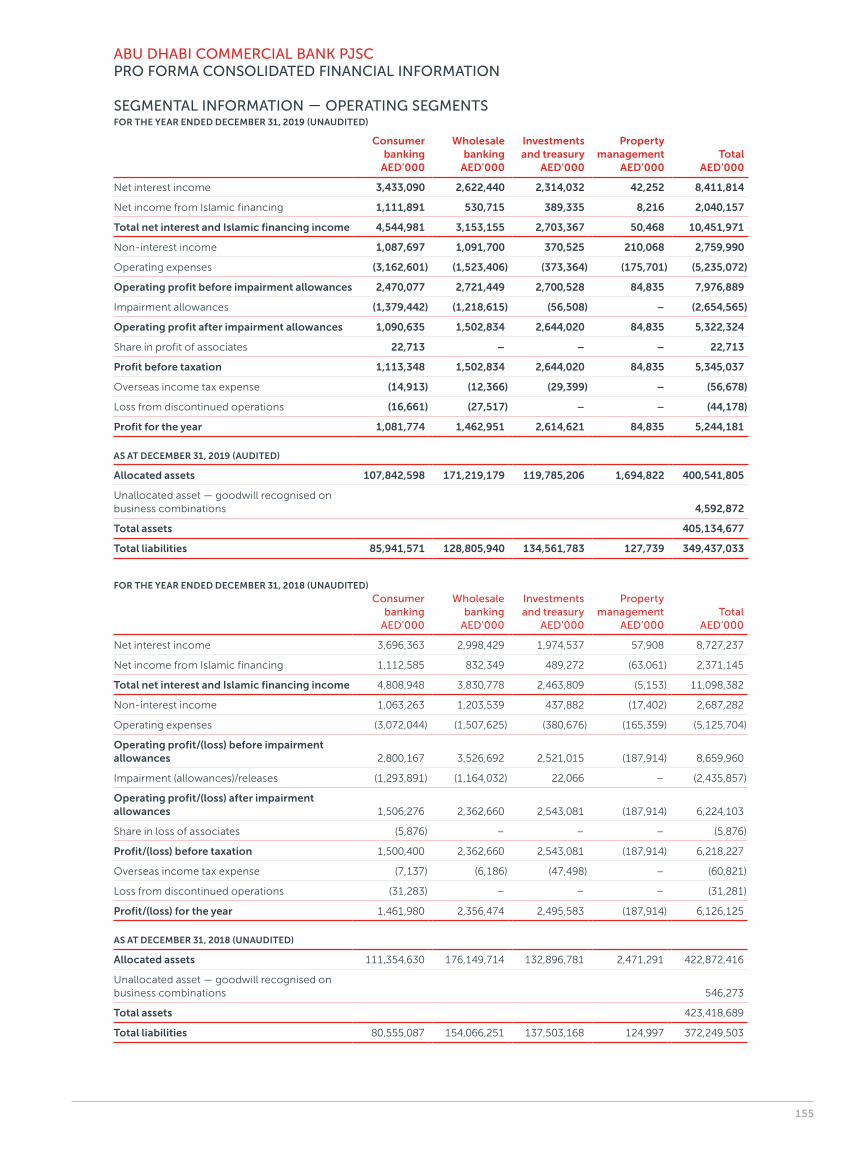
Consumer banking
AED’000
Wholesale banking
AED’000
Investments and treasury
AED’000
Property management
AED’000Total
AED’000
Net interest income 3,433,090 2,622,440 2,314,032 42,252 8,411,814
Net income from Islamic financing 1,111,891 530,715 389,335 8,216 2,040,157
Total net interest and Islamic financing income 4,544,981 3,153,155 2,703,367 50,468 10,451,971
Non- interest income 1,087,697 1,091,700 370,525 210,068 2,759,990
Operating expenses (3,162,601) (1,523,406) (373,364) (175,701) (5,235,072)
Operating profit before impairment allowances 2,470,077 2,721,449 2,700,528 84,835 7,976,889
Impairment allowances (1,379,442) (1,218,615) (56,508) – (2,654,565)
Operating profit after impairment allowances 1,090,635 1,502,834 2,644,020 84,835 5,322,324
Share in profit of associates 22,713 – – – 22,713
Profit before taxation 1,113,348 1,502,834 2,644,020 84,835 5,345,037
Overseas income tax expense (14,913) (12,366) (29,399) – (56,678)
Loss from discontinued operations (16,661) (27,517) – – (44,178)
Profit for the year 1,081,774 1,462,951 2,614,621 84,835 5,244,181
AS AT DECEMBER 31, 2019 (AUDITED)
Allocated assets 107,842,598 171,219,179 119,785,206 1,694,822 400,541,805
Unallocated asset — goodwill recognised on business combinations 4,592,872
Total assets 405,134,677
Total liabilities 85,941,571 128,805,940 134,561,783 127,739 349,437,033
FOR THE YEAR ENDED DECEMBER 31, 2018 (UNAUDITED)
Consumer banking
AED’000
Wholesale banking
AED’000
Investments and treasury
AED’000
Property management
AED’000Total
AED’000
Net interest income 3,696,363 2,998,429 1,974,537 57,908 8,727,237
Net income from Islamic financing 1,112,585 832,349 489,272 (63,061) 2,371,145
Total net interest and Islamic financing income 4,808,948 3,830,778 2,463,809 (5,153) 11,098,382
Non- interest income 1,063,263 1,203,539 437,882 (17,402) 2,687,282
Operating expenses (3,072,044) (1,507,625) (380,676) (165,359) (5,125,704)
Operating profit/(loss) before impairment allowances 2,800,167 3,526,692 2,521,015 (187,914) 8,659,960
Impairment (allowances)/releases (1,293,891) (1,164,032) 22,066 – (2,435,857)
Operating profit/(loss) after impairment allowances 1,506,276 2,362,660 2,543,081 (187,914) 6,224,103
Share in loss of associates (5,876) – – – (5,876)
Profit/(loss) before taxation 1,500,400 2,362,660 2,543,081 (187,914) 6,218,227
Overseas income tax expense (7,137) (6,186) (47,498) – (60,821)
Loss from discontinued operations (31,283) – – – (31,281)
Profit/(loss) for the year 1,461,980 2,356,474 2,495,583 (187,914) 6,126,125
AS AT DECEMBER 31, 2018 (UNAUDITED)
Allocated assets 111,354,630 176,149,714 132,896,781 2,471,291 422,872,416
Unallocated asset — goodwill recognised on business combinations 546,273
Total assets 423,418,689
Total liabilities 80,555,087 154,066,251 137,503,168 124,997 372,249,503
ABU DHABI COMMERCIAL BANK PJSCPRO FORMA CONSOLIDATED FINANCIAL INFORMATION
SEGMENTAL INFORMATION — OPERATING SEGMENTSFOR THE YEAR ENDED DECEMBER 31, 2019 (UNAUDITED)
155
Consolidatedfinancialstatements
F U T U R E R E A D Y
TABLE OF CONTENTS
INDEPENDENT AUDITOR’S REPORT 158
CONSOLIDATED STATEMENT OF FINANCIAL POSITION 164
CONSOLIDATED INCOME STATEMENT 165
CONSOLIDATED STATEMENT OF COMPREHENSIVE INCOME 166
CONSOLIDATED STATEMENT OF CHANGES IN EQUITY 167
CONSOLIDATED STATEMENT OF CASH FLOWS 168
NOTES TO THE CONSOLIDATED FINANCIAL STATEMENTS
1. General information 169
2. Application of new and revised International Financial Reporting Standards (IFRSs) 169
3. Summary of significant accounting policies 171
3.1 Basis of preparation 171
3.2 Measurement 171
3.3 Functional and presentation currency 171
3.4 Use of estimates and judgements 171
3.5 Basis of consolidation 171
3.6 Business combination under common control 173
3.7 Change in accounting policy 174
3.8 Financial instruments 176
3.9 Foreign currencies 182
3.10 Offsetting 182
3.11 Sale and repurchase agreements 182
3.12 Securities borrowing and lending 182
3.13 Cash and cash equivalents 182
3.14 Amortised cost measurement 183
3.15 Fair value measurement 183
3.16 Derivatives 183
3.17 Hedge accounting 184
3.18 Treasury shares and contracts on own shares 185
3.19 Financial guarantees 185
3.20 Acceptances 185
3.21 Collateral repossessed 185
3.22 Investment properties 185
3.23 Property and equipment 186
3.24 Capital work in progress 186
3.25 Intangible assets 186
3.26 Borrowing costs 186
3.27 Impairment of non- financial assets 186
3.28 Employee benefits 187
3.29 Provisions and contingent liabilities 188
3.30 Segment reporting 188
3.31 Taxation 188
3.32 Revenue and expense recognition 188
3.33 Islamic financing 189
4. Critical accounting judgements and key sources of estimation uncertainty 190
4.1 Critical judgements in applying the changes in Group’s accounting policies 190
4.3 Key sources of estimation uncertainty 192
5. Cash and balances with central banks, net 193
6. Deposits and balances due from banks, net 193
7. Reverse-repo placements 194
8. Derivative financial instruments 194
9. Investment securities 197
10. Loans and advances to customers, net 199
11. Investment in associates 199
12. Investment properties 200
13. Other assets, net 200
14. Property and equipment, net 201
15. Intangible assets, net 202
16. Due to banks 203
17. Deposits from customers 203
18. Euro commercial paper 204
19. Borrowings 204
20. Other liabilities 207
21. Share capital 208
22. Other reserves 209
23. Islamic financing 211
24. Employees’ incentive plan shares, net 211
25. Capital notes 212
26. Interest income 212
27. Interest expense 212
28. Net fees and commission income 212
29. Net trading income 212
30. Other operating income 213
31. Operating expenses 213
32. Impairment allowances 213
33. Earnings per share 213
34. Discontinued operations 214
35. Cash and cash equivalents 214
36. Related party transactions 214
37. Commitments and contingent liabilities 216
38. Operating segments 217
39. Financial instruments 220
40. Fair value hierarchy 221
41. Risk Management 223
42. Credit Risk Management 224
42.1 Maximum exposure to credit risk 230
42.2 Gross exposure 231
42.3 Expected credit losses 234
42.4 Concentration of credit risk 238
42.5 Credit risk measurement and mitigation policies 241
43. Interest rate risk framework, measurement and monitoring 242
44. Liquidity risk framework, measurement and monitoring 245
45. Market risk framework, measurement and management 250
46. Operational risk management 252
47. Trust activities 253
48. Subsidiaries 254
49. Capital adequacy ratio and capital management 255
50. Social contributions 258
51. Legal proceedings 258
52. Business combinations 258
157
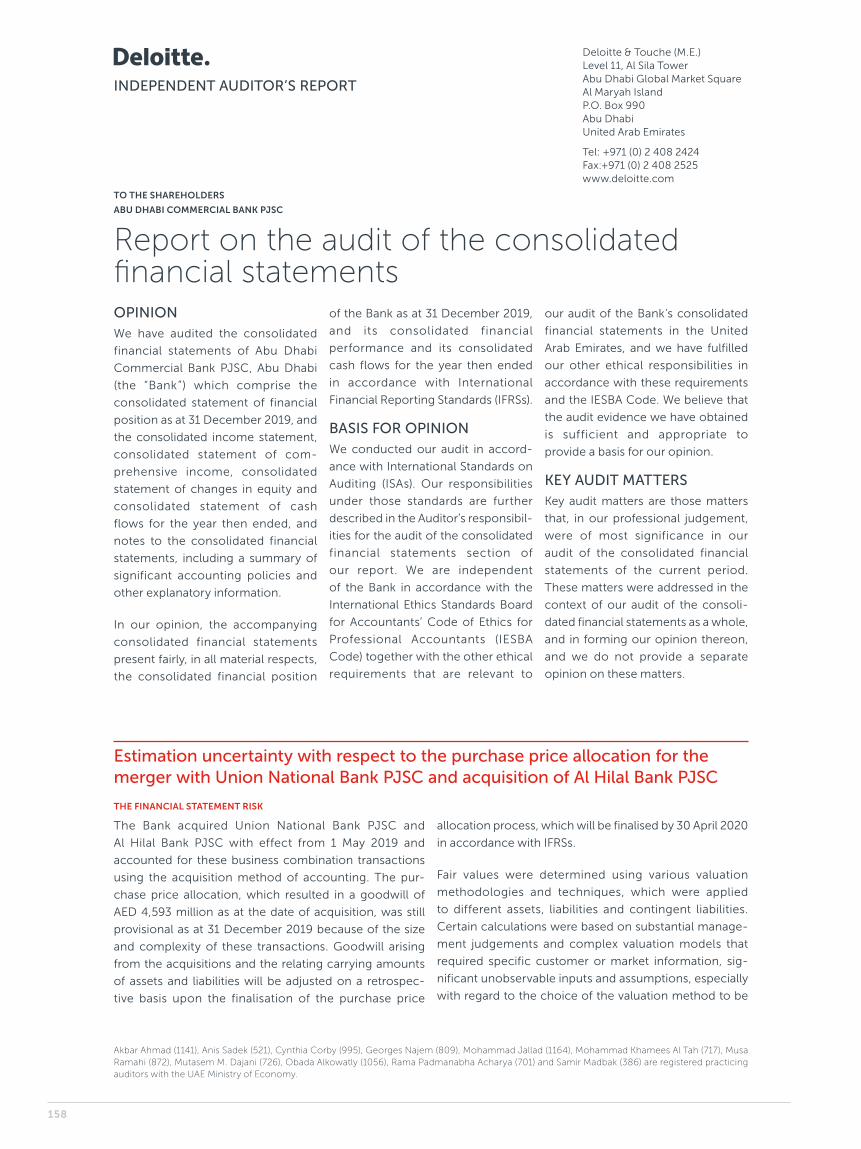
INDEPENDENT AUDITOR’S REPORT
TO THE SHAREHOLDERS
ABU DHABI COMMERCIAL BANK PJSC
Report on the audit of the consolidated financial statementsOPINIONWe have audited the consolidated
financial statements of Abu Dhabi
Commercial Bank PJSC, Abu Dhabi
(the “Bank”) which comprise the
consolidated statement of financial
position as at 31 December 2019, and
the consolidated income statement,
consolidated statement of com-
prehensive income, consolidated
statement of changes in equity and
consolidated statement of cash
flows for the year then ended, and
notes to the consolidated financial
statements, including a summary of
significant accounting policies and
other explanatory information.
In our opinion, the accompanying
consolidated financial statements
present fairly, in all material respects,
the consolidated financial position
of the Bank as at 31 December 2019,
and its consolidated financial
performance and its consolidated
cash flows for the year then ended
in accordance with International
Financial Reporting Standards (IFRSs).
BASIS FOR OPINIONWe conducted our audit in accord-
ance with International Standards on
Auditing (ISAs). Our responsibilities
under those standards are further
described in the Auditor’s responsibil-
ities for the audit of the consolidated
financial statements section of
our report. We are independent
of the Bank in accordance with the
International Ethics Standards Board
for Accountants’ Code of Ethics for
Professional Accountants (IESBA
Code) together with the other ethical
requirements that are relevant to
our audit of the Bank’s consolidated
financial statements in the United
Arab Emirates, and we have fulfilled
our other ethical responsibilities in
accordance with these requirements
and the IESBA Code. We believe that
the audit evidence we have obtained
is sufficient and appropriate to
provide a basis for our opinion.
KEY AUDIT MATTERSKey audit matters are those matters
that, in our professional judgement,
were of most significance in our
audit of the consolidated financial
statements of the current period.
These matters were addressed in the
context of our audit of the consoli-
dated financial statements as a whole,
and in forming our opinion thereon,
and we do not provide a separate
opinion on these matters.
Estimation uncertainty with respect to the purchase price allocation for the merger with Union National Bank PJSC and acquisition of Al Hilal Bank PJSC
THE FINANCIAL STATEMENT RISK
The Bank acquired Union National Bank PJSC and
Al Hilal Bank PJSC with effect from 1 May 2019 and
accounted for these business combination transactions
using the acquisition method of accounting. The pur-
chase price allocation, which resulted in a goodwill of
AED 4,593 million as at the date of acquisition, was still
provisional as at 31 December 2019 because of the size
and complexity of these transactions. Goodwill arising
from the acquisitions and the relating carrying amounts
of assets and liabilities will be adjusted on a retrospec-
tive basis upon the finalisation of the purchase price
allocation process, which will be finalised by 30 April 2020
in accordance with IFRSs.
Fair values were determined using various valuation
methodologies and techniques, which were applied
to different assets, liabilities and contingent liabilities.
Certain calculations were based on substantial manage-
ment judgements and complex valuation models that
required specific customer or market information, sig-
nificant unobservable inputs and assumptions, especially
with regard to the choice of the valuation method to be
Deloitte & Touche (M.E.)Level 11, Al Sila TowerAbu Dhabi Global Market SquareAl Maryah IslandP.O. Box 990Abu DhabiUnited Arab Emirates
Tel: +971 (0) 2 408 2424Fax:+971 (0) 2 408 2525www.deloitte.com
Akbar Ahmad (1141), Anis Sadek (521), Cynthia Corby (995), Georges Najem (809), Mohammad Jallad (1164), Mohammad Khamees Al Tah (717), Musa Ramahi (872), Mutasem M. Dajani (726), Obada Alkowatly (1056), Rama Padmanabha Acharya (701) and Samir Madbak (386) are registered practicing auditors with the UAE Ministry of Economy.
158
used and the inputs to be considered, which depend on
current market environments and estimates over future
developments. The Bank prepared its own assessments
and, for certain assets, used external appraisals to deter-
mine the fair values of assets and liabilities acquired.
We considered this as a key audit matter because of the
quantitative materiality of the transactions and the signif-
icant judgements and estimates made by management in
determining the fair values of acquired assets and liabili-
ties. Auditing these complex judgements and assumptions
involves, inter alia, challenging auditor judgements and
utilising our internal fair value specialists to assess the fair
value of different types of assets, due to the nature and
extent of audit evidence and effort required to address
these matters.
For further information on this key audit matter refer
to Note 3.6, 15 and 52 to the consolidated financial
statements.
HOW THE MATTER WAS ADDRESSED IN THE AUDIT
We performed the following procedures on the prelimi-
nary purchase price allocation, which included, but was
not limited, to the following:
• We assessed the design and implementation of controls
over the transaction;
• We considered whether the transaction falls within the
scope of IFRS 3 Business Combinations by assessing
whether the assets acquired and liabilities assumed
constitute a business and whether the transaction
should be accounted for by applying the acquisi-
tion method;
• We verified that the results of the operations of the
entities acquired were included in the consolidated
financial statements of the Bank from the date of acqui-
sition, as defined by IFRS 3;
• We evaluated the approach and key assumptions
used in the Bank’s fair value adjustments relative to
the acquired portfolio of financial assets at amortised
cost, in particular loans and advances to customers,
and challenged management’s judgements on specific
customer or market related factors, such as expected
default rates;
• We evaluated the accounting policy adopted by
management for the identification of purchased or
originated credit impaired financial assets (POCI) and
assessed the adequacy of the recognition, presentation
and measurement policy for these assets;
• We evaluated the identification and valuation of
intangible assets based on our understanding of the
businesses of the acquired entities, and discussed with
the Bank the business rationale for the acquisitions and
the Bank’s external appraiser’s valuation results;
• We engaged our internal valuation specialists to
perform an assessment of the identified intangible
assets and the determination of their respective fair
values and useful lives;
• We assessed the competence, objectivity and capa-
bilities of the external appraisers for the valuation of
investment properties and owner- occupied properties
engaged by the Bank and, for a sample of properties,
engaged our internal specialists in assessing the valua-
tion methodologies and reasonableness of underlying
assumptions; and
• We assessed the disclosures included in Note 52 against
the relevant IFRS disclosure requirements.
INDEPENDENT AUDITOR’S REPORT
159
Estimation uncertainty with respect to expected credit losses for loans and advances to customers
THE FINANCIAL STATEMENT RISK
As described in Notes 10 and 42 to the consolidated
financial statements, the Bank had loans and advances
of AED 250 billion as at 31 December 2019 representing
61.7% of total assets. The determination of the Bank’s
expected credit losses for loans and advances to cus-
tomers measured at amortised cost is considered a key
audit matter given the magnitude of the account balance
and as it is a material and complex estimate requiring
significant management judgement in the evaluation of
the credit quality and the estimation of inherent losses in
the portfolio.
The financial statement risk arises from several aspects
requiring substantial judgement of management, such
as the estimation of expected future cash flows, the
determination of significant increases in credit risk (SICR)
and credit- impairment status (default), the use of differ-
ent modelling techniques and assumptions as well as
consideration of post model adjustments. In calculating
expected credit losses, the Bank considered credit quality
indicators for each loan and portfolios, stratifies loans
and advances by risk grades and estimates losses for each
loan based upon their nature and risk profile.
For further information on the accounting policies relat-
ing to impairment of loans and advances as well as the
Bank’s management of credit risk refer to Note 3.8 and
Note 42 to the consolidated financial statements.
HOW THE MATTER WAS ADDRESSED IN THE AUDIT
We established an audit approach which includes both
testing the design and operating effectiveness of internal
controls over the determination of expected credit losses
and risk-based substantive audit procedures. Our proce-
dures over internal controls focused on the governance
over the process controls around the ECL methodology,
completeness and accuracy of loan data used in the
expected loss models, management review of outcomes,
management validation and approval processes, the
assignment of borrowers’ risk classification, consistency
of application of accounting policies and the process for
calculating individual allowances.
The primary substantive procedures which we performed
to address this key audit matter included, but were not
limited to, the following:
• For a risk-based sample of individually assessed loans,
we performed a credit review, assessed the appropriate-
ness of information for evaluating the credit- worthiness
and staging classification of individual borrowers and
challenged the assumptions underlying the expected
credit loss allowance calculations, such as estimated
future cash flows, collateral valuations and estimates of
recovery as well as considered the consistency of the
Bank’s application of its impairment policy. Further, we
evaluated controls over approval, accuracy and com-
pleteness of impairment allowances and governance
controls, including assessing key management and
committee meetings that form part of the approval
process for loan impairment allowances;
• For loans tested collectively, we evaluated controls over
the modelling process, including model monitoring,
model outputs, and approval. With the involvement of
our modelling specialists, we tested the mathematical
accuracy and computation of the expected credit
losses by re- performing or independently calculating
elements of the expected credit losses based on rel-
evant source data and methodology documents. We
challenged key assumptions and the expected credit
loss policy. We evaluated key assumptions such as the
thresholds used to determine SICR and forward looking
and macroeconomic information and the weighting of
each economic scenario;
• With the support of our credit risk and modelling spe-
cialists, we evaluated the reasonableness of post model
adjustments and management overlays and challenged
their rationale;
• We tested, utilising our internal IT specialists, the IT
application used in the credit impairment process
and verified the integrity of data used as input to the
models including the transfer of data between source
systems and the impairment models. We evaluated
system-based and manual controls over the recogni-
tion and measurement of impairment allowances.
INDEPENDENT AUDITOR’S REPORT
160
Risk of inappropriate access or changes to information technology systems
THE FINANCIAL STATEMENT RISK
The Bank is vitally dependent on its complex information
technology environment for the reliability and continuity
of its operations and financial reporting process due to
the extensive volume and variety of transactions which
are processed daily across the Bank’s businesses; this
includes cyber risks.
Inappropriate granting of or ineffective monitoring
of access rights to IT systems therefore presents a risk
to the accuracy of financial accounting and reporting.
Appropriate IT controls are required to protect the Bank’s
IT infrastructure, data and applications, ensure transac-
tions are processed correctly and limit the potential for
fraud and error as a result of change to an application or
underlying data.
Unauthorised or extensive access rights cause a risk of
intended or unintended manipulation of data that could
have a material effect on the completeness and accuracy
of financial statements. Therefore, we considered this
area as key audit matter.
For further information on this key audit matter refer
to Note 41.
HOW THE MATTER WAS ADDRESSED IN THE AUDIT
Our audit approach depends to a large extent on the
effectiveness of automated and IT- dependent manual
controls and therefore we updated our understanding of
the Bank’s IT- related control environment and identified
IT applications, databases and operating systems that
are relevant for the financial reporting process and to
our audit.
For relevant IT- dependent controls within the financial
reporting process we identified, with the involvement of
our internal IT specialists, supporting general IT controls
and evaluated their design, implementation and oper-
ating effectiveness. We updated our understanding of
applications relevant for financial reporting and tested
key controls particularly in the area of access protection,
integrity of system interfaces and linkage of such controls
to the reliability, completeness and accuracy of financial
reporting including computer- generated reports used
in financial reporting. Our audit procedures covered,
but were not limited to, the following areas relevant for
financial reporting:
• IT general controls relevant to automated controls
and computer- generated information covering access
security, program changes, data centre and network
operations;
• Controls regarding initial access granted to IT systems
for new employees or employees changing roles,
whether that access was subject to appropriate screen-
ing and it was approved by authorised persons;
• Controls regarding removal of employee or former
employee access rights within an appropriate period
of time after having changed roles or leaving the Bank;
• Controls regarding the appropriateness of system
access rights for privileged or administrative author-
isations (superuser) being subject to a restrictive
authorisation assignment procedure and regular
review thereof;
• Password protection, security settings regarding
modification of applications, databases and operating
systems, the segregation of department and IT users
and segregation of employees responsible for program
development and those responsible for system
operations;
• Program developers approval rights in the modification
process and their capability to carry out any modi-
fications in the productive versions of applications,
databases and operating systems. We analysed the
segregation of duties on critical trading and payment
systems in order to assess whether the segregation
between front and back office was effective; and
• We performed journal entry testing as stipulated by the
International Standards on Auditing.
INDEPENDENT AUDITOR’S REPORT
161
OTHER INFORMATIONThe Board of Directors and manage-
ment are responsible for the other
information. The other information
comprises the annual report of the
Bank but does not include the con-
solidated financial statements and
our auditor’s report thereon. The
annual report is expected to be made
available to us after the date of this
auditor’s report. Our opinion on the
consolidated financial statements
does not cover the other informa-
tion and we do not express an audit
opinion or any form of assurance
conclusion thereon.
In connection with our audit of the
consolidated financial statements,
our responsibility is to read the other
information and, in doing so, con-
sider whether the other information
is materially inconsistent with the
consolidated financial statements or
our knowledge obtained in the audit,
or otherwise appears to be materially
misstated.
When we read the annual report of
the Bank, if we conclude that there
is a material misstatement therein,
we are required to communicate
the matter to those charged with
governance.
RESPONSIBILITIES OF MANAGEMENT AND THOSE CHARGED WITH GOVERNANCE FOR THE CONSOLIDATED FINANCIAL STATEMENTSManagement is responsible for the
preparation and fair presentation of
the consolidated financial statements
in accordance with IFRSs and their
preparation in compliance with the
applicable provisions of the UAE
Federal Law No. (2) of 2015, and for
such internal control as management
determines is necessary to enable the
preparation of consolidated financial
statements that are free from material
misstatement, whether due to fraud
or error.
In preparing the consolidated
financial statements, management
is responsible for assessing the
Bank’s ability to continue as a going
concern, disclosing, as applicable,
matters related to going concern
and using the going concern basis
of accounting unless management
either intends to liquidate the Bank
or to cease operations, or has no
realistic alternative but to do so.
The Board of Directors and Board
Audit & Compliance Committee are
responsible for overseeing the Bank’s
financial reporting process.
AUDITOR’S RESPONSIBILITIES FOR THE AUDIT OF THE CONSOLIDATED FINANCIAL STATEMENTSOur objectives are to obtain reason-
able assurance about whether the
consolidated financial statements as
a whole are free from material mis-
statement, whether due to fraud or
error, and to issue an auditor’s report
that includes our opinion. Reasonable
assurance is a high level of assurance,
but is not a guarantee that an audit
conducted in accordance with ISAs
will always detect a material misstate-
ment when it exists. Misstatements
can arise from fraud or error and are
considered material if, individually
or in the aggregate, they could rea-
sonably be expected to influence the
economic decisions of users taken
on the basis of these consolidated
financial statements.
As part of an audit in accordance
with ISAs, we exercise professional
judgement and maintain professional
scepticism throughout the audit.
We also:
• Identify and assess the risks of
material misstatement of the
consolidated financial statements,
whether due to fraud or error,
design and perform audit proce-
dures responsive to those risks, and
obtain audit evidence that is suf-
ficient and appropriate to provide
a basis for our opinion. The risk of
not detecting a material misstate-
ment resulting from fraud is higher
than for one resulting from error,
as fraud may involve collusion,
forgery, intentional omissions,
misrepresentations, or the override
of internal control.
• Obtain an understanding of internal
control relevant to the audit in order
to design audit procedures that are
appropriate in the circumstances,
but not for the purpose of express-
ing an opinion on the effectiveness
of the Bank’s internal control.
• Evaluate the appropriateness of
accounting policies used and the
reasonableness of accounting
estimates and related disclosures
made by management.
• Conclude on the appropriateness
of management’s use of the going
concern basis of accounting
and, based on the audit evidence
obtained, whether a material
uncertainty exists related to events
or conditions that may cast signif-
icant doubt on the Bank’s ability
to continue as a going concern.
If we conclude that a material
uncertainty exists, we are required
to draw attention in our auditor’s
report to the related disclosures in
the consolidated financial state-
ments or, if such disclosures are
inadequate, to modify our opinion.
Our conclusions are based on
the audit evidence obtained up to
the date of our auditor’s report.
However, future events or condi-
tions may cause the Bank to cease
to continue as a going concern.
• Evaluate the overall presentation,
structure and content of the
consolidated financial statements,
including the disclosures, and
whether the consolidated financial
statements represent the under-
lying transactions and events
in a manner that achieves fair
presentation.
INDEPENDENT AUDITOR’S REPORT
162
• Obtain sufficient appropriate audit
evidence regarding the financial
information of the entities or
business activities of the Bank to
express an opinion on the con-
solidated financial statements. We
are responsible for the direction,
supervision and performance of
the group audit. We remain solely
responsible for our audit opinion.
We communicate with those charged
with governance regarding, among
other matters, the planned scope and
timing of the audit and significant
audit findings, including any signifi-
cant deficiencies in internal control
that we identify during our audit.
We also provide those charged with
governance with a statement that we
have complied with relevant ethical
requirements regarding independ-
ence, and to communicate with them
all relationships and other matters
that may reasonably be thought
to bear on our independence, and
where applicable, related safeguards.
From the matters communicated
with the Bank’s Board Audit &
Compliance Committee, we deter-
mine those matters that were of most
significance in the audit of the con-
solidated financial statements of the
current period and are therefore the
key audit matters. We describe these
matters in our auditor’s report unless
law or regulation precludes public
disclosure about the matter or when,
in extremely rare circumstances, we
determine that a matter should not be
communicated in our report because
the adverse consequences of doing
so would reasonably be expected to
outweigh the public interest benefits
of such communication.
REPORT ON OTHER LEGAL AND REGULATORY REQUIREMENTSAs required by the UAE Federal Law
No. (2) of 2015, we report that:
• we have obtained all the informa-
tion we considered necessary for
the purposes of our audit;
• the consolidated financial state-
ments of the Bank have been
prepared and comply, in all material
respects, with the applicable pro-
visions of the UAE Federal Law No.
(2) of 2015;
• the Bank has maintained proper
books of account;
• the financial information included
in the Directors’ report is consistent
with the Bank’s books of account;
• Note 40 to the consolidated
financial statements of the Bank
discloses purchased or investment
in shares during the financial year
ended 31 December 2019;
• Note 36 to the consolidated
financial statements of the Bank
discloses material related party
transactions, the terms under
which these were conducted and
principles of managing conflict of
interests;
• based on the information that has
been made available to us nothing
has come to our attention which
causes us to believe that the Bank
has contravened during the finan-
cial year ended 31 December 2019
any of the applicable provisions
of the UAE Federal Law No. (2) of
2015 or of its Articles of Association
which would materially affect its
activities or its financial position as
at 31 December 2019; and
• Note 52 to the consolidated
financial statements of the Bank
discloses social contributions made
during the financial year ended 31
December 2019.
Further, as required by the Decree
of the Chairman of the Abu Dhabi
Accountability Authority No. (1)
of 2017 pertaining to Auditing the
Financial Statements of Subject
Entities, we report that, based on the
procedures performed and infor-
mation provided to us, nothing has
come to our attention that causes us
to believe that the Bank has not com-
plied, in all material respects, with
any of the provisions of the following
laws, regulations and circulars, which
would materially affect its activities or
its consolidated financial statements
as at 31 December 2019:
• law of establishment; and
• relevant provisions of applicable
laws, resolutions and circulars
organising the Bank’s operations.
Further, as required by the UAE
Federal Law No. (14) of 2018, we
report that we have obtained all the
information and explanations we
considered necessary for the purpose
of our audit.
Deloitte & Touche (M.E.)
Mohammad Khamees Al Tah
Registration No. 717
26 January 2020
Abu Dhabi
United Arab Emirates
INDEPENDENT AUDITOR’S REPORT
163
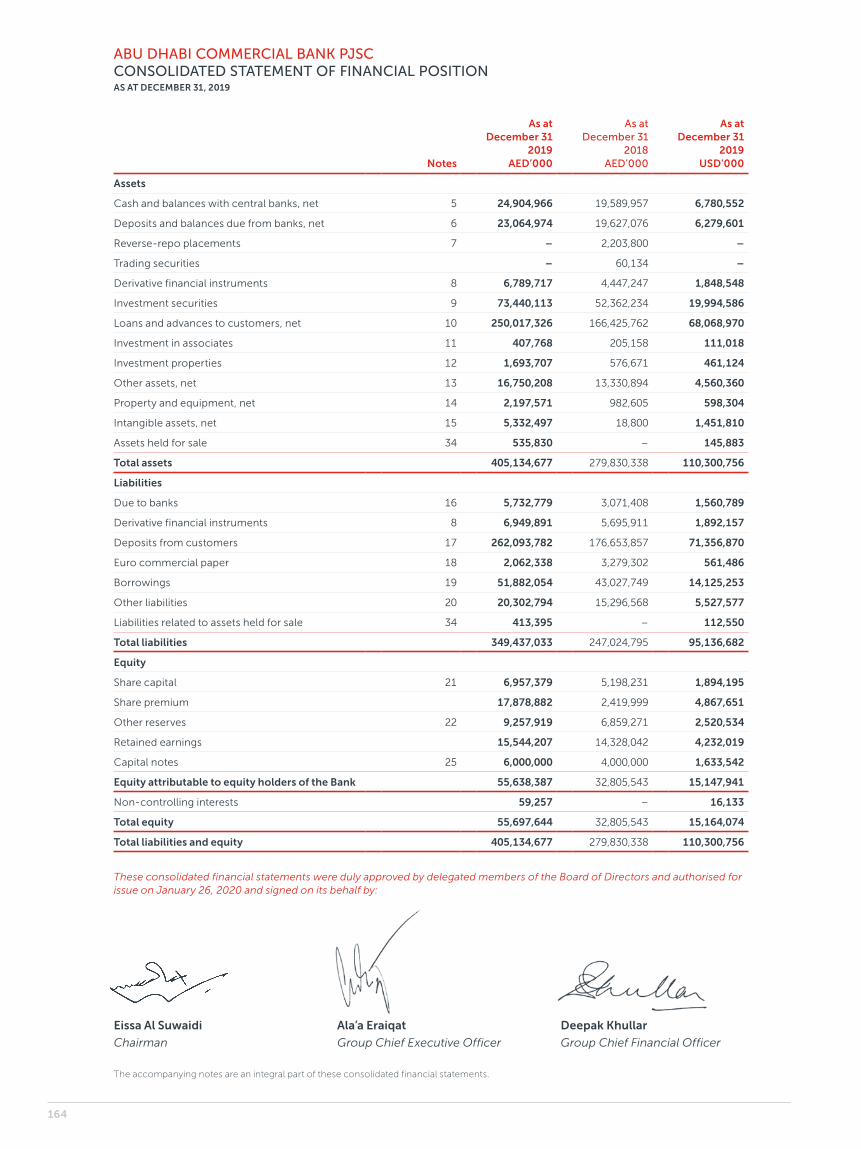
Notes
As at December 31
2019 AED’000
As at December 31
2018 AED’000
As at December 31
2019 USD’000
Assets
Cash and balances with central banks, net 5 24,904,966 19,589,957 6,780,552
Deposits and balances due from banks, net 6 23,064,974 19,627,076 6,279,601
Reverse-repo placements 7 – 2,203,800 –
Trading securities – 60,134 –
Derivative financial instruments 8 6,789,717 4,447,247 1,848,548
Investment securities 9 73,440,113 52,362,234 19,994,586
Loans and advances to customers, net 10 250,017,326 166,425,762 68,068,970
Investment in associates 11 407,768 205,158 111,018
Investment properties 12 1,693,707 576,671 461,124
Other assets, net 13 16,750,208 13,330,894 4,560,360
Property and equipment, net 14 2,197,571 982,605 598,304
Intangible assets, net 15 5,332,497 18,800 1,451,810
Assets held for sale 34 535,830 – 145,883
Total assets 405,134,677 279,830,338 110,300,756
Liabilities
Due to banks 16 5,732,779 3,071,408 1,560,789
Derivative financial instruments 8 6,949,891 5,695,911 1,892,157
Deposits from customers 17 262,093,782 176,653,857 71,356,870
Euro commercial paper 18 2,062,338 3,279,302 561,486
Borrowings 19 51,882,054 43,027,749 14,125,253
Other liabilities 20 20,302,794 15,296,568 5,527,577
Liabilities related to assets held for sale 34 413,395 – 112,550
Total liabilities 349,437,033 247,024,795 95,136,682
Equity
Share capital 21 6,957,379 5,198,231 1,894,195
Share premium 17,878,882 2,419,999 4,867,651
Other reserves 22 9,257,919 6,859,271 2,520,534
Retained earnings 15,544,207 14,328,042 4,232,019
Capital notes 25 6,000,000 4,000,000 1,633,542
Equity attributable to equity holders of the Bank 55,638,387 32,805,543 15,147,941
Non- controlling interests 59,257 – 16,133
Total equity 55,697,644 32,805,543 15,164,074
Total liabilities and equity 405,134,677 279,830,338 110,300,756
These consolidated financial statements were duly approved by delegated members of the Board of Directors and authorised for issue on January 26, 2020 and signed on its behalf by:
Eissa Al Suwaidi Ala’a Eraiqat Deepak Khullar
Chairman Group Chief Executive Officer Group Chief Financial Officer
ABU DHABI COMMERCIAL BANK PJSCCONSOLIDATED STATEMENT OF FINANCIAL POSITIONAS AT DECEMBER 31, 2019
The accompanying notes are an integral part of these consolidated financial statements.
164
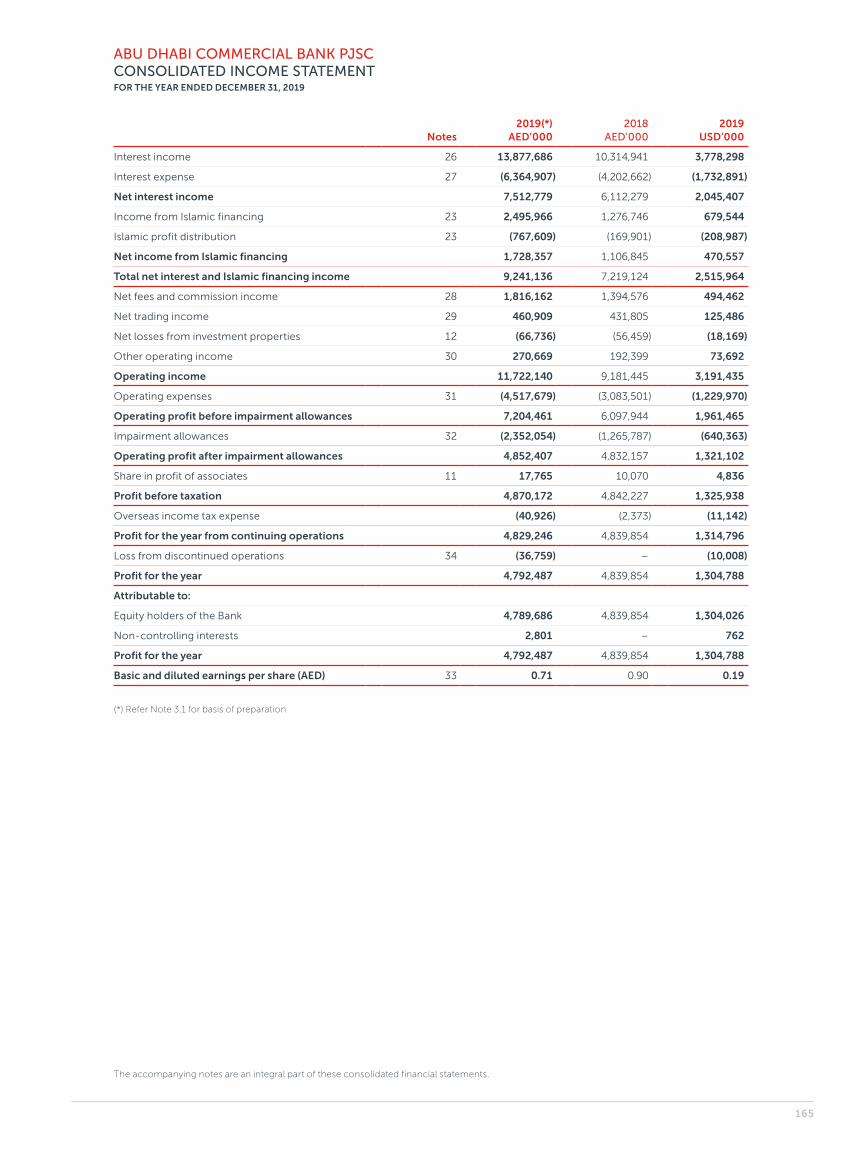
Notes2019(*)
AED’0002018
AED’0002019
USD’000
Interest income 26 13,877,686 10,314,941 3,778,298
Interest expense 27 (6,364,907) (4,202,662) (1,732,891)
Net interest income 7,512,779 6,112,279 2,045,407
Income from Islamic financing 23 2,495,966 1,276,746 679,544
Islamic profit distribution 23 (767,609) (169,901) (208,987)
Net income from Islamic financing 1,728,357 1,106,845 470,557
Total net interest and Islamic financing income 9,241,136 7,219,124 2,515,964
Net fees and commission income 28 1,816,162 1,394,576 494,462
Net trading income 29 460,909 431,805 125,486
Net losses from investment properties 12 (66,736) (56,459) (18,169)
Other operating income 30 270,669 192,399 73,692
Operating income 11,722,140 9,181,445 3,191,435
Operating expenses 31 (4,517,679) (3,083,501) (1,229,970)
Operating profit before impairment allowances 7,204,461 6,097,944 1,961,465
Impairment allowances 32 (2,352,054) (1,265,787) (640,363)
Operating profit after impairment allowances 4,852,407 4,832,157 1,321,102
Share in profit of associates 11 17,765 10,070 4,836
Profit before taxation 4,870,172 4,842,227 1,325,938
Overseas income tax expense (40,926) (2,373) (11,142)
Profit for the year from continuing operations 4,829,246 4,839,854 1,314,796
Loss from discontinued operations 34 (36,759) – (10,008)
Profit for the year 4,792,487 4,839,854 1,304,788
Attributable to:
Equity holders of the Bank 4,789,686 4,839,854 1,304,026
Non- controlling interests 2,801 – 762
Profit for the year 4,792,487 4,839,854 1,304,788
Basic and diluted earnings per share (AED) 33 0.71 0.90 0.19
(*) Refer Note 3.1 for basis of preparation
ABU DHABI COMMERCIAL BANK PJSCCONSOLIDATED INCOME STATEMENTFOR THE YEAR ENDED DECEMBER 31, 2019
The accompanying notes are an integral part of these consolidated financial statements.
165
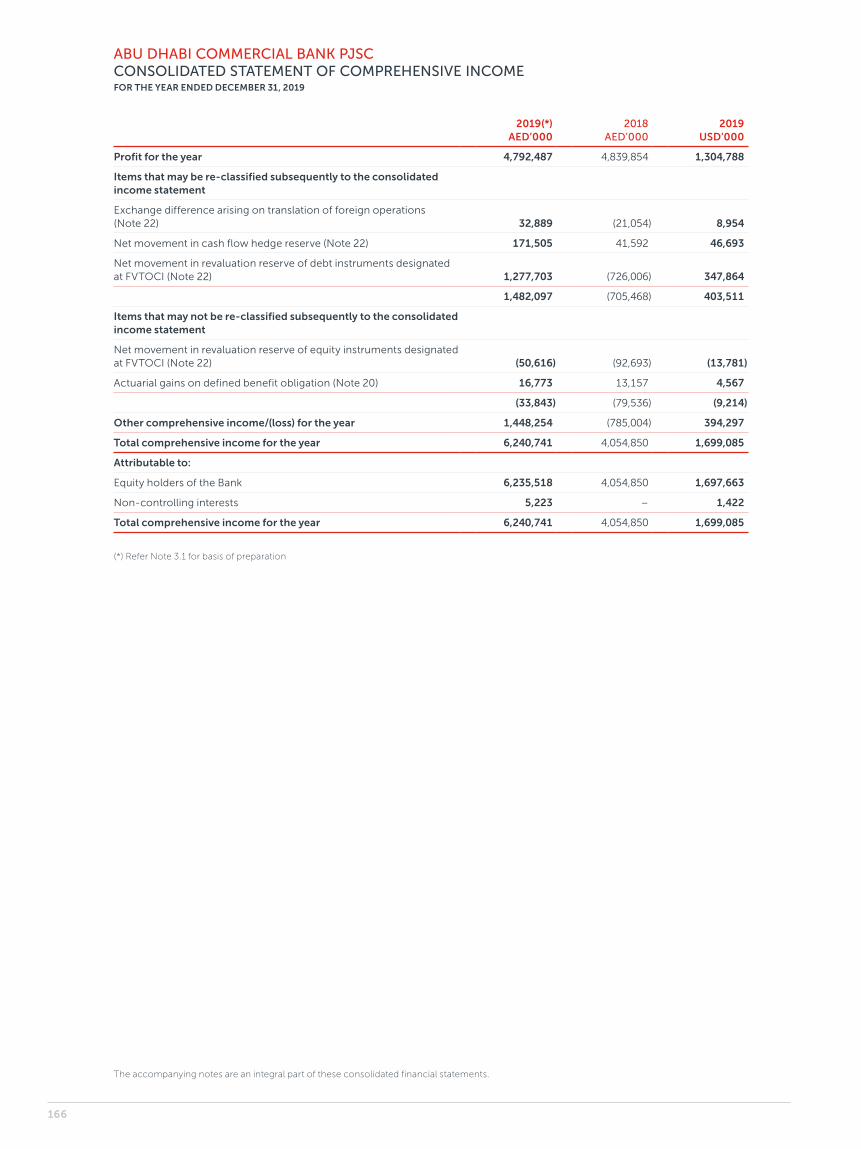
2019(*) AED’000
2018 AED’000
2019 USD’000
Profit for the year 4,792,487 4,839,854 1,304,788
Items that may be re- classified subsequently to the consolidated income statement
Exchange difference arising on translation of foreign operations (Note 22) 32,889 (21,054) 8,954
Net movement in cash flow hedge reserve (Note 22) 171,505 41,592 46,693
Net movement in revaluation reserve of debt instruments designated at FVTOCI (Note 22) 1,277,703 (726,006) 347,864
1,482,097 (705,468) 403,511
Items that may not be re- classified subsequently to the consolidated income statement
Net movement in revaluation reserve of equity instruments designated at FVTOCI (Note 22) (50,616) (92,693) (13,781)
Actuarial gains on defined benefit obligation (Note 20) 16,773 13,157 4,567
(33,843) (79,536) (9,214)
Other comprehensive income/(loss) for the year 1,448,254 (785,004) 394,297
Total comprehensive income for the year 6,240,741 4,054,850 1,699,085
Attributable to:
Equity holders of the Bank 6,235,518 4,054,850 1,697,663
Non- controlling interests 5,223 – 1,422
Total comprehensive income for the year 6,240,741 4,054,850 1,699,085
(*) Refer Note 3.1 for basis of preparation
ABU DHABI COMMERCIAL BANK PJSCCONSOLIDATED STATEMENT OF COMPREHENSIVE INCOMEFOR THE YEAR ENDED DECEMBER 31, 2019
The accompanying notes are an integral part of these consolidated financial statements.
166
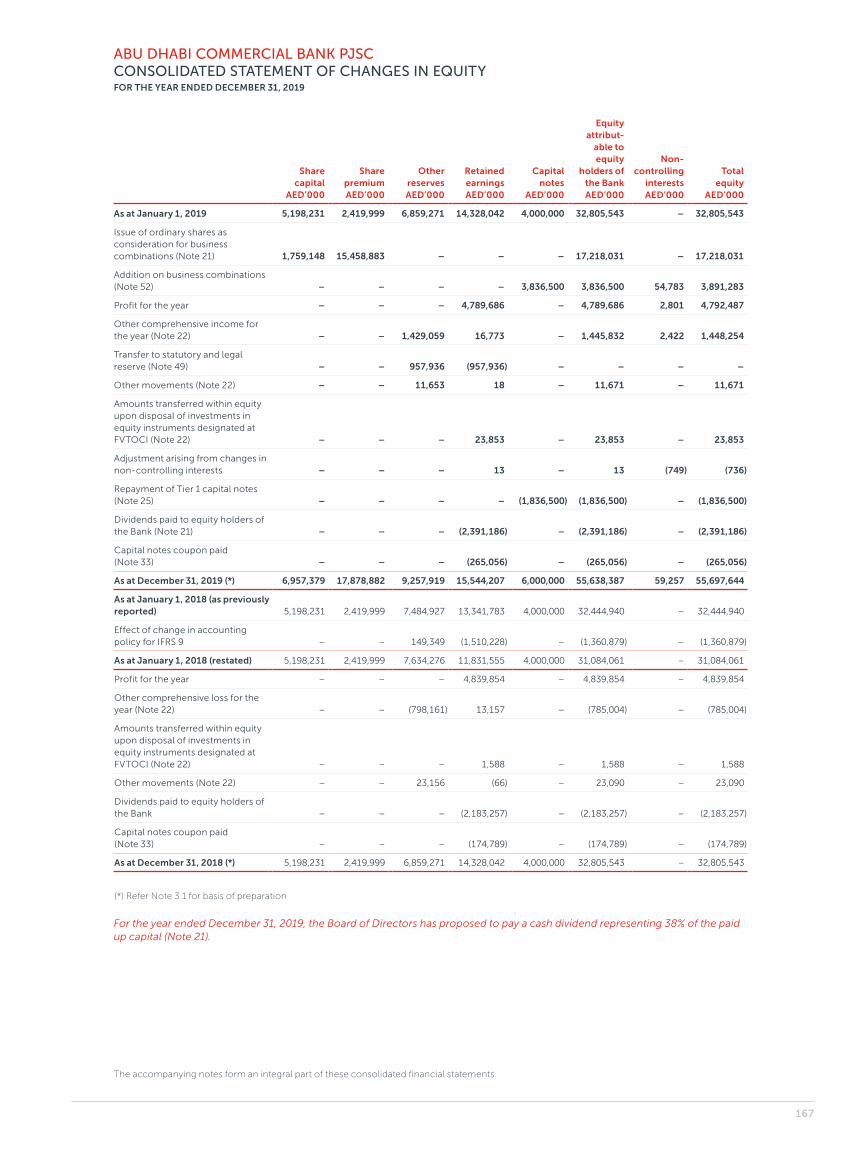
Share capital
AED’000
Share premium AED’000
Other reserves AED’000
Retained earnings AED’000
Capital notes
AED’000
Equity attribut-
able to equity
holders of the Bank AED’000
Non- controlling
interests AED’000
Total equity
AED’000
As at January 1, 2019 5,198,231 2,419,999 6,859,271 14,328,042 4,000,000 32,805,543 – 32,805,543
Issue of ordinary shares as consideration for business combinations (Note 21) 1,759,148 15,458,883 – – – 17,218,031 – 17,218,031
Addition on business combinations (Note 52) – – – – 3,836,500 3,836,500 54,783 3,891,283
Profit for the year – – – 4,789,686 – 4,789,686 2,801 4,792,487
Other comprehensive income for the year (Note 22) – – 1,429,059 16,773 – 1,445,832 2,422 1,448,254
Transfer to statutory and legal reserve (Note 49) – – 957,936 (957,936) – – – –
Other movements (Note 22) – – 11,653 18 – 11,671 – 11,671
Amounts transferred within equity upon disposal of investments in equity instruments designated at FVTOCI (Note 22) – – – 23,853 – 23,853 – 23,853
Adjustment arising from changes in non- controlling interests – – – 13 – 13 (749) (736)
Repayment of Tier 1 capital notes (Note 25) – – – – (1,836,500) (1,836,500) – (1,836,500)
Dividends paid to equity holders of the Bank (Note 21) – – – (2,391,186) – (2,391,186) – (2,391,186)
Capital notes coupon paid (Note 33) – – – (265,056) – (265,056) – (265,056)
As at December 31, 2019 (*) 6,957,379 17,878,882 9,257,919 15,544,207 6,000,000 55,638,387 59,257 55,697,644
As at January 1, 2018 (as previously reported) 5,198,231 2,419,999 7,484,927 13,341,783 4,000,000 32,444,940 – 32,444,940
Effect of change in accounting policy for IFRS 9 – – 149,349 (1,510,228) – (1,360,879) – (1,360,879)
As at January 1, 2018 (restated) 5,198,231 2,419,999 7,634,276 11,831,555 4,000,000 31,084,061 – 31,084,061
Profit for the year – – – 4,839,854 – 4,839,854 – 4,839,854
Other comprehensive loss for the year (Note 22) – – (798,161) 13,157 – (785,004) – (785,004)
Amounts transferred within equity upon disposal of investments in equity instruments designated at FVTOCI (Note 22) – – – 1,588 – 1,588 – 1,588
Other movements (Note 22) – – 23,156 (66) – 23,090 – 23,090
Dividends paid to equity holders of the Bank – – – (2,183,257) – (2,183,257) – (2,183,257)
Capital notes coupon paid (Note 33) – – – (174,789) – (174,789) – (174,789)
As at December 31, 2018 (*) 5,198,231 2,419,999 6,859,271 14,328,042 4,000,000 32,805,543 – 32,805,543
(*) Refer Note 3.1 for basis of preparation
For the year ended December 31, 2019, the Board of Directors has proposed to pay a cash dividend representing 38% of the paid up capital (Note 21).
ABU DHABI COMMERCIAL BANK PJSCCONSOLIDATED STATEMENT OF CHANGES IN EQUITYFOR THE YEAR ENDED DECEMBER 31, 2019
The accompanying notes form an integral part of these consolidated financial statements.
167
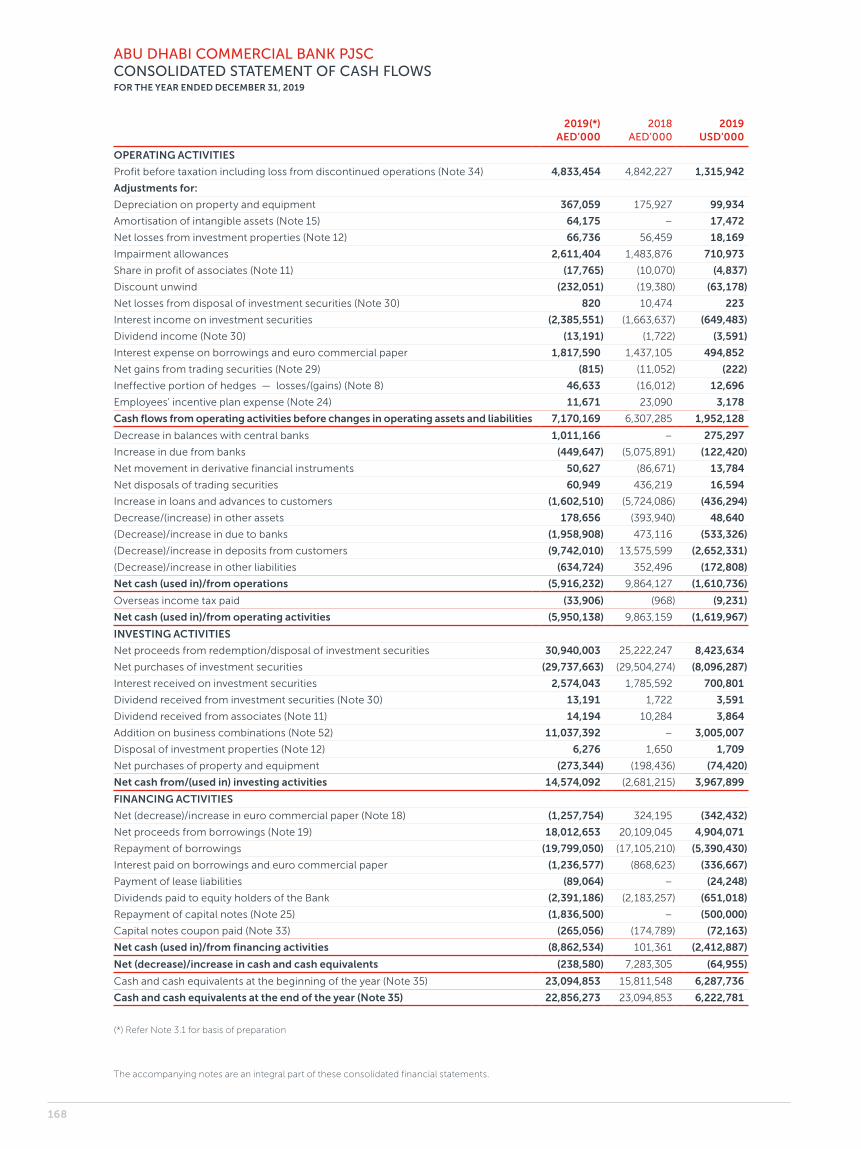
2019(*) AED’000
2018 AED’000
2019 USD’000
OPERATING ACTIVITIES
Profit before taxation including loss from discontinued operations (Note 34) 4,833,454 4,842,227 1,315,942
Adjustments for:
Depreciation on property and equipment 367,059 175,927 99,934
Amortisation of intangible assets (Note 15) 64,175 – 17,472
Net losses from investment properties (Note 12) 66,736 56,459 18,169
Impairment allowances 2,611,404 1,483,876 710,973
Share in profit of associates (Note 11) (17,765) (10,070) (4,837)
Discount unwind (232,051) (19,380) (63,178)
Net losses from disposal of investment securities (Note 30) 820 10,474 223
Interest income on investment securities (2,385,551) (1,663,637) (649,483)
Dividend income (Note 30) (13,191) (1,722) (3,591)
Interest expense on borrowings and euro commercial paper 1,817,590 1,437,105 494,852
Net gains from trading securities (Note 29) (815) (11,052) (222)
Ineffective portion of hedges — losses/(gains) (Note 8) 46,633 (16,012) 12,696
Employees’ incentive plan expense (Note 24) 11,671 23,090 3,178
Cash flows from operating activities before changes in operating assets and liabilities 7,170,169 6,307,285 1,952,128
Decrease in balances with central banks 1,011,166 – 275,297
Increase in due from banks (449,647) (5,075,891) (122,420)
Net movement in derivative financial instruments 50,627 (86,671) 13,784
Net disposals of trading securities 60,949 436,219 16,594
Increase in loans and advances to customers (1,602,510) (5,724,086) (436,294)
Decrease/(increase) in other assets 178,656 (393,940) 48,640
(Decrease)/increase in due to banks (1,958,908) 473,116 (533,326)
(Decrease)/increase in deposits from customers (9,742,010) 13,575,599 (2,652,331)
(Decrease)/increase in other liabilities (634,724) 352,496 (172,808)
Net cash (used in)/from operations (5,916,232) 9,864,127 (1,610,736)
Overseas income tax paid (33,906) (968) (9,231)
Net cash (used in)/from operating activities (5,950,138) 9,863,159 (1,619,967)
INVESTING ACTIVITIES
Net proceeds from redemption/disposal of investment securities 30,940,003 25,222,247 8,423,634
Net purchases of investment securities (29,737,663) (29,504,274) (8,096,287)
Interest received on investment securities 2,574,043 1,785,592 700,801
Dividend received from investment securities (Note 30) 13,191 1,722 3,591
Dividend received from associates (Note 11) 14,194 10,284 3,864
Addition on business combinations (Note 52) 11,037,392 – 3,005,007
Disposal of investment properties (Note 12) 6,276 1,650 1,709
Net purchases of property and equipment (273,344) (198,436) (74,420)
Net cash from/(used in) investing activities 14,574,092 (2,681,215) 3,967,899
FINANCING ACTIVITIES
Net (decrease)/increase in euro commercial paper (Note 18) (1,257,754) 324,195 (342,432)
Net proceeds from borrowings (Note 19) 18,012,653 20,109,045 4,904,071
Repayment of borrowings (19,799,050) (17,105,210) (5,390,430)
Interest paid on borrowings and euro commercial paper (1,236,577) (868,623) (336,667)
Payment of lease liabilities (89,064) – (24,248)
Dividends paid to equity holders of the Bank (2,391,186) (2,183,257) (651,018)
Repayment of capital notes (Note 25) (1,836,500) – (500,000)
Capital notes coupon paid (Note 33) (265,056) (174,789) (72,163)
Net cash (used in)/from financing activities (8,862,534) 101,361 (2,412,887)
Net (decrease)/increase in cash and cash equivalents (238,580) 7,283,305 (64,955)
Cash and cash equivalents at the beginning of the year (Note 35) 23,094,853 15,811,548 6,287,736
Cash and cash equivalents at the end of the year (Note 35) 22,856,273 23,094,853 6,222,781
(*) Refer Note 3.1 for basis of preparation
ABU DHABI COMMERCIAL BANK PJSCCONSOLIDATED STATEMENT OF CASH FLOWSFOR THE YEAR ENDED DECEMBER 31, 2019
The accompanying notes are an integral part of these consolidated financial statements.
168
ABU DHABI COMMERCIAL BANK PJSCNOTES TO THE CONSOLIDATED FINANCIAL STATEMENTSDECEMBER 31, 2019
1. General information
Abu Dhabi Commercial Bank PJSC (“ADCB” or the “Bank”)
is a public joint stock company with limited liability incor-
porated in the emirate of Abu Dhabi, United Arab Emirates
(UAE). The Bank and its subsidiaries (together referred to
as the “Group”) is principally engaged in the business of
retail, commercial and Islamic banking and provision of
other financial services.
On March 21, 2019, the shareholders of ADCB and
Union National Bank PJSC (“UNB”) approved the merger
of two banks pursuant to Article 283 (1) of UAE Federal
Law No. 2 of 2015 and subsequent acquisition of 100%
of issued share capital of Al Hilal Bank PJSC (“AHB”) by
the combined bank. The merger was effected through
issuance of 0.5966 new shares in ADCB for every one
share of UNB, subject to the terms and conditions of the
merger. Following the merger, ADCB and UNB sharehold-
ers owns approximately 76% and 24% of the combined
bank, respectively. On the effective date of the merger,
UNB shares were delisted from the Abu Dhabi Securities
Exchange. The combined bank retained ADCB’s legal
registrations.
The combined bank issued a mandatory convertible bond
(“bond”) of AED 1,000,000 thousand to the shareholder
of AHB as consideration to acquire the entire issued share
capital of AHB. The bond was converted immediately into
117,647,058 ADCB shares.
The effective date of the above merger and acquisition
was May 1, 2019.
The registered head office of ADCB is at Abu Dhabi
Commercial Bank Head Office Building, Sheikh Zayed Bin
Sultan Street, Plot C- 33, Sector E-11, P. O. Box 939, Abu
Dhabi, UAE.
2. Application of new and revised International Financial Reporting Standards (IFRSs)
In the current year, the Group applied for the first time,
IFRS 16 Leases. As required by IAS 1 Presentation of
Financial Statements, the nature and effect of these
changes are disclosed in Note 3.7 of the consolidated
financial statements.
The Group has also applied the following amendments
to IFRSs issued by the International Accounting Standards
Board (“IASB”) that are mandatorily effective for an
accounting period that begins on or after January 1, 2019.
The application of these amendments to IFRSs has not
had any material impact on the amounts reported for the
current and prior periods but may affect the accounting
for the Group’s future transactions or arrangements.
• Annual Improvements to IFRSs 2015–2017 Cycle
amending IFRS 3, IFRS 11, IAS 12 and IAS 23
• IFRIC 23 Uncertainty over Income Tax Treatments
• Amendments in IFRS 9 Financial Instruments relating to
prepayment features with negative compensation
• Amendment to IAS 19 Employee Benefits
• Amendments in IAS 28 Investments in Associates and
Joint Ventures relating to long-term interests in associ-
ates and joint ventures
Other than the above, there are no other significant IFRSs
and amendments that were effective for the first time for
the financial year beginning on or after January 1, 2019.
169

ABU DHABI COMMERCIAL BANK PJSCNOTES TO THE CONSOLIDATED FINANCIAL STATEMENTSDECEMBER 31, 2019
STANDARDS AND INTERPRETATIONS IN ISSUE BUT NOT YET EFFECTIVE
The Group has not early adopted new and revised IFRSs that have been issued but are not yet effective.
New standards and significant amendments to standards applicable to the Group:
Effective for annual periods beginning on or after
Amendments to references to the Conceptual Framework in IFRS Standards — amend-
ments to IFRS 2, IFRS 3, IFRS 6, IFRS 14, IAS 1, IAS 8, IAS 34, IAS 37, IAS 38, IFRIC 12,
IFRIC 19, IFRIC 20, IFRIC 22, and SIC-32 to update those pronouncements with regard
to references to and quotes from the framework or to indicate where they refer to a
different version of the Conceptual Framework.
January 1, 2020
Amendment to IFRS 3 regarding the definition of business. January 1, 2020
Amendments to IAS 1 and IAS 8 regarding the definition of materiality. January 1, 2020
Amendments to IFRS 9, IAS 39 and IFRS 7 — Interest Rate Benchmark Reform January 1, 2020
IFRS 17 Insurance Contracts which requires insurance liabilities to be measured at a
current fulfilment value and provides a more uniform measurement and presentation
approach for all insurance contracts. These requirements are designed to achieve
the goal of a consistent, principle-based accounting for insurance contracts. IFRS 17
supersedes IFRS 4 Insurance Contracts as of January 1, 2022.
January 1, 2022
Amendments to IFRS 10 Consolidated Financial Statements and IAS 28 Investments in
Associates and Joint Ventures (2011) relating to the treatment of the sale or contribu-
tion of assets from an investor to its associate or joint venture.
Effective date deferred
indefinitely. Adoption is
still permitted.
Management anticipates that these amendments will be
adopted in the consolidated financial statements in the
initial period when they become mandatorily effective.
The impact of these standards and amendments are
currently being assessed by the management.
UPDATE ON PROSPECTIVE CHANGES IN REFERENCE RATES (IBOR)
The impact of the replacement of interbank offered rates
(“Ibors”) with alternative risk-free rates on the Group’s
products and services remains a key area of focus. The
Group have a significant and growing volume of contracts
referencing Ibors, such as Libor and Eibor, extending past
2021 when it is likely that these Ibors will cease being
published. The management has started a project to
coordinate the Group’s transition activities aims to min-
imise the volume of such contracts outstanding upon
the cessation of these Ibors, and therefore the associated
disruption to financial flows and potential economic
losses. The project is significant in terms of scale and
complexity and will impact multiple products, currencies,
systems and processes. The process of adopting new
reference rates exposes the Group to operational and
financial risks such as earnings volatility resulting from
contract modifications and changes in hedge accounting.
The Group continue to engage with various stakeholders
to support an orderly transition and to mitigate the risks
resulting from the transition.
170
ABU DHABI COMMERCIAL BANK PJSCNOTES TO THE CONSOLIDATED FINANCIAL STATEMENTSDECEMBER 31, 2019
3. Summary of significant accounting policies
3.1 BASIS OF PREPARATION
The consolidated financial statements have been pre-
pared on a going concern basis and in accordance with
International Financial Reporting Standards (IFRSs) issued
by the International Accounting Standards Board (IASB).
IFRSs comprise accounting standards issued by the IASB
as well as Interpretations issued by the International
Financial Reporting Interpretations Committee (IFRIC).
The consolidated financial statements comprise of results
for the year ended December 31, 2019 for ADCB and its
subsidiaries and the results for the eight month period
ended December 31, 2019 for erstwhile UNB (including
its subsidiaries) and AHB group while the comparatives
are of ADCB only.
Certain disclosure notes have been rearranged from the
Group’s prior year consolidated financial statements to
conform to the current year’s presentation.
3.2 MEASUREMENT
The consolidated financial statements have been pre-
pared under the historical cost convention except as
modified by the revaluation of financial assets and liabil-
ities at fair value through profit and loss, financial assets
and liabilities at fair value through other comprehensive
income and investment properties.
3.3 FUNCTIONAL AND PRESENTATION CURRENCY
The consolidated financial statements are prepared and
presented in United Arab Emirates Dirhams (AED), which is
the Group’s functional and presentation currency. Except
as indicated, financial information presented in AED has
been rounded to the nearest thousand.
The United States Dollar (USD) amounts in the primary
financial statements are presented for the convenience
of the reader only by converting the AED balances at the
pegged exchange rate of 1 USD = 3.673 AED.
3.4 USE OF ESTIMATES AND JUDGEMENTS
The preparation of financial statements requires manage-
ment to make judgements, estimates and assumptions
that affect the application of the accounting policies and
the reported amounts of assets, liabilities, income and
expenses. Actual results may differ from these estimates.
Estimates and underlying assumptions are reviewed on
an ongoing basis. Revisions to accounting estimates are
recognised in the period in which the estimate is revised
and in any future periods affected.
Information about significant areas of estimation uncer-
tainty and critical judgements in applying accounting
policies that have the most significant effect on the
amounts recognised in the consolidated financial state-
ments are described in Note 4.
3.5 BASIS OF CONSOLIDATION
These consolidated financial statements incorporate
the financial statements of the Bank and its subsidiaries
(collectively referred to as the “Group”).
SUBSIDIARIES
Subsidiaries are entities that are controlled by the Bank.
Control is achieved when the Bank:
• has power over the investee;
• is exposed, or has rights, to variable returns from its
involvement with the investee; and
• has the ability to use its power to affect its returns.
The Bank reassesses whether or not it controls an inves-
tee if facts and circumstances indicate that there are
changes to one or more of the three elements of control
listed above.
When the Bank has less than a majority of voting rights of
an investee, still it has power over the investee when the
voting rights are sufficient to give it the practical ability to
direct the relevant activities of the investee unilaterally.
The Bank considers all relevant facts and circumstances
in assessing whether or not the Bank’s voting rights in an
investee are sufficient to give it power, including:
• the size of the Bank’s holding of voting rights relative
to the size and dispersion of holdings of the other
vote holders;
• potential voting rights held by the Bank;
• rights arising from other contractual arrangements; and
• any additional facts and circumstances that indicate
that the Bank has, or does not have, the current ability
to direct the relevant activities at the time the decision
needs to be made, including voting patterns at previous
shareholders’ meetings.
171

ABU DHABI COMMERCIAL BANK PJSCNOTES TO THE CONSOLIDATED FINANCIAL STATEMENTSDECEMBER 31, 2019
Consolidation of a subsidiary begins when the Bank
obtains control over the subsidiary and ceases when the
Bank loses control of the subsidiary. Income and expenses
of a subsidiary acquired or disposed of during the year are
included in the consolidated income statement and other
comprehensive income from the date the Bank gains
control until the date when the Bank ceases to control
the subsidiary.
Profit or loss and each component of other comprehen-
sive income are attributed to owners of the Bank and
to the non- controlling interests. Total comprehensive
income of the subsidiaries is attributed to the owners of
the Bank and non- controlling interests even if this results
in non- controlling interests having a deficit balance.
When necessary, adjustments are made to the consol-
idated financial statements of subsidiaries to align their
accounting policies with the Bank’s accounting policies.
All intragroup balances and income, expenses and cash
flows resulting from intragroup transactions are elimi-
nated in full on consolidation.
CHANGES IN THE BANK’S OWNERSHIP INTERESTS IN EXISTING
SUBSIDIARIES
Changes in the Bank’s ownership interests in subsidiaries
that do not result in the Bank losing control over the
subsidiaries are accounted for as equity transactions. The
carrying amount of the Bank’s interests is adjusted to
reflect the changes in their relative interests in the subsid-
iaries. Any difference between the amount by which the
non- controlling interests are adjusted and the fair value of
the consideration paid or received is recognised directly
in equity and attributed to the shareholders of the Bank.
When the Bank loses control of a subsidiary, a gain or loss
is recognised in the consolidated income statement and
is calculated as the difference between (i) the aggregate
of the fair value of the consideration received and the fair
value of any retained interest and (ii) the previous carrying
amount of the assets (including goodwill), liabilities of the
subsidiary and any non- controlling interests.
All amounts previously recognised in other comprehen-
sive income in relation to that subsidiary are accounted for
as if the Bank had directly disposed of the related assets
or liabilities of the subsidiary (i.e. reclassified to income
statement or transferred to another category of equity
as specified/permitted by applicable IFRSs). The fair value
of any investment retained in the former subsidiary, at
the date when control is lost, is regarded as the fair value
on initial recognition for subsequent accounting under
IFRS 9 or, when appropriate, the cost on initial recognition
of an investment in an associate or joint venture.
SPECIAL PURPOSE ENTITIES
Special purpose entities (SPEs) are entities that are created
to accomplish a narrow and well- defined objective such
as the securitisation of particular assets, or the execution
of a specific borrowing or lending transaction. A SPE is
consolidated if, based on an evaluation of the substance
of its relationship with the Bank, the Bank has power over
the SPE, is exposed to or has rights to variable returns
from its involvement with the SPE and its ability to use
its power over the SPE at inception and subsequently to
affect the amount of its return, the Bank concludes that it
controls the SPE.
The assessment of whether the Bank has control over a
SPE is carried out at inception and normally no further
reassessment of control is carried out in the absence of
changes in the structure or terms of the SPE, or additional
transactions between the Bank and the SPE except when-
ever there is a change in the substance of the relationship
between the Bank and a SPE.
FUNDS UNDER MANAGEMENT
The Bank manages and administers assets held in unit
trusts on behalf of investors. The financial statements of
these entities are not included in the consolidated finan-
cial statements except when the Bank controls the entity,
as referred to above.
INVESTMENT IN ASSOCIATES
Associates are those entities in which the Group has
significant influence. Significant influence is the power to
participate in the financial and operating policy decisions
of the investee but not control or joint control over those
policies. Investments in associates are accounted for using
the equity method and are recognised initially at cost. The
cost of the investments includes transaction costs.
The consolidated financial statements includes the
Group’s share of the profit or loss and other comprehen-
sive income of investment in associates, after adjustments
to align the accounting policies with those of the Group,
from the date that significant influence commences until
the date that significant influence ceases.
When the Group’s share of losses exceeds its interest in
an equity-accounted investee, the carrying amount of the
investment, including any long-term interests that form
part thereof, is reduced to zero, and the recognition of
further losses is discontinued except to the extent that the
Group has an obligation or has made payments on behalf
of the investee.
172

ABU DHABI COMMERCIAL BANK PJSCNOTES TO THE CONSOLIDATED FINANCIAL STATEMENTSDECEMBER 31, 2019
The carrying amount of the investment (including
goodwill) is tested for impairment in accordance with
IAS 36 — Impairment of Assets, as a single asset by com-
paring with the recoverable amount (higher of value in
use and fair value less cost of disposal). Any impairment
loss recognised forms part of the carrying amount of
the investment. Any reversal of the impairment loss is
recognised in accordance with IAS 36 to the extent that
the recoverable amount of the investment subsequently
increases such that the increased carrying amount does
not exceed the carrying amount that would have been
determined had no impairment loss been recognised for
the investment in prior years.
The Group discontinues the use of equity method of
accounting from the date when the investment ceases
to be an associate or when the investment is classified as
held for sale. When the Group retains an interest in the
former associate and the retained interest is a financial
asset, the Group measures the retained interest at fair
value at that date and the fair value is regarded as its fair
value on initial recognition in accordance with IFRS 9. The
difference between the carrying amount of the associate
at the date equity method was discontinued and the fair
value of the retained interest and any proceeds from
disposing of a part interest in the associate is included
in the determination of the gain or loss on disposal of
associate. In addition, the Group accounts for all amounts
previously recognised in other comprehensive income
in relation of that associate on the same basis as would
be required if that associate had directly disposed of the
related assets or liabilities. Therefore, if a gain or loss
previously recognised in other comprehensive income
by that associate would be reclassified to profit or loss on
the disposal of the related assets or liabilities, the Group
reclassifies the gain or loss from equity to profit or loss (as
a reclassification adjustment) when the equity method is
discontinued.
JOINT ARRANGEMENTS
Joint arrangements are arrangements of which the Group
has joint control, established by contracts requiring
unanimous consent for decisions about the activities that
significantly affect the arrangements’ returns. They are
classified and accounted for as follows:
Joint operation — when the Group has rights to the assets
and obligations for the liabilities, relating to an arrange-
ment, it accounts for each of its assets, liabilities and
transactions, including its share of those held or incurred
jointly, in relation to the joint operation.
Joint venture — when the Group has rights only to the
net assets of the arrangements, it accounts for its interest
using the equity method, as for associates.
NON- CURRENT ASSETS HELD FOR SALE
Non- current assets (and disposal groups) classified
as held for sale are measured at the lower of carrying
amount and fair value less costs to sell.
Non- current assets and disposal groups are classified as
held for sale if their carrying amount will be recovered
through a sale transaction rather than through continuing
use. This condition is regarded as met only when the
sale is highly probable and the asset (or disposal group)
is available for immediate sale in its present condition.
Management must be committed to the sale which
should be expected to qualify for recognition as a com-
pleted sale within one year from the date of classification.
When the Group is committed to a sale plan involving loss
of control of a subsidiary, all of the assets and liabilities of
that subsidiary are classified as held for sale when the cri-
teria described above are met, regardless of whether the
Group will retain a non- controlling interest in its former
subsidiary after the sale.
When the Group is committed to a sale plan involving
disposal of an investment in an associate or, a portion
of an investment in an associate, the investment, or the
portion of the investment in the associate, that will be
disposed of is classified as held for sale when the criteria
described above are met. The Group then ceases to apply
the equity method in relation to the portion that is classi-
fied as held for sale. Any retained portion of an investment
in an associate that has not been classified as held for sale
continues to be accounted for using the equity method.
3.6 BUSINESS COMBINATION UNDER COMMON CONTROL
A business combination involving entities under common
control is a business combination in which all the com-
bining entities or businesses are ultimately controlled
by the same party or parties both before and after the
business combination, and that control is not transitory.
Currently, there is no specific guidance on accounting
for common control transactions under IFRSs, therefore
the management needs to use judgement to develop
an accounting policy that provides relevant and reliable
information in accordance with IAS 8.
The Group accounts for business combinations under
common control using the acquisition method. Under
acquisition method, the consideration transferred in a
business combination is measured at fair value, which is
calculated as the sum of the acquisition-date fair values
of the assets transferred by the Group, liabilities incurred
by the Group to the former owners of the acquiree and
the equity interests issued by the Group in exchange for
control of the acquiree. Acquisition- related costs are
recognised in profit or loss as incurred.
173

ABU DHABI COMMERCIAL BANK PJSCNOTES TO THE CONSOLIDATED FINANCIAL STATEMENTSDECEMBER 31, 2019
At the acquisition date, the identifiable assets acquired
and the liabilities assumed are recognised at their fair
value, except that:
• deferred tax assets or liabilities, and assets or liabilities
related to employee benefit arrangements are recog-
nised and measured in accordance with IAS 12 Income
Taxes and IAS 19 Employee Benefits respectively; and
• assets (or disposal groups) that are classified as held for
sale in accordance with IFRS 5 Non- current Assets Held
for Sale and Discontinued Operations are measured in
accordance with that standard.
Goodwill is measured as the excess of the sum of the con-
sideration transferred, the amount of any non- controlling
interests in the acquiree and the fair value of the acquirer’s
previously held equity interest in the acquiree (if any) over
the net of the acquisition-date amounts of the identifi-
able assets acquired and the liabilities assumed. If, after
reassessment, the net of the acquisition-date amounts
of the identifiable assets acquired and liabilities assumed
exceeds the sum of the consideration transferred, the
amount of any non- controlling interests in the acquiree
and the fair value of the acquirer’s previously held interest
in the acquiree (if any), the excess is recognised immedi-
ately in profit or loss as a bargain purchase gain.
Non- controlling interests that are present ownership
interests and entitle their holders to a proportionate
share of the entity’s net assets in the event of liquidation
may be initially measured either at fair value or at the
non- controlling interests’ proportionate share of the
recognised amounts of the acquiree’s identifiable net
assets. The choice of measurement basis is made on a
transaction-by- transaction basis.
When a business combination is achieved in stages, the
Group’s previously held equity interest in the acquiree
is remeasured to its acquisition-date fair value and the
resulting gain or loss, if any, is recognised in profit or loss.
Amounts arising from interests in the acquiree prior to the
acquisition date that have previously been recognised in
other comprehensive income are reclassified to profit or
loss where such treatment would be appropriate if that
interest were disposed of.
If the initial accounting for a business combination is
incomplete by the end of the reporting period in which
the combination occurs, the Group reports provisional
amounts for the items for which the accounting is incom-
plete. Those provisional amounts are adjusted during the
measurement period, or additional assets or liabilities are
recognised, to reflect new information obtained about
facts and circumstances that existed at the acquisition
date that, if known, would have affected the amounts
recognised at that date.
The measurement period is the period from the date of
acquisition to the date the Group obtains complete infor-
mation about facts and circumstances that existed as of
the acquisition date but does not exceed twelve months.
IMPAIRMENT TESTING OF GOODWILL
Goodwill arising on an acquisition of a business is carried
at cost as established at the date of acquisition of the
business (Note 52) less accumulated impairment losses,
if any.
For the purpose of impairment testing, goodwill is
allocated to each of the Group’s cash- generating units
(or groups of cash- generating units) that is expected to
benefit from the synergies of the combination.
A cash- generating unit (“CGU”) to which goodwill has
been allocated is tested for impairment annually, or
more frequently when there is an indication that the
unit may be impaired. If the recoverable amount of the
cash- generating unit is less than its carrying amount, the
impairment loss is allocated first to reduce the carrying
amount of any goodwill allocated to the unit and then to
the other assets of the unit pro-rata based on the carrying
amount of each asset in the unit. Any impairment loss
for goodwill is recognised directly in profit or loss. An
impairment loss recognised for goodwill is not reversed
in subsequent periods.
On disposal of the relevant cash- generating unit, the
attributable amount of goodwill is included in the deter-
mination of the profit or loss on disposal.
3.7 CHANGE IN ACCOUNTING POLICY
GENERAL IMPACT OF APPLICATION OF IFRS 16 LEASES
IFRS 16 “Leases” replaces IAS 17 “Leases” along with
three Interpretations (IFRIC 4 “Determining whether
an Arrangement contains a Lease”, SIC 15 “Operating
Leases- Incentives” and SIC 27 “Evaluating the Substance
of Transactions Involving the Legal Form of a Lease”). The
adoption of this new Standard has resulted in the Group
recognising a right-of-use asset and related lease liability
in connection with all former operating leases except
for those identified as low-value or having a remaining
lease term of less than 12 months from the date of initial
application.
IFRS introduces significant changes to the lessee
accounting by removing the distinction between oper-
ating and finance lease and requires the recognition of a
right-of-use asset and a lease liability at commencement
for all leases, except for short-term leases and leases of
low value assets. In contrast to lessee accounting, the
requirements for lessor accounting have remained largely
unchanged.
174
ABU DHABI COMMERCIAL BANK PJSCNOTES TO THE CONSOLIDATED FINANCIAL STATEMENTSDECEMBER 31, 2019
The date of initial application of IFRS 16 for the Group
is January 1, 2019. The Group has applied IFRS 16 using
simplified modified approach. Management has assessed
that the impact of adoption of IFRS 16 on the Group’s
consolidated financial statements is not material.
IMPACT ON LESSEE ACCOUNTING
IFRS 16 changes how the Group accounts for leases pre-
viously classified as operating leases under IAS 17, which
were off- balance-sheet.
The Group has made use of the practical expedient avail-
able on transition to IFRS 16 not to reassess whether a
contract is or contains lease. Accordingly, the definition of
a lease in accordance with IAS 17 and IFRIC 4 will continue
to be applied to those leases entered or modified before
January 1, 2019. The lease liability for such leases are
measured at the present value of the remaining lease
payments using the incremental borrowing rate as of
January 1, 2019.
The Group has elected not to include initial direct costs in
the measurement of the right-of-use asset for operating
leases in existence at the date of initial application of
IFRS 16, being January 1, 2019. At this date, the Group
has also elected to measure the right-of-use assets at
an amount equal to the lease liability adjusted for any
prepaid or accrued lease payments that existed at the date
of transition.
The Group has applied a single discount rate to port-
folio of leases, as the leases are of reasonably similar
characteristics.
On transition, for leases previously accounted for as
operating leases with a remaining lease term of less than
12 months and for leases of low-value assets the Group
has applied the optional exemptions to not recognise
right-of-use assets but to account for the lease expense
on a straight-line basis over the remaining lease term.
Instead of performing an impairment review on the
right-of-use assets at the date of initial application, the
Group has relied on its historic assessment as to whether
leases were onerous immediately before the date of initial
application of IFRS 16.
For those leases previously classified as finance leases, the
right-of-use asset and lease liability are measured at the
date of initial application at the same amounts as under
IAS 17 immediately before the date of initial application.
The following is a reconciliation of the financial statement line items from IAS 17 to IFRS 16 as at January 1, 2019:
Carrying amount December 31, 2018
AED’000Re- measurement
AED’000
IFRS 16 Carrying amount
January 1, 2019 AED’000
Property and equipment 982,605 141,722 1,124,327
Other assets — Prepayments 78,314 (10,764) 67,550
Impact on total assets 130,958
Other liabilities — Lease liabilities – 130,958 130,958
Impact on total liabilities 130,958
The following is a reconciliation of total operating lease commitments as at December 31, 2018 (as disclosed in the
financial statements of December 31, 2018) to the lease liabilities recognised at January 1, 2019:
AED’000
Total operating lease commitments as at December 31, 2018 152,170
Recognition exemptions:
Lease of low value assets –
Lease with remaining lease term of less than 12 months (9,825)
Operating lease liabilities before discounting 142,345
Discounted using incremental borrowing rate 3.5% p.a.
Total lease liabilities recognised under IFRS 16 as at January 1, 2019 130,958
175

ABU DHABI COMMERCIAL BANK PJSCNOTES TO THE CONSOLIDATED FINANCIAL STATEMENTSDECEMBER 31, 2019
IMPACT ON LESSOR ACCOUNTING
IFRS 16 does not change substantially how a lessor
accounts for leases. Under IFRS 16, a lessor continues to
classify leases as either finance lease or operating lease
and account for those two types of leases differently.
However, IFRS 16 has changed and expanded the dis-
closures required, in particular regarding how a lessor
manages the risks arising from its residual interest in
leased assets.
ACCOUNTING POLICIES FOR ACCOUNTING OF LEASES TILL
DECEMBER 31, 2018
The determination of whether an arrangement is a lease
or it contains a lease, is based on the substance of the
arrangement and requires an assessment of whether the
fulfilment of the arrangement is dependent on the use of
a specific asset or assets and the arrangement conveys a
right to use the asset.
Group as a lessee — Leases which do not transfer to the
Group substantially all the risks and benefits incidental
to ownership of the leased items are operating leases.
Operating lease payments are recognised as an expense
in the consolidated income statement on a straight line
basis over the lease term. Contingent rentals payable are
recognised as an expense in the period in which they
are incurred.
Group as a lessor — Leases where the Group does not
transfer substantially all the risk and benefits of owner-
ship of the asset are classified as operating leases. Rental
income are recognised in the consolidated income
statement on a straight line basis over the lease term.
Contingent rents are recognised as revenue in the period
in which they are earned.
ACCOUNTING POLICIES INTRODUCED ON ADOPTION OF IFRS 16
The Group as lessee
The Group assesses whether a contract is or contains a
lease, at inception of the contract. The Group recognises
a right-of-use asset and a corresponding lease liability
with respect to all lease arrangement in which it is the
lessee, except for short-term (defined as leases with a
lease term of 12 months or less) and leases of low value
asset. For these leases, the Group recognises the lease
payments as an operating lease on a straight-line basis
over the term of the lease unless another systematic
basis is more representative of the time pattern in which
economic benefits from the leased assets are consumed.
This expense is presented within other expenses in the
consolidated income statement.
The lease liability is initially measured at the present value
of the lease payments that are not paid at the commence-
ment date, discounted by the rate implicit in the lease. If
this rate cannot be readily determined, the Group uses its
incremental borrowing rate. The lease liability is subse-
quently measured by increasing the carrying amount to
reflect the interest on the lease liability (using the effective
interest method) and by reducing the carrying amount to
reflect the lease payments made.
The right-of-use assets comprise the initial measurement
of the corresponding lease liability, lease payments made
at or before the commencement day and any initial
direct costs. They are subsequently measured at cost less
accumulated depreciation and impairment losses. Right-
of-use assets are depreciated over the period of lease
term or useful life of the underlying asset whichever is
shorter. The Group applies IAS 36 to determine whether a
right-of-use asset is impaired and accounts for any identi-
fied impairment loss as per the Group’s impairment policy
for non- financial assets.
As a practical expedient, IFRS 16 permits a lessee not
to separate non-lease component, and instead account
for any lease and associated non-lease component as
a single arrangement. The Group has used this practical
expedient.
The Group has presented right-of-use asset within
“Property and equipment” and lease liabilities within
“Other liabilities” in the consolidated statement of finan-
cial position.
The Group as lessor
Leases where the Group does not transfer substantially all
the risk and benefits of ownership of the asset are clas-
sified as operating leases. Rental income are recognised
in the consolidated income statement on a straight line
basis over the lease term. Contingent rents are recognised
as revenue in the period in which they are earned.
3.8 FINANCIAL INSTRUMENTS
FINANCIAL ASSETS
All financial assets are recognised and derecognised on
settlement date basis (other than derivative contracts
which are recognised and derecognised on trade date
basis) where the purchase or sale of a financial asset is
under a contract whose terms require delivery of the
financial asset within the timeframe established by the
market concerned, and are initially measured at fair value,
plus transaction costs, except for those financial assets
classified as at FVTPL. Settlement date is the date that
the Group physically receives or transfers the assets.
Transaction costs directly attributable to the acquisition
of financial assets classified as at FVTPL are recognised
immediately in profit or loss.
All recognised financial assets that are within the scope
of IFRS 9 are required to be subsequently measured at
amortised cost or fair value on the basis of the entity’s
176
ABU DHABI COMMERCIAL BANK PJSCNOTES TO THE CONSOLIDATED FINANCIAL STATEMENTSDECEMBER 31, 2019
business model for managing the financial assets and
the contractual cash flow characteristics of the financial
assets. Specifically:
(i) debt instruments that are held within a business
model whose objective is to collect the contractual
cash flows, and that have contractual cash flows that
are solely payments of principal and interest on the
principal amount outstanding (SPPI), are subsequently
measured at amortised cost;
(ii) debt instruments that are held within a business
model whose objective is both to collect the con-
tractual cash flows and to sell the debt instruments,
and that have contractual cash flows that are SPPI, are
subsequently measured at fair value through other
comprehensive income (FVTOCI);
(iii) all other debt instruments (e.g. debt instruments
managed on a fair value basis, or held for sale) and
equity investments are subsequently measured at
FVTPL. However, the Group may make the following
irrevocable election/designation at the date of initial
application of IFRS 9 or at the date of initial recogni-
tion of a financial asset on an asset-by-asset basis:
• the Group may irrevocably elect to present subse-
quent changes in fair value of an equity investment
that is neither held for trading nor contingent
consideration recognised by an acquirer in a busi-
ness combination to which IFRS 3 applies, in other
comprehensive income (OCI) with dividend income
recognised in profit or loss; and
• the Group may irrevocably designate a debt instru-
ment that meets the amortised cost or FVTOCI
criteria as measured at FVTPL if doing so eliminates
or significantly reduces an accounting mismatch
(referred to as the fair value option).
The Group holds equity investments and mutual funds
as strategic investments and has elected to carry these
investments at FVTOCI with changes in fair value through
other comprehensive income.
(a) DEBT INSTRUMENTS AT AMORTISED COST OR AT FVTOCI
The Group assesses the classification and measurement
of a financial asset based on the contractual cash flow
characteristics of the asset and the Group’s business
model for managing the asset.
For an asset to be classified and measured at amortised
cost or at FVTOCI, its contractual terms should give rise
to cash flows that are solely payments of principal and
interest on the principal outstanding (SPPI).
For the purpose of SPPI test, principal is the fair value of
the financial asset at initial recognition. That principal
amount may change over the life of the financial asset
(e.g. if there are repayments of principal). Interest consists
of consideration for the time value of money, for the
credit risk associated with the principal amount outstand-
ing during a particular period of time and for other basic
lending risks and costs, as well as a profit margin. The SPPI
assessment is made in the currency in which the financial
asset is denominated.
Contractual cash flows that are SPPI are consistent with a
basic lending arrangement. Contractual terms that intro-
duce exposure to risks or volatility in the contractual cash
flows that are unrelated to a basic lending arrangement,
such as exposure to changes in equity prices or commod-
ity prices, do not give rise to contractual cash flows that
are SPPI. An originated or an acquired financial asset can
be a basic lending arrangement irrespective of whether it
is a loan in its legal form.
An assessment of business models for managing financial
assets is fundamental to the classification of a financial
asset. The Group determines the business models at
a level that reflects how groups of financial assets are
managed together to achieve a particular business objec-
tive. The Group’s business model does not depend on
management’s intentions for an individual instrument,
therefore the business model assessment is performed
at a higher level of aggregation rather than on an
instrument-by- instrument basis.
The Group has more than one business model for man-
aging its financial instruments which reflects how the
Group manages its financial assets in order to generate
cash flows. The Group’s business models determine
whether cash flows will result from collecting contractual
cash flows, selling financial assets or both.
At initial recognition of a financial asset, the Group deter-
mines whether newly recognised financial assets are part
of an existing business model or whether they reflect the
commencement of a new business model. The Group
reassess its business models during each reporting period
to determine whether the business models have changed
since the preceding period.
Debt instruments that are subsequently measured at
amortised cost or at FVTOCI are subject to impairment.
177

ABU DHABI COMMERCIAL BANK PJSCNOTES TO THE CONSOLIDATED FINANCIAL STATEMENTSDECEMBER 31, 2019
(b) FINANCIAL ASSETS AT FVTPL
Financial assets at FVTPL are:
(i) assets with contractual cash flows that are not
SPPI; or/and
(ii) assets that are held in a business model other than
held to collect contractual cash flows or held to
collect and sell; or
(iii) assets designated at FVTPL using the fair value option.
These assets are measured at fair value, with any gains/
losses arising on remeasurement recognised in profit
or loss.
(c) RECLASSIFICATIONS
If the business model under which the Group holds
financial assets changes, the financial assets affected are
reclassified. The classification and measurement require-
ments related to the new category apply prospectively
from the first day of the first reporting period following
the change in business model that results in reclassifying
the Group’s financial assets. Changes in contractual cash
flows are discussed under the accounting policy on mod-
ification and derecognition of financial assets.
(d) IMPAIRMENT
The Group recognises allowances for expected credit loss
(ECLs) on the following financial instruments that are not
measured at FVTPL:
• balances with central banks;
• deposits and balances due from banks;
• reverse-repo placements;
• debt investment securities;
• loans and advances to customers;
• loan commitments issued; and
• financial guarantee contracts issued.
No impairment loss is recognised on equity investments.
With the exception of purchased or originated credit
impaired financial assets (which are considered separately
below), ECLs are required to be measured through a loss
allowance at an amount equal to:
• 12-month ECL that result from those default events
on the financial instrument that are possible within
12 months after the reporting date, (referred to as
Stage 1); or
• full lifetime ECL that result from all possible default
events over the life of the financial instrument, (referred
to as Stage 2 and Stage 3).
A loss allowance for full lifetime ECL is required for a
financial instrument if the credit risk on that financial
instrument has increased significantly since initial rec-
ognition. For all other financial instruments, ECLs are
measured at an amount equal to the 12-month ECL. More
details on the determination of a significant increase in
credit risk are provided in Note 3.8(h).
ECLs are a probability- weighted estimate of the present
value of credit losses. These are measured as the present
value of the difference between the cash flows due to
the Group under the contract and the cash flows that
the Group expects to receive arising from the weighting
of multiple future economic scenarios, discounted at
the asset’s EIR. However, for unfunded exposures, ECL is
measured as follows:
• for undrawn loan commitments, the ECL is the dif-
ference between the present value of the contractual
cash flows that are due to the Group if the holder of the
commitment draws down the loan and the cash flows
that the Group expects to receive if the loan is drawn
down; and
• for financial guarantee contracts, the ECL is the differ-
ence between the expected payments to reimburse
the holder of the guaranteed debt instrument less any
amounts that the Group expects to receive from the
holder, the debtor or any other party.
Refer Note 42 for more details on measurement of ECL.
(e) CREDIT- IMPAIRED FINANCIAL ASSETS
A financial asset is “credit- impaired” when one or more
events that have a detrimental impact on the estimated
future cash flows of the financial asset have occurred.
Credit- impaired financial assets are referred to as Stage 3
assets. Evidence of credit- impairment includes observa-
ble data about the following events:
• significant financial difficulty of the borrower or issuer;
• a breach of contract such as a default or past due event;
• for economic or contractual reasons relating to the
borrower’s financial difficulty, concessions given to the
borrower that would not otherwise be considered;
• the disappearance of an active market for a security
because of financial difficulties; or
• the purchase of a financial asset at a deep discount that
reflects the incurred credit losses.
It may not be possible to identify a single discrete event —
instead, the combined effect of several events may have
caused financial assets to become credit- impaired.
The Group assesses whether debt instruments that are
financial assets measured at amortised cost or FVTOCI
are credit- impaired at each reporting date. To assess
178
ABU DHABI COMMERCIAL BANK PJSCNOTES TO THE CONSOLIDATED FINANCIAL STATEMENTSDECEMBER 31, 2019
if sovereign and corporate debt instruments are credit
impaired, the Group considers factors such as bond
yields, credit ratings and the ability of the borrower to
raise funding.
A loan is considered credit- impaired when a concession
is granted to the borrower due to a deterioration in the
borrower’s financial condition, unless there is evidence
that as a result of granting the concession the risk of not
receiving the contractual cash flows has reduced signif-
icantly and there are no other indicators of impairment.
For financial assets where concessions are contemplated
but not granted, the asset is deemed credit impaired
when there is observable evidence of credit- impairment
including meeting the definition of default. The definition
of default (see below) includes unlikeliness to pay indica-
tors and a backstop if amounts are overdue for 90 days
or more.
(f) PURCHASED OR ORIGINATED CREDIT- IMPAIRED
FINANCIAL ASSETS
The Group measures expected credit loss on a lifetime
basis for purchased or originated credit impaired finan-
cial assets (POCI) throughout the life of the instrument.
However, expected credit loss is not recognised in a
separate loss provision on initial recognition for POCI
instruments as the lifetime expected credit loss is inherent
within the gross carrying amount of the instruments. The
Group recognises the change in lifetime expected credit
losses arising subsequent to initial recognition in the
income statement and the cumulative changes as a loss
provision. Where lifetime expected credit losses on POCI
instruments are less than those at initial recognition, then
the favourable differences are recognised as impairment
gains in the income statement (and impairment loss
where the expected credit losses are greater).
(g) DEFINITION OF DEFAULT
Critical to the determination of ECL is the definition of
default. The definition of default is used in measuring the
amount of ECL and in the determination of whether the
loss allowance is based on 12-month or lifetime ECL, as
default is a component of the probability of default (PD)
which affects both the measurement of ECLs and the
identification of a significant increase in credit risk.
The Group considers the following as constituting an
event of default:
• the borrower is past due for more than 90 days on any
material credit obligation to the Group; or
• the borrower is unlikely to pay its credit obligations to
the Group in full.
The definition of default is appropriately tailored to reflect
different characteristics of different types of assets. The
decision to use cross- default is based on case by case
assessment of borrower and facility conditions such as
collateral and materiality of exposure.
When assessing if the borrower is unlikely to pay its credit
obligation, the Group takes into account both qualitative
and quantitative indicators. The information assessed
depends on the type of the asset, for example, in cor-
porate lending a qualitative indicator used is the breach
of covenants, which is not relevant for retail lending.
Quantitative indicators, such as overdue status and non-
payment on another obligation of the same counterparty
are key inputs in this analysis. The Group uses a variety of
sources of information to assess default which are either
developed internally or obtained from external sources.
(h) SIGNIFICANT INCREASE IN CREDIT RISK (SICR)
The Group monitors all financial assets, issued loan
commitments and financial guarantee contracts that
are subject to the impairment requirements to assess
whether there has been a significant increase in credit
risk since initial recognition. If there has been a significant
increase in credit risk, the Group will measure the loss
allowance based on lifetime rather than 12-month ECL.
In assessing whether the credit risk on a financial instru-
ment has increased significantly since initial recognition,
the Group compares the risk of a default occurring on
the financial instrument at the reporting date based
on the remaining maturity of the instrument with the
risk of a default occurring that was anticipated for the
remaining maturity at the current reporting date when the
financial instrument was first recognised. In making this
assessment, the Group considers both quantitative and
qualitative information that is reasonable and supporta-
ble, including historical experience and forward- looking
information that is available without undue cost or effort,
based on the Group’s historical experience and expert
credit assessment including forward- looking informa-
tion. For corporate lending, forward- looking information
includes the future prospects of the industries in which
the Group’s counterparties operate, obtained from eco-
nomic expert reports, financial analysts, governmental
bodies and other similar organisations, as well as consid-
eration of various internal and external sources of actual
and forecast economic information. For retail, lending
forward looking information includes the same economic
forecasts as corporate lending with additional forecasts
of local economic indicators, particularly for regions with
a concentration to certain industries, as well as internally
generated information of customer payment behaviour.
Refer Note 42 for more details about forward looking
information and criteria used to determine significant
increase in credit risk.
179
ABU DHABI COMMERCIAL BANK PJSCNOTES TO THE CONSOLIDATED FINANCIAL STATEMENTSDECEMBER 31, 2019
The Group uses different criteria to determine whether
credit risk has increased significantly per portfolio of
assets. The criteria used are both deterioration in internal/
external ratings as well as qualitative assessment. For
further details on SICR refer to Note 42.
Regardless of the analysis above, a significant increase in
credit risk is presumed if a customer is more than 30 days
past due in making a contractual payment.
The qualitative factors that indicate significant increase
in credit risk are reflected in PD models on a timely basis.
However, the Group still considers separately some
qualitative factors to assess if credit risk has increased
significantly. For corporate lending there is particular
focus on assets that are included on a “watch list” given
an exposure is on a watch list once there is a concern
that the creditworthiness of the specific counterparty has
deteriorated. For retail lending the Group considers credit
scores and events such as unemployment, bankruptcy or
death. As a back-stop when an asset becomes 30 days
past due, the Group considers that a significant increase
in credit risk has occurred and the asset is in stage 2 of the
impairment model, i.e. the loss allowance is measured as
the lifetime ECL.
(i) MODIFICATION AND DERECOGNITION OF FINANCIAL ASSETS
Modification of financial assets
A modification of a financial asset occurs when the con-
tractual terms governing the cash flows of a financial
asset are renegotiated or otherwise modified between
initial recognition and maturity of the financial asset. A
modification affects the amount and/or timing of the con-
tractual cash flows either immediately or at a future date.
In addition, the introduction or adjustment of existing
covenants of an existing loan would constitute a modi-
fication even if these new or adjusted covenants do not
yet affect the cash flows immediately but may affect the
cash flows depending on whether the covenant is or is
not met (e.g. a change to the increase in the interest rate
that arises when covenants are breached).
The Group renegotiates loans to customers in financial
difficulty to maximise collection and minimise the risk
of default. A loan forbearance is granted in cases where
although the borrower made all reasonable efforts to pay
under the original contractual terms, there is a high risk of
default or default has already happened and the borrower
is expected to be able to meet the revised terms. The
revised terms in most of the cases include an extension
of the maturity of the loan, changes to the timing of the
cash flows of the loan (principal and interest repayment),
reduction in the amount of cash flows due (principal and
interest forgiveness) and amendments to covenants.
When a financial asset is modified the Group assesses
whether this modification results in derecognition. In
accordance with the Group’s policy a modification results
in derecognition when it gives rise to substantially differ-
ent terms. To determine the substantially different terms
the Group considers the qualitative factors (i.e. contrac-
tual cash flows after modification, change in currency or
counterparty, interest rates, maturity, covenants) and a
quantitative assessment (i.e. compare the present value
of the remaining contractual cash flows under the original
terms with the contractual cash flows under the revised
terms, discounted at the original effective interest).
In case where the financial asset is derecognised the
loss allowance for ECL is remeasured at the date of
derecognition to determine net carrying amount of the
asset at that date. The difference between this revised
carrying amount and the fair value of the new financial
asset with the new terms will lead to a gain or loss on
derecognition. The new financial asset will have a loss
allowance measured based on 12-month ECL except in
the rare occasions where the new loan is considered to
be originated credit impaired. This applies only in the
case where the fair value of the new loan is recognised at
a significant discount to its revised par amount because
there remains a high risk of default which has not been
reduced by the modification. The Group monitors credit
risk of modified financial assets by evaluating qualitative
and quantitative information, such as if the borrower is in
past due status under the new terms.
When the contractual terms of a financial asset are modi-
fied and the modification does not result in derecognition,
the Group determines if the financial asset’s credit risk
has increased significantly since initial recognition by
comparing the credit rating at initial recognition and
the original contractual terms; with credit rating at the
reporting date based on the modified terms.
Where a modification does not lead to derecognition the
Group calculates the modification gain/loss comparing
the gross carrying amount before and after the modifi-
cation (excluding the ECL allowance). Then the Group
measures ECL for the modified asset, where the expected
cash flows arising from the modified financial asset are
included in calculating the expected cash shortfalls from
the original asset.
Derecognition of financial assets
The Group derecognises a financial asset only when
the contractual rights to the asset’s cash flows expire
(including expiry arising from a modification with sub-
stantially different terms), or when the financial asset and
substantially all the risks and rewards of ownership of
the asset are transferred to another entity. If the Group
180
ABU DHABI COMMERCIAL BANK PJSCNOTES TO THE CONSOLIDATED FINANCIAL STATEMENTSDECEMBER 31, 2019
neither transfers nor retains substantially all the risks and
rewards of ownership and continues to control the trans-
ferred asset, the Group recognises its retained interest in
the asset and an associated liability for amounts it may
have to pay. If the Group retains substantially all the risks
and rewards of ownership of a transferred financial asset,
the Group continues to recognise the financial asset
and also recognises a collateralised borrowing for the
proceeds received.
On derecognition of a financial asset in its entirety, the
difference between the asset’s carrying amount and the
sum of the consideration received and receivable and the
cumulative gain/loss that had been recognised in OCI
and accumulated in equity is recognised in profit or loss,
with the exception of equity investment designated as
measured at FVTOCI, where the cumulative gain/loss
previously recognised in OCI is not subsequently reclassi-
fied to profit or loss but is transferred to retained earnings.
(j) PRESENTATION OF ALLOWANCE FOR ECL
Loss allowances for ECL are presented in the consolidated
financial statements as follows:
• for financial assets measured at amortised cost (loans
and advances, balances due from central banks and
other banks, reverse-repo placements and other
financial assets): as a deduction from the gross carrying
amount of the assets;
• for debt instruments measured at FVTOCI: as part
of revaluation reserve of investments designated
at FVTOCI and recognised in other comprehensive
income; and
• for loan commitments and financial guarantee con-
tracts: as a provision.
FINANCIAL LIABILITIES
Financial liabilities are classified as either financial liabilities
at “FVTPL” or “other financial liabilities”. The classification
of financial liabilities at initial recognition depends on
the purpose and management’s intention for which the
financial liabilities were incurred and their characteristics.
Financial liabilities are recognised in the Group’s balance
sheet when the Group becomes a party to the contrac-
tual provisions of the instrument. Financial liabilities are
initially measured at fair value. Transaction costs that are
directly attributable to the acquisition or issue of financial
liabilities (other than financial liabilities at FVTPL) are
deducted from the fair value of the financial liabilities,
as appropriate, on initial recognition. Transaction costs
directly attributable to the acquisition of financial liabilities
at FVTPL are recognised immediately in profit or loss.
If the transaction price differs from fair value at initial
recognition, the Group will account for such difference
as follows:
• if fair value is evidenced by a quoted price in an active
market for an identical liability or based on a valuation
technique that uses only data from observable markets,
then the difference is recognised in profit or loss on
initial recognition (i.e. day 1 profit or loss);
• in all other cases, the fair value will be adjusted to bring
it in line with the transaction price (i.e. day 1 profit or
loss will be deferred by including it in the initial carrying
amount of the liability).
Financial liabilities are subsequently measured at amor-
tised cost except for financial liabilities at fair value
through profit or loss. Gains and losses on financial
liabilities, other than derivative instruments, designated at
fair value through profit or loss are presented partially in
other comprehensive income (the amount of change in
fair value of the financial liability that is attributable to the
changes in credit risk of that liability, which is determined
as the amount that is not attributable to changes in market
conditions that give rise to market risk) and partially in
profit or loss (the remaining amount of change in the fair
value of the liability). This is unless such a presentation
would create, or enlarge, an accounting mismatch, in
which case the gains or losses attributable to changes
in the credit risk of the liability are also presented in the
profit or loss.
DERECOGNITION OF FINANCIAL LIABILITIES
Financial liabilities are derecognised when they are extin-
guished (i.e. when the obligation specified in the contract
is discharged, cancelled or expires).
The exchange between the Group and its original lenders
of debt instruments with substantially different terms, as
well as substantial modifications of the terms of existing
liabilities, are accounted for as an extinguishment of the
original financial liability and a recognition of a new finan-
cial liability. The terms are substantially different if the
discounted present value of the cash flows under the new
terms, including any fees paid net of any fees received and
discounted using the original effective interest rate, is at
least 10% different from the discounted present value of
the remaining cash flows of the original financial liability.
In addition, other qualitative factors such as, currency
that the instrument is denominated in, changes in the
type of interest rate, new conversion features attached to
the instrument and change in covenants are also taken
into consideration. If an exchange of debt instruments or
modification of terms is accounted for as an extinguish-
ment, any cost or fees incurred is recognised as part of
the gain or loss on extinguishment. If an exchange or
modification is not accounted for as an extinguishment,
181
ABU DHABI COMMERCIAL BANK PJSCNOTES TO THE CONSOLIDATED FINANCIAL STATEMENTSDECEMBER 31, 2019
any cost or fees incurred adjust the carrying amount of
the liability and are amortised using EIR method over the
remaining term of the modified liability.
3.9 FOREIGN CURRENCIES
Items included in the financial statements of each of
the Group’s entities are measured using the currency of
the primary economic environment in which the entity
operates (the “functional currency”). The consolidated
financial statements of the Group are presented in AED,
which is the Group’s functional and presentation currency.
Foreign currency transactions are translated into the func-
tional currency using the exchange rates prevailing on the
dates of the transaction. Monetary assets and liabilities
denominated in foreign currencies are translated into the
functional currency at the rate of exchange prevailing
at the statement of financial position date. Any resulting
exchange differences are included in the consolidated
income statement. Non- monetary assets and liabilities
are translated at historical exchange rates or year-end
exchange rates if held at fair value, as appropriate. The
resulting foreign exchange gains or losses are recognised
in either consolidated income statement or consolidated
other comprehensive income statement depending upon
the nature of the asset or liability.
In the consolidated financial statements, the results and
financial positions of branches and subsidiaries whose
functional currency is not AED, are translated into the
Group’s presentation currency as follows:
(a) assets and liabilities at the rate of exchange prevailing
at the statement of financial position date;
(b) income and expenses at the average rates of exchange
for the reporting period; and
(c) all resulting exchange differences arising from the
retranslation of opening assets and liabilities and
arising from retranslation of the result for the reporting
period from the average rate to the exchange rate
prevailing at the period end are recognised in other
comprehensive income and accumulated in equity
under “foreign currency translation reserve” (Note 22).
On disposal or partial disposal (i.e. of associates or jointly
controlled entities not involving a change of account-
ing basis) of a foreign operation, exchange differences
relating thereto and previously recognised in reserves are
recognised in the consolidated income statement on a
proportionate basis, except in the case of partial disposal
(i.e. no loss of control) of a subsidiary that includes a
foreign operation, where the proportionate share of
accumulated exchange differences are re- attributed to
non- controlling interests and are not recognised in the
consolidated income statement.
3.10 OFFSETTING
Financial assets and liabilities are offset and reported
net in the consolidated statement of financial position
only when there is a legally enforceable right to set off
the recognised amounts and when the Group intends
to settle either on a net basis, or to realise the asset and
settle the liability simultaneously. Income and expenses
are presented on a net basis only when permitted by the
accounting standards, or for gains and losses arising from
a group of similar transactions such as in the Group’s
trading activity.
The Group is party to a number of arrangements, includ-
ing master netting agreements that give it the right to
offset financial assets and financial liabilities but, where it
does not intend to settle the amounts net or simultane-
ously, the assets and liabilities concerned are presented
on a gross basis.
3.11 SALE AND REPURCHASE AGREEMENTS
Securities sold subject to a commitment to repurchase
them at a predetermined price at a specified future date
(repos) are continued to be recognised in the consol-
idated statement of financial position and a liability is
recorded in respect of the consideration received under
borrowings. The difference between sale and repurchase
price is treated as interest expense using the effective
interest rate yield method over the life of the agreement.
Assets purchased with a corresponding commitment to
resell at a specified future date (reverse repos) are not
recognised in the consolidated statement of financial
position. Amounts placed under these agreements are
included in reverse-repo placements. The difference
between purchase and resale price is treated as interest
income using the effective yield method over the life of
the agreement.
3.12 SECURITIES BORROWING AND LENDING
Securities borrowing and lending transactions are usually
secured by cash or securities advanced by the borrower.
Borrowed securities are not recognised in the statement
of financial position nor are lent securities derecognised.
Cash collateral received or given is treated as a financial
asset or liability. However, where securities borrowed are
transferred to third parties, a liability for the obligation to
return the securities to the stock lending counterparty is
recorded. The securities borrowing and lending activity
arrangements are generally entered into through repos
and reverse repos.
3.13 CASH AND CASH EQUIVALENTS
Cash and cash equivalents include cash on hand, bal-
ances held with central banks, deposits and balances due
from banks, due to banks, items in the course of collec-
tion from or in transmission to other banks and highly
182
ABU DHABI COMMERCIAL BANK PJSCNOTES TO THE CONSOLIDATED FINANCIAL STATEMENTSDECEMBER 31, 2019
liquid assets with original maturities of less than three
months from the date of acquisition, which are subject
to insignificant risk of changes in their fair value, and are
used by the Group in the management of its short-term
commitments. Cash and cash equivalents are carried at
amortised cost in the statement of financial position.
3.14 AMORTISED COST MEASUREMENT
The amortised cost of a financial asset or liability is the
amount at which the financial asset or liability is measured
at initial recognition, minus principal repayments, plus or
minus the cumulative amortisation using the effective
interest method of any difference between the initial
amount recognised and the maturity amount, minus any
reduction for impairment. The effective interest rate is
the rate that exactly discounts estimated future cash pay-
ments through the expected life of the financial liability,
or, where appropriate, a shorter period to the net carrying
amount of the financial asset or financial liability.
3.15 FAIR VALUE MEASUREMENT
The Group measures its financial assets and liabilities at
market price that it would receive to sell an asset or pay
to transfer a liability in an orderly transaction between
market participants at the measurement date in the prin-
cipal market, or in its absence in the most advantageous
market for the assets or liabilities. The Group considers
principal market as the market with the greatest volume
and level of activity for financial assets and liabilities.
The Group measures its non- financial assets at a price
that take into account a market participant’s ability to
generate economic benefits by using the assets for their
highest and best use.
Fair value is the price that would be received to sell an
asset or paid to transfer a liability in an orderly transaction
between market participants at the measurement date in
the principal, or in its absence, the most advantageous
market to which the Group has access at that date under
current market conditions regardless of whether that
price is directly observable or estimated using another
valuation technique. The fair value of a liability reflects its
non- performance risk.
When applicable, the Group measures the fair value of an
instrument using the quoted price in an active market for
that instrument. A market is regarded as active if transac-
tions for the asset or liability takes place with sufficient
frequency and volume to provide pricing information on
an ongoing basis.
When there is no quoted price in an active market, the
Group uses valuation techniques that maximise the use
of relevant observable inputs and minimise the use of
unobservable inputs. The chosen valuation technique
incorporates all the factors that market participants would
take into account into pricing a transaction.
The best evidence of the fair value of a financial instru-
ment at initial recognition is normally the transaction
price, i.e. the fair value of the consideration given or
received. If the Group determines that the fair value at
initial recognition differs from the transaction price and
the fair value is evidenced neither by a quoted price in
an active market for an identical asset or a liability nor
based on valuation technique that uses only data from
observable markets, the instrument is initially measured
at fair value, adjusted to defer the difference between the
fair value at initial recognition and the transaction price.
Subsequently, the difference is recognised in profit or loss
on an appropriate basis over the life of the instrument but
no later than when the valuation is supported wholly by
observable market data or the transaction is closed out.
If an asset or a liability measured at fair value has a bid
and an ask price, the Group measures assets and long
positions at a bid price and liabilities and short positions
at an ask price.
Portfolios of financial assets and financial liabilities
that are exposed to market risk and credit risk that are
managed by the Group on the basis of the net exposure to
either the market or credit risk, are measured on the basis
of a price that would be received to sell a net long position
(or paid to transfer a net short position) for a particular risk
exposure. Those portfolio-level adjustments are allocated
to the individual assets and liabilities on the basis of the
relative risk adjustment of each of the individual instru-
ments in the portfolio.
Different levels of fair value hierarchy based on the inputs
to valuation techniques are discussed in Note 40. The
Group’s policy is to recognise transfers into and transfers
out of fair value hierarchy levels as of the date of the event
or change in circumstances that caused the transfer.
3.16 DERIVATIVES
A derivative financial instrument is a financial contract
between two parties where payments are dependent
upon movements in the price of one or more underlying
financial instrument, reference rate or index.
Derivative financial instruments are initially measured at
fair value at trade date, and are subsequently re- measured
at fair value at the end of each reporting period. All deriva-
tives are carried at their fair values as assets where the fair
values are positive and as liabilities where the fair values are
negative. Derivative assets and liabilities arising from differ-
ent transactions are only offset if the transactions are with
the same counterparty, a legal right of offset exists and the
parties intend to settle the cash flows on a net basis.
183
ABU DHABI COMMERCIAL BANK PJSCNOTES TO THE CONSOLIDATED FINANCIAL STATEMENTSDECEMBER 31, 2019
Derivative fair values are determined from quoted prices
in active markets where available. Where there is no active
market for an instrument, fair value is derived from prices
for the derivative’s components using appropriate pricing
or valuation models.
The method of recognising fair value gains and losses
depends on whether derivatives are held for trading or are
designated as hedging instruments, and if the latter, the
nature of the risks being hedged. All gains and losses from
changes in the fair value of derivatives held for trading are
recognised in the consolidated income statement under
“net gain on dealing in derivatives” (Note 29).
3.17 HEDGE ACCOUNTING
Derivatives designated as hedges are classified as either:
(i) hedges of the change in the fair value of recognised
assets or liabilities or firm commitments (“fair value
hedges”); (ii) hedges of the variability in future cash
flows attributable to a particular risk associated with a
recognised asset or liability, or a highly probable forecast
transaction that could affect future reported net income
(“cash flow hedges”); or (iii) a hedge of a net investment
in a foreign operation (“net investment hedges”). Hedge
accounting is applied to derivatives designated in this way
provided certain criteria are met.
At the inception of a hedging relationship, to qualify for
hedge accounting, the Group documents the relationship
between the hedging instruments and the hedged items
as well as its risk management objective and its strategy
for undertaking the hedge. The Group also requires a
documented assessment, both at hedge inception and on
an ongoing basis, of whether or not the hedging instru-
ments, primarily derivatives, that are used in hedging
transactions are highly effective in offsetting the changes
attributable to the hedged risks in the fair values or cash
flows of the hedged items. Interest income and expense
on designated qualifying hedge instruments is included in
“Net interest income”.
FAIR VALUE HEDGES
Where a hedging relationship is designated as a fair value
hedge, the hedged item is adjusted for the change in fair
value in respect of the risk being hedged. Gains or losses
on the changes in fair value of both the derivative and the
hedged item attributable to hedged risk are recognised
in the consolidated income statement and the carrying
amount of the hedged item is adjusted accordingly. If the
derivative expires, is sold, terminated, exercised, no longer
meets the criteria for fair value hedge accounting or the
designation is revoked, hedge accounting is discontinued.
Any adjustment up to that point to the carrying value of
a hedged item, for which the effective interest method is
used, is amortised in the consolidated income statement
as part of the recalculated effective interest rate over the
period to maturity or derecognition.
CASH FLOW HEDGES
The effective portion of changes in the fair value of deriv-
atives and other qualifying hedging instruments that are
designated and qualify as cash flow hedges is recognised
in other comprehensive income and accumulated under
cash flow hedge reserve. The cash flow hedge reserve is
adjusted to the lower of the cumulative gain or loss on
the hedging instrument and the cumulative change in
fair value of the hedged item. The gain or loss relating to
the ineffective portion is recognised immediately in the
consolidated income statement.
Amounts previously recognised in other comprehensive
income and accumulated in equity are reclassified to
consolidated income statement in the periods when the
hedged item affects profit or loss, in the same line as
the recognised hedged item. However, when the hedged
forecast transaction results in the recognition of a non-
financial asset or a non- financial liability, the gains and
losses previously recognised in other comprehensive
income and accumulated in equity are removed from
equity and included in the initial measurement of the cost
of the non- financial asset or non- financial liability. This
transfer does not affect other comprehensive income.
Furthermore, if the Group expects that some or all of the
loss accumulated in other comprehensive income will not
be recovered in the future, that amount is immediately
reclassified to profit or loss.
Hedge accounting is discontinued only when the hedging
relationship (or a part thereof) ceases to meet the qual-
ifying criteria. This includes instances when the hedging
instrument expires or is sold, terminated or exercised. The
discontinuation is accounted for prospectively. Any gain
or loss recognised in other comprehensive income and
accumulated in equity at that time remains in equity and
is recognised when the forecast transaction is ultimately
recognised in profit or loss. When a forecast transaction
is no longer expected to occur, the gain or loss accumu-
lated in equity is recognised immediately in profit or loss.
NET INVESTMENT HEDGE
Hedges of net investments in foreign operations are
accounted for in a similar way to cash flow hedges.
A gain or loss on the effective portion of the hedging
instrument is recognised in other comprehensive income
and held in the net investment hedge reserve. The gain
or loss relating to the ineffective portion is recognised
immediately in the consolidated income statement.
Gains and losses accumulated in equity are reclassified
from other comprehensive income and included in the
consolidated income statement on the disposal of the
foreign operation.
184

ABU DHABI COMMERCIAL BANK PJSCNOTES TO THE CONSOLIDATED FINANCIAL STATEMENTSDECEMBER 31, 2019
HEDGE EFFECTIVENESS TESTING
To qualify for hedge accounting, the Group requires that
at the inception of the hedge and through its life, each
hedge must be expected to be highly effective (prospec-
tive effectiveness) and demonstrate actual effectiveness
(retrospective effectiveness) on an ongoing basis.
The documentation of each hedging relationship sets
out how the effectiveness of the hedge is assessed. The
method the Group adopts for assessing hedge effective-
ness depends on its risk management strategy.
For prospective effectiveness, the hedging instrument
must be expected to be highly effective in offsetting
changes in fair value or cash flows attributable to the
hedged risk during the period for which the hedge is
designated. For actual effectiveness to be achieved, the
changes in fair value or cash flows must offset each
other in the range of 80 per cent to 125 per cent. Hedge
ineffectiveness is recognised in the consolidated income
statement.
DERIVATIVES THAT DO NOT QUALIFY FOR HEDGE ACCOUNTING
All gains and losses from changes in the fair values of
derivatives that do not qualify for hedge accounting are
recognised immediately in the consolidated income
statement in “net gains from dealing in derivatives” under
net trading income (Note 29).
3.18 TREASURY SHARES AND CONTRACTS ON OWN SHARES
Own equity instruments of the Group which are acquired
by the Group or any of its subsidiaries (treasury shares)
are deducted from other reserves and accounted for at
weighted average cost. Consideration paid or received
on the purchase, sale, issue or cancellation of the Group’s
own equity instruments is recognised directly in equity.
No gain or loss is recognised in the consolidated income
statement on the purchase, sale, issue or cancellation of
own equity instruments.
Contracts on own shares that require physical settlement
of a fixed number of own shares for a fixed consideration
are classified as equity and added to or deducted from
equity. Contracts on own shares that require net cash
settlement or provide a choice of settlement are classified
as trading instruments and changes in the fair value are
reported in the consolidated income statement.
3.19 FINANCIAL GUARANTEES
Financial guarantees are contracts that require the Group
to make specified payments to reimburse the holder for
a loss it incurs because a specified party fails to meet its
obligation when due in accordance with the contrac-
tual terms.
Financial guarantee contracts are initially recognised
at their fair value, which is likely to equal the premium
received on issuance. The received premium is amortised
over the life of the financial guarantee. The guarantee
liability (the notional amount) is subsequently recognised
at the higher of this amortised amount and the present
value of any expected payments (when a payment under
guarantee has become probable). The premium received
on these financial guarantees is included within other
liabilities.
3.20 ACCEPTANCES
Acceptances arise when the Bank is under an obligation to
make payments against documents drawn under letters
of credit. Acceptances specify the amount of money, the
date and the person to which the payment is due. After
acceptance, the instrument becomes an unconditional
liability (time draft) of the Bank and is therefore recog-
nised as a financial liability in the consolidated statement
of financial position with a corresponding contractual
right of reimbursement from the customer recognised as
a financial asset.
3.21 COLLATERAL REPOSSESSED
The Bank acquires collaterals in settlement of certain
loans and advances. These collaterals are recognised at
net realisable value on the date of acquisition and are
classified as investment properties. Subsequently, the fair
value is determined on a periodic basis by independent
professional valuers. Fair value adjustments on these
collaterals are included in the consolidated income state-
ment in the period in which these gains or losses arise.
3.22 INVESTMENT PROPERTIES
Investment property is property held either to earn rental
income or for capital appreciation or both, but not for sale
in the ordinary course of business, use in the production
or supply of goods or services or for administrative pur-
poses. Investment property is reflected at valuation based
on fair value at the statement of financial position date.
Refer Note 3.15 for policy on fair valuation.
The fair value is determined on a periodic basis by inde-
pendent professional valuers. Fair value adjustments on
investment property are included in the consolidated
income statement in the period in which these gains or
losses arise.
Investment properties under development that are being
constructed or developed for future use as investment
property are measured initially at cost including all direct
costs attributable to the design and construction of the
property including related staff costs. Subsequent to initial
recognition, investment properties under development
are measured at fair value. Gains and losses arising from
185
ABU DHABI COMMERCIAL BANK PJSCNOTES TO THE CONSOLIDATED FINANCIAL STATEMENTSDECEMBER 31, 2019
changes in the fair value of investment property under
development is included in the consolidated income
statement in the period in which they arise.
An investment property is derecognised upon disposal or
when the investment property and investment property
under development are permanently withdrawn from
use and no future economic benefits are expected from
the disposal. Any gain or loss arising on derecognition of
the property (calculated as the difference between net
disposal proceeds and the carrying amount of the asset)
in included in profit or loss in the period in which the
property is derecognised.
3.23 PROPERTY AND EQUIPMENT
Property and equipment are stated at cost less accu-
mulated depreciation and impairment loss, if any. Cost
includes expenditure that is directly attributable to the
acquisition of the asset.
Depreciation is charged to the consolidated income
statement so as to write off the depreciable amount of
property and equipment over their estimated useful lives
using the straight-line method. The depreciable amount
is the cost of an asset less its residual value. Land is not
depreciated.
Estimated useful lives are as follows:
Freehold properties 15 to 40 years
Leasehold and freehold improvements 7 to 10 years
Furniture, equipment and vehicles 3 to 5 years
Computer equipment, software and
accessories 4 to 10 years
Changes in the expected useful life are accounted for by
changing the depreciation period or method, as appro-
priate, and treated as changes in accounting estimates.
Property and equipment is derecognised on disposal or
when no future economic benefits are expected from
its use. Gain or loss arising on the disposal or retirement
of an asset is determined as the difference between the
sales proceeds and the carrying amount of the asset at
that date and is recognised in the consolidated income
statement.
3.24 CAPITAL WORK IN PROGRESS
Capital work in progress is stated at cost. When the asset
is ready for use, capital work in progress is transferred to
the appropriate property and equipment category and
depreciated in accordance with the Group’s policies.
3.25 INTANGIBLE ASSETS
An intangible asset is recognised only when its cost can
be measured reliably and it is probable that the expected
future economic benefits that are attributable to it will
flow to the Group. Intangible assets acquired separately
or in a business combination (other than goodwill) are
measured on initial recognition at fair value and sub-
sequently at cost less accumulated amortisation and
impairment loss.
The useful lives of intangible assets are assessed to be
either finite or indefinite. Intangible assets with finite lives
are amortised over the useful economic life. The amortisa-
tion period and the amortisation method for an intangible
asset with a finite useful life are reviewed at the end of
each reporting period. Changes in the expected useful life
or the expected pattern of consumption of future eco-
nomic benefits embodied in the asset are accounted for
by changing the amortisation period or method, as appro-
priate, and treated as changes in accounting estimates and
accounted for on a prospective basis. The amortisation
expense on intangible assets with finite lives is recognised
in the consolidated income statement.
An intangible asset is derecognised on disposal or when
no future economic benefits are expected from use.
Gains or losses arising from derecognition of an intan-
gible asset, measured as the difference between the net
disposal proceeds and the carrying amount of the asset,
are recognised in consolidated income statement when
the asset is derecognised.
3.26 BORROWING COSTS
Borrowing costs directly attributable to the acquisition or
construction of qualifying assets, which are assets that
necessarily take a substantial period of time to get ready
for their intended use are added to the cost of those
assets, until such time as the assets are substantially ready
for their intended use.
All other borrowing costs are recognised in the con-
solidated income statement in the period in which they
are incurred.
3.27 IMPAIRMENT OF NON- FINANCIAL ASSETS
At each consolidated statement of financial position
date, the Group reviews the carrying amounts of its
non- financial assets to determine whether there is any
indication that those assets have suffered an impairment
loss. If any such indication exists, the recoverable amount
of the assets is estimated in order to determine the extent
of the impairment loss (if any). Where it is not possible to
estimate the recoverable amount of an individual asset,
the Group estimates the recoverable amount of the cash-
generating unit to which the asset belongs.
186
ABU DHABI COMMERCIAL BANK PJSCNOTES TO THE CONSOLIDATED FINANCIAL STATEMENTSDECEMBER 31, 2019
Recoverable amount is the higher of fair value less costs
to sell and value in use. In assessing value in use, the esti-
mated future cash flows are discounted to their present
value using a pre-tax discount rate that reflects current
market assessments of the time value of money and the
risks specific to the asset for which the estimates of future
cash flows have not been adjusted.
If the recoverable amount of an asset (or cash- generating
unit) is estimated to be less than its carrying amount, the
carrying amount of the asset (cash- generating unit) is
reduced to its recoverable amount. An impairment loss
is recognised in the consolidated income statement,
unless the relevant asset is carried at a revalued amount,
in which case the impairment loss is treated as a revalua-
tion decrease.
Where an impairment loss subsequently reverses, the
carrying amount of the asset (cash- generating unit)
is increased to the revised estimate of its recoverable
amount, such that the increased carrying amount does
not exceed the carrying amount that would have been
determined had no impairment loss been recognised for
the asset (cash- generating unit) in prior years. A reversal
of an impairment loss is recognised in the consolidated
income statement, unless the relevant asset is carried
at a revalued amount, in which case the reversal of the
impairment loss is treated as a revaluation increase.
3.28 EMPLOYEE BENEFITS
(i) Employees’ end of service benefits
(a) Defined benefit plan
A defined benefit plan is a post- employment benefit
plan other than a defined contribution plan. The liabil-
ity recognised in the statement of financial position in
respect of defined benefit gratuity plans is the present
value of the defined benefit obligation at the end of the
reporting period together with adjustments for unrecog-
nised past- service costs. The defined benefit obligation
is calculated annually by independent actuaries using the
projected unit credit method. The present value of the
defined benefit obligation is determined by discounting
the estimated future cash outflows using interest rates
of high- quality corporate bonds that are denominated in
the currency in which the benefits will be paid, and that
have terms to maturity approximating to the terms of the
related pension obligation.
Past- service costs are recognised immediately in income,
unless the changes to the gratuity plan are conditional
on the employees remaining in service for a specified
period of time (the vesting period). In this case, the past-
service costs are amortised on a straight-line basis over
the vesting period.
Remeasurements of the net defined benefit liability,
which comprise actuarial gains and losses are recognised
immediately in other comprehensive income. Actuarial
gains and losses comprise experience adjustments (the
effects of differences between the previous actuarial
assumptions and what has actually occurred), as well as
the effects of changes in actuarial assumptions.
The Group provides end of service benefits for its expatri-
ate employees. The entitlement to these benefits is based
upon the employees’ length of service and completion of
a minimum service period. The expected costs of these
benefits are accrued over the period of employment.
(b) Defined contribution plan
A defined contribution plan is a post- employment benefit
plan under which an entity pays fixed contributions into
a separate entity and will have no legal or constructive
obligation to pay further amounts. Obligations for
contributions to defined contribution pension plans are
recognised as an employee benefit expense in consol-
idated income statement in the periods during which
services are rendered by employees.
Pension contributions are made by the Group to the Abu
Dhabi Retirement Pensions and Benefits Fund for UAE
citizens in accordance with UAE Federal Law No. 7 of 1999
and to respective pension authorities for other employees
including GCC Nationals as per applicable laws.
(ii) Termination benefits
Termination benefits are recognised as an expense when
the Group is committed demonstrably, without realistic
possibility of withdrawal, to a formal detailed plan to either
terminate employment before the normal retirement date,
or to provide termination benefits as a result of an offer
made to encourage voluntary redundancy. Termination
benefits for voluntary redundancies are recognised if the
Group has made an offer of voluntary redundancy, it is
probable that the offer will be accepted, and the number
of acceptances can be estimated reliably. If benefits are
payable more than 12 months after the reporting date,
then they are discounted to their present value.
(iii) Short-term employee benefits
Short-term employee benefit obligations are measured
on an undiscounted basis and are expensed as the related
service is provided. A liability is recognised for the amount
expected to be paid under short-term cash bonus or
profit- sharing plans if the Group has a present legal or
constructive obligation to pay this amount as a result of
past service provided by the employee and the obligation
can be estimated reliably.
187
ABU DHABI COMMERCIAL BANK PJSCNOTES TO THE CONSOLIDATED FINANCIAL STATEMENTSDECEMBER 31, 2019
(iv) Employees’ incentive plan shares
The cost of the equity- settled share-based payments is
expensed over the vesting period, based on the Group’s
estimate of equity instruments that will eventually vest.
At the end of each reporting period, the Group revises its
estimate of the number of equity instruments expected to
vest. The impact of the revision of the original estimates, if
any, is recognised in the consolidated income statement
over the remaining vesting period, with a corresponding
adjustment to the employees’ incentive plan reserve.
Where the terms of an equity-settled award are modified,
the minimum expense recognised is the expense as if the
terms had not been modified. An additional expense is
recognised for any modification which increases the total
fair value of the share-based payment arrangement or is
otherwise beneficial to the employee as measured at the
date of modification.
Where an equity-settled award is cancelled, it is treated
as if it had vested on the date of cancellation, and any
expense not yet recognised for the award is recognised
immediately. This includes any award where non-vesting
conditions within the control of either the entity or the
counterparty are not met. However, if a new award is
substituted for the cancelled award, and designated as
a replacement award on the date that it is granted, the
cancelled and new awards are treated as if they were a
modification of the original award, as described in the
previous paragraph.
The dilutive effect of outstanding incentive plan shares is
reflected in the computation of diluted earnings per share
(Note 33).
3.29 PROVISIONS AND CONTINGENT LIABILITIES
Provisions are recognised when the Group has a present
legal or constructive obligation as a result of past events
and it is probable that an outflow of resources embodying
economic benefits will be required to settle the obligation
and a reliable estimate of the amount of the obligation
can be made. Where a provision is measured using the
cash flows estimated to settle the present obligation, its
carrying amount is the present value of those cash flows.
Provisions for onerous contracts are recognised when
the expected benefits to be derived by the Group from a
contract are lower than the unavoidable cost of meeting
its obligation under the contract. The provision is meas-
ured at the present value of the lower of the expected
cost of terminating the contract and the expected net
cost of continuing with the contract. Before a provision is
established, the Group recognises any impairment loss on
the assets associated with that contract.
When some or all of the economic benefits required to
settle a provision are expected to be recovered from a
third party, a receivable is recognised as an asset only if it
is virtually certain that reimbursement will be received and
the amount of the receivable can be measured reliably.
Contingent liabilities, which include certain guarantees
and letters of credit, are possible obligations that arise
from past events whose existence will be confirmed only
by the occurrence, or non- occurrence, of one or more
uncertain future events not wholly within the Group’s
control; or are present obligations that have arisen from
past events but are not recognised because it is not prob-
able that settlement will require outflow of economic
benefits, or because the amount of the obligations
cannot be reliably measured. Contingent liabilities are
not recognised in the consolidated financial statements
but are disclosed in the notes to the consolidated financial
statements, unless they are remote.
3.30 SEGMENT REPORTING
A segment is a distinguishable component of the Group
that is engaged either in providing products or services
(business segment), or in products or services within
a particular economic environment (geographical
segment), which is subject to risks and rewards that are
different from those of other segments.
Refer to Note 38 on Business Segment reporting.
3.31 TAXATION
Provision is made for taxes at rates enacted or substan-
tively enacted as at statement of financial position date
on taxable profits of overseas branches and subsidiaries
in accordance with the fiscal regulations of the respective
countries in which the Group operates.
3.32 REVENUE AND EXPENSE RECOGNITION
Revenue is recognised to the extent that it is probable
that the economic benefits will flow to the Group and the
revenue can be reliably measured. The following specific
recognition criteria must also be met before revenue is
recognised.
(i) Interest income and expense
Interest income and expense for all financial instruments
except for those classified as held for trading or those
measured or designated at fair value through profit or loss
(FVTPL) are recognised in “net interest income” as “inter-
est income” and “interest expense” in the profit or loss
account using the effective interest method. Interest on
financial instruments classified as held for trading or those
measured or designated at FVTPL is recognised in “Net
gains from trading securities” under “Net trading income”.
188

ABU DHABI COMMERCIAL BANK PJSCNOTES TO THE CONSOLIDATED FINANCIAL STATEMENTSDECEMBER 31, 2019
The effective interest rate (EIR) is the rate that exactly
discounts estimated future cash flows of the financial
instrument through the expected life of the financial
instrument or, where appropriate, a shorter period, to
the net carrying amount of the financial asset or financial
liability. The future cash flows are estimated taking into
account all the contractual terms of the instrument. The
calculation of the EIR includes all fees and points paid or
received between parties to the contract that are incre-
mental and directly attributable to the specific lending
arrangement, transaction costs, and all other premiums
or discounts. For financial assets at FVTPL transaction
costs are recognised in profit or loss at initial recognition.
(ii) Dividend income
Dividend income is recognised on the ex- dividend
date when the Group’s right to receive the payment is
established.
(iii) Fee and commission income
The Group earns fee and commission income from a
diverse range of services it provides to its customers. Fee
income can be divided into the following two categories:
(a) Fee income earned from services that are provided
over a certain period of time
Fees earned for the provision of services over a period
of time are accrued over that period. These fees include
commission income and asset management, custody and
other management and advisory fees.
Loan commitment fees for loans that are likely to be
drawn down and other credit related fees are deferred
(together with any incremental costs) and recognised as
an adjustment to the effective interest rate on the loan.
When it is unlikely that a loan will be drawn down, the loan
commitment fees are recognised over the commitment
period on a straight line basis.
(b) Fee income from providing transaction services
Fees arising from negotiating or participating in the
negotiation of a transaction for a third party, such as
the arrangement of the acquisition of shares or other
securities or the purchase or sale of businesses, are rec-
ognised on completion of the underlying transaction.
Fees or components of fees that are linked to a certain
performance are recognised after fulfilling the corre-
sponding criteria.
3.33 ISLAMIC FINANCING
The Group engages in Shari’ah-compliant Islamic banking
activities through various Islamic instruments such as
Murabaha, Ijara, Musharaka, Salam, Mudaraba, Sukuk
and Wakala.
MURABAHA FINANCING
A sale contract whereby the Group sells to a customer
commodities and other assets at an agreed upon profit
mark up on cost. The Group purchases the assets based
on a promise received from customer to buy the item
purchased according to specific terms and conditions.
Profit from Murabaha is quantifiable at the commence-
ment of the transaction. Such income is recognised as it
accrues over the period of the contract on effective profit
rate method on the balance outstanding.
IJARA FINANCING
Ijara financing is an agreement whereby the Group
(lessor) leases or constructs an asset based on the cus-
tomer’s (lessee) request and promise to lease the assets
for a specific period against certain rent instalments. Ijara
could end in transferring the ownership of the asset to
the lessee at the end of the lease period. Also, the Group
transfers substantially all the risks and rewards related
to the ownership of the leased asset to the lessee. Ijara
income is recognised on an effective profit rate basis over
the lease term.
MUSHARAKA
Musharaka is an Islamic contract in which two parties
(Islamic financial institution and its customer) pool their
respective funds to form a partnership. In Musharaka both
parties are involved in management of the business/part-
nership. Profit is shared on the basis of pre- agreed ratio
and loss is shared in the ratio of capital contribution. It’s
not mandatory in Musharaka for all parties to participate
in the management of business. Practically, this form of
investment is used by the Islamic financial institution to
finance its customers.
MUDARABA
A contract between the Group and a customer, whereby
one party provides the funds (Rab Al Mal) and the other
party (the Mudarib) invests the funds in a project or a par-
ticular activity and any profits generated are distributed
between the parties according to the profit shares that
were pre- agreed in the contract. The Mudarib would bear
the loss in case of default, negligence or violation of any
of the terms and conditions of the Mudaraba, otherwise,
losses are borne by the Rab Al Mal. Income is recognised
based on expected results adjusted for actual results on
distribution by the Mudarib, whereas if the Group is the
Rab Al Mal the losses are charged to the Group’s consoli-
dated income statement when incurred.
189

ABU DHABI COMMERCIAL BANK PJSCNOTES TO THE CONSOLIDATED FINANCIAL STATEMENTSDECEMBER 31, 2019
SALAM
Bai Al Salam is a sale contract where the customer (seller)
undertakes to deliver/supply a specified tangible asset
to the Group (buyer) at mutually agreed future date(s) in
exchange for an advance price fully paid on the spot by
the buyer.
Revenue on Salam financing is recognised on the effec-
tive profit rate basis over the period of the contract, based
on the Salam capital outstanding.
WAKALA
An agreement between the Group and customer whereby
one party (Rab Al Mal) provides a certain sum of money
to an agent (Wakil), who invests it according to specific
conditions in return for a certain fee (a lump sum of
money or a percentage of the amount invested). The
agent is obliged to guarantee the invested amount in case
of default, negligence or violation of any of the terms and
conditions of the Wakala. The Group may be Wakil or Rab
Al Mal depending on the nature of the transaction.
Estimated income from Wakala is recognised on the
effective profit rate basis over the period, adjusted by
actual income when received. Losses are accounted for
when incurred.
SUKUK
Certificates of equal value representing undivided shares
in ownership of tangible assets, usufructs and services or
(in the ownership of) the assets of particular projects or
special investment activity. It is asset- backed trust cer-
tificates evidencing ownership of an asset or its usufruct
(earnings or benefits) and complies with the principle
of Shari’ah.
4. Critical accounting judgements and key sources of estimation uncertainty
The reported results of the Group are sensitive to the
accounting policies, assumptions and estimates that
underlie the preparation of these consolidated financial
statements. IFRS requires the management, in preparing
the Group’s consolidated financial statements, to select
suitable accounting policies, apply them consistently
and make judgements and estimates that are reasonable
and prudent. In the absence of an applicable standard
or interpretation, IAS 8 Accounting Policies, Changes in
Accounting Estimates and Errors, requires management
to develop and apply an accounting policy that results
in relevant and reliable information in the light of the
requirements and guidance in IFRS dealing with similar
and related issues and the IASB’s Framework for the
Preparation and Presentation of Financial Statements.
The judgements and assumptions involved in the Group’s
accounting policies that are considered by the Board
of Directors (the “Board”) to be the most important to
the portrayal of its financial condition are discussed
below. The use of estimates, assumptions or models that
differ from those adopted by the Group would affect its
reported results.
4.1 CRITICAL JUDGEMENTS IN APPLYING THE CHANGES IN GROUP’S ACCOUNTING POLICIES
The following are the critical judgements, apart from those
involving estimations, that the management has made in
the process of applying the Group’s accounting policies
and that have the most significant effect on the amounts
recognised in the consolidated financial statements:
BUSINESS MODEL ASSESSMENT
Classification and measurement of financial assets
depends on the results of the SPPI and the business
model test. The Group determines the business model
at a level that reflects how groups of financial assets are
managed together to achieve a particular business objec-
tive. This assessment includes judgement reflecting all
relevant evidence including how the performance of the
assets is evaluated and their performance measured, the
risks that affect the performance of the assets and how
these are managed and how the managers of the assets
are compensated. The Group monitors financial assets
measured at amortised cost or fair value through other
comprehensive income that are derecognised prior to
their maturity to understand the reason for their disposal
and whether the reasons are consistent with the objective
of the business for which the asset was held. Monitoring
is part of the Group’s continuous assessment of whether
the business model for which the remaining financial
assets are held continues to be appropriate and if it is not
appropriate whether there has been a change in business
model and so a prospective change to the classification
of those assets.
IMPAIRMENT LOSSES
• Significant increase of credit risk: ECLs are measured as
an allowance equal to 12-month ECL for stage 1 assets,
or lifetime ECL for stage 2 or stage 3 assets. An asset
moves to stage 2 when its credit risk has increased
significantly since initial recognition. IFRS 9 does not
define what constitutes a significant increase in credit
risk. In assessing whether the credit risk of an asset has
significantly increased the Group takes into account
qualitative and quantitative reasonable and supportable
forward looking information.
• Establishing groups of assets with similar credit risk
characteristics: When ECLs are measured on a collec-
tive basis, the financial instruments are grouped on the
basis of shared risk characteristics (e.g. instrument type,
190
ABU DHABI COMMERCIAL BANK PJSCNOTES TO THE CONSOLIDATED FINANCIAL STATEMENTSDECEMBER 31, 2019
credit risk grade, collateral type, date of initial recogni-
tion, remaining term to maturity, industry, geographic
location of the borrower, etc.). The Group monitors the
appropriateness of the credit risk characteristics on an
ongoing basis to assess whether they continue to be
similar. This is required in order to ensure that should
credit risk characteristics change there is appropriate
re- segmentation of the assets. This may result in new
portfolios being created or assets moving to an existing
portfolio that better reflects the similar credit risk char-
acteristics of that group of assets. Re- segmentation of
portfolios and movement between portfolios is more
common when there is a significant increase in credit
risk (or when that significant increase reverses) and so
assets move from 12-month to lifetime ECLs, or vice
versa, but it can also occur within portfolios that con-
tinue to be measured on the same basis of 12-month or
lifetime ECLs but the amount of ECL changes because
the credit risk of the portfolios differ.
• Models and assumptions used: The Group uses various
models and assumptions in measuring ECL of financial
assets. Judgement is applied in identifying the most
appropriate model for each type of asset, as well as for
determining the assumptions used in these models,
including assumptions that relate to key drivers of credit
risk. Refer Note 42 for more details on ECL.
VALUATION OF FINANCIAL INSTRUMENTS
The best evidence of fair value is a quoted price for the
instrument being measured in an actively traded market.
In the event that the market for a financial instrument is
not active, a valuation technique is used. The majority of
valuation techniques employ only observable market data
and so the reliability of the fair value measurement is high.
However, certain financial instruments are valued on the
basis of valuation techniques that include one or more
significant market inputs that are unobservable. Valuation
techniques that rely to a greater extent on unobservable
inputs require a higher level of management judgement
to calculate a fair value than those based wholly on
observable inputs.
Valuation techniques used to calculate fair values are dis-
cussed in Note 40. The main assumptions and estimates
which management consider when applying a model
with valuation techniques are:
• the likelihood and expected timing of future cash flows
on the instrument. These cash flows are estimated
based on the terms of the instrument, and judgement
may be required when the ability of the counterparty
to service the instrument in accordance with the con-
tractual terms is in doubt. Future cash flows may be
sensitive to changes in market rates;
• selecting an appropriate discount rate for the instru-
ment. The determination of this rate is based on an
assessment of what a market participant would regard
as the appropriate spread of the rate for the instrument
over the appropriate risk-free rate; and
• when applying a model with unobservable inputs,
estimates are made to reflect uncertainties in fair
values resulting from a lack of market data inputs, for
example, as a result of illiquidity in the market. For these
instruments, the fair value measurement is less reliable.
Inputs into valuations based on unobservable data are
inherently uncertain because there is little or no current
market data available from which to determine the level
at which an arm’s length transaction would occur under
normal business conditions. However, in most cases
there is some market data available on which to base a
determination of fair value, for example historical data,
and the fair values of most financial instruments are
based on some market observable inputs even when
unobservable inputs are significant.
FAIR VALUATION OF INVESTMENT PROPERTIES
The fair values of investment properties is based on the
highest and best use of the properties, which is their
current use. The fair valuation of the investment prop-
erties is carried out by independent valuers based on
models whose inputs are observable in an active market
such as market conditions, market prices, future rental
income, etc.
The fair value movements on investment properties are
disclosed in more detail in Note 12.
CONSOLIDATION OF FUNDS
The changes introduced by IFRS 10 — Consolidated
Financial Statements require an investor to consolidate
an investee when it controls the investee. The investor
controls an investee when it is exposed, or has rights, to
variable returns from its involvement with the investee
and has the ability to affect those returns through its
power over the investee. The new definition of control
requires the Group to exercise significant judgement on
an ongoing basis to determine which entities are con-
trolled, and therefore are required to be consolidated.
191
ABU DHABI COMMERCIAL BANK PJSCNOTES TO THE CONSOLIDATED FINANCIAL STATEMENTSDECEMBER 31, 2019
LEASE ACCOUNTING UNDER IFRS 16
The following are the critical judgements in the applica-
tion of IFRS 16, apart from those involving estimations,
that the management has made in the process of applying
the Group’s accounting policies and that have the most
significant effect on the amounts recognised in the con-
solidated financial statements:
• identifying whether a contract (or part of a contract)
includes a lease;
• determining whether it is reasonably certain that an
extension or termination option will be exercised;
• classification of lease arrangements (when the entity
is a lessor).
TAX POSITIONS
The income tax positions taken are considered by the
Group to be supportable and are intended to withstand
challenge from tax authorities. However, it is acknowl-
edged that these positions are uncertain and include
interpretations of complex tax laws which could be
disputed by tax authorities. Evolving insights, for example
following final tax assessments for prior years, can result
in additional tax burdens or benefits, and new tax risks
may arise.
The Group judges these positions on their technical
merits and this on a regular basis using all the information
available (legislation, case law, regulations, established
practice, authoritative doctrine as well as the current state
of discussions with tax authorities, where appropriate). A
liability is recorded for each item that is not probable of
being sustained on examination by the tax authorities,
based on all relevant information. The liability is calcu-
lated taking into account the most likely outcome or the
expected value, depending on which is thought to give
a better prediction of the resolution of each uncertain
tax position in view of reflecting the likelihood of an
adjustment being recognised upon examination. These
estimates are based on facts and circumstances existing
at the end of the reporting period. The tax liability and
income tax expense include expected penalties and late
payment interests arising from tax disputes.
Management has used its best estimate of the correct
value of liability to recognise in each case, which includes
a judgement on the length of the future time period to use
in such assessments.
4.2 KEY SOURCES OF ESTIMATION UNCERTAINTY
The following are key estimations that the management
has used in the process of applying the Group’s account-
ing policies and that have the most significant effect on
the amounts recognised in the Group’s consolidated
financial statements:
• Establishing the number and relative weightings of
forward- looking scenarios for each type of product/
market and determining the forward looking informa-
tion relevant to each scenario: When measuring ECL
the Group uses reasonable and supportable forward
looking information, which is based on assumptions for
the future movement of different economic drivers and
how these drivers will affect each other.
• Probability of default (PD) constitutes a key input in
measuring ECL. PD is an estimate of the likelihood of
default over a given time horizon, the calculation of
which includes historical data, assumptions and expec-
tations of future conditions.
• Loss given default (LGD) is an estimate of the loss arising
on default. It is based on the difference between the
contractual cash flows due and those that the lender
would expect to receive, taking into account cash flows
from collateral and integral credit enhancements.
LEASE ACCOUNTING UNDER IFRS 16
The following are key estimations that the management
has used in the process of applying the Group’s account-
ing policies for IFRS 16 and that have the most significant
effect on the amounts recognised in the Group’s consol-
idated financial statements:
• determination of the appropriate rate to discount the
lease payments;
• assessment of whether a right-of-use asset is impaired.
FAIR VALUATION OF ASSETS ACQUIRED AND LIABILITIES ASSUMED
IN BUSINESS COMBINATION
As stated in Note 3.6 above, the identifiable assets
acquired and the liabilities assumed in business combi-
nation are recognised at their fair value. In estimating the
fair value of an asset or a liability, the Group uses market-
observable data to the extent it is available. Where Level 1
inputs are not available, the Group engages third-party
qualified valuers to perform the valuation. Such valuations
are sensitive to changes in one or more unobservable
inputs which are considered reasonably possible within
the next financial year.
192
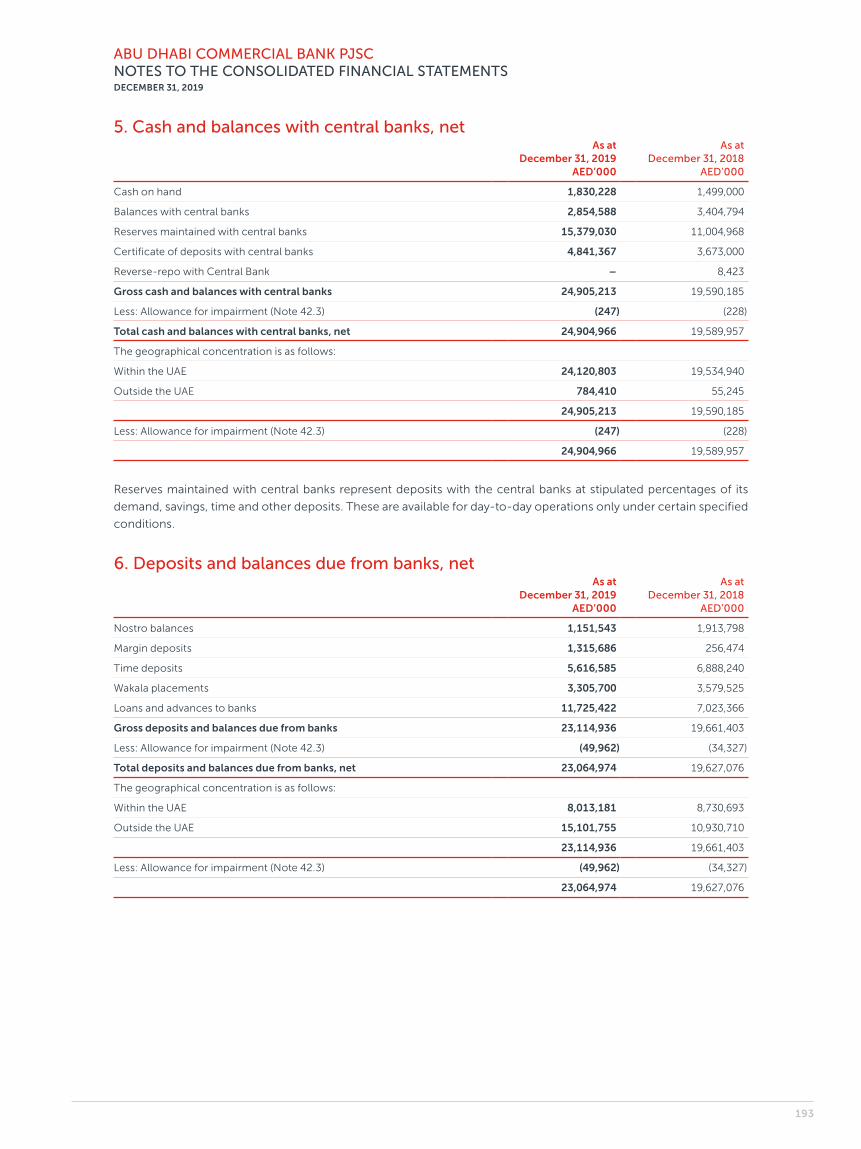
ABU DHABI COMMERCIAL BANK PJSCNOTES TO THE CONSOLIDATED FINANCIAL STATEMENTSDECEMBER 31, 2019
5. Cash and balances with central banks, netAs at
December 31, 2019 AED’000
As at December 31, 2018
AED’000
Cash on hand 1,830,228 1,499,000
Balances with central banks 2,854,588 3,404,794
Reserves maintained with central banks 15,379,030 11,004,968
Certificate of deposits with central banks 4,841,367 3,673,000
Reverse-repo with Central Bank – 8,423
Gross cash and balances with central banks 24,905,213 19,590,185
Less: Allowance for impairment (Note 42.3) (247) (228)
Total cash and balances with central banks, net 24,904,966 19,589,957
The geographical concentration is as follows:
Within the UAE 24,120,803 19,534,940
Outside the UAE 784,410 55,245
24,905,213 19,590,185
Less: Allowance for impairment (Note 42.3) (247) (228)
24,904,966 19,589,957
Reserves maintained with central banks represent deposits with the central banks at stipulated percentages of its
demand, savings, time and other deposits. These are available for day-to-day operations only under certain specified
conditions.
6. Deposits and balances due from banks, netAs at
December 31, 2019 AED’000
As at December 31, 2018
AED’000
Nostro balances 1,151,543 1,913,798
Margin deposits 1,315,686 256,474
Time deposits 5,616,585 6,888,240
Wakala placements 3,305,700 3,579,525
Loans and advances to banks 11,725,422 7,023,366
Gross deposits and balances due from banks 23,114,936 19,661,403
Less: Allowance for impairment (Note 42.3) (49,962) (34,327)
Total deposits and balances due from banks, net 23,064,974 19,627,076
The geographical concentration is as follows:
Within the UAE 8,013,181 8,730,693
Outside the UAE 15,101,755 10,930,710
23,114,936 19,661,403
Less: Allowance for impairment (Note 42.3) (49,962) (34,327)
23,064,974 19,627,076
193

ABU DHABI COMMERCIAL BANK PJSCNOTES TO THE CONSOLIDATED FINANCIAL STATEMENTSDECEMBER 31, 2019
7. Reverse-repo placementsAs at
December 31 2019
AED’000
As at December 31
2018 AED’000
Banks and financial institutions – 2,203,800
Total reverse-repo placements – 2,203,800
The geographical concentration is as follows:
Within the UAE – 2,020,150
Outside the UAE – 183,650
– 2,203,800
The Group enters into reverse repurchase agree-
ments under which bonds with fair value of AED Nil
(December 31, 2018 — bonds with fair value of AED
2,271,007 thousand) were received as collateral against
reverse-repo placements. The risks and rewards relating
to these bonds remains with the counterparties. The
terms and conditions of these collaterals are governed by
Global Master Repurchase Agreements (GMRA).
8. Derivative financial instruments
In the ordinary course of business the Group enters into
various types of derivative transactions that are affected
by variables in the underlying instruments.
A derivative is a financial instrument or other contract
with all three of the following characteristics:
(a) its value changes in response to the change in a
specified interest rate, financial instrument price, com-
modity price, foreign exchange rate, index of prices or
rates, credit rating or credit index, or other variable,
provided in the case of a non- financial variable that
the variable is not specific to a party to the contract
(sometimes called the “underlying”);
(b) it requires no initial net investment or an initial net
investment that is smaller than would be required
for other types of contracts that would be expected
to have a similar response to changes in market
factors; and
(c) it is settled at a future date.
Derivative financial instruments which the Group enters
into includes forward foreign exchange contracts, interest
rate futures, forward rate agreements, commodity swaps,
interest rate swaps and currency and interest rate options.
The Group uses the following derivative financial instru-
ments for hedging and trading purposes.
FORWARD AND FUTURES TRANSACTIONS
Currency forwards represent commitments to pur-
chase foreign and domestic currencies, including
non- deliverable forward transactions (i.e. the transaction
is net settled). Foreign currency and interest rate futures
are contractual obligations to receive or pay a net amount
based on changes in currency rates or interest rates or to
buy or sell foreign currency or a financial instrument on a
future date at a specified price established in an organised
financial market. The credit risk for futures contracts is
negligible as they are collateralised by cash or marketable
securities and changes in the futures’ contract value are
settled daily with the broker. Forward rate agreements
are individually negotiated interest rate futures that call
for a cash settlement at a future date for the difference
between a contracted rate of interest and the current
market rate based on a notional principal amount.
SWAP TRANSACTIONS
Currency and interest rate swaps are commitments to
exchange one set of cash flows for another. Swaps result
in an economic exchange of currencies or interest rates
(for example: fixed rate for floating rate) or a combination
of all these (for example: cross- currency interest rate
swaps). No exchange of principal takes place except for
certain cross currency interest rate swaps. The Group’s
credit risk represents the potential loss if counterparties
fail to fulfil their obligation. This risk is monitored on an
ongoing basis through market risk limits on exposures
and credit risk assessment of counterparties using the
same techniques as those of lending activities.
OPTION TRANSACTIONS
Foreign currency and interest rate options are contrac-
tual agreements under which the seller (writer) grants
the purchaser (holder) the right, but not the obligation,
either to buy (a call option) or sell (a put option) at or by
a set date or during a set period, a specific amount of
a foreign currency or a specific rate of interest or any
financial instrument at a predetermined price. The seller
receives a premium from the purchaser in consideration
for the assumption of foreign exchange or interest rate
risk. Options may be either exchange- traded or nego-
tiated between the Group and a customer over the
counter (OTC).
Derivative contracts can be exchange traded or OTC. The
Group values exchange traded derivatives using inputs
at market- clearing levels. OTC derivatives are valued
using market based inputs or broker/dealer quotations.
Where models are required, the Group uses a variety of
inputs, including contractual terms, market prices, market
volatilities, yield curves and other reference market data.
194

ABU DHABI COMMERCIAL BANK PJSCNOTES TO THE CONSOLIDATED FINANCIAL STATEMENTSDECEMBER 31, 2019
FAIR VALUE MEASUREMENT MODELS
For OTC derivatives that trade in liquid markets such as
generic forwards, swaps and options, model inputs can
generally be verified and model selection conforms to
market practice. Certain OTC derivatives trade in less
liquid markets with limited pricing information and the
determination of fair value for these derivatives is inher-
ently more difficult. Subsequent to initial recognition, the
Group only updates valuation inputs when corroborated
by evidence such as similar market transactions, third-
party pricing services and/or broker dealer quotations
or other empirical market data. In the absence of such
evidence, Management’s best estimates are used.
DERIVATIVES HELD OR ISSUED FOR TRADING PURPOSES
The Group’s trading activities are predominantly related
to offering hedging solutions to customers at compet-
itive prices in order to enable them to transfer, modify
or reduce current and expected risks. The Group also
manages risk taken as a result of client transactions or
initiates positions with the expectation of profiting from
favourable movement in prices, rates or indices.
DERIVATIVES HELD OR ISSUED FOR HEDGING PURPOSES
The Group uses derivative financial instruments for
hedging purposes as part of its asset and liability man-
agement activities in order to reduce its own exposure
to fluctuations in currency and interest rates. The Group
uses forward foreign exchange contracts, cross currency
interest rate swaps and interest rate swaps to hedge
currency rate and interest rate risks. In all such cases, the
hedging relationship and objectives including details of
the hedged item and hedging instrument are formally
documented and the transactions are accounted for
based on the type of hedge.
195
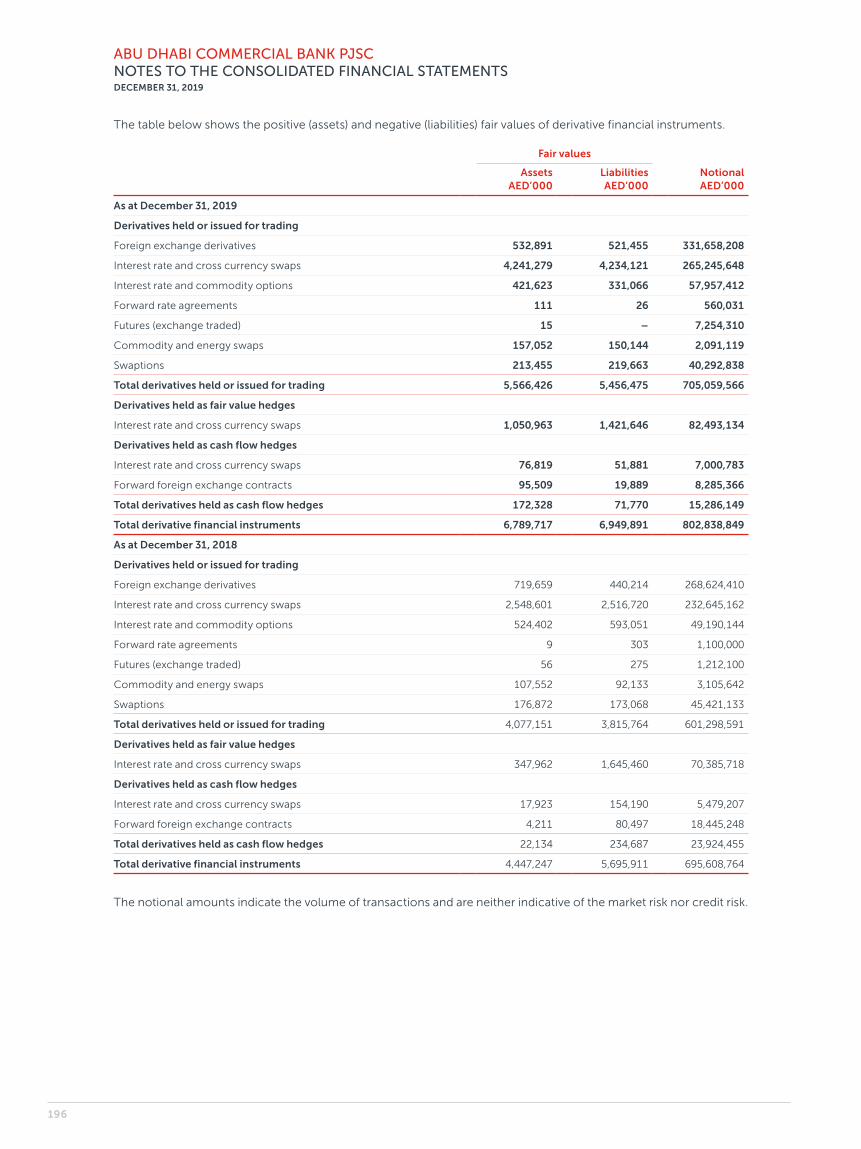
ABU DHABI COMMERCIAL BANK PJSCNOTES TO THE CONSOLIDATED FINANCIAL STATEMENTSDECEMBER 31, 2019
The table below shows the positive (assets) and negative (liabilities) fair values of derivative financial instruments.
Fair values
Assets AED’000
Liabilities AED’000
Notional AED’000
As at December 31, 2019
Derivatives held or issued for trading
Foreign exchange derivatives 532,891 521,455 331,658,208
Interest rate and cross currency swaps 4,241,279 4,234,121 265,245,648
Interest rate and commodity options 421,623 331,066 57,957,412
Forward rate agreements 111 26 560,031
Futures (exchange traded) 15 – 7,254,310
Commodity and energy swaps 157,052 150,144 2,091,119
Swaptions 213,455 219,663 40,292,838
Total derivatives held or issued for trading 5,566,426 5,456,475 705,059,566
Derivatives held as fair value hedges
Interest rate and cross currency swaps 1,050,963 1,421,646 82,493,134
Derivatives held as cash flow hedges
Interest rate and cross currency swaps 76,819 51,881 7,000,783
Forward foreign exchange contracts 95,509 19,889 8,285,366
Total derivatives held as cash flow hedges 172,328 71,770 15,286,149
Total derivative financial instruments 6,789,717 6,949,891 802,838,849
As at December 31, 2018
Derivatives held or issued for trading
Foreign exchange derivatives 719,659 440,214 268,624,410
Interest rate and cross currency swaps 2,548,601 2,516,720 232,645,162
Interest rate and commodity options 524,402 593,051 49,190,144
Forward rate agreements 9 303 1,100,000
Futures (exchange traded) 56 275 1,212,100
Commodity and energy swaps 107,552 92,133 3,105,642
Swaptions 176,872 173,068 45,421,133
Total derivatives held or issued for trading 4,077,151 3,815,764 601,298,591
Derivatives held as fair value hedges
Interest rate and cross currency swaps 347,962 1,645,460 70,385,718
Derivatives held as cash flow hedges
Interest rate and cross currency swaps 17,923 154,190 5,479,207
Forward foreign exchange contracts 4,211 80,497 18,445,248
Total derivatives held as cash flow hedges 22,134 234,687 23,924,455
Total derivative financial instruments 4,447,247 5,695,911 695,608,764
The notional amounts indicate the volume of transactions and are neither indicative of the market risk nor credit risk.
196
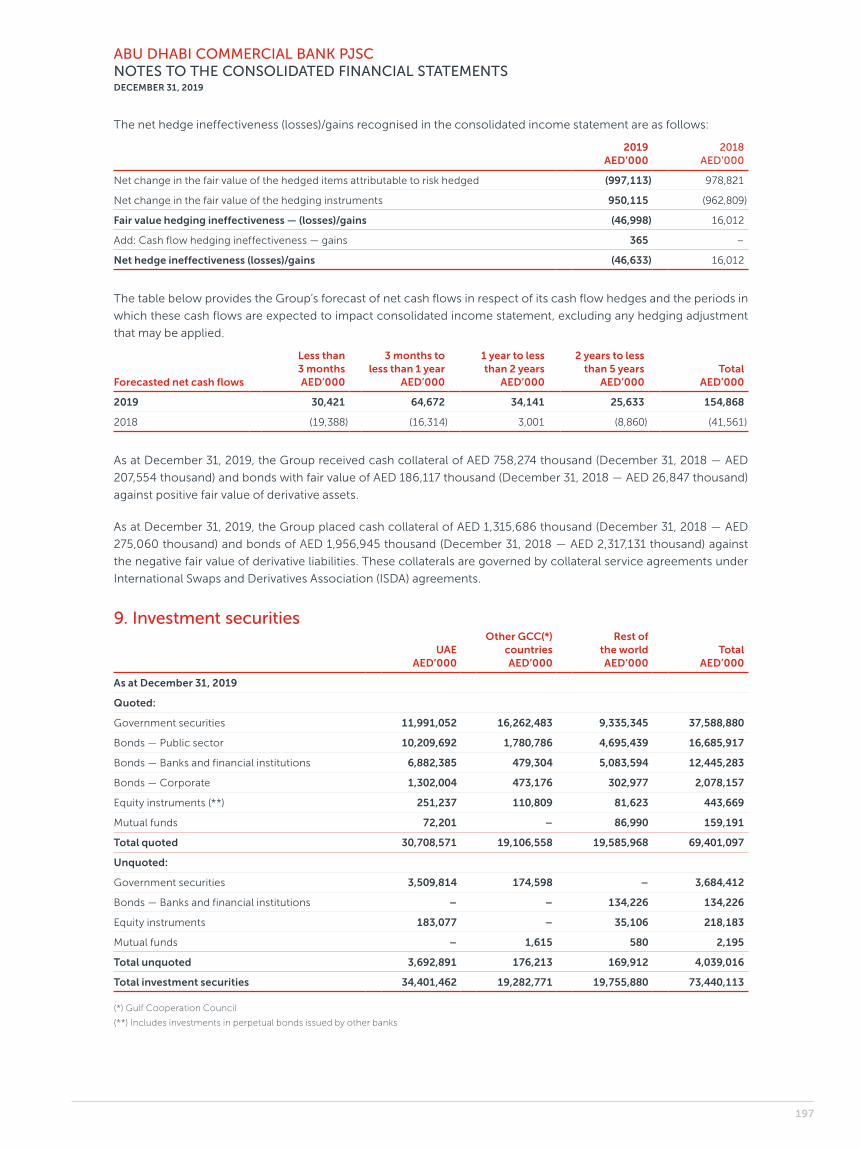
ABU DHABI COMMERCIAL BANK PJSCNOTES TO THE CONSOLIDATED FINANCIAL STATEMENTSDECEMBER 31, 2019
The net hedge ineffectiveness (losses)/gains recognised in the consolidated income statement are as follows:
2019 AED’000
2018 AED’000
Net change in the fair value of the hedged items attributable to risk hedged (997,113) 978,821
Net change in the fair value of the hedging instruments 950,115 (962,809)
Fair value hedging ineffectiveness — (losses)/gains (46,998) 16,012
Add: Cash flow hedging ineffectiveness — gains 365 –
Net hedge ineffectiveness (losses)/gains (46,633) 16,012
The table below provides the Group’s forecast of net cash flows in respect of its cash flow hedges and the periods in
which these cash flows are expected to impact consolidated income statement, excluding any hedging adjustment
that may be applied.
Forecasted net cash flows
Less than 3 months AED’000
3 months to less than 1 year
AED’000
1 year to less than 2 years
AED’000
2 years to less than 5 years
AED’000Total
AED’000
2019 30,421 64,672 34,141 25,633 154,868
2018 (19,388) (16,314) 3,001 (8,860) (41,561)
As at December 31, 2019, the Group received cash collateral of AED 758,274 thousand (December 31, 2018 — AED
207,554 thousand) and bonds with fair value of AED 186,117 thousand (December 31, 2018 — AED 26,847 thousand)
against positive fair value of derivative assets.
As at December 31, 2019, the Group placed cash collateral of AED 1,315,686 thousand (December 31, 2018 — AED
275,060 thousand) and bonds of AED 1,956,945 thousand (December 31, 2018 — AED 2,317,131 thousand) against
the negative fair value of derivative liabilities. These collaterals are governed by collateral service agreements under
International Swaps and Derivatives Association (ISDA) agreements.
9. Investment securities
UAE AED’000
Other GCC(*) countries AED’000
Rest of the world AED’000
Total AED’000
As at December 31, 2019
Quoted:
Government securities 11,991,052 16,262,483 9,335,345 37,588,880
Bonds — Public sector 10,209,692 1,780,786 4,695,439 16,685,917
Bonds — Banks and financial institutions 6,882,385 479,304 5,083,594 12,445,283
Bonds — Corporate 1,302,004 473,176 302,977 2,078,157
Equity instruments (**) 251,237 110,809 81,623 443,669
Mutual funds 72,201 – 86,990 159,191
Total quoted 30,708,571 19,106,558 19,585,968 69,401,097
Unquoted:
Government securities 3,509,814 174,598 – 3,684,412
Bonds — Banks and financial institutions – – 134,226 134,226
Equity instruments 183,077 – 35,106 218,183
Mutual funds – 1,615 580 2,195
Total unquoted 3,692,891 176,213 169,912 4,039,016
Total investment securities 34,401,462 19,282,771 19,755,880 73,440,113
(*) Gulf Cooperation Council
(**) Includes investments in perpetual bonds issued by other banks
197
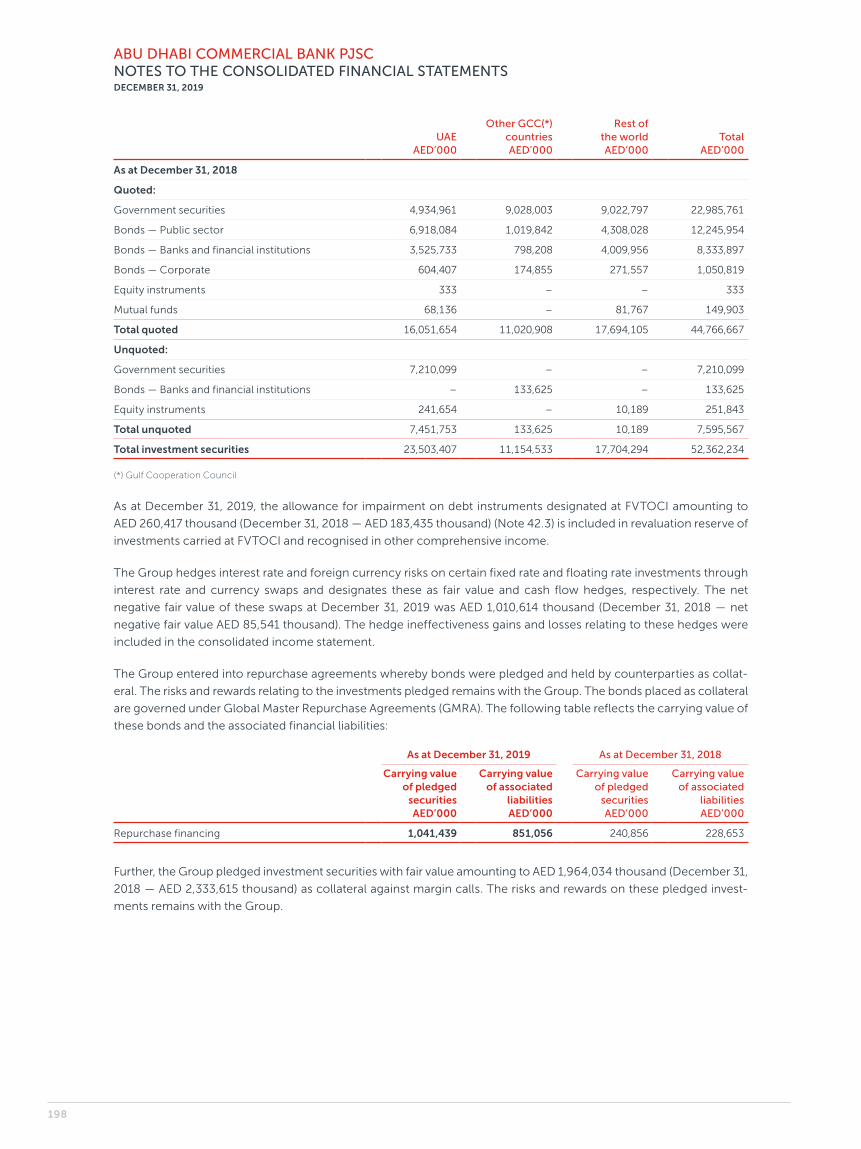
ABU DHABI COMMERCIAL BANK PJSCNOTES TO THE CONSOLIDATED FINANCIAL STATEMENTSDECEMBER 31, 2019
UAE AED’000
Other GCC(*) countries AED’000
Rest of the world AED’000
Total AED’000
As at December 31, 2018
Quoted:
Government securities 4,934,961 9,028,003 9,022,797 22,985,761
Bonds — Public sector 6,918,084 1,019,842 4,308,028 12,245,954
Bonds — Banks and financial institutions 3,525,733 798,208 4,009,956 8,333,897
Bonds — Corporate 604,407 174,855 271,557 1,050,819
Equity instruments 333 – – 333
Mutual funds 68,136 – 81,767 149,903
Total quoted 16,051,654 11,020,908 17,694,105 44,766,667
Unquoted:
Government securities 7,210,099 – – 7,210,099
Bonds — Banks and financial institutions – 133,625 – 133,625
Equity instruments 241,654 – 10,189 251,843
Total unquoted 7,451,753 133,625 10,189 7,595,567
Total investment securities 23,503,407 11,154,533 17,704,294 52,362,234
(*) Gulf Cooperation Council
As at December 31, 2019, the allowance for impairment on debt instruments designated at FVTOCI amounting to
AED 260,417 thousand (December 31, 2018 — AED 183,435 thousand) (Note 42.3) is included in revaluation reserve of
investments carried at FVTOCI and recognised in other comprehensive income.
The Group hedges interest rate and foreign currency risks on certain fixed rate and floating rate investments through
interest rate and currency swaps and designates these as fair value and cash flow hedges, respectively. The net
negative fair value of these swaps at December 31, 2019 was AED 1,010,614 thousand (December 31, 2018 — net
negative fair value AED 85,541 thousand). The hedge ineffectiveness gains and losses relating to these hedges were
included in the consolidated income statement.
The Group entered into repurchase agreements whereby bonds were pledged and held by counterparties as collat-
eral. The risks and rewards relating to the investments pledged remains with the Group. The bonds placed as collateral
are governed under Global Master Repurchase Agreements (GMRA). The following table reflects the carrying value of
these bonds and the associated financial liabilities:
As at December 31, 2019 As at December 31, 2018
Carrying value of pledged
securities AED’000
Carrying value of associated
liabilities AED’000
Carrying value of pledged
securities AED’000
Carrying value of associated
liabilities AED’000
Repurchase financing 1,041,439 851,056 240,856 228,653
Further, the Group pledged investment securities with fair value amounting to AED 1,964,034 thousand (December 31,
2018 — AED 2,333,615 thousand) as collateral against margin calls. The risks and rewards on these pledged invest-
ments remains with the Group.
198
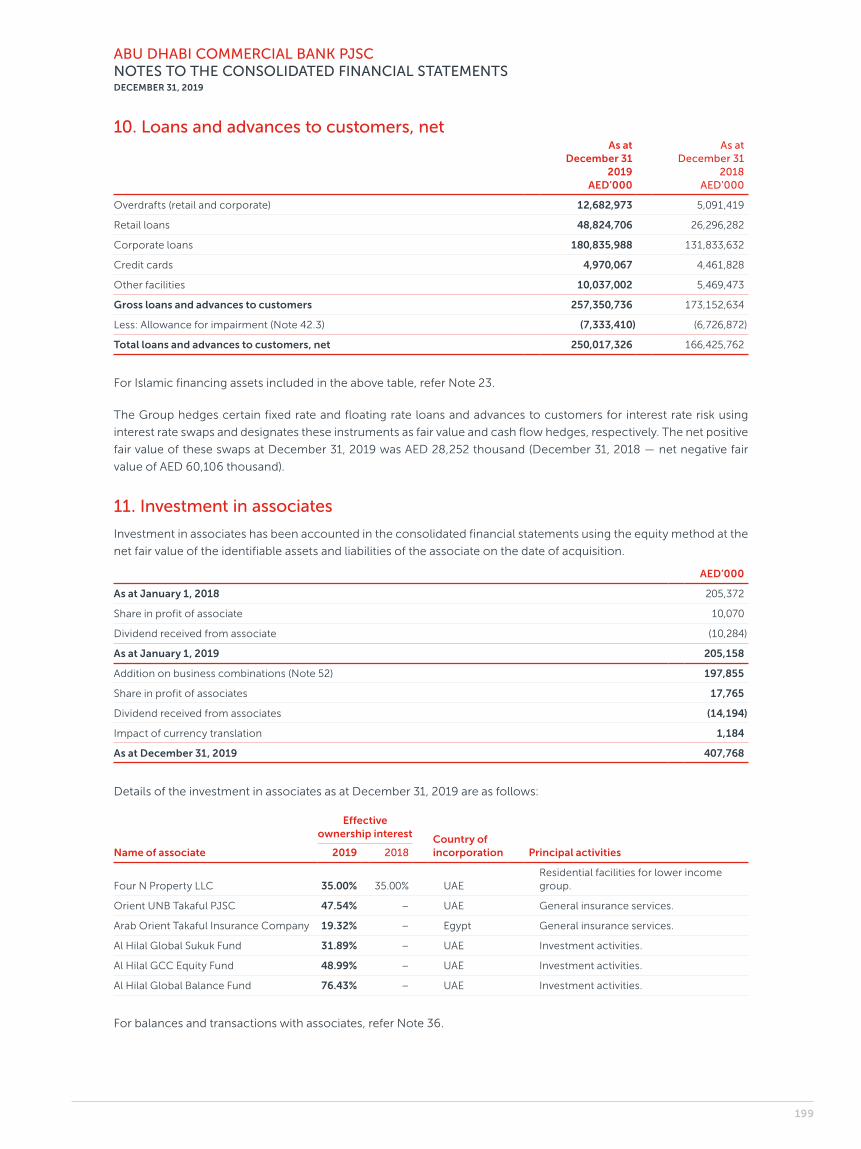
ABU DHABI COMMERCIAL BANK PJSCNOTES TO THE CONSOLIDATED FINANCIAL STATEMENTSDECEMBER 31, 2019
10. Loans and advances to customers, netAs at
December 31 2019
AED’000
As at December 31
2018 AED’000
Overdrafts (retail and corporate) 12,682,973 5,091,419
Retail loans 48,824,706 26,296,282
Corporate loans 180,835,988 131,833,632
Credit cards 4,970,067 4,461,828
Other facilities 10,037,002 5,469,473
Gross loans and advances to customers 257,350,736 173,152,634
Less: Allowance for impairment (Note 42.3) (7,333,410) (6,726,872)
Total loans and advances to customers, net 250,017,326 166,425,762
For Islamic financing assets included in the above table, refer Note 23.
The Group hedges certain fixed rate and floating rate loans and advances to customers for interest rate risk using
interest rate swaps and designates these instruments as fair value and cash flow hedges, respectively. The net positive
fair value of these swaps at December 31, 2019 was AED 28,252 thousand (December 31, 2018 — net negative fair
value of AED 60,106 thousand).
11. Investment in associates
Investment in associates has been accounted in the consolidated financial statements using the equity method at the
net fair value of the identifiable assets and liabilities of the associate on the date of acquisition.
AED’000
As at January 1, 2018 205,372
Share in profit of associate 10,070
Dividend received from associate (10,284)
As at January 1, 2019 205,158
Addition on business combinations (Note 52) 197,855
Share in profit of associates 17,765
Dividend received from associates (14,194)
Impact of currency translation 1,184
As at December 31, 2019 407,768
Details of the investment in associates as at December 31, 2019 are as follows:
Name of associate
Effective ownership interest Country of
incorporation Principal activities2019 2018
Four N Property LLC 35.00% 35.00% UAEResidential facilities for lower income group.
Orient UNB Takaful PJSC 47.54% – UAE General insurance services.
Arab Orient Takaful Insurance Company 19.32% – Egypt General insurance services.
Al Hilal Global Sukuk Fund 31.89% – UAE Investment activities.
Al Hilal GCC Equity Fund 48.99% – UAE Investment activities.
Al Hilal Global Balance Fund 76.43% – UAE Investment activities.
For balances and transactions with associates, refer Note 36.
199
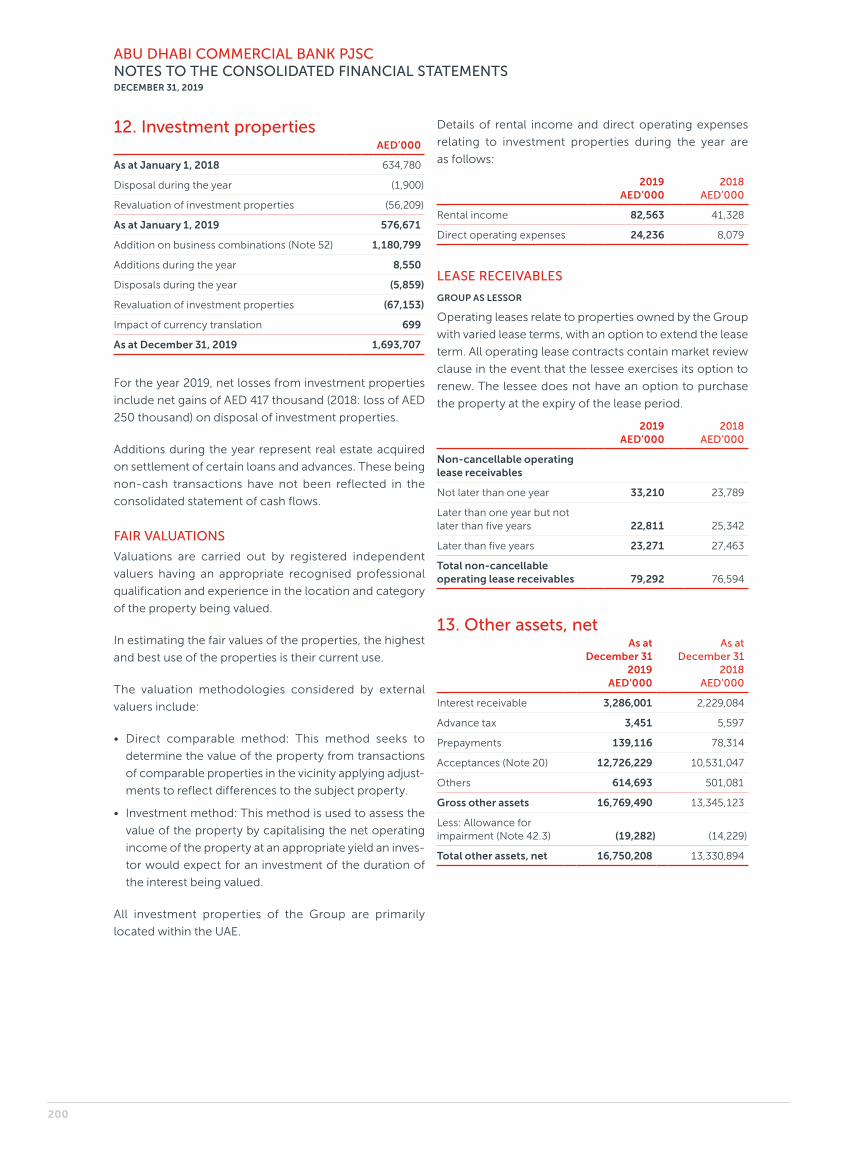
ABU DHABI COMMERCIAL BANK PJSCNOTES TO THE CONSOLIDATED FINANCIAL STATEMENTSDECEMBER 31, 2019
12. Investment propertiesAED’000
As at January 1, 2018 634,780
Disposal during the year (1,900)
Revaluation of investment properties (56,209)
As at January 1, 2019 576,671
Addition on business combinations (Note 52) 1,180,799
Additions during the year 8,550
Disposals during the year (5,859)
Revaluation of investment properties (67,153)
Impact of currency translation 699
As at December 31, 2019 1,693,707
For the year 2019, net losses from investment properties
include net gains of AED 417 thousand (2018: loss of AED
250 thousand) on disposal of investment properties.
Additions during the year represent real estate acquired
on settlement of certain loans and advances. These being
non-cash transactions have not been reflected in the
consolidated statement of cash flows.
FAIR VALUATIONS
Valuations are carried out by registered independent
valuers having an appropriate recognised professional
qualification and experience in the location and category
of the property being valued.
In estimating the fair values of the properties, the highest
and best use of the properties is their current use.
The valuation methodologies considered by external
valuers include:
• Direct comparable method: This method seeks to
determine the value of the property from transactions
of comparable properties in the vicinity applying adjust-
ments to reflect differences to the subject property.
• Investment method: This method is used to assess the
value of the property by capitalising the net operating
income of the property at an appropriate yield an inves-
tor would expect for an investment of the duration of
the interest being valued.
All investment properties of the Group are primarily
located within the UAE.
Details of rental income and direct operating expenses
relating to investment properties during the year are
as follows:
2019 AED’000
2018 AED’000
Rental income 82,563 41,328
Direct operating expenses 24,236 8,079
LEASE RECEIVABLES
GROUP AS LESSOR
Operating leases relate to properties owned by the Group
with varied lease terms, with an option to extend the lease
term. All operating lease contracts contain market review
clause in the event that the lessee exercises its option to
renew. The lessee does not have an option to purchase
the property at the expiry of the lease period.
2019 AED’000
2018 AED’000
Non- cancellable operating lease receivables
Not later than one year 33,210 23,789
Later than one year but not later than five years 22,811 25,342
Later than five years 23,271 27,463
Total non- cancellable operating lease receivables 79,292 76,594
13. Other assets, netAs at
December 31 2019
AED’000
As at December 31
2018 AED’000
Interest receivable 3,286,001 2,229,084
Advance tax 3,451 5,597
Prepayments 139,116 78,314
Acceptances (Note 20) 12,726,229 10,531,047
Others 614,693 501,081
Gross other assets 16,769,490 13,345,123
Less: Allowance for impairment (Note 42.3) (19,282) (14,229)
Total other assets, net 16,750,208 13,330,894
200
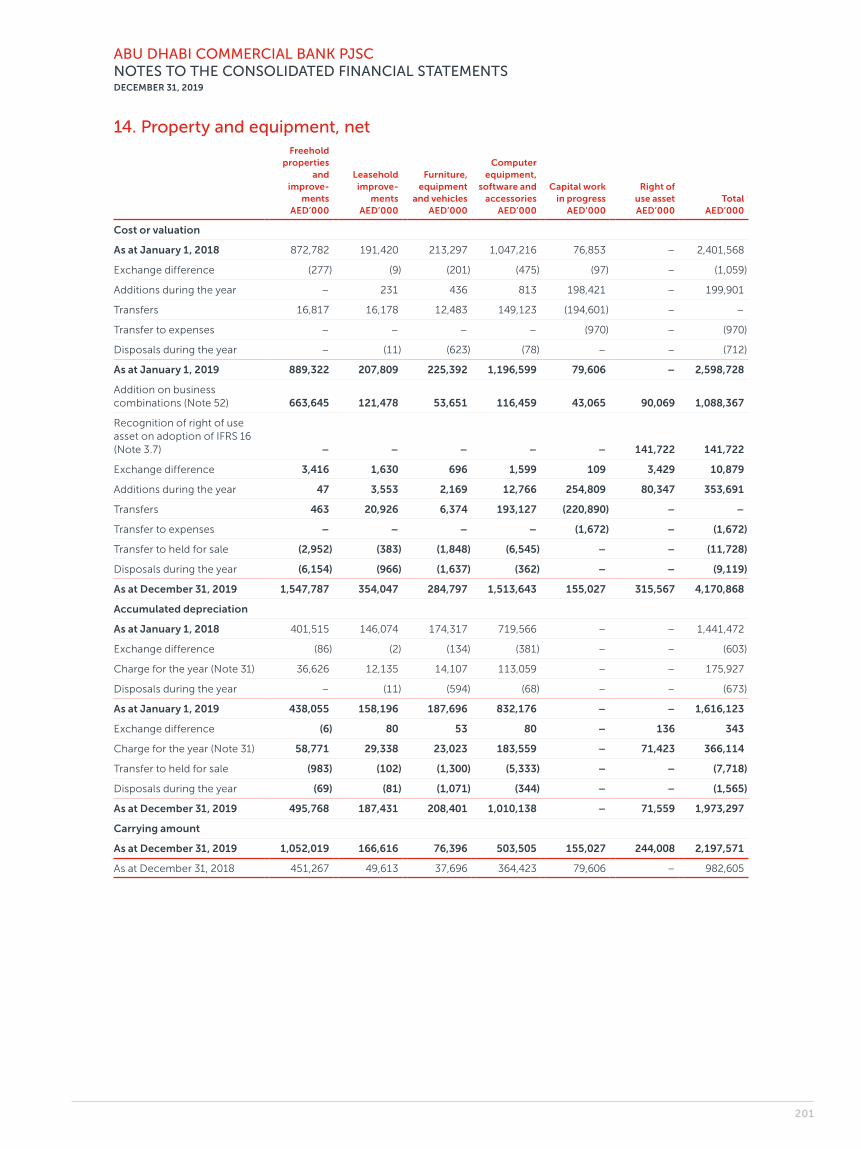
ABU DHABI COMMERCIAL BANK PJSCNOTES TO THE CONSOLIDATED FINANCIAL STATEMENTSDECEMBER 31, 2019
14. Property and equipment, netFreehold
properties and
improve-ments
AED’000
Leasehold improve-
ments AED’000
Furniture, equipment
and vehicles AED’000
Computer equipment,
software and accessories
AED’000
Capital work in progress
AED’000
Right of use asset AED’000
Total AED’000
Cost or valuation
As at January 1, 2018 872,782 191,420 213,297 1,047,216 76,853 – 2,401,568
Exchange difference (277) (9) (201) (475) (97) – (1,059)
Additions during the year – 231 436 813 198,421 – 199,901
Transfers 16,817 16,178 12,483 149,123 (194,601) – –
Transfer to expenses – – – – (970) – (970)
Disposals during the year – (11) (623) (78) – – (712)
As at January 1, 2019 889,322 207,809 225,392 1,196,599 79,606 – 2,598,728
Addition on business combinations (Note 52) 663,645 121,478 53,651 116,459 43,065 90,069 1,088,367
Recognition of right of use asset on adoption of IFRS 16 (Note 3.7) – – – – – 141,722 141,722
Exchange difference 3,416 1,630 696 1,599 109 3,429 10,879
Additions during the year 47 3,553 2,169 12,766 254,809 80,347 353,691
Transfers 463 20,926 6,374 193,127 (220,890) – –
Transfer to expenses – – – – (1,672) – (1,672)
Transfer to held for sale (2,952) (383) (1,848) (6,545) – – (11,728)
Disposals during the year (6,154) (966) (1,637) (362) – – (9,119)
As at December 31, 2019 1,547,787 354,047 284,797 1,513,643 155,027 315,567 4,170,868
Accumulated depreciation
As at January 1, 2018 401,515 146,074 174,317 719,566 – – 1,441,472
Exchange difference (86) (2) (134) (381) – – (603)
Charge for the year (Note 31) 36,626 12,135 14,107 113,059 – – 175,927
Disposals during the year – (11) (594) (68) – – (673)
As at January 1, 2019 438,055 158,196 187,696 832,176 – – 1,616,123
Exchange difference (6) 80 53 80 – 136 343
Charge for the year (Note 31) 58,771 29,338 23,023 183,559 – 71,423 366,114
Transfer to held for sale (983) (102) (1,300) (5,333) – – (7,718)
Disposals during the year (69) (81) (1,071) (344) – – (1,565)
As at December 31, 2019 495,768 187,431 208,401 1,010,138 – 71,559 1,973,297
Carrying amount
As at December 31, 2019 1,052,019 166,616 76,396 503,505 155,027 244,008 2,197,571
As at December 31, 2018 451,267 49,613 37,696 364,423 79,606 – 982,605
201

ABU DHABI COMMERCIAL BANK PJSCNOTES TO THE CONSOLIDATED FINANCIAL STATEMENTSDECEMBER 31, 2019
15. Intangible assets, netOther intangible assets
Goodwill AED’000
Trade mark and license
AED’000
Core deposits
AED’000
Customer relationships
AED’000Total
AED’000
Cost or valuation
As at January 1, 2019 18,800 – – – 18,800
Recognised on business combinations (Note 52) 4,592,872 244,000 457,000 84,000 5,377,872
As at December 31, 2019 4,611,672 244,000 457,000 84,000 5,396,672
Accumulated amortisation
As at January 1, 2019 – – – – –
Amortisation during the period (Note 31) – – 54,004 10,171 64,175
As at December 31, 2019 – – 54,004 10,171 64,175
Carrying amount
As at December 31, 2019 4,611,672 244,000 402,996 73,829 5,332,497
As at December 31, 2018 18,800 – – – 18,800
GOODWILL
GOODWILL ARISING ON BUSINESS COMBINATIONS DURING 2019
On May 1, 2019, Union National Bank PJSC (or “UNB”)
merged with Abu Dhabi Commercial Bank PJSC in a stock
transaction. The merged entity subsequently completed
100% acquisition of Al Hilal Bank PJSC (or “AHB”). Based
on the preliminary fair valuation and purchase price
allocation exercise performed by an external consultant
following the merger and acquisition, the Bank recog-
nised AED 785,000 thousand as intangible assets and AED
4,592,872 thousand as goodwill. As the purchase price
allocation exercise is expected to complete within twelve
months from the date of business combinations, it is pos-
sible that different values may be attributed to the assets,
liabilities and contingent liabilities acquired, and hence,
there can be a change in the value of goodwill recognised
on merger and acquisition (Refer Note 52 for details).
IMPAIRMENT ASSESSMENT OF GOODWILL
For the purposes of impairment testing, goodwill acquired
in a business combination is required to be allocated to
the CGUs. In a goodwill impairment test, the recoverable
amounts of the goodwill- carrying CGUs are compared
with the respective carrying amounts. The recoverable
amount is the higher of a CGU’s fair value less costs of
disposal and its value in use.
The key guidance offered by the standard is that CGU
selection will be influenced by “how management mon-
itors the entity’s operations (such as by product lines,
businesses, individual locations, districts or regional areas)
or how management makes decisions about continuing
or disposing of the entity’s assets and operations”.
Management has identified four CGUs for which the
residual Goodwill will be allocated and performance
monitored by management. The four CGUs are consist-
ent with the operating segments of ADCB determined in
accordance with IFRS 8 Operating Segments. The CGUs
are as follows:
• Wholesale banking
• Consumer banking
• Investments and treasury and
• Property management
However, the allocation logic will be finalised in the first
quarter of 2020 (within the measurement period) and
currently the testing is based on overall cost synergies
achieved by ADCB against the initial integration plan. After
the allocation logic is finalised, impairment assessment
will be based on cost synergies achieved by each CGU.
GOODWILL ARISING ON ACQUISITION OF RBS PORTFOLIO
On October 1, 2010, the Bank acquired the retail banking,
wealth management and small and medium enter-
prise businesses (the “Business”) of The Royal Bank of
Scotland (“RBS”) in the U.A.E. for a consideration of AED
168,900 thousand. Based on the fair valuation and pur-
chase price allocation exercise performed by an external
consultant immediately following the acquisition in 2010,
the Bank recognised AED 143,400 thousand as intangible
assets which were fully amortised during the previous
years and AED 18,800 thousand as goodwill.
No impairment loss on goodwill was recognised during
the year ended December 31, 2019 (2018 — AED Nil).
202

ABU DHABI COMMERCIAL BANK PJSCNOTES TO THE CONSOLIDATED FINANCIAL STATEMENTSDECEMBER 31, 2019
OTHER INTANGIBLE ASSETS
Trade mark and
license
AHB has built a strong franchise and has a reputation as a progressive Islamic bank offering a
wide range of client- centric Shari’ah-compliant retail banking products. The AHB brand plays
a key part in generating revenues for the Bank.
Egypt license This has been recognised as an intangible asset as Central Bank of Egypt has not issued a new
banking license to any entity for the past 20 years, and has therefore restricted engagement
in banking activities to banks already licensed and operating in Egypt. The license plays a key
part in generating revenues for the Bank. Egypt license was valued considering the market
approach using comparable transactions.
Customer
relationships
Customer relationship intangible assets represent the value attributable to the business
expected to be generated from customers that existed as at the acquisition date. In
determining the fair value of customer relationships, trade finance customers were
considered. These relationships are expected to generate material recurring income in the
form of fees and commission.
Core deposit
intangible
The value of core deposit intangible asset arises from the fact that the deposit base of the
Group represents a cheaper source of funding than wholesale or money market funding. The
spread between the cost of deposit funding and the cost of wholesale/money market funding
represents the value of the core deposit intangible.
Intangible asset Useful life
Customer relationships 3 to 6 years
Core deposit intangible 4.5 to 7 years
Trade mark and license Indefinite
16. Due to banksAs at
December 31 2019
AED’000
As at December 31
2018 AED’000
Vostro balances 1,739,098 870,881
Margin deposits 460,583 200,090
Time deposits 3,533,098 2,000,437
Total due to banks 5,732,779 3,071,408
The Group hedges certain foreign currency time deposits
for foreign currency and floating interest rate risks using
foreign exchange and interest rate swaps and designates
these swaps as either cash flow or fair value hedges. The
net positive fair value of these swaps at December 31,
2019 was AED 14,719 thousand (December 31, 2018 — net
negative fair value of AED 3,008 thousand).
17. Deposits from customersAs at
December 31 2019
AED’000
As at December 31
2018 AED’000
Time deposits 157,307,229 95,078,854
Current account deposits 78,022,123 54,855,845
Savings deposits 21,873,206 13,534,209
Murabaha deposits 2,490,166 11,549,497
Long-term government deposits 351,702 377,014
Margin deposits 2,049,356 1,258,438
Total deposits from customers 262,093,782 176,653,857
For Islamic deposits (excluding Murabaha deposits)
included in the above table, refer Note 23.
The Group hedges certain foreign currency time deposits
for foreign currency and floating interest rate risks using
foreign exchange and interest rate swaps and designates
these swaps as either cash flow or fair value hedges. The
net positive fair value of these swaps at December 31,
2019 was AED 52,648 thousand (December 31, 2018 —
net negative fair value of AED 40,044 thousand).
203
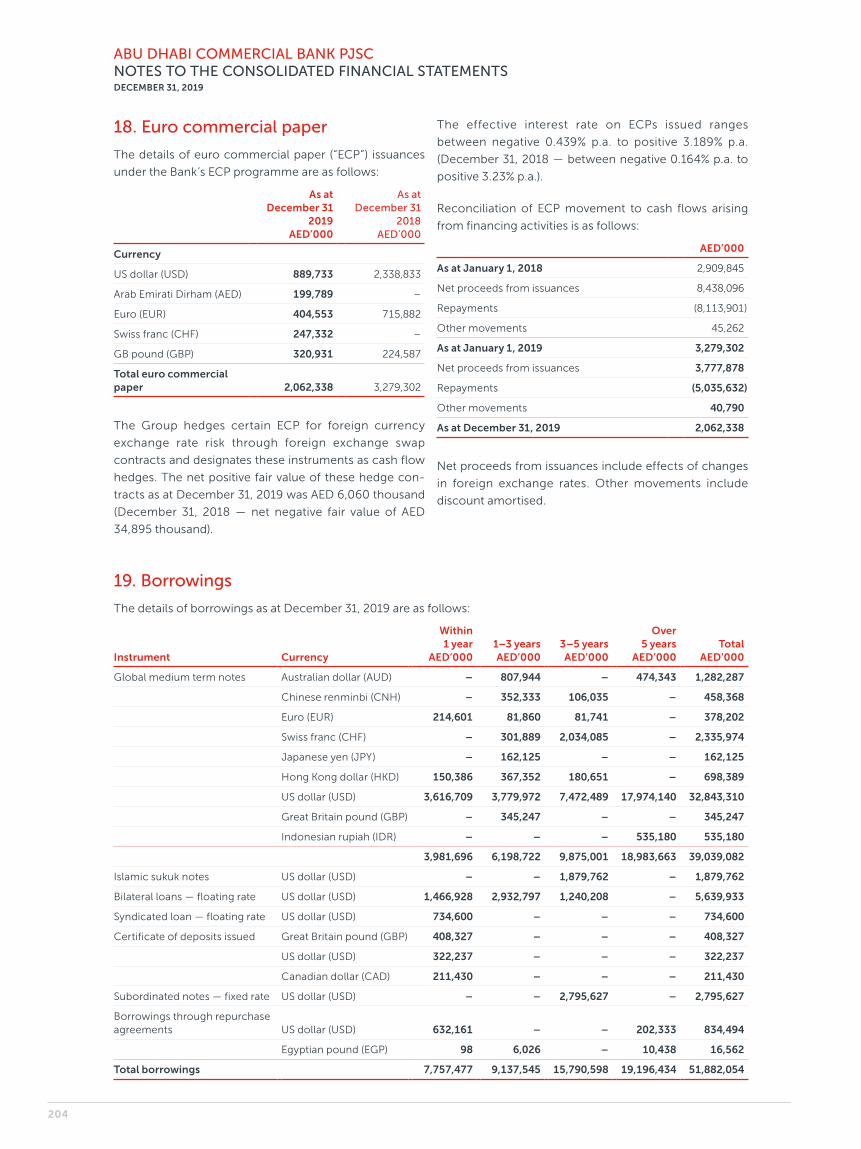
ABU DHABI COMMERCIAL BANK PJSCNOTES TO THE CONSOLIDATED FINANCIAL STATEMENTSDECEMBER 31, 2019
18. Euro commercial paper
The details of euro commercial paper (“ECP”) issuances
under the Bank’s ECP programme are as follows:
As at December 31
2019 AED’000
As at December 31
2018 AED’000
Currency
US dollar (USD) 889,733 2,338,833
Arab Emirati Dirham (AED) 199,789 –
Euro (EUR) 404,553 715,882
Swiss franc (CHF) 247,332 –
GB pound (GBP) 320,931 224,587
Total euro commercial paper 2,062,338 3,279,302
The Group hedges certain ECP for foreign currency
exchange rate risk through foreign exchange swap
contracts and designates these instruments as cash flow
hedges. The net positive fair value of these hedge con-
tracts as at December 31, 2019 was AED 6,060 thousand
(December 31, 2018 — net negative fair value of AED
34,895 thousand).
The effective interest rate on ECPs issued ranges
between negative 0.439% p.a. to positive 3.189% p.a.
(December 31, 2018 — between negative 0.164% p.a. to
positive 3.23% p.a.).
Reconciliation of ECP movement to cash flows arising
from financing activities is as follows:
AED’000
As at January 1, 2018 2,909,845
Net proceeds from issuances 8,438,096
Repayments (8,113,901)
Other movements 45,262
As at January 1, 2019 3,279,302
Net proceeds from issuances 3,777,878
Repayments (5,035,632)
Other movements 40,790
As at December 31, 2019 2,062,338
Net proceeds from issuances include effects of changes
in foreign exchange rates. Other movements include
discount amortised.
19. Borrowings
The details of borrowings as at December 31, 2019 are as follows:
Instrument Currency
Within 1 year
AED’0001–3 years AED’000
3–5 years AED’000
Over 5 years
AED’000Total
AED’000
Global medium term notes Australian dollar (AUD) – 807,944 – 474,343 1,282,287
Chinese renminbi (CNH) – 352,333 106,035 – 458,368
Euro (EUR) 214,601 81,860 81,741 – 378,202
Swiss franc (CHF) – 301,889 2,034,085 – 2,335,974
Japanese yen (JPY) – 162,125 – – 162,125
Hong Kong dollar (HKD) 150,386 367,352 180,651 – 698,389
US dollar (USD) 3,616,709 3,779,972 7,472,489 17,974,140 32,843,310
Great Britain pound (GBP) – 345,247 – – 345,247
Indonesian rupiah (IDR) – – – 535,180 535,180
3,981,696 6,198,722 9,875,001 18,983,663 39,039,082
Islamic sukuk notes US dollar (USD) – – 1,879,762 – 1,879,762
Bilateral loans — floating rate US dollar (USD) 1,466,928 2,932,797 1,240,208 – 5,639,933
Syndicated loan — floating rate US dollar (USD) 734,600 – – – 734,600
Certificate of deposits issued Great Britain pound (GBP) 408,327 – – – 408,327
US dollar (USD) 322,237 – – – 322,237
Canadian dollar (CAD) 211,430 – – – 211,430
Subordinated notes — fixed rate US dollar (USD) – – 2,795,627 – 2,795,627
Borrowings through repurchase agreements US dollar (USD) 632,161 – – 202,333 834,494
Egyptian pound (EGP) 98 6,026 – 10,438 16,562
Total borrowings 7,757,477 9,137,545 15,790,598 19,196,434 51,882,054
204
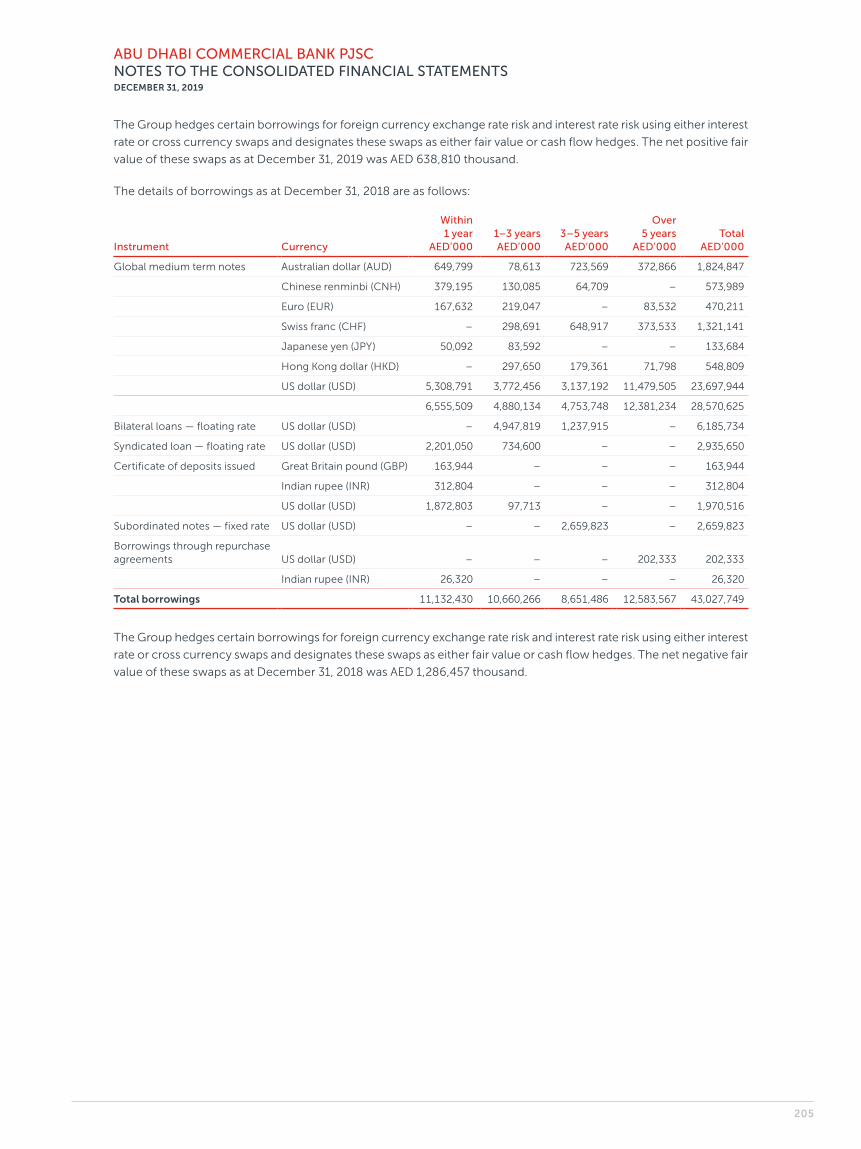
ABU DHABI COMMERCIAL BANK PJSCNOTES TO THE CONSOLIDATED FINANCIAL STATEMENTSDECEMBER 31, 2019
The Group hedges certain borrowings for foreign currency exchange rate risk and interest rate risk using either interest
rate or cross currency swaps and designates these swaps as either fair value or cash flow hedges. The net positive fair
value of these swaps as at December 31, 2019 was AED 638,810 thousand.
The details of borrowings as at December 31, 2018 are as follows:
Instrument Currency
Within 1 year
AED’0001–3 years AED’000
3–5 years AED’000
Over 5 years
AED’000Total
AED’000
Global medium term notes Australian dollar (AUD) 649,799 78,613 723,569 372,866 1,824,847
Chinese renminbi (CNH) 379,195 130,085 64,709 – 573,989
Euro (EUR) 167,632 219,047 – 83,532 470,211
Swiss franc (CHF) – 298,691 648,917 373,533 1,321,141
Japanese yen (JPY) 50,092 83,592 – – 133,684
Hong Kong dollar (HKD) – 297,650 179,361 71,798 548,809
US dollar (USD) 5,308,791 3,772,456 3,137,192 11,479,505 23,697,944
6,555,509 4,880,134 4,753,748 12,381,234 28,570,625
Bilateral loans — floating rate US dollar (USD) – 4,947,819 1,237,915 – 6,185,734
Syndicated loan — floating rate US dollar (USD) 2,201,050 734,600 – – 2,935,650
Certificate of deposits issued Great Britain pound (GBP) 163,944 – – – 163,944
Indian rupee (INR) 312,804 – – – 312,804
US dollar (USD) 1,872,803 97,713 – – 1,970,516
Subordinated notes — fixed rate US dollar (USD) – – 2,659,823 – 2,659,823
Borrowings through repurchase agreements US dollar (USD) – – – 202,333 202,333
Indian rupee (INR) 26,320 – – – 26,320
Total borrowings 11,132,430 10,660,266 8,651,486 12,583,567 43,027,749
The Group hedges certain borrowings for foreign currency exchange rate risk and interest rate risk using either interest
rate or cross currency swaps and designates these swaps as either fair value or cash flow hedges. The net negative fair
value of these swaps as at December 31, 2018 was AED 1,286,457 thousand.
205
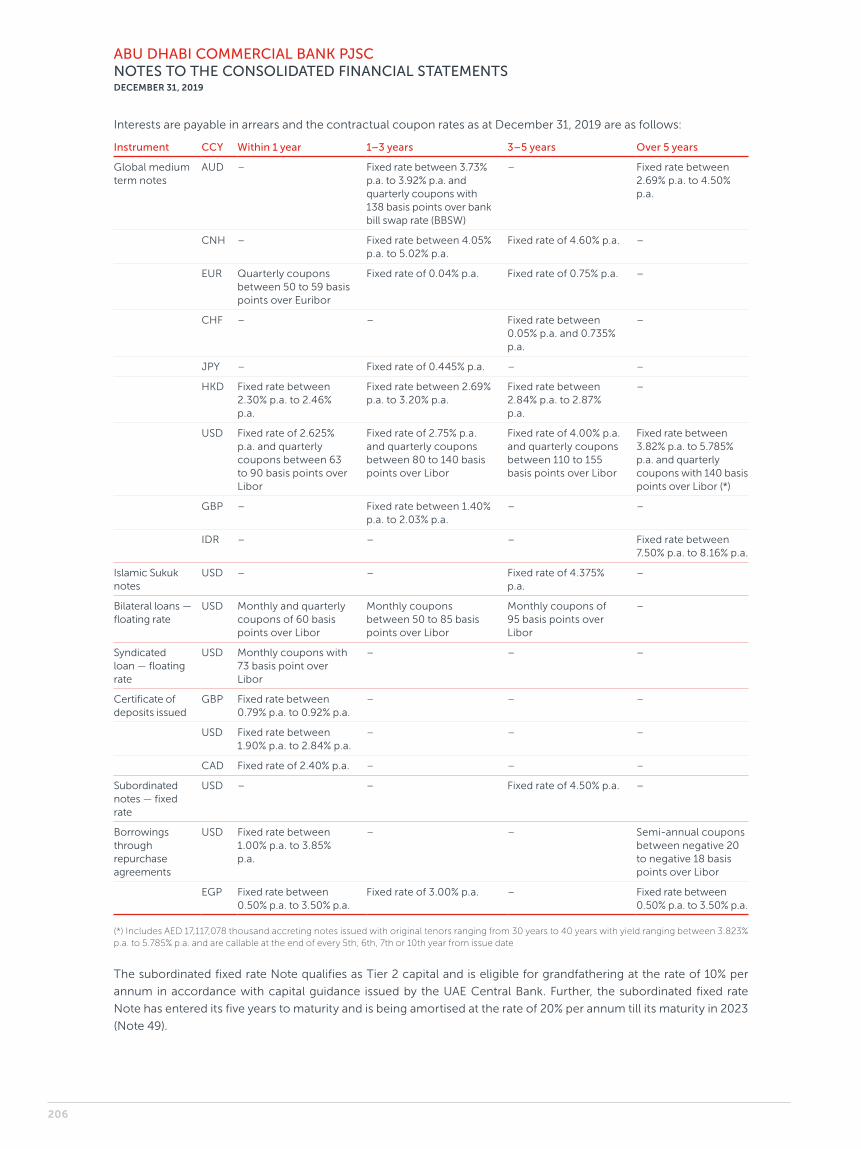
ABU DHABI COMMERCIAL BANK PJSCNOTES TO THE CONSOLIDATED FINANCIAL STATEMENTSDECEMBER 31, 2019
Interests are payable in arrears and the contractual coupon rates as at December 31, 2019 are as follows:
Instrument CCY Within 1 year 1–3 years 3–5 years Over 5 years
Global medium term notes
AUD – Fixed rate between 3.73% p.a. to 3.92% p.a. and quarterly coupons with 138 basis points over bank bill swap rate (BBSW)
– Fixed rate between 2.69% p.a. to 4.50% p.a.
CNH – Fixed rate between 4.05% p.a. to 5.02% p.a.
Fixed rate of 4.60% p.a. –
EUR Quarterly coupons between 50 to 59 basis points over Euribor
Fixed rate of 0.04% p.a. Fixed rate of 0.75% p.a. –
CHF – – Fixed rate between 0.05% p.a. and 0.735% p.a.
–
JPY – Fixed rate of 0.445% p.a. – –
HKD Fixed rate between 2.30% p.a. to 2.46% p.a.
Fixed rate between 2.69% p.a. to 3.20% p.a.
Fixed rate between 2.84% p.a. to 2.87% p.a.
–
USD Fixed rate of 2.625% p.a. and quarterly coupons between 63 to 90 basis points over Libor
Fixed rate of 2.75% p.a. and quarterly coupons between 80 to 140 basis points over Libor
Fixed rate of 4.00% p.a. and quarterly coupons between 110 to 155 basis points over Libor
Fixed rate between 3.82% p.a. to 5.785% p.a. and quarterly coupons with 140 basis points over Libor (*)
GBP – Fixed rate between 1.40% p.a. to 2.03% p.a.
– –
IDR – – – Fixed rate between 7.50% p.a. to 8.16% p.a.
Islamic Sukuk notes
USD – – Fixed rate of 4.375% p.a.
–
Bilateral loans — floating rate
USD Monthly and quarterly coupons of 60 basis points over Libor
Monthly coupons between 50 to 85 basis points over Libor
Monthly coupons of 95 basis points over Libor
–
Syndicated loan — floating rate
USD Monthly coupons with 73 basis point over Libor
– – –
Certificate of deposits issued
GBP Fixed rate between 0.79% p.a. to 0.92% p.a.
– – –
USD Fixed rate between 1.90% p.a. to 2.84% p.a.
– – –
CAD Fixed rate of 2.40% p.a. – – –
Subordinated notes — fixed rate
USD – – Fixed rate of 4.50% p.a. –
Borrowings through repurchase agreements
USD Fixed rate between 1.00% p.a. to 3.85% p.a.
– – Semi- annual coupons between negative 20 to negative 18 basis points over Libor
EGP Fixed rate between 0.50% p.a. to 3.50% p.a.
Fixed rate of 3.00% p.a. – Fixed rate between 0.50% p.a. to 3.50% p.a.
(*) Includes AED 17,117,078 thousand accreting notes issued with original tenors ranging from 30 years to 40 years with yield ranging between 3.823% p.a. to 5.785% p.a. and are callable at the end of every 5th, 6th, 7th or 10th year from issue date
The subordinated fixed rate Note qualifies as Tier 2 capital and is eligible for grandfathering at the rate of 10% per
annum in accordance with capital guidance issued by the UAE Central Bank. Further, the subordinated fixed rate
Note has entered its five years to maturity and is being amortised at the rate of 20% per annum till its maturity in 2023
(Note 49).
206

ABU DHABI COMMERCIAL BANK PJSCNOTES TO THE CONSOLIDATED FINANCIAL STATEMENTSDECEMBER 31, 2019
Reconciliation of borrowings movement to cash flows
arising from financing activities is as follows:
AED’000
As at January 1, 2018 40,555,195
Net proceeds from issuances 20,109,045
Repayments (17,105,210)
Other movements (531,281)
As at January 1, 2019 43,027,749
Net proceeds from issuances 18,012,653
Addition on business combinations (Note 52) 8,152,427
Repayments (19,799,050)
Other movements 2,488,275
As at December 31, 2019 51,882,054
Net proceeds from issuances include effects of changes in
foreign exchange rates on borrowings. Other movements
include interest capitalised on accreting notes, discount
on issuances amortised and changes in fair value hedges.
20. Other liabilitiesAs at
December 31 2019
AED’000
As at December 31
2018 AED’000
Interest payable 1,758,479 1,409,503
Recognised liability for defined benefit obligation 633,262 487,995
Accounts payable and other creditors 353,293 215,558
Deferred income 813,968 672,303
Acceptances (Note 13) 12,726,229 10,531,047
Impairment allowance on letters of credit, guarantees and other commitments (Note 42.3) 1,432,363 349,752
Others (*) 2,585,200 1,630,410
Total other liabilities 20,302,794 15,296,568
(*) Includes AED 226,828 thousand pertaining to lease liability as at December 31, 2019 (December 31, 2018 — AED Nil)
DEFINED BENEFIT OBLIGATION
The Group provides gratuity benefits to its eligible
employees in UAE. The most recent actuarial valuations
of the present value of the defined benefit obligation
were carried out in the last quarter of 2019 by a registered
actuary in the UAE. The present value of the defined
benefit obligation and the related current and past
service cost, were measured using the Projected Unit
Credit Method.
Key assumptions used in the actuarial valuation are
as follows:
Discount rate: 2.80% p.a.
Salary increment rate: 3.00% p.a.
Demographic assumptions for mortality and retirement
were used in valuing the liabilities and benefits under
the plan.
The liability would be higher by AED 20,524 thousand had
the discount rate used in the assumption been lower by
0.50% and the liability would be lower by AED 19,333 thou-
sand had the discount rate used in the assumption been
higher by 0.50%. Similarly, the liability would be higher
by AED 18,637 thousand had the salary increment rate
used in the assumption been higher by 0.50% and the
liability would be lower by AED 17,714 thousand had the
salary increment rate used in the assumption been lower
by 0.50%.
The movement in defined benefit obligation is as follows:
2019 AED’000
2018 AED’000
Opening balance 487,995 453,866
Addition on business combinations 206,825 –
Net charge during the year(*) 74,158 80,097
Actuarial gains on defined benefit obligation (16,773) (13,157)
Benefits paid (118,943) (32,811)
Closing balance 633,262 487,995
(*) Recognised under “staff costs” in the consolidated income statement
207
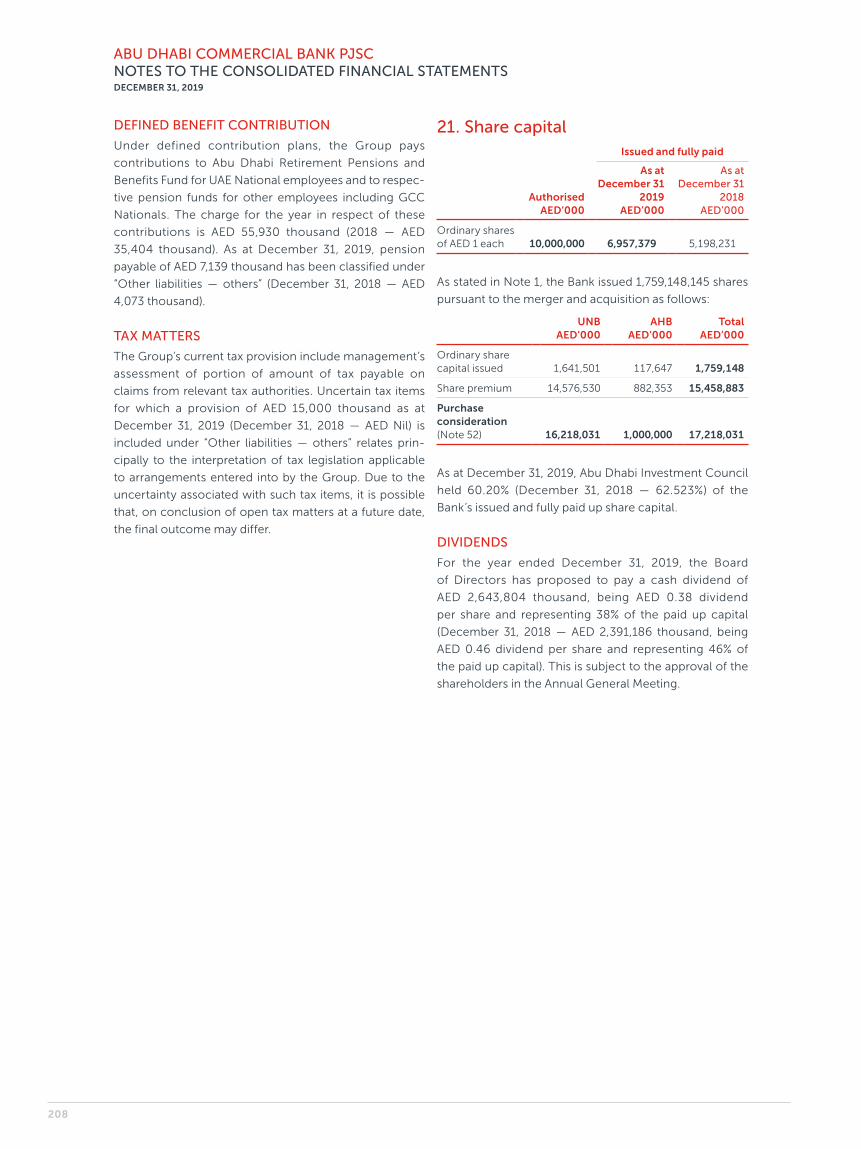
ABU DHABI COMMERCIAL BANK PJSCNOTES TO THE CONSOLIDATED FINANCIAL STATEMENTSDECEMBER 31, 2019
DEFINED BENEFIT CONTRIBUTION
Under defined contribution plans, the Group pays
contributions to Abu Dhabi Retirement Pensions and
Benefits Fund for UAE National employees and to respec-
tive pension funds for other employees including GCC
Nationals. The charge for the year in respect of these
contributions is AED 55,930 thousand (2018 — AED
35,404 thousand). As at December 31, 2019, pension
payable of AED 7,139 thousand has been classified under
“Other liabilities — others” (December 31, 2018 — AED
4,073 thousand).
TAX MATTERS
The Group’s current tax provision include management’s
assessment of portion of amount of tax payable on
claims from relevant tax authorities. Uncertain tax items
for which a provision of AED 15,000 thousand as at
December 31, 2019 (December 31, 2018 — AED Nil) is
included under “Other liabilities — others” relates prin-
cipally to the interpretation of tax legislation applicable
to arrangements entered into by the Group. Due to the
uncertainty associated with such tax items, it is possible
that, on conclusion of open tax matters at a future date,
the final outcome may differ.
21. Share capitalIssued and fully paid
Authorised AED’000
As at December 31
2019 AED’000
As at December 31
2018 AED’000
Ordinary shares of AED 1 each 10,000,000 6,957,379 5,198,231
As stated in Note 1, the Bank issued 1,759,148,145 shares
pursuant to the merger and acquisition as follows:
UNB AED’000
AHB AED’000
Total AED’000
Ordinary share capital issued 1,641,501 117,647 1,759,148
Share premium 14,576,530 882,353 15,458,883
Purchase consideration (Note 52) 16,218,031 1,000,000 17,218,031
As at December 31, 2019, Abu Dhabi Investment Council
held 60.20% (December 31, 2018 — 62.523%) of the
Bank’s issued and fully paid up share capital.
DIVIDENDS
For the year ended December 31, 2019, the Board
of Directors has proposed to pay a cash dividend of
AED 2,643,804 thousand, being AED 0.38 dividend
per share and representing 38% of the paid up capital
(December 31, 2018 — AED 2,391,186 thousand, being
AED 0.46 dividend per share and representing 46% of
the paid up capital). This is subject to the approval of the
shareholders in the Annual General Meeting.
208
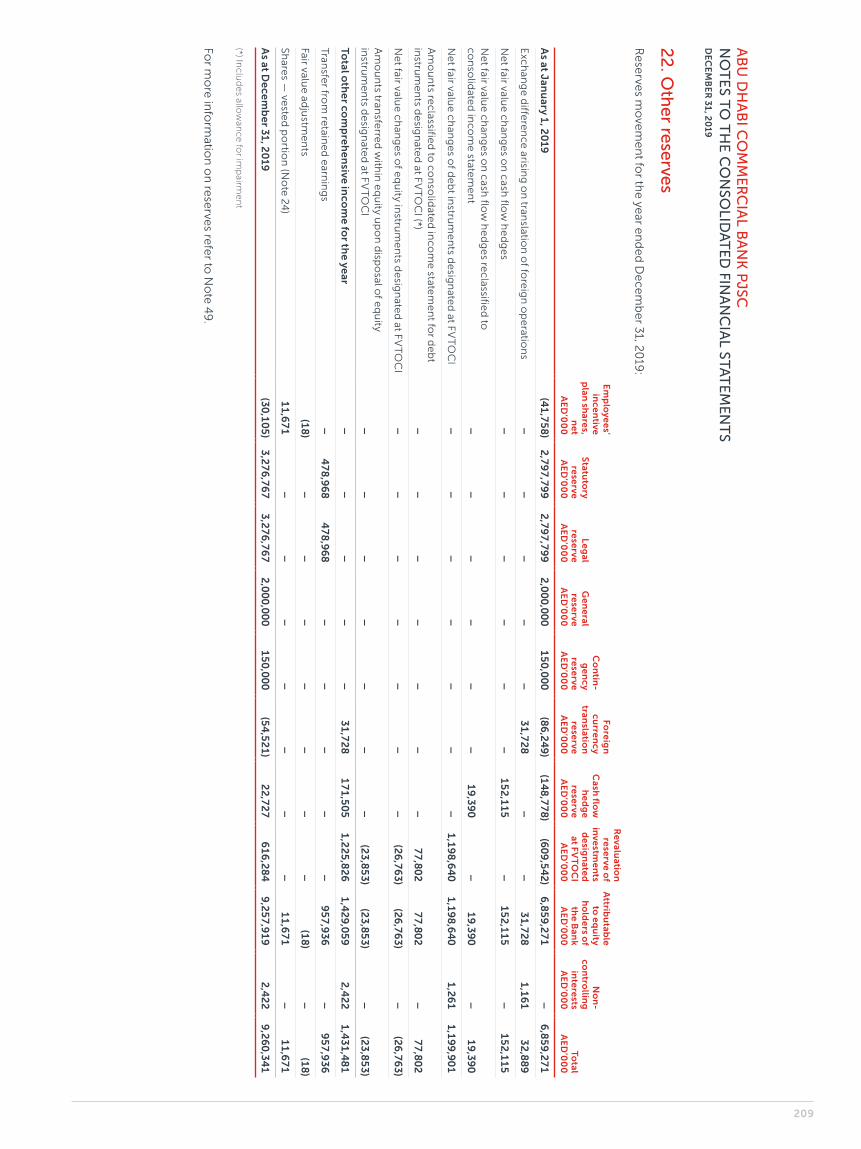
AB
U D
HA
BI C
OM
ME
RC
IAL B
AN
K P
JSCN
OT
ES T
O T
HE
CO
NSO
LIDA
TE
D FIN
AN
CIA
L STA
TE
ME
NT
SD
EC
EM
BE
R 3
1, 2
019
22
. Oth
er re
serve
s
Re
serve
s mo
vem
en
t for th
e ye
ar en
de
d D
ece
mb
er 3
1, 20
19:
Em
plo
yee
s’ in
cen
tive p
lan sh
ares,
ne
t A
ED
’00
0
Statu
tory
rese
rve A
ED
’00
0
Le
gal
rese
rve A
ED
’00
0
Ge
ne
ral re
serve
AE
D’0
00
Co
ntin
-g
en
cy
rese
rve A
ED
’00
0
Fore
ign
cu
rren
cy
translatio
n
rese
rve A
ED
’00
0
Cash
flow
h
ed
ge
rese
rve A
ED
’00
0
Re
valuatio
n
rese
rve of
inve
stme
nts
de
sign
ated
at F
VT
OC
I A
ED
’00
0
Attrib
utab
le to
eq
uity
ho
lde
rs of
the B
ank
AE
D’0
00
No
n-
con
trollin
g
inte
rests
AE
D’0
00
Total
AE
D’0
00
As at J
anu
ary 1, 2
019
(41
,75
8)
2,7
97
,79
92
,79
7,7
99
2,0
00
,00
01
50
,00
0(8
6,2
49
)(1
48
,77
8)
(60
9,5
42
)6
,85
9,2
71
–6
,85
9,2
71
Exc
han
ge
diffe
ren
ce arisin
g o
n tran
slation
of fo
reig
n o
pe
ration
s–
––
––
31
,72
8–
–3
1,7
28
1,1
61
32
,88
9
Ne
t fair value
ch
ang
es o
n c
ash flo
w h
ed
ge
s–
––
––
–1
52
,11
5–
15
2,1
15
–1
52
,11
5
Ne
t fair value
ch
ang
es o
n c
ash flo
w h
ed
ge
s rec
lassified
to
con
solid
ated
inco
me
statem
en
t–
––
––
–1
9,3
90
–1
9,3
90
–1
9,3
90
Ne
t fair value
ch
ang
es o
f de
bt in
strum
en
ts de
sign
ated
at FV
TO
CI
––
––
––
–1
,19
8,6
40
1,1
98
,64
01
,26
11
,19
9,9
01
Am
ou
nts re
classifie
d to
con
solid
ated
inco
me
statem
en
t for d
eb
t in
strum
en
ts de
sign
ated
at FV
TO
CI (*)
––
––
––
–7
7,8
02
77
,80
2–
77
,80
2
Ne
t fair value
ch
ang
es o
f eq
uity in
strum
en
ts de
sign
ated
at FV
TO
CI
––
––
––
–(2
6,7
63
)(2
6,7
63
)–
(26
,76
3)
Am
ou
nts tran
sferre
d w
ithin
eq
uity u
po
n d
ispo
sal of e
qu
ity in
strum
en
ts de
sign
ated
at FV
TO
CI
––
––
––
–(2
3,8
53
)(2
3,8
53
)–
(23
,85
3)
Total o
the
r com
pre
he
nsive in
com
e for th
e year
––
––
–3
1,7
28
17
1,5
05
1,2
25
,82
61
,42
9,0
59
2,4
22
1,4
31
,48
1
Transfe
r from
retain
ed
earn
ing
s–
47
8,9
68
47
8,9
68
––
––
–9
57
,93
6–
95
7,9
36
Fair value
adju
stme
nts
(18
)–
––
––
––
(18
)–
(18
)
Sh
ares —
veste
d p
ortio
n (N
ote
24)
11
,67
1–
––
––
––
11
,67
1–
11
,67
1
As at D
ece
mb
er 3
1, 2
019
(30
,10
5)
3,2
76
,76
73
,27
6,7
67
2,0
00
,00
01
50
,00
0(5
4,5
21
)2
2,7
27
61
6,2
84
9,2
57
,91
92
,42
29
,26
0,3
41
(*) Inc
lud
es allo
wan
ce fo
r imp
airme
nt
For m
ore
info
rmatio
n o
n re
serve
s refe
r to N
ote
49
.
209
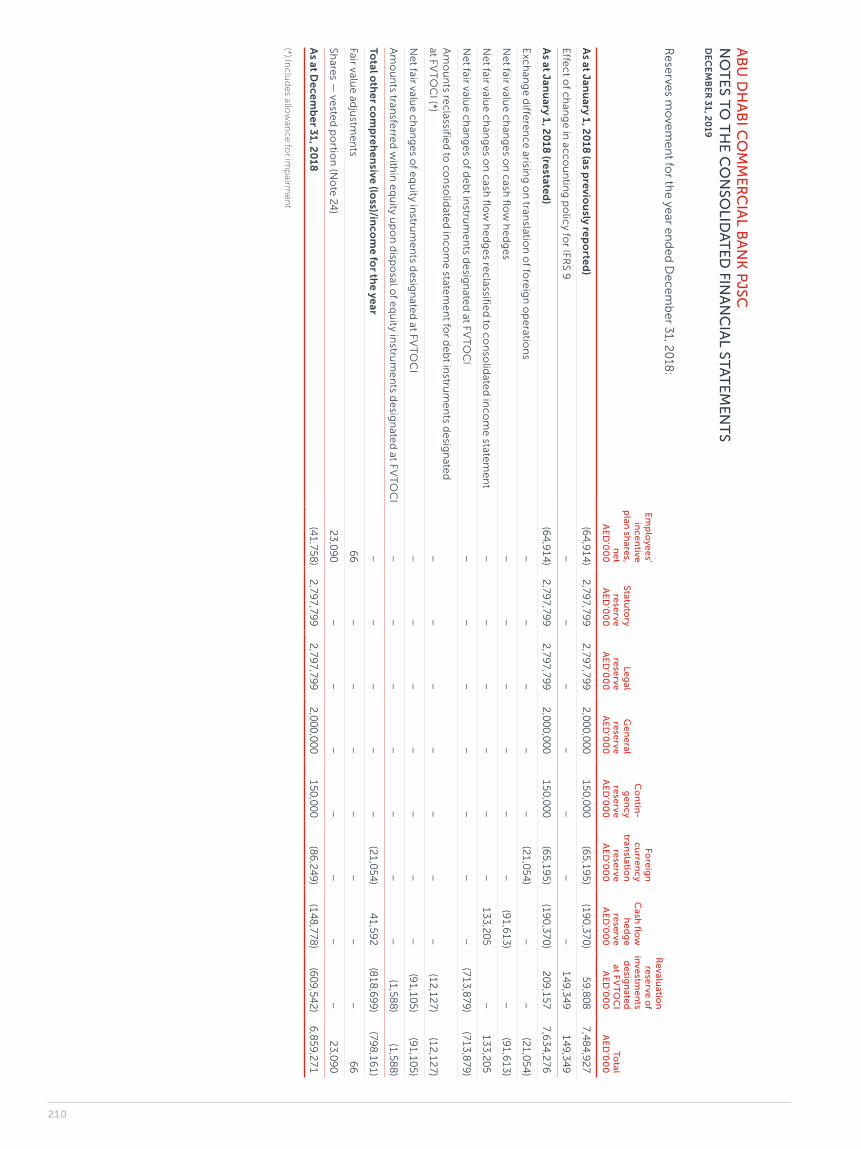
AB
U D
HA
BI C
OM
ME
RC
IAL B
AN
K P
JSCN
OT
ES T
O T
HE
CO
NSO
LIDA
TE
D FIN
AN
CIA
L STA
TE
ME
NT
SD
EC
EM
BE
R 3
1, 2
019
Re
serve
s mo
vem
en
t for th
e ye
ar en
de
d D
ece
mb
er 3
1, 20
18:
Em
plo
yee
s’ in
ce
ntive
p
lan sh
ares,
ne
t A
ED
’00
0
Statu
tory
rese
rve
AE
D’0
00
Leg
al re
serve
A
ED
’00
0
Ge
ne
ral re
serve
A
ED
’00
0
Co
ntin
-g
en
cy
rese
rve
AE
D’0
00
Fore
ign
c
urre
nc
y tran
slation
re
serve
A
ED
’00
0
Cash
flow
h
ed
ge
re
serve
A
ED
’00
0
Re
valuatio
n
rese
rve o
f in
vestm
en
ts d
esig
nate
d
at FV
TO
CI
AE
D’0
00
Total
AE
D’0
00
As at J
anu
ary 1, 2
018
(as pre
viou
sly rep
orte
d)
(64
,91
4)
2,7
97
,79
92
,79
7,7
99
2,0
00
,00
01
50
,00
0(6
5,1
95
)(1
90
,37
0)
59
,80
87
,48
4,9
27
Effe
ct o
f ch
ang
e in
accou
ntin
g p
olic
y for IFR
S 9–
––
––
––
14
9,3
49
14
9,3
49
As at J
anu
ary 1, 2
018
(restate
d)
(64
,91
4)
2,7
97
,79
92
,79
7,7
99
2,0
00
,00
01
50
,00
0(6
5,1
95
)(1
90
,37
0)
20
9,1
57
7,6
34
,27
6
Exc
han
ge
diffe
ren
ce arisin
g o
n tran
slation
of fo
reig
n o
pe
ration
s–
––
––
(21
,05
4)
––
(21
,05
4)
Ne
t fair value
ch
ang
es o
n c
ash flo
w h
ed
ge
s–
––
––
–(9
1,6
13
)–
(91
,61
3)
Ne
t fair value
ch
ang
es o
n c
ash flo
w h
ed
ge
s rec
lassified
to co
nso
lidate
d in
com
e state
me
nt
––
––
––
13
3,2
05
–1
33
,20
5
Ne
t fair value
ch
ang
es o
f de
bt in
strum
en
ts de
sign
ated
at FV
TO
CI
––
––
––
–(7
13
,87
9)
(71
3,8
79
)
Am
ou
nts re
classifie
d to
con
solid
ated
inco
me
statem
en
t for d
eb
t instru
me
nts d
esig
nate
d
at FV
TO
CI (*)
––
––
––
–(1
2,1
27
)(1
2,1
27
)
Ne
t fair value
ch
ang
es o
f eq
uity in
strum
en
ts de
sign
ated
at FV
TO
CI
––
––
––
–(9
1,1
05
)(9
1,1
05
)
Am
ou
nts tran
sferre
d w
ithin
eq
uity u
po
n d
ispo
sal of e
qu
ity instru
me
nts d
esig
nate
d at F
VT
OC
I–
––
––
––
(1,5
88
)(1
,58
8)
Total o
the
r com
pre
he
nsive (lo
ss)/inco
me fo
r the ye
ar–
––
––
(21
,05
4)
41
,59
2(8
18
,69
9)
(79
8,1
61
)
Fair value
adju
stme
nts
66
––
––
––
–6
6
Sh
ares —
veste
d p
ortio
n (N
ote
24)
23
,09
0–
––
––
––
23
,09
0
As at D
ece
mb
er 3
1, 2
018
(41
,75
8)
2,7
97
,79
92
,79
7,7
99
2,0
00
,00
01
50
,00
0(8
6,2
49
)(1
48
,77
8)
(60
9,5
42
)6
,85
9,2
71
(*) Inc
lud
es allo
wan
ce fo
r imp
airme
nt
210

ABU DHABI COMMERCIAL BANK PJSCNOTES TO THE CONSOLIDATED FINANCIAL STATEMENTSDECEMBER 31, 2019
23. Islamic financingIslamic financing assets
2019 AED’000
2018 AED’000
Murabaha 21,206,387 3,633,709
Ijara financing 19,515,742 11,436,508
Salam 6,556,904 6,596,310
Others 442,512 234,908
Gross Islamic financing assets 47,721,545 21,901,435
Less: Allowance for impairment (845,643) (568,667)
Net Islamic financing assets 46,875,902 21,332,768
Gross Ijara and related present value of the minimum Ijara payments
2019 AED’000
2018 AED’000
Not later than one year 4,706,988 2,053,800
Later than one year but not later than five years 11,216,570 5,446,449
Later than five years 9,514,024 6,981,305
Gross Ijara 25,437,582 14,481,554
Less: Deferred income (5,921,840) (3,045,046)
Net Ijara 19,515,742 11,436,508
Net present value
Not later than one year 3,694,475 1,622,121
Later than one year but not later than five years 8,633,960 4,301,684
Later than five years 7,187,307 5,512,703
Total net present value 19,515,742 11,436,508
Income from Islamic financing2019
AED’0002018
AED’000
Murabaha 1,025,079 202,823
Ijara financing 938,843 602,533
Salam 409,329 455,829
Sukuk investments 74,343 –
Others 48,372 15,561
Total income from Islamic financing 2,495,966 1,276,746
Islamic deposits2019
AED’0002018
AED’000
Current account deposits 11,507,685 4,282,450
Margin deposits 252,100 75,248
Mudaraba savings deposits 11,401,045 6,732,645
Mudaraba term deposits 1,324,282 621,365
Wakala deposits 22,491,377 5,228,283
Total Islamic deposits 46,976,489 16,939,991
Islamic profit distribution2019
AED’0002018
AED’000
Mudaraba savings and term deposits 88,831 66,960
Wakala deposits 599,640 102,941
Islamic sukuk notes and reverse murabaha 79,138 –
Total Islamic profit distribution 767,609 169,901
24. Employees’ incentive plan shares, net
The Group operates Deferred Compensation Plan (the
“Plan”) to recognise and retain good performing employ-
ees. Under the Plan, the employees are granted shares of
the Bank when they meet the vesting conditions at a price
prevailing at the grant date. These shares are acquired and
held by a subsidiary of the Bank until vesting conditions
are met. The Board Nomination Compensation HR and
Governance Committee determines and approves the
shares to be granted to employees based on the Group’s
key performance indicators.
As at December 31, 2019, the Group had the following
incentive plan in force as described below:
Grant date January 1, 2017
Number of shares granted 2,675,000
Fair value of the granted shares at the grant date in AED thousand 18,458
Vesting date December 31, 2020
Vesting conditions — Four years’ service from the grant
date or meeting special conditions during the vesting
period (death, disability, retirement, termination or
achieving the budgeted performance).
The movement of plan shares is as follows:
2019 2018
Opening balance 5,184,158 9,614,022
Exercised during the year (2,685,579) (3,921,450)
Forfeited during the year (253,579) (508,414)
Closing balance 2,245,000 5,184,158
Amount of “Plan” cost recognised under “staff costs” in the consolidated income statement (AED ‘000) 11,671 23,090
Total number of un- allotted shares under the Plan as at
December 31, 2019 were 4,105,237 shares (December 31,
2018 — 3,851,658 shares). These un- allotted shares
include forfeited shares and shares purchased for
future awards.
211
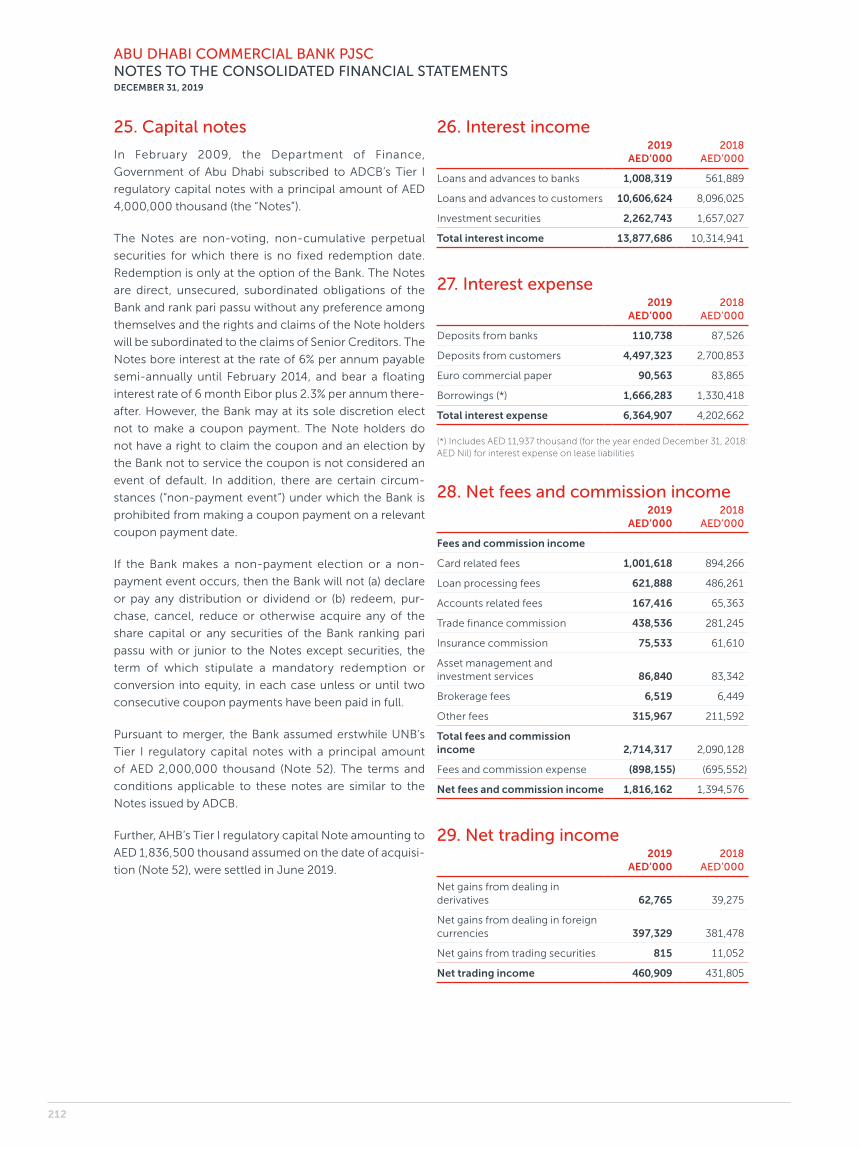
ABU DHABI COMMERCIAL BANK PJSCNOTES TO THE CONSOLIDATED FINANCIAL STATEMENTSDECEMBER 31, 2019
25. Capital notes
In February 2009, the Department of Finance,
Government of Abu Dhabi subscribed to ADCB’s Tier I
regulatory capital notes with a principal amount of AED
4,000,000 thousand (the “Notes”).
The Notes are non- voting, non- cumulative perpetual
securities for which there is no fixed redemption date.
Redemption is only at the option of the Bank. The Notes
are direct, unsecured, subordinated obligations of the
Bank and rank pari passu without any preference among
themselves and the rights and claims of the Note holders
will be subordinated to the claims of Senior Creditors. The
Notes bore interest at the rate of 6% per annum payable
semi- annually until February 2014, and bear a floating
interest rate of 6 month Eibor plus 2.3% per annum there-
after. However, the Bank may at its sole discretion elect
not to make a coupon payment. The Note holders do
not have a right to claim the coupon and an election by
the Bank not to service the coupon is not considered an
event of default. In addition, there are certain circum-
stances (“non- payment event”) under which the Bank is
prohibited from making a coupon payment on a relevant
coupon payment date.
If the Bank makes a non- payment election or a non-
payment event occurs, then the Bank will not (a) declare
or pay any distribution or dividend or (b) redeem, pur-
chase, cancel, reduce or otherwise acquire any of the
share capital or any securities of the Bank ranking pari
passu with or junior to the Notes except securities, the
term of which stipulate a mandatory redemption or
conversion into equity, in each case unless or until two
consecutive coupon payments have been paid in full.
Pursuant to merger, the Bank assumed erstwhile UNB’s
Tier I regulatory capital notes with a principal amount
of AED 2,000,000 thousand (Note 52). The terms and
conditions applicable to these notes are similar to the
Notes issued by ADCB.
Further, AHB’s Tier I regulatory capital Note amounting to
AED 1,836,500 thousand assumed on the date of acquisi-
tion (Note 52), were settled in June 2019.
26. Interest income2019
AED’0002018
AED’000
Loans and advances to banks 1,008,319 561,889
Loans and advances to customers 10,606,624 8,096,025
Investment securities 2,262,743 1,657,027
Total interest income 13,877,686 10,314,941
27. Interest expense2019
AED’0002018
AED’000
Deposits from banks 110,738 87,526
Deposits from customers 4,497,323 2,700,853
Euro commercial paper 90,563 83,865
Borrowings (*) 1,666,283 1,330,418
Total interest expense 6,364,907 4,202,662
(*) Includes AED 11,937 thousand (for the year ended December 31, 2018: AED Nil) for interest expense on lease liabilities
28. Net fees and commission income2019
AED’0002018
AED’000
Fees and commission income
Card related fees 1,001,618 894,266
Loan processing fees 621,888 486,261
Accounts related fees 167,416 65,363
Trade finance commission 438,536 281,245
Insurance commission 75,533 61,610
Asset management and investment services 86,840 83,342
Brokerage fees 6,519 6,449
Other fees 315,967 211,592
Total fees and commission income 2,714,317 2,090,128
Fees and commission expense (898,155) (695,552)
Net fees and commission income 1,816,162 1,394,576
29. Net trading income2019
AED’0002018
AED’000
Net gains from dealing in derivatives 62,765 39,275
Net gains from dealing in foreign currencies 397,329 381,478
Net gains from trading securities 815 11,052
Net trading income 460,909 431,805
212
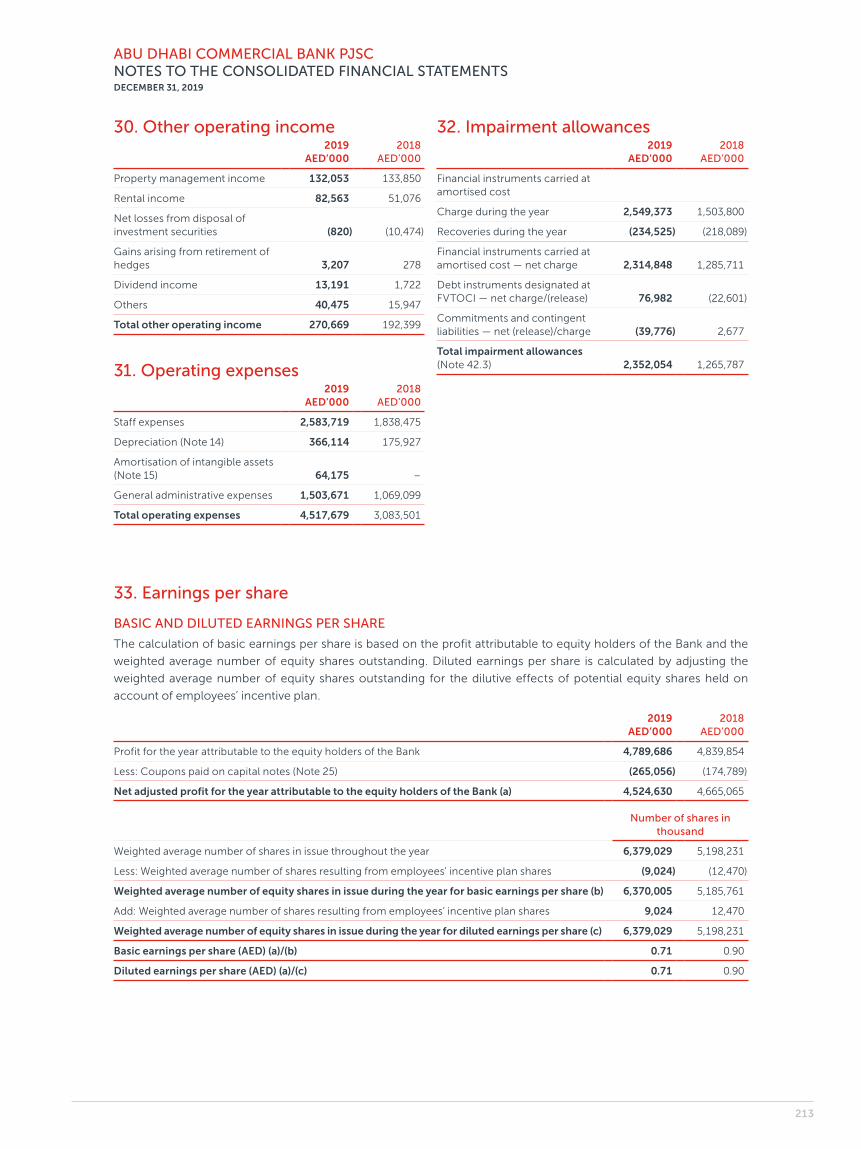
ABU DHABI COMMERCIAL BANK PJSCNOTES TO THE CONSOLIDATED FINANCIAL STATEMENTSDECEMBER 31, 2019
30. Other operating income2019
AED’0002018
AED’000
Property management income 132,053 133,850
Rental income 82,563 51,076
Net losses from disposal of investment securities (820) (10,474)
Gains arising from retirement of hedges 3,207 278
Dividend income 13,191 1,722
Others 40,475 15,947
Total other operating income 270,669 192,399
31. Operating expenses2019
AED’0002018
AED’000
Staff expenses 2,583,719 1,838,475
Depreciation (Note 14) 366,114 175,927
Amortisation of intangible assets (Note 15) 64,175 –
General administrative expenses 1,503,671 1,069,099
Total operating expenses 4,517,679 3,083,501
32. Impairment allowances2019
AED’0002018
AED’000
Financial instruments carried at amortised cost
Charge during the year 2,549,373 1,503,800
Recoveries during the year (234,525) (218,089)
Financial instruments carried at amortised cost — net charge 2,314,848 1,285,711
Debt instruments designated at FVTOCI — net charge/(release) 76,982 (22,601)
Commitments and contingent liabilities — net (release)/charge (39,776) 2,677
Total impairment allowances (Note 42.3) 2,352,054 1,265,787
33. Earnings per share
BASIC AND DILUTED EARNINGS PER SHARE
The calculation of basic earnings per share is based on the profit attributable to equity holders of the Bank and the
weighted average number of equity shares outstanding. Diluted earnings per share is calculated by adjusting the
weighted average number of equity shares outstanding for the dilutive effects of potential equity shares held on
account of employees’ incentive plan.
2019 AED’000
2018 AED’000
Profit for the year attributable to the equity holders of the Bank 4,789,686 4,839,854
Less: Coupons paid on capital notes (Note 25) (265,056) (174,789)
Net adjusted profit for the year attributable to the equity holders of the Bank (a) 4,524,630 4,665,065
Number of shares in thousand
Weighted average number of shares in issue throughout the year 6,379,029 5,198,231
Less: Weighted average number of shares resulting from employees’ incentive plan shares (9,024) (12,470)
Weighted average number of equity shares in issue during the year for basic earnings per share (b) 6,370,005 5,185,761
Add: Weighted average number of shares resulting from employees’ incentive plan shares 9,024 12,470
Weighted average number of equity shares in issue during the year for diluted earnings per share (c) 6,379,029 5,198,231
Basic earnings per share (AED) (a)/(b) 0.71 0.90
Diluted earnings per share (AED) (a)/(c) 0.71 0.90
213
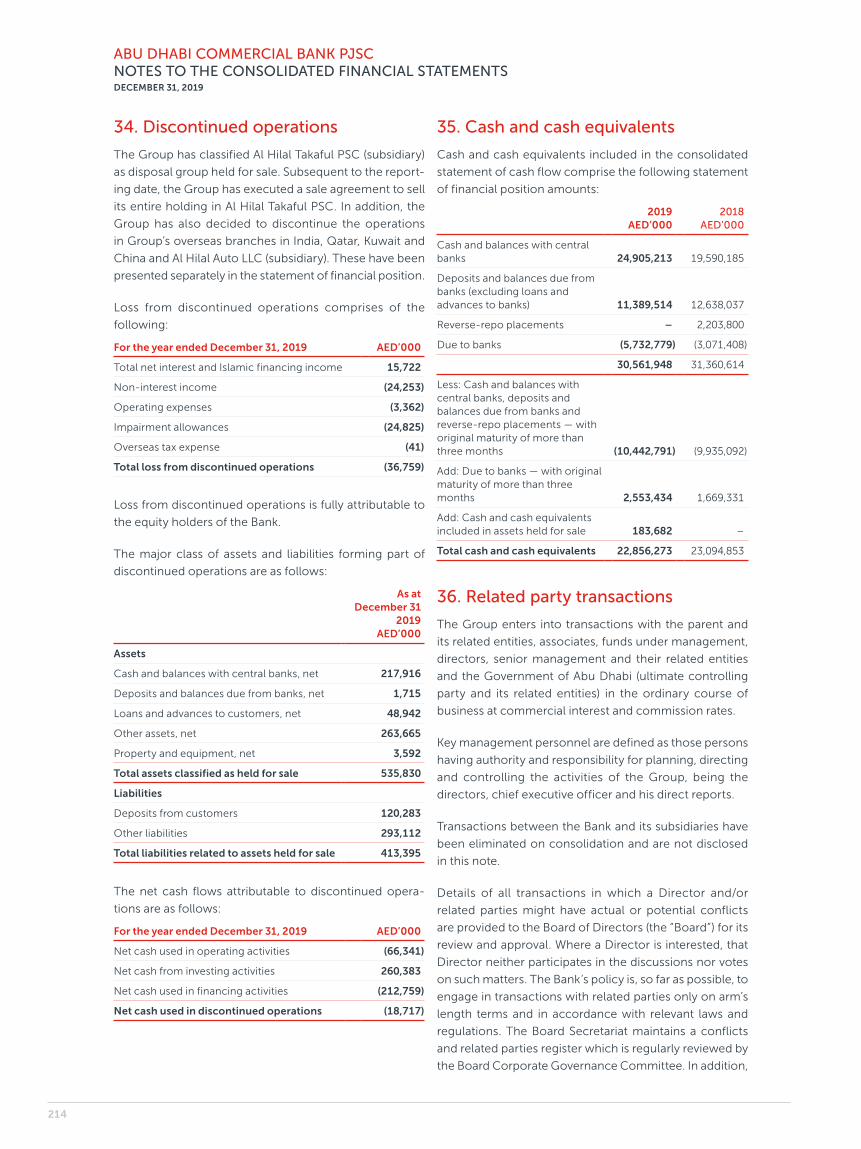
ABU DHABI COMMERCIAL BANK PJSCNOTES TO THE CONSOLIDATED FINANCIAL STATEMENTSDECEMBER 31, 2019
34. Discontinued operations
The Group has classified Al Hilal Takaful PSC (subsidiary)
as disposal group held for sale. Subsequent to the report-
ing date, the Group has executed a sale agreement to sell
its entire holding in Al Hilal Takaful PSC. In addition, the
Group has also decided to discontinue the operations
in Group’s overseas branches in India, Qatar, Kuwait and
China and Al Hilal Auto LLC (subsidiary). These have been
presented separately in the statement of financial position.
Loss from discontinued operations comprises of the
following:
For the year ended December 31, 2019 AED’000
Total net interest and Islamic financing income 15,722
Non- interest income (24,253)
Operating expenses (3,362)
Impairment allowances (24,825)
Overseas tax expense (41)
Total loss from discontinued operations (36,759)
Loss from discontinued operations is fully attributable to
the equity holders of the Bank.
The major class of assets and liabilities forming part of
discontinued operations are as follows:
As at December 31
2019 AED’000
Assets
Cash and balances with central banks, net 217,916
Deposits and balances due from banks, net 1,715
Loans and advances to customers, net 48,942
Other assets, net 263,665
Property and equipment, net 3,592
Total assets classified as held for sale 535,830
Liabilities
Deposits from customers 120,283
Other liabilities 293,112
Total liabilities related to assets held for sale 413,395
The net cash flows attributable to discontinued opera-
tions are as follows:
For the year ended December 31, 2019 AED’000
Net cash used in operating activities (66,341)
Net cash from investing activities 260,383
Net cash used in financing activities (212,759)
Net cash used in discontinued operations (18,717)
35. Cash and cash equivalents
Cash and cash equivalents included in the consolidated
statement of cash flow comprise the following statement
of financial position amounts:
2019 AED’000
2018 AED’000
Cash and balances with central banks 24,905,213 19,590,185
Deposits and balances due from banks (excluding loans and advances to banks) 11,389,514 12,638,037
Reverse-repo placements – 2,203,800
Due to banks (5,732,779) (3,071,408)
30,561,948 31,360,614
Less: Cash and balances with central banks, deposits and balances due from banks and reverse-repo placements — with original maturity of more than three months (10,442,791) (9,935,092)
Add: Due to banks — with original maturity of more than three months 2,553,434 1,669,331
Add: Cash and cash equivalents included in assets held for sale 183,682 –
Total cash and cash equivalents 22,856,273 23,094,853
36. Related party transactions
The Group enters into transactions with the parent and
its related entities, associates, funds under management,
directors, senior management and their related entities
and the Government of Abu Dhabi (ultimate controlling
party and its related entities) in the ordinary course of
business at commercial interest and commission rates.
Key management personnel are defined as those persons
having authority and responsibility for planning, directing
and controlling the activities of the Group, being the
directors, chief executive officer and his direct reports.
Transactions between the Bank and its subsidiaries have
been eliminated on consolidation and are not disclosed
in this note.
Details of all transactions in which a Director and/or
related parties might have actual or potential conflicts
are provided to the Board of Directors (the “Board”) for its
review and approval. Where a Director is interested, that
Director neither participates in the discussions nor votes
on such matters. The Bank’s policy is, so far as possible, to
engage in transactions with related parties only on arm’s
length terms and in accordance with relevant laws and
regulations. The Board Secretariat maintains a conflicts
and related parties register which is regularly reviewed by
the Board Corporate Governance Committee. In addition,
214
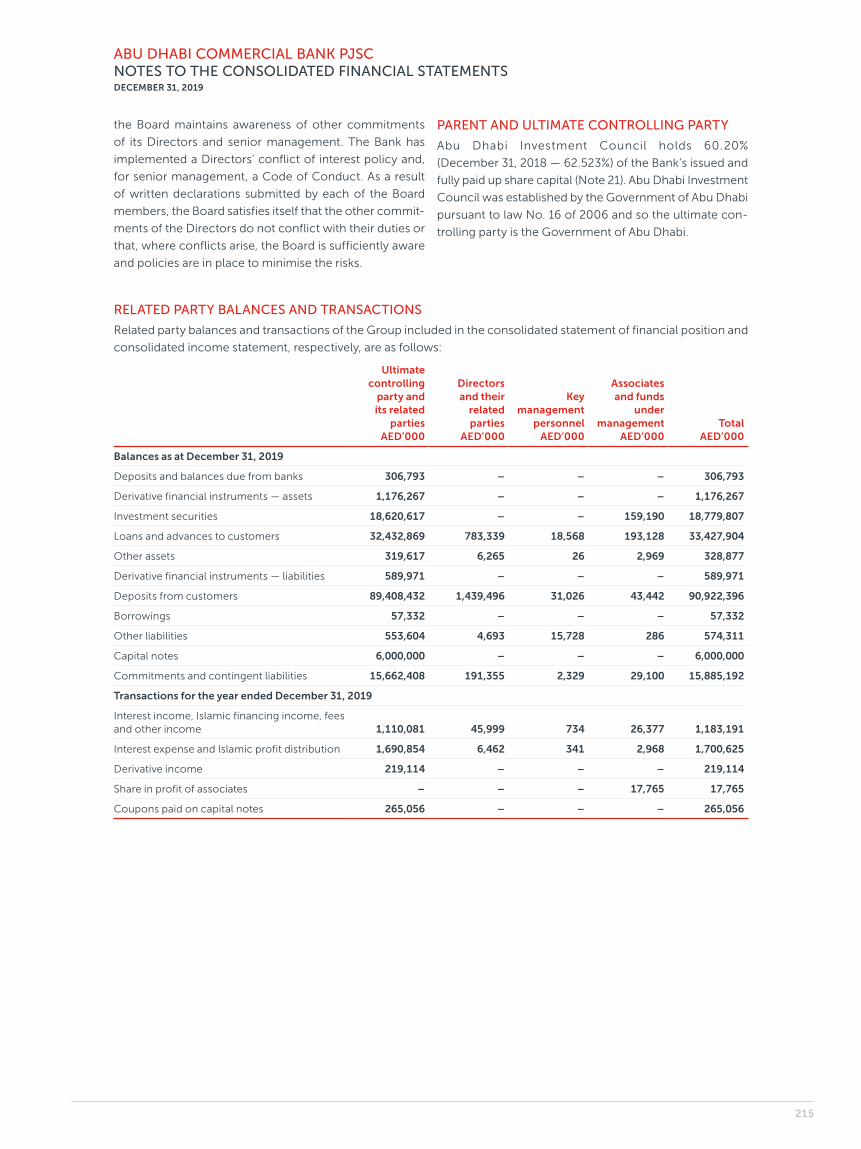
ABU DHABI COMMERCIAL BANK PJSCNOTES TO THE CONSOLIDATED FINANCIAL STATEMENTSDECEMBER 31, 2019
the Board maintains awareness of other commitments
of its Directors and senior management. The Bank has
implemented a Directors’ conflict of interest policy and,
for senior management, a Code of Conduct. As a result
of written declarations submitted by each of the Board
members, the Board satisfies itself that the other commit-
ments of the Directors do not conflict with their duties or
that, where conflicts arise, the Board is sufficiently aware
and policies are in place to minimise the risks.
PARENT AND ULTIMATE CONTROLLING PARTY
Abu Dhabi Investment Council holds 60.20%
(December 31, 2018 — 62.523%) of the Bank’s issued and
fully paid up share capital (Note 21). Abu Dhabi Investment
Council was established by the Government of Abu Dhabi
pursuant to law No. 16 of 2006 and so the ultimate con-
trolling party is the Government of Abu Dhabi.
RELATED PARTY BALANCES AND TRANSACTIONS
Related party balances and transactions of the Group included in the consolidated statement of financial position and
consolidated income statement, respectively, are as follows:
Ultimate controlling
party and its related
parties AED’000
Directors and their
related parties
AED’000
Key management
personnel AED’000
Associates and funds
under management
AED’000Total
AED’000
Balances as at December 31, 2019
Deposits and balances due from banks 306,793 – – – 306,793
Derivative financial instruments — assets 1,176,267 – – – 1,176,267
Investment securities 18,620,617 – – 159,190 18,779,807
Loans and advances to customers 32,432,869 783,339 18,568 193,128 33,427,904
Other assets 319,617 6,265 26 2,969 328,877
Derivative financial instruments — liabilities 589,971 – – – 589,971
Deposits from customers 89,408,432 1,439,496 31,026 43,442 90,922,396
Borrowings 57,332 – – – 57,332
Other liabilities 553,604 4,693 15,728 286 574,311
Capital notes 6,000,000 – – – 6,000,000
Commitments and contingent liabilities 15,662,408 191,355 2,329 29,100 15,885,192
Transactions for the year ended December 31, 2019
Interest income, Islamic financing income, fees and other income 1,110,081 45,999 734 26,377 1,183,191
Interest expense and Islamic profit distribution 1,690,854 6,462 341 2,968 1,700,625
Derivative income 219,114 – – – 219,114
Share in profit of associates – – – 17,765 17,765
Coupons paid on capital notes 265,056 – – – 265,056
215
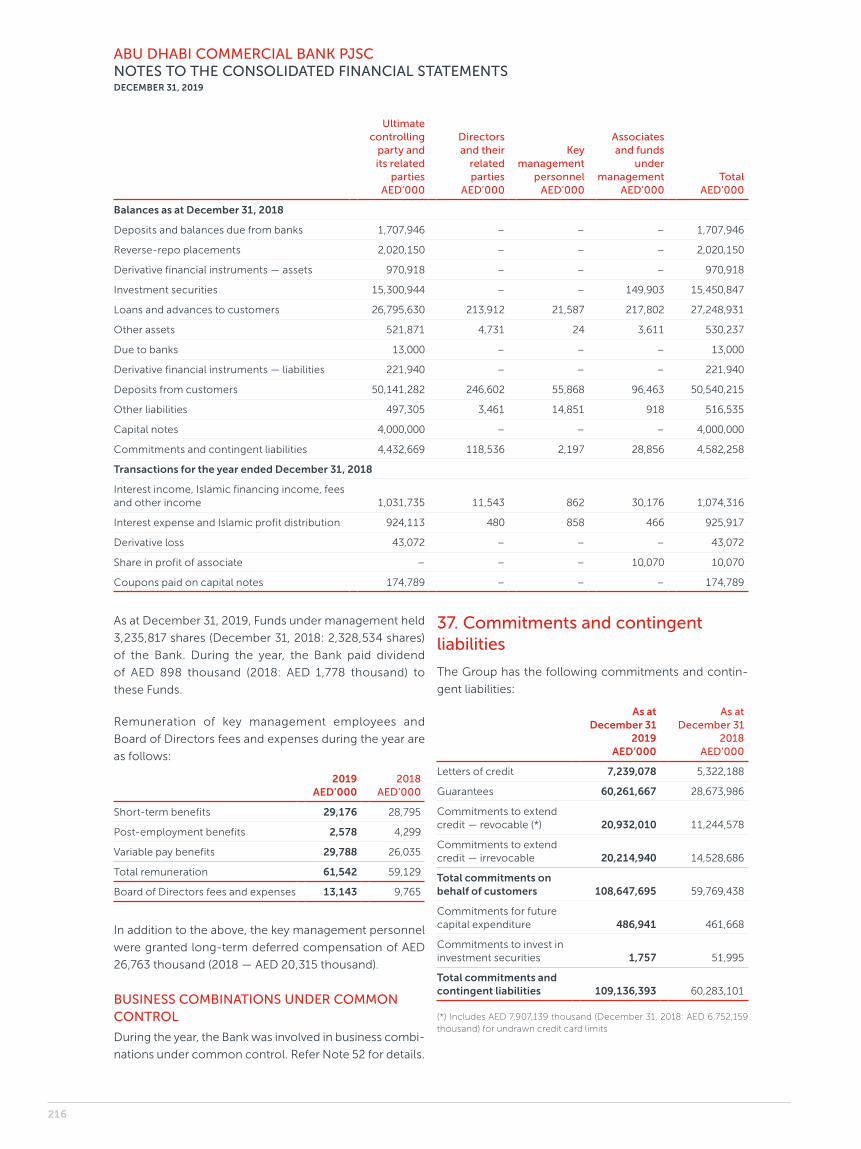
ABU DHABI COMMERCIAL BANK PJSCNOTES TO THE CONSOLIDATED FINANCIAL STATEMENTSDECEMBER 31, 2019
Ultimate controlling
party and its related
parties AED’000
Directors and their
related parties
AED’000
Key management
personnel AED’000
Associates and funds
under management
AED’000Total
AED’000
Balances as at December 31, 2018
Deposits and balances due from banks 1,707,946 – – – 1,707,946
Reverse-repo placements 2,020,150 – – – 2,020,150
Derivative financial instruments — assets 970,918 – – – 970,918
Investment securities 15,300,944 – – 149,903 15,450,847
Loans and advances to customers 26,795,630 213,912 21,587 217,802 27,248,931
Other assets 521,871 4,731 24 3,611 530,237
Due to banks 13,000 – – – 13,000
Derivative financial instruments — liabilities 221,940 – – – 221,940
Deposits from customers 50,141,282 246,602 55,868 96,463 50,540,215
Other liabilities 497,305 3,461 14,851 918 516,535
Capital notes 4,000,000 – – – 4,000,000
Commitments and contingent liabilities 4,432,669 118,536 2,197 28,856 4,582,258
Transactions for the year ended December 31, 2018
Interest income, Islamic financing income, fees and other income 1,031,735 11,543 862 30,176 1,074,316
Interest expense and Islamic profit distribution 924,113 480 858 466 925,917
Derivative loss 43,072 – – – 43,072
Share in profit of associate – – – 10,070 10,070
Coupons paid on capital notes 174,789 – – – 174,789
As at December 31, 2019, Funds under management held
3,235,817 shares (December 31, 2018: 2,328,534 shares)
of the Bank. During the year, the Bank paid dividend
of AED 898 thousand (2018: AED 1,778 thousand) to
these Funds.
Remuneration of key management employees and
Board of Directors fees and expenses during the year are
as follows:
2019 AED’000
2018 AED’000
Short-term benefits 29,176 28,795
Post- employment benefits 2,578 4,299
Variable pay benefits 29,788 26,035
Total remuneration 61,542 59,129
Board of Directors fees and expenses 13,143 9,765
In addition to the above, the key management personnel
were granted long-term deferred compensation of AED
26,763 thousand (2018 — AED 20,315 thousand).
BUSINESS COMBINATIONS UNDER COMMON CONTROL
During the year, the Bank was involved in business combi-
nations under common control. Refer Note 52 for details.
37. Commitments and contingent liabilities
The Group has the following commitments and contin-
gent liabilities:
As at December 31
2019 AED’000
As at December 31
2018 AED’000
Letters of credit 7,239,078 5,322,188
Guarantees 60,261,667 28,673,986
Commitments to extend credit — revocable (*) 20,932,010 11,244,578
Commitments to extend credit — irrevocable 20,214,940 14,528,686
Total commitments on behalf of customers 108,647,695 59,769,438
Commitments for future capital expenditure 486,941 461,668
Commitments to invest in investment securities 1,757 51,995
Total commitments and contingent liabilities 109,136,393 60,283,101
(*) Includes AED 7,907,139 thousand (December 31, 2018: AED 6,752,159 thousand) for undrawn credit card limits
216
ABU DHABI COMMERCIAL BANK PJSCNOTES TO THE CONSOLIDATED FINANCIAL STATEMENTSDECEMBER 31, 2019
CREDIT- RELATED COMMITMENTS
Credit- related commitments include commitments to
extend credit, letters of credit and guarantees which are
designed to meet the requirements of the Bank’s custom-
ers. Irrevocable commitments to extend credit represent
contractual commitments to make loans and advances
and revolving credits. Revocable commitments to extend
credit represent commitments to make loan and advances
and revolving credits which can be cancelled by the Bank
unconditionally without any contractual obligations.
Commitments generally have fixed expiry dates or other
termination clauses. Since commitments may expire
without being drawn upon, the total contract amounts
do not necessarily represent future cash requirements.
Letters of credit and guarantees commit the Bank to
make payments on behalf of customers contingent upon
the failure of the customer to perform under the terms
of the contract. These contracts would be exposed to
market risk if issued or extended at a fixed rate of interest.
However these contracts are primarily made at float-
ing rates.
Commitments and contingent liabilities which have been
entered into on behalf of customers and for which there
are corresponding obligations from customers, are not
included in assets and liabilities. The Bank’s maximum
exposure to credit loss, in the event of non- performance
by the other party and where all counterclaims, collateral
or security proves valueless, is represented by the con-
tractual nominal amount of these instruments included
in the table above. These commitments and contingent
obligations are subject to the Bank’s normal credit
approval processes.
38. Operating segments
The Group has four reportable segments as described
below. These segments offer different products and ser-
vices and are managed separately based on the Group’s
management and internal reporting structure. The
Group’s Management Executive Committee (the Chief
Operating Decision Maker “CODM”), is responsible for
allocation of resources to these segments, whereas, the
Group’s Performance Management Committee, based on
delegation from CODM reviews the performance of these
segments on a regular basis.
The following summary describes the operations in each
of the Group’s reportable segments:
Consumer
banking
comprises of retail, wealth manage-
ment, Islamic financing and investment
in associates. It includes loans, depos-
its and other transactions and balances
with retail customers and corporate and
private accounts of high net worth indi-
viduals and fund management activities.
Wholesale
banking
comprises of business banking, cash
management, trade finance, corporate
finance, small and medium enterprise
financing, investment banking, Islamic
financing, infrastructure and asset
finance, government and public enter-
prises. It includes loans, deposits and
other transactions and balances with
corporate customers.
Investments
and treasury
comprises of central treasury operations,
management of the Group’s investment
portfolio and interest rate, currency
and commodity derivative portfolio
and Islamic financing. Investments and
treasury undertakes the Group’s fund-
ing and centralised risk management
activities through borrowings, issue of
debt securities and use of derivatives
for risk management. It also undertakes
trading and corporate finance activities
and investing in liquid assets such as
short-term placements, corporate and
government debt securities.
Property
management
comprises of real estate management
and engineering service operations of
subsidiaries and rental income earned
from properties of the Group.
Information regarding the results of each reportable
segment is shown below. Performance is measured based
on segment profit before income tax, as included in the
internal management reports that are reviewed by the
Performance Management Committee. Segment profit is
used to measure performance as management believes
that such information is the most relevant in evaluating
the results of certain segments relative to other entities
that operate within these industries. Inter- segment pricing
is determined on an arm’s length basis.
217
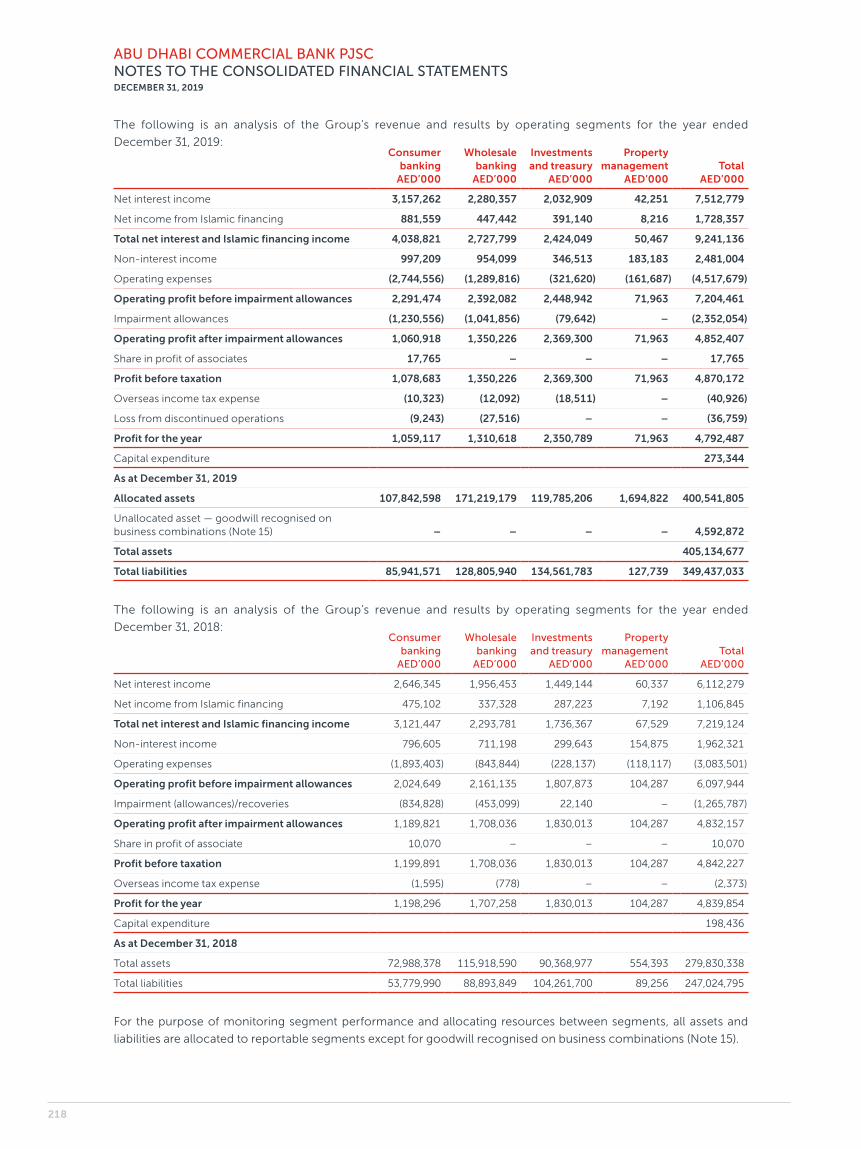
ABU DHABI COMMERCIAL BANK PJSCNOTES TO THE CONSOLIDATED FINANCIAL STATEMENTSDECEMBER 31, 2019
The following is an analysis of the Group’s revenue and results by operating segments for the year ended
December 31, 2019:Consumer
banking AED’000
Wholesale banking
AED’000
Investments and treasury
AED’000
Property management
AED’000Total
AED’000
Net interest income 3,157,262 2,280,357 2,032,909 42,251 7,512,779
Net income from Islamic financing 881,559 447,442 391,140 8,216 1,728,357
Total net interest and Islamic financing income 4,038,821 2,727,799 2,424,049 50,467 9,241,136
Non- interest income 997,209 954,099 346,513 183,183 2,481,004
Operating expenses (2,744,556) (1,289,816) (321,620) (161,687) (4,517,679)
Operating profit before impairment allowances 2,291,474 2,392,082 2,448,942 71,963 7,204,461
Impairment allowances (1,230,556) (1,041,856) (79,642) – (2,352,054)
Operating profit after impairment allowances 1,060,918 1,350,226 2,369,300 71,963 4,852,407
Share in profit of associates 17,765 – – – 17,765
Profit before taxation 1,078,683 1,350,226 2,369,300 71,963 4,870,172
Overseas income tax expense (10,323) (12,092) (18,511) – (40,926)
Loss from discontinued operations (9,243) (27,516) – – (36,759)
Profit for the year 1,059,117 1,310,618 2,350,789 71,963 4,792,487
Capital expenditure 273,344
As at December 31, 2019
Allocated assets 107,842,598 171,219,179 119,785,206 1,694,822 400,541,805
Unallocated asset — goodwill recognised on business combinations (Note 15) – – – – 4,592,872
Total assets 405,134,677
Total liabilities 85,941,571 128,805,940 134,561,783 127,739 349,437,033
The following is an analysis of the Group’s revenue and results by operating segments for the year ended
December 31, 2018:Consumer
banking AED’000
Wholesale banking
AED’000
Investments and treasury
AED’000
Property management
AED’000Total
AED’000
Net interest income 2,646,345 1,956,453 1,449,144 60,337 6,112,279
Net income from Islamic financing 475,102 337,328 287,223 7,192 1,106,845
Total net interest and Islamic financing income 3,121,447 2,293,781 1,736,367 67,529 7,219,124
Non- interest income 796,605 711,198 299,643 154,875 1,962,321
Operating expenses (1,893,403) (843,844) (228,137) (118,117) (3,083,501)
Operating profit before impairment allowances 2,024,649 2,161,135 1,807,873 104,287 6,097,944
Impairment (allowances)/recoveries (834,828) (453,099) 22,140 – (1,265,787)
Operating profit after impairment allowances 1,189,821 1,708,036 1,830,013 104,287 4,832,157
Share in profit of associate 10,070 – – – 10,070
Profit before taxation 1,199,891 1,708,036 1,830,013 104,287 4,842,227
Overseas income tax expense (1,595) (778) – – (2,373)
Profit for the year 1,198,296 1,707,258 1,830,013 104,287 4,839,854
Capital expenditure 198,436
As at December 31, 2018
Total assets 72,988,378 115,918,590 90,368,977 554,393 279,830,338
Total liabilities 53,779,990 88,893,849 104,261,700 89,256 247,024,795
For the purpose of monitoring segment performance and allocating resources between segments, all assets and
liabilities are allocated to reportable segments except for goodwill recognised on business combinations (Note 15).
218

ABU DHABI COMMERCIAL BANK PJSCNOTES TO THE CONSOLIDATED FINANCIAL STATEMENTSDECEMBER 31, 2019
OTHER DISCLOSURES
The following is the analysis of the total operating income of each segment between income from external parties
and inter- segment.
External Inter- segment
2019 AED’000
2018 AED’000
2019 AED’000
2018 AED’000
Consumer banking 6,543,825 5,150,822 (1,507,795) (1,232,770)
Wholesale banking 5,295,885 4,243,633 (1,613,987) (1,238,654)
Investments and treasury (265,408) (326,768) 3,035,970 2,362,778
Property management 147,838 113,758 85,812 108,646
Total operating income 11,722,140 9,181,445 – –
GEOGRAPHICAL INFORMATION
The Group operates in two principal geographic areas i.e. domestic and international. The United Arab Emirates is
designated as domestic area which represents the operations of the Group that originates from the UAE branches
and subsidiaries. International area represents the operations of the Group that originates from its branches in Kuwait,
Qatar, China, India, Jersey and through its subsidiaries outside UAE. The information regarding the Group’s revenue
from continuing operations and non- current assets by geographical location are detailed as follows:
Domestic International
2019 AED’000
2018 AED’000
2019 AED’000
2018 AED’000
Income
Net interest and Islamic financing income 9,091,578 7,229,494 149,558 (10,370)
Non- interest income 2,420,230 1,954,487 60,774 7,834
Non- current assets
Investment in associates 387,627 205,158 20,141 –
Investment properties 1,684,448 576,671 9,259 –
Property and equipment, net 2,023,029 977,778 174,542 4,827
Intangible assets 5,211,497 18,800 121,000 –
219
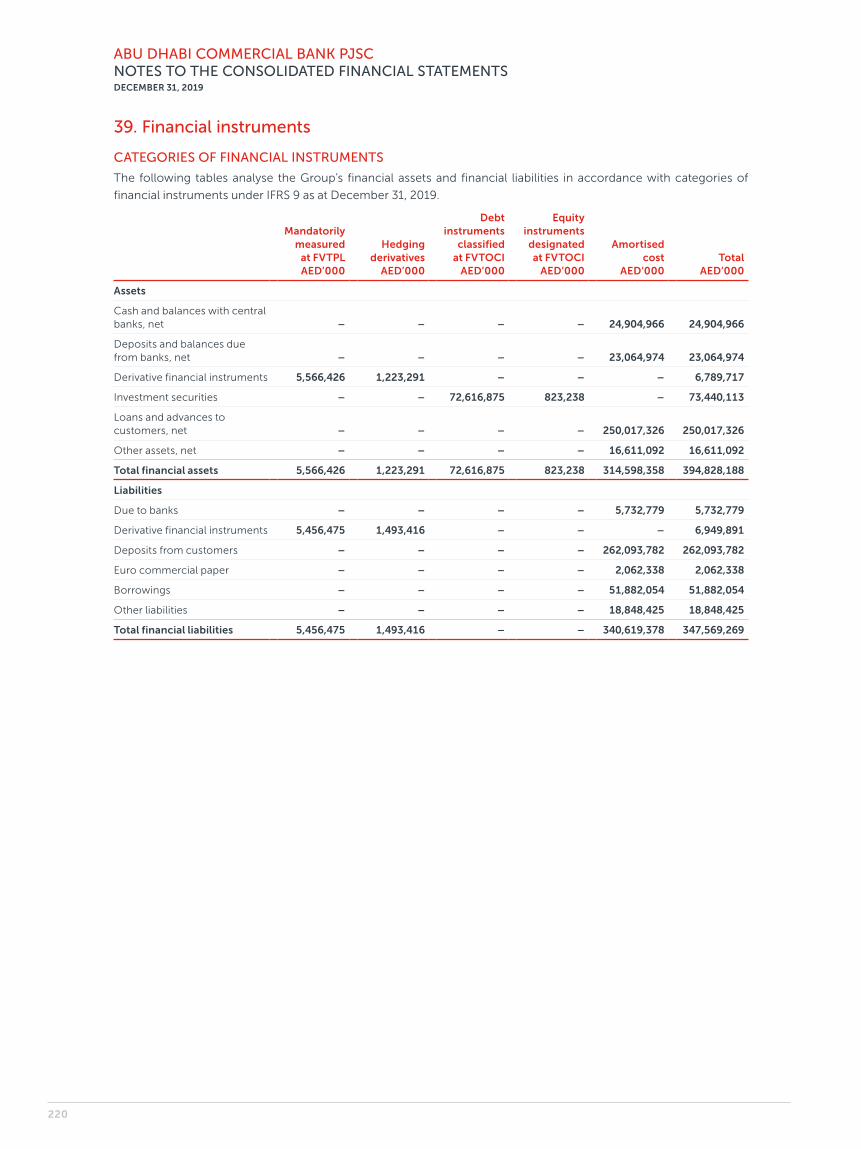
ABU DHABI COMMERCIAL BANK PJSCNOTES TO THE CONSOLIDATED FINANCIAL STATEMENTSDECEMBER 31, 2019
39. Financial instruments
CATEGORIES OF FINANCIAL INSTRUMENTS
The following tables analyse the Group’s financial assets and financial liabilities in accordance with categories of
financial instruments under IFRS 9 as at December 31, 2019.
Mandatorily measured
at FVTPL AED’000
Hedging derivatives
AED’000
Debt instruments
classified at FVTOCI
AED’000
Equity instruments designated at FVTOCI
AED’000
Amortised cost
AED’000Total
AED’000
Assets
Cash and balances with central banks, net – – – – 24,904,966 24,904,966
Deposits and balances due from banks, net – – – – 23,064,974 23,064,974
Derivative financial instruments 5,566,426 1,223,291 – – – 6,789,717
Investment securities – – 72,616,875 823,238 – 73,440,113
Loans and advances to customers, net – – – – 250,017,326 250,017,326
Other assets, net – – – – 16,611,092 16,611,092
Total financial assets 5,566,426 1,223,291 72,616,875 823,238 314,598,358 394,828,188
Liabilities
Due to banks – – – – 5,732,779 5,732,779
Derivative financial instruments 5,456,475 1,493,416 – – – 6,949,891
Deposits from customers – – – – 262,093,782 262,093,782
Euro commercial paper – – – – 2,062,338 2,062,338
Borrowings – – – – 51,882,054 51,882,054
Other liabilities – – – – 18,848,425 18,848,425
Total financial liabilities 5,456,475 1,493,416 – – 340,619,378 347,569,269
220
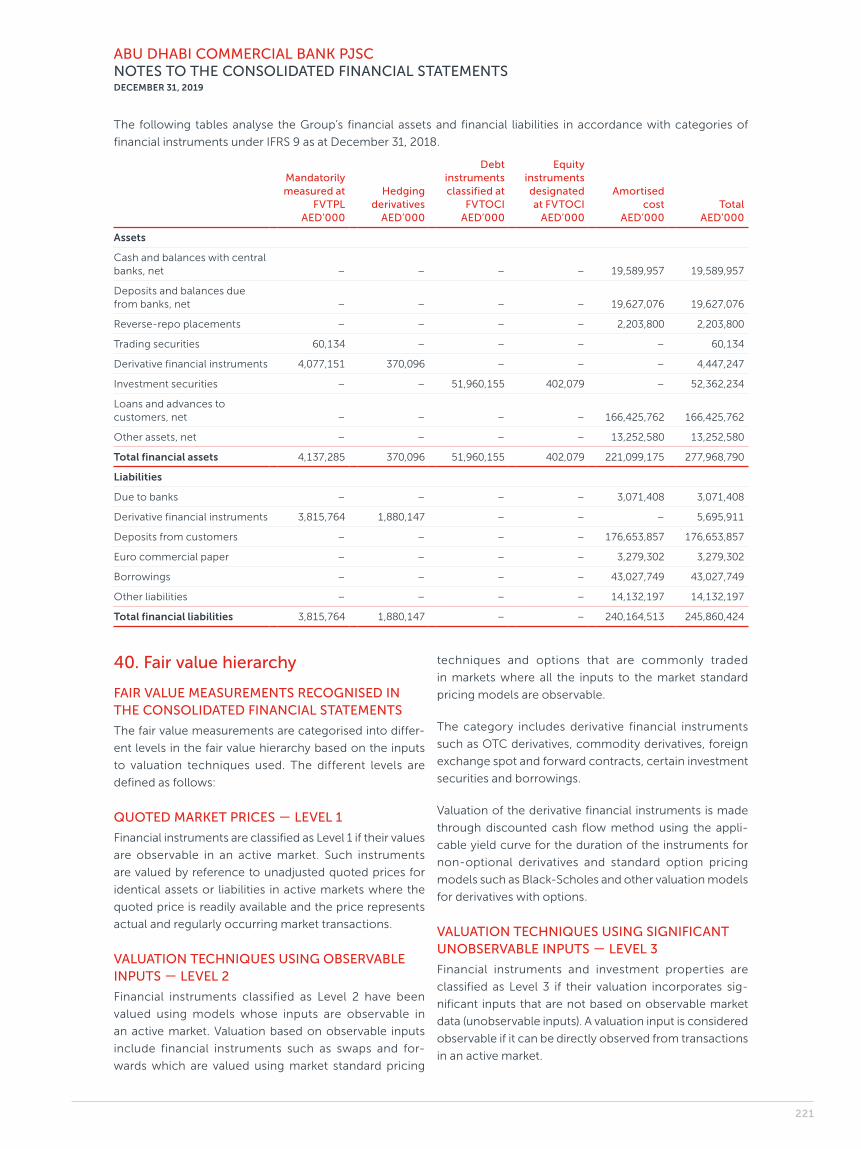
ABU DHABI COMMERCIAL BANK PJSCNOTES TO THE CONSOLIDATED FINANCIAL STATEMENTSDECEMBER 31, 2019
The following tables analyse the Group’s financial assets and financial liabilities in accordance with categories of
financial instruments under IFRS 9 as at December 31, 2018.
Mandatorily measured at
FVTPL AED’000
Hedging derivatives
AED’000
Debt instruments classified at
FVTOCI AED’000
Equity instruments designated at FVTOCI
AED’000
Amortised cost
AED’000Total
AED’000
Assets
Cash and balances with central banks, net – – – – 19,589,957 19,589,957
Deposits and balances due from banks, net – – – – 19,627,076 19,627,076
Reverse-repo placements – – – – 2,203,800 2,203,800
Trading securities 60,134 – – – – 60,134
Derivative financial instruments 4,077,151 370,096 – – – 4,447,247
Investment securities – – 51,960,155 402,079 – 52,362,234
Loans and advances to customers, net – – – – 166,425,762 166,425,762
Other assets, net – – – – 13,252,580 13,252,580
Total financial assets 4,137,285 370,096 51,960,155 402,079 221,099,175 277,968,790
Liabilities
Due to banks – – – – 3,071,408 3,071,408
Derivative financial instruments 3,815,764 1,880,147 – – – 5,695,911
Deposits from customers – – – – 176,653,857 176,653,857
Euro commercial paper – – – – 3,279,302 3,279,302
Borrowings – – – – 43,027,749 43,027,749
Other liabilities – – – – 14,132,197 14,132,197
Total financial liabilities 3,815,764 1,880,147 – – 240,164,513 245,860,424
40. Fair value hierarchy
FAIR VALUE MEASUREMENTS RECOGNISED IN THE CONSOLIDATED FINANCIAL STATEMENTS
The fair value measurements are categorised into differ-
ent levels in the fair value hierarchy based on the inputs
to valuation techniques used. The different levels are
defined as follows:
QUOTED MARKET PRICES — LEVEL 1
Financial instruments are classified as Level 1 if their values
are observable in an active market. Such instruments
are valued by reference to unadjusted quoted prices for
identical assets or liabilities in active markets where the
quoted price is readily available and the price represents
actual and regularly occurring market transactions.
VALUATION TECHNIQUES USING OBSERVABLE INPUTS — LEVEL 2
Financial instruments classified as Level 2 have been
valued using models whose inputs are observable in
an active market. Valuation based on observable inputs
include financial instruments such as swaps and for-
wards which are valued using market standard pricing
techniques and options that are commonly traded
in markets where all the inputs to the market standard
pricing models are observable.
The category includes derivative financial instruments
such as OTC derivatives, commodity derivatives, foreign
exchange spot and forward contracts, certain investment
securities and borrowings.
Valuation of the derivative financial instruments is made
through discounted cash flow method using the appli-
cable yield curve for the duration of the instruments for
non- optional derivatives and standard option pricing
models such as Black- Scholes and other valuation models
for derivatives with options.
VALUATION TECHNIQUES USING SIGNIFICANT UNOBSERVABLE INPUTS — LEVEL 3
Financial instruments and investment properties are
classified as Level 3 if their valuation incorporates sig-
nificant inputs that are not based on observable market
data (unobservable inputs). A valuation input is considered
observable if it can be directly observed from transactions
in an active market.
221

ABU DHABI COMMERCIAL BANK PJSCNOTES TO THE CONSOLIDATED FINANCIAL STATEMENTSDECEMBER 31, 2019
Unobservable input levels are generally determined based
on observable inputs of a similar nature, historical obser-
vations or other analytical techniques.
Financial instruments under this category mainly includes
private equity instruments and funds. The carrying values
of these investments are adjusted as follows:
a) Private equity instruments — using the latest available
net book value; and
b) Funds — based on the net asset value provided by the
fund manager.
This hierarchy requires the use of observable market
data when available. The Group considers relevant and
observable market prices in its valuations where possible.
Refer Note 12 in respect of valuation methodology used
for investment properties.
Except as detailed in the following table, the Management considers that the carrying amounts of financial assets and
liabilities recognised in the consolidated financial statements do not materially differ from their fair values.
Level 1 Level 2 Level 3
Notes
Quoted market
prices AED’000
Observable inputs
AED’000
Significant unobservable
inputs AED’000
Total fair value
AED’000
Carrying value
AED’000
As at December 31, 2019
Assets at fair value
Derivative financial instruments 8 15 6,789,702 – 6,789,717 6,789,717
Investment securities 9
— Quoted 65,909,746 3,491,351 – 69,401,097 69,401,097
— Unquoted – 3,818,638 220,378 4,039,016 4,039,016
Investment properties 12 – – 1,693,707 1,693,707 1,693,707
Total 65,909,761 14,099,691 1,914,085 81,923,537 81,923,537
Liabilities at fair value
Derivative financial instruments 8 – 6,949,891 – 6,949,891 6,949,891
Liabilities at amortised cost
Euro commercial paper 18 – 2,074,605 – 2,074,605 2,062,338
Borrowings 19 18,728,489 32,244,310 – 50,972,799 51,882,054
Total 18,728,489 41,268,806 – 59,997,295 60,894,283
As at December 31, 2018
Assets at fair value
Trading securities 60,134 – – 60,134 60,134
Derivative financial instruments 8 56 4,447,191 – 4,447,247 4,447,247
Investment securities 9
— Quoted 43,339,649 1,427,018 – 44,766,667 44,766,667
— Unquoted – 7,343,724 251,843 7,595,567 7,595,567
Investment properties 12 – – 576,671 576,671 576,671
Total 43,399,839 13,217,933 828,514 57,446,286 57,446,286
Liabilities at fair value
Derivative financial instruments 8 275 5,695,636 – 5,695,911 5,695,911
Liabilities at amortised cost
Euro commercial paper 18 – 3,285,187 – 3,285,187 3,279,302
Borrowings 19 15,427,393 26,186,580 – 41,613,973 43,027,749
Total 15,427,668 35,167,403 – 50,595,071 52,002,962
The Group’s OTC derivatives in the trading book are classified as Level 2 as they are valued using inputs that can be
observed in the market.
222
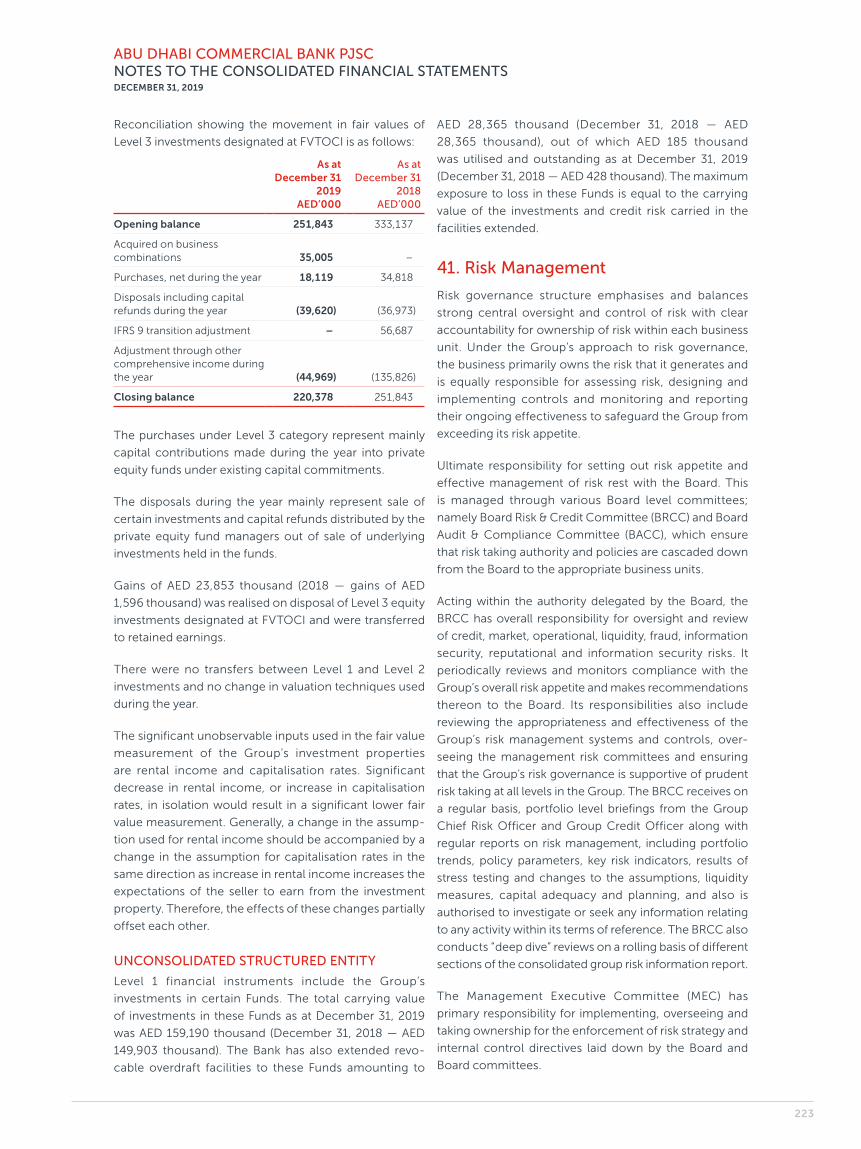
ABU DHABI COMMERCIAL BANK PJSCNOTES TO THE CONSOLIDATED FINANCIAL STATEMENTSDECEMBER 31, 2019
Reconciliation showing the movement in fair values of
Level 3 investments designated at FVTOCI is as follows:
As at December 31
2019 AED’000
As at December 31
2018 AED’000
Opening balance 251,843 333,137
Acquired on business combinations 35,005 –
Purchases, net during the year 18,119 34,818
Disposals including capital refunds during the year (39,620) (36,973)
IFRS 9 transition adjustment – 56,687
Adjustment through other comprehensive income during the year (44,969) (135,826)
Closing balance 220,378 251,843
The purchases under Level 3 category represent mainly
capital contributions made during the year into private
equity funds under existing capital commitments.
The disposals during the year mainly represent sale of
certain investments and capital refunds distributed by the
private equity fund managers out of sale of underlying
investments held in the funds.
Gains of AED 23,853 thousand (2018 — gains of AED
1,596 thousand) was realised on disposal of Level 3 equity
investments designated at FVTOCI and were transferred
to retained earnings.
There were no transfers between Level 1 and Level 2
investments and no change in valuation techniques used
during the year.
The significant unobservable inputs used in the fair value
measurement of the Group’s investment properties
are rental income and capitalisation rates. Significant
decrease in rental income, or increase in capitalisation
rates, in isolation would result in a significant lower fair
value measurement. Generally, a change in the assump-
tion used for rental income should be accompanied by a
change in the assumption for capitalisation rates in the
same direction as increase in rental income increases the
expectations of the seller to earn from the investment
property. Therefore, the effects of these changes partially
offset each other.
UNCONSOLIDATED STRUCTURED ENTITY
Level 1 financial instruments include the Group’s
investments in certain Funds. The total carrying value
of investments in these Funds as at December 31, 2019
was AED 159,190 thousand (December 31, 2018 — AED
149,903 thousand). The Bank has also extended revo-
cable overdraft facilities to these Funds amounting to
AED 28,365 thousand (December 31, 2018 — AED
28,365 thousand), out of which AED 185 thousand
was utilised and outstanding as at December 31, 2019
(December 31, 2018 — AED 428 thousand). The maximum
exposure to loss in these Funds is equal to the carrying
value of the investments and credit risk carried in the
facilities extended.
41. Risk Management
Risk governance structure emphasises and balances
strong central oversight and control of risk with clear
accountability for ownership of risk within each business
unit. Under the Group’s approach to risk governance,
the business primarily owns the risk that it generates and
is equally responsible for assessing risk, designing and
implementing controls and monitoring and reporting
their ongoing effectiveness to safeguard the Group from
exceeding its risk appetite.
Ultimate responsibility for setting out risk appetite and
effective management of risk rest with the Board. This
is managed through various Board level committees;
namely Board Risk & Credit Committee (BRCC) and Board
Audit & Compliance Committee (BACC), which ensure
that risk taking authority and policies are cascaded down
from the Board to the appropriate business units.
Acting within the authority delegated by the Board, the
BRCC has overall responsibility for oversight and review
of credit, market, operational, liquidity, fraud, information
security, reputational and information security risks. It
periodically reviews and monitors compliance with the
Group’s overall risk appetite and makes recommendations
thereon to the Board. Its responsibilities also include
reviewing the appropriateness and effectiveness of the
Group’s risk management systems and controls, over-
seeing the management risk committees and ensuring
that the Group’s risk governance is supportive of prudent
risk taking at all levels in the Group. The BRCC receives on
a regular basis, portfolio level briefings from the Group
Chief Risk Officer and Group Credit Officer along with
regular reports on risk management, including portfolio
trends, policy parameters, key risk indicators, results of
stress testing and changes to the assumptions, liquidity
measures, capital adequacy and planning, and also is
authorised to investigate or seek any information relating
to any activity within its terms of reference. The BRCC also
conducts “deep dive” reviews on a rolling basis of different
sections of the consolidated group risk information report.
The Management Executive Committee (MEC) has
primary responsibility for implementing, overseeing and
taking ownership for the enforcement of risk strategy and
internal control directives laid down by the Board and
Board committees.
223
ABU DHABI COMMERCIAL BANK PJSCNOTES TO THE CONSOLIDATED FINANCIAL STATEMENTSDECEMBER 31, 2019
The Management level committees also actively manage
risk particularly the Assets and Liabilities Management
Committee (ALCO), Management Risk & Credit Committee
(MRCC) and Management Recoveries Committee (MRC).
The Risk Management function headed by the Group’s
Chief Risk Officer reports via matrix independently to
BRCC and CEO. The risk function is independent of the
origination, trading and sales function to ensure balance
in risk reward decision is not compromised and to ensure
transparency of decisions in accordance with laid down
standards and policies. The risk function exercises
control over credit, market, liquidity, operational, fraud,
compliance, data governance and information security
risk. The Risk function is also independent of the credit
underwriting division which is headed by the Group Chief
Credit Officer.
BACC provides assistance to the Board to fulfil its duties
to ensure and oversee the Group’s financial statements,
independence and performance of the Group’s external
and internal auditors, compliance with legal and regu-
latory requirements and internal policies and internal
control over financial reporting.
The Internal Audit division (IAD) aims to apply a systematic
and disciplined approach to evaluating and improving the
effectiveness of the Group’s risk management, control
and governance processes. The IAD reports directly to
BACC. The IAD consists of a team of auditors, whose
tasks are, among other things, to evaluate the quality
of the Group’s lending portfolio, controls in operational
processes and the integrity of the Group’s information
systems and databases. The IAD auditors, alongside the
compliance department, also ensure that transactions
undertaken by the Group are conducted in compliance
with applicable legal and regulatory requirements and
in accordance with the Group’s internal procedures,
thereby minimising the risk of fraudulent, improper or
illegal practices.
42. Credit Risk Management
Credit risk is the risk that a customer or counterparty will
default on its contractual obligations resulting in financial
loss to the Group. The Group’s main income generating
activity is lending to customers and therefore credit risk
is a principal risk. Credit risk mainly arises from loans and
advances to customers and other banks (including related
commitments to lend such as loan or credit card facilities),
investments in debt securities and derivatives that are an
asset position. The Group considers all elements of credit
risk exposure such as counterparty default risk, geograph-
ical risk and sector risk for risk management purposes.
The Group’s risk and credit committee is responsible for
managing the Group’s credit risk by:
• Ensuring that the Group has appropriate credit risk
practices, including an effective system of internal
control, to consistently determine adequate allowances
in accordance with the Group’s stated policies and
procedures, IFRS and relevant supervisory guidance.
• Identifying, assessing and measuring credit risk across
the Group, from an individual instrument to a portfo-
lio level.
• Creating credit policies to protect the Group against
the identified risks including the requirements to obtain
collateral from borrowers, to perform robust ongoing
credit assessment of borrowers and to continually
monitor exposures against internal risk limits.
• Limiting concentrations of exposure by type of asset,
counterparties, industry, credit rating, geographic
location, etc.
• Establishing a robust control framework regarding the
authorisation structure for the approval and renewal of
credit facilities.
• Developing and maintaining the Group’s risk grading to
categorise exposures according to the degree of risk of
default. Risk grades are subject to regular reviews.
• Developing and maintaining the Group’s processes
for measuring ECL including monitoring of credit risk,
incorporation of forward looking information and the
method used to measure ECL.
• Ensuring that the Group has policies and procedures
in place to appropriately maintain and validate models
used to assess and measure ECL.
• Establishing a sound credit risk assessment and meas-
urement process that provides it with a strong basis for
common systems, tools and data to assess credit risk
and to account for ECL. Providing advice, guidance
and specialist skills to business units to promote best
practice throughout the Group in the management of
credit risk.
• Managing the credit exposure relating to its trading
activities by entering into master netting agreements
and collateral arrangements with counterparties in
appropriate circumstances and limiting the duration of
exposure. In certain cases, the Group may also close
out transactions or assign them to other counterparties
to mitigate credit risk.
The Group wide credit policies and standards are
approved by BRCC. These govern all delegated lending
authorities and include policies, standards, metrics, strat-
egies and procedures specific to each of the different
business segments and are decided based on the macro
economic conditions, the risk appetite of the Group,
224
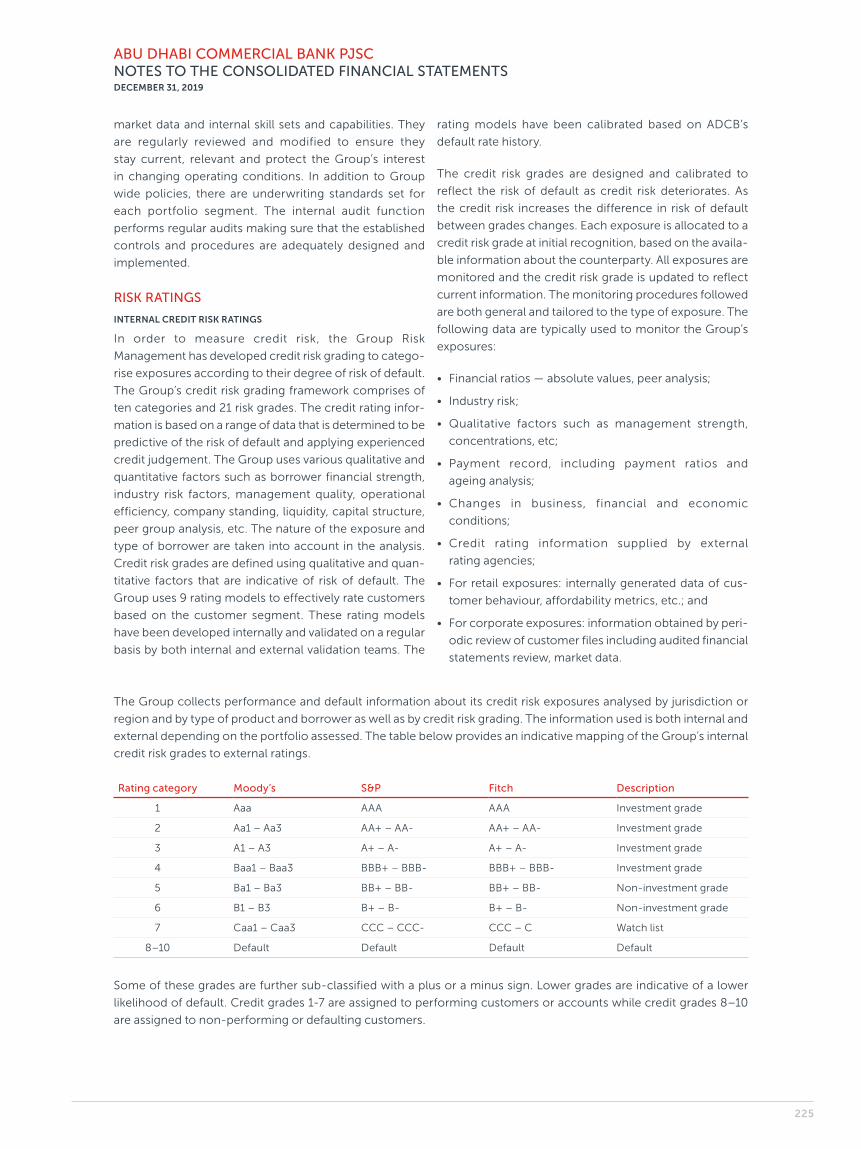
ABU DHABI COMMERCIAL BANK PJSCNOTES TO THE CONSOLIDATED FINANCIAL STATEMENTSDECEMBER 31, 2019
market data and internal skill sets and capabilities. They
are regularly reviewed and modified to ensure they
stay current, relevant and protect the Group’s interest
in changing operating conditions. In addition to Group
wide policies, there are underwriting standards set for
each portfolio segment. The internal audit function
performs regular audits making sure that the established
controls and procedures are adequately designed and
implemented.
RISK RATINGS
INTERNAL CREDIT RISK RATINGS
In order to measure credit risk, the Group Risk
Management has developed credit risk grading to catego-
rise exposures according to their degree of risk of default.
The Group’s credit risk grading framework comprises of
ten categories and 21 risk grades. The credit rating infor-
mation is based on a range of data that is determined to be
predictive of the risk of default and applying experienced
credit judgement. The Group uses various qualitative and
quantitative factors such as borrower financial strength,
industry risk factors, management quality, operational
efficiency, company standing, liquidity, capital structure,
peer group analysis, etc. The nature of the exposure and
type of borrower are taken into account in the analysis.
Credit risk grades are defined using qualitative and quan-
titative factors that are indicative of risk of default. The
Group uses 9 rating models to effectively rate customers
based on the customer segment. These rating models
have been developed internally and validated on a regular
basis by both internal and external validation teams. The
rating models have been calibrated based on ADCB’s
default rate history.
The credit risk grades are designed and calibrated to
reflect the risk of default as credit risk deteriorates. As
the credit risk increases the difference in risk of default
between grades changes. Each exposure is allocated to a
credit risk grade at initial recognition, based on the availa-
ble information about the counterparty. All exposures are
monitored and the credit risk grade is updated to reflect
current information. The monitoring procedures followed
are both general and tailored to the type of exposure. The
following data are typically used to monitor the Group’s
exposures:
• Financial ratios — absolute values, peer analysis;
• Industry risk;
• Qualitative factors such as management strength,
concentrations, etc;
• Payment record, including payment ratios and
ageing analysis;
• Changes in business, financial and economic
conditions;
• Credit rating information supplied by external
rating agencies;
• For retail exposures: internally generated data of cus-
tomer behaviour, affordability metrics, etc.; and
• For corporate exposures: information obtained by peri-
odic review of customer files including audited financial
statements review, market data.
The Group collects performance and default information about its credit risk exposures analysed by jurisdiction or
region and by type of product and borrower as well as by credit risk grading. The information used is both internal and
external depending on the portfolio assessed. The table below provides an indicative mapping of the Group’s internal
credit risk grades to external ratings.
Rating category Moody’s S&P Fitch Description
1 Aaa AAA AAA Investment grade
2 Aa1 – Aa3 AA+ – AA- AA+ – AA- Investment grade
3 A1 – A3 A+ – A- A+ – A- Investment grade
4 Baa1 – Baa3 BBB+ – BBB- BBB+ – BBB- Investment grade
5 Ba1 – Ba3 BB+ – BB- BB+ – BB- Non- investment grade
6 B1 – B3 B+ – B- B+ – B- Non- investment grade
7 Caa1 – Caa3 CCC – CCC- CCC – C Watch list
8–10 Default Default Default Default
Some of these grades are further sub- classified with a plus or a minus sign. Lower grades are indicative of a lower
likelihood of default. Credit grades 1-7 are assigned to performing customers or accounts while credit grades 8–10
are assigned to non- performing or defaulting customers.
225
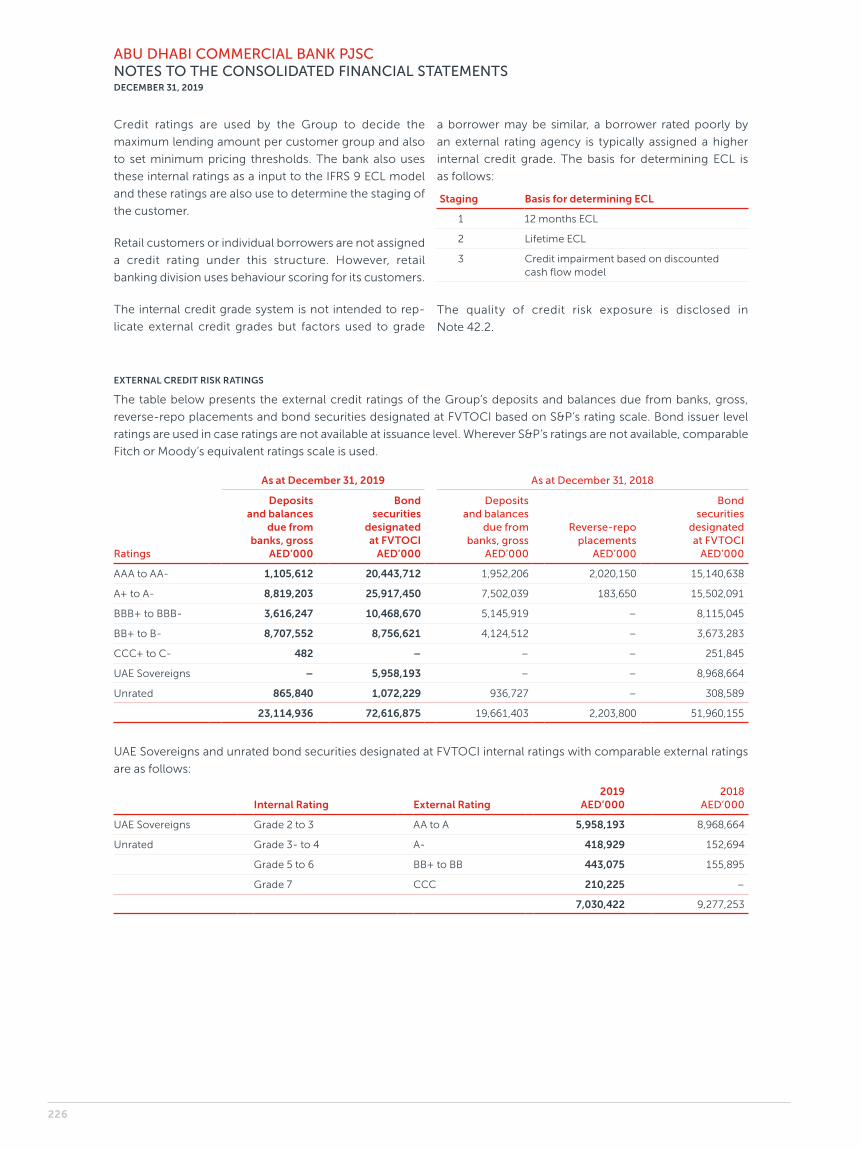
ABU DHABI COMMERCIAL BANK PJSCNOTES TO THE CONSOLIDATED FINANCIAL STATEMENTSDECEMBER 31, 2019
Credit ratings are used by the Group to decide the
maximum lending amount per customer group and also
to set minimum pricing thresholds. The bank also uses
these internal ratings as a input to the IFRS 9 ECL model
and these ratings are also use to determine the staging of
the customer.
Retail customers or individual borrowers are not assigned
a credit rating under this structure. However, retail
banking division uses behaviour scoring for its customers.
The internal credit grade system is not intended to rep-
licate external credit grades but factors used to grade
a borrower may be similar, a borrower rated poorly by
an external rating agency is typically assigned a higher
internal credit grade. The basis for determining ECL is
as follows:
Staging Basis for determining ECL
1 12 months ECL
2 Lifetime ECL
3 Credit impairment based on discounted cash flow model
The quality of credit risk exposure is disclosed in
Note 42.2.
EXTERNAL CREDIT RISK RATINGS
The table below presents the external credit ratings of the Group’s deposits and balances due from banks, gross,
reverse-repo placements and bond securities designated at FVTOCI based on S&P’s rating scale. Bond issuer level
ratings are used in case ratings are not available at issuance level. Wherever S&P’s ratings are not available, comparable
Fitch or Moody’s equivalent ratings scale is used.
As at December 31, 2019 As at December 31, 2018
Ratings
Deposits and balances
due from banks, gross
AED’000
Bond securities
designated at FVTOCI
AED’000
Deposits and balances
due from banks, gross
AED’000
Reverse-repo placements
AED’000
Bond securities
designated at FVTOCI
AED’000
AAA to AA- 1,105,612 20,443,712 1,952,206 2,020,150 15,140,638
A+ to A- 8,819,203 25,917,450 7,502,039 183,650 15,502,091
BBB+ to BBB- 3,616,247 10,468,670 5,145,919 – 8,115,045
BB+ to B- 8,707,552 8,756,621 4,124,512 – 3,673,283
CCC+ to C- 482 – – – 251,845
UAE Sovereigns – 5,958,193 – – 8,968,664
Unrated 865,840 1,072,229 936,727 – 308,589
23,114,936 72,616,875 19,661,403 2,203,800 51,960,155
UAE Sovereigns and unrated bond securities designated at FVTOCI internal ratings with comparable external ratings
are as follows:
Internal Rating External Rating2019
AED’0002018
AED’000
UAE Sovereigns Grade 2 to 3 AA to A 5,958,193 8,968,664
Unrated Grade 3- to 4 A- 418,929 152,694
Grade 5 to 6 BB+ to BB 443,075 155,895
Grade 7 CCC 210,225 –
7,030,422 9,277,253
226
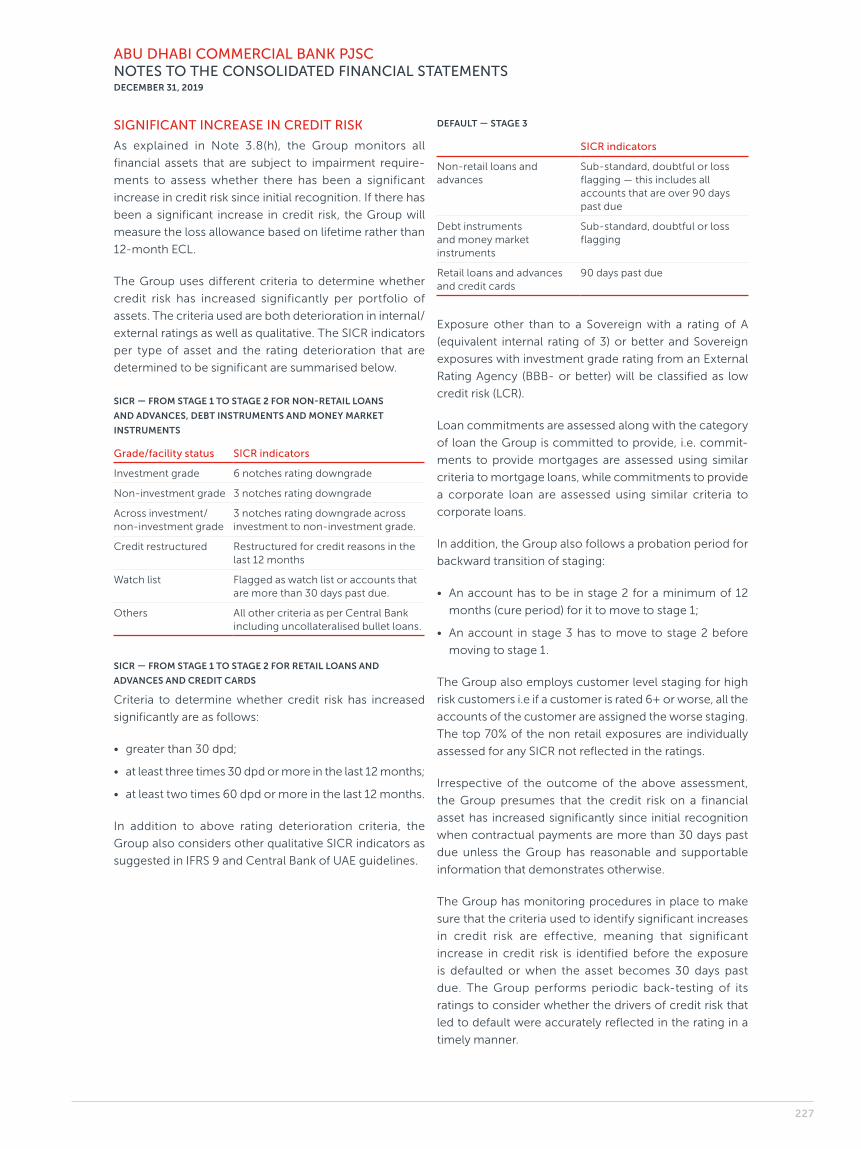
ABU DHABI COMMERCIAL BANK PJSCNOTES TO THE CONSOLIDATED FINANCIAL STATEMENTSDECEMBER 31, 2019
SIGNIFICANT INCREASE IN CREDIT RISK
As explained in Note 3.8(h), the Group monitors all
financial assets that are subject to impairment require-
ments to assess whether there has been a significant
increase in credit risk since initial recognition. If there has
been a significant increase in credit risk, the Group will
measure the loss allowance based on lifetime rather than
12-month ECL.
The Group uses different criteria to determine whether
credit risk has increased significantly per portfolio of
assets. The criteria used are both deterioration in internal/
external ratings as well as qualitative. The SICR indicators
per type of asset and the rating deterioration that are
determined to be significant are summarised below.
SICR — FROM STAGE 1 TO STAGE 2 FOR NON- RETAIL LOANS
AND ADVANCES, DEBT INSTRUMENTS AND MONEY MARKET
INSTRUMENTS
Grade/facility status SICR indicators
Investment grade 6 notches rating downgrade
Non- investment grade 3 notches rating downgrade
Across investment/ non- investment grade
3 notches rating downgrade across investment to non- investment grade.
Credit restructured Restructured for credit reasons in the last 12 months
Watch list Flagged as watch list or accounts that are more than 30 days past due.
Others All other criteria as per Central Bank including uncollateralised bullet loans.
SICR — FROM STAGE 1 TO STAGE 2 FOR RETAIL LOANS AND
ADVANCES AND CREDIT CARDS
Criteria to determine whether credit risk has increased
significantly are as follows:
• greater than 30 dpd;
• at least three times 30 dpd or more in the last 12 months;
• at least two times 60 dpd or more in the last 12 months.
In addition to above rating deterioration criteria, the
Group also considers other qualitative SICR indicators as
suggested in IFRS 9 and Central Bank of UAE guidelines.
DEFAULT — STAGE 3
SICR indicators
Non-retail loans and advances
Sub- standard, doubtful or loss flagging — this includes all accounts that are over 90 days past due
Debt instruments and money market instruments
Sub- standard, doubtful or loss flagging
Retail loans and advances and credit cards
90 days past due
Exposure other than to a Sovereign with a rating of A
(equivalent internal rating of 3) or better and Sovereign
exposures with investment grade rating from an External
Rating Agency (BBB- or better) will be classified as low
credit risk (LCR).
Loan commitments are assessed along with the category
of loan the Group is committed to provide, i.e. commit-
ments to provide mortgages are assessed using similar
criteria to mortgage loans, while commitments to provide
a corporate loan are assessed using similar criteria to
corporate loans.
In addition, the Group also follows a probation period for
backward transition of staging:
• An account has to be in stage 2 for a minimum of 12
months (cure period) for it to move to stage 1;
• An account in stage 3 has to move to stage 2 before
moving to stage 1.
The Group also employs customer level staging for high
risk customers i.e if a customer is rated 6+ or worse, all the
accounts of the customer are assigned the worse staging.
The top 70% of the non retail exposures are individually
assessed for any SICR not reflected in the ratings.
Irrespective of the outcome of the above assessment,
the Group presumes that the credit risk on a financial
asset has increased significantly since initial recognition
when contractual payments are more than 30 days past
due unless the Group has reasonable and supportable
information that demonstrates otherwise.
The Group has monitoring procedures in place to make
sure that the criteria used to identify significant increases
in credit risk are effective, meaning that significant
increase in credit risk is identified before the exposure
is defaulted or when the asset becomes 30 days past
due. The Group performs periodic back- testing of its
ratings to consider whether the drivers of credit risk that
led to default were accurately reflected in the rating in a
timely manner.
227

ABU DHABI COMMERCIAL BANK PJSCNOTES TO THE CONSOLIDATED FINANCIAL STATEMENTSDECEMBER 31, 2019
INCORPORATION OF FORWARD- LOOKING INFORMATION
The Group uses forward- looking macro- economic in its measurement of ECL. The Group Chief Economist provides
the macro- economic forecasts and scenarios.
The Group has identified and documented key drivers of credit risk and credit losses for each portfolio of financial
instruments and, has macro- economic models that forecast relationships between macro- economic variables and
credit losses.
The Group changed the macro- economic model used to predict corporate defaults — The change was made to align
the model with last approved macro- economic model used in Central Bank stress testing submission.
The table below summarises the principal macroeconomic indicators included in the economic scenarios used at
December 31, 2019 for the years 2020 to 2023, for UAE which is the country where the Group operates and therefore
is the country that has a material impact on ECLs.
List of macro variables used Definition Used in Range
Oil Price, Brent USD Price per barrel ADCB UAE Between USD 40 and USD 90
Real GDP Growth % change ADCB UAE Between 1.7% and 4.6%
Real Non-oil GDP Growth % change ADCB UAE Between 1.9% and 5.1%
Abu Dhabi Real Estate Sale Prices % change ADCB UAE Between -7.0% and 4.2%
Consumer inflation % annual average ADCB UAE Between 1.2% and 2.8%
Dubai Real Estate Sale Prices % change ADCB UAE Between -12% and -1%
Predicted relationships between the key indicators and default and loss rates on various portfolios of financial assets
have been developed based on analysing historical data of more than five years.
As required by Central Bank, the Group aligns its macro- economic model used in ECL computation with the macro-
economic model used in Central bank stress testing submissions.
MEASUREMENT OF ECL
The key inputs used for measuring ECL are:
• probability of default (PD);
• loss given default (LGD); and
• exposure at default (EAD).
These figures are generally derived from internally
developed statistical models and other historical data
and they are adjusted to reflect probability- weighted
forward- looking information.
PD is an estimate of the likelihood of default over a given
time horizon. It is estimated as at a point in time. The cal-
culation is based on statistical rating models, and assessed
using rating tools tailored to the various categories of
counterparties and exposures. These statistical models
are based on market data (where available), as well as
internal data comprising both quantitative and qualitative
factors. PDs are estimated considering the contractual
maturities of exposures and estimated prepayment rates.
The estimation is based on current conditions, adjusted
to take into account estimates of future conditions that
will impact PD.
LGD is an estimate of the loss arising on default. It is based
on the difference between the contractual cash flows due
and those that the lender would expect to receive, taking
into account cash flows from any collateral. The LGD
models for secured assets consider forecasts of future
collateral valuation taking into account sale discounts,
time to realisation of collateral, cross collateralisation
and seniority of claim, cost of realisation of collateral
and cure rates (i.e. exit from non- performing status). LGD
models for unsecured assets consider time of recovery,
recovery rates and seniority of claims. The calculation is
on a discounted cash flow basis, where the cash flows are
discounted by the original EIR of the loan.
EAD is an estimate of the exposure at a future default
date, taking into account expected changes in the expo-
sure after the reporting date, including repayments of
principal and interest, and expected drawdowns on com-
mitted facilities. The Group’s modelling approach for EAD
reflects expected changes in the balance outstanding
over the lifetime of the loan exposure that are permitted
by the current contractual terms, such as amortisation
profiles, early repayment or overpayment, changes in
utilisation of undrawn commitments and credit mitigation
actions taken before default. The Group uses EAD models
that reflect the characteristics of the portfolios.
228

ABU DHABI COMMERCIAL BANK PJSCNOTES TO THE CONSOLIDATED FINANCIAL STATEMENTSDECEMBER 31, 2019
The Group measures ECL considering the risk of default
over the maximum contractual period (including exten-
sion options) over which the entity is exposed to credit
risk and not a longer period, even if contact extension
or renewal is common business practice. However, for
financial instruments such as credit cards, revolving credit
facilities and overdraft facilities that include both a loan
and an undrawn commitment component, the Group’s
contractual ability to demand repayment and cancel the
undrawn commitment does not limit the Group’s expo-
sure to credit losses to the contractual notice period. For
such financial instruments the Group measures ECL over
the period that it is exposed to credit risk and ECL would
not be mitigated by credit risk management actions, even
if that period extends beyond the maximum contractual
period. These financial instruments do not have a fixed
term or repayment structure and have a short contrac-
tual cancellation period. However, the Group does not
enforce in the normal day-to-day management the
contractual right to cancel these financial instruments.
This is because these financial instruments are managed
on a collective basis and are cancelled only when the
Group becomes aware of an increase in credit risk at
the facility level. This longer period is estimated taking
into account the credit risk management actions that the
Group expects to take to mitigate ECL, e.g. reduction in
limits or cancellation of the loan commitment.
The ECL calculation for accounting purposes is different
to the provision calculation for regulatory purposes,
although many inputs used are similar. The Group has
ensured that the appropriate methodology is used
when calculating ECL for both accounting and regula-
tory purposes.
The measurement of ECL is based on probability weighted
average credit loss. As a result, the measurement of the
loss allowance should be the same regardless of whether
it is measured on an individual basis or a collective basis
(although measurement on a collective basis is more
practical for large portfolios of items). In relation to the
assessment of whether there has been a significant
increase in credit risk it can be necessary to perform the
assessment on a collective basis as noted below.
GROUPINGS BASED ON SHARED RISKS CHARACTERISTICS
For assessing the significant increase in credit risk and
for the measurement of ECL on a collective basis, the
financial instruments are grouped on the basis of shared
risk characteristics, such as:
• product type;
• credit risk grade;
• collateral type;
• date of initial recognition;
• economic sector/industry;
• geographic location of the borrower;
• income bracket of the borrower; and
• the value of collateral relative to the financial asset if it
has an impact on the probability of a default occurring
(loan-to-value (LTV) ratios).
The groupings are reviewed on a regular basis to ensure
that each group is comprised of homogenous exposures.
229
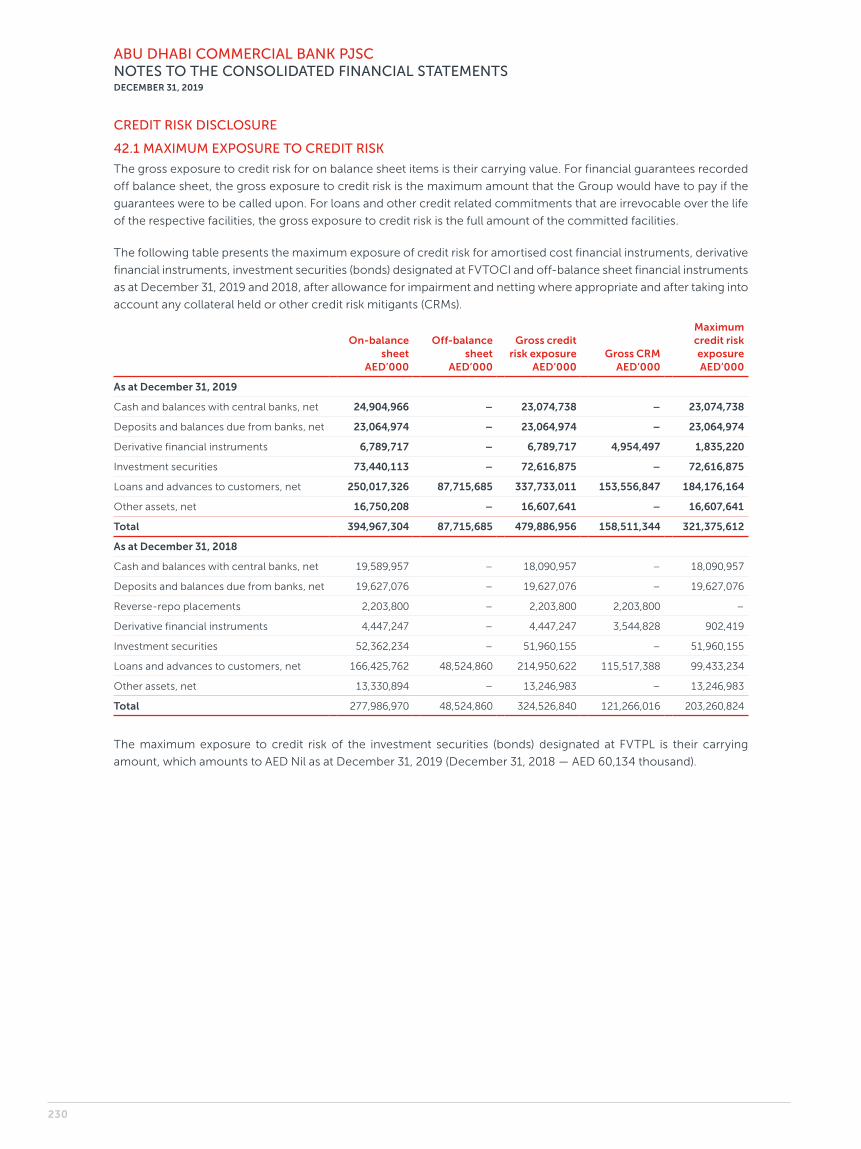
ABU DHABI COMMERCIAL BANK PJSCNOTES TO THE CONSOLIDATED FINANCIAL STATEMENTSDECEMBER 31, 2019
CREDIT RISK DISCLOSURE
42.1 MAXIMUM EXPOSURE TO CREDIT RISK
The gross exposure to credit risk for on balance sheet items is their carrying value. For financial guarantees recorded
off balance sheet, the gross exposure to credit risk is the maximum amount that the Group would have to pay if the
guarantees were to be called upon. For loans and other credit related commitments that are irrevocable over the life
of the respective facilities, the gross exposure to credit risk is the full amount of the committed facilities.
The following table presents the maximum exposure of credit risk for amortised cost financial instruments, derivative
financial instruments, investment securities (bonds) designated at FVTOCI and off- balance sheet financial instruments
as at December 31, 2019 and 2018, after allowance for impairment and netting where appropriate and after taking into
account any collateral held or other credit risk mitigants (CRMs).
On- balance sheet
AED’000
Off- balance sheet
AED’000
Gross credit risk exposure
AED’000Gross CRM
AED’000
Maximum credit risk exposure AED’000
As at December 31, 2019
Cash and balances with central banks, net 24,904,966 – 23,074,738 – 23,074,738
Deposits and balances due from banks, net 23,064,974 – 23,064,974 – 23,064,974
Derivative financial instruments 6,789,717 – 6,789,717 4,954,497 1,835,220
Investment securities 73,440,113 – 72,616,875 – 72,616,875
Loans and advances to customers, net 250,017,326 87,715,685 337,733,011 153,556,847 184,176,164
Other assets, net 16,750,208 – 16,607,641 – 16,607,641
Total 394,967,304 87,715,685 479,886,956 158,511,344 321,375,612
As at December 31, 2018
Cash and balances with central banks, net 19,589,957 – 18,090,957 – 18,090,957
Deposits and balances due from banks, net 19,627,076 – 19,627,076 – 19,627,076
Reverse-repo placements 2,203,800 – 2,203,800 2,203,800 –
Derivative financial instruments 4,447,247 – 4,447,247 3,544,828 902,419
Investment securities 52,362,234 – 51,960,155 – 51,960,155
Loans and advances to customers, net 166,425,762 48,524,860 214,950,622 115,517,388 99,433,234
Other assets, net 13,330,894 – 13,246,983 – 13,246,983
Total 277,986,970 48,524,860 324,526,840 121,266,016 203,260,824
The maximum exposure to credit risk of the investment securities (bonds) designated at FVTPL is their carrying
amount, which amounts to AED Nil as at December 31, 2019 (December 31, 2018 — AED 60,134 thousand).
230

ABU DHABI COMMERCIAL BANK PJSCNOTES TO THE CONSOLIDATED FINANCIAL STATEMENTSDECEMBER 31, 2019
42.2 GROSS EXPOSURE
An analysis of the Group’s credit risk exposure per class of financial asset, internal rating and “stage” without taking
into account the effects of any collateral or other credit enhancements is provided in the following tables. Unless
specifically indicated, for financial assets, the amounts in the table represent gross carrying amounts. For loan
commitments and financial guarantee contracts, the amounts in the table represent the amounts committed or
guaranteed, respectively.
As at December 31, 2019Stage 1
AED’000Stage 2
AED’000Stage 3
AED’000POCI
AED’000Total
AED’000
Financial instruments carried at amortised cost
Grades 1–4 142,813,914 459,862 – – 143,273,776
Grades 5–6 84,343,366 9,937,227 449,146 – 94,729,739
Grade 7 4,866,580 9,255,035 275,941 – 14,397,556
Grades 8–10 – – 6,882,654 3,726,497 10,609,151
Unrated 54,143,240 1,973,667 898,089 142,362 57,157,358
Gross financial instruments carried at amortised cost 286,167,100 21,625,791 8,505,830 3,868,859 320,167,580
Debt instruments designated at FVTOCI
Grades 1–4 62,711,131 – – – 62,711,131
Grades 5–6 7,165,943 2,529,575 – – 9,695,518
Grade 7 – – 210,226 – 210,226
Gross debt instruments designated at FVTOCI 69,877,074 2,529,575 210,226 – 72,616,875
Commitments and contingent liabilities
Grades 1–4 44,424,128 136,837 – – 44,560,965
Grades 5–6 32,162,448 2,307,143 – – 34,469,591
Grade 7 4,440,473 2,808,267 – – 7,248,740
Grades 8–10 – – – 932,213 932,213
Unrated 494,498 – – 9,678 504,176
Total commitments and contingent liabilities 81,521,547 5,252,247 – 941,891 87,715,685
As at December 31, 2018Stage 1
AED’000Stage 2
AED’000Stage 3
AED’000Total
AED’000
Financial instruments carried at amortised cost
Grades 1–4 116,172,078 871,408 – 117,043,486
Grades 5–6 54,442,891 6,080,145 22,920 60,545,956
Grade 7 2,009,854 8,214,653 314,440 10,538,947
Grades 8–10 – – 4,224,617 4,224,617
Unrated 32,144,064 1,207,979 665,185 34,017,228
Gross financial instruments carried at amortised cost 204,768,887 16,374,185 5,227,162 226,370,234
Debt instruments designated at FVTOCI
Grades 1–4 49,051,583 – – 49,051,583
Grades 5–6 1,517,888 1,138,839 – 2,656,727
Grade 7 – 251,845 – 251,845
Gross debt instruments designated at FVTOCI 50,569,471 1,390,684 – 51,960,155
Commitments and contingent liabilities
Grades 1–4 26,486,370 196,318 – 26,682,688
Grades 5–6 17,377,416 1,367,389 – 18,744,805
Grade 7 1,643,725 1,140,022 – 2,783,747
Unrated 313,620 – – 313,620
Total commitments and contingent liabilities 45,821,131 2,703,729 – 48,524,860
231
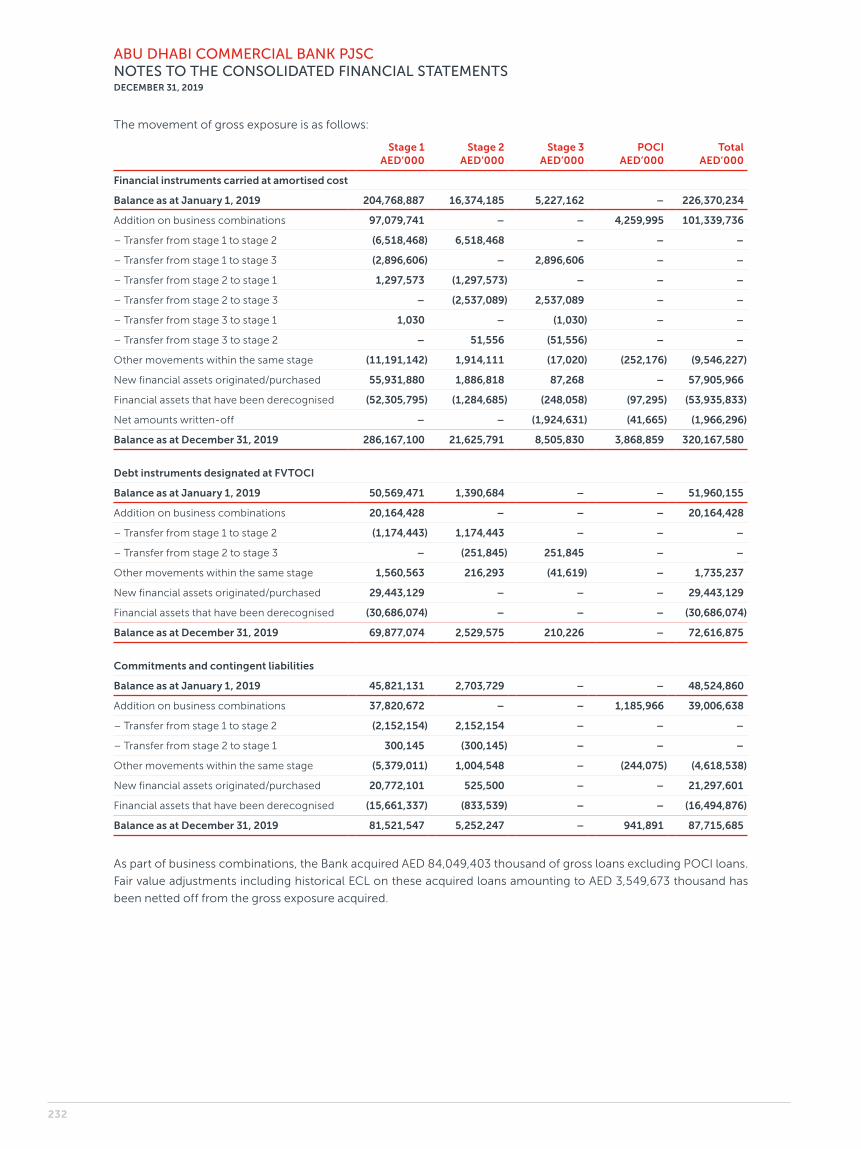
ABU DHABI COMMERCIAL BANK PJSCNOTES TO THE CONSOLIDATED FINANCIAL STATEMENTSDECEMBER 31, 2019
The movement of gross exposure is as follows:
Stage 1 AED’000
Stage 2 AED’000
Stage 3 AED’000
POCI AED’000
Total AED’000
Financial instruments carried at amortised cost
Balance as at January 1, 2019 204,768,887 16,374,185 5,227,162 – 226,370,234
Addition on business combinations 97,079,741 – – 4,259,995 101,339,736
– Transfer from stage 1 to stage 2 (6,518,468) 6,518,468 – – –
– Transfer from stage 1 to stage 3 (2,896,606) – 2,896,606 – –
– Transfer from stage 2 to stage 1 1,297,573 (1,297,573) – – –
– Transfer from stage 2 to stage 3 – (2,537,089) 2,537,089 – –
– Transfer from stage 3 to stage 1 1,030 – (1,030) – –
– Transfer from stage 3 to stage 2 – 51,556 (51,556) – –
Other movements within the same stage (11,191,142) 1,914,111 (17,020) (252,176) (9,546,227)
New financial assets originated/purchased 55,931,880 1,886,818 87,268 – 57,905,966
Financial assets that have been derecognised (52,305,795) (1,284,685) (248,058) (97,295) (53,935,833)
Net amounts written-off – – (1,924,631) (41,665) (1,966,296)
Balance as at December 31, 2019 286,167,100 21,625,791 8,505,830 3,868,859 320,167,580
Debt instruments designated at FVTOCI
Balance as at January 1, 2019 50,569,471 1,390,684 – – 51,960,155
Addition on business combinations 20,164,428 – – – 20,164,428
– Transfer from stage 1 to stage 2 (1,174,443) 1,174,443 – – –
– Transfer from stage 2 to stage 3 – (251,845) 251,845 – –
Other movements within the same stage 1,560,563 216,293 (41,619) – 1,735,237
New financial assets originated/purchased 29,443,129 – – – 29,443,129
Financial assets that have been derecognised (30,686,074) – – – (30,686,074)
Balance as at December 31, 2019 69,877,074 2,529,575 210,226 – 72,616,875
Commitments and contingent liabilities
Balance as at January 1, 2019 45,821,131 2,703,729 – – 48,524,860
Addition on business combinations 37,820,672 – – 1,185,966 39,006,638
– Transfer from stage 1 to stage 2 (2,152,154) 2,152,154 – – –
– Transfer from stage 2 to stage 1 300,145 (300,145) – – –
Other movements within the same stage (5,379,011) 1,004,548 – (244,075) (4,618,538)
New financial assets originated/purchased 20,772,101 525,500 – – 21,297,601
Financial assets that have been derecognised (15,661,337) (833,539) – – (16,494,876)
Balance as at December 31, 2019 81,521,547 5,252,247 – 941,891 87,715,685
As part of business combinations, the Bank acquired AED 84,049,403 thousand of gross loans excluding POCI loans.
Fair value adjustments including historical ECL on these acquired loans amounting to AED 3,549,673 thousand has
been netted off from the gross exposure acquired.
232
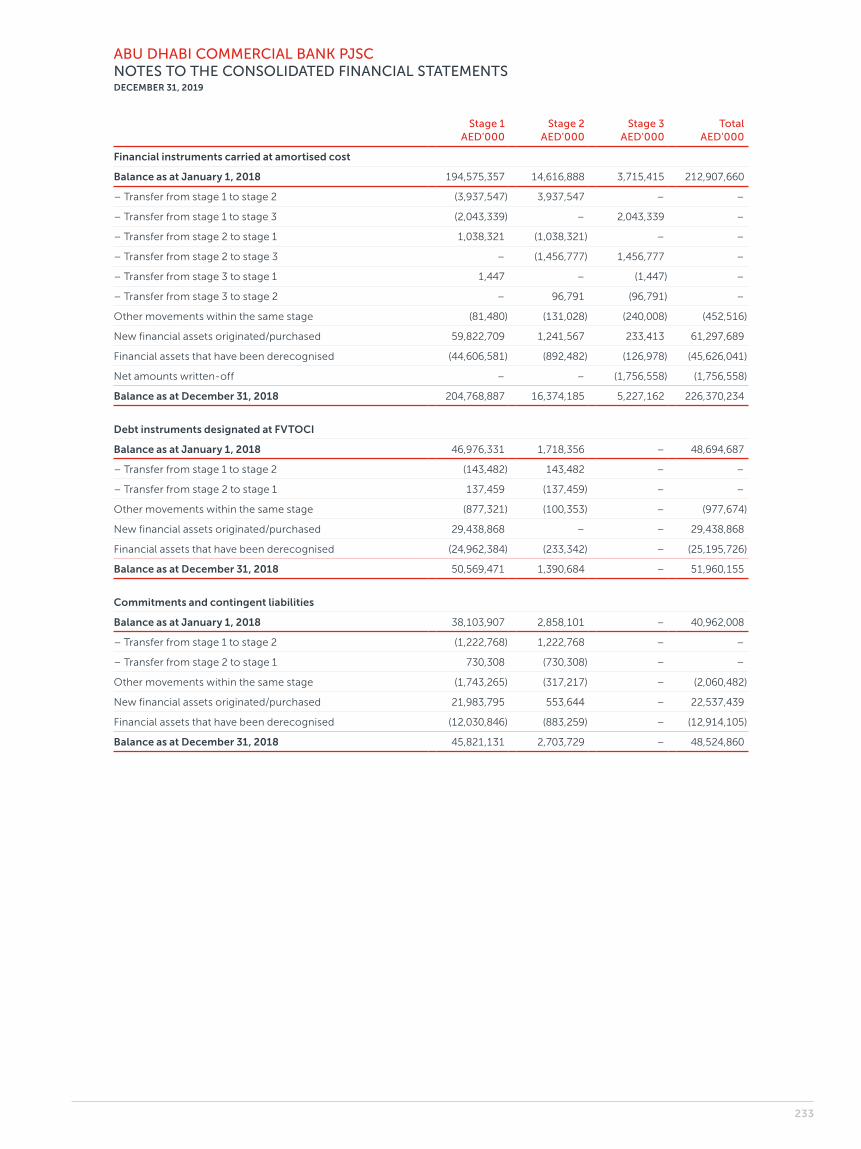
ABU DHABI COMMERCIAL BANK PJSCNOTES TO THE CONSOLIDATED FINANCIAL STATEMENTSDECEMBER 31, 2019
Stage 1 AED’000
Stage 2 AED’000
Stage 3 AED’000
Total AED’000
Financial instruments carried at amortised cost
Balance as at January 1, 2018 194,575,357 14,616,888 3,715,415 212,907,660
– Transfer from stage 1 to stage 2 (3,937,547) 3,937,547 – –
– Transfer from stage 1 to stage 3 (2,043,339) – 2,043,339 –
– Transfer from stage 2 to stage 1 1,038,321 (1,038,321) – –
– Transfer from stage 2 to stage 3 – (1,456,777) 1,456,777 –
– Transfer from stage 3 to stage 1 1,447 – (1,447) –
– Transfer from stage 3 to stage 2 – 96,791 (96,791) –
Other movements within the same stage (81,480) (131,028) (240,008) (452,516)
New financial assets originated/purchased 59,822,709 1,241,567 233,413 61,297,689
Financial assets that have been derecognised (44,606,581) (892,482) (126,978) (45,626,041)
Net amounts written-off – – (1,756,558) (1,756,558)
Balance as at December 31, 2018 204,768,887 16,374,185 5,227,162 226,370,234
Debt instruments designated at FVTOCI
Balance as at January 1, 2018 46,976,331 1,718,356 – 48,694,687
– Transfer from stage 1 to stage 2 (143,482) 143,482 – –
– Transfer from stage 2 to stage 1 137,459 (137,459) – –
Other movements within the same stage (877,321) (100,353) – (977,674)
New financial assets originated/purchased 29,438,868 – – 29,438,868
Financial assets that have been derecognised (24,962,384) (233,342) – (25,195,726)
Balance as at December 31, 2018 50,569,471 1,390,684 – 51,960,155
Commitments and contingent liabilities
Balance as at January 1, 2018 38,103,907 2,858,101 – 40,962,008
– Transfer from stage 1 to stage 2 (1,222,768) 1,222,768 – –
– Transfer from stage 2 to stage 1 730,308 (730,308) – –
Other movements within the same stage (1,743,265) (317,217) – (2,060,482)
New financial assets originated/purchased 21,983,795 553,644 – 22,537,439
Financial assets that have been derecognised (12,030,846) (883,259) – (12,914,105)
Balance as at December 31, 2018 45,821,131 2,703,729 – 48,524,860
233
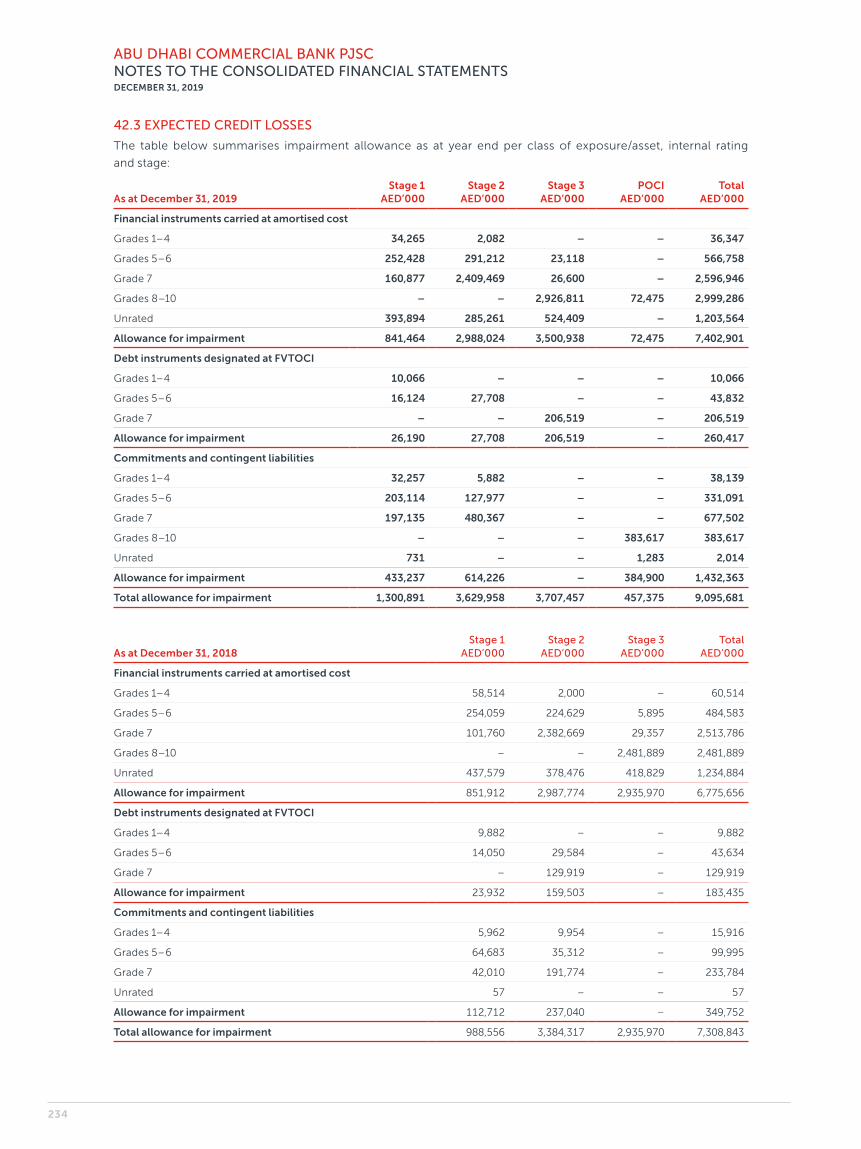
ABU DHABI COMMERCIAL BANK PJSCNOTES TO THE CONSOLIDATED FINANCIAL STATEMENTSDECEMBER 31, 2019
42.3 EXPECTED CREDIT LOSSES
The table below summarises impairment allowance as at year end per class of exposure/asset, internal rating
and stage:
As at December 31, 2019Stage 1
AED’000Stage 2
AED’000Stage 3
AED’000POCI
AED’000Total
AED’000
Financial instruments carried at amortised cost
Grades 1–4 34,265 2,082 – – 36,347
Grades 5–6 252,428 291,212 23,118 – 566,758
Grade 7 160,877 2,409,469 26,600 – 2,596,946
Grades 8–10 – – 2,926,811 72,475 2,999,286
Unrated 393,894 285,261 524,409 – 1,203,564
Allowance for impairment 841,464 2,988,024 3,500,938 72,475 7,402,901
Debt instruments designated at FVTOCI
Grades 1–4 10,066 – – – 10,066
Grades 5–6 16,124 27,708 – – 43,832
Grade 7 – – 206,519 – 206,519
Allowance for impairment 26,190 27,708 206,519 – 260,417
Commitments and contingent liabilities
Grades 1–4 32,257 5,882 – – 38,139
Grades 5–6 203,114 127,977 – – 331,091
Grade 7 197,135 480,367 – – 677,502
Grades 8–10 – – – 383,617 383,617
Unrated 731 – – 1,283 2,014
Allowance for impairment 433,237 614,226 – 384,900 1,432,363
Total allowance for impairment 1,300,891 3,629,958 3,707,457 457,375 9,095,681
As at December 31, 2018Stage 1
AED’000Stage 2
AED’000Stage 3
AED’000Total
AED’000
Financial instruments carried at amortised cost
Grades 1–4 58,514 2,000 – 60,514
Grades 5–6 254,059 224,629 5,895 484,583
Grade 7 101,760 2,382,669 29,357 2,513,786
Grades 8–10 – – 2,481,889 2,481,889
Unrated 437,579 378,476 418,829 1,234,884
Allowance for impairment 851,912 2,987,774 2,935,970 6,775,656
Debt instruments designated at FVTOCI
Grades 1–4 9,882 – – 9,882
Grades 5–6 14,050 29,584 – 43,634
Grade 7 – 129,919 – 129,919
Allowance for impairment 23,932 159,503 – 183,435
Commitments and contingent liabilities
Grades 1–4 5,962 9,954 – 15,916
Grades 5–6 64,683 35,312 – 99,995
Grade 7 42,010 191,774 – 233,784
Unrated 57 – – 57
Allowance for impairment 112,712 237,040 – 349,752
Total allowance for impairment 988,556 3,384,317 2,935,970 7,308,843
234

ABU DHABI COMMERCIAL BANK PJSCNOTES TO THE CONSOLIDATED FINANCIAL STATEMENTSDECEMBER 31, 2019
Allocation of impairment allowance for the year ended December 31, 2019 is as follows:
Stage 1 AED’000
Stage 2 AED’000
Stage 3 AED’000
POCI AED’000
Total AED’000
Balances with central banks (Note 5) 247 – – – 247
Deposits and balances due from banks (Note 6) 45,726 4,236 – – 49,962
Investment securities (Note 9) (*) 26,190 27,708 206,519 – 260,417
Loans and advances to customers (Note 10) 787,274 2,982,378 3,492,708 71,050 7,333,410
Other assets (Note 13) 8,217 1,410 8,230 1,425 19,282
Letters of credit, guarantees and other commitments (Note 20) 433,237 614,226 – 384,900 1,432,363
Total allowance for impairment 1,300,891 3,629,958 3,707,457 457,375 9,095,681
(*) Impairment allowance is recognised under “Revaluation reserve of investments designated at FVTOCI”.
Allocation of impairment allowance for the year ended December 31, 2018 is as follows:
Stage 1 AED’000
Stage 2 AED’000
Stage 3 AED’000
Total AED’000
Balances with central banks (Note 5) 228 – – 228
Deposits and balances due from banks (Note 6) 32,037 2,290 – 34,327
Investment securities (Note 9) (*) 23,932 159,503 – 183,435
Loans and advances to customers (Note 10) 815,349 2,984,050 2,927,473 6,726,872
Other assets (Note 13) 4,298 1,434 8,497 14,229
Letters of credit, guarantees and other commitments (Note 20) 112,712 237,040 – 349,752
Total allowance for impairment 988,556 3,384,317 2,935,970 7,308,843
(*) Impairment allowance is recognised under “Revaluation reserve of investments designated at FVTOCI”.
235

ABU DHABI COMMERCIAL BANK PJSCNOTES TO THE CONSOLIDATED FINANCIAL STATEMENTSDECEMBER 31, 2019
The movement in impairment allowances is as follows:
Stage 1 AED’000
Stage 2 AED’000
Stage 3 AED’000
POCI AED’000
Total AED’000
Financial instruments carried at amortised cost
Balance as at January 1, 2019 851,912 2,987,774 2,935,970 – 6,775,656
Addition on business combinations 5,184 – – 38,985 44,169
– Transfer from stage 1 to stage 2 (44,253) 44,253 – – –
– Transfer from stage 1 to stage 3 (56,757) – 56,757 – –
– Transfer from stage 2 to stage 1 114,947 (114,947) – – –
– Transfer from stage 2 to stage 3 – (540,828) 540,828 – –
– Transfer from stage 3 to stage 1 531 – (531) – –
– Transfer from stage 3 to stage 2 – 15,825 (15,825) – –
Other movements within the same stage (65,069) 520,308 1,803,071 75,155 2,333,465
New financial assets originated/purchased 248,384 151,910 264,689 – 664,983
Financial assets that have been derecognised (142,112) (67,510) (159,292) – (368,914)
Changes to methodologies, assumptions and risk parameters (71,303) (8,761) (97) – (80,161)
Gross (release)/charge for the year (15,632) 250 2,489,600 75,155 2,549,373
Recoveries – – (234,525) – (234,525)
Net (release)/charge for the year (15,632) 250 2,255,075 75,155 2,314,848
Net amounts written-off – – (1,690,107) (41,665) (1,731,772)
Balance as at December 31, 2019 841,464 2,988,024 3,500,938 72,475 7,402,901
Debt instruments designated at FVTOCI
Balance as at January 1, 2019 23,932 159,503 – – 183,435
– Transfer from stage 1 to stage 2 (920) 920 – – –
– Transfer from stage 2 to stage 3 – (129,919) 129,919 – –
Other movements within the same stage 4,354 (131) 76,600 – 80,823
New financial assets originated/purchased 7,378 – – – 7,378
Financial assets that have been derecognised (2,697) – – – (2,697)
Changes to methodologies, assumptions and risk parameters (5,857) (2,665) – – (8,522)
Net charge/(release) for the year 2,258 (131,795) 206,519 – 76,982
Balance as at December 31, 2019 26,190 27,708 206,519 – 260,417
Commitments and contingent liabilities
Balance as at January 1, 2019 112,712 237,040 – – 349,752
Addition on business combinations 625,643 – – 496,744 1,122,387
– Transfer from stage 1 to stage 2 (318,547) 318,547 – – –
– Transfer from stage 2 to stage 1 6,181 (6,181) – – –
Other movements within the same stage (13,564) 43,853 – (111,844) (81,555)
New financial assets originated/purchased 72,291 73,899 – – 146,190
Financial assets that have been derecognised (28,479) (55,053) – – (83,532)
Changes to methodologies, assumptions and risk parameters (23,000) 2,121 – – (20,879)
Net (release)/charge for the year (305,118) 377,186 – (111,844) (39,776)
Balance as at December 31, 2019 433,237 614,226 – 384,900 1,432,363
236

ABU DHABI COMMERCIAL BANK PJSCNOTES TO THE CONSOLIDATED FINANCIAL STATEMENTSDECEMBER 31, 2019
Stage 1 AED’000
Stage 2 AED’000
Stage 3 AED’000
Total AED’000
Financial instruments carried at amortised cost
Balance as at January 1, 2018 1,172,573 3,472,124 2,403,097 7,047,794
– Transfer from stage 1 to stage 2 (37,536) 37,536 – –
– Transfer from stage 1 to stage 3 (184,443) – 184,443 –
– Transfer from stage 2 to stage 1 179,053 (179,053) – –
– Transfer from stage 2 to stage 3 – (575,368) 575,368 –
– Transfer from stage 3 to stage 1 945 – (945) –
– Transfer from stage 3 to stage 2 – 22,285 (22,285) –
Other movements within the same stage (181,553) 91,587 1,552,981 1,463,015
New financial assets originated/purchased 189,897 146,222 78,781 414,900
Financial assets that have been derecognised (153,475) (51,673) (76,697) (281,845)
Changes to methodologies, assumptions and risk parameters (114,169) 24,114 (2,215) (92,270)
Gross (release)/charge for the year (301,281) (484,350) 2,289,431 1,503,800
Recoveries – – (218,089) (218,089)
Net (release)/charge for the year (301,281) (484,350) 2,071,342 1,285,711
Discount unwind (19,380) – – (19,380)
Net amounts written-off – – (1,538,469) (1,538,469)
Balance as at December 31, 2018 851,912 2,987,774 2,935,970 6,775,656
Debt instruments designated at FVTOCI
Balance as at January 1, 2018 19,106 186,930 – 206,036
– Transfer from stage 1 to stage 2 (396) 396 – –
– Transfer from stage 2 to stage 1 7,485 (7,485) – –
Other movements within the same stage 1,804 (12,624) – (10,820)
New financial assets originated/purchased 3,166 – – 3,166
Financial assets that have been derecognised (3,632) (2,954) – (6,586)
Changes to methodologies, assumptions and risk parameters (3,601) (4,760) – (8,361)
Net charge/(release) for the year 4,826 (27,427) – (22,601)
Balance as at December 31, 2018 23,932 159,503 – 183,435
Commitments and contingent liabilities
Balance as at January 1, 2018 94,772 252,303 – 347,075
– Transfer from stage 1 to stage 2 (2,976) 2,976 – –
– Transfer from stage 2 to stage 1 25,899 (25,899) – –
Other movements within the same stage (29,220) 30,026 – 806
New financial assets originated/purchased 49,981 27,123 – 77,104
Financial assets that have been derecognised (17,893) (46,168) – (64,061)
Changes to methodologies, assumptions and risk parameters (7,851) (3,321) – (11,172)
Net charge/(release) for the year 17,940 (15,263) – 2,677
Balance as at December 31, 2018 112,712 237,040 – 349,752
237
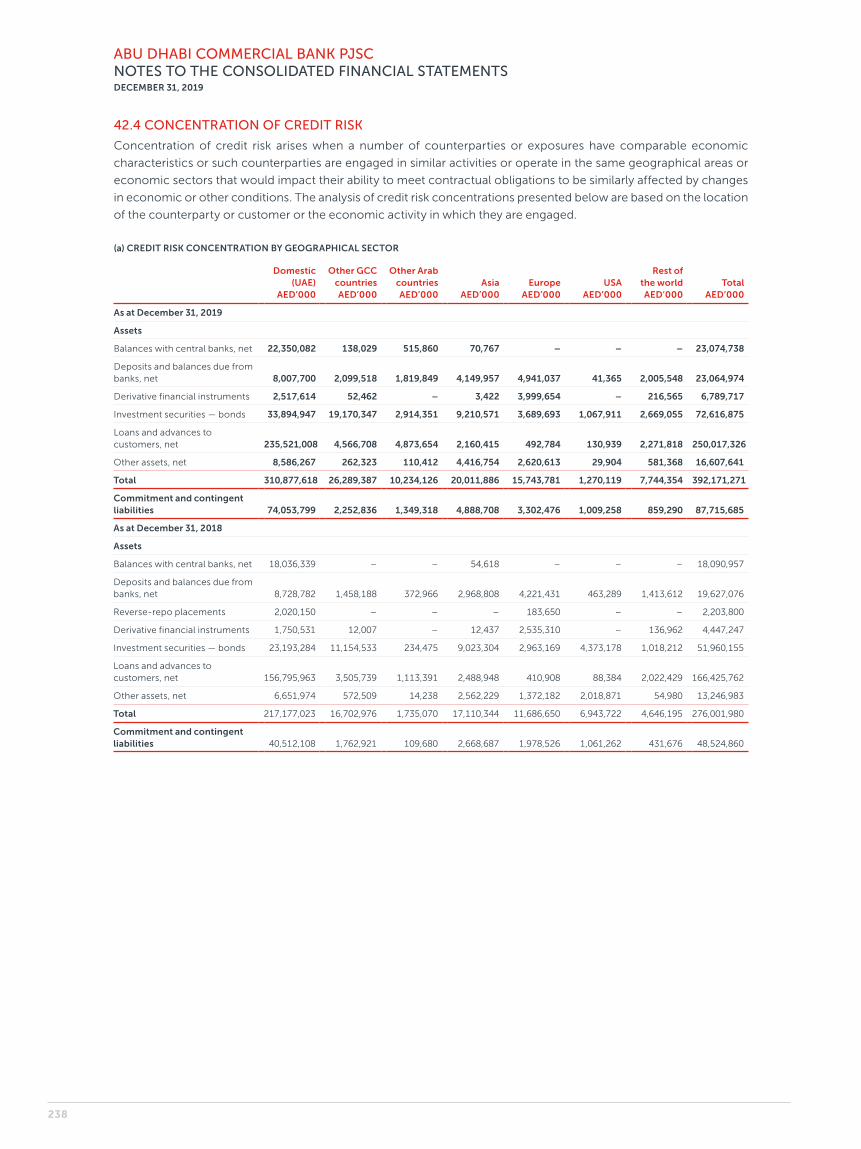
ABU DHABI COMMERCIAL BANK PJSCNOTES TO THE CONSOLIDATED FINANCIAL STATEMENTSDECEMBER 31, 2019
42.4 CONCENTRATION OF CREDIT RISK
Concentration of credit risk arises when a number of counterparties or exposures have comparable economic
characteristics or such counterparties are engaged in similar activities or operate in the same geographical areas or
economic sectors that would impact their ability to meet contractual obligations to be similarly affected by changes
in economic or other conditions. The analysis of credit risk concentrations presented below are based on the location
of the counterparty or customer or the economic activity in which they are engaged.
(a) CREDIT RISK CONCENTRATION BY GEOGRAPHICAL SECTOR
Domestic (UAE)
AED’000
Other GCC countries AED’000
Other Arab countries AED’000
Asia AED’000
Europe AED’000
USA AED’000
Rest of the world AED’000
Total AED’000
As at December 31, 2019
Assets
Balances with central banks, net 22,350,082 138,029 515,860 70,767 – – – 23,074,738
Deposits and balances due from banks, net 8,007,700 2,099,518 1,819,849 4,149,957 4,941,037 41,365 2,005,548 23,064,974
Derivative financial instruments 2,517,614 52,462 – 3,422 3,999,654 – 216,565 6,789,717
Investment securities — bonds 33,894,947 19,170,347 2,914,351 9,210,571 3,689,693 1,067,911 2,669,055 72,616,875
Loans and advances to customers, net 235,521,008 4,566,708 4,873,654 2,160,415 492,784 130,939 2,271,818 250,017,326
Other assets, net 8,586,267 262,323 110,412 4,416,754 2,620,613 29,904 581,368 16,607,641
Total 310,877,618 26,289,387 10,234,126 20,011,886 15,743,781 1,270,119 7,744,354 392,171,271
Commitment and contingent liabilities 74,053,799 2,252,836 1,349,318 4,888,708 3,302,476 1,009,258 859,290 87,715,685
As at December 31, 2018
Assets
Balances with central banks, net 18,036,339 – – 54,618 – – – 18,090,957
Deposits and balances due from banks, net 8,728,782 1,458,188 372,966 2,968,808 4,221,431 463,289 1,413,612 19,627,076
Reverse-repo placements 2,020,150 – – – 183,650 – – 2,203,800
Derivative financial instruments 1,750,531 12,007 – 12,437 2,535,310 – 136,962 4,447,247
Investment securities — bonds 23,193,284 11,154,533 234,475 9,023,304 2,963,169 4,373,178 1,018,212 51,960,155
Loans and advances to customers, net 156,795,963 3,505,739 1,113,391 2,488,948 410,908 88,384 2,022,429 166,425,762
Other assets, net 6,651,974 572,509 14,238 2,562,229 1,372,182 2,018,871 54,980 13,246,983
Total 217,177,023 16,702,976 1,735,070 17,110,344 11,686,650 6,943,722 4,646,195 276,001,980
Commitment and contingent liabilities 40,512,108 1,762,921 109,680 2,668,687 1,978,526 1,061,262 431,676 48,524,860
238
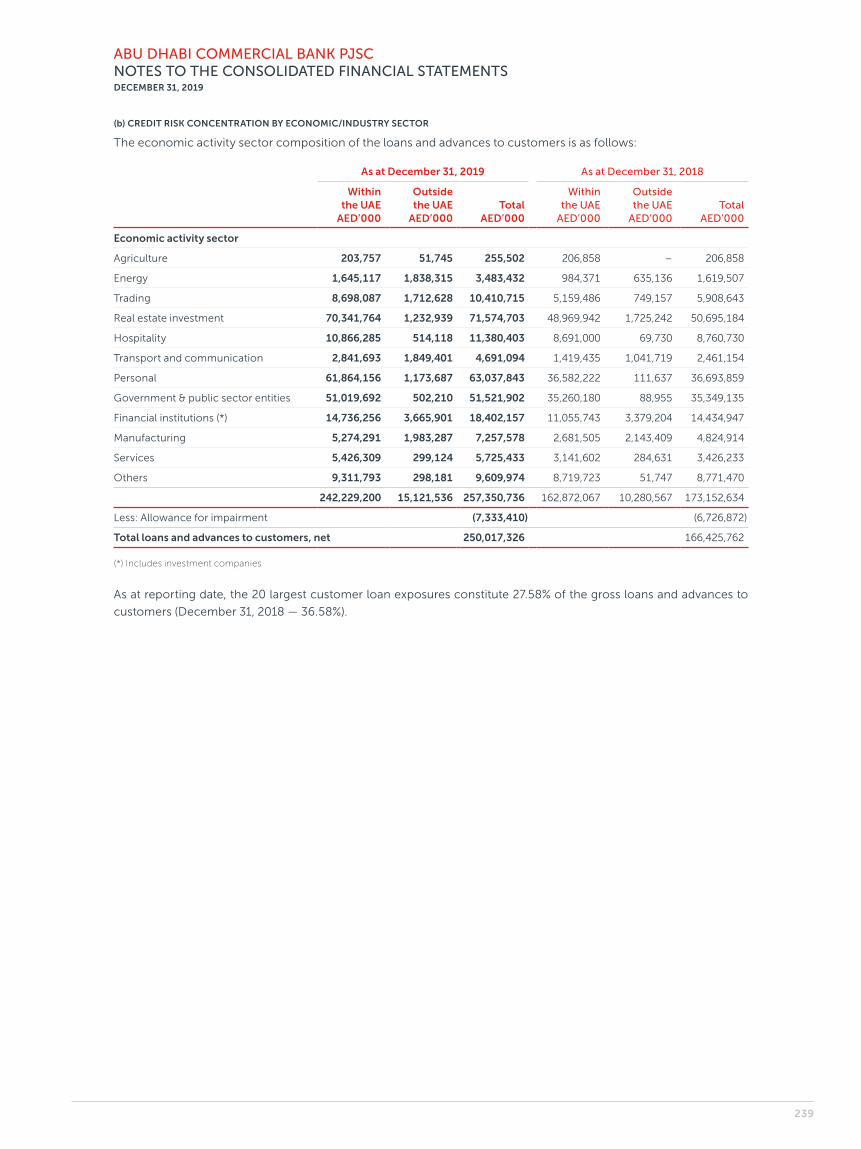
ABU DHABI COMMERCIAL BANK PJSCNOTES TO THE CONSOLIDATED FINANCIAL STATEMENTSDECEMBER 31, 2019
(b) CREDIT RISK CONCENTRATION BY ECONOMIC/INDUSTRY SECTOR
The economic activity sector composition of the loans and advances to customers is as follows:
As at December 31, 2019 As at December 31, 2018
Within the UAE
AED’000
Outside the UAE
AED’000Total
AED’000
Within the UAE
AED’000
Outside the UAE
AED’000Total
AED’000
Economic activity sector
Agriculture 203,757 51,745 255,502 206,858 – 206,858
Energy 1,645,117 1,838,315 3,483,432 984,371 635,136 1,619,507
Trading 8,698,087 1,712,628 10,410,715 5,159,486 749,157 5,908,643
Real estate investment 70,341,764 1,232,939 71,574,703 48,969,942 1,725,242 50,695,184
Hospitality 10,866,285 514,118 11,380,403 8,691,000 69,730 8,760,730
Transport and communication 2,841,693 1,849,401 4,691,094 1,419,435 1,041,719 2,461,154
Personal 61,864,156 1,173,687 63,037,843 36,582,222 111,637 36,693,859
Government & public sector entities 51,019,692 502,210 51,521,902 35,260,180 88,955 35,349,135
Financial institutions (*) 14,736,256 3,665,901 18,402,157 11,055,743 3,379,204 14,434,947
Manufacturing 5,274,291 1,983,287 7,257,578 2,681,505 2,143,409 4,824,914
Services 5,426,309 299,124 5,725,433 3,141,602 284,631 3,426,233
Others 9,311,793 298,181 9,609,974 8,719,723 51,747 8,771,470
242,229,200 15,121,536 257,350,736 162,872,067 10,280,567 173,152,634
Less: Allowance for impairment (7,333,410) (6,726,872)
Total loans and advances to customers, net 250,017,326 166,425,762
(*) Includes investment companies
As at reporting date, the 20 largest customer loan exposures constitute 27.58% of the gross loans and advances to
customers (December 31, 2018 — 36.58%).
239
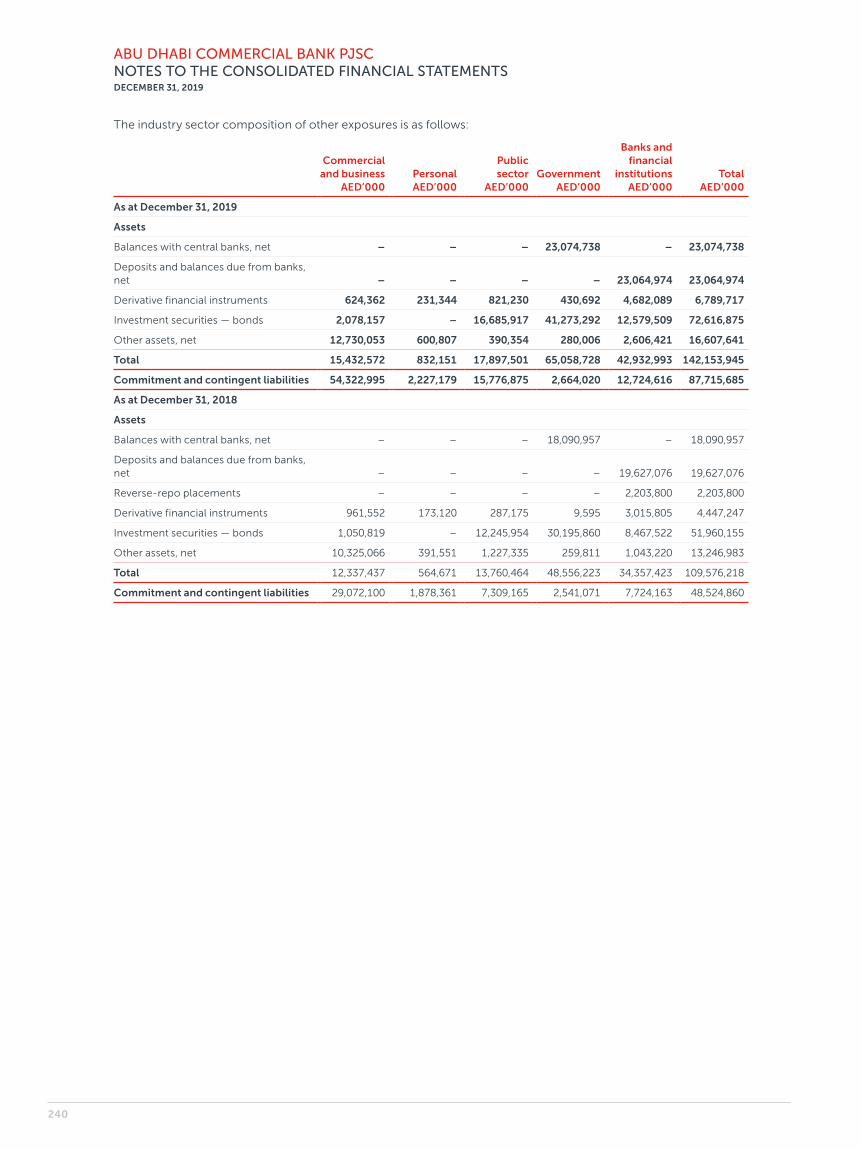
ABU DHABI COMMERCIAL BANK PJSCNOTES TO THE CONSOLIDATED FINANCIAL STATEMENTSDECEMBER 31, 2019
The industry sector composition of other exposures is as follows:
Commercial and business
AED’000Personal AED’000
Public sector
AED’000Government
AED’000
Banks and financial
institutions AED’000
Total AED’000
As at December 31, 2019
Assets
Balances with central banks, net – – – 23,074,738 – 23,074,738
Deposits and balances due from banks, net – – – – 23,064,974 23,064,974
Derivative financial instruments 624,362 231,344 821,230 430,692 4,682,089 6,789,717
Investment securities — bonds 2,078,157 – 16,685,917 41,273,292 12,579,509 72,616,875
Other assets, net 12,730,053 600,807 390,354 280,006 2,606,421 16,607,641
Total 15,432,572 832,151 17,897,501 65,058,728 42,932,993 142,153,945
Commitment and contingent liabilities 54,322,995 2,227,179 15,776,875 2,664,020 12,724,616 87,715,685
As at December 31, 2018
Assets
Balances with central banks, net – – – 18,090,957 – 18,090,957
Deposits and balances due from banks, net – – – – 19,627,076 19,627,076
Reverse-repo placements – – – – 2,203,800 2,203,800
Derivative financial instruments 961,552 173,120 287,175 9,595 3,015,805 4,447,247
Investment securities — bonds 1,050,819 – 12,245,954 30,195,860 8,467,522 51,960,155
Other assets, net 10,325,066 391,551 1,227,335 259,811 1,043,220 13,246,983
Total 12,337,437 564,671 13,760,464 48,556,223 34,357,423 109,576,218
Commitment and contingent liabilities 29,072,100 1,878,361 7,309,165 2,541,071 7,724,163 48,524,860
240

ABU DHABI COMMERCIAL BANK PJSCNOTES TO THE CONSOLIDATED FINANCIAL STATEMENTSDECEMBER 31, 2019
42.5 CREDIT RISK MEASUREMENT AND MITIGATION POLICIES
Loans and advances to customers is the main source of
credit risk although the Group can also be exposed to
other forms of credit risk through, for example, loans
to banks, loan commitments and debt securities. The
Group’s risk management policies and processes are
designed to identify and analyse risk, to set appropriate
risk appetite and to monitor the risks and adherence to
limits by means of reliable and timely data. The Group
assesses the probability of default of individual counter-
parties using internal rating tools tailored to the various
categories of counterparties.
Exposure to credit risk is also managed through regular
analysis of the ability of borrowers and potential borrow-
ers to meet interest and capital repayment obligations
and by changing the lending limits where appropriate.
COLLATERAL
The Group holds collateral against various credit
risk exposures in the form of mortgage interests over
property, other registered securities over assets, fixed
deposits and guarantees. Estimates of fair value of the
collateral (including shares) are updated on a regular basis.
Collateral generally is not held over loans and advances to
banks, except when securities are held as part of reverse
repurchase and securities borrowing activity. The princi-
pal collateral types for loans and advances are:
• Cash and marketable securities;
• Mortgages over residential and commercial properties;
• Charges over business assets such as premises, inven-
tory and accounts receivable;
• Charges over financial instruments such as debt secu-
rities and equities; and
• Guarantees.
The estimated fair value of collateral and other secu-
rity enhancements held against various credit risk
exposures for the year ended December 31, 2019 was
AED 247,161,187 thousand (December 31, 2018 — AED
178,273,983 thousand).
Collateral held as security against impaired loans primar-
ily relates to commercial and residential properties and
securities. Where the estimated fair value of collateral
held exceeds the outstanding loan, any excess on realisa-
tion is paid back to the customers and is not available for
offset against other loans.
WRITE-OFF
Financial assets are written off when there is no reason-
able expectation of recovery, such as a debtor failing to
engage in a repayment plan with the Group. The Group
categorises a loan or receivable for write off when a
debtor fails to make contractual payments greater than
180 days past due for retail and SME loans. Where loans
or receivables have been written off, the Group continues
to engage in enforcement activity to attempt to recover
the receivable due. Where recoveries are made, these are
recognised in profit or loss.
REVERSAL OF IMPAIRMENT
If the amount of an impairment loss decreases in a
subsequent period, and the decrease can be related
objectively to an event occurring after the impairment
was recognised, the excess is written back by reducing
the loan impairment allowance account accordingly.
The write-back is recognised in the consolidated income
statement in the period in which it occurs.
DERIVATIVES
The Group maintains strict control limits on net open
derivative positions (i.e. the difference between purchase
and sale contracts), by both amount and term. At any
time, the amount subject to credit risk is limited to the
current fair value of instruments that are favourable to the
Group (i.e. positive fair value of assets), which in relation
to derivatives is a small fraction of the contract or notional
values used to express the volume of instruments out-
standing. This credit risk exposure is managed as part of
the overall lending limits with customers together with
potential exposures from market movements.
Settlement risk arises in any situation where a payment in
cash, securities or equities is made in the expectation of a
corresponding receipt in cash, securities or equities. Daily
settlement limits are established for each counterparty to
cover the aggregate of all settlement risks arising from the
Group’s market transactions on any single day.
The following table represents internal credit ratings of
derivative financial instruments:
2019 AED’000
2018 AED’000
Internal risk grades
Grades 1 to 4 5,160,691 3,639,422
Grades 5 to 6 1,536,539 776,407
Grade 7 74,873 –
Unrated 17,614 31,418
6,789,717 4,447,247
241
ABU DHABI COMMERCIAL BANK PJSCNOTES TO THE CONSOLIDATED FINANCIAL STATEMENTSDECEMBER 31, 2019
MASTER NETTING ARRANGEMENTS
The Group further restricts its exposure to credit losses
by entering into master netting arrangements with coun-
terparties with which it undertakes a significant volume of
transactions. Master netting arrangements do not gen-
erally result in an offset of statement of financial position
assets and liabilities, as transactions are usually settled on
a gross basis, hence the impact of netting in practice is
immaterial.
However, the credit risk associated with favourable
contracts is reduced by a master netting arrangement to
the extent that if a default occurs, all amounts with the
counterparty are terminated and settled on a net basis.
The Group’s overall exposure to credit risk on derivative
instruments subject to master netting arrangements can
change substantially within a year, as it is affected by each
transaction subject to the arrangement.
DERIVATIVE RELATED CREDIT RISK
Credit risk in respect of derivative financial instruments
arises from the potential for a counterparty to default on
its contractual obligations and is limited to the positive
fair value of instruments that are favourable to the Group.
The Group enters into derivative contracts with financial
institutions and corporates which are of satisfactory credit
standing as per the Group’s independent credit assess-
ment. Credit risk in derivatives is mitigated through limit
control and master netting agreements.
OFF- BALANCE SHEET
The Group applies the same risk management policies
for off- balance sheet risks as it does for its on- balance
sheet risks with the exception that the worse staging for
off- balance sheet exposures is stage 2. In the case of
commitments to lend, customers and counterparties will
be subject to the same credit management policies as for
loans and advances. Collateral may be sought depending
on the strength of the counterparty and the nature of the
transaction.
43. Interest rate risk framework, measurement and monitoring
Interest rate risk arises from interest bearing financial
instruments and reflects the possibility that changes in
interest rates will adversely affect the value of the financial
instruments and the related income. The Group manages
this risk principally through monitoring of interest rate
gaps, economic value of equity and earnings at risk and
by matching the re- pricing profile of assets and liabilities.
Overall interest rate risk positions are managed by the
Group’s Treasury division, which uses derivative instru-
ments such as interest rate swaps and cross currency
interest rate swaps to manage the overall interest rate
risk arising from the Group’s interest bearing financial
instruments.
Financial assets and liabilities exposed to interest rate risk
are assets and liabilities with either a fixed or a floating
contractual rate of interest. A significant portion of the
Group’s loans and advances, deposits and balances due
from banks, investment securities, deposits from custom-
ers, due to banks, and borrowings fall under this category.
Financial assets that are not subject to any interest rate
risk mainly comprise of investments in equity investments,
cash and balances with central banks excluding certificate
of deposits and reverse repo.
The off- balance sheet gap represents the net notional
amounts of the off- balance sheet financial instruments,
such as interest rate and cross currency interest rate
swaps which are used to manage interest rate risk.
The Group uses financial simulation tools to periodically
measure and monitor interest rate sensitivity. The results
are analysed and monitored by the Asset and Liability
Committee (ALCO).
The Group’s interest rate sensitivity position based on
contractual repricing arrangements as at December 31,
2019 is as follows. Derivative financial instruments (other
than those designated in a hedge relationship) and trading
book assets and liabilities (excluding non- interest bearing)
are included in the “less than 3 months” column at their
fair value. Derivative financial instruments designated
in a hedge relationship are included according to their
contractual next re- pricing tenor.
242

ABU DHABI COMMERCIAL BANK PJSCNOTES TO THE CONSOLIDATED FINANCIAL STATEMENTSDECEMBER 31, 2019
Less than 3 months AED’000
3 months to less than
6 months AED’000
6 months to less
than 1 year AED’000
1 year to less than
3 years AED’000
Over 3 years
AED’000
Non- interest bearing
items AED’000
Total AED’000
Assets
Cash and balances with central banks, net 3,916,366 925,000 – – – 20,063,600 24,904,966
Deposits and balances due from banks, net 14,339,262 4,564,997 3,009,306 – – 1,151,409 23,064,974
Derivative financial instruments 5,909,711 50,510 – – – 829,496 6,789,717
Investment securities 10,386,061 3,775,714 5,110,890 23,590,702 29,753,508 823,238 73,440,113
Loans and advances to customers, net 190,644,741 25,372,562 7,348,137 8,747,036 26,541,893 (8,637,043) 250,017,326
Investment in associates – – – – – 407,768 407,768
Investment properties – – – – – 1,693,707 1,693,707
Other assets, net – – – – – 16,750,208 16,750,208
Property and equipment, net – – – – – 2,197,571 2,197,571
Intangible assets, net – – – – – 5,332,497 5,332,497
Assets held for sale – – – – – 535,830 535,830
Total assets 225,196,141 34,688,783 15,468,333 32,337,738 56,295,401 41,148,281 405,134,677
Liabilities and equity
Due to banks 3,186,219 109,821 36,730 660,911 – 1,739,098 5,732,779
Derivative financial instruments 6,179,120 35,257 – – – 735,514 6,949,891
Deposits from customers 139,863,952 32,357,423 25,673,762 3,222,513 231,486 60,744,646 262,093,782
Euro commercial paper 1,382,071 462,732 217,535 – – – 2,062,338
Borrowings 15,825,363 371,360 784,949 4,215,790 30,684,592 – 51,882,054
Other liabilities – – – – – 20,302,794 20,302,794
Liabilities related to assets held for sale – – – – – 413,395 413,395
Equity – – – – – 55,697,644 55,697,644
Total liabilities and equity 166,436,725 33,336,593 26,712,976 8,099,214 30,916,078 139,633,091 405,134,677
On- balance sheet gap 58,759,416 1,352,190 (11,244,643) 24,238,524 25,379,323 (98,484,810) –
Off- balance sheet gap 7,782,963 (332,626) (3,067,581) (8,639,002) 4,256,246 – –
Total interest rate sensitivity gap 66,542,379 1,019,564 (14,312,224) 15,599,522 29,635,569 (98,484,810) –
Cumulative interest rate sensitivity gap 66,542,379 67,561,943 53,249,719 68,849,241 98,484,810 – –
Non- interest bearing items under loans and advances to customers, net include mainly impairment allowances.
243
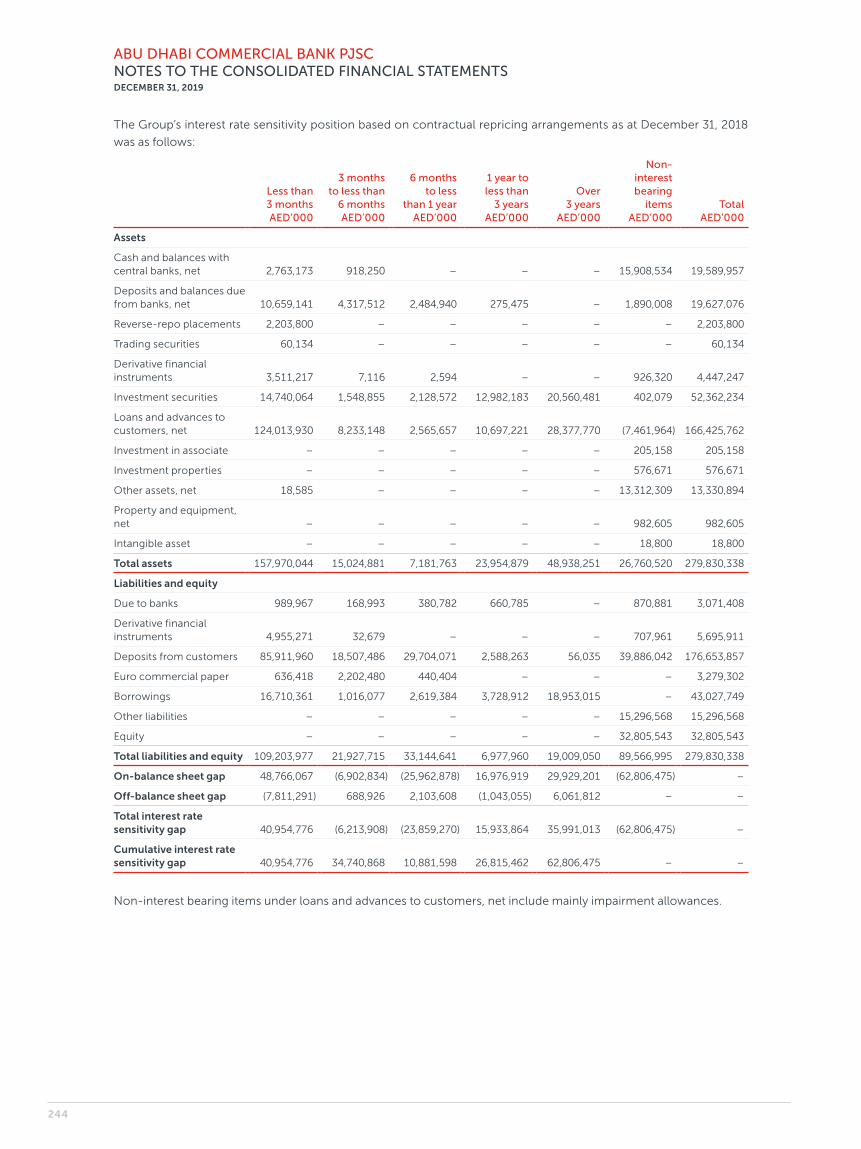
ABU DHABI COMMERCIAL BANK PJSCNOTES TO THE CONSOLIDATED FINANCIAL STATEMENTSDECEMBER 31, 2019
The Group’s interest rate sensitivity position based on contractual repricing arrangements as at December 31, 2018
was as follows:
Less than 3 months AED’000
3 months to less than
6 months AED’000
6 months to less
than 1 year AED’000
1 year to less than
3 years AED’000
Over 3 years
AED’000
Non- interest bearing
items AED’000
Total AED’000
Assets
Cash and balances with central banks, net 2,763,173 918,250 – – – 15,908,534 19,589,957
Deposits and balances due from banks, net 10,659,141 4,317,512 2,484,940 275,475 – 1,890,008 19,627,076
Reverse-repo placements 2,203,800 – – – – – 2,203,800
Trading securities 60,134 – – – – – 60,134
Derivative financial instruments 3,511,217 7,116 2,594 – – 926,320 4,447,247
Investment securities 14,740,064 1,548,855 2,128,572 12,982,183 20,560,481 402,079 52,362,234
Loans and advances to customers, net 124,013,930 8,233,148 2,565,657 10,697,221 28,377,770 (7,461,964) 166,425,762
Investment in associate – – – – – 205,158 205,158
Investment properties – – – – – 576,671 576,671
Other assets, net 18,585 – – – – 13,312,309 13,330,894
Property and equipment, net – – – – – 982,605 982,605
Intangible asset – – – – – 18,800 18,800
Total assets 157,970,044 15,024,881 7,181,763 23,954,879 48,938,251 26,760,520 279,830,338
Liabilities and equity
Due to banks 989,967 168,993 380,782 660,785 – 870,881 3,071,408
Derivative financial instruments 4,955,271 32,679 – – – 707,961 5,695,911
Deposits from customers 85,911,960 18,507,486 29,704,071 2,588,263 56,035 39,886,042 176,653,857
Euro commercial paper 636,418 2,202,480 440,404 – – – 3,279,302
Borrowings 16,710,361 1,016,077 2,619,384 3,728,912 18,953,015 – 43,027,749
Other liabilities – – – – – 15,296,568 15,296,568
Equity – – – – – 32,805,543 32,805,543
Total liabilities and equity 109,203,977 21,927,715 33,144,641 6,977,960 19,009,050 89,566,995 279,830,338
On- balance sheet gap 48,766,067 (6,902,834) (25,962,878) 16,976,919 29,929,201 (62,806,475) –
Off- balance sheet gap (7,811,291) 688,926 2,103,608 (1,043,055) 6,061,812 – –
Total interest rate sensitivity gap 40,954,776 (6,213,908) (23,859,270) 15,933,864 35,991,013 (62,806,475) –
Cumulative interest rate sensitivity gap 40,954,776 34,740,868 10,881,598 26,815,462 62,806,475 – –
Non- interest bearing items under loans and advances to customers, net include mainly impairment allowances.
244
ABU DHABI COMMERCIAL BANK PJSCNOTES TO THE CONSOLIDATED FINANCIAL STATEMENTSDECEMBER 31, 2019
44. Liquidity risk framework, measurement and monitoring
Liquidity risk is the risk that the Group will be unable to
meet its payment obligations associated with its finan-
cial liabilities when they fall due and to replenish funds
when they are withdrawn. The Group’s approach to
managing liquidity is to ensure, that it will always have
sufficient liquidity to meet its liabilities when due, under
both normal and stressed conditions, without incurring
unacceptable losses or risking damage to the Group’s
reputation.
LIQUIDITY RISK MANAGEMENT PROCESS
The Group has Board of Directors (BOD) approved liquidity
risk appetite framework which establishes the minimum
liquidity to be carried by the Group in order to survive
a stress environment for a stipulated time horizon. The
BOD has delegated to Management Executive Committee
(MEC) the responsibility of liquidity management which is
overseen on their behalf by the Asset Liability Committee
(ALCO) on a day to day basis. ALCO sets and monitors
liquidity ratios and regularly revises and calibrates the
liquidity management policies to ensure that the Group
is in a position to meet its obligations as they fall due.
ALCO also ensures that the bank remains compliant with
all regulatory and internal policy guidelines pertaining to
liquidity risk.
The Group’s liquidity management process, as carried out
within the Group and monitored by the Group’s Treasury
division includes:
• Monitoring of liquidity position on a daily, weekly and
monthly basis. This entails forecasting of future cash
inflows/outflows and ensuring that the Group can meet
the required outflows;
• Conducting regularly liquidity stress testing of the
Group’s liquidity position under a variety of scenarios
covering both normal and more severe market condi-
tions with triggers and suggested actions;
• Ensuring regular compliance with the liquidity ratios
such as Advances to Stable Resources (ADR) ratio and
Liquidity Coverage ratio (LCR) stipulated by the Central
Bank of the UAE and internally approved management
triggers for liquidity risk;
• Monitoring Basel-III based NSFR liquidity risk ratio as a
measure of long-term liquidity stress and maintaining
the ratio above the management approved thresh-
old; and
• Conducting regular enterprise wide liquidity stress test
which estimates liquidity requirements under idiosyn-
cratic and systemic stress conditions. The enterprise
wide stress test incorporates diverse liquidity triggers
like currency de-peg, failure of a major local bank,
credit rating downgrades in addition to regular stress
cash flow analysis.
• Monitoring of depositor concentration to ensure that
the Group’s deposit funding is well diversified.
The Group has set an internal ceiling on the ADR ratio that
should not be higher than 1:1 between:
– the amount of loans and advances together with the
amount of inter-bank placements with a remaining
life of more than three months; and
– the amount of stable resource comprising of free
own funds with a remaining life of more than six
months, stable customer deposits and standby
liquidity facilities.
The above is in line with the definition of Advances to
Stable Resources ratio as prescribed by the Central Bank
of the UAE.
Monitoring composition of funding sources at a granular
level includes setting triggers for avoiding concentration
of funding by product. The concentration of funding
sources is monitored as percentage of the total liability
and equity position. Some of the ratios monitored are
as follows:
• Euro commercial paper to total liabilities and equity
• Wholesale funds to total liabilities and equity
• Money market deposits to total liabilities and equity
• Core deposits to customer deposits
• Offshore funds to total liabilities and equity
The Group has established several early warning indica-
tors for liquidity risk in line with the Central Bank of the
UAE requirements and monitors them regularly. Some of
the key early warning indicators are as follows:
• Credit rating downgrade
• Decline in stock price
• Widening credit- default-swap levels
• Rising retail/wholesale funding costs
• Increased collateral calls
The Group has also established a breach management
and escalation process with clear definition of roles and
responsibilities.
245
ABU DHABI COMMERCIAL BANK PJSCNOTES TO THE CONSOLIDATED FINANCIAL STATEMENTSDECEMBER 31, 2019
TOOLS FOR LIQUIDITY MANAGEMENT
The Group through its Treasury division ensures that it
has access to diverse sources of funding ranging from
local customer deposits from its retail, corporate and
institutional customers as well as international sovereign
wealth funds and central banks to long-term funding such
as debt securities and subordinated liabilities issued under
the global medium term Note program.
Whilst the Group’s debt securities and sub-debt typically
are issued with maturities of greater than one year, depos-
its from banks and customers generally have shorter
maturities which increase the liquidity risk of the Group.
The Group’s Treasury division manages this risk by:
• Diversification of funding sources and balancing
between long-term and short-term funding sources
through borrowing under its global medium term notes
issue programs;
• Monitoring the stickiness of liability portfolio and
rewarding business units for sticky deposits through
the fund transfer pricing process; and
• Investing in various short-term or medium term but
highly marketable assets in line with Basel-III guidelines
for High Quality Liquid Assets (HQLA) such as certificate
of deposit with Central Bank, investment grade bonds
that can be repurchased at short notices, etc.
Further, the Bank also has the following facilities from the
Central Bank of the UAE to manage its liquidity risk during
critical times:
• Overdraft facility against its cash reserves at overnight
repo rate plus a spread of 150 basis points;
• Overdraft facility beyond the cash reserves at overnight
repo rate plus a spread of 300 basis points; and
• Repo facility against CDs at overnight repo rate.
The Bank has access to Marginal Lending Facility (MLF)
initiated by the Central Bank of the UAE effective from
March 2014. Under MLF, Bank can borrow from UAE
Central Bank by posting eligible collateral. The Bank
periodically tests MLF facility with the Central Bank for its
operational readiness.
None of the above Central Bank facilities were utilised and
outstanding at the end of the year.
The Bank has in place a contingent funding plan which
lists out the trigger points to be monitored for invok-
ing the contingent funding plan. The trigger points
are based on market observable data points like credit
spreads and internal and external events like decline in
customer deposits and drying up of wholesale markets.
The contingent funding plan clearly defines the roles
and responsibilities and is updated with changing market
conditions by ALCO.
The table below summarises the maturity profile of the
Group’s assets and liabilities. The contractual maturities
of assets and liabilities have been determined on the basis
of the remaining period at the end of the reporting period
date to the contractual maturity date and do not take
into account the effective maturities as indicated by the
Group’s deposit retention history and the availability of
liquid funds.
Derivative financial instruments (other than those desig-
nated in a hedge relationship) and trading portfolio assets
and liabilities are included in “less than 3 months” at their
fair value. Liquidity risk on these items is not managed
on the basis of remaining maturity since they are not
held for settlement according to such maturity and will
frequently be settled before remaining maturity at fair
value. Derivatives designated in a hedge relationship are
included according to their remaining maturity at fair
value. Investment securities in equities and mutual funds
with no maturity are included in “over 3 years.”
The maturity profile is monitored by management to
ensure adequate liquidity is maintained.
246

ABU DHABI COMMERCIAL BANK PJSCNOTES TO THE CONSOLIDATED FINANCIAL STATEMENTSDECEMBER 31, 2019
The maturity profile of the assets and liabilities as at December 31, 2019 was as follows:
Less than 3 months AED’000
3 months to less than
6 months AED’000
6 months to less
than 1 year AED’000
1 year to less than
3 years AED’000
Over 3 years
AED’000Total
AED’000
Assets
Cash and balances with central banks, net 23,979,966 925,000 – – – 24,904,966
Deposits and balances due from banks, net 13,423,798 4,421,777 3,703,615 1,515,784 – 23,064,974
Derivative financial instruments 5,639,754 26,325 40,874 167,824 914,940 6,789,717
Investment securities 5,788,373 4,270,039 8,786,912 23,997,210 30,597,579 73,440,113
Loans and advances to customers, net 43,956,474 5,191,108 7,122,147 45,665,622 148,081,975 250,017,326
Investment in associates – – – – 407,768 407,768
Investment properties – – – 1,693,707 – 1,693,707
Other assets, net 6,469,945 1,214,600 8,832,632 91,168 141,863 16,750,208
Property and equipment, net – – – – 2,197,571 2,197,571
Intangible assets, net – – – – 5,332,497 5,332,497
Assets held for sale 535,830 – – – – 535,830
Total assets 99,794,140 16,048,849 28,486,180 73,131,315 187,674,193 405,134,677
Liabilities and equity
Due to banks 4,925,317 109,821 36,730 660,911 – 5,732,779
Derivative financial instruments 5,480,266 13,354 84,380 305,823 1,066,068 6,949,891
Deposits from customers 197,772,261 32,773,977 26,359,616 4,074,804 1,113,124 262,093,782
Euro commercial paper 1,382,071 462,732 217,535 – – 2,062,338
Borrowings 4,180,133 416,678 3,160,661 9,137,546 34,987,036 51,882,054
Other liabilities 6,469,937 1,188,275 9,018,310 315,229 3,311,043 20,302,794
Liabilities related to assets held for sale 413,395 – – – – 413,395
Equity – – – – 55,697,644 55,697,644
Total liabilities and equity 220,623,380 34,964,837 38,877,232 14,494,313 96,174,915 405,134,677
Balance sheet liquidity gap (120,829,240) (18,915,988) (10,391,052) 58,637,002 91,499,278 –
Off balance sheet
Financial guarantees and irrevocable commitments 1,908,054 983,050 2,052,972 12,028,727 6,054,677 23,027,480
247
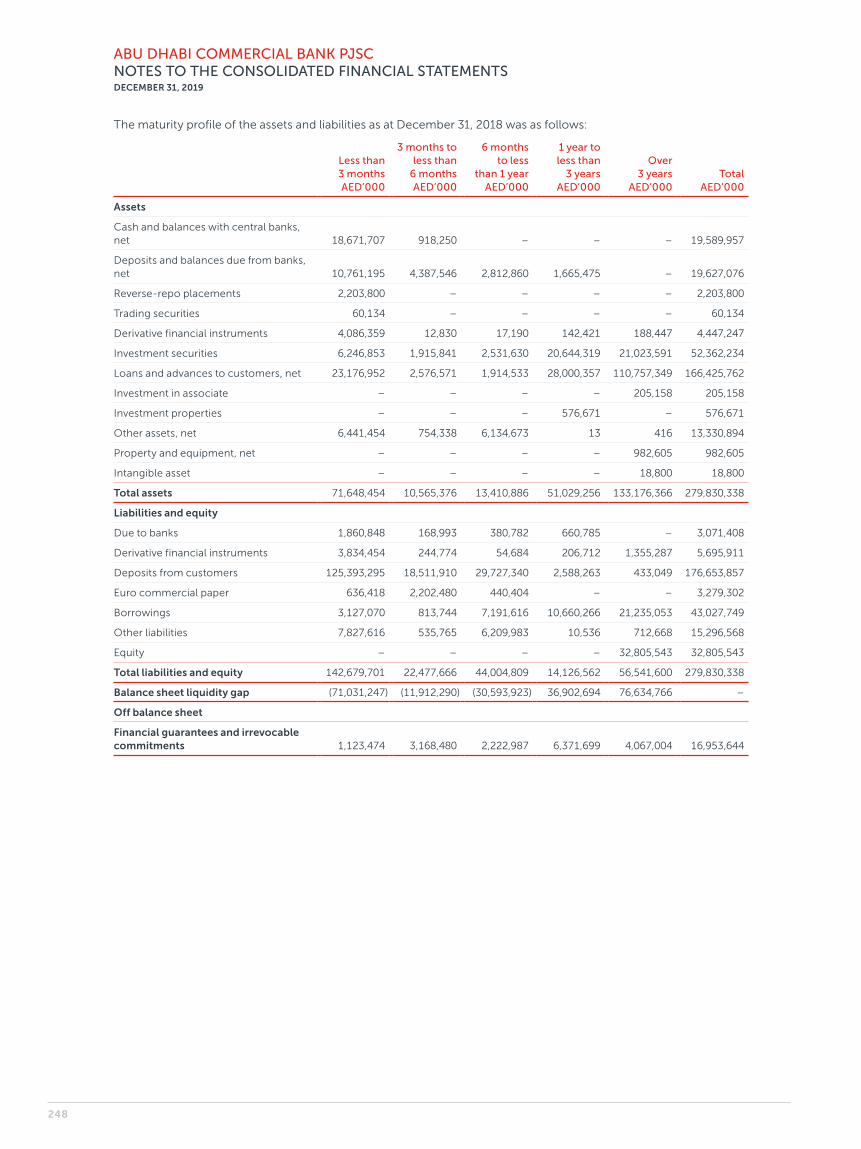
ABU DHABI COMMERCIAL BANK PJSCNOTES TO THE CONSOLIDATED FINANCIAL STATEMENTSDECEMBER 31, 2019
The maturity profile of the assets and liabilities as at December 31, 2018 was as follows:
Less than 3 months AED’000
3 months to less than
6 months AED’000
6 months to less
than 1 year AED’000
1 year to less than
3 years AED’000
Over 3 years
AED’000Total
AED’000
Assets
Cash and balances with central banks, net 18,671,707 918,250 – – – 19,589,957
Deposits and balances due from banks, net 10,761,195 4,387,546 2,812,860 1,665,475 – 19,627,076
Reverse-repo placements 2,203,800 – – – – 2,203,800
Trading securities 60,134 – – – – 60,134
Derivative financial instruments 4,086,359 12,830 17,190 142,421 188,447 4,447,247
Investment securities 6,246,853 1,915,841 2,531,630 20,644,319 21,023,591 52,362,234
Loans and advances to customers, net 23,176,952 2,576,571 1,914,533 28,000,357 110,757,349 166,425,762
Investment in associate – – – – 205,158 205,158
Investment properties – – – 576,671 – 576,671
Other assets, net 6,441,454 754,338 6,134,673 13 416 13,330,894
Property and equipment, net – – – – 982,605 982,605
Intangible asset – – – – 18,800 18,800
Total assets 71,648,454 10,565,376 13,410,886 51,029,256 133,176,366 279,830,338
Liabilities and equity
Due to banks 1,860,848 168,993 380,782 660,785 – 3,071,408
Derivative financial instruments 3,834,454 244,774 54,684 206,712 1,355,287 5,695,911
Deposits from customers 125,393,295 18,511,910 29,727,340 2,588,263 433,049 176,653,857
Euro commercial paper 636,418 2,202,480 440,404 – – 3,279,302
Borrowings 3,127,070 813,744 7,191,616 10,660,266 21,235,053 43,027,749
Other liabilities 7,827,616 535,765 6,209,983 10,536 712,668 15,296,568
Equity – – – – 32,805,543 32,805,543
Total liabilities and equity 142,679,701 22,477,666 44,004,809 14,126,562 56,541,600 279,830,338
Balance sheet liquidity gap (71,031,247) (11,912,290) (30,593,923) 36,902,694 76,634,766 –
Off balance sheet
Financial guarantees and irrevocable commitments 1,123,474 3,168,480 2,222,987 6,371,699 4,067,004 16,953,644
248

ABU DHABI COMMERCIAL BANK PJSCNOTES TO THE CONSOLIDATED FINANCIAL STATEMENTSDECEMBER 31, 2019
The table below summarises the maturity profile of the Group’s financial liabilities as at December 31, 2019 and
2018 based on contractual undiscounted repayment obligations. As interest payments up to contractual maturity
are included in the table, totals do not match with the consolidated statement of financial position. The contractual
maturities of liabilities have been determined based on the remaining period at the consolidated statement of
financial position date to the contractual maturity date and do not take into account the effective expected maturities.
Derivative financial instruments held for trading are included in “less than 3 months” column at their fair value. The
Group expects that many customers will not request repayment on the earliest date the Group could be required to
pay and the table does not reflect the expected cash flows indicated by the Group’s deposit retention history.
Carrying Amount
AED’000
Gross outflow
AED’000
Less than 3 months AED’000
3 months to less than
6 months AED’000
6 months to less
than 1 year AED’000
1 year to less than
3 years AED’000
Over 3 years
AED’000
As at December 31, 2019
Due to banks 5,732,779 5,821,738 4,954,314 112,545 37,567 717,312 –
Derivative financial instruments 6,949,891 6,582,921 5,457,296 132,010 58,207 497,449 437,959
Deposits from customers 262,093,782 264,472,376 199,405,090 33,060,680 26,846,726 4,028,523 1,131,357
Euro commercial paper 2,062,338 2,077,702 1,394,874 464,209 218,619 – –
Borrowings 51,882,054 107,122,345 4,536,900 600,768 3,601,391 10,650,433 87,732,853
Total financial liabilities 328,720,844 386,077,082 215,748,474 34,370,212 30,762,510 15,893,717 89,302,169
As at December 31, 2018
Due to banks 3,071,408 3,202,619 1,894,629 173,046 393,585 741,359 –
Derivative financial instruments 5,695,911 3,933,966 3,599,517 393,614 25,431 (1,614) (82,982)
Deposits from customers 176,653,857 179,220,417 126,742,475 18,725,235 30,562,044 2,749,830 440,833
Euro commercial paper 3,279,302 3,303,973 639,414 2,222,137 442,422 – –
Borrowings 43,027,749 79,408,470 3,508,161 980,085 7,690,488 11,700,475 55,529,261
Total financial liabilities 231,728,227 269,069,445 136,384,196 22,494,117 39,113,970 15,190,050 55,887,112
249
ABU DHABI COMMERCIAL BANK PJSCNOTES TO THE CONSOLIDATED FINANCIAL STATEMENTSDECEMBER 31, 2019
45. Market risk framework, measurement and management
The Group’s activities expose it primarily to market risk
which is defined as the risk that changes in market prices,
such as interest rates, equity prices, foreign exchange
rates, commodity prices and credit spreads (not relat-
ing to changes in the obligor’s/issuer’s credit standing)
which will affect the Group’s income or the value of its
holdings of financial instruments. The objective of market
risk management is to manage and control market risk
exposures within acceptable parameters, while optimising
the return on risk.
• Interest rate risk is the risk that the fair value or future
cash flows of a financial instrument will fluctuate
because of changes in market interest rates.
• Currency risk is the risk that the fair value or future cash
flows of a financial instrument will fluctuate because of
changes in foreign exchange rates.
• Other price risk is the risk that the fair value or future
cash flows of a financial instrument will fluctuate
because of changes in market prices (other than those
arising from interest rate risk or currency risk), whether
those changes are caused by factors specific to the
individual financial instrument or its issuer or by factors
affecting all similar financial instruments traded in
the market.
The Group separates its exposure to market risk between
trading and banking book as defined below:
MARKET RISK ARISING FROM TRADING BOOK
Trading positions are held by the Treasury division, and
include positions arising from market making and propri-
etary position taking, together with financial assets and
liabilities that are managed on a fair value basis. Realised
and unrealised gains and losses on these positions are
reported in consolidated income statement.
MARKET RISK ARISING FROM BANKING BOOK
Market risk from banking book arises from execution of
the Group’s core business strategies, products and ser-
vices to its customers, that invariably create interest rate
risk and open currency positions that the Group endeav-
ours to manage through strategic positions to mitigate
the inherent risk caused by these positions.
Banking book includes all positions that are not held for
trading such as but not limited to the Group’s investments
in instruments designated at FVTOCI, loans and advances
carried at amortised cost, derivatives used for hedging
and other financial assets held for long term.
These exposures can result from a variety of factors
including but not limited to re- pricing of gaps in assets,
liabilities and off- balance sheet instruments and changes
in the level and shape of market interest rate curves.
RISK IDENTIFICATION AND CLASSIFICATION
The MRCC approves market risk policies for the Group.
All business segments are responsible for comprehensive
identification and verification of market risks within their
business units. Regular meetings are held between market
risk management and the heads of risk taking businesses
to discuss and decide on risk exposures in the context of
the market environment.
MANAGEMENT OF MARKET RISK
The Board of Directors have set risk limits based on the
Value-at Risk (VaR), Stressed Value at Risk (SVaR), Greeks,
sensitivity/stress analysis and foreign exchange open
position limits which are closely monitored by the risk
management division and reported regularly to the senior
management and discussed by ALCO.
Market risk is identified, measured, managed and con-
trolled by an independent risk control function. Market
risk management aims to reduce volatility in operating
performance and make the Group’s market risk profile
transparent to senior management, the Board of Directors
and Regulators.
Market risk management is overseen by MRCC and per-
forms the following primary functions:
• establishment of a comprehensive mark-to- market
valuation policy framework;
• establishment of a comprehensive market risk policy
framework;
• independent measurement, monitoring and control of
market risk;
• setting and monitoring of limits; and
• hedge effectiveness methodology.
RISK MEASUREMENT
The following are the tools used to measure the market
risk, because no single measure can reflect all aspects of
market risk. The Group uses various matrices, both sta-
tistical and non- statistical, including sensitivity analysis.
250
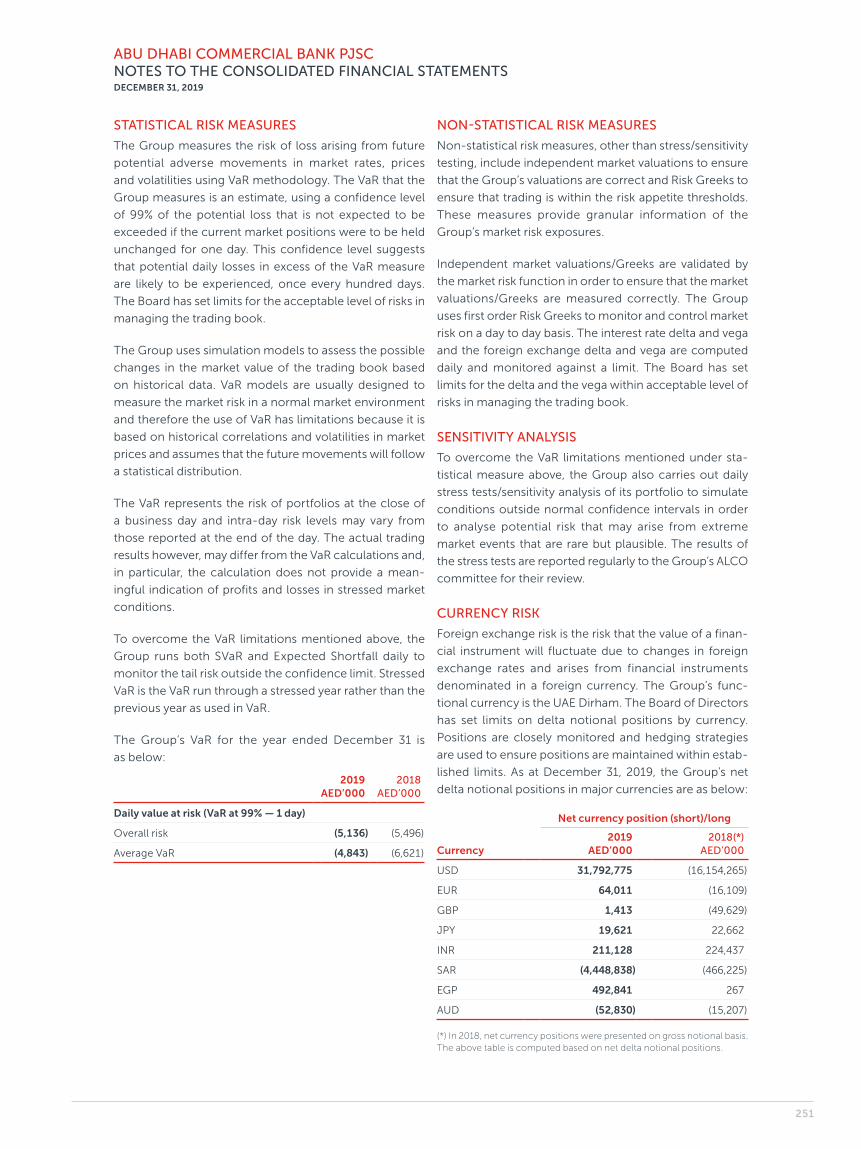
ABU DHABI COMMERCIAL BANK PJSCNOTES TO THE CONSOLIDATED FINANCIAL STATEMENTSDECEMBER 31, 2019
STATISTICAL RISK MEASURES
The Group measures the risk of loss arising from future
potential adverse movements in market rates, prices
and volatilities using VaR methodology. The VaR that the
Group measures is an estimate, using a confidence level
of 99% of the potential loss that is not expected to be
exceeded if the current market positions were to be held
unchanged for one day. This confidence level suggests
that potential daily losses in excess of the VaR measure
are likely to be experienced, once every hundred days.
The Board has set limits for the acceptable level of risks in
managing the trading book.
The Group uses simulation models to assess the possible
changes in the market value of the trading book based
on historical data. VaR models are usually designed to
measure the market risk in a normal market environment
and therefore the use of VaR has limitations because it is
based on historical correlations and volatilities in market
prices and assumes that the future movements will follow
a statistical distribution.
The VaR represents the risk of portfolios at the close of
a business day and intra-day risk levels may vary from
those reported at the end of the day. The actual trading
results however, may differ from the VaR calculations and,
in particular, the calculation does not provide a mean-
ingful indication of profits and losses in stressed market
conditions.
To overcome the VaR limitations mentioned above, the
Group runs both SVaR and Expected Shortfall daily to
monitor the tail risk outside the confidence limit. Stressed
VaR is the VaR run through a stressed year rather than the
previous year as used in VaR.
The Group’s VaR for the year ended December 31 is
as below:
2019 AED’000
2018 AED’000
Daily value at risk (VaR at 99% — 1 day)
Overall risk (5,136) (5,496)
Average VaR (4,843) (6,621)
NON- STATISTICAL RISK MEASURES
Non- statistical risk measures, other than stress/sensitivity
testing, include independent market valuations to ensure
that the Group’s valuations are correct and Risk Greeks to
ensure that trading is within the risk appetite thresholds.
These measures provide granular information of the
Group’s market risk exposures.
Independent market valuations/Greeks are validated by
the market risk function in order to ensure that the market
valuations/Greeks are measured correctly. The Group
uses first order Risk Greeks to monitor and control market
risk on a day to day basis. The interest rate delta and vega
and the foreign exchange delta and vega are computed
daily and monitored against a limit. The Board has set
limits for the delta and the vega within acceptable level of
risks in managing the trading book.
SENSITIVITY ANALYSIS
To overcome the VaR limitations mentioned under sta-
tistical measure above, the Group also carries out daily
stress tests/sensitivity analysis of its portfolio to simulate
conditions outside normal confidence intervals in order
to analyse potential risk that may arise from extreme
market events that are rare but plausible. The results of
the stress tests are reported regularly to the Group’s ALCO
committee for their review.
CURRENCY RISK
Foreign exchange risk is the risk that the value of a finan-
cial instrument will fluctuate due to changes in foreign
exchange rates and arises from financial instruments
denominated in a foreign currency. The Group’s func-
tional currency is the UAE Dirham. The Board of Directors
has set limits on delta notional positions by currency.
Positions are closely monitored and hedging strategies
are used to ensure positions are maintained within estab-
lished limits. As at December 31, 2019, the Group’s net
delta notional positions in major currencies are as below:
Net currency position (short)/long
Currency2019
AED’0002018(*)
AED’000
USD 31,792,775 (16,154,265)
EUR 64,011 (16,109)
GBP 1,413 (49,629)
JPY 19,621 22,662
INR 211,128 224,437
SAR (4,448,838) (466,225)
EGP 492,841 267
AUD (52,830) (15,207)
(*) In 2018, net currency positions were presented on gross notional basis. The above table is computed based on net delta notional positions.
251

ABU DHABI COMMERCIAL BANK PJSCNOTES TO THE CONSOLIDATED FINANCIAL STATEMENTSDECEMBER 31, 2019
The following table depicts the sensitivity of fair valua-
tions in the trading and banking book to hypothetical,
instantaneous changes in the level of foreign currency
exchange rates — with other market risk factors held
constant (including the USD-AED currency pair which is
pegged) — which would have an impact on the Group’s
consolidated income statement:
2019 2018
Price shock in percentage
+5% AED’000
-5% AED’000
+5% AED’000
-5% AED’000
USD-AUD (2,578) 5,097 (207) 1,689
EUR-USD (6,770) 9,120 (15,493) 24,965
GBP-USD 2,197 (2,147) 1,182 (914)
USD-JPY 103 (122) 1,474 8
USD-INR (11,769) 13,143 (13,762) 6,991
USD-EGP (23,384) 25,846 (13) 14
USD-SAR 105,725 (508,562) (13,977) (64,104)
INTEREST RATE RISK — TRADING BOOK
The following table depicts the sensitivity of fair valuations
in the trading book to hypothetical and instantaneous
changes in the level of interest rates — with other market
risk factors held constant — which would have an impact
on the Group’s consolidated income statement:
Relative instantaneous rate move shift for all tenors:
2019 2018
+25bps AED’000
-25bps AED’000
+25bps AED’000
-25bps AED’000
AED (29,850) 31,783 (3,941) 10,713
USD 3,059 (4,953) (110) 466
INTEREST RATE RISK — NON-TRADING BOOK
The following table depicts the sensitivity of fair valuations
in the non- trading book to hypothetical and instantane-
ous changes in the level of interest rates — with other
market risk factors held constant — which would have an
impact on the Group’s consolidated income statement:
2019 2018
+25 bps AED’000
-25 bps AED’000
+25 bps AED’000
-25 bps AED’000
Sensitivity of net interest income 70,293 (62,094) 107,807 (107,807)
The sensitivity on the consolidated income statement is
the effect of the assumed changes in interest rates on the
net interest income for one year, based on the floating
rate non- trading financial assets and financial liabilities,
including the effect of hedging instruments.
46. Operational risk management
OVERVIEW
Operational risk is the risk of loss resulting from inade-
quate or failed internal processes, people and systems or
from external events. Operational risks can arise from all
business processes and activities carried out by the Group
and can expose the Group to potentially large losses, legal
suits, regulatory criticism and reputational damage.
The objective of the Group’s operational risk manage-
ment is to manage and control operational risk in a
cost- effective manner within targeted levels of opera-
tional risk consistent with our defined risk appetite.
KEY DEVELOPMENTS IN 2019
During 2019, the Group has enhanced the Operational
Risk Management Framework (“ORMF”), Operational Risk
Management Policy and updated standard operating
procedures.
The new ORMF provides an end-to-end view of non-
financial risks, enhancing focus on the risks that are
critical to achieving the Group’s strategic objectives
and associated controls. It provides a platform to drive
forward- looking risk awareness and assist management
focus. It also helps the organisation understand the level
of risk it is willing to accept.
The Group focused on the use of the three lines of
defence model to reinforce individual accountability. It
sets our roles and responsibilities for managing opera-
tional risk on a daily basis. All employees are responsible
for identifying and managing risk within the scope of their
role as part of the three lines of defence model.
THREE LINES OF DEFENCE
To create a robust control environment to manage risks,
the Group uses an activity-based three lines of defence
model. This model delineates management accounta-
bilities and responsibilities for risk management and the
control environment. The model underpins the Group’s
approach to risk management by clarifying responsibility,
encouraging collaboration, and enabling efficient coordi-
nation of risk and control activities.
The three lines of defence are summarised below:
The first line of defence owns the risks and is responsible
for identifying, recording, reporting and managing them,
and ensuring that the right controls and assessments are
in place to mitigate them.
252
ABU DHABI COMMERCIAL BANK PJSCNOTES TO THE CONSOLIDATED FINANCIAL STATEMENTSDECEMBER 31, 2019
The second line of defence sets the policy and guidelines
for managing specific risk areas, provides advice and
guidance in relation to the risk, and challenges the first
line of defence on effective risk management.
The third line of defence is the Group’s Internal Audit
function, which provides independent and objective
assurance of the adequacy of the design and operational
effectiveness of the Group’s risk management framework
and control governance process.
GOVERNANCE AND STRUCTURE
The ORMF defines minimum standards and processes and
the governance structure for the management of opera-
tional risk and internal controls in the Group’s businesses
and support functions. The ORMF has been codified in
policies and supplemented with detailed standard oper-
ating procedures. Policies describe the Group’s approach
in identifying, assessing, monitoring and controlling
operational risk and give guidance on mitigating action to
be taken when weaknesses are identified.
The Group has a dedicated Group Operational Risk
Management function. It is responsible for leading the
embedding of the ORMF and assuring adherence to
associated policies and processes across the first and
second lines of defence. It supports the Group Chief Risk
Officer and the Operational Risk Working Group which
meets bi- monthly to discuss key risk issues and review
implementation of the ORMF. The Group Operational Risk
Management function is also responsible for preparation
of operational risk reporting at Group level including
reports for consideration by the Operational Risk Working
Group and Strategic Board Risk and Credit Committee
(SBRCC). A formal governance structure provides over-
sight of the function’s management.
KEY RISK MANAGEMENT PROCESSES
Business managers throughout the Group are responsible
for maintaining an acceptable level of internal control
commensurate with the scale and nature of operations
and for identifying and assessing risks, designing controls
and monitoring the effectiveness of these controls. The
ORMF helps managers to fulfil these responsibilities by
defining a standard risk assessment methodology and
providing a tool for the systematic reporting of opera-
tional loss data.
Operational risk and control self- assessments, along with
issue and action plans, are identified and maintained by
business units. Business and functional management
monitor the progress of documented action plans to
address any shortcomings. To help ensure that opera-
tional risk losses are consistently reported and monitored
at Group level, all Group companies are required to
report individual losses when the gross loss is expected to
exceed AED 1,000, and to aggregate all other operational
risk losses as per the standard operating procedures.
Losses are reported and escalated to the appropriate
governance structures on a monthly and ad-hoc basis in
line with their materiality.
47. Trust activities
As at December 31, 2019, the net asset value of the
funds under the management of the Group amounted
to AED 2,981,303 thousand (December 31, 2018 — AED
2,504,545 thousand).
253
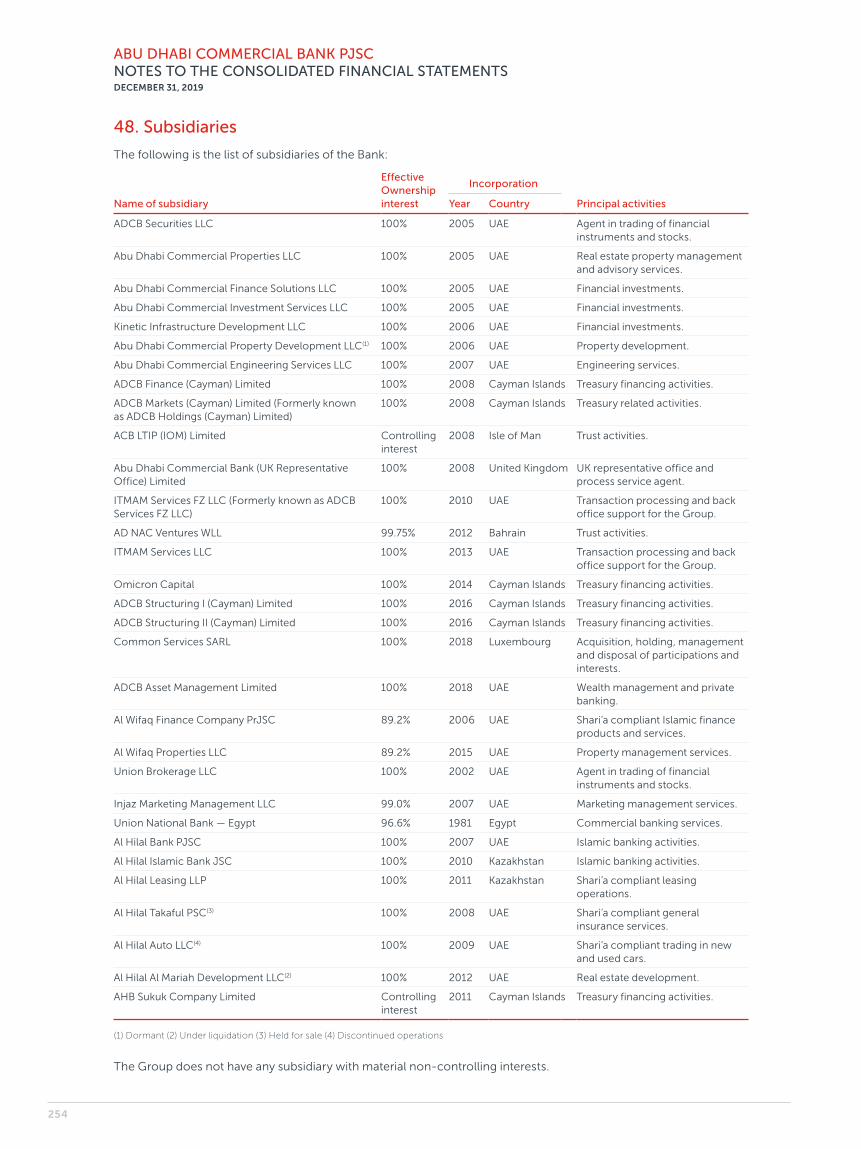
ABU DHABI COMMERCIAL BANK PJSCNOTES TO THE CONSOLIDATED FINANCIAL STATEMENTSDECEMBER 31, 2019
48. Subsidiaries
The following is the list of subsidiaries of the Bank:
Effective Ownership interest
Incorporation
Name of subsidiary Year Country Principal activities
ADCB Securities LLC 100% 2005 UAE Agent in trading of financial instruments and stocks.
Abu Dhabi Commercial Properties LLC 100% 2005 UAE Real estate property management and advisory services.
Abu Dhabi Commercial Finance Solutions LLC 100% 2005 UAE Financial investments.
Abu Dhabi Commercial Investment Services LLC 100% 2005 UAE Financial investments.
Kinetic Infrastructure Development LLC 100% 2006 UAE Financial investments.
Abu Dhabi Commercial Property Development LLC (1) 100% 2006 UAE Property development.
Abu Dhabi Commercial Engineering Services LLC 100% 2007 UAE Engineering services.
ADCB Finance (Cayman) Limited 100% 2008 Cayman Islands Treasury financing activities.
ADCB Markets (Cayman) Limited (Formerly known as ADCB Holdings (Cayman) Limited)
100% 2008 Cayman Islands Treasury related activities.
ACB LTIP (IOM) Limited Controlling interest
2008 Isle of Man Trust activities.
Abu Dhabi Commercial Bank (UK Representative Office) Limited
100% 2008 United Kingdom UK representative office and process service agent.
ITMAM Services FZ LLC (Formerly known as ADCB Services FZ LLC)
100% 2010 UAE Transaction processing and back office support for the Group.
AD NAC Ventures WLL 99.75% 2012 Bahrain Trust activities.
ITMAM Services LLC 100% 2013 UAE Transaction processing and back office support for the Group.
Omicron Capital 100% 2014 Cayman Islands Treasury financing activities.
ADCB Structuring I (Cayman) Limited 100% 2016 Cayman Islands Treasury financing activities.
ADCB Structuring II (Cayman) Limited 100% 2016 Cayman Islands Treasury financing activities.
Common Services SARL 100% 2018 Luxembourg Acquisition, holding, management and disposal of participations and interests.
ADCB Asset Management Limited 100% 2018 UAE Wealth management and private banking.
Al Wifaq Finance Company PrJSC 89.2% 2006 UAE Shari’a compliant Islamic finance products and services.
Al Wifaq Properties LLC 89.2% 2015 UAE Property management services.
Union Brokerage LLC 100% 2002 UAE Agent in trading of financial instruments and stocks.
Injaz Marketing Management LLC 99.0% 2007 UAE Marketing management services.
Union National Bank — Egypt 96.6% 1981 Egypt Commercial banking services.
Al Hilal Bank PJSC 100% 2007 UAE Islamic banking activities.
Al Hilal Islamic Bank JSC 100% 2010 Kazakhstan Islamic banking activities.
Al Hilal Leasing LLP 100% 2011 Kazakhstan Shari’a compliant leasing operations.
Al Hilal Takaful PSC (3) 100% 2008 UAE Shari’a compliant general insurance services.
Al Hilal Auto LLC (4) 100% 2009 UAE Shari’a compliant trading in new and used cars.
Al Hilal Al Mariah Development LLC (2) 100% 2012 UAE Real estate development.
AHB Sukuk Company Limited Controlling interest
2011 Cayman Islands Treasury financing activities.
(1) Dormant (2) Under liquidation (3) Held for sale (4) Discontinued operations
The Group does not have any subsidiary with material non- controlling interests.
254
ABU DHABI COMMERCIAL BANK PJSCNOTES TO THE CONSOLIDATED FINANCIAL STATEMENTSDECEMBER 31, 2019
49. Capital adequacy ratio and capital management
CAPITAL MANAGEMENT PROCESS
The Group’s objectives when managing capital, which
is a broader concept than the “equity” on the face of
statement of financial position, are:
• to comply with the capital requirements set by the
Central Bank of the United Arab Emirates;
• to safeguard the Group’s ability to continue as a going
concern and increase the returns for the sharehold-
ers; and
• to maintain a strong capital base to support the devel-
opment of its business.
Capital adequacy and the use of regulatory capital are
monitored on a regular basis by the Bank’s management
employing techniques based on the guidelines devel-
oped by the Basel Committee and the Central Bank of the
United Arab Emirates.
The UAE Central Bank vide its circular No. 60/2017 dated
March 2, 2017 informed all the Banks operating in the
UAE to comply with Basel III Capital Adequacy regula-
tions effective from February 1, 2017. The regulations
were issued to ensure compliance with Basel III Capital
Standard set out by the Basel Committee on Banking
Supervision (BCBS).
For credit and market risk, the Central Bank of the United
Arab Emirates has issued guidelines for implementation of
Standardised approach and banks are required to comply
and report under Pillar 2 — Internal Capital Adequacy
Assessment Process (ICAAP) requirements since March
2010. For operational risk, the Central Bank of the United
Arab Emirates has given banks the option to use the Basic
Indicators approach or the Standardised approach and
the Group has chosen to use the Standardised approach.
The Bank currently uses the approach defined below for
Pillar 1 reporting:
Credit risk: Standardised approach is used by the Group
in calculating its capital requirements for credit risk.
This approach allows the use of external ratings from
designated credit rating agencies, wherever available, in
determining the appropriate risk weights. The risk weight
is determined by the asset class and the external rating
of the counterparty. The net exposure incorporates off
balance sheet exposures after applying the credit conver-
sion factors (CCF) and credit risk mitigants (CRM).
Market risk: For the regulatory market risk capital require-
ment, the Group uses the standardised approach.
Operational risk: Basel III includes a capital require-
ment for operational risk, again utilising three levels of
sophistication. The capital required under the basic indi-
cator approach is a simple percentage of gross revenues,
whereas under the standardised approach it is one of
three different percentages of total operating income
under each of eight defined business lines. Both these
approaches use an average of the last three financial
years’ revenues. The Group has adopted the standardised
approach in determining the operational risk capital
requirements.
The Group also prepares an annual comprehensive ICAAP
document. This document is a detailed assessment by
the Group of its risk profile, approaches to assess and
measure various material risks, capital planning under
regular and stress scenarios.
The Group’s capital management is driven by long-/
short-term strategies and organisational requirements
with due consideration to the regulatory, economic and
commercial environment in which the Bank operates.
The Group seeks to optimise returns on capital and it has
always been the objective to maintain a strong capital
base to support business development and to meet regu-
latory capital requirements at all times.
255
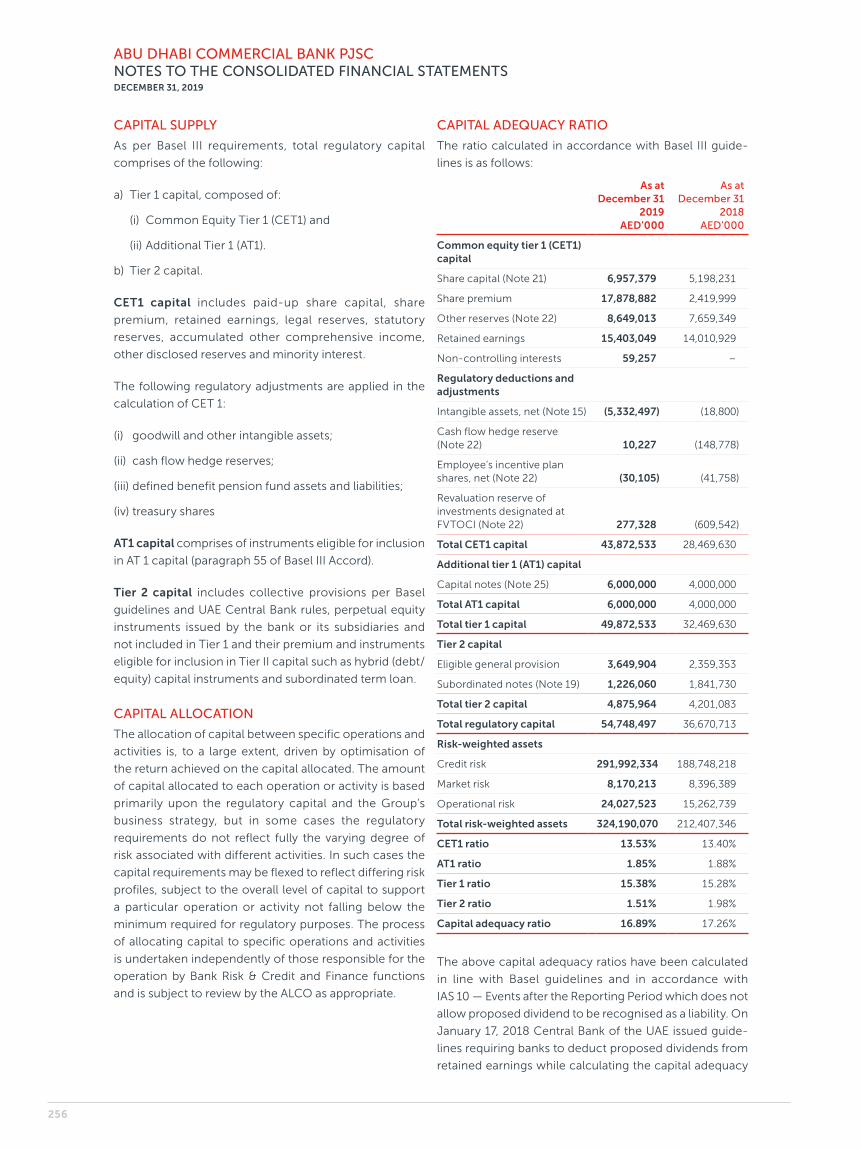
ABU DHABI COMMERCIAL BANK PJSCNOTES TO THE CONSOLIDATED FINANCIAL STATEMENTSDECEMBER 31, 2019
CAPITAL SUPPLY
As per Basel III requirements, total regulatory capital
comprises of the following:
a) Tier 1 capital, composed of:
(i) Common Equity Tier 1 (CET1) and
(ii) Additional Tier 1 (AT1).
b) Tier 2 capital.
CET1 capital includes paid-up share capital, share
premium, retained earnings, legal reserves, statutory
reserves, accumulated other comprehensive income,
other disclosed reserves and minority interest.
The following regulatory adjustments are applied in the
calculation of CET 1:
(i) goodwill and other intangible assets;
(ii) cash flow hedge reserves;
(iii) defined benefit pension fund assets and liabilities;
(iv) treasury shares
AT1 capital comprises of instruments eligible for inclusion
in AT 1 capital (paragraph 55 of Basel III Accord).
Tier 2 capital includes collective provisions per Basel
guidelines and UAE Central Bank rules, perpetual equity
instruments issued by the bank or its subsidiaries and
not included in Tier 1 and their premium and instruments
eligible for inclusion in Tier II capital such as hybrid (debt/
equity) capital instruments and subordinated term loan.
CAPITAL ALLOCATION
The allocation of capital between specific operations and
activities is, to a large extent, driven by optimisation of
the return achieved on the capital allocated. The amount
of capital allocated to each operation or activity is based
primarily upon the regulatory capital and the Group’s
business strategy, but in some cases the regulatory
requirements do not reflect fully the varying degree of
risk associated with different activities. In such cases the
capital requirements may be flexed to reflect differing risk
profiles, subject to the overall level of capital to support
a particular operation or activity not falling below the
minimum required for regulatory purposes. The process
of allocating capital to specific operations and activities
is undertaken independently of those responsible for the
operation by Bank Risk & Credit and Finance functions
and is subject to review by the ALCO as appropriate.
CAPITAL ADEQUACY RATIO
The ratio calculated in accordance with Basel III guide-
lines is as follows:
As at December 31
2019 AED’000
As at December 31
2018 AED’000
Common equity tier 1 (CET1) capital
Share capital (Note 21) 6,957,379 5,198,231
Share premium 17,878,882 2,419,999
Other reserves (Note 22) 8,649,013 7,659,349
Retained earnings 15,403,049 14,010,929
Non- controlling interests 59,257 –
Regulatory deductions and adjustments
Intangible assets, net (Note 15) (5,332,497) (18,800)
Cash flow hedge reserve (Note 22) 10,227 (148,778)
Employee’s incentive plan shares, net (Note 22) (30,105) (41,758)
Revaluation reserve of investments designated at FVTOCI (Note 22) 277,328 (609,542)
Total CET1 capital 43,872,533 28,469,630
Additional tier 1 (AT1) capital
Capital notes (Note 25) 6,000,000 4,000,000
Total AT1 capital 6,000,000 4,000,000
Total tier 1 capital 49,872,533 32,469,630
Tier 2 capital
Eligible general provision 3,649,904 2,359,353
Subordinated notes (Note 19) 1,226,060 1,841,730
Total tier 2 capital 4,875,964 4,201,083
Total regulatory capital 54,748,497 36,670,713
Risk- weighted assets
Credit risk 291,992,334 188,748,218
Market risk 8,170,213 8,396,389
Operational risk 24,027,523 15,262,739
Total risk- weighted assets 324,190,070 212,407,346
CET1 ratio 13.53% 13.40%
AT1 ratio 1.85% 1.88%
Tier 1 ratio 15.38% 15.28%
Tier 2 ratio 1.51% 1.98%
Capital adequacy ratio 16.89% 17.26%
The above capital adequacy ratios have been calculated
in line with Basel guidelines and in accordance with
IAS 10 — Events after the Reporting Period which does not
allow proposed dividend to be recognised as a liability. On
January 17, 2018 Central Bank of the UAE issued guide-
lines requiring banks to deduct proposed dividends from
retained earnings while calculating the capital adequacy
256
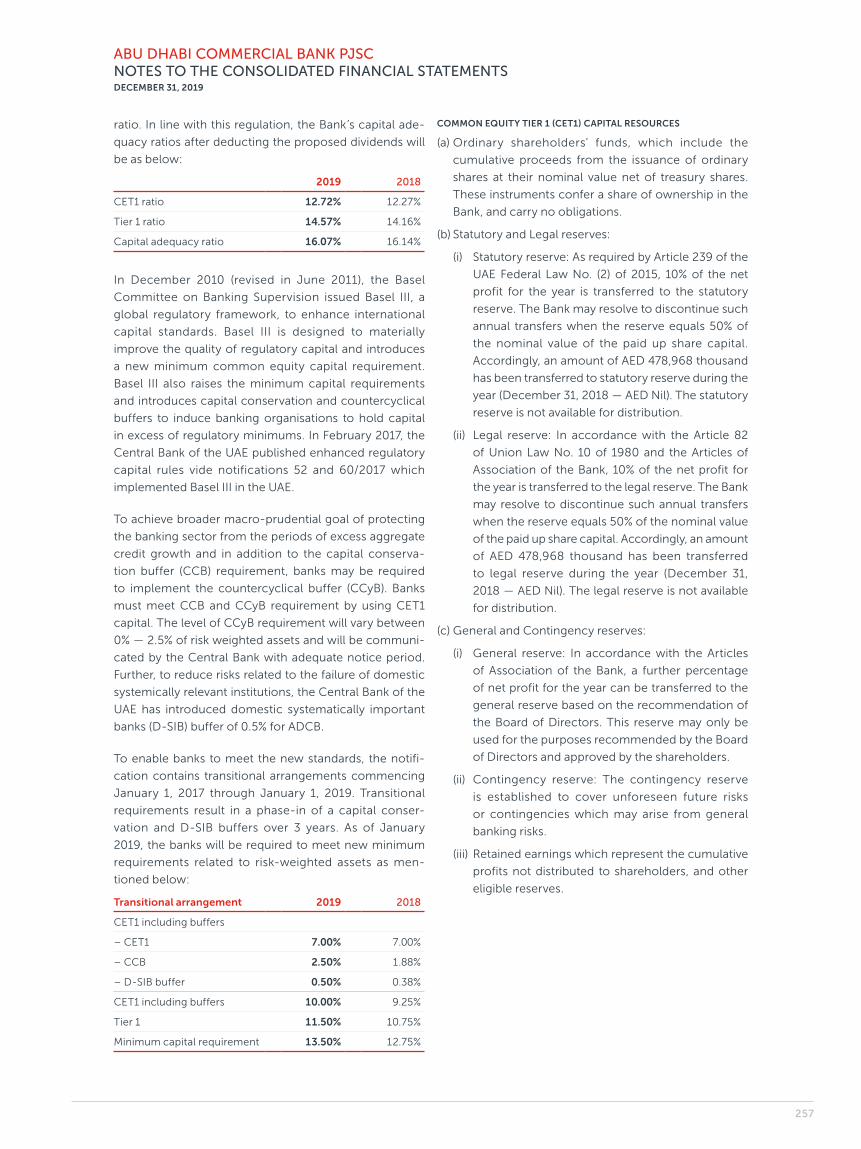
ABU DHABI COMMERCIAL BANK PJSCNOTES TO THE CONSOLIDATED FINANCIAL STATEMENTSDECEMBER 31, 2019
ratio. In line with this regulation, the Bank’s capital ade-
quacy ratios after deducting the proposed dividends will
be as below:
2019 2018
CET1 ratio 12.72% 12.27%
Tier 1 ratio 14.57% 14.16%
Capital adequacy ratio 16.07% 16.14%
In December 2010 (revised in June 2011), the Basel
Committee on Banking Supervision issued Basel III, a
global regulatory framework, to enhance international
capital standards. Basel III is designed to materially
improve the quality of regulatory capital and introduces
a new minimum common equity capital requirement.
Basel III also raises the minimum capital requirements
and introduces capital conservation and countercyclical
buffers to induce banking organisations to hold capital
in excess of regulatory minimums. In February 2017, the
Central Bank of the UAE published enhanced regulatory
capital rules vide notifications 52 and 60/2017 which
implemented Basel III in the UAE.
To achieve broader macro- prudential goal of protecting
the banking sector from the periods of excess aggregate
credit growth and in addition to the capital conserva-
tion buffer (CCB) requirement, banks may be required
to implement the countercyclical buffer (CCyB). Banks
must meet CCB and CCyB requirement by using CET1
capital. The level of CCyB requirement will vary between
0% — 2.5% of risk weighted assets and will be communi-
cated by the Central Bank with adequate notice period.
Further, to reduce risks related to the failure of domestic
systemically relevant institutions, the Central Bank of the
UAE has introduced domestic systematically important
banks (D-SIB) buffer of 0.5% for ADCB.
To enable banks to meet the new standards, the notifi-
cation contains transitional arrangements commencing
January 1, 2017 through January 1, 2019. Transitional
requirements result in a phase-in of a capital conser-
vation and D-SIB buffers over 3 years. As of January
2019, the banks will be required to meet new minimum
requirements related to risk- weighted assets as men-
tioned below:
Transitional arrangement 2019 2018
CET1 including buffers
– CET1 7.00% 7.00%
– CCB 2.50% 1.88%
– D-SIB buffer 0.50% 0.38%
CET1 including buffers 10.00% 9.25%
Tier 1 11.50% 10.75%
Minimum capital requirement 13.50% 12.75%
COMMON EQUITY TIER 1 (CET1) CAPITAL RESOURCES
(a) Ordinary shareholders’ funds, which include the
cumulative proceeds from the issuance of ordinary
shares at their nominal value net of treasury shares.
These instruments confer a share of ownership in the
Bank, and carry no obligations.
(b) Statutory and Legal reserves:
(i) Statutory reserve: As required by Article 239 of the
UAE Federal Law No. (2) of 2015, 10% of the net
profit for the year is transferred to the statutory
reserve. The Bank may resolve to discontinue such
annual transfers when the reserve equals 50% of
the nominal value of the paid up share capital.
Accordingly, an amount of AED 478,968 thousand
has been transferred to statutory reserve during the
year (December 31, 2018 — AED Nil). The statutory
reserve is not available for distribution.
(ii) Legal reserve: In accordance with the Article 82
of Union Law No. 10 of 1980 and the Articles of
Association of the Bank, 10% of the net profit for
the year is transferred to the legal reserve. The Bank
may resolve to discontinue such annual transfers
when the reserve equals 50% of the nominal value
of the paid up share capital. Accordingly, an amount
of AED 478,968 thousand has been transferred
to legal reserve during the year (December 31,
2018 — AED Nil). The legal reserve is not available
for distribution.
(c) General and Contingency reserves:
(i) General reserve: In accordance with the Articles
of Association of the Bank, a further percentage
of net profit for the year can be transferred to the
general reserve based on the recommendation of
the Board of Directors. This reserve may only be
used for the purposes recommended by the Board
of Directors and approved by the shareholders.
(ii) Contingency reserve: The contingency reserve
is established to cover unforeseen future risks
or contingencies which may arise from general
banking risks.
(iii) Retained earnings which represent the cumulative
profits not distributed to shareholders, and other
eligible reserves.
257

ABU DHABI COMMERCIAL BANK PJSCNOTES TO THE CONSOLIDATED FINANCIAL STATEMENTSDECEMBER 31, 2019
(d) Regulatory deductions and adjustments:
(i) Goodwill and other intangible assets.
(ii) Cash flow hedge reserve: The effective portion
of changes in the fair value of derivatives that are
designated and qualify as cash flow hedges are
recognised in other comprehensive income and
accumulated in equity. However, it is limited to 45%
if the balance is positive.
(iii) Employees’ incentive plan shares: The Bank grants
equity- settled share-based payments to employ-
ees. These shares are acquired by the Bank for its
employees and are deducted from capital.
(iv) Revaluation reserve of investments designated at
FVTOCI: This includes the cumulative net change in
the fair value of investments measured at fair value
through other comprehensive income. However, it
is limited to 45% if the balance is positive.
ADDITIONAL TIER 1 (AT1) CAPITAL RESOURCES
(a) Capital notes: In February 2009, the Department of
Finance, Government of Abu Dhabi subscribed to the
ADCB’s Tier 1 regulatory capital notes with a principal
amount of AED 4,000,000 thousand (the “Notes”).
The Notes are non- voting, non- cumulative perpetual
securities for which there is no fixed redemption date.
Redemption is only at the option of the Bank.
Pursuant to merger, the Bank assumed erstwhile UNB’s
Tier I regulatory capital notes with a principal amount
of AED 2,000,000 thousand. The terms and condi-
tions applicable to these notes are similar to the Notes
issued by ADCB.
TIER 2 CAPITAL RESOURCES
(a) Collective impairment on loans and advances limited
to 1.25% of credit risk- weighted assets.
(b) Eligible subordinated notes (Note 19).
50. Social contributions
The Group made the following social contributions
during the year:
2019 AED’000
2018 AED’000
Donations 2,132 1,497
Sponsorships 13,390 6,998
Total social contributions 15,522 8,495
51. Legal proceedings
The Group is involved in various legal proceedings and
claims arising in the ordinary course of business. While the
outcome of these matters cannot be predicted with cer-
tainty, management does not believe that these matters
will have a material adverse effect on the Group’s con-
solidated financial information if disposed unfavourably.
52. Business combinations
Merger with Union National Bank PJSC — On May 1,
2019, Union National Bank PJSC (or “UNB”) merged with
Abu Dhabi Commercial Bank PJSC in a stock transaction.
UNB was a banking institution headquartered in Abu
Dhabi with operations in UAE, Egypt, Kuwait, Qatar and
China. Under the terms of the agreement, shareholders
of UNB received 0.5966 ordinary shares of ADCB for
each ordinary share of UNB. ADCB issued 1,641,501,087
ordinary shares that had a total fair value of AED
16,218,031 thousand based on the closing market price
of AED 9.88 per share on April 30, 2019. UNB shares were
delisted from Abu Dhabi Securities Exchange subsequent
to the merger.
Acquisition of Al Hilal Bank PJSC — On May 1, 2019,
ADCB and UNB as a merged entity completed its 100%
acquisition of Al Hilal Bank PJSC (or “AHB”) at a consid-
eration of AED 1,000,000 thousand. AHB is a banking
institution headquartered in Abu Dhabi with operations in
UAE and Kazakhstan.
The merger and acquisition constituted business com-
bination under common control. The Group sought and
received fairness opinions from two investment banks of
international repute, who opined that the aforementioned
exchange ratio for merger with UNB and consideration
for acquisition of AHB are fair, from a financial point of
view, to the shareholders of the banks.
The merger and acquisition has been accounted for using
the acquisition method of accounting and, accordingly,
assets acquired, liabilities assumed, and consideration
exchanged were recorded at estimated fair value on the
acquisition date. The determination of estimated fair
values required management to make certain estimates
about discount rates, future expected cash flows, market
conditions and other future events that are highly sub-
jective in nature and may require adjustments, which can
be revisited for up to a year following the merger and
acquisition.
258
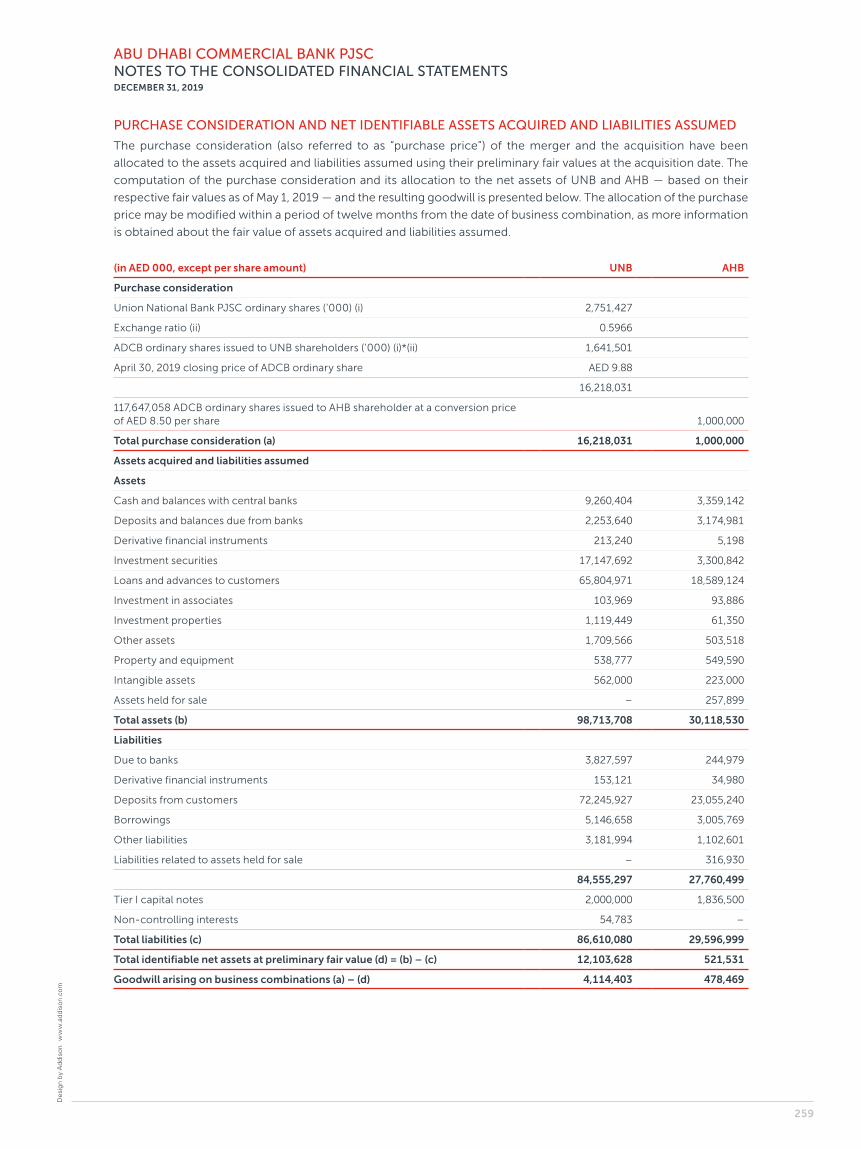
ABU DHABI COMMERCIAL BANK PJSCNOTES TO THE CONSOLIDATED FINANCIAL STATEMENTSDECEMBER 31, 2019
PURCHASE CONSIDERATION AND NET IDENTIFIABLE ASSETS ACQUIRED AND LIABILITIES ASSUMED
The purchase consideration (also referred to as “purchase price”) of the merger and the acquisition have been
allocated to the assets acquired and liabilities assumed using their preliminary fair values at the acquisition date. The
computation of the purchase consideration and its allocation to the net assets of UNB and AHB — based on their
respective fair values as of May 1, 2019 — and the resulting goodwill is presented below. The allocation of the purchase
price may be modified within a period of twelve months from the date of business combination, as more information
is obtained about the fair value of assets acquired and liabilities assumed.
(in AED 000, except per share amount) UNB AHB
Purchase consideration
Union National Bank PJSC ordinary shares (‘000) (i) 2,751,427
Exchange ratio (ii) 0.5966
ADCB ordinary shares issued to UNB shareholders (‘000) (i)*(ii) 1,641,501
April 30, 2019 closing price of ADCB ordinary share AED 9.88
16,218,031
117,647,058 ADCB ordinary shares issued to AHB shareholder at a conversion price of AED 8.50 per share 1,000,000
Total purchase consideration (a) 16,218,031 1,000,000
Assets acquired and liabilities assumed
Assets
Cash and balances with central banks 9,260,404 3,359,142
Deposits and balances due from banks 2,253,640 3,174,981
Derivative financial instruments 213,240 5,198
Investment securities 17,147,692 3,300,842
Loans and advances to customers 65,804,971 18,589,124
Investment in associates 103,969 93,886
Investment properties 1,119,449 61,350
Other assets 1,709,566 503,518
Property and equipment 538,777 549,590
Intangible assets 562,000 223,000
Assets held for sale – 257,899
Total assets (b) 98,713,708 30,118,530
Liabilities
Due to banks 3,827,597 244,979
Derivative financial instruments 153,121 34,980
Deposits from customers 72,245,927 23,055,240
Borrowings 5,146,658 3,005,769
Other liabilities 3,181,994 1,102,601
Liabilities related to assets held for sale – 316,930
84,555,297 27,760,499
Tier I capital notes 2,000,000 1,836,500
Non- controlling interests 54,783 –
Total liabilities (c) 86,610,080 29,596,999
Total identifiable net assets at preliminary fair value (d) = (b) – (c) 12,103,628 521,531
Goodwill arising on business combinations (a) – (d) 4,114,403 478,469
Des
ign
by A
ddis
on
ww
w.a
ddis
on.c
om
259
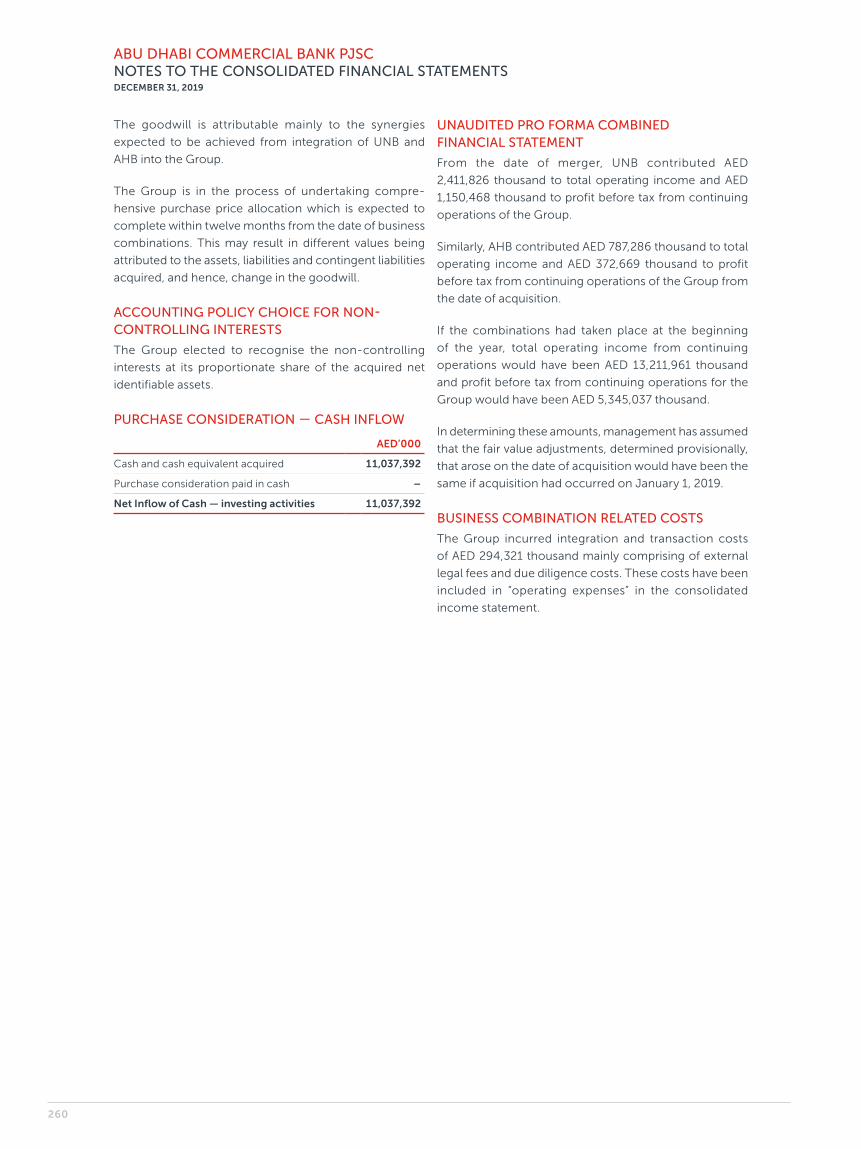
ABU DHABI COMMERCIAL BANK PJSCNOTES TO THE CONSOLIDATED FINANCIAL STATEMENTSDECEMBER 31, 2019
The goodwill is attributable mainly to the synergies
expected to be achieved from integration of UNB and
AHB into the Group.
The Group is in the process of undertaking compre-
hensive purchase price allocation which is expected to
complete within twelve months from the date of business
combinations. This may result in different values being
attributed to the assets, liabilities and contingent liabilities
acquired, and hence, change in the goodwill.
ACCOUNTING POLICY CHOICE FOR NON- CONTROLLING INTERESTS
The Group elected to recognise the non- controlling
interests at its proportionate share of the acquired net
identifiable assets.
PURCHASE CONSIDERATION — CASH INFLOW
AED’000
Cash and cash equivalent acquired 11,037,392
Purchase consideration paid in cash –
Net Inflow of Cash — investing activities 11,037,392
UNAUDITED PRO FORMA COMBINED FINANCIAL STATEMENT
From the date of merger, UNB contributed AED
2,411,826 thousand to total operating income and AED
1,150,468 thousand to profit before tax from continuing
operations of the Group.
Similarly, AHB contributed AED 787,286 thousand to total
operating income and AED 372,669 thousand to profit
before tax from continuing operations of the Group from
the date of acquisition.
If the combinations had taken place at the beginning
of the year, total operating income from continuing
operations would have been AED 13,211,961 thousand
and profit before tax from continuing operations for the
Group would have been AED 5,345,037 thousand.
In determining these amounts, management has assumed
that the fair value adjustments, determined provisionally,
that arose on the date of acquisition would have been the
same if acquisition had occurred on January 1, 2019.
BUSINESS COMBINATION RELATED COSTS
The Group incurred integration and transaction costs
of AED 294,321 thousand mainly comprising of external
legal fees and due diligence costs. These costs have been
included in “operating expenses” in the consolidated
income statement.
260

This page has been left blank intentionally
A D C B 2 0 1 9 A N N U A L R E P O R T