Embed Size (px)
Citation preview
專題討論Modeling the distribution of
enhanced soil shear strength beneath riparian trees of south-eastern Australia
79842032 許涵硯 2009 11 27
Location of the study area on the Hawkesbury-Nepean River system and the plantation near Cobbity Bridge where experimental work was undertaken.
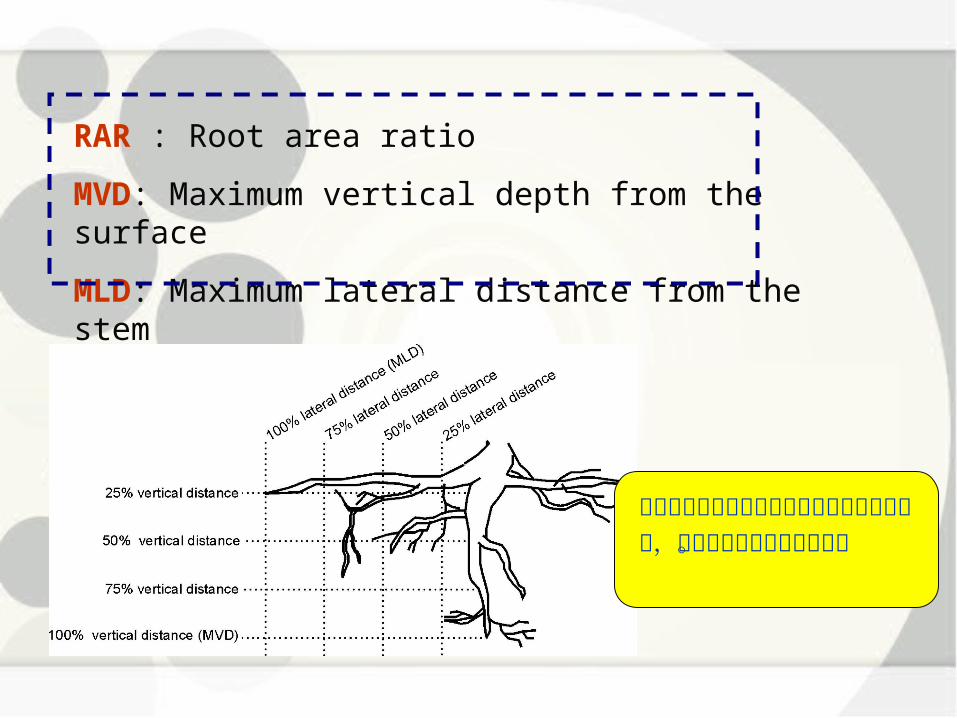
RAR : Root area ratio
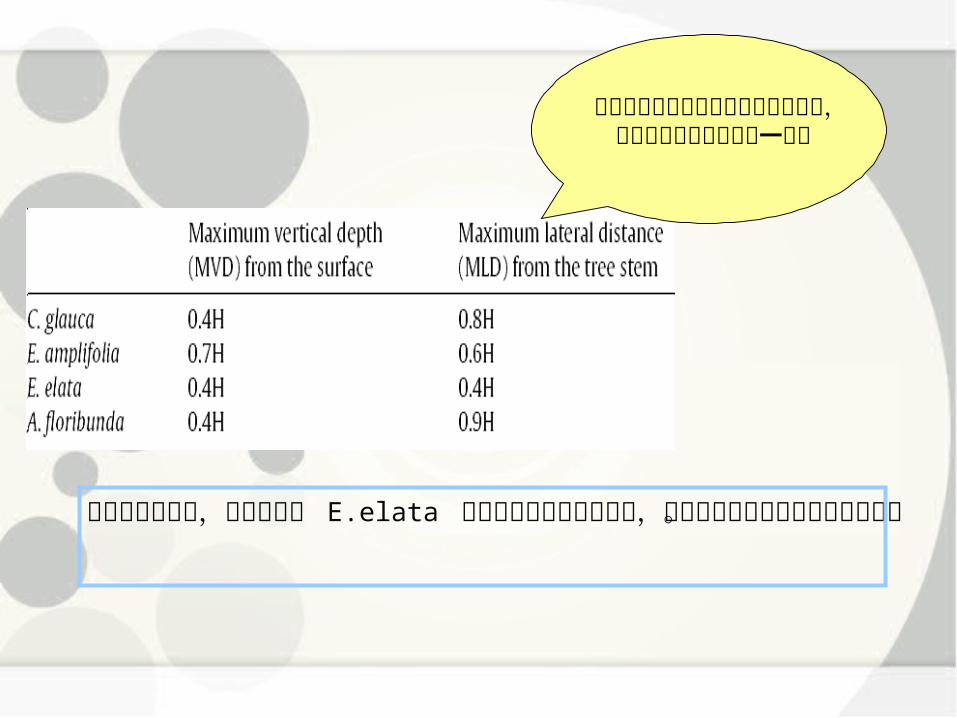
MVD: Maximum vertical depth from the surface
MLD: Maximum lateral distance from the stem
利用網格來測量側根長以及深度佔總根之比例,以便於比較不同植物的根。
最長
側根最寬
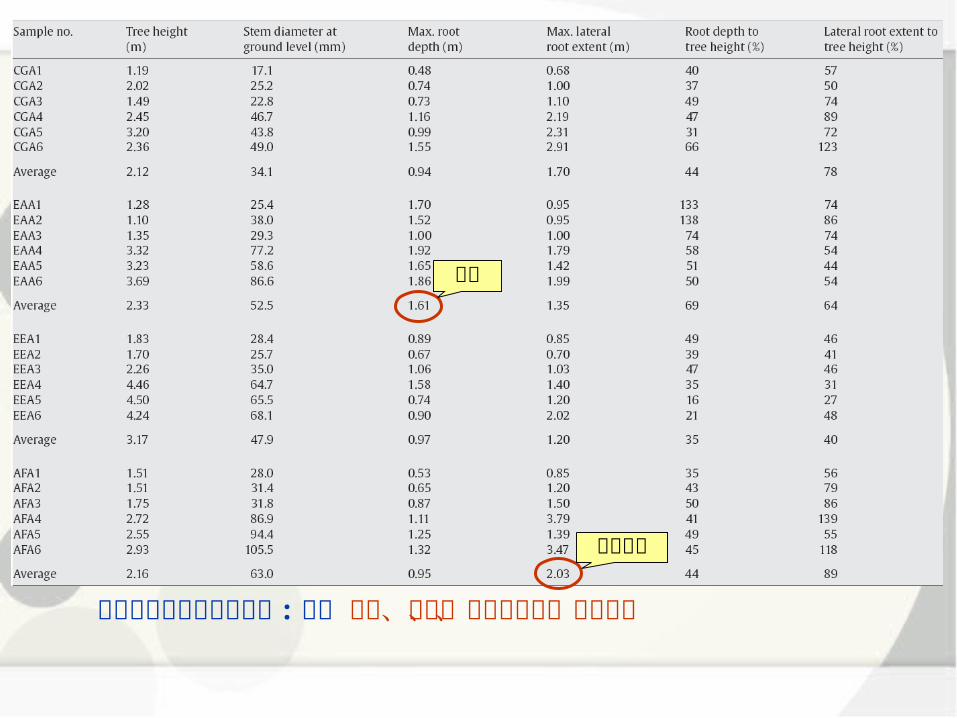
地上部與地下部測量內容 :包含 樹高、基徑、最大垂直根、最大側根
最大垂直根與最大側根和樹高的關係,可以用再不同年齡的同一種樹
跟上表之比較後,可以發現到 E.elata 的上半部生長較其三種快,但根的生長速率卻是裡面最慢的。
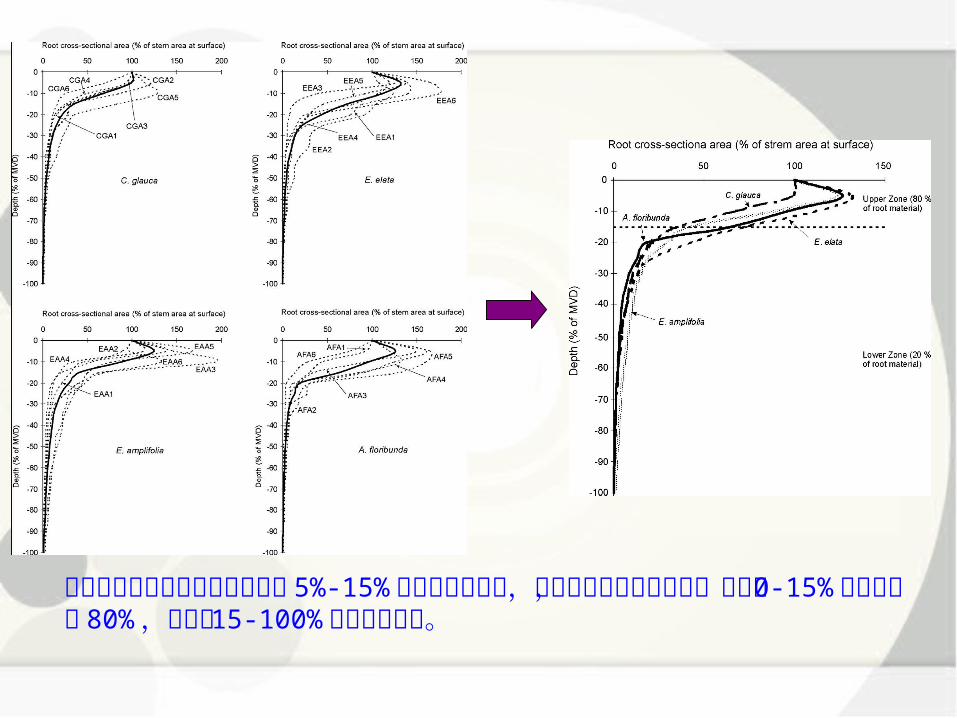
可以從圖中可以見到四種植物從 5%-15% 根面積減少最快,將四種植物合起來比較,發現到 0-15% 根的量佔了 80% ,而其他 15-100% 僅佔了少部份。
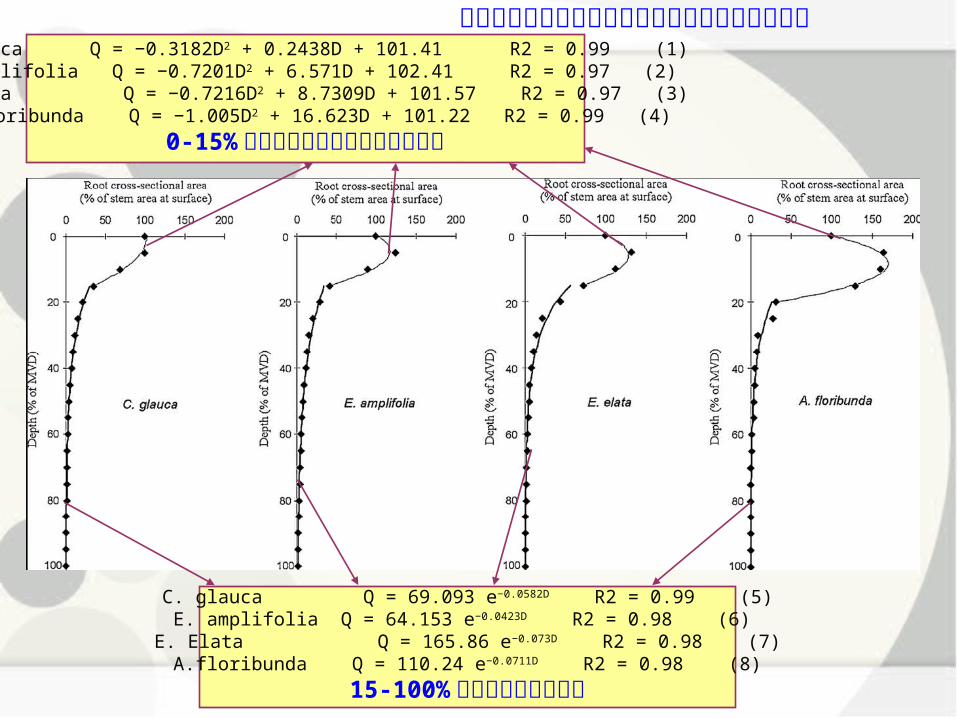
利用不同的數學形式來模擬根段面積與深度的曲線C. glauca Q = −0.3182D2 + 0.2438D + 101.41 R2 = 0.99 (1)E. amplifolia Q = −0.7201D2 + 6.571D + 102.41 R2 = 0.97 (2)E. elata Q = −0.7216D2 + 8.7309D + 101.57 R2 = 0.97 (3)A .floribunda Q = −1.005D2 + 16.623D + 101.22 R2 = 0.99 (4)
0-15% 利用二維方程式來呈現比較符合
C. glauca Q = 69.093 e−0.0582D R2 = 0.99 (5)E. amplifolia Q = 64.153 e−0.0423D R2 = 0.98 (6) E. Elata Q = 165.86 e−0.073D R2 = 0.98 (7)A.floribunda Q = 110.24 e−0.0711D R2 = 0.98 (8)
15-100% 利用負的指數來表現
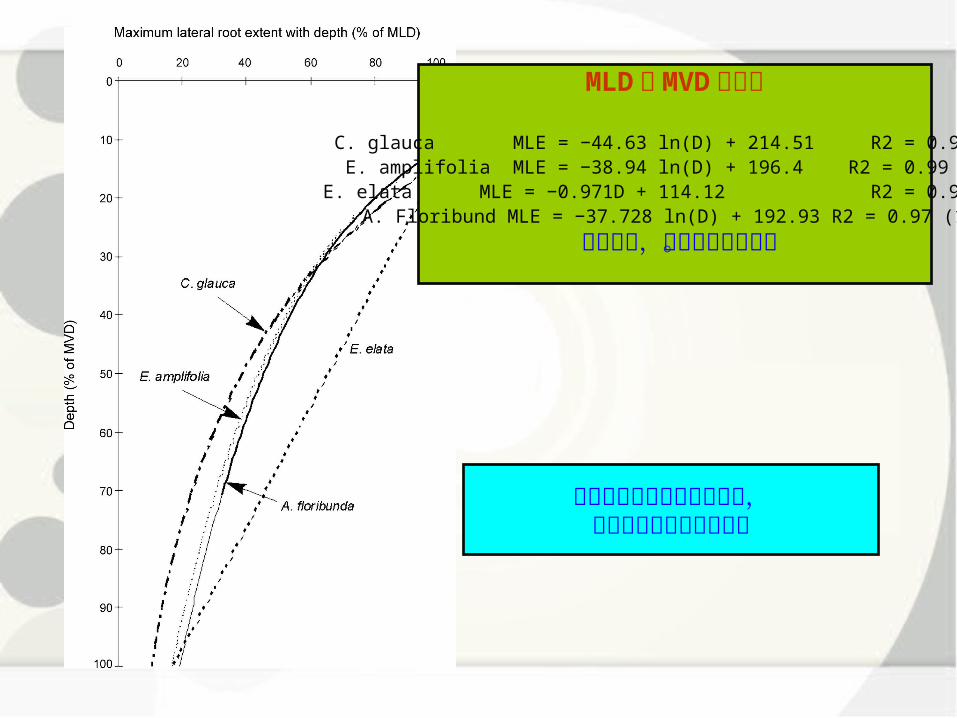
MLD 與 MVD 之比較
C. glauca MLE = −44.63 ln(D) + 214.51 R2 = 0.99 (9)E. amplifolia MLE = −38.94 ln(D) + 196.4 R2 = 0.99 (10)E. elata MLE = −0.971D + 114.12 R2 = 0.99 (11)A. Floribund MLE = −37.728 ln(D) + 192.93 R2 = 0.97 (12)
深度越大,側根的長度越短。
最長側根通常位於淺層土壤,而最深的根則在莖的下面
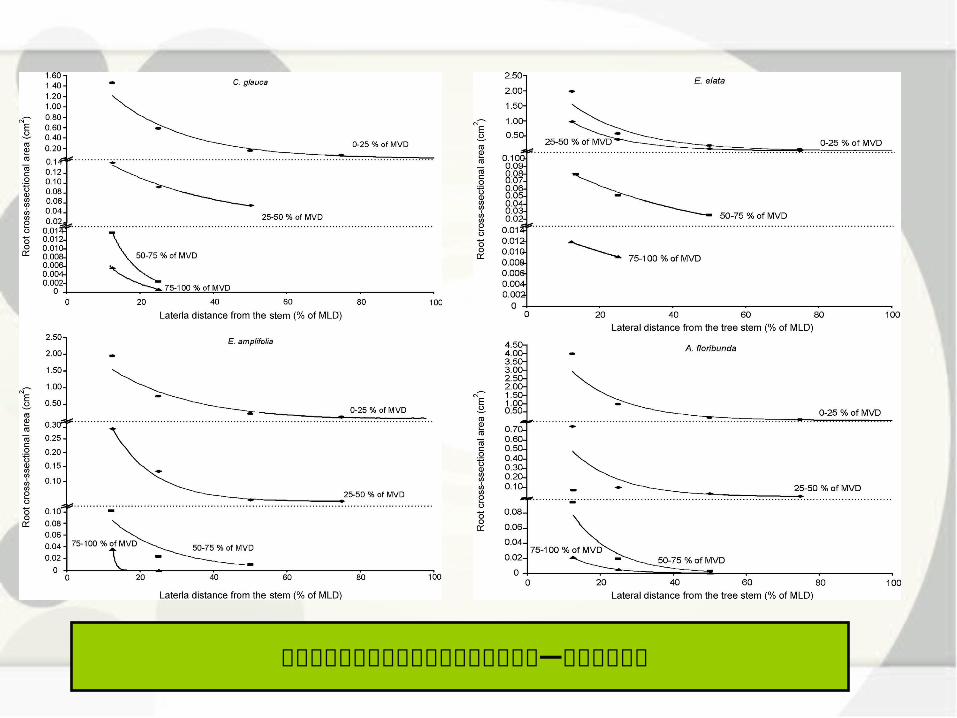
四種植物的根斷面積和離樹幹的距離呈現一個負指數關係
Discussion
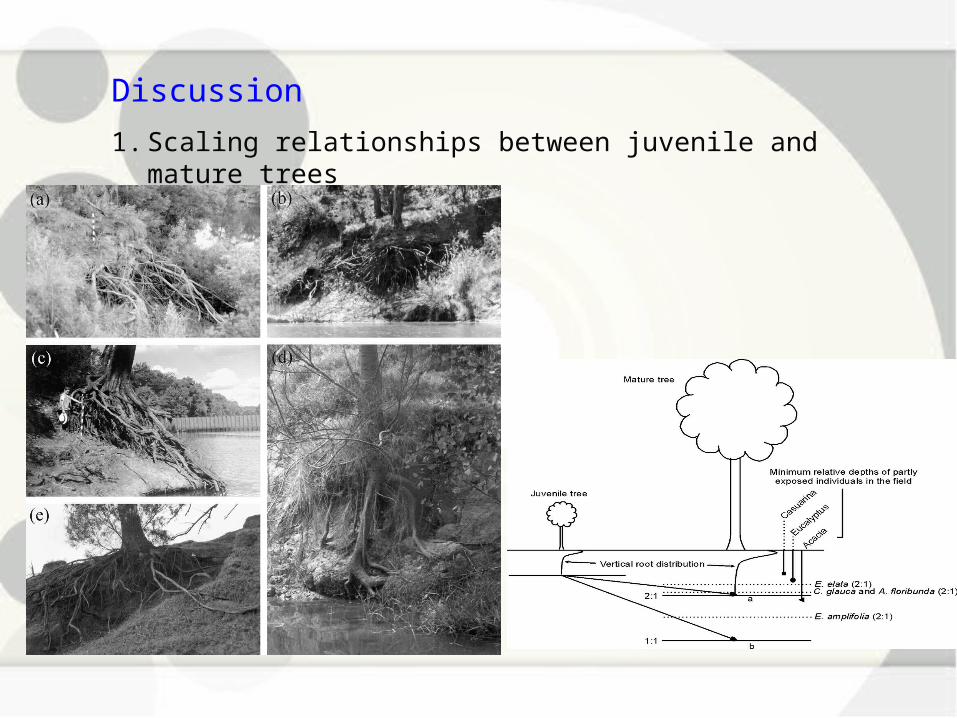
1. Scaling relationships between juvenile and mature trees
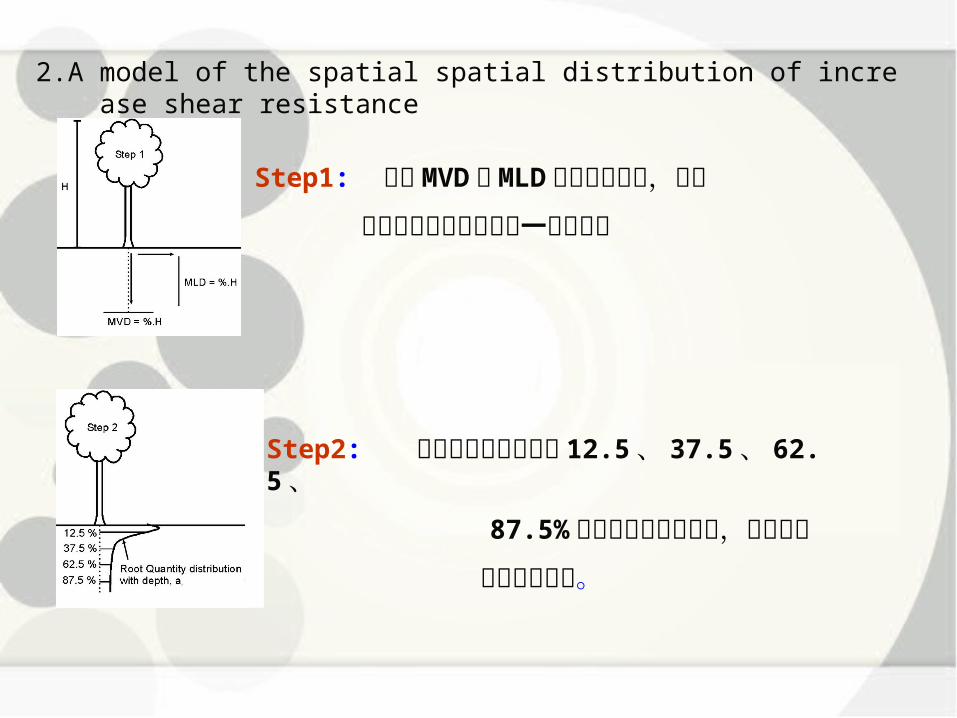
2.A model of the spatial spatial distribution of increase shear resistance
Step1: 求出 MVD 與 MLD 和樹高的關係,可以
看出幼樹和成年樹種為一半之關係
Step2: 將根長分成四個部份 12.5 、 37.5 、 62.5 、
87.5% 計算出其各斷面根量,在跟前面
的公式做比對。
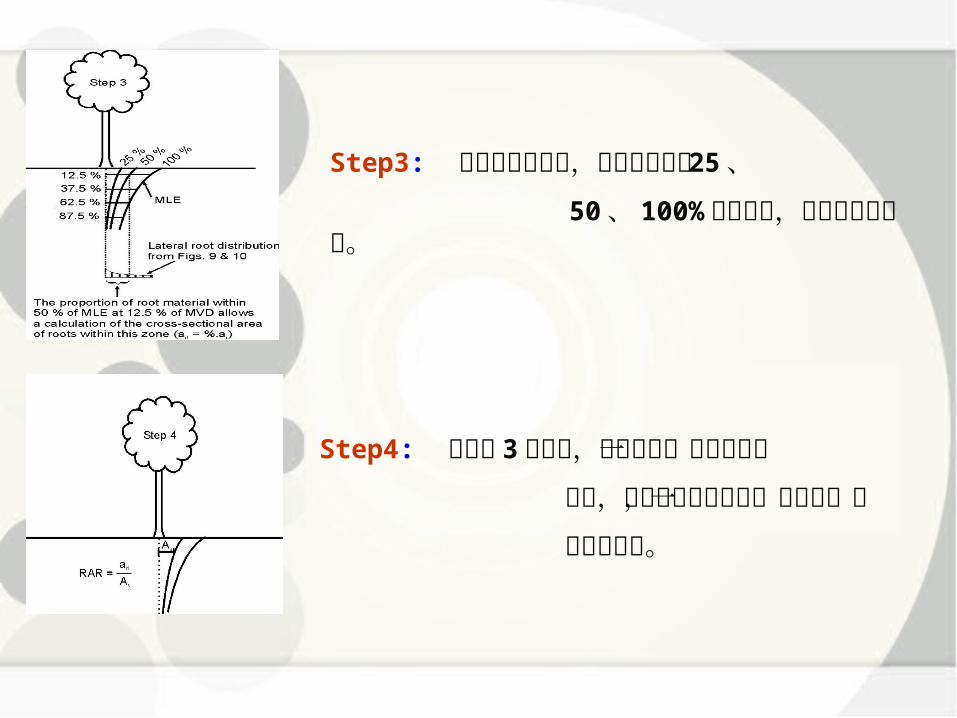
Step3: 延續第二個步驟,將側根長分成 25 、
50 、 100% 三個部分,計算其根斷面積。
Step4: 延續第 3 個步驟,計算出每一個格子的根
面積,並除以期方格面積,得到每一格
的根面積比。
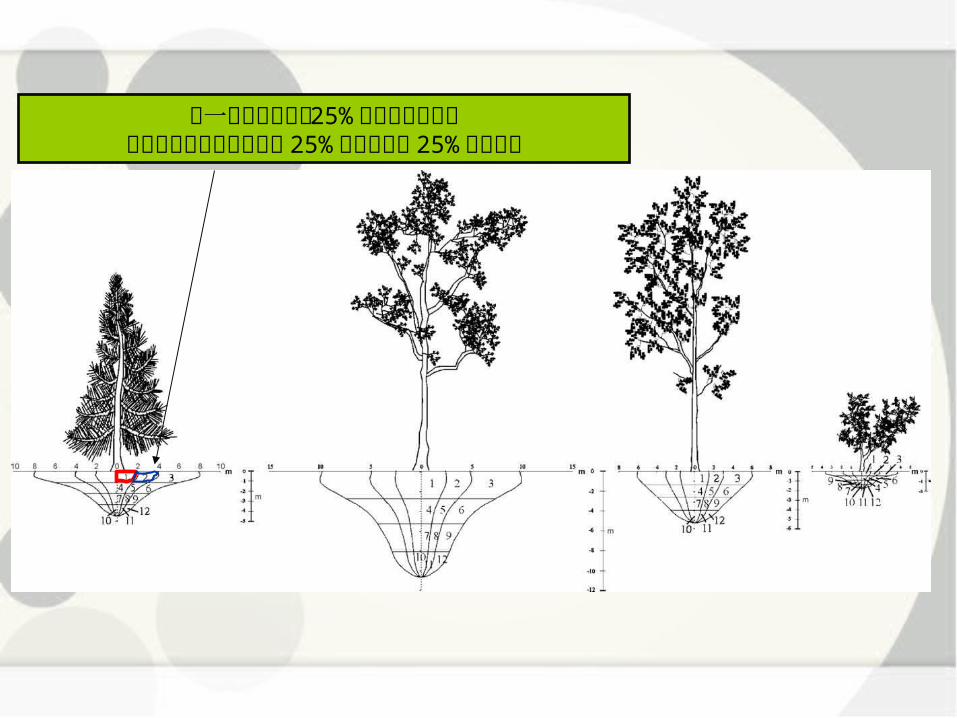
第一格中包含了前 25% 的側根和垂直根第二格中包含了第二佈份 25% 的側根和前 25% 的垂直根
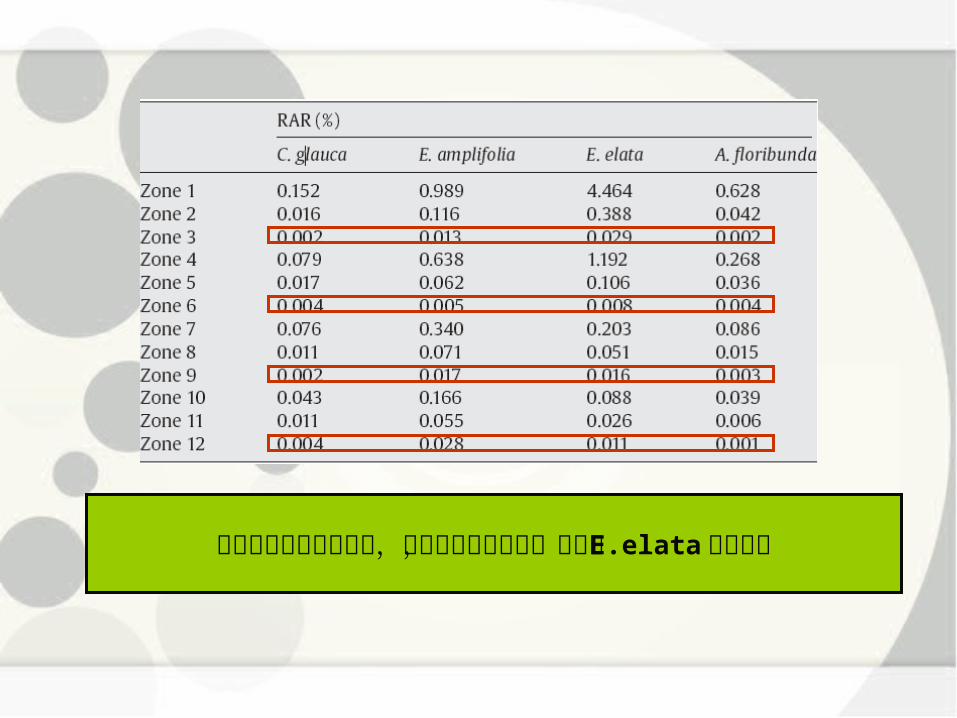
隨著和樹幹的距離越遠,根面積比快速減少,尤其是 E.elata 更為明顯
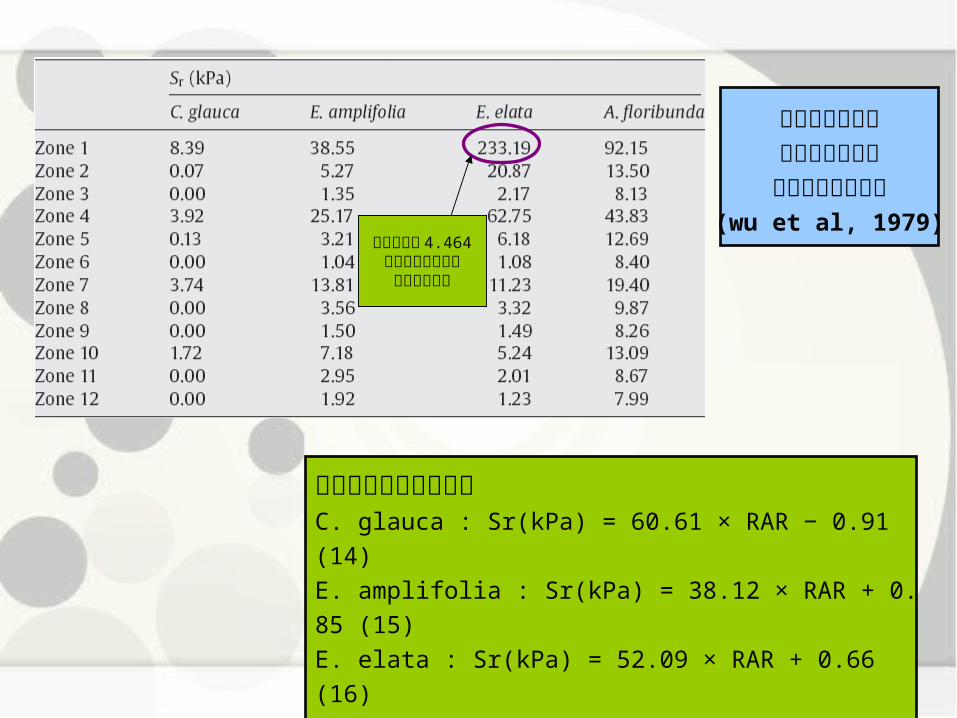
將根面積比轉換成剪力C. glauca : Sr(kPa) = 60.61 × RAR − 0.91 (14)
E. amplifolia : Sr(kPa) = 38.12 × RAR + 0.85 (15)
E. elata : Sr(kPa) = 52.09 × RAR + 0.66 (16)
A. floribunda : Sr(kPa) = 134.22 × RAR + 7.86 (17)
土壤剪力的增加可以依據根穿過剪力面的根量來建(wu et al, 1979)
根面積比為 4.464是所有樹種中最大
有最大的剪力
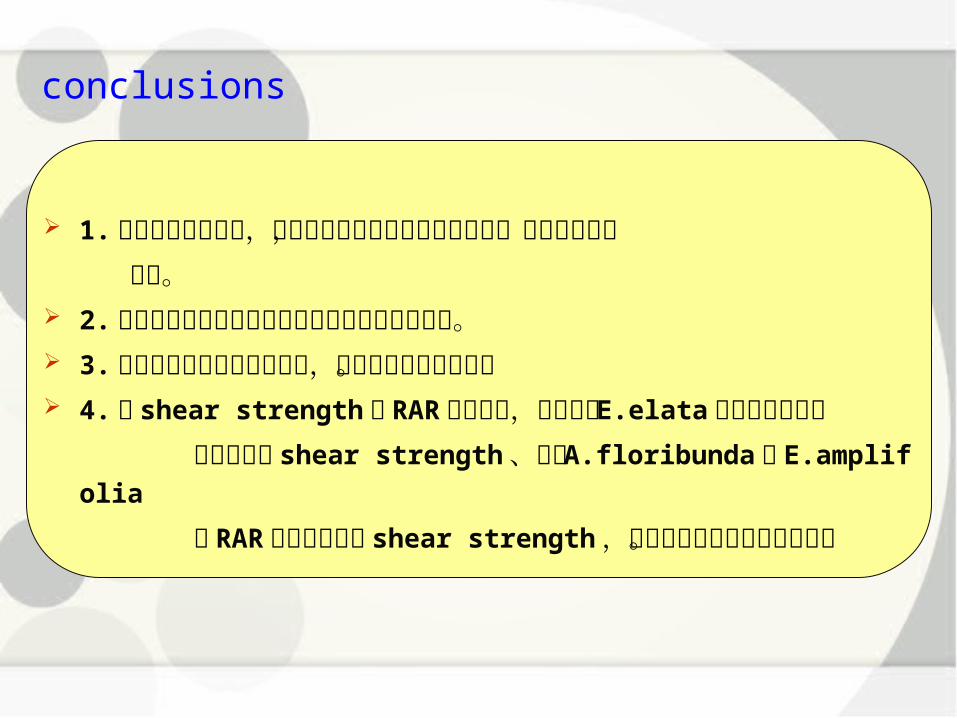
conclusions
1. 利用挖掘出的幼樹,可以發現到根離樹幹越寬和越深,根的量會快速 變少。 2. 可以利用數學的關係來表示出根的長和深之曲線。 3. 利用幼樹與成年樹種的關係,平估土壤強化的關係。 4. 從 shear strength 和 RAR 的表格中,可以看出 E.elata 比其他三種植
物 提供最多的 shear strength 、另外 A.floribunda 較 E.amplifolia
的 RAR 卻提供最多的 shear strength ,意味著對於土壤的強化越強。

THE END