Embed Size (px)
Citation preview
UNTITLED-1 Thu May 08 11:08:13 2014 Page 1
C M Y CM MY CY CMY K
�������
������
�����
������
������
���� �
����������
����
������
���
�������������������������
��������� ����
�������������������
������������
������������������������������ �����
���������� ����� �������������
�������� ����������������� ��������
�����������������������
����� ������������������
�������
��������
������
�������� ������������
�������
�������������������
�������������������������
������������
�����������������
������� ������
�����
�����
� ��������
�������
���������
�����
�����
� ��������
�������
���������
�������� �� �����
�������� �� ������ �� ��������������� ������ �������� �������
� ������������������ �
������� ������ ��� �����
�������
������
�����
������
������
���� �
����������
����
������
���
�������������������������
��������� ����
�������������������
������������
������������������������������ �����
���������� ����� �������������
�������� ����������������� ��������
�����������������������
����� ������������������
�������
��������
������
�������� ������������
�������
�������������������
�������������������������
������������
�����������������
������� ������
�����
�����
� ��������
�������
���������
�����
�����
� ��������
�������
���������
�������� �� �����
�������� �� ������ �� ��������������� ������ �������� �������
� ������������������ �
������� ������ ��� �����
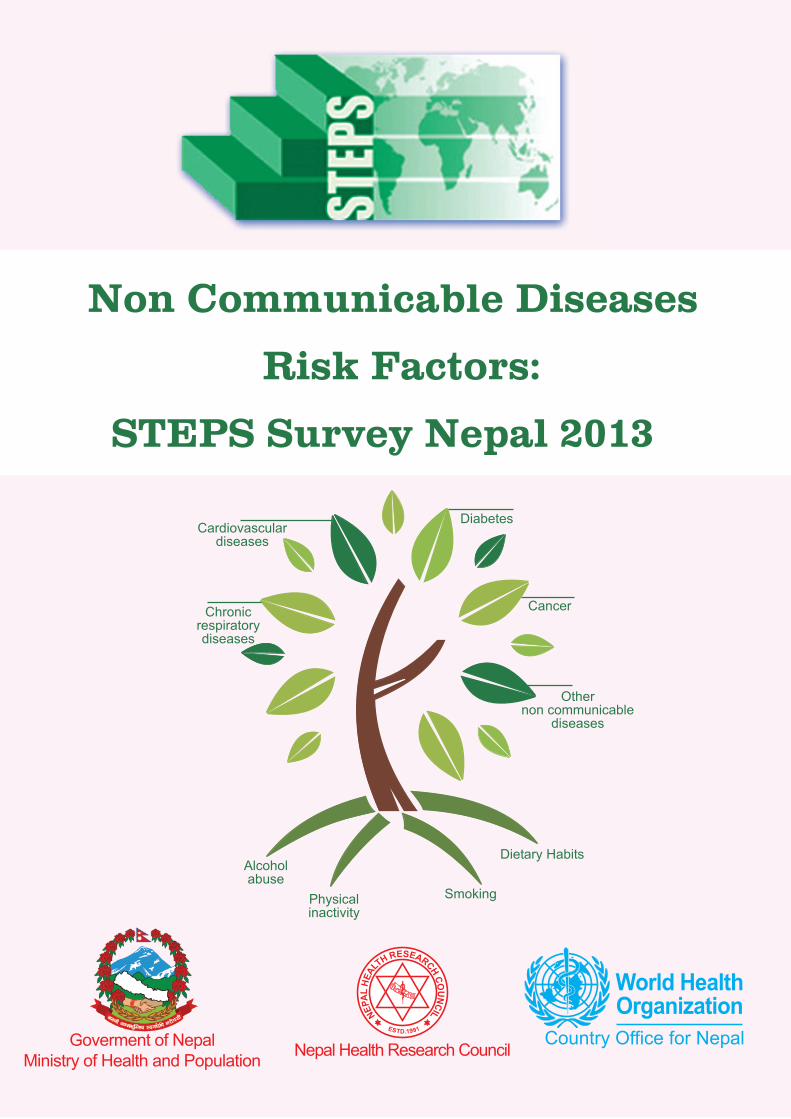
Non Communicable Diseases Risk Factors: STEPS Survey Nepal 2013
AuthorsKrishna Kumar Aryal, Sushhama Neupane, Suresh Mehata, Abhinav Vaidya, Sunil Singh, Frank Paulin, Renu Garg Madanlal, Leanne Margaret Riley, Melanie Cowan, Regina Guthold, Shanker Pratap Singh, Chop Lal Bhusal, Guna Raj Lohani
Recommended Citation
Aryal, KK; Neupane, S; Mehata, S; Vaidya, A; Singh, S; Paulin, F; Madanlal, RG; Riley, LM; Cowan, M; Guthold, R; Singh, SP; Bhusal, CL; Lohani, GR; (2014) Non communicable diseases risk factors: STEPS Survey Nepal 2013. Kathmandu: Nepal Health Research Council
i
Contents
List of Tables .......................................................................................................................................... ......iv
List of Figures................................................................................................................................................ v
List of Annex Tables .....................................................................................................................................vi
Acronyms ...................................................................................................................................................... x
Foreword: Khagraj Adhikari, Minister, Ministry of Health and Population ..................................................xi
Foreword: Dr Praveen Mishra, Secretary, Ministry of Health and Population ...........................................xiii
Foreword: Dr Lin Aung, WHO Representative to Federal Democratic Republic of Nepal............................xv
Acknowledgements ...................................................................................................................................xvii
Factsheet ..................................................................................................................................................xviii
Executive Summary .................................................................................................................................... xx
Chapter 1. Introduction ................................................................................................................................ 1
Background............................................................................................................................................... 1
Objectives ................................................................................................................................................. 2
Chapter 2. Methodology .............................................................................................................................. 3
Study population ...................................................................................................................................... 3
Sample design .......................................................................................................................................... 3
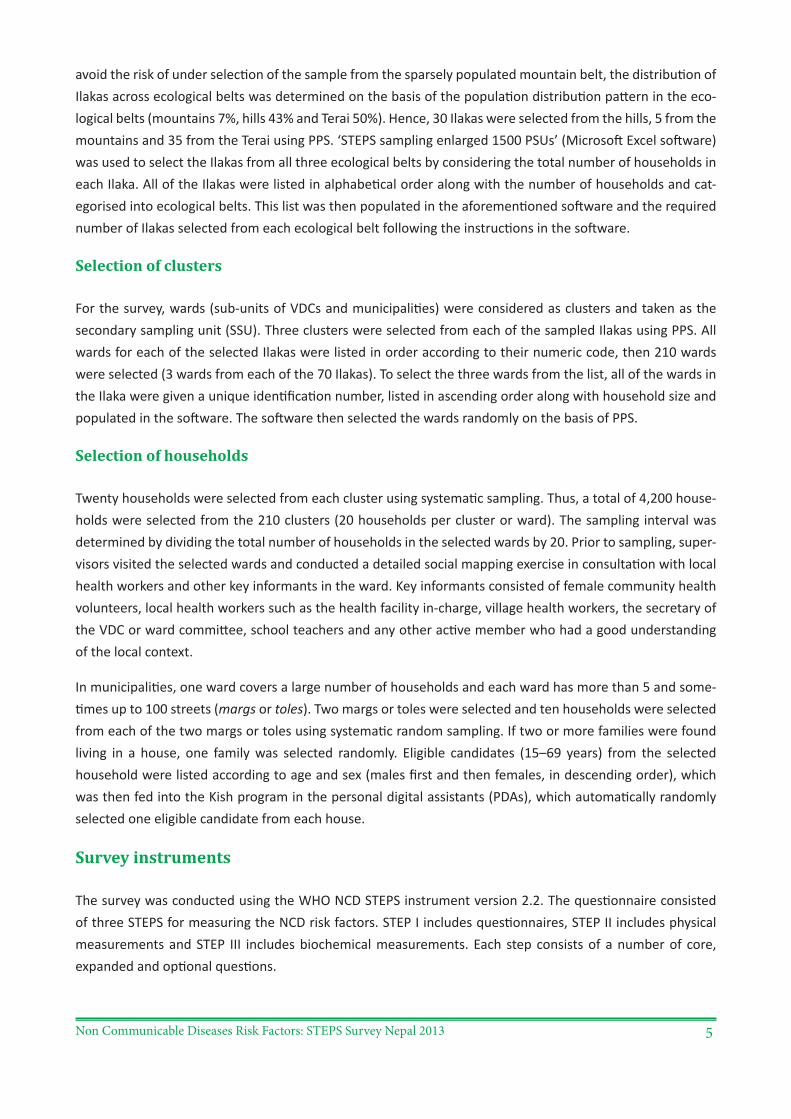
Survey instruments................................................................................................................................... 5
Data collection procedure ...................................................................................................................... 10
Data processing and analysis .................................................................................................................. 12
Ethical considerations ............................................................................................................................. 13
Chapter 3. Background Characteristics ...................................................................................................... 14
Age group and sex .................................................................................................................................. 14
Education ................................................................................................................................................ 14
Ethnicity .................................................................................................................................................. 15
Marital status ......................................................................................................................................... 15
Employment status ................................................................................................................................. 16
Chapter 4. Tobacco Use .............................................................................................................................. 17
Current smokers and daily smokers ....................................................................................................... 17
Age of initiation of smoking ................................................................................................................... 18
Types of tobacco products used ............................................................................................................. 18
Quantity of cigarettes smoked daily ....................................................................................................... 19
Years since cessation of smoking ............................................................................................................ 19
Former daily smokers ............................................................................................................................. 20
Past attempts or advice by doctor to quit smoking ................................................................................20
Users of smokeless tobacco ................................................................................................................... 20
Types of smokeless tobacco used ........................................................................................................... 21
Users of smoke and smokeless tobacco ................................................................................................. 21
ii
Exposure to second-hand smoke ............................................................................................................ 21
Chapter 5. Alcohol Consumption ............................................................................................................... 22
Current drinkers ..................................................................................................................................... 22
Frequency of alcohol consumption ........................................................................................................ 22
Drinking pattern ..................................................................................................................................... 24
Drinking with or without meals .............................................................................................................. 24
Drinking in past seven days .................................................................................................................... 24
Chapter 6. Dietary Habits ........................................................................................................................... 26
Fruit and vegetable consumption ........................................................................................................... 26
Type of oil used ...................................................................................................................................... 27
Eating outside home ............................................................................................................................... 27
Chapter 7. Physical Activity ........................................................................................................................ 28
Level of physical activity ......................................................................................................................... 28
Time spent on physical activity............................................................................................................... 29
Types of activity ...................................................................................................................................... 30
Chapter 8. Dietary Salt ............................................................................................................................... 31
Dietary salt intake ................................................................................................................................... 31
Awareness of need to lower salt intake ................................................................................................. 32
Control of salt intake .............................................................................................................................. 32
Chapter 9. Oral Health ............................................................................................................................... 33
State of teeth and gums ......................................................................................................................... 33
Dentures ................................................................................................................................................. 33
Oral pain or discomfort .......................................................................................................................... 33
Dental care ............................................................................................................................................. 34
Dental hygiene ........................................................................................................................................ 34
Difficulty chewing or speaking ................................................................................................................ 36
Dental caries ........................................................................................................................................... 36
Chapter 10. Housing and Energy ................................................................................................................ 37
House construction materials ................................................................................................................. 37
Cooking fuel ............................................................................................................................................ 37
Source of lighting .................................................................................................................................... 37
Chapter 11. Overweight and Obesity ......................................................................................................... 38
Body mass index ..................................................................................................................................... 38
Waist hip ratio ........................................................................................................................................ 39
Chapter 12. Blood Pressure ........................................................................................................................ 40
History of raised blood pressure (hypertension) ....................................................................................40
Blood pressure treatment ...................................................................................................................... 40
Lifestyle advice ....................................................................................................................................... 40
Traditional healers and remedies ........................................................................................................... 40
Blood pressure measurement ................................................................................................................ 40
iii
Pulse rate ................................................................................................................................................ 42
Chapter 13. Blood Glucose ......................................................................................................................... 43
History of raised blood glucose (diabetes mellitus) ...............................................................................43
Diabetes treatment ................................................................................................................................ 43
Lifestyle advice ....................................................................................................................................... 43
Traditional healers and remedies ........................................................................................................... 43
Blood glucose measurement .................................................................................................................. 43
Chapter 14. Abnormal Lipids ...................................................................................................................... 45
Total cholesterol ..................................................................................................................................... 45
High density lipoproteins ....................................................................................................................... 46
Triglycerides ............................................................................................................................................ 46
Low density lipoproteins ........................................................................................................................ 47
Chapter 15. Combined risk factors and cardiovascular disease risk prediction .........................................49
Combined risk factors ............................................................................................................................. 49
Cardiovascular disease risk prediction ................................................................................................... 50
Chapter 16. Conclusion and Recommendations ........................................................................................51
Conclusion .............................................................................................................................................. 51
Recommendations .................................................................................................................................. 51
References .................................................................................................................................................. 54
Annex I. Data Tables ...................................................................................................................................... I
Background characteristics ........................................................................................................................ I
Tobacco use .............................................................................................................................................. II
Alcohol consumption ............................................................................................................................... XI
Fruit and vegetable consumption ..........................................................................................................XVI
Physical activity ...................................................................................................................................XVIII
Dietary salt ........................................................................................................................................ XXVII
Oral health ........................................................................................................................................... XXV
Housing and energy ..............................................................................................................................XXX
Overweight and obesity .....................................................................................................................XXXII
Blood pressure .................................................................................................................................. XXXV
Blood glucose ....................................................................................................................................XXXIX
Abnormal lipids .................................................................................................................................... XLII
Combined risks factors ........................................................................................................................ XLIV
Annex II. List of Steering Committee Members, Study Team and Data Collection Team ......................... XLV
Annex III. Survey Instruments ................................................................................................................ XLVII
Annex IV. Caste Classification Card ....................................................................................................... LXVIII
Annex V. Show Cards ............................................................................................................................... LXIX
Annex VI: Reference Laboratories ......................................................................................................... LXXIV
iv
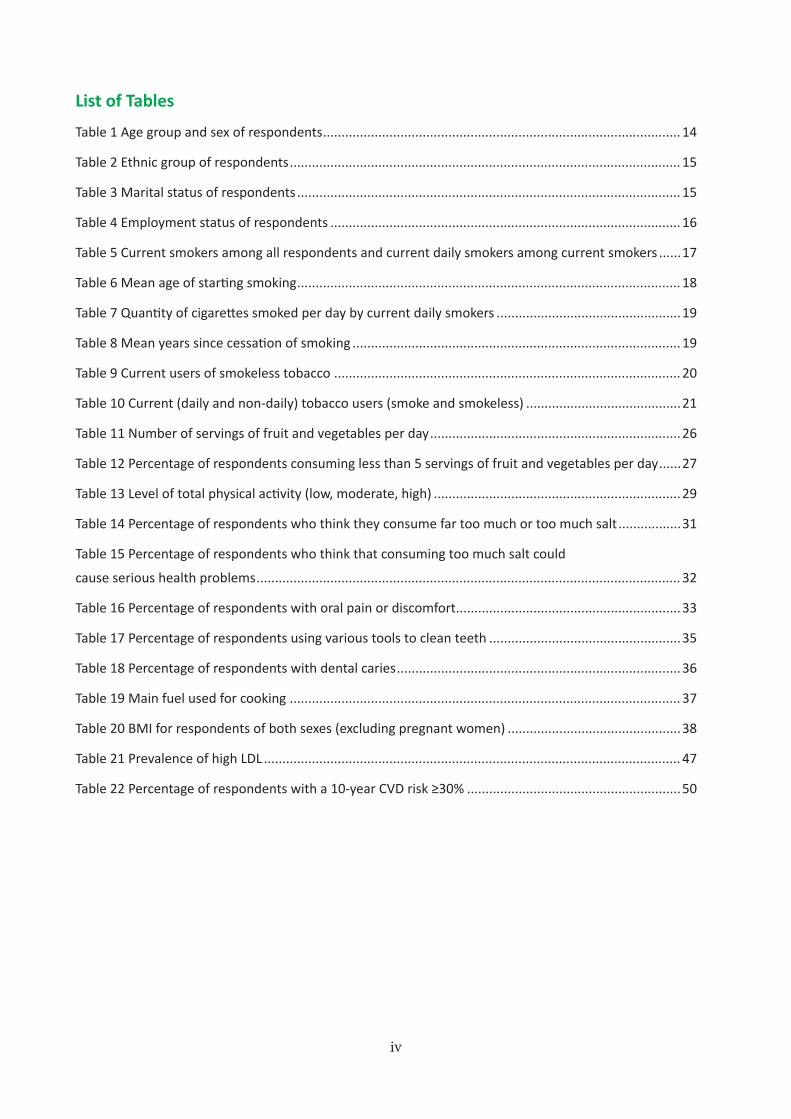
List of Tables
Table 1 Age group and sex of respondents ................................................................................................. 14
Table 2 Ethnic group of respondents .......................................................................................................... 15
Table 3 Marital status of respondents ........................................................................................................ 15
Table 4 Employment status of respondents ............................................................................................... 16
Table 5 Current smokers among all respondents and current daily smokers among current smokers ......17
Table 6 Mean age of starting smoking ........................................................................................................ 18
Table 7 Quantity of cigarettes smoked per day by current daily smokers ..................................................19
Table 8 Mean years since cessation of smoking .........................................................................................19
Table 9 Current users of smokeless tobacco .............................................................................................. 20
Table 10 Current (daily and non-daily) tobacco users (smoke and smokeless) ..........................................21
Table 11 Number of servings of fruit and vegetables per day ....................................................................26
Table 12 Percentage of respondents consuming less than 5 servings of fruit and vegetables per day ......27
Table 13 Level of total physical activity (low, moderate, high) ...................................................................29
Table 14 Percentage of respondents who think they consume far too much or too much salt .................31
Table 15 Percentage of respondents who think that consuming too much salt could
cause serious health problems ................................................................................................................... 32
Table 16 Percentage of respondents with oral pain or discomfort .............................................................33
Table 17 Percentage of respondents using various tools to clean teeth ....................................................35
Table 18 Percentage of respondents with dental caries .............................................................................36
Table 19 Main fuel used for cooking .......................................................................................................... 37
Table 20 BMI for respondents of both sexes (excluding pregnant women) ...............................................38
Table 21 Prevalence of high LDL ................................................................................................................. 47
Table 22 Percentage of respondents with a 10-year CVD risk ≥30% ..........................................................50
v
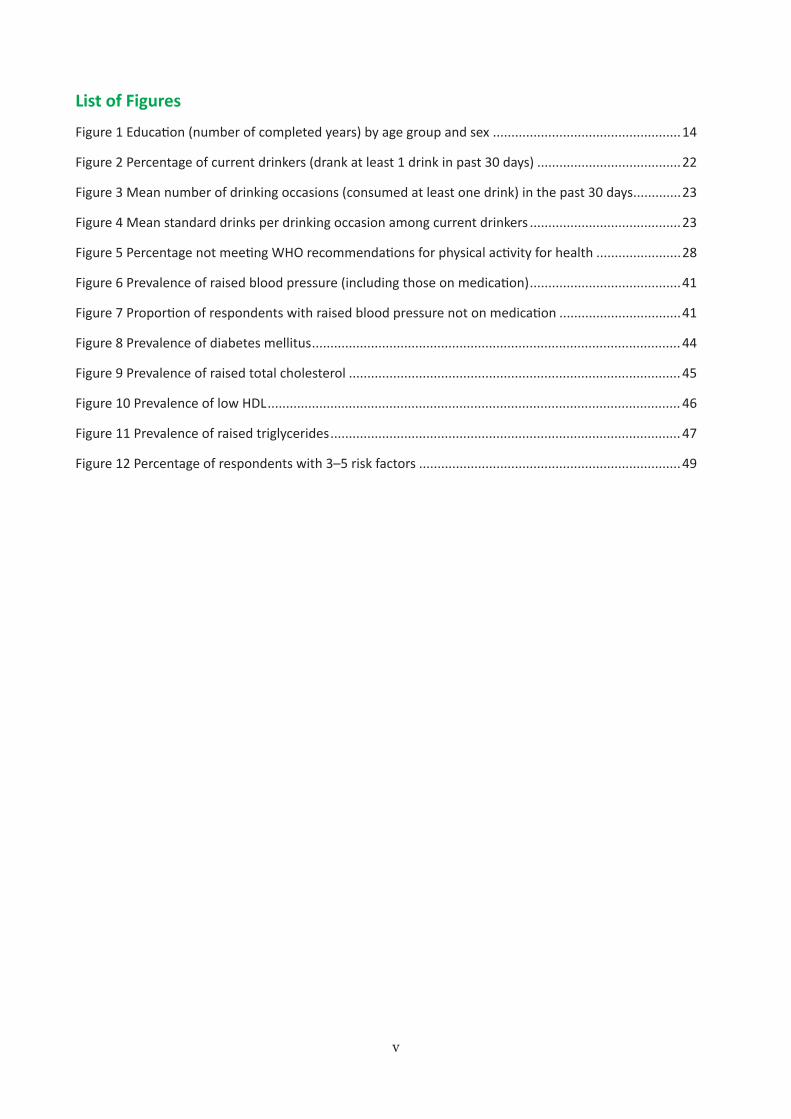
List of Figures
Figure 1 Education (number of completed years) by age group and sex ...................................................14
Figure 2 Percentage of current drinkers (drank at least 1 drink in past 30 days) .......................................22
Figure 3 Mean number of drinking occasions (consumed at least one drink) in the past 30 days .............23
Figure 4 Mean standard drinks per drinking occasion among current drinkers .........................................23
Figure 5 Percentage not meeting WHO recommendations for physical activity for health .......................28
Figure 6 Prevalence of raised blood pressure (including those on medication) .........................................41
Figure 7 Proportion of respondents with raised blood pressure not on medication .................................41
Figure 8 Prevalence of diabetes mellitus .................................................................................................... 44
Figure 9 Prevalence of raised total cholesterol ..........................................................................................45
Figure 10 Prevalence of low HDL ................................................................................................................ 46
Figure 11 Prevalence of raised triglycerides ............................................................................................... 47
Figure 12 Percentage of respondents with 3–5 risk factors .......................................................................49
vi
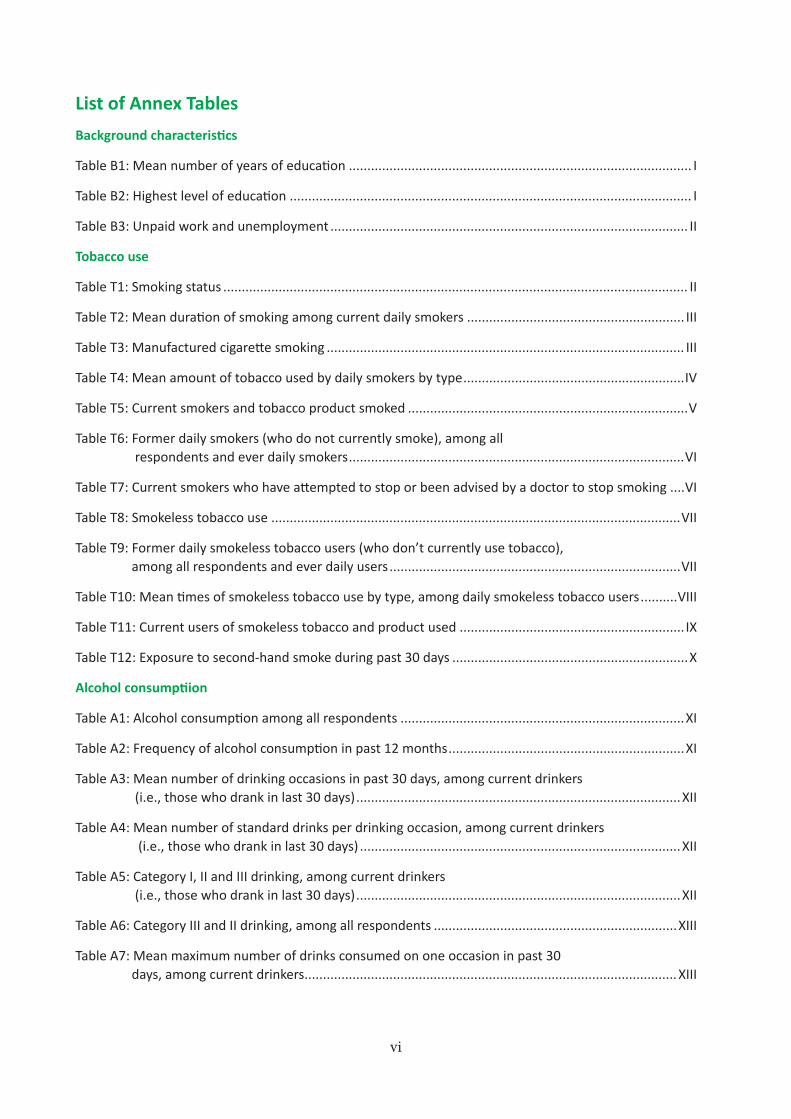
List of Annex Tables Background characteristics
Table B1: Mean number of years of education ............................................................................................. I
Table B2: Highest level of education ............................................................................................................. I
Table B3: Unpaid work and unemployment ................................................................................................. II
Tobacco use
Table T1: Smoking status .............................................................................................................................. II
Table T2: Mean duration of smoking among current daily smokers ........................................................... III
Table T3: Manufactured cigarette smoking ................................................................................................. III
Table T4: Mean amount of tobacco used by daily smokers by type ............................................................IV
Table T5: Current smokers and tobacco product smoked ............................................................................V
Table T6: Former daily smokers (who do not currently smoke), among all respondents and ever daily smokers ...........................................................................................VI
Table T7: Current smokers who have attempted to stop or been advised by a doctor to stop smoking ....VI
Table T8: Smokeless tobacco use ...............................................................................................................VII
Table T9: Former daily smokeless tobacco users (who don’t currently use tobacco), among all respondents and ever daily users ...............................................................................VII
Table T10: Mean times of smokeless tobacco use by type, among daily smokeless tobacco users ..........VIII
Table T11: Current users of smokeless tobacco and product used ............................................................. IX
Table T12: Exposure to second-hand smoke during past 30 days ................................................................X
Alcohol consumptiion
Table A1: Alcohol consumption among all respondents .............................................................................XI
Table A2: Frequency of alcohol consumption in past 12 months ................................................................XI
Table A3: Mean number of drinking occasions in past 30 days, among current drinkers (i.e., those who drank in last 30 days) ........................................................................................XII
Table A4: Mean number of standard drinks per drinking occasion, among current drinkers (i.e., those who drank in last 30 days) .......................................................................................XII
Table A5: Category I, II and III drinking, among current drinkers (i.e., those who drank in last 30 days) ........................................................................................XII
Table A6: Category III and II drinking, among all respondents ..................................................................XIII
Table A7: Mean maximum number of drinks consumed on one occasion in past 30 days, among current drinkers .....................................................................................................XIII
vii
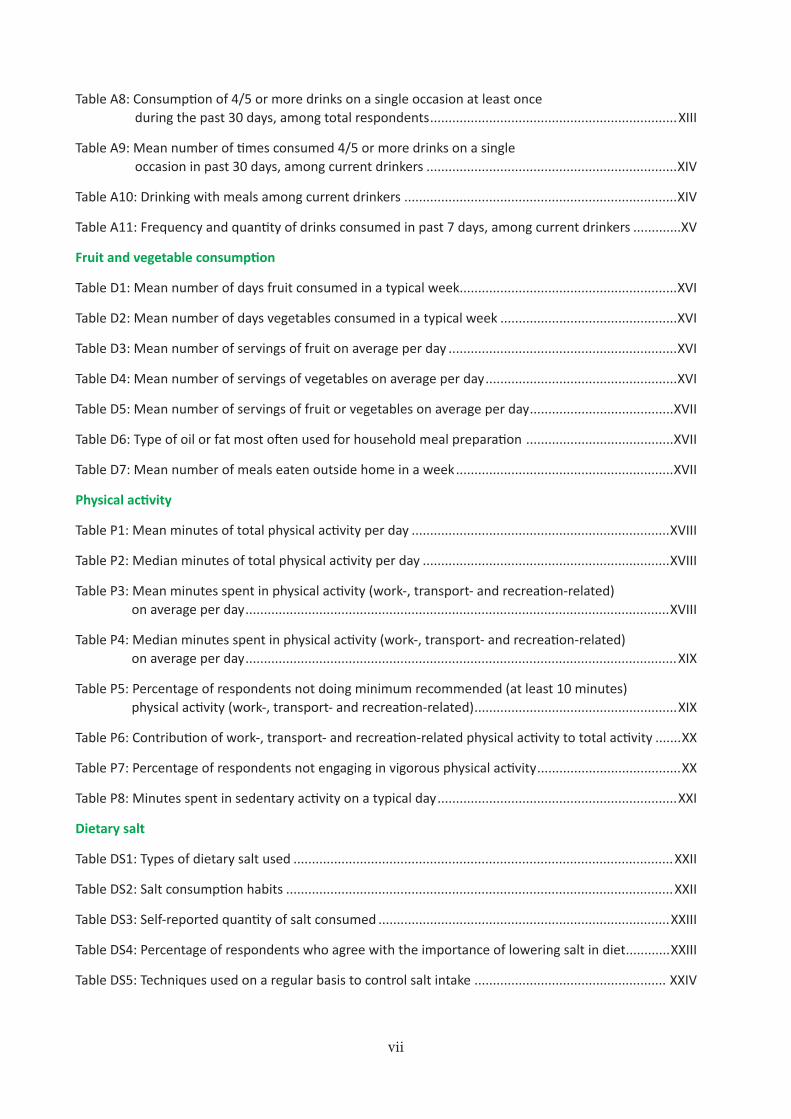
Table A8: Consumption of 4/5 or more drinks on a single occasion at least once during the past 30 days, among total respondents ...................................................................XIII
Table A9: Mean number of times consumed 4/5 or more drinks on a single occasion in past 30 days, among current drinkers ....................................................................XIV
Table A10: Drinking with meals among current drinkers ..........................................................................XIV
Table A11: Frequency and quantity of drinks consumed in past 7 days, among current drinkers .............XV
Fruit and vegetable consumption
Table D1: Mean number of days fruit consumed in a typical week ...........................................................XVI
Table D2: Mean number of days vegetables consumed in a typical week ................................................XVI
Table D3: Mean number of servings of fruit on average per day ..............................................................XVI
Table D4: Mean number of servings of vegetables on average per day ....................................................XVI
Table D5: Mean number of servings of fruit or vegetables on average per day .......................................XVII
Table D6: Type of oil or fat most often used for household meal preparation ........................................XVII
Table D7: Mean number of meals eaten outside home in a week ...........................................................XVII
Physical activity
Table P1: Mean minutes of total physical activity per day ......................................................................XVIII
Table P2: Median minutes of total physical activity per day ...................................................................XVIII
Table P3: Mean minutes spent in physical activity (work-, transport- and recreation-related) on average per day ...................................................................................................................XVIII
Table P4: Median minutes spent in physical activity (work-, transport- and recreation-related) on average per day .....................................................................................................................XIX
Table P5: Percentage of respondents not doing minimum recommended (at least 10 minutes) physical activity (work-, transport- and recreation-related) .......................................................XIX
Table P6: Contribution of work-, transport- and recreation-related physical activity to total activity .......XX
Table P7: Percentage of respondents not engaging in vigorous physical activity .......................................XX
Table P8: Minutes spent in sedentary activity on a typical day .................................................................XXI
Dietary salt
Table DS1: Types of dietary salt used .......................................................................................................XXII
Table DS2: Salt consumption habits .........................................................................................................XXII
Table DS3: Self-reported quantity of salt consumed ...............................................................................XXIII
Table DS4: Percentage of respondents who agree with the importance of lowering salt in diet ............XXIII
Table DS5: Techniques used on a regular basis to control salt intake .................................................... XXIV
viii
Oral health
Table O1: Percentage of respondents with natural teeth ........................................................................ XXV
Table O2: Percentage of respondents with poor or very poor state of teeth and gums, among those with natural teeth.............................................................................................. XXV
Table O3: Percentage of respondents with removable dentures ........................................................... XXVI
Table O4: Percentage of respondents who have seen a dentist in the past 12 months ......................... XXVI
Table O5: Percentage of respondents who have never received dental care ........................................ XXVII
Table O6: Main reason for last visit to dentist, among those who ever visited a dentist ...................... XXVII
Table O7: Percentage of respondents who clean their teeth at least once and at least twice a day .... XXVII
Table O8: Percentage of respondents who use toothpaste, among those who clean their teeth ....... XXVIII
Table O9: Percentage of respondents who use toothpaste containing fluoride, among those who use toothpaste........................................................................................ XXVIII
Table O10: Percentage of respondents who have had problems resulting from poor oral status during past 12 months ...................................................................................... XXVIII
Housing and energy
Table X1: Roof materials of house ............................................................................................................XXX
Table X2: Wall materials of house ............................................................................................................XXX
Table X3: Floor materials of house ...........................................................................................................XXX
Table X4: Percentage of respondents with a separate kitchen in their house ..........................................XXX
Table X5: Types of stoves used for cooking .............................................................................................XXXI
Table X6: Main source of lighting ............................................................................................................XXXI
Overweight and obesity
Table M1: Mean height and weight among all respondents ..................................................................XXXII
Table M2: Mean BMI (kg/m2) among all respondents ...........................................................................XXXII
Table M3: Percentage of respondents (excluding pregnant women) in each BMI category ..................XXXII
Table M4: Percentage of respondents classified as overweight (BMI≥25) ............................................XXXIII
Table M5: Mean waist and hip circumference among all respondents (excluding pregnant women) ..XXXIII
Table M6: Mean waist-to-hip ratio among all respondents (excluding pregnant women) ................... XXXIV
Blood pressure
Table H1: Blood pressure measurement and diagnosis of hypertension ............................................. XXXIV
Table H2: Percentage of respondents currently taking blood pressure drugs prescribed by doctor or health worker, among those diagnosed ......................................... XXXV
ix
Table H3: Percentage of previously diagnosed hypertensive respondents who have received lifestyle advice from a doctor or health worker ............................................. XXXV
Table H4: Percentage of previously diagnosed hypertensive respondents who have visited or received treatment from a traditional healer .............................................. XXXVI
Table M7: Mean systolic and diastolic blood pressure (mmHg) ........................................................... XXXVI
Table M8: Percentage of respondents with raised blood pressure ..................................................... XXXVII
Table M9: Percentage of respondents with treated or controlled raised blood pressure, among those with raised blood pressure (SBP ≥140 and/or DBP ≥ 90 mmHg) or currently on medication for raised blood pressure .......................................................................... XXXVIII
Table M10: Mean heart rate (beats per minute) ................................................................................ XXXVIII
Blood glucose
Table H5: Blood glucose measurement and diagnosis of diabetes mellitus ..........................................XXXIX
Table H6: Percentage of respondents currently taking insulin and oral medication, among those previously diagnosed .......................................................................................XXXIX
Table H7: Percentage of respondents who have received diabetes lifestyle advice from a doctor or health worker, among those previously diagnosed ............................ XL
Table H8: Percentage of respondents who have sought advice or treatment for diabetes from a traditional healer, among those previously diagnosed .................................................. XL
Table M11: Percentage of respondents currently on medication for diabetes ......................................... XLI
Table M12: Mean fasting blood glucose (mg/dl) among all respondents ................................................. XLI
Table M13: Impaired fasting glycaemia among all respondents ............................................................... XLI
Table M14: Raised blood glucose (plasma venous value ≥ 126 mg/dl) or currently on medication for diabetes .......................................................................................................... XLI
Abnormal lipids
Table M15: Mean total cholesterol among all respondents including those currently on medication for raised cholesterol ..................................................................................... XLII
Table M16: Percentage of respondents with raised total cholesterol or on medication for raised cholesterol .......................................................................................... XLII
Table M17: Mean HDL among all respondents ........................................................................................ XLII
Table M18: Percentage of respondents with low HDL ............................................................................ XLIII
Table M19: Mean fasting triglycerides among all respondents ............................................................... XLIII
Table M20: Percentage of respondents with raised fasting triglycerides ................................................ XLIII
Table M21: Mean LDL among all respondents ........................................................................................ XLIII
Combined risk factors
Table S1: Summary of combined risk factors ............................................................................................ XLV
x
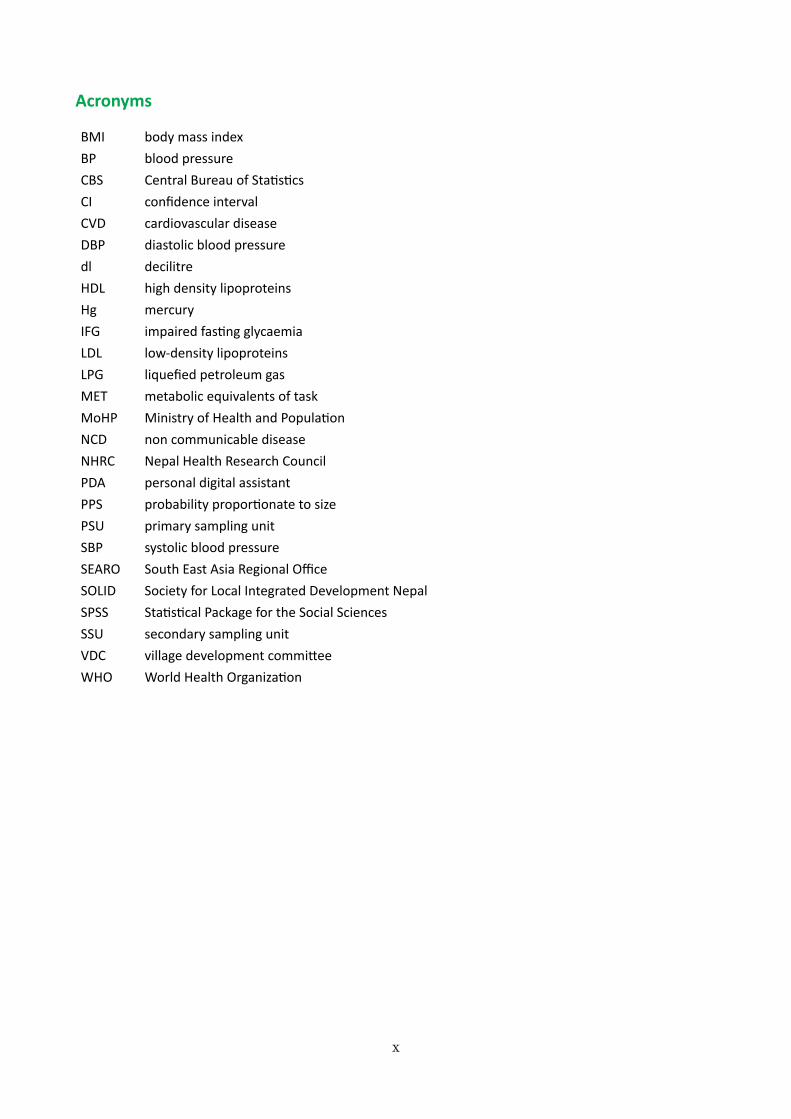
Acronyms
BMI body mass indexBP blood pressureCBS Central Bureau of StatisticsCI confidence intervalCVD cardiovascular diseaseDBP diastolic blood pressuredl decilitreHDL high density lipoproteinsHg mercuryIFG impaired fasting glycaemiaLDL low-density lipoproteinsLPG liquefied petroleum gasMET metabolic equivalents of taskMoHP Ministry of Health and PopulationNCD non communicable diseaseNHRC Nepal Health Research CouncilPDA personal digital assistantPPS probability proportionate to sizePSU primary sampling unitSBP systolic blood pressureSEARO South East Asia Regional OfficeSOLID Society for Local Integrated Development NepalSPSS Statistical Package for the Social SciencesSSU secondary sampling unitVDC village development committeeWHO World Health Organization
xi

xii
xiii

xiv
xv
UN HOUSE, PULCHOWK, LALITPUR, PO BOX: 108, KATHMANDU, NEPAL, TEL: +977-1-5523200 FAX: +977-1-5527756, E-MAIL: [email protected]
Foreword
Non-communicable diseases (NCDs) are major causes of preventable deaths and disabilities in Nepal. With technical assistance from the World Health Organization the first nationally representa-tive NCD STEPS survey was conducted by the Nepal Health Research Council (NHRC) under the supervision of the Ministry of Health and Population (MOHP) in order to establish the rational and evidence base for the development of a Multisectoral NCD Action Plan. The survey followed the WHO STEPS Manual guidance and implemented WHO STEP wise approach to chronic disease risk factor surveillance. Evidence driven initiatives have a high probability of bringing about a positive impact in any action taken thereof.
I am particularly pleased to note that the survey was done in a paperless environment. Instead of printed questionnaires and data sheets, PDAs were used for direct data recording, which made the data cleansing and primary analysis easier and less time consuming. This highlights the commit-ment of MOHP and NHRC to harvest the benefits of modern IT technologies into its processes and actions.
The primary objective of this survey was to provide relevant and up to date evidence on the magni-tude and distribution of prevalence of conditions like Diabetes Mellitus and Hypertension, key NCD risk factors and oral health status. Understanding the risk populations demography, behavioural pat-tern and risk factor prevalence is essential for designing the effective response. Current STEPS sur-vey provides essential baseline information on biological risk factors associated with NCDs in Nepal.
I am confident that the survey findings will support the MOHP to address the growing burden of NCDs in Nepal.
I would like to congratulate NHRC and the Ministry of Health and Population to have come out with this report and findings of “Non Communicable Diseases Risk Factors: STEPS Survey Nepal 2013” which I think will contribute a great deal to the National Health Sector Programme planning, design-ing effective interventions, both promotive and preventive as well as early diagnosis, treatment and control of NCDs in the country through regular monitoring of the trend and prevalence of NCDs.
Dr Lin Aung
WHO Representative to Federal Democratic Republic of Nepal
20 April 2014
xvi
Acknowledgements
I would like to express my gratitude to everyone involved in this research project. I am indebted to the in-vestigators of the project: Dr Krishna Kumar Aryal and Ms Sushhama Neupane of the Nepal Health Research Council (NHRC), Dr Suresh Mehata of the Nepal Health Sector Support Programme, Dr Abhinav Vaidya of the Kathmandu Medical College and Dr Sunil Singh of the Nepal Army Institute of Health Sciences for con-ceptualising the study, proposal development, data analysis and production of this report. I would like to acknowledge the support of Dr Praveen Mishra, Secretary of the Ministry of Health and Population. I express my sincere gratitude to Prof Dr Chop Lal Bhusal, the then Executive Chairman of NHRC, who was the guiding force behind this survey. I would also like to thank Dr Shanker Pratap Singh, the then Member Secretary of NHRC and Dr Babu Ram Marasini, Director of the Epidemiology and Disease Control Division, Department of Health Services, for their contribution to completing the survey. I also acknowledge the support of Mr Puru-shottam Dhakal of NHRC in completing the survey. I would like to acknowledge Dr Sangeeta Rana of NHRC for her contribution to finalization of the report. I express my sincere gratitude to Dr Leanne Margaret Riley, Dr Regina Guthold and Ms Melanie Cowan from the World Health Organization (WHO) headquarters, Geneva, for their technical support. Similarly, I thank Dr Frank Paulin of the WHO Country Office Nepal and Dr Renu Garg Madanlal of WHO South East Asia Regional Office (SEARO) for their support. I also appreciate the sup-port of Dr Shailesh Upadhyaya of the WHO Country Office Nepal, Badri Bahadur Khadka, Chief of the Tobacco and NCD Control Section, National Health Education Information and Communication Center, Prof Dr Shaili Pradhan of the National Academy for Medical Sciences and Dr Krishnan Anand of WHO SEARO.
Appreciation is due to all the members of the Steering Committee for this survey. I would also like to thank the field supervisors, Baivab Shrestha and Anurag Singh Ghimire of NHRC, and the medical laboratory technolo-gists, laboratory technicians and enumerators of the survey for completing the data collection smoothly. I am also thankful to Bijay Kumar Jha of NHRC for ensuring the smooth implementation of the survey.
I am especially thankful to all of those who participated in the survey and to the community leaders, female community health volunteers and chiefs of the district public health offices of the selected districts for their help in implementing the study. I would like to acknowledge Nirbhay Kumar Sharma and Subodh Kumar Karna and all the staff of NHRC who assisted us to complete the report on time. I also acknowledge the support of Pradeep Belbase. I am grateful to the Nepali-German Health Sector Support Programme for its support in the copyediting of this report and to Susan Sellars-Shrestha for the actual copyediting. I am also grateful to the WHO Country Office Nepal for their financial support, which complemented the regular budget of the Gov-ernment of Nepal and made it possible to complete this survey.
Dr Guna Raj Lohani
Executive Chief
Nepal Health Research Council
xvii
Non Communicable Diseases Risk Factors: STEPS Survey Nepal 2013
Factsheet
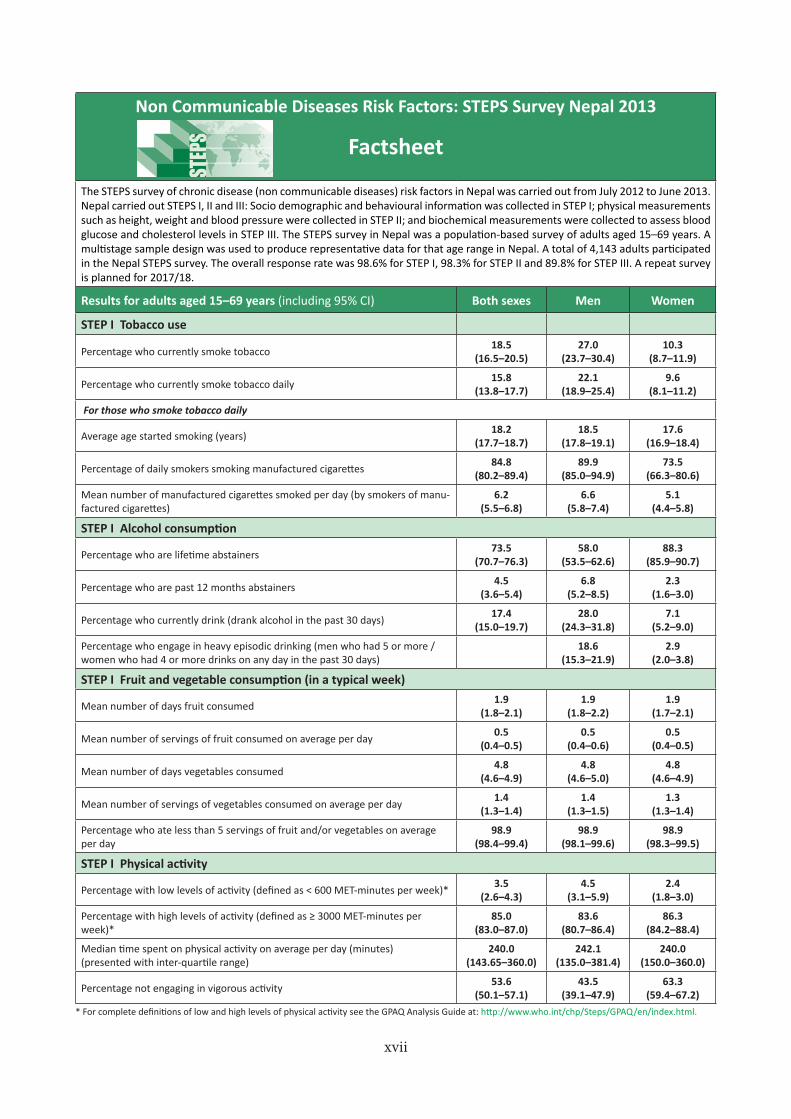
The STEPS survey of chronic disease (non communicable diseases) risk factors in Nepal was carried out from July 2012 to June 2013. Nepal carried out STEPS I, II and III: Socio demographic and behavioural information was collected in STEP I; physical measurements such as height, weight and blood pressure were collected in STEP II; and biochemical measurements were collected to assess blood glucose and cholesterol levels in STEP III. The STEPS survey in Nepal was a population-based survey of adults aged 15–69 years. A multistage sample design was used to produce representative data for that age range in Nepal. A total of 4,143 adults participated in the Nepal STEPS survey. The overall response rate was 98.6% for STEP I, 98.3% for STEP II and 89.8% for STEP III. A repeat survey is planned for 2017/18.
Results for adults aged 15–69 years (including 95% CI) Both sexes Men Women
STEP I Tobacco use
Percentage who currently smoke tobacco 18.5(16.5–20.5)
27.0(23.7–30.4)
10.3(8.7–11.9)
Percentage who currently smoke tobacco daily 15.8(13.8–17.7)
22.1 (18.9–25.4)
9.6(8.1–11.2)
For those who smoke tobacco daily
Average age started smoking (years) 18.2(17.7–18.7)
18.5(17.8–19.1)
17.6(16.9–18.4)
Percentage of daily smokers smoking manufactured cigarettes 84.8(80.2–89.4)
89.9(85.0–94.9)
73.5(66.3–80.6)
Mean number of manufactured cigarettes smoked per day (by smokers of manu-factured cigarettes)
6.2(5.5–6.8)
6.6(5.8–7.4)
5.1(4.4–5.8)
STEP I Alcohol consumption
Percentage who are lifetime abstainers 73.5(70.7–76.3)
58.0(53.5–62.6)
88.3(85.9–90.7)
Percentage who are past 12 months abstainers 4.5(3.6–5.4)
6.8(5.2–8.5)
2.3(1.6–3.0)
Percentage who currently drink (drank alcohol in the past 30 days) 17.4(15.0–19.7)
28.0(24.3–31.8)
7.1(5.2–9.0)
Percentage who engage in heavy episodic drinking (men who had 5 or more / women who had 4 or more drinks on any day in the past 30 days)
18.6(15.3–21.9)
2.9(2.0–3.8)
STEP I Fruit and vegetable consumption (in a typical week)
Mean number of days fruit consumed 1.9(1.8–2.1)
1.9(1.8–2.2)
1.9(1.7–2.1)
Mean number of servings of fruit consumed on average per day 0.5(0.4–0.5)
0.5(0.4–0.6)
0.5(0.4–0.5)
Mean number of days vegetables consumed 4.8(4.6–4.9)
4.8(4.6–5.0)
4.8(4.6–4.9)
Mean number of servings of vegetables consumed on average per day 1.4(1.3–1.4)
1.4(1.3–1.5)
1.3(1.3–1.4)
Percentage who ate less than 5 servings of fruit and/or vegetables on average per day
98.9(98.4–99.4)
98.9(98.1–99.6)
98.9(98.3–99.5)
STEP I Physical activity
Percentage with low levels of activity (defined as < 600 MET-minutes per week)* 3.5(2.6–4.3)
4.5(3.1–5.9)
2.4(1.8–3.0)
Percentage with high levels of activity (defined as ≥ 3000 MET-minutes per week)*
85.0(83.0–87.0)
83.6(80.7–86.4)
86.3(84.2–88.4)
Median time spent on physical activity on average per day (minutes)(presented with inter-quartile range)
240.0(143.65–360.0)
242.1(135.0–381.4)
240.0(150.0–360.0)
Percentage not engaging in vigorous activity 53.6(50.1–57.1)
43.5(39.1–47.9)
63.3(59.4–67.2)
* For complete definitions of low and high levels of physical activity see the GPAQ Analysis Guide at: http://www.who.int/chp/Steps/GPAQ/en/index.html.
xviii
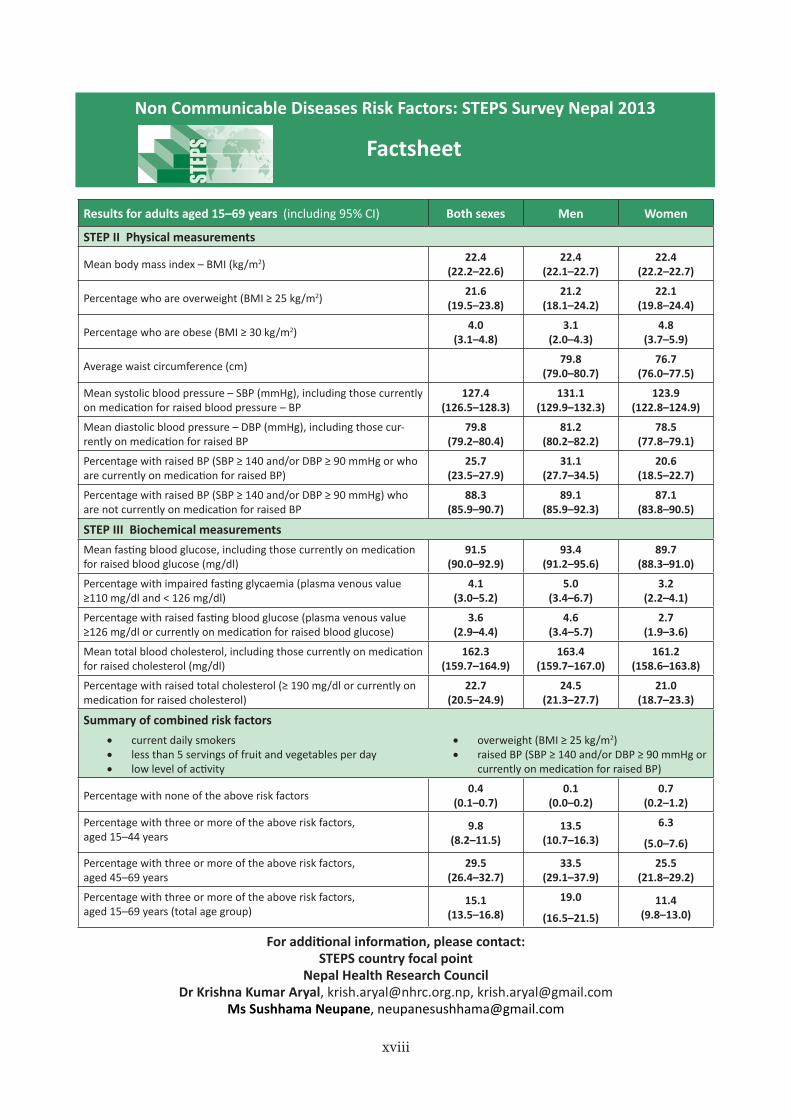
Non Communicable Diseases Risk Factors: STEPS Survey Nepal 2013
Factsheet
Results for adults aged 15–69 years (including 95% CI) Both sexes Men Women
STEP II Physical measurements
Mean body mass index – BMI (kg/m2) 22.4(22.2–22.6)
22.4(22.1–22.7)
22.4(22.2–22.7)
Percentage who are overweight (BMI ≥ 25 kg/m2) 21.6(19.5–23.8)
21.2(18.1–24.2)
22.1(19.8–24.4)
Percentage who are obese (BMI ≥ 30 kg/m2) 4.0(3.1–4.8)
3.1(2.0–4.3)
4.8(3.7–5.9)
Average waist circumference (cm) 79.8(79.0–80.7)
76.7 (76.0–77.5)
Mean systolic blood pressure – SBP (mmHg), including those currently on medication for raised blood pressure – BP
127.4(126.5–128.3)
131.1(129.9–132.3)
123.9 (122.8–124.9)
Mean diastolic blood pressure – DBP (mmHg), including those cur-rently on medication for raised BP
79.8(79.2–80.4)
81.2(80.2–82.2)
78.5(77.8–79.1)
Percentage with raised BP (SBP ≥ 140 and/or DBP ≥ 90 mmHg or who are currently on medication for raised BP)
25.7(23.5–27.9)
31.1(27.7–34.5)
20.6 (18.5–22.7)
Percentage with raised BP (SBP ≥ 140 and/or DBP ≥ 90 mmHg) who are not currently on medication for raised BP
88.3(85.9–90.7)
89.1(85.9–92.3)
87.1(83.8–90.5)
STEP III Biochemical measurementsMean fasting blood glucose, including those currently on medication for raised blood glucose (mg/dl)
91.5(90.0–92.9)
93.4(91.2–95.6)
89.7(88.3–91.0)
Percentage with impaired fasting glycaemia (plasma venous value ≥110 mg/dl and < 126 mg/dl)
4.1 (3.0–5.2)
5.0(3.4–6.7)
3.2(2.2–4.1)
Percentage with raised fasting blood glucose (plasma venous value ≥126 mg/dl or currently on medication for raised blood glucose)
3.6(2.9–4.4)
4.6(3.4–5.7)
2.7(1.9–3.6)
Mean total blood cholesterol, including those currently on medication for raised cholesterol (mg/dl)
162.3(159.7–164.9)
163.4(159.7–167.0)
161.2(158.6–163.8)
Percentage with raised total cholesterol (≥ 190 mg/dl or currently on medication for raised cholesterol)
22.7(20.5–24.9)
24.5(21.3–27.7)
21.0(18.7–23.3)
Summary of combined risk factors• current daily smokers• less than 5 servings of fruit and vegetables per day• low level of activity
• overweight (BMI ≥ 25 kg/m2)• raised BP (SBP ≥ 140 and/or DBP ≥ 90 mmHg or
currently on medication for raised BP)
Percentage with none of the above risk factors 0.4(0.1–0.7)
0.1(0.0–0.2)
0.7(0.2–1.2)
Percentage with three or more of the above risk factors, aged 15–44 years
9.8(8.2–11.5)
13.5(10.7–16.3)
6.3
(5.0–7.6)
Percentage with three or more of the above risk factors, aged 45–69 years
29.5(26.4–32.7)
33.5(29.1–37.9)
25.5(21.8–29.2)
Percentage with three or more of the above risk factors, aged 15–69 years (total age group)
15.1(13.5–16.8)
19.0
(16.5–21.5)11.4
(9.8–13.0)
For additional information, please contact:STEPS country focal point
Nepal Health Research CouncilDr Krishna Kumar Aryal, [email protected], [email protected]
Ms Sushhama Neupane, [email protected]
xix
Executive SummaryThe emerging pandemic of non communicable diseases (NCDs) is creating major health challenges globally. The burden of non communicable diseases is also increasingly affecting developing countries such as Nepal. Similar to other low and middle income countries, Nepal is facing a triple burden of diseases: communi-cable diseases, re-emerging diseases and an escalation of non communicable diseases. Cardiovascular dis-eases, cancer, chronic obstructive pulmonary diseases and diabetes have been identified by the World Health Organization (WHO) as the four major NCDs worldwide. These diseases are driven by various forces including ageing, rapid unplanned urbanisation and the globalisation of unhealthy lifestyles. The World Health Report 2002 states the eight major risk factors (four behavioural and four biological) that contribute most to the development of NCDs (WHO 2002). To reduce NCDs it is important to focus on decreasing the risk factors as-sociated with these diseases and mapping the epidemic of NCDs and their risk factors.
In Nepal, the first national-level NCD risk factor survey was conducted in 2007/08 to determine the preva-lence of modifiable behavioural risk factors; however, this survey did not cover biological risk factors. Against this backdrop, the current study was conducted in 2012/13 (five years later) to collect baseline data on bio-logical risk factors and determine the distribution of modifiable behavioural risk factors (NCD risk factors) among the Nepalese population.
Method
This national NCD risk factor survey was conducted as a cross sectional study from July 2012 to June 2013 with data collection spread from January to June 2013. Prior to data collection, ethical approval was sought from the independent ethical review board of the Nepal Health Research Council. The main objective of the survey was to estimate the national prevalence of major NCD risk factors among different population strata in Nepal. A sample size of 4,200 was used to represent the target population (15–69 year old adults) in Nepal. Multi-stage cluster sampling using a mix of probability proportionate to size (PPS) and systematic random sampling was applied using the sampling framework from the Nepal Census 2011 (CBS 2011) to select the participants. The primary sampling unit (PSU) of this survey was the Ilaka (an administrative unit at the sub-district level). Out of the 921 Ilakas in Nepal, 70 were selected, which were proportionately distributed across Nepal’s three ecological zones based on population proportion, as per the latest Census (CBS 2011). Individual wards in a village development committee (VDC) or municipality were considered as clusters and these clusters were taken as the secondary sampling unit (SSU). Three clusters were selected from each of the sampled Ilakas us-ing the PPS sampling method, leading to the selection of 210 wards. Twenty households were selected from each cluster using systematic sampling. One participant out of the eligible candidates (15–69 years) in each selected household was selected to take part in the survey using the Kish method.
The survey was conducted using the WHO NCD STEPS instrument version 2.2, which consists of three Steps for measuring NCD risk factors. Socio demographic and behavioural information were collected in STEP I. Be-havioural information included tobacco use, harmful alcohol consumption, low fruit and vegetable consump-tion, history of raised blood pressure and blood glucose levels, oral health, dietary salt consumption, and housing and energy (indoor air pollution). Physical measurements such as height, weight and blood pressure were collected in STEP II. Biochemical measurements were collected in STEP III using the wet method to as-sess blood glucose and cholesterol levels. Data was collected digitally using personal digital assistants (PDAs)
xx
from which data were transferred to Microsoft Excel on personal computers. Data cleaning was done using SPSS 16.0 and analysis undertaken using Epi Info 3.5.1 using prior developed analysis commands. Descriptive weighted analysis was also undertaken along with complex sample analysis.
Response rate
Out of 4,200 targeted respondents, 4,143 (98.6%) participated in STEP I and 4,130 (98.3%) in STEP II, but only 3,772 (89.8%) participated in STEP III.
Background characteristics
Among the 4,143 respondents who participated in the survey 1,336 (32.2%) were men and 2,807 (67.8%) were women. The median number of years schooling was 4.6 (men 7.0 years, women 3.5 years). The majority (43.3%) of respondents were from upper caste groups followed by disadvantaged janajatis (31.3%). Around 86.1% of respondents were married at the time of the survey. Regarding employment status, 66.7% of re-spondents were involved in unpaid work, 26.8% were self employed, 4.2% were non government employees and 2.3% were government employees.
Tobacco use
The prevalence of smoking among respondents was 18.5% (men 27.0%, women 10.3%). This proportion in-creased with age among both sexes. Likewise, the prevalence of current daily smoking was 15.8% overall (men 22.1%, women 9.6%). On average, respondents started to smoke at 18.2 years of age (men 18.5 years, women 17.6 years). About 84.8% of current daily smokers smoked manufactured cigarettes; this proportion was higher among men (89.9%) than women (73.5%).
The prevalence of smokeless tobacco use was 17.8% (men 31.3%, women 4.8%). Around 77.6% of current users took snuff by mouth (khaini), 23.1% used chewing tobacco and 7.8% used betel or quid. The prevalence of tobacco use, both smoke and smokeless combined, was 30.8%. Nearly one in every two men aged 15–69 years (48.1%) were found to be using either form of tobacco; however, among women this proportion was much less at 14.1%. More than one-third of respondents (36.1%) had been exposed to second-hand smoke at home and 37.2% in the workplace during the past 30 days.
Alcohol consumption
The prevalence of alcohol consumption (current drinkers, i.e., drank in the past 30 days) was 17.4% (men 28.0%, women 7.1%). Among those who drank in the past 12 months, 17.8% (men 17.9%, women 17.5%) drank daily. Current drinkers on average had taken at least one alcoholic drink on 12.3 occasions in the past 30 days and consumed 4.4 standard drinks on a single drinking occasion. More than one-tenth (men 11.1%, women 13.2%) of current drinkers were binge (heavy) drinkers (≥ 60 g of pure alcohol for men, ≥40 g for women on a single occasion).
Current drinkers reported consuming 6.5 standard drinks (men 7 standard drinks, women 4.6 standard drinks) as the largest number of drinks on a single occasion. Male current drinkers reported consuming 5 or more drinks on 6 occasions and female current drinkers 4 or more drinks on 2.9 occasions within the past 30 days.
xxi
Fruit and vegetable consumption
The surveyed population ate fruit on average on 1.9 days in a typical week. Vegetable consumption was rela-tively better than fruit consumption with vegetables being eaten on average on 4.8 days in a typical week. The quantity of intake was measured by servings: one serving of fruit was defined as equal to a medium sized banana or apple or equivalent and one serving of vegetables equal to one cup of green leafy vegetables or half a cup of cooked vegetables). The minimum requirement for an adult is five or more servings of fruit or vegetables a day. The overall daily per capita consumption of fruit and vegetables was 1.8 servings in an aver-age day (fruit 0.5 servings and vegetables 1.4 servings). Comparing this to the minimum recommended in-take, 98.9% of respondents did not consume an adequate amount of fruit and vegetables on an average day.
Physical activity
Physical activity related to work, transportation and recreational activities was assessed in terms of minutes that caused the respondent to feel breathless or experience increased heart rate. However, continuous activ-ity for at least 10 minutes for vigorous activity and 30 minutes for moderate activity was taken into account in calculating the total activity for the day. The total duration of activity was then converted into metabolic equivalents (MET minutes/week). Based on MET minutes/week, 3.5% of respondents engaged in low physical activity (<600 MET minutes/week), 11.6% undertook moderate physical activity (600–3,000 MET minutes/week) and 85.0% high physical activity (>3,000 MET minutes/week). Around 2.3% of respondents did not meet the WHO recommendations for physical activity for health (150 minutes of moderate-intensity physical activity per week, or equivalent).
Dietary salt and oil
Among the surveyed population, 91.0% consumed powdered salt from the packet with two children on its logo. Around 4.7% of respondents always or often added salt before eating or while eating. Similarly, 11.5% of respondents always or often consumed processed food containing high amounts of salt. Around 10.9% thought that they consumed far too much or too much salt. More than three-quarters of respondents (78.5%) thought that consuming too much salt could cause serious health problems.
Various techniques were used by respondents on a regular basis to control salt intake: Around 15.2% of re-spondents avoided or minimised their consumption of processed food, 7.5% looked at the salt or sodium lev-els on food labels, 42.2% ate meals without adding salt at the table and 13.5% bought low salt or low sodium alternatives to control salt intake. Regarding oil consumption, almost four-fifths (79.1%) of respondents most often used mustard oil for meal preparation.
Oral health
Around 95% of respondents were found to have 20 or more natural teeth. Among those with natural teeth, 9.5% had teeth in a poor or very poor state and 7.0% had gums in a poor or very poor state. During the past 12 months, 23.7% of respondents were found to have had pain or discomfort caused by their teeth or gums. Around 6.2% were seen by a dentist, but 83.9% had never received any dental care. The main reason cited for
xxii
the last visit to the dentist, among those who had ever visited a dentist, was pain or trouble with teeth and gums (72.9%).
Around 94.9% of respondents cleaned their teeth at least once a day. Among those cleaning their teeth, 88.2% used a toothbrush and 87.1% used toothpaste. During the past 12 months, 16.2% of respondents had difficulty chewing foods and 5.8% had difficulty with speech or trouble pronouncing words due to dental problems. The self-reported prevalence of dental caries was 35.9%.
Housing and energy
Around 62.7% of respondents lived in a house with mud floors. Many lived in houses where the roof (15.2%) and walls (34.4%) were made of mud. More than one-tenth (15.1%) of respondents had no separate kitchen in their house. Nearly, three-quarters (71.4%) of respondents used wood as the main fuel for cooking, while one-quarter (24.4%) used liquefied petroleum gas (LPG). Nearly two-thirds (60.2%) used mud stoves, 26.9% used gas stoves and 6.7% used an open fire for cooking. More than four-fifths of respondents (82.9%) used electricity as the main source of lighting in their house.
Overweight and obesity
Based on body mass index (BMI), one-tenth of respondents (10.4%) were found to be underweight, 67.9% were normal weight, 17.7% were overweight and 4% were obese. Mean waist circumference was 79.8 cm for men and 76.7 cm for women. Mean hip circumference was 88.1 cm for men and 87.5 for women. Mean waist and hip circumference ratio was 0.9 for both sexes and across all age groups.
Raised blood pressure (hypertension)
Around 42.7% of the study population had never had their blood pressure measured. The prevalence of raised blood pressure or hypertension (SBP≥140 and/or DBP≥90), excluding those on medication, was 23.4% (men 28.7%, women 18.5%) and this figure rose to 25.7% (men 31.1%, women 20.6%) when those currently using medication were included. Among those with raised blood pressure (SBP≥140 and/or DBP≥90), 3.8% had normal blood pressure with medication, 7.9% were hypertensive with medication and 88.3% were hy-pertensive without medication.
Raised blood glucose (diabetes mellitus)
Around 89.2% of respondents had never measured their blood glucose. The prevalence of self reported dia-betes was 1.9% (men 2.4%, women 1.4%). Among those with diabetes, 9.4% were receiving insulin and 63.4% were taking oral drugs for diabetes. The prevalence of impaired fasting glycaemia (IFG), defined as a plasma venous value of blood glucose ≥110 mg/dl to <126mg/dl, was 4.1% (men 5.1%, women 3.2%). The prevalence of diabetes mellitus, based on plasma venous value of blood glucose ≥126 mg/dl and including those on medication, was 3.6% (men 4.6%, women 2.7%). This proportion was found to increase with age.
xxiii
Abnormal lipids
The prevalence of raised total cholesterol (plasma venous value ≥190 mg/dl) including those currently on medication was 22.7% (men 24.5%, women 21.0%). The prevalence of low HDL (plasma venous value <40 mg/dl in men and <50 mg/dl in women) was higher among women (79.3%) than men (61.2%). The prevalence of raised triglycerides (plasma venous value ≥150 mg/dl) was 25.2% (men 31.4%, women 19.4%).
Combined risk factors
The prevalence of combined risk factors was calculated using five risk factors: current daily smoking, intake of less than five servings of fruit and vegetables per day, a low level of physical activity, overweight (BMI ≥ 25 kg/m2) and raised blood pressure (BP) (SBP ≥ 140 and/or DBP ≥ 90 mmHg or currently on medication for raised BP). Only 0.4% of respondents did not have any of these risk factors, 84.5% had one to two risk factors and 15.1% had three to five risk factors. The proportion of respondents in the age group 40–69 years with a 10-year CVD risk of ≥ 30% was found to be 3.2% (men 2.6%, women 3.7%). In both sexes this proportion was higher for the 55–69 year age group at 6.1% (men 7.3% , women 4.9%).
Conclusion
It can be inferred from these results that NCD risk factors are highly prevalent among the Nepalese popula-tion, which is a serious public health problem. Unless urgent and targeted interventions are made to pre-vent, treat and control non communicable diseases and their risk factors, the burden of NCDs could become unbearable in Nepal. There is an urgent need for concerned agencies to plan interventions to prevent and control these risk factors.

xxiv
Non Communicable Diseases Risk Factors: STEPS Survey Nepal 2013 1
CHAPTER 1. INTRODUCTION
Background
Non communicable diseases (NCDs) cause 63% of deaths globally and nearly 80% of deaths in low and middle income countries (WHO 2010). In Nepal, 42% of deaths are caused by NCDs and nearly 35% of deaths are caused by four particular NCDs – cardiovascular diseases (CVDs), cancer, chronic obstructive pulmonary dis-eases and diabetes mellitus (Subedi 2007).
In 2002, the World Health Organization (WHO) identified the eight major behavioural and biological risk factors for NCDs (WHO 2002): tobacco use, harmful alcohol consumption, unhealthy diet (low fruit and veg-etable consumption), physical inactivity, overweight and obesity, raised blood pressure, raised blood glucose, and abnormal blood lipids and its subset raised total cholesterol. These behavioural and biological risk factors contribute to chronic diseases such as CVD, cancer, chronic obstructive pulmonary diseases and diabetes mellitus. Additional risk factors such as indoor air pollution (housing and energy), poor oral health and high salt consumption are also closely linked to the development of these chronic diseases (WHO 2009; CDC 2011; Asaria 2007).
Some initial steps were taken in Nepal in the 1980s to assess risk factors for NCDs (dietary salt consumption and hypertension) (Pandey 1987). The Nepal Demographic Health Survey 2011 (MoHP 2012) indicated a high prevalence of tobacco use in Nepal (52% men, 13% women). The Nepal Living Standard Survey 2011 (CBS 2011) revealed that 64.4% of Nepal’s households use firewood and 17.7% use liquefied petroleum gas (LPG), indicating a high incidence of indoor air pollution in Nepal.
Previous rounds of WHO STEPS risk factor surveillance were carried out in Nepal in three stages. The first assessment, which was conducted in 2003, was confined to Kathmandu Metropolitan City (WHO 2003). The second covered three districts (Lalitpur, Tanahun and Ilam) and included both urban and rural areas (Shres-tha 2006). The third assessment was conducted at the national level (Shrestha 2008). These three studies included only STEP I and STEP II. STEP I covers socio demographic and behavioural variables, while STEP II covers physical measurements such as height, weight, waist and hip circumference, and blood pressure. STEP III covers blood glucose and lipid profile measurement in order to assess biological risk factors. A survey was recently (2011/12) conducted in Kathmandu Metropolitan City that included biological risk factors in addition to some behavioural risk factors (Dhakal 2012); however, this survey did not follow the complete protocol for the STEP-wise surveillance of NCD risk factors.
In 2012/13, this national survey, covering all three STEPS, was carried out to determine the national preva-lence of biological and behavioural risk factors. This study is expected to reveal the national burden of NCD risk factors. The evidence generated from the current study will better equip policy makers and programme managers to develop a national action plan for the prevention and control of NCDs in Nepal.
Non Communicable Diseases Risk Factors: STEPS Survey Nepal 20132
Objectives
The general objective of this study was to assess the prevalence of NCD risk factors among different popula-tion strata in Nepal.
The specific objectives were to:
• determine the prevalence of behavioural risk factors (tobacco use, alcohol consumption, low fruit and vegetable consumption, and physical inactivity);
• measure the prevalence of biological risk factors (raised blood pressure, overweight and obesity, raised blood glucose and abnormal blood lipids); and
• assess the status of additional risk factors (indoor air pollution, oral health and dietary salt intake).
Non Communicable Diseases Risk Factors: STEPS Survey Nepal 2013 3
CHAPTER 2. METHODOLOGY
This study was designed as a cross sectional study to determine the burden of risk factors for NCDs in Nepal.
Study population
The surveyed population included men and women aged 15–69 years who had been living at their place of residence for at least six months. People with the following characteristics were not included:
• Those visiting Nepal (e.g., tourists)
• Those whose primary place of residence was in a military base or group quarters
• Those residing in hospitals, prisons, nursing homes and other institutions
• Those aged less than 15 years or more than 69 years
• Those too frail and mentally unfit to participate in the study
• Those with any physical disability
• Those unable or unwilling to give informed consent
Sample design
Sample size calculation
The sample size was calculated to represent the entire target population in Nepal. In order to achieve this statistical inference, the sample size calculator by WHO (sample_size_calculator STEPS) was used to derive a sample size of 4,200. The WHO STEPS NCD survey conducted in Nepal in 2007/08 was taken as the reference proportion (Shrestha 2008). The 2007/08 study had measured the burden of six risk factors (tobacco use, al-cohol consumption, low fruit and vegetable consumption, physical inactivity, overweight/obesity and raised blood pressure). The sample size for the present study was calculated using the prevalence of low fruit and vegetable consumption (61.9%). The details of the sample size calculation are given below:
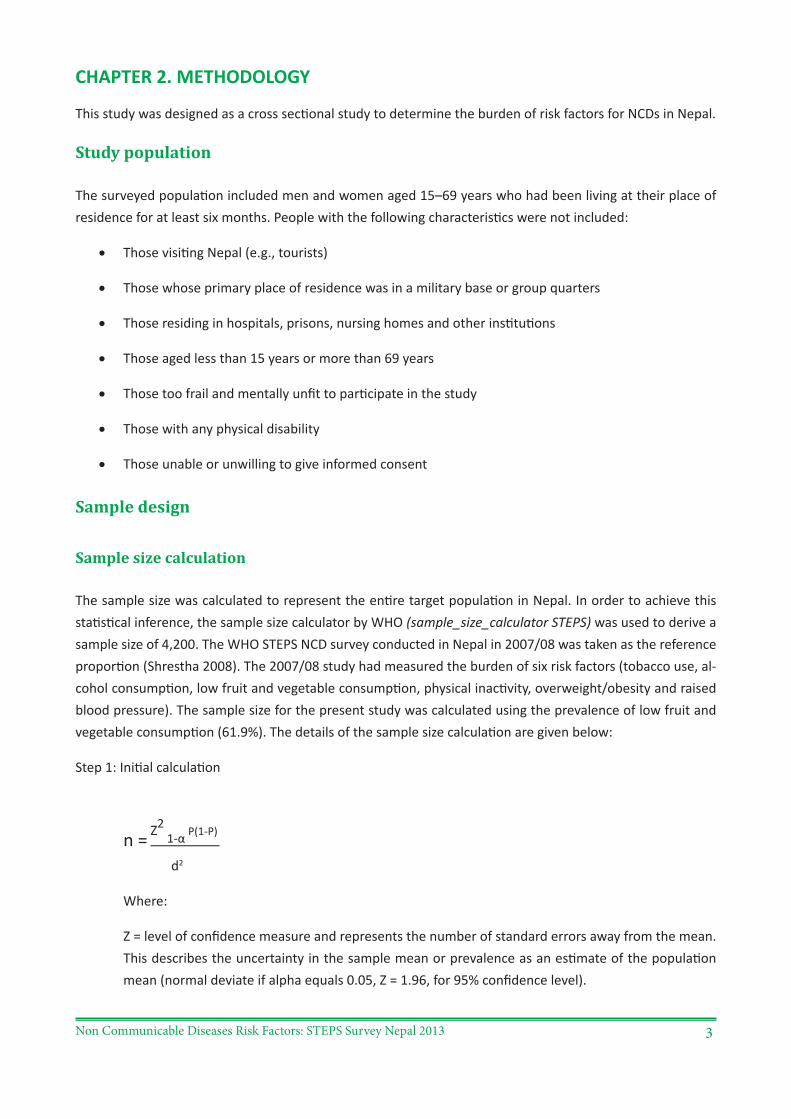
Step 1: Initial calculation
n = Z2
1-α P(1-P)
d2
Where:
Z = level of confidence measure and represents the number of standard errors away from the mean. This describes the uncertainty in the sample mean or prevalence as an estimate of the population mean (normal deviate if alpha equals 0.05, Z = 1.96, for 95% confidence level).
Non Communicable Diseases Risk Factors: STEPS Survey Nepal 20134
P = baseline level of indicators. For example, the baseline prevalence of low fruit and vegetable con-sumption is taken as 61.9%, as found in the WHO NCD STEPS survey 2007/08.
d = margin of error. This is the expected half width of the confidence interval and is taken as 0.05 for this study.
n = 1.96*1.96 {0.619 *(1-0.619)}
0.05*0.05
n = 362.3996
Step 2: Multiply by design effect (1.5) and number of domains (6). The number of domains was decided by considering three age ranges (15–29, 30–44, 45–69 years) and two sex groups (men and women). This sample size allowed the findings to be stratified into six age-sex estimates.
n = 362.3996*1.5*6 = 3261.5968
Step 3: This sample size was adjusted for the expected non response to obtain the final sample size. An 80% response rate was assumed for the study. To adjust for non response, the above sample size was divided by the expected response rate.
n= 3261.5968/0.8 = 4076.996 ~ 4,200
This gave the sample size of 4,200 individuals from the population in the 15–69 year age range.
Sampling technique
Probability proportionate to size (PPS) was applied in the sampling strategy to improve the precision of the survey estimates. The distribution of population characteristics in Nepal varies across eco-development re-gions and in urban and rural areas of the country. Topographically, the country is divided into three ecological belts that run from north to south: mountains, hills and Terai (plains). Administratively, the country is divided into 75 districts and these districts are further divided into Ilakas. The Ilakas are divided into rural areas called village development committees (VDCs) and urban municipalities. VDCs and municipalities contain smaller wards – each VDC has 9 wards and the number of wards in each municipality varies according to population distribution, ranging from 10 to 35.
Ilaka selection
Household information from each Ilaka was taken from the 2011 Census conducted by the Central Bureau of Statistics (CBS 2011). Data was also used from the Health Management Information System of the Depart-ment of Health Services Nepal, as the CBS data did not give complete information on the Ilakas. For this survey, the Ilaka was taken as the primary sampling unit (PSU). Out of the 921 Ilakas in Nepal, 159 are in the mountains, 467 in the hills and 295 in the Terai. The Steering Committee and the WHO NCD STEPS team at WHO headquarters in Geneva predetermined the number of PSUs to be taken in the study as 70. Thus, 70 Ilakas were sampled. Considering the varied distribution of the population across the ecological belts and to
Non Communicable Diseases Risk Factors: STEPS Survey Nepal 2013 5
avoid the risk of under selection of the sample from the sparsely populated mountain belt, the distribution of Ilakas across ecological belts was determined on the basis of the population distribution pattern in the eco-logical belts (mountains 7%, hills 43% and Terai 50%). Hence, 30 Ilakas were selected from the hills, 5 from the mountains and 35 from the Terai using PPS. ‘STEPS sampling enlarged 1500 PSUs’ (Microsoft Excel software) was used to select the Ilakas from all three ecological belts by considering the total number of households in each Ilaka. All of the Ilakas were listed in alphabetical order along with the number of households and cat-egorised into ecological belts. This list was then populated in the aforementioned software and the required number of Ilakas selected from each ecological belt following the instructions in the software.
Selection of clusters
For the survey, wards (sub-units of VDCs and municipalities) were considered as clusters and taken as the secondary sampling unit (SSU). Three clusters were selected from each of the sampled Ilakas using PPS. All wards for each of the selected Ilakas were listed in order according to their numeric code, then 210 wards were selected (3 wards from each of the 70 Ilakas). To select the three wards from the list, all of the wards in the Ilaka were given a unique identification number, listed in ascending order along with household size and populated in the software. The software then selected the wards randomly on the basis of PPS.
Selection of households
Twenty households were selected from each cluster using systematic sampling. Thus, a total of 4,200 house-holds were selected from the 210 clusters (20 households per cluster or ward). The sampling interval was determined by dividing the total number of households in the selected wards by 20. Prior to sampling, super-visors visited the selected wards and conducted a detailed social mapping exercise in consultation with local health workers and other key informants in the ward. Key informants consisted of female community health volunteers, local health workers such as the health facility in-charge, village health workers, the secretary of the VDC or ward committee, school teachers and any other active member who had a good understanding of the local context.
In municipalities, one ward covers a large number of households and each ward has more than 5 and some-times up to 100 streets (margs or toles). Two margs or toles were selected and ten households were selected from each of the two margs or toles using systematic random sampling. If two or more families were found living in a house, one family was selected randomly. Eligible candidates (15–69 years) from the selected household were listed according to age and sex (males first and then females, in descending order), which was then fed into the Kish program in the personal digital assistants (PDAs), which automatically randomly selected one eligible candidate from each house.
Survey instruments
The survey was conducted using the WHO NCD STEPS instrument version 2.2. The questionnaire consisted of three STEPS for measuring the NCD risk factors. STEP I includes questionnaires, STEP II includes physical measurements and STEP III includes biochemical measurements. Each step consists of a number of core, expanded and optional questions.
Non Communicable Diseases Risk Factors: STEPS Survey Nepal 20136
STEP I
Core Expanded OptionalBasic demographic information includ-ing age, sex and level of education
Years at school, ethnicity, marital status, employment status, household income
Mental health, intentional and un-intentional injury and violence, oral health and sexual behaviours
Tobacco use Smokeless tobacco useAlcohol consumption Past 7 days drinking
Fruit and vegetable consumption Oil and fat consumptionPhysical activity Objective measure of physical
activity behaviourHistory of blood pressure Treatment for raised blood pres-
sure
History of diabetes Treatment for diabetes
STEP II
Core Expanded Optional Weight and height Hip circumference Skin fold thickness, assessment of
physical fitness
Waist circumference
Blood pressure
STEP III
Core Expanded Optional
Fasting blood glucose Oral glucose tolerance test, urine examination, salivary cotinine
Total cholesterol High density lipoproteins (HDL) cholesterol and fasting triglycerides
The present study included the core and expanded questionnaire along with some of the optional modules (oral health) and additional questionnaires regarding dietary salt consumption and indoor air pollution (hous-ing and energy) for STEP I. For STEP II and III, all of the core and expanded options in the STEPS instrument were used.
The WHO NCD STEPS questionnaire was translated into Nepali and validated through a pilot study and in expert meetings. A pilot study was carried out in a community among 20 households for all three steps. Necessary changes were made to the ques-tionnaires following the pilot study. The pilot study mainly focused on identifying is-sues with the questions, their coherency and consistency. The total number of ques-tions was not changed after the pilot study. Physical measurements in STEP II were taken using the validated equipment listed in the data collection process section of
Non Communicable Diseases Risk Factors: STEPS Survey Nepal 2013 7
the WHO STEPS Surveillance Manual (WHO 2005). Height, weight, waist and hip circumference, blood pres-sure and heart rate were measured in STEP II. In STEP III, biochemical examination was carried out using the wet method. Blood glucose and lipid profile were examined after 12 hours of fasting.
In this survey, PDAs were used as a data collection tool. The PDAs had eSTEPs software installed to record the information given by the respondents and the biochemical measurements taken in STEP III. Following the completion of data collection, a final master dataset was created.
Preparation of PDAs with STEPS instrument
Before programming the instrument in the PDAs, the English version of the STEPS instrument version 2.2 was finalised for the local context by adding some additional questions. All of the core modules from this particular version along with optional modules on dietary salt, oral health, and housing and energy (indoor air pollution) were included for this survey. The translation was carried out by the technical working group of the survey and then finalised through several meetings of the technical working group and Steering Com-mittee. The Steering Committee consisted of local experts working with NCDs and their risk factors. Once the Nepalese version of the STEPS instrument was finalised, the file was sent for qml preparation (a program required for the question to be fed into the PDAs through software). The STEPS team at WHO headquarters in Geneva prepared all the qmls for every section of the instrument and, before it was finally set into the PDAs, the prepared qmls were discussed with the technical working group in Nepal. After the qmls were finalised, the STEPS team fed the instrument into the PDAs. The PDAs were then ready with the Nepalese version of the questionnaires to be used in the field. The software installed in the PDAs allowed double data storage: one copy on the machine and another on the memory card.
Questionnaire
The survey questionnaire covered the demographics and health behaviour of respondents. Demographic in-formation included date of birth (age), sex, ethnicity, marital status, years at school and primary occupation. The health behaviour covered in the questionnaire included tobacco use, alcohol consumption, fruit and veg-etable consumption, physical activity, history of raised blood pressure and raised blood glucose, oral health, dietary salt consumption, and housing and energy.
Tobacco use: Information on both forms of tobacco use – smoking and smokeless – was collected. Questions were asked to identify current users (those who had smoked or used smokeless tobacco in the past 30 days), daily users and past users. Detailed information was taken from daily users regarding their age at starting to-bacco use, frequency of use of tobacco products in a day or week, types of tobacco products used and so on. Information such as age at which the respondent stopped smoking was taken from past users. Information on passive smokers was also gathered. Pictorial cards showing different tobacco products were shown during data collection.
Alcohol consumption: Questions were asked to determine the percentage of lifetime abstainers, past 12 months abstainers and current users of alcohol. Detailed information, such as the number of standard drinks consumed and frequency of consuming standard drinks in the last 30 days, was obtained from current users. Pictorial cards showing different kinds of glasses and bowls most commonly used in Nepal were used to help
Non Communicable Diseases Risk Factors: STEPS Survey Nepal 20138
the participants recall the amount of alcohol consumed. The amount, as identified by the respondent, was then used to calculate the number of standard drinks of alcohol consumed (one standard drink contains 10 grams of ethanol).
Diet: Information was taken from respondents on the number of days that they consumed fruit and veg-etables in a typical week and the number of servings of fruit and vegetables consumed on average per day. Measurement of the amount of fruit and vegetables was aided by pictorial show cards and measuring cups (one standard serving of fruit or vegetables equals 80 grams).
Physical activity: Physical activity related to work was categorised into vigorous, moderate and low levels of activity. Vigorous physical activity was defined as any activity that causes a significant rise in heart rate and breathing rate, for example digging or ploughing fields, lifting heavy weights, etc. Continuous engagement in such activity for at least 10 minutes was considered as involvement in vigorous activity. Moderate physical ac-tivity was defined as any activity that causes a moderate increment in heart rate and breathing rate (examples include domestic chores, gardening, lifting light weights, etc.). Continuously engaging in such activity for at least 30 minutes was considered involvement in moderate activity.
Physical activity related to transport and recreation and time spent in sedentary behaviour were also as-sessed. Physical activity related to transport included travel to work or market by walking or using a bicycle. Recreational activity included two types of activities based on severity, i.e., vigorous and moderate. Vigorous recreational activity was defined as any recreational activity that causes a large increase in heart rate and breathing; for example, games such as football, fast swimming and rapid cycling. Ten minutes of such activity was considered as involvement in vigorous recreational activity. Moderate recreational activity was defined as any kind of recreational activity that causes a moderate increase in heart rate and breathing; examples include yoga and playing basketball. Sedentary behaviour was defined as a behaviour where an individual spends time sitting at a desk, sitting with friends, travelling in a car, bus or train, reading a book, and so on.
History of raised blood pressure and blood glucose: Participants were asked about their history of raised blood pressure or blood glucose and advice prescribed by a doctor to control raised blood pressure or blood glucose (such as medicines prescribed or any special diet to be followed, or advice to reduce salt intake, lose weight, stop smoking, or do more exercise).
Dietary salt: Information was obtained on knowledge, attitudes and behaviour towards dietary salt. Dietary salt includes ordinary table salt, unrefined salt such as sea salt, salty sauces and so on. Participants were also asked about the addition of salt to food just before eating and during food preparation at home, the frequen-cy of consumption of high salt processed foods and attempts to control salt intake.
Oral health: Participants were asked about the health status of their teeth and gums and reasons for visiting a dentist, if they had. They were also asked how frequently they brushed their teeth, materials used for brush-ing, use of toothpaste and physical, psychological and social problems associated with oral health problems.
Housing and energy: Information related to housing and energy (indoor air pollution) was collected by the enumerators by observing different aspects of house construction, such as the materials used for the roof, walls and floors, as well as the kitchen of the house. Questions were also asked about the fuel used for cook-ing, types of stoves used and source of lighting.
Non Communicable Diseases Risk Factors: STEPS Survey Nepal 2013 9
Physical measurements: Height and weight were measured and body mass index (BMI) calculated. Waist and hip circumference was also measured in order to determine the waist-hip ratio. Height was measured with a portable standard stature scale. For the height measurement, respondents were asked to remove footwear (shoes, slippers, sandals) and any hat or hair ties. Respondents stood on a flat surface facing the interviewer with their feet together and heels against the backboard with knees straight. They were asked to look straight ahead and not tilt their head up, making sure that their eyes were at the same level as their ears. Height was recorded in centimetres.
Weight was measured with a portable digital weighing scale (Seca, Germany). The instrument was placed on a firm, flat surface. Participants were requested to remove their footwear and socks, wear light clothes, stand on the scale with one foot on each side of the scale, face forward, place arms at their side and wait until asked to step off. Weight was recorded in kilograms.
Waist and hip circumference were measured using a constant tension tape (Seca, Germany). A private area, such as a separate room within the house, was used and the measurement was taken over light clothing. Waist circumference was taken at the end of a normal expiration with the arms relaxed at the sides at the midpoint between the lower margin of the last palpable rib and the top of the iliac crest (hip bone). Hip circumference was taken at the maximum circumference over the buttocks. Participants were requested to wrap the tape around themselves. The measurement was read at the level of the tape to the nearest 0.1 cm, making sure to keep the measuring tape snug.
Blood pressure measurement: Blood pressure was measured with a digital, automated blood pressure moni-tor (OMRON digital device) with appropriate sized cuffs. Before taking the measurements, participants were asked to sit quietly and rest for 15 minutes with legs uncrossed. Three readings of the systolic and diastolic blood pressure were obtained. Participants rested for three minutes between each reading. The mean of the second and third readings was calculated. A medium cuff size was used for all participants. The sphyg-momanometer cuff was placed on the left arm while the participant rested their forearm on a table with the palm facing upward. Participants were requested to remove or roll up clothing on the arm. The cuff was kept above the elbow aligning the mark for artery (ART) on the cuff with the brachial artery and making sure the lower edge of the cuff was placed 1.2 to 2.5 cm above the inner side of the elbow joint and with the level of the cuff at the same level as the heart. Hypertension was defined as having systolic blood pressure ≥140 mm Hg and/or diastolic blood pressure ≥90 mm Hg during the study, or being previously diagnosed as having hypertension determined by sighting documentation such as a treatment record book or by the history of the participant taking medicine for high blood pressure.
Biochemical measurements: A separate mobile laboratory setting was used by both of the data collection teams. The mobile laboratory contained all of the logistics and human resources required for the set up including a semi auto analyser and all of the chemicals required for blood glucose testing and lipid profile measurement. To ensure that the cold chain was maintained for the collected samples and for the pres-ervation of the chemicals used for the tests, continuous electricity was ensured with an electric generator and refrigerator. Furthermore, to ensure external quality control, reference laboratories were enlisted by the technical working group prior to starting the survey. The criterion for selecting the reference laboratory was a bio scientific laboratory with a fully automatic analyser. The laboratories chosen are listed in Annex VI.
Non Communicable Diseases Risk Factors: STEPS Survey Nepal 201310
Fasting samples were taken to measure blood glucose and the wet (liquid) method was used to measure blood lipids. Participants were instructed to fast overnight for 12 hours and diabetic patients on medica-tion were reminded to bring their medicine/insulin with them and take their medicine after providing the blood sample. A venous blood sample (4 ml of blood) was taken using a flashback needle with an aseptic technique and kept in plain and fluoride treated tubes. Those samples were kept in an ice pack carrier and brought to the mobile laboratory within one hour. Biochemical measurements of blood glucose and lipids were done using semi-automated procedures (Bioanalyzer, Analyticon, Germany) and commercially available kits (Analyticon, Germany). Plasma glucose was estimated using the GOD-PAP (glucose oxidase/peroxidise – phenol-4-amenophenazone) method. Serum total cholesterol was determined by an enzymatic endpoint method using the CHOD-PAP (cholesteroloxidase/peroxidase – 4-phenol-aminoantipyrine) method. Serum triglycerides were estimated using the GPO-PAP (glycerol-3-phosphate oxidase/peroxidase-4-chlorophenol and 4-aminophenazone) method. For the determination of HDL cholesterol, low-density lipoproteins and the chylomicron fraction from the serum samples were first precipitated out. The clear supernatant was then analysed using the method described above for cholesterol. External quality control of these biochemical investigations was performed by sending 10% of the samples to the nearest reference laboratory with stan-dardised fully-automated procedures for biochemical measurement.
Data collection procedure
Training of data collection team
A week-long training was organised in the two weeks prior to the beginning of data collection. The training was led by a STEPS team from WHO headquarters, Geneva and WHO SEARO, New Delhi. The local investigator team also joined the STEPS team as trainers. Prior to the training, the enumerators were oriented on the tools to be used to collect the data. Training focused on interview techniques, sampling process, household and individual selection, the use of the different kinds of templates and forms in the survey, the use and care of PDAs, a detailed explanation of the questionnaire and the technique to be used for physical measurements. The supervisors were also trained on downloading data from the PDAs as well as the management of minor issues with the PDAs.
Data collection technique
Data were collected using the WHO STEPS instruments by trained data collectors. Prior to data collection, each data collector developed a sampling frame for the SSU (ward/cluster) by obtaining an updated list of the households and/or performing clear social mapping with proper identification of households. Selected households were followed up at least twice in case of unavailability of the respondent on the first visit. A re-spondent who could not be contacted even after the second attempt was counted as a non-response. In the case of more than one household (family) living in a single house, one was randomly selected and the Kish method adapted to select one eligible participant from that household.
Data collection was spread over three phases, namely, initial contact with the participant, completing the questionnaire and taking physical measurements, and collecting blood samples for biochemical measure-ment. The participants were requested to give 45–60 minutes of their time for completion of STEPS I and STEP II and an additional 5 minutes for collecting the blood sample.
Non Communicable Diseases Risk Factors: STEPS Survey Nepal 2013 11
In most instances, data collection from a selected participant was completed in 2–3 days. On the first day, all eligible participants in the selected household were listed and one participant selected using the Kish method. An interview tracking form was completed to record brief information about the respondent. If a selected participant was present on that visit, s/he was requested to participate in the study and asked for consent. Once the consent was obtained, the STEP I and II questionnaire was completed. If s/he was not at home, a second visit was made. After completing STEPS I and II, participants were given a feedback form. This form included information on their height, weight, hip and waist circumferences, blood pressure (third read-ing) and heart rate (third reading). A clinic card was also given to every participant for biochemical measure-ment containing fasting instruction. This card also contained the appointment date, time and place for blood sample collection. On the given date and time, the laboratory technician/enumerators drew blood samples from the participants and biochemical measurements were done in the mobile laboratory.
Field management
The field manpower for data collection comprised 26 individuals divided into 2 teams. Each team consisted of one field supervisor, one medical laboratory technologist, one laboratory technician and ten enumera-tors. Enumerators had an academic background either in nursing, general medicine or public health. Their major responsibility was to fill out the questionnaires, carry out physical measurements and collect blood samples. The laboratory technicians were appointed for cold chain maintenance, sample processing, and the recording and reporting of biochemical measurements. Medical laboratory technologists were responsible for examining and verifying glucose levels and the value of the lipid profile and sending a 10% blood sample to the reference laboratory for external quality control. A field supervisor was appointed as a team leader for overall field management and to coordinate with respective authorities at the field level, ensure completion of sampling frames, and select 20 households from each cluster as per the sample design. Furthermore, field supervisors also carried out on-the-spot checks of information collected by enumerators to ensure the quality of data. The field supervisors were responsible for aggregating the data from individual PDAs to their laptop and forwarding them to the centre via email or by handing them over to the investigators.
Quality control
This study adopted the validated WHO STEPS instrument version 2.2. The English version of the instrument was translated into Nepali and survey results translated back into English. Before finalisation of the Nepali version, a pilot study was conducted in the Kirtipur Municipality with 20 people with a wide range of socio-demographic backgrounds. At the end of data collection, participants’ feedback was obtained and all the comments compiled into a single report and used to refine the instrument. The revised instrument in Nepali was endorsed by the Steering Committee prior to use in the field.
Physical measurement was done using validated equipment, strictly following the WHO procedure for per-forming the various measurements. Blood pressure was measured using digital, automatic blood pressure monitors (OMRON) with appropriate sized cuffs. Height was measured using a portable standard stature scale and waist and hip circumference were measured with a constant tension tape (Seca, Germany).
Regarding biochemical measurements, blood glucose and blood lipids were measured by the wet method for which a semi autoanalyser from Analyticon company, Germany was used. The device was calibrated by
Non Communicable Diseases Risk Factors: STEPS Survey Nepal 201312
standard and quality control sera prior to testing the blood sample to ensure consistency and accuracy. Prior to taking participant samples, a control sample was run daily to determine the reliability of the result. For external quality control, 10% of the tested samples were randomly selected and sent to the nearest reference laboratory for re-testing. The Executive Chairman of the NHRC, the consultant pathologist of the study team, investigators, and representatives from WHO and the Ministry of Health and Population visited the field to monitor the data collection to ensure that standard quality procedures were followed.
Data processing and analysis
eSTEPs software was used to design and program the data collection tools in the PDAs. The use of the soft-ware and PDAs to collect the data helped to generate the final dataset quickly following the completion of data collection. The collected datasets were stored in the device as well as the memory card in rml format. The rml files from the PDAs were transferred to personal computers via the Windows Mobile Device Center. The files were then transferred to a central computer, the format changed to Microsoft Excel and the files stored. The datasets from every individual PDA were then transferred to SPSS 16.0 and merged into a single SPSS file. Data cleaning and editing was done in the SPSS file. Analysis was done with Epi Info version 3.5.1 us-ing prior developed analysis commands. From the data download until the final analysis, continuous technical support was received from the STEPS team at WHO headquarters, Geneva via email as well as teleconference. Once the final dataset with complete and thoroughly cleaned data from all the study sites was ready, a team of investigators analysed the data under the guidance of the STEPS team at WHO Western Pacific Regional Office, Manila in a week-long data analysis workshop. Following the analysis, a data book was produced for the survey and, based on that data book, report writing was undertaken including interpretation.
Individual weight
To calculate the sampling weight of each of the sampling levels the probability of selection of each of the sam-pling units was calculated (see sections below). The individual probability of each sampling level was calcu-lated and the inverse of the individual probability was considered as the weight of the individual household. The probability of selection was calculated using the sampling software designed for NCD risk factor STEPS survey by WHO headquarters, Geneva.
Probability of selection of primary sampling units
The probability of selection of each of the PSUs (Ilakas) from the mountains, hills and Terai was used from separate files, as Ilakas were selected from these three different strata. The probability of selection was ob-tained from a separate frame of Ilakas for each of the ecological belts. The total household size of each Ilaka within each ecological belt was considered to calculate the probability of selection of each of the selected Ilakas. The probability thus obtained for selection of PSUs was denominated as P1.
Probability of selection of secondary sampling units
Within each of the 70 selected Ilakas the total list of wards (SSUs) with their household size was used to ob-tain the desired number of SSUs (3 wards each), as discussed in the sampling technique; this also gave us the probability of selection of each of the selected SSUs. The total list of SSUs of the selected Ilakas from each ecological belt was populated in the Excel sheet with the total number of households within that SSU. Follow-
Non Communicable Diseases Risk Factors: STEPS Survey Nepal 2013 13
ing that, the required number of SSUs was chosen from the abovementioned software from each of the Ilakas (PSUs), which also gave us the probability of selection of each of the SSUs. The probability thus obtained for selection of SSUs was denominated as P2.
Households
Within each of the selected SSUs (clusters/wards) the probability of selection of each individual household was obtained by dividing the number of households selected for the study by the total number of households within that selected ward. In this case the number of households selected from each ward was 20. The prob-ability thus obtained for selection of households was denominated as P3.
Calculating the total probability
The product of P1 to P3 gave us the total probability, i.e., the probability up to the level of household. The inverse of the total probability thus gave us the weight up to the household level.
Finally, to calculate the weight for correcting the age sex proportion, the proportion of the population in the six age sex groups (15–29, 30–44, 45–69 for men and women) was taken from the 2011 Census. The propor-tion of these six age sex groups in the sample was also taken and divided by the census proportion, which gave the weight for each of the six age sex groups and was applied to every individual. The final product of the weight calculated above was then multiplied with this weight for each age sex group to obtain the final weight, which was applied for the weighted analysis.
In addition to the use of this weighted variable, complex sample analysis was done using the PSU and stratum vari-able. The PSU variable was the 210 wards and the stratum variable was the ecological belt (mountains, hills and Terai). The weighted analysis was done using the individual weight using the prior developed weighted analy-sis commands in the Epi Info 3.5.1.
Ethical considerations
This study was approved by the ethical review board of the Nepal Health Research Council. Formal permission was taken from the concerned authorities in the selected districts, VDCs and municipalities. An informed writ-ten consent was obtained from all the participants. The objectives of the research were explained in simple language and participants were also provided with an information sheet containing the research objectives, data collection method, role of participants, and personal and community benefits, as well as any possible harm to the participant. A participant feedback form was also provided to all participants after taking their physical and biochemical measurements. The confidentiality of the information gathered was maintained. Any waste generated during the laboratory procedures was properly disinfected using aseptic techniques and safely disposed of. All blood samples were discarded after completing the biochemical measurements.
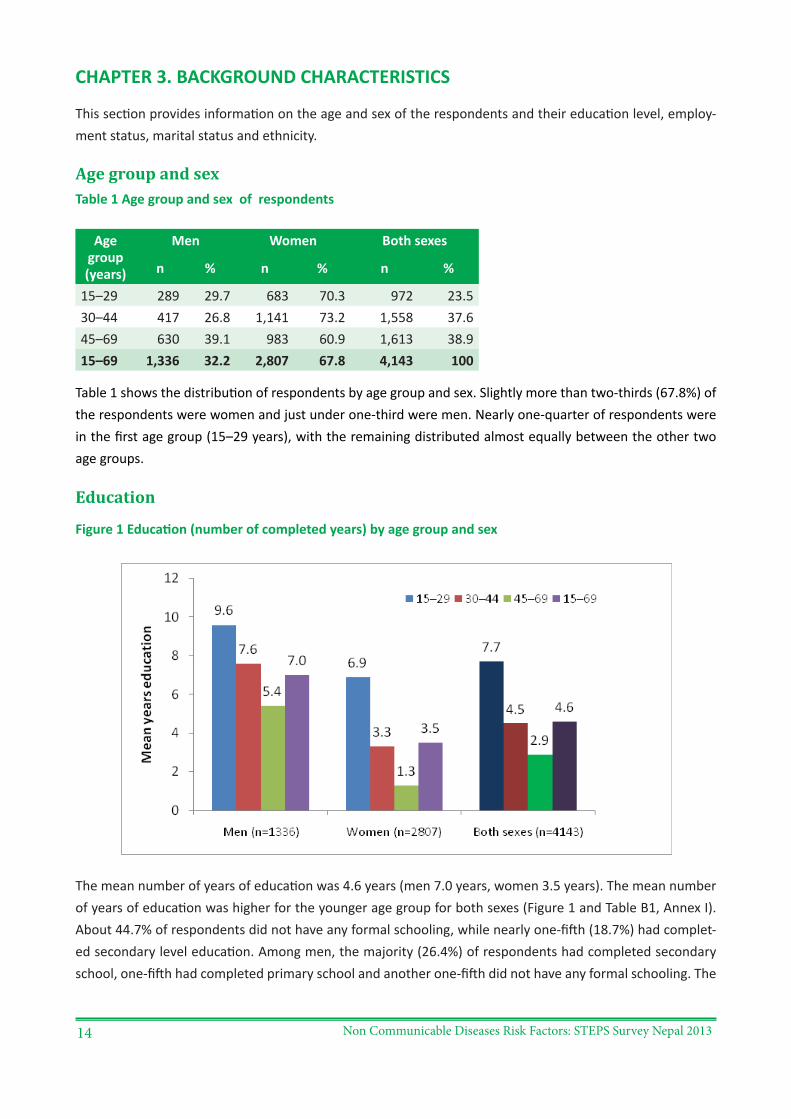
Non Communicable Diseases Risk Factors: STEPS Survey Nepal 201314
CHAPTER 3. BACKGROUND CHARACTERISTICS
This section provides information on the age and sex of the respondents and their education level, employ-ment status, marital status and ethnicity.
Age group and sexTable 1 Age group and sex of respondents
Age group (years)
Men Women Both sexes
n % n % n %
15–29 289 29.7 683 70.3 972 23.530–44 417 26.8 1,141 73.2 1,558 37.645–69 630 39.1 983 60.9 1,613 38.915–69 1,336 32.2 2,807 67.8 4,143 100
Table 1 shows the distribution of respondents by age group and sex. Slightly more than two-thirds (67.8%) of the respondents were women and just under one-third were men. Nearly one-quarter of respondents were in the first age group (15–29 years), with the remaining distributed almost equally between the other two age groups.
Education
Figure 1 Education (number of completed years) by age group and sex
The mean number of years of education was 4.6 years (men 7.0 years, women 3.5 years). The mean number of years of education was higher for the younger age group for both sexes (Figure 1 and Table B1, Annex I). About 44.7% of respondents did not have any formal schooling, while nearly one-fifth (18.7%) had complet-ed secondary level education. Among men, the majority (26.4%) of respondents had completed secondary school, one-fifth had completed primary school and another one-fifth did not have any formal schooling. The
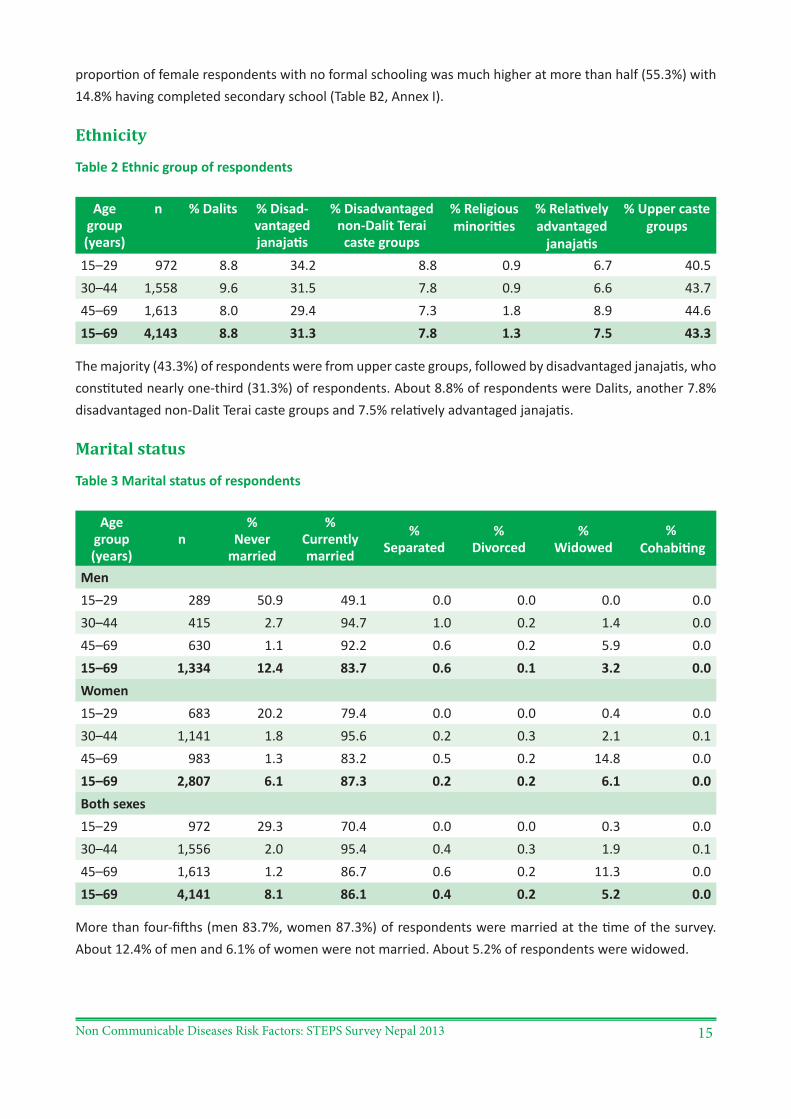
Non Communicable Diseases Risk Factors: STEPS Survey Nepal 2013 15
proportion of female respondents with no formal schooling was much higher at more than half (55.3%) with 14.8% having completed secondary school (Table B2, Annex I).
Ethnicity
Table 2 Ethnic group of respondents
Age group (years)
n % Dalits % Disad-vantaged janajatis
% Disadvantaged non-Dalit Terai
caste groups
% Religious minorities
% Relatively advantaged
janajatis
% Upper caste groups
15–29 972 8.8 34.2 8.8 0.9 6.7 40.530–44 1,558 9.6 31.5 7.8 0.9 6.6 43.745–69 1,613 8.0 29.4 7.3 1.8 8.9 44.615–69 4,143 8.8 31.3 7.8 1.3 7.5 43.3
The majority (43.3%) of respondents were from upper caste groups, followed by disadvantaged janajatis, who constituted nearly one-third (31.3%) of respondents. About 8.8% of respondents were Dalits, another 7.8% disadvantaged non-Dalit Terai caste groups and 7.5% relatively advantaged janajatis.
Marital status
Table 3 Marital status of respondents
Age group (years)
n%
Never married
% Currently married
% Separated
% Divorced
% Widowed
% Cohabiting
Men15–29 289 50.9 49.1 0.0 0.0 0.0 0.030–44 415 2.7 94.7 1.0 0.2 1.4 0.045–69 630 1.1 92.2 0.6 0.2 5.9 0.015–69 1,334 12.4 83.7 0.6 0.1 3.2 0.0Women15–29 683 20.2 79.4 0.0 0.0 0.4 0.030–44 1,141 1.8 95.6 0.2 0.3 2.1 0.145–69 983 1.3 83.2 0.5 0.2 14.8 0.015–69 2,807 6.1 87.3 0.2 0.2 6.1 0.0Both sexes15–29 972 29.3 70.4 0.0 0.0 0.3 0.030–44 1,556 2.0 95.4 0.4 0.3 1.9 0.145–69 1,613 1.2 86.7 0.6 0.2 11.3 0.015–69 4,141 8.1 86.1 0.4 0.2 5.2 0.0
More than four-fifths (men 83.7%, women 87.3%) of respondents were married at the time of the survey. About 12.4% of men and 6.1% of women were not married. About 5.2% of respondents were widowed.
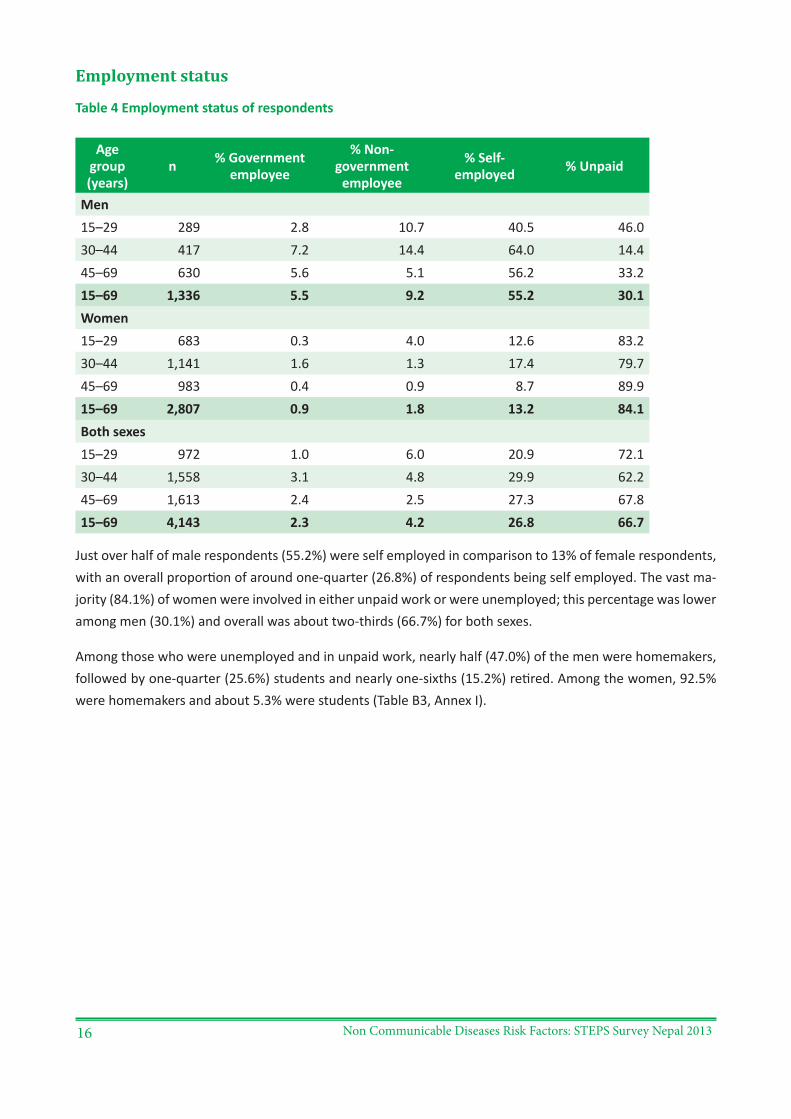
Non Communicable Diseases Risk Factors: STEPS Survey Nepal 201316
Employment status
Table 4 Employment status of respondents
Age group (years)
n % Government employee
% Non- government
employee
% Self- employed % Unpaid
Men15–29 289 2.8 10.7 40.5 46.030–44 417 7.2 14.4 64.0 14.445–69 630 5.6 5.1 56.2 33.215–69 1,336 5.5 9.2 55.2 30.1Women15–29 683 0.3 4.0 12.6 83.230–44 1,141 1.6 1.3 17.4 79.745–69 983 0.4 0.9 8.7 89.915–69 2,807 0.9 1.8 13.2 84.1Both sexes15–29 972 1.0 6.0 20.9 72.130–44 1,558 3.1 4.8 29.9 62.245–69 1,613 2.4 2.5 27.3 67.815–69 4,143 2.3 4.2 26.8 66.7
Just over half of male respondents (55.2%) were self employed in comparison to 13% of female respondents, with an overall proportion of around one-quarter (26.8%) of respondents being self employed. The vast ma-jority (84.1%) of women were involved in either unpaid work or were unemployed; this percentage was lower among men (30.1%) and overall was about two-thirds (66.7%) for both sexes.
Among those who were unemployed and in unpaid work, nearly half (47.0%) of the men were homemakers, followed by one-quarter (25.6%) students and nearly one-sixths (15.2%) retired. Among the women, 92.5% were homemakers and about 5.3% were students (Table B3, Annex I).
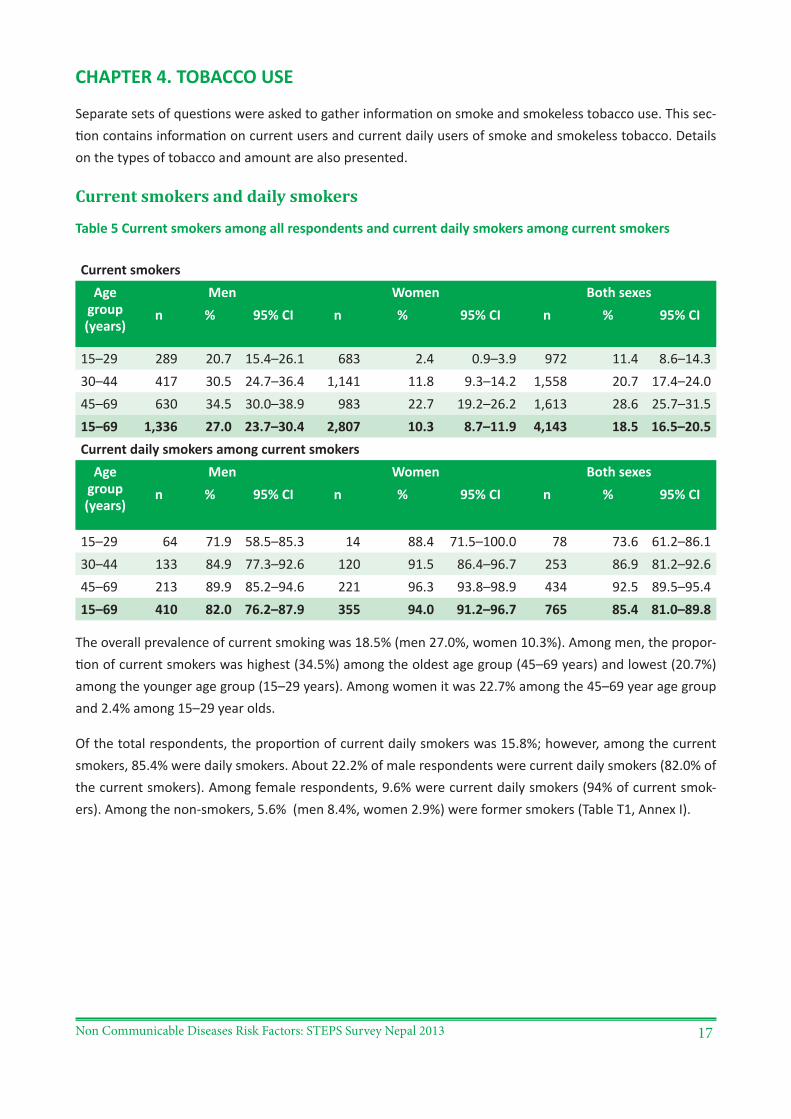
Non Communicable Diseases Risk Factors: STEPS Survey Nepal 2013 17
CHAPTER 4. TOBACCO USE
Separate sets of questions were asked to gather information on smoke and smokeless tobacco use. This sec-tion contains information on current users and current daily users of smoke and smokeless tobacco. Details on the types of tobacco and amount are also presented.
Current smokers and daily smokers
Table 5 Current smokers among all respondents and current daily smokers among current smokers
Current smokersAge
group (years)
Men Women Both sexesn % 95% CI n % 95% CI n % 95% CI
15–29 289 20.7 15.4–26.1 683 2.4 0.9–3.9 972 11.4 8.6–14.330–44 417 30.5 24.7–36.4 1,141 11.8 9.3–14.2 1,558 20.7 17.4–24.045–69 630 34.5 30.0–38.9 983 22.7 19.2–26.2 1,613 28.6 25.7–31.515–69 1,336 27.0 23.7–30.4 2,807 10.3 8.7–11.9 4,143 18.5 16.5–20.5Current daily smokers among current smokers
Age group (years)
Men Women Both sexesn % 95% CI n % 95% CI n % 95% CI
15–29 64 71.9 58.5–85.3 14 88.4 71.5–100.0 78 73.6 61.2–86.130–44 133 84.9 77.3–92.6 120 91.5 86.4–96.7 253 86.9 81.2–92.645–69 213 89.9 85.2–94.6 221 96.3 93.8–98.9 434 92.5 89.5–95.415–69 410 82.0 76.2–87.9 355 94.0 91.2–96.7 765 85.4 81.0–89.8
The overall prevalence of current smoking was 18.5% (men 27.0%, women 10.3%). Among men, the propor-tion of current smokers was highest (34.5%) among the oldest age group (45–69 years) and lowest (20.7%) among the younger age group (15–29 years). Among women it was 22.7% among the 45–69 year age group and 2.4% among 15–29 year olds.
Of the total respondents, the proportion of current daily smokers was 15.8%; however, among the current smokers, 85.4% were daily smokers. About 22.2% of male respondents were current daily smokers (82.0% of the current smokers). Among female respondents, 9.6% were current daily smokers (94% of current smok-ers). Among the non-smokers, 5.6% (men 8.4%, women 2.9%) were former smokers (Table T1, Annex I).
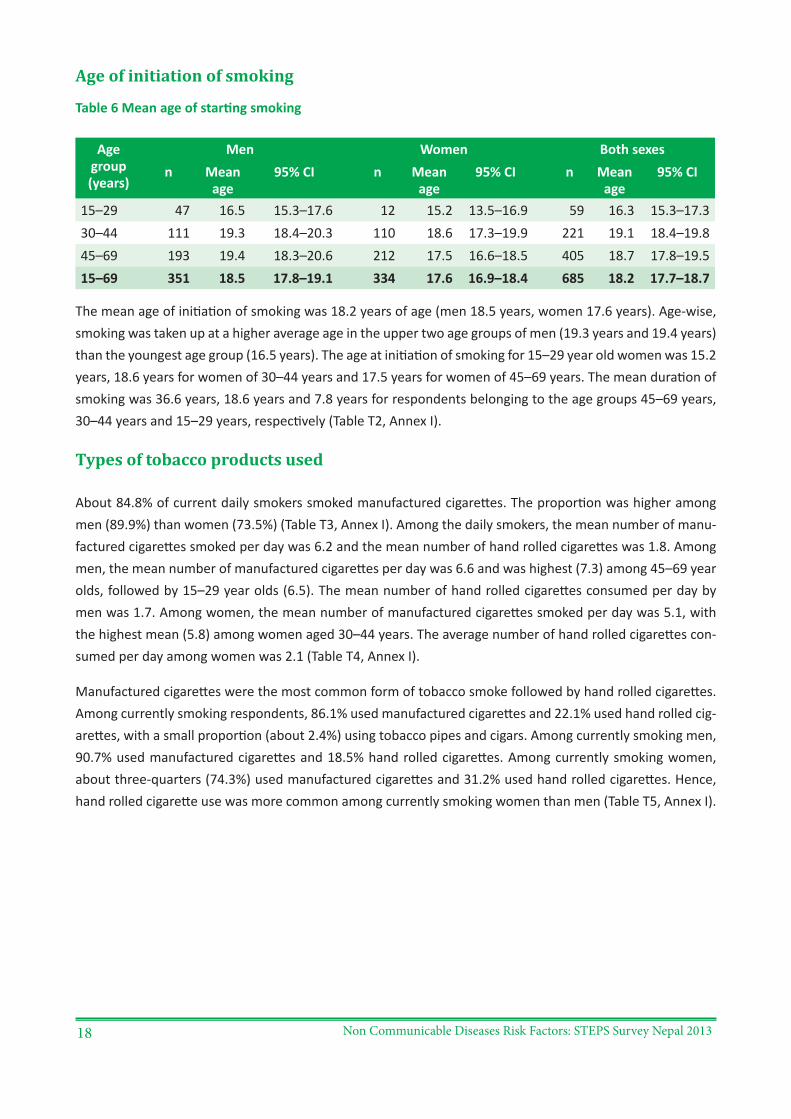
Non Communicable Diseases Risk Factors: STEPS Survey Nepal 201318
Age of initiation of smoking
Table 6 Mean age of starting smoking
Age group (years)
Men Women Both sexesn Mean
age95% CI n Mean
age95% CI n Mean
age95% CI
15–29 47 16.5 15.3–17.6 12 15.2 13.5–16.9 59 16.3 15.3–17.330–44 111 19.3 18.4–20.3 110 18.6 17.3–19.9 221 19.1 18.4–19.845–69 193 19.4 18.3–20.6 212 17.5 16.6–18.5 405 18.7 17.8–19.515–69 351 18.5 17.8–19.1 334 17.6 16.9–18.4 685 18.2 17.7–18.7
The mean age of initiation of smoking was 18.2 years of age (men 18.5 years, women 17.6 years). Age-wise, smoking was taken up at a higher average age in the upper two age groups of men (19.3 years and 19.4 years) than the youngest age group (16.5 years). The age at initiation of smoking for 15–29 year old women was 15.2 years, 18.6 years for women of 30–44 years and 17.5 years for women of 45–69 years. The mean duration of smoking was 36.6 years, 18.6 years and 7.8 years for respondents belonging to the age groups 45–69 years, 30–44 years and 15–29 years, respectively (Table T2, Annex I).
Types of tobacco products used
About 84.8% of current daily smokers smoked manufactured cigarettes. The proportion was higher among men (89.9%) than women (73.5%) (Table T3, Annex I). Among the daily smokers, the mean number of manu-factured cigarettes smoked per day was 6.2 and the mean number of hand rolled cigarettes was 1.8. Among men, the mean number of manufactured cigarettes per day was 6.6 and was highest (7.3) among 45–69 year olds, followed by 15–29 year olds (6.5). The mean number of hand rolled cigarettes consumed per day by men was 1.7. Among women, the mean number of manufactured cigarettes smoked per day was 5.1, with the highest mean (5.8) among women aged 30–44 years. The average number of hand rolled cigarettes con-sumed per day among women was 2.1 (Table T4, Annex I).
Manufactured cigarettes were the most common form of tobacco smoke followed by hand rolled cigarettes. Among currently smoking respondents, 86.1% used manufactured cigarettes and 22.1% used hand rolled cig-arettes, with a small proportion (about 2.4%) using tobacco pipes and cigars. Among currently smoking men, 90.7% used manufactured cigarettes and 18.5% hand rolled cigarettes. Among currently smoking women, about three-quarters (74.3%) used manufactured cigarettes and 31.2% used hand rolled cigarettes. Hence, hand rolled cigarette use was more common among currently smoking women than men (Table T5, Annex I).
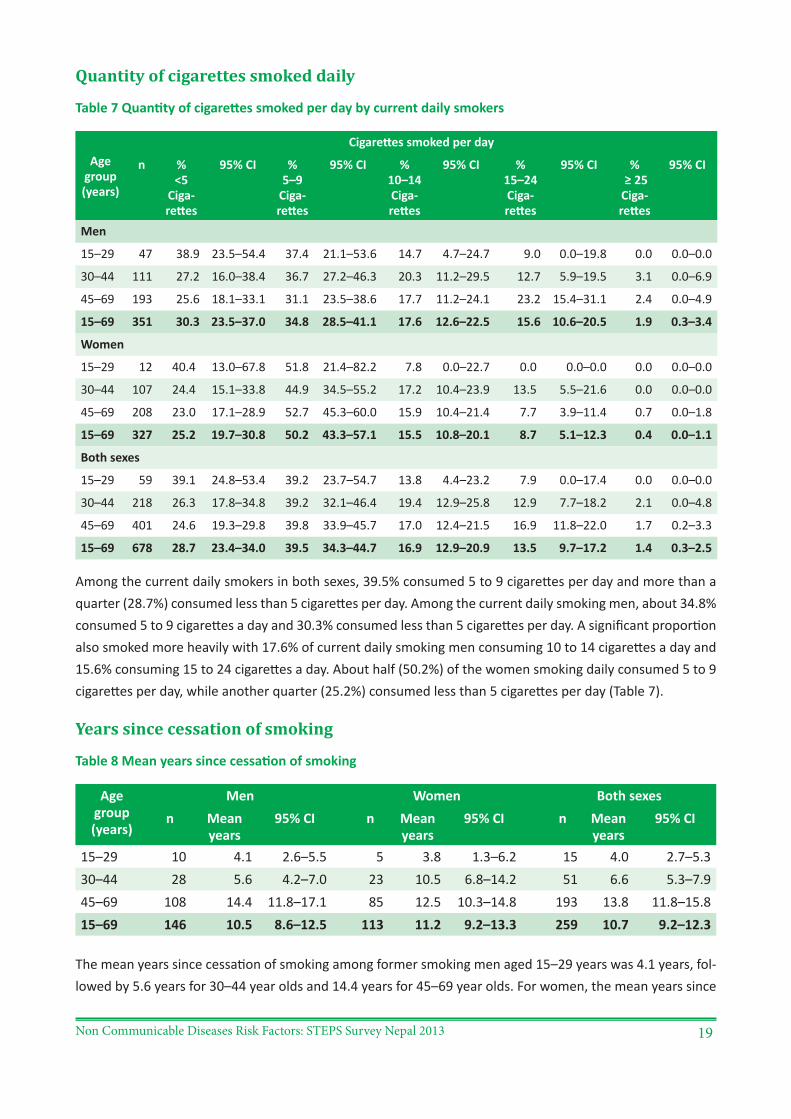
Non Communicable Diseases Risk Factors: STEPS Survey Nepal 2013 19
Quantity of cigarettes smoked daily
Table 7 Quantity of cigarettes smoked per day by current daily smokers
Age group (years)
Cigarettes smoked per day
n % <5
Ciga-rettes
95% CI % 5–9
Ciga-rettes
95% CI % 10–14 Ciga-rettes
95% CI % 15–24 Ciga-rettes
95% CI % ≥ 25 Ciga-rettes
95% CI
Men
15–29 47 38.9 23.5–54.4 37.4 21.1–53.6 14.7 4.7–24.7 9.0 0.0–19.8 0.0 0.0–0.0
30–44 111 27.2 16.0–38.4 36.7 27.2–46.3 20.3 11.2–29.5 12.7 5.9–19.5 3.1 0.0–6.9
45–69 193 25.6 18.1–33.1 31.1 23.5–38.6 17.7 11.2–24.1 23.2 15.4–31.1 2.4 0.0–4.9
15–69 351 30.3 23.5–37.0 34.8 28.5–41.1 17.6 12.6–22.5 15.6 10.6–20.5 1.9 0.3–3.4
Women
15–29 12 40.4 13.0–67.8 51.8 21.4–82.2 7.8 0.0–22.7 0.0 0.0–0.0 0.0 0.0–0.0
30–44 107 24.4 15.1–33.8 44.9 34.5–55.2 17.2 10.4–23.9 13.5 5.5–21.6 0.0 0.0–0.0
45–69 208 23.0 17.1–28.9 52.7 45.3–60.0 15.9 10.4–21.4 7.7 3.9–11.4 0.7 0.0–1.8
15–69 327 25.2 19.7–30.8 50.2 43.3–57.1 15.5 10.8–20.1 8.7 5.1–12.3 0.4 0.0–1.1
Both sexes
15–29 59 39.1 24.8–53.4 39.2 23.7–54.7 13.8 4.4–23.2 7.9 0.0–17.4 0.0 0.0–0.0
30–44 218 26.3 17.8–34.8 39.2 32.1–46.4 19.4 12.9–25.8 12.9 7.7–18.2 2.1 0.0–4.8
45–69 401 24.6 19.3–29.8 39.8 33.9–45.7 17.0 12.4–21.5 16.9 11.8–22.0 1.7 0.2–3.3
15–69 678 28.7 23.4–34.0 39.5 34.3–44.7 16.9 12.9–20.9 13.5 9.7–17.2 1.4 0.3–2.5
Among the current daily smokers in both sexes, 39.5% consumed 5 to 9 cigarettes per day and more than a quarter (28.7%) consumed less than 5 cigarettes per day. Among the current daily smoking men, about 34.8% consumed 5 to 9 cigarettes a day and 30.3% consumed less than 5 cigarettes per day. A significant proportion also smoked more heavily with 17.6% of current daily smoking men consuming 10 to 14 cigarettes a day and 15.6% consuming 15 to 24 cigarettes a day. About half (50.2%) of the women smoking daily consumed 5 to 9 cigarettes per day, while another quarter (25.2%) consumed less than 5 cigarettes per day (Table 7).
Years since cessation of smoking
Table 8 Mean years since cessation of smoking
Age group (years)
Men Women Both sexesn Mean
years95% CI n Mean
years95% CI n Mean
years95% CI
15–29 10 4.1 2.6–5.5 5 3.8 1.3–6.2 15 4.0 2.7–5.330–44 28 5.6 4.2–7.0 23 10.5 6.8–14.2 51 6.6 5.3–7.945–69 108 14.4 11.8–17.1 85 12.5 10.3–14.8 193 13.8 11.8–15.815–69 146 10.5 8.6–12.5 113 11.2 9.2–13.3 259 10.7 9.2–12.3
The mean years since cessation of smoking among former smoking men aged 15–29 years was 4.1 years, fol-lowed by 5.6 years for 30–44 year olds and 14.4 years for 45–69 year olds. For women, the mean years since
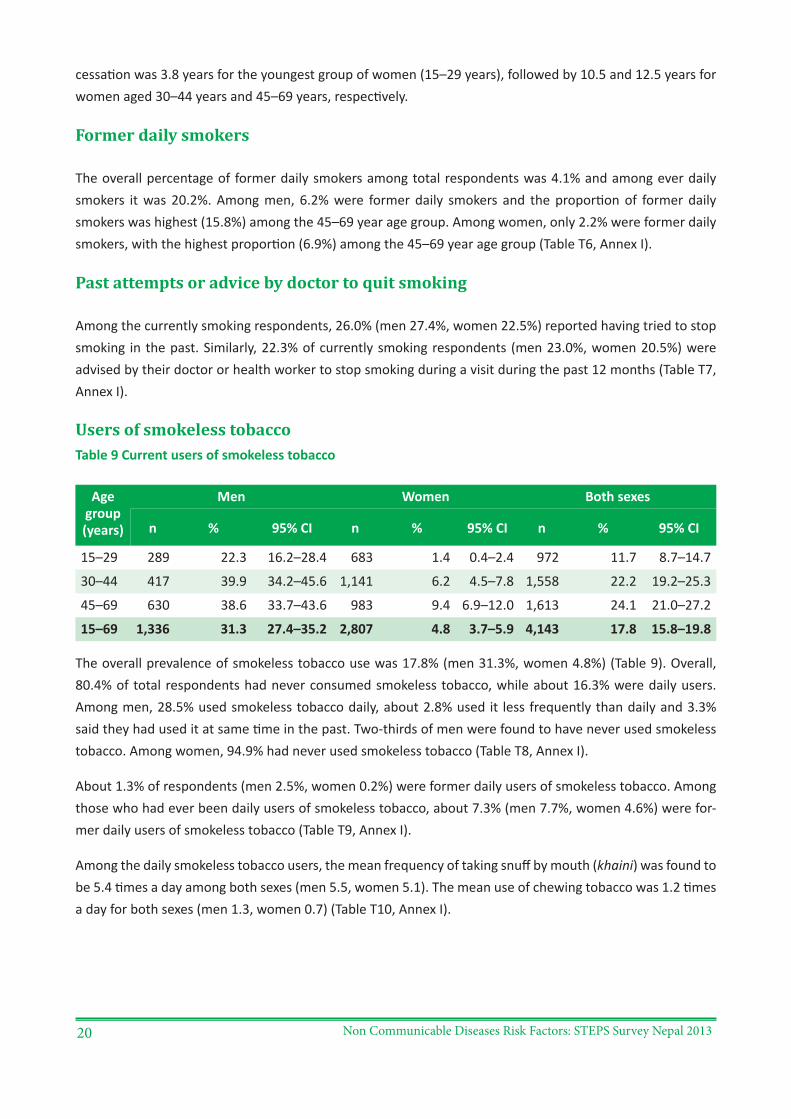
Non Communicable Diseases Risk Factors: STEPS Survey Nepal 201320
cessation was 3.8 years for the youngest group of women (15–29 years), followed by 10.5 and 12.5 years for women aged 30–44 years and 45–69 years, respectively.
Former daily smokers
The overall percentage of former daily smokers among total respondents was 4.1% and among ever daily smokers it was 20.2%. Among men, 6.2% were former daily smokers and the proportion of former daily smokers was highest (15.8%) among the 45–69 year age group. Among women, only 2.2% were former daily smokers, with the highest proportion (6.9%) among the 45–69 year age group (Table T6, Annex I).
Past attempts or advice by doctor to quit smoking
Among the currently smoking respondents, 26.0% (men 27.4%, women 22.5%) reported having tried to stop smoking in the past. Similarly, 22.3% of currently smoking respondents (men 23.0%, women 20.5%) were advised by their doctor or health worker to stop smoking during a visit during the past 12 months (Table T7, Annex I).
Users of smokeless tobaccoTable 9 Current users of smokeless tobacco
Age group (years)
Men Women Both sexes
n % 95% CI n % 95% CI n % 95% CI
15–29 289 22.3 16.2–28.4 683 1.4 0.4–2.4 972 11.7 8.7–14.7
30–44 417 39.9 34.2–45.6 1,141 6.2 4.5–7.8 1,558 22.2 19.2–25.3
45–69 630 38.6 33.7–43.6 983 9.4 6.9–12.0 1,613 24.1 21.0–27.2
15–69 1,336 31.3 27.4–35.2 2,807 4.8 3.7–5.9 4,143 17.8 15.8–19.8
The overall prevalence of smokeless tobacco use was 17.8% (men 31.3%, women 4.8%) (Table 9). Overall, 80.4% of total respondents had never consumed smokeless tobacco, while about 16.3% were daily users. Among men, 28.5% used smokeless tobacco daily, about 2.8% used it less frequently than daily and 3.3% said they had used it at same time in the past. Two-thirds of men were found to have never used smokeless tobacco. Among women, 94.9% had never used smokeless tobacco (Table T8, Annex I).
About 1.3% of respondents (men 2.5%, women 0.2%) were former daily users of smokeless tobacco. Among those who had ever been daily users of smokeless tobacco, about 7.3% (men 7.7%, women 4.6%) were for-mer daily users of smokeless tobacco (Table T9, Annex I).
Among the daily smokeless tobacco users, the mean frequency of taking snuff by mouth (khaini) was found to be 5.4 times a day among both sexes (men 5.5, women 5.1). The mean use of chewing tobacco was 1.2 times a day for both sexes (men 1.3, women 0.7) (Table T10, Annex I).
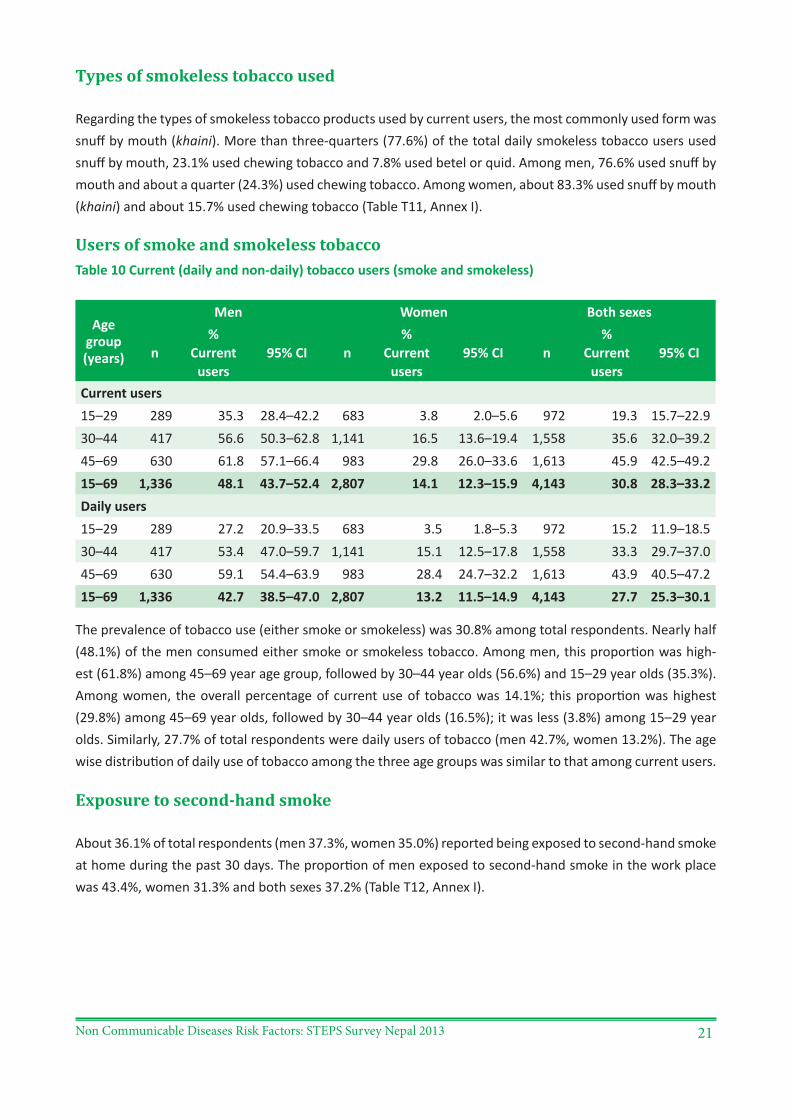
Non Communicable Diseases Risk Factors: STEPS Survey Nepal 2013 21
Types of smokeless tobacco used
Regarding the types of smokeless tobacco products used by current users, the most commonly used form was snuff by mouth (khaini). More than three-quarters (77.6%) of the total daily smokeless tobacco users used snuff by mouth, 23.1% used chewing tobacco and 7.8% used betel or quid. Among men, 76.6% used snuff by mouth and about a quarter (24.3%) used chewing tobacco. Among women, about 83.3% used snuff by mouth (khaini) and about 15.7% used chewing tobacco (Table T11, Annex I).
Users of smoke and smokeless tobaccoTable 10 Current (daily and non-daily) tobacco users (smoke and smokeless)
Age group (years)
Men Women Both sexes
n%
Current users
95% CI n%
Current users
95% CI n%
Current users
95% CI
Current users15–29 289 35.3 28.4–42.2 683 3.8 2.0–5.6 972 19.3 15.7–22.930–44 417 56.6 50.3–62.8 1,141 16.5 13.6–19.4 1,558 35.6 32.0–39.245–69 630 61.8 57.1–66.4 983 29.8 26.0–33.6 1,613 45.9 42.5–49.215–69 1,336 48.1 43.7–52.4 2,807 14.1 12.3–15.9 4,143 30.8 28.3–33.2Daily users15–29 289 27.2 20.9–33.5 683 3.5 1.8–5.3 972 15.2 11.9–18.530–44 417 53.4 47.0–59.7 1,141 15.1 12.5–17.8 1,558 33.3 29.7–37.045–69 630 59.1 54.4–63.9 983 28.4 24.7–32.2 1,613 43.9 40.5–47.215–69 1,336 42.7 38.5–47.0 2,807 13.2 11.5–14.9 4,143 27.7 25.3–30.1
The prevalence of tobacco use (either smoke or smokeless) was 30.8% among total respondents. Nearly half (48.1%) of the men consumed either smoke or smokeless tobacco. Among men, this proportion was high-est (61.8%) among 45–69 year age group, followed by 30–44 year olds (56.6%) and 15–29 year olds (35.3%). Among women, the overall percentage of current use of tobacco was 14.1%; this proportion was highest (29.8%) among 45–69 year olds, followed by 30–44 year olds (16.5%); it was less (3.8%) among 15–29 year olds. Similarly, 27.7% of total respondents were daily users of tobacco (men 42.7%, women 13.2%). The age wise distribution of daily use of tobacco among the three age groups was similar to that among current users.
Exposure to second-hand smoke
About 36.1% of total respondents (men 37.3%, women 35.0%) reported being exposed to second-hand smoke at home during the past 30 days. The proportion of men exposed to second-hand smoke in the work place was 43.4%, women 31.3% and both sexes 37.2% (Table T12, Annex I).
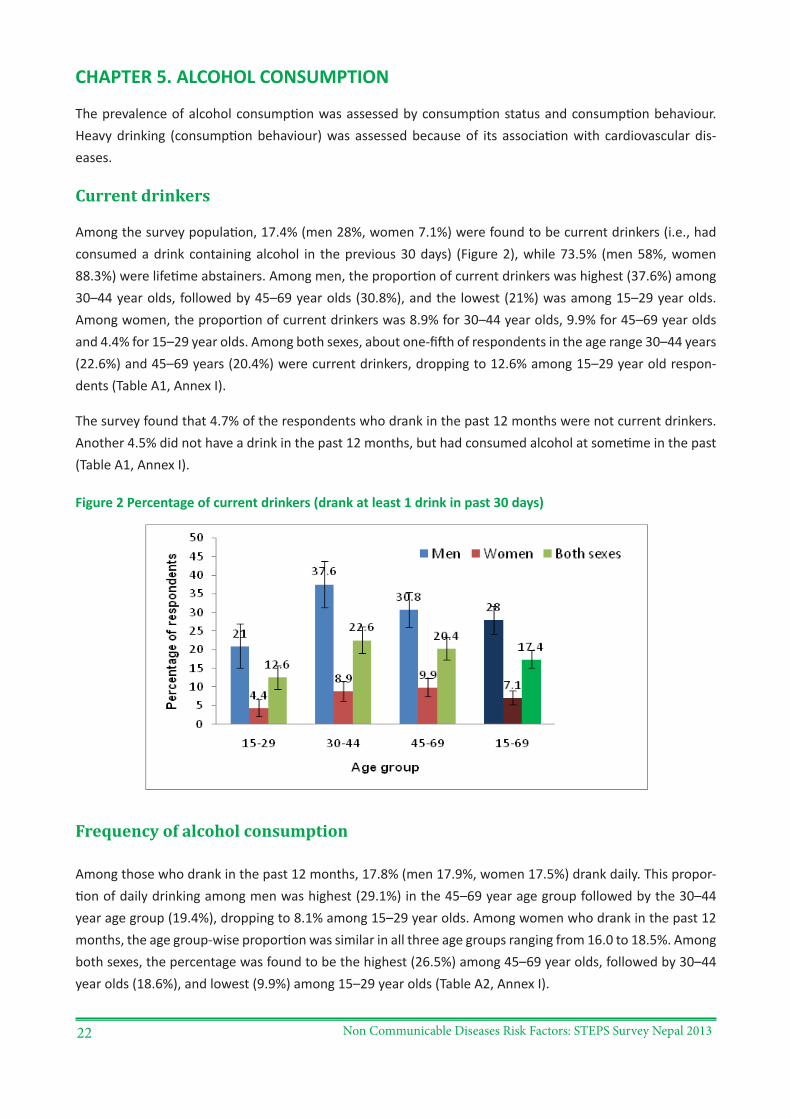
Non Communicable Diseases Risk Factors: STEPS Survey Nepal 201322
CHAPTER 5. ALCOHOL CONSUMPTION
The prevalence of alcohol consumption was assessed by consumption status and consumption behaviour. Heavy drinking (consumption behaviour) was assessed because of its association with cardiovascular dis-eases.
Current drinkers
Among the survey population, 17.4% (men 28%, women 7.1%) were found to be current drinkers (i.e., had consumed a drink containing alcohol in the previous 30 days) (Figure 2), while 73.5% (men 58%, women 88.3%) were lifetime abstainers. Among men, the proportion of current drinkers was highest (37.6%) among 30–44 year olds, followed by 45–69 year olds (30.8%), and the lowest (21%) was among 15–29 year olds. Among women, the proportion of current drinkers was 8.9% for 30–44 year olds, 9.9% for 45–69 year olds and 4.4% for 15–29 year olds. Among both sexes, about one-fifth of respondents in the age range 30–44 years (22.6%) and 45–69 years (20.4%) were current drinkers, dropping to 12.6% among 15–29 year old respon-dents (Table A1, Annex I).
The survey found that 4.7% of the respondents who drank in the past 12 months were not current drinkers. Another 4.5% did not have a drink in the past 12 months, but had consumed alcohol at sometime in the past (Table A1, Annex I).
Figure 2 Percentage of current drinkers (drank at least 1 drink in past 30 days)
Frequency of alcohol consumption
Among those who drank in the past 12 months, 17.8% (men 17.9%, women 17.5%) drank daily. This propor-tion of daily drinking among men was highest (29.1%) in the 45–69 year age group followed by the 30–44 year age group (19.4%), dropping to 8.1% among 15–29 year olds. Among women who drank in the past 12 months, the age group-wise proportion was similar in all three age groups ranging from 16.0 to 18.5%. Among both sexes, the percentage was found to be the highest (26.5%) among 45–69 year olds, followed by 30–44 year olds (18.6%), and lowest (9.9%) among 15–29 year olds (Table A2, Annex I).
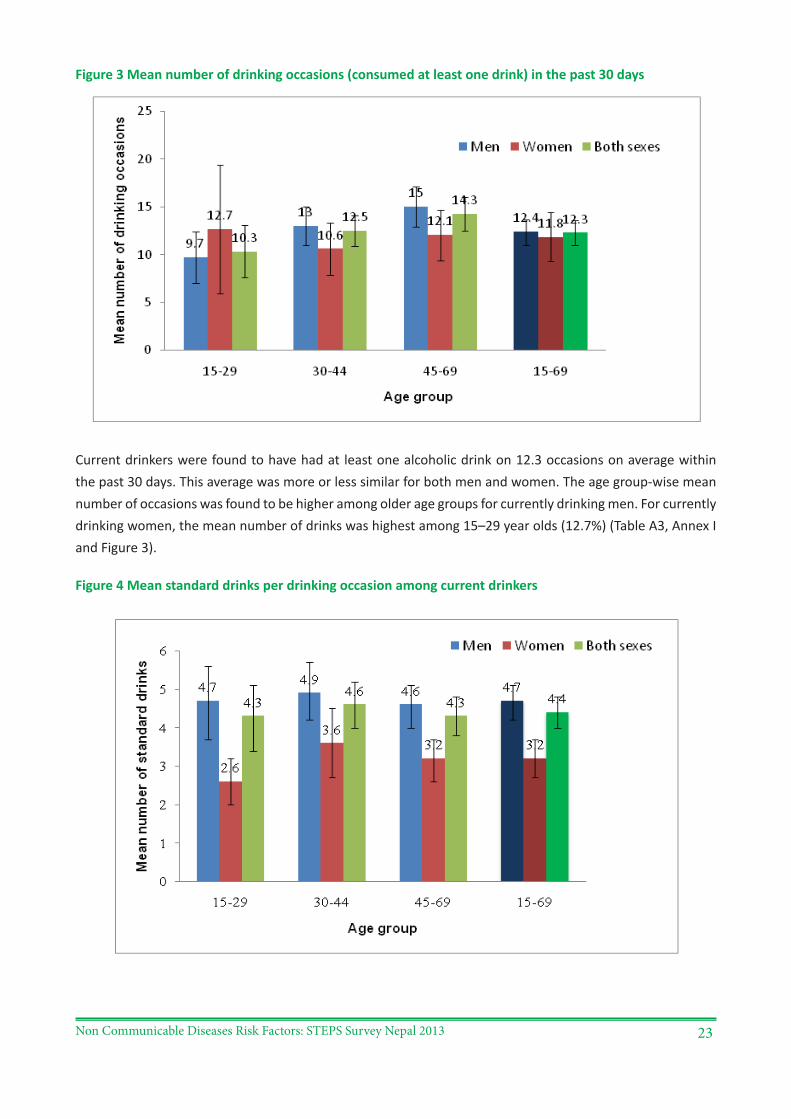
Non Communicable Diseases Risk Factors: STEPS Survey Nepal 2013 23
Figure 3 Mean number of drinking occasions (consumed at least one drink) in the past 30 days
Current drinkers were found to have had at least one alcoholic drink on 12.3 occasions on average within the past 30 days. This average was more or less similar for both men and women. The age group-wise mean number of occasions was found to be higher among older age groups for currently drinking men. For currently drinking women, the mean number of drinks was highest among 15–29 year olds (12.7%) (Table A3, Annex I and Figure 3).
Figure 4 Mean standard drinks per drinking occasion among current drinkers
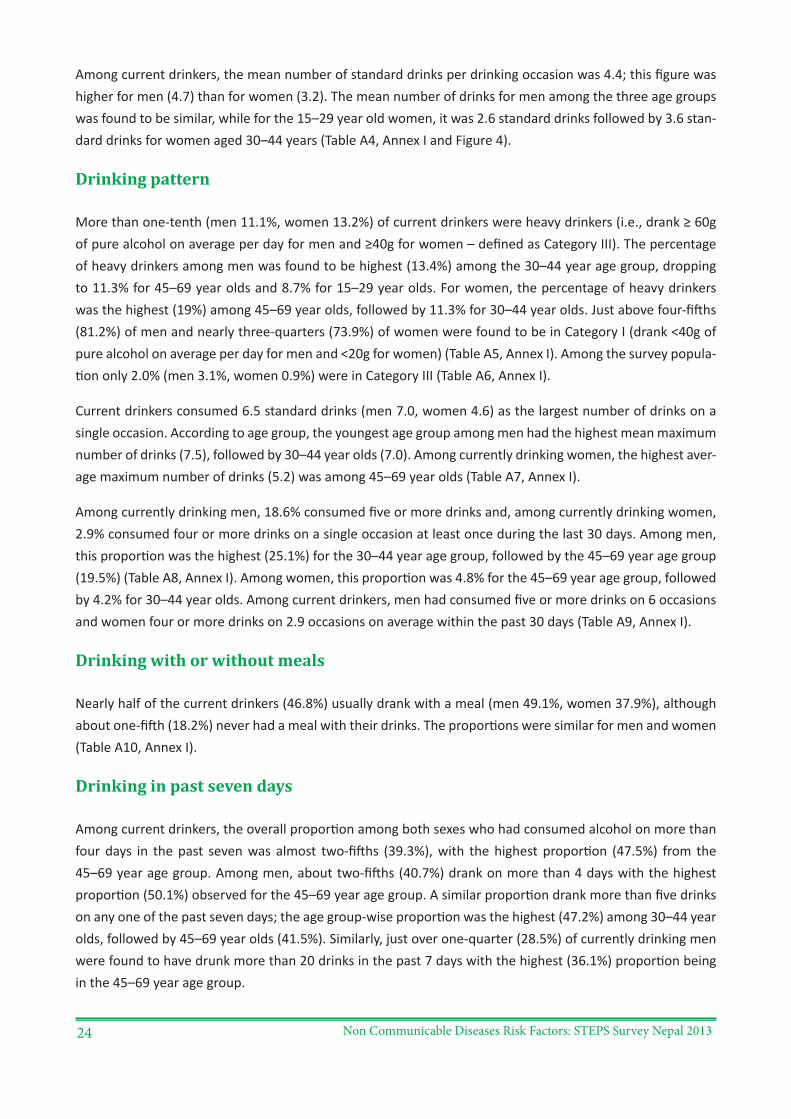
Non Communicable Diseases Risk Factors: STEPS Survey Nepal 201324
Among current drinkers, the mean number of standard drinks per drinking occasion was 4.4; this figure was higher for men (4.7) than for women (3.2). The mean number of drinks for men among the three age groups was found to be similar, while for the 15–29 year old women, it was 2.6 standard drinks followed by 3.6 stan-dard drinks for women aged 30–44 years (Table A4, Annex I and Figure 4).
Drinking pattern
More than one-tenth (men 11.1%, women 13.2%) of current drinkers were heavy drinkers (i.e., drank ≥ 60g of pure alcohol on average per day for men and ≥40g for women – defined as Category III). The percentage of heavy drinkers among men was found to be highest (13.4%) among the 30–44 year age group, dropping to 11.3% for 45–69 year olds and 8.7% for 15–29 year olds. For women, the percentage of heavy drinkers was the highest (19%) among 45–69 year olds, followed by 11.3% for 30–44 year olds. Just above four-fifths (81.2%) of men and nearly three-quarters (73.9%) of women were found to be in Category I (drank <40g of pure alcohol on average per day for men and <20g for women) (Table A5, Annex I). Among the survey popula-tion only 2.0% (men 3.1%, women 0.9%) were in Category III (Table A6, Annex I).
Current drinkers consumed 6.5 standard drinks (men 7.0, women 4.6) as the largest number of drinks on a single occasion. According to age group, the youngest age group among men had the highest mean maximum number of drinks (7.5), followed by 30–44 year olds (7.0). Among currently drinking women, the highest aver-age maximum number of drinks (5.2) was among 45–69 year olds (Table A7, Annex I).
Among currently drinking men, 18.6% consumed five or more drinks and, among currently drinking women, 2.9% consumed four or more drinks on a single occasion at least once during the last 30 days. Among men, this proportion was the highest (25.1%) for the 30–44 year age group, followed by the 45–69 year age group (19.5%) (Table A8, Annex I). Among women, this proportion was 4.8% for the 45–69 year age group, followed by 4.2% for 30–44 year olds. Among current drinkers, men had consumed five or more drinks on 6 occasions and women four or more drinks on 2.9 occasions on average within the past 30 days (Table A9, Annex I).
Drinking with or without meals
Nearly half of the current drinkers (46.8%) usually drank with a meal (men 49.1%, women 37.9%), although about one-fifth (18.2%) never had a meal with their drinks. The proportions were similar for men and women (Table A10, Annex I).
Drinking in past seven days
Among current drinkers, the overall proportion among both sexes who had consumed alcohol on more than four days in the past seven was almost two-fifths (39.3%), with the highest proportion (47.5%) from the 45–69 year age group. Among men, about two-fifths (40.7%) drank on more than 4 days with the highest proportion (50.1%) observed for the 45–69 year age group. A similar proportion drank more than five drinks on any one of the past seven days; the age group-wise proportion was the highest (47.2%) among 30–44 year olds, followed by 45–69 year olds (41.5%). Similarly, just over one-quarter (28.5%) of currently drinking men were found to have drunk more than 20 drinks in the past 7 days with the highest (36.1%) proportion being in the 45–69 year age group.
Non Communicable Diseases Risk Factors: STEPS Survey Nepal 2013 25
One-third of the currently drinking women (33.9%) reported drinking on more than four days in the last seven, with the highest proportion (39.5%) being in the 45–69 year age group, followed by 33.9% among 15–29 year olds. Almost one-third (31.2%) of currently drinking women were found to have drunk more than 4 drinks on one of the past 7 days and just over one-fifth (21.6%) of currently drinking women were found to have drunk more than 15 drinks in total in the past 7 days (Table A11, Annex I).
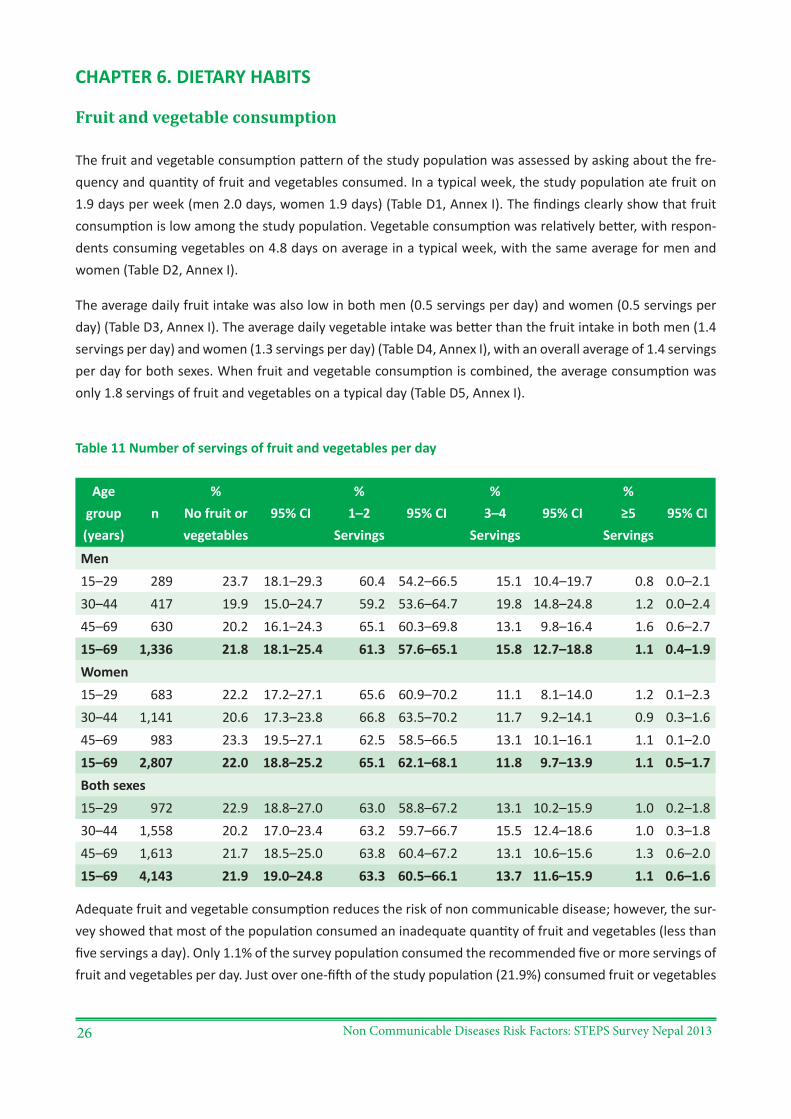
Non Communicable Diseases Risk Factors: STEPS Survey Nepal 201326
CHAPTER 6. DIETARY HABITS
Fruit and vegetable consumption
The fruit and vegetable consumption pattern of the study population was assessed by asking about the fre-quency and quantity of fruit and vegetables consumed. In a typical week, the study population ate fruit on 1.9 days per week (men 2.0 days, women 1.9 days) (Table D1, Annex I). The findings clearly show that fruit consumption is low among the study population. Vegetable consumption was relatively better, with respon-dents consuming vegetables on 4.8 days on average in a typical week, with the same average for men and women (Table D2, Annex I).
The average daily fruit intake was also low in both men (0.5 servings per day) and women (0.5 servings per day) (Table D3, Annex I). The average daily vegetable intake was better than the fruit intake in both men (1.4 servings per day) and women (1.3 servings per day) (Table D4, Annex I), with an overall average of 1.4 servings per day for both sexes. When fruit and vegetable consumption is combined, the average consumption was only 1.8 servings of fruit and vegetables on a typical day (Table D5, Annex I).
Table 11 Number of servings of fruit and vegetables per day
Age group (years)
n%
No fruit or vegetables
95% CI%
1–2 Servings
95% CI%
3–4 Servings
95% CI% ≥5
Servings95% CI
Men15–29 289 23.7 18.1–29.3 60.4 54.2–66.5 15.1 10.4–19.7 0.8 0.0–2.130–44 417 19.9 15.0–24.7 59.2 53.6–64.7 19.8 14.8–24.8 1.2 0.0–2.445–69 630 20.2 16.1–24.3 65.1 60.3–69.8 13.1 9.8–16.4 1.6 0.6–2.715–69 1,336 21.8 18.1–25.4 61.3 57.6–65.1 15.8 12.7–18.8 1.1 0.4–1.9Women15–29 683 22.2 17.2–27.1 65.6 60.9–70.2 11.1 8.1–14.0 1.2 0.1–2.330–44 1,141 20.6 17.3–23.8 66.8 63.5–70.2 11.7 9.2–14.1 0.9 0.3–1.645–69 983 23.3 19.5–27.1 62.5 58.5–66.5 13.1 10.1–16.1 1.1 0.1–2.015–69 2,807 22.0 18.8–25.2 65.1 62.1–68.1 11.8 9.7–13.9 1.1 0.5–1.7Both sexes15–29 972 22.9 18.8–27.0 63.0 58.8–67.2 13.1 10.2–15.9 1.0 0.2–1.830–44 1,558 20.2 17.0–23.4 63.2 59.7–66.7 15.5 12.4–18.6 1.0 0.3–1.845–69 1,613 21.7 18.5–25.0 63.8 60.4–67.2 13.1 10.6–15.6 1.3 0.6–2.015–69 4,143 21.9 19.0–24.8 63.3 60.5–66.1 13.7 11.6–15.9 1.1 0.6–1.6
Adequate fruit and vegetable consumption reduces the risk of non communicable disease; however, the sur-vey showed that most of the population consumed an inadequate quantity of fruit and vegetables (less than five servings a day). Only 1.1% of the survey population consumed the recommended five or more servings of fruit and vegetables per day. Just over one-fifth of the study population (21.9%) consumed fruit or vegetables
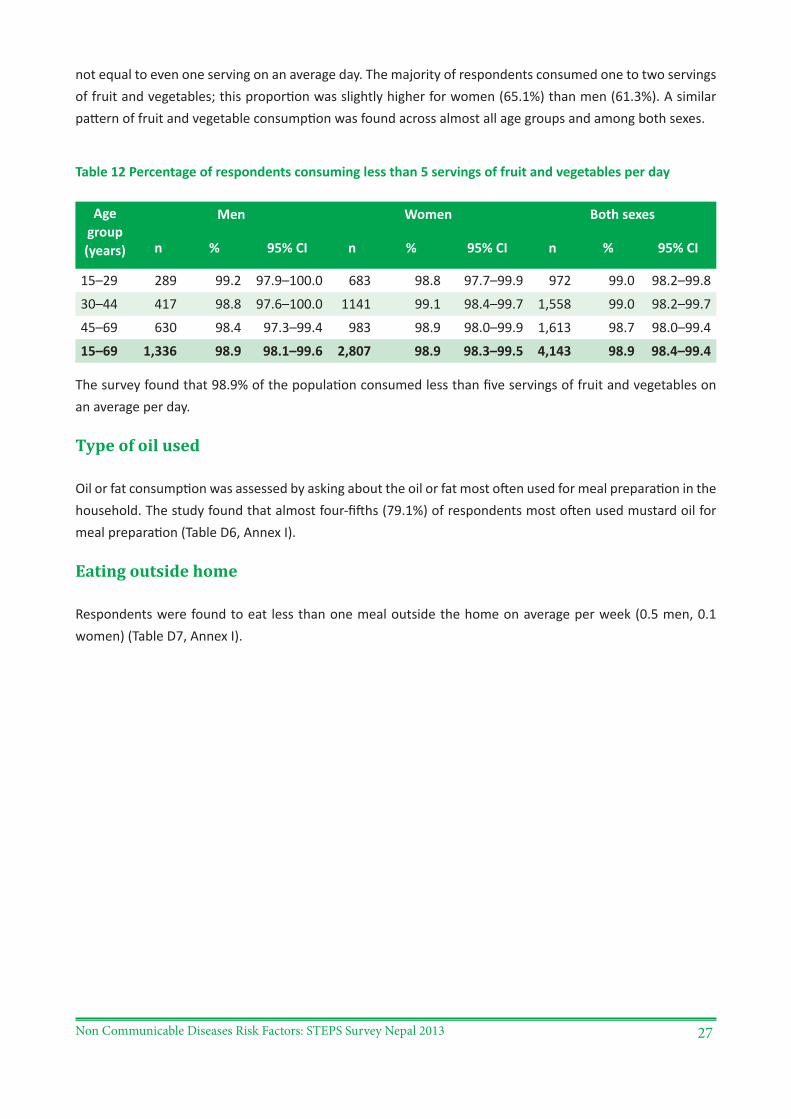
Non Communicable Diseases Risk Factors: STEPS Survey Nepal 2013 27
not equal to even one serving on an average day. The majority of respondents consumed one to two servings of fruit and vegetables; this proportion was slightly higher for women (65.1%) than men (61.3%). A similar pattern of fruit and vegetable consumption was found across almost all age groups and among both sexes.
Table 12 Percentage of respondents consuming less than 5 servings of fruit and vegetables per day
Age group (years)
Men Women Both sexes
n % 95% CI n % 95% CI n % 95% CI
15–29 289 99.2 97.9–100.0 683 98.8 97.7–99.9 972 99.0 98.2–99.8
30–44 417 98.8 97.6–100.0 1141 99.1 98.4–99.7 1,558 99.0 98.2–99.7
45–69 630 98.4 97.3–99.4 983 98.9 98.0–99.9 1,613 98.7 98.0–99.4
15–69 1,336 98.9 98.1–99.6 2,807 98.9 98.3–99.5 4,143 98.9 98.4–99.4
The survey found that 98.9% of the population consumed less than five servings of fruit and vegetables on an average per day.
Type of oil used
Oil or fat consumption was assessed by asking about the oil or fat most often used for meal preparation in the household. The study found that almost four-fifths (79.1%) of respondents most often used mustard oil for meal preparation (Table D6, Annex I).
Eating outside home
Respondents were found to eat less than one meal outside the home on average per week (0.5 men, 0.1 women) (Table D7, Annex I).
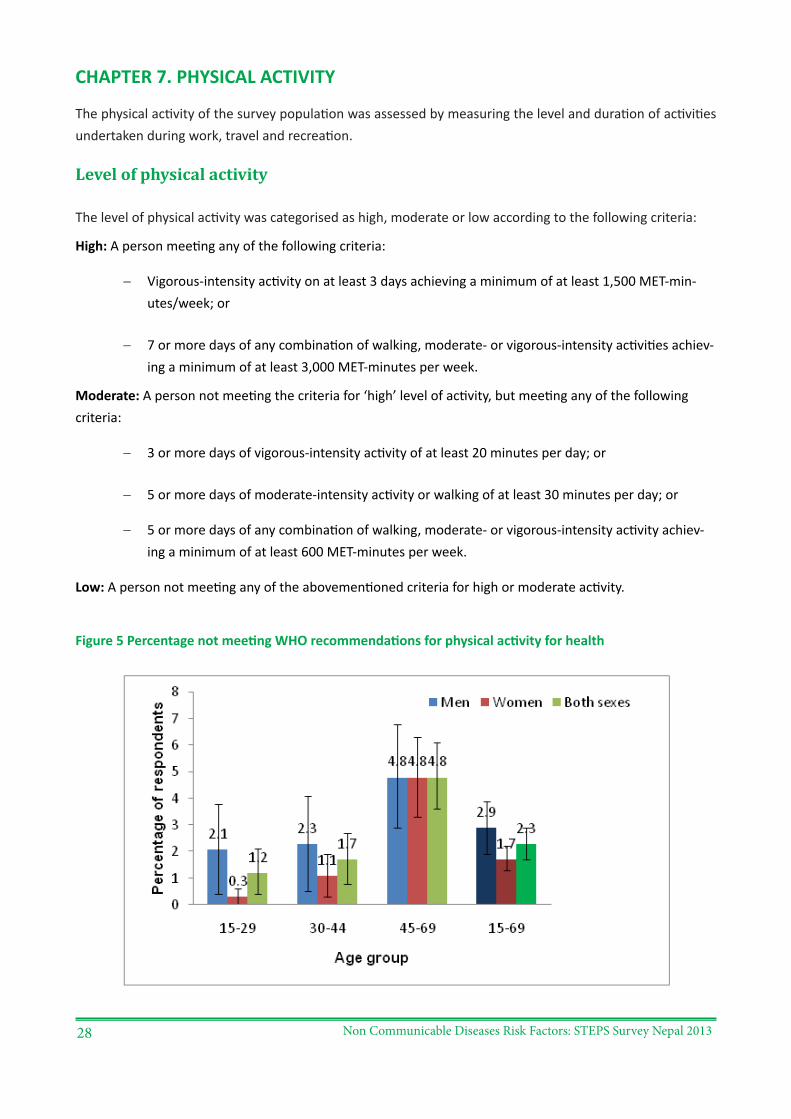
Non Communicable Diseases Risk Factors: STEPS Survey Nepal 201328
CHAPTER 7. PHYSICAL ACTIVITY
The physical activity of the survey population was assessed by measuring the level and duration of activities undertaken during work, travel and recreation.
Level of physical activity
The level of physical activity was categorised as high, moderate or low according to the following criteria:
High: A person meeting any of the following criteria:
− Vigorous-intensity activity on at least 3 days achieving a minimum of at least 1,500 MET-min-utes/week; or
− 7 or more days of any combination of walking, moderate- or vigorous-intensity activities achiev-ing a minimum of at least 3,000 MET-minutes per week.
Moderate: A person not meeting the criteria for ‘high’ level of activity, but meeting any of the following criteria:
− 3 or more days of vigorous-intensity activity of at least 20 minutes per day; or
− 5 or more days of moderate-intensity activity or walking of at least 30 minutes per day; or
− 5 or more days of any combination of walking, moderate- or vigorous-intensity activity achiev-ing a minimum of at least 600 MET-minutes per week.
Low: A person not meeting any of the abovementioned criteria for high or moderate activity.
Figure 5 Percentage not meeting WHO recommendations for physical activity for health
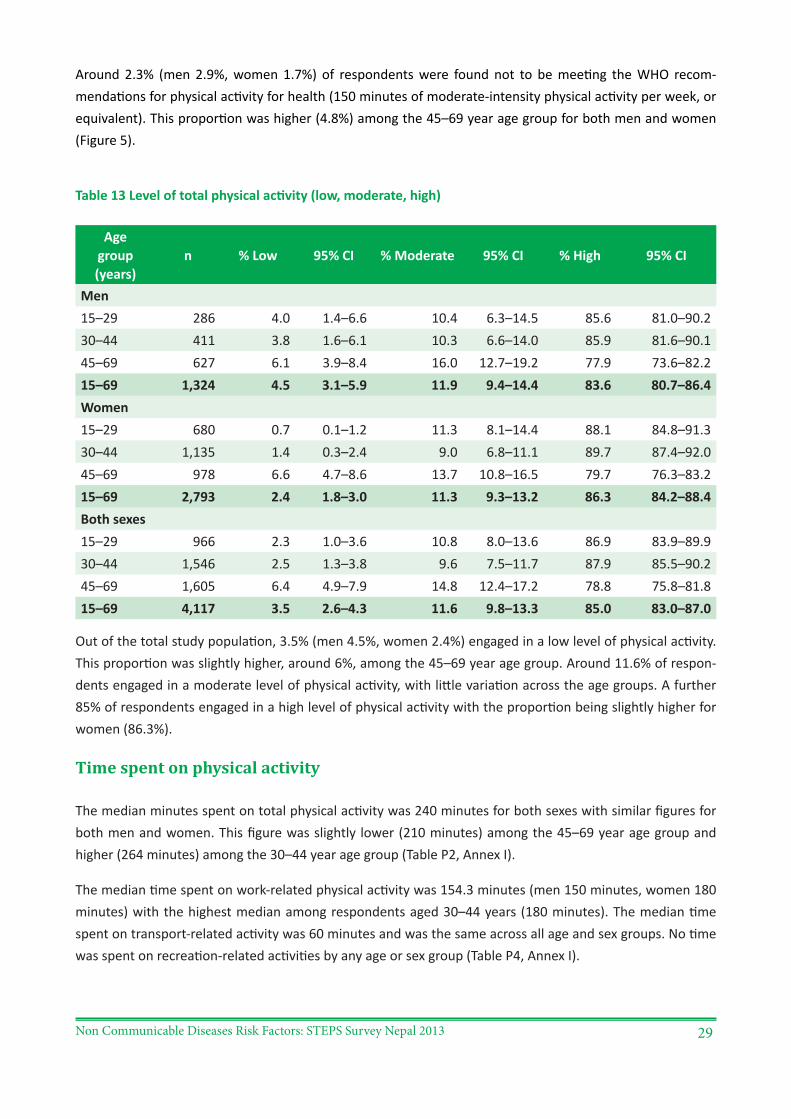
Non Communicable Diseases Risk Factors: STEPS Survey Nepal 2013 29
Around 2.3% (men 2.9%, women 1.7%) of respondents were found not to be meeting the WHO recom-mendations for physical activity for health (150 minutes of moderate-intensity physical activity per week, or equivalent). This proportion was higher (4.8%) among the 45–69 year age group for both men and women (Figure 5).
Table 13 Level of total physical activity (low, moderate, high)
Age group (years)
n % Low 95% CI % Moderate 95% CI % High 95% CI
Men15–29 286 4.0 1.4–6.6 10.4 6.3–14.5 85.6 81.0–90.230–44 411 3.8 1.6–6.1 10.3 6.6–14.0 85.9 81.6–90.145–69 627 6.1 3.9–8.4 16.0 12.7–19.2 77.9 73.6–82.215–69 1,324 4.5 3.1–5.9 11.9 9.4–14.4 83.6 80.7–86.4Women15–29 680 0.7 0.1–1.2 11.3 8.1–14.4 88.1 84.8–91.330–44 1,135 1.4 0.3–2.4 9.0 6.8–11.1 89.7 87.4–92.045–69 978 6.6 4.7–8.6 13.7 10.8–16.5 79.7 76.3–83.215–69 2,793 2.4 1.8–3.0 11.3 9.3–13.2 86.3 84.2–88.4Both sexes15–29 966 2.3 1.0–3.6 10.8 8.0–13.6 86.9 83.9–89.930–44 1,546 2.5 1.3–3.8 9.6 7.5–11.7 87.9 85.5–90.245–69 1,605 6.4 4.9–7.9 14.8 12.4–17.2 78.8 75.8–81.815–69 4,117 3.5 2.6–4.3 11.6 9.8–13.3 85.0 83.0–87.0
Out of the total study population, 3.5% (men 4.5%, women 2.4%) engaged in a low level of physical activity. This proportion was slightly higher, around 6%, among the 45–69 year age group. Around 11.6% of respon-dents engaged in a moderate level of physical activity, with little variation across the age groups. A further 85% of respondents engaged in a high level of physical activity with the proportion being slightly higher for women (86.3%).
Time spent on physical activity
The median minutes spent on total physical activity was 240 minutes for both sexes with similar figures for both men and women. This figure was slightly lower (210 minutes) among the 45–69 year age group and higher (264 minutes) among the 30–44 year age group (Table P2, Annex I).
The median time spent on work-related physical activity was 154.3 minutes (men 150 minutes, women 180 minutes) with the highest median among respondents aged 30–44 years (180 minutes). The median time spent on transport-related activity was 60 minutes and was the same across all age and sex groups. No time was spent on recreation-related activities by any age or sex group (Table P4, Annex I).
Non Communicable Diseases Risk Factors: STEPS Survey Nepal 201330
Types of activity
Among total respondents, 9.3% (men 14.8%, women 4.0%) were found not to have done the minimum level (at least 10 minutes per day) of work-related activity. Among women this proportion was quite high (10.8%) in the 45–69 year age group, but there was not much difference according to age group generally. Similarly, 6.7% (men 6.1%, women 7.2%) of total respondents were found not to have the minimum level (at least 10 minutes per day) of transport-related activity. Finally, 87.9% (men 78.8%, women 96.6%) were found not to have done the minimum level (at least 10 minutes per day) of recreation-related physical activity (Table P5, Annex I).
The contribution of activity from work to total activity was found to be 62.7% (men 55.1%, women 69.9%), followed by 33.6% (men 37.9%, women 29.4%) for activity related to transport and 3.7% (men 6.9%, women 0.7%) for activity related to recreation (Table P6, Annex I).
More than half (53.6%) of respondents did not engage in vigorous physical activity (men 43.5%, women 63.3%). This proportion was higher among the older age groups compared to younger groups in the study population (Table P7, Annex I). The median time spent in sedentary activities was found to be 120 minutes for all respondents, as well as for men and women separately (Table P8, Annex I).
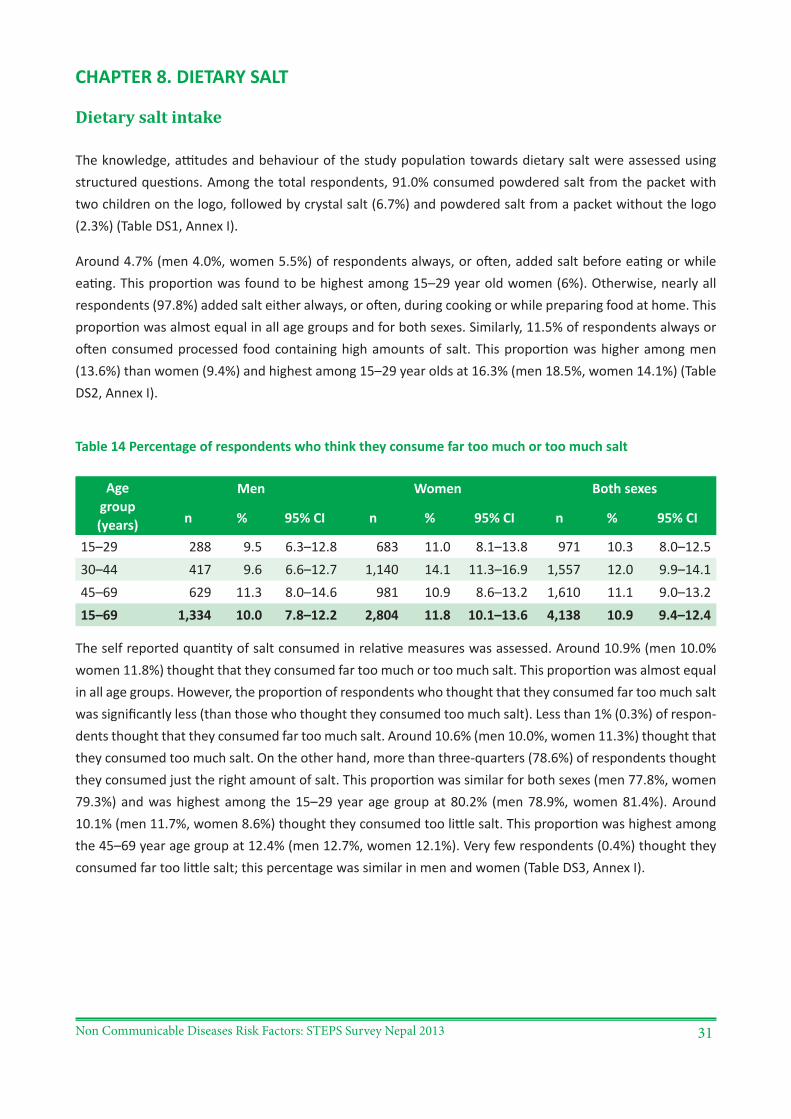
Non Communicable Diseases Risk Factors: STEPS Survey Nepal 2013 31
CHAPTER 8. DIETARY SALT
Dietary salt intake
The knowledge, attitudes and behaviour of the study population towards dietary salt were assessed using structured questions. Among the total respondents, 91.0% consumed powdered salt from the packet with two children on the logo, followed by crystal salt (6.7%) and powdered salt from a packet without the logo (2.3%) (Table DS1, Annex I).
Around 4.7% (men 4.0%, women 5.5%) of respondents always, or often, added salt before eating or while eating. This proportion was found to be highest among 15–29 year old women (6%). Otherwise, nearly all respondents (97.8%) added salt either always, or often, during cooking or while preparing food at home. This proportion was almost equal in all age groups and for both sexes. Similarly, 11.5% of respondents always or often consumed processed food containing high amounts of salt. This proportion was higher among men (13.6%) than women (9.4%) and highest among 15–29 year olds at 16.3% (men 18.5%, women 14.1%) (Table DS2, Annex I).
Table 14 Percentage of respondents who think they consume far too much or too much salt
Age group (years)
Men Women Both sexes
n % 95% CI n % 95% CI n % 95% CI
15–29 288 9.5 6.3–12.8 683 11.0 8.1–13.8 971 10.3 8.0–12.530–44 417 9.6 6.6–12.7 1,140 14.1 11.3–16.9 1,557 12.0 9.9–14.145–69 629 11.3 8.0–14.6 981 10.9 8.6–13.2 1,610 11.1 9.0–13.215–69 1,334 10.0 7.8–12.2 2,804 11.8 10.1–13.6 4,138 10.9 9.4–12.4
The self reported quantity of salt consumed in relative measures was assessed. Around 10.9% (men 10.0% women 11.8%) thought that they consumed far too much or too much salt. This proportion was almost equal in all age groups. However, the proportion of respondents who thought that they consumed far too much salt was significantly less (than those who thought they consumed too much salt). Less than 1% (0.3%) of respon-dents thought that they consumed far too much salt. Around 10.6% (men 10.0%, women 11.3%) thought that they consumed too much salt. On the other hand, more than three-quarters (78.6%) of respondents thought they consumed just the right amount of salt. This proportion was similar for both sexes (men 77.8%, women 79.3%) and was highest among the 15–29 year age group at 80.2% (men 78.9%, women 81.4%). Around 10.1% (men 11.7%, women 8.6%) thought they consumed too little salt. This proportion was highest among the 45–69 year age group at 12.4% (men 12.7%, women 12.1%). Very few respondents (0.4%) thought they consumed far too little salt; this percentage was similar in men and women (Table DS3, Annex I).
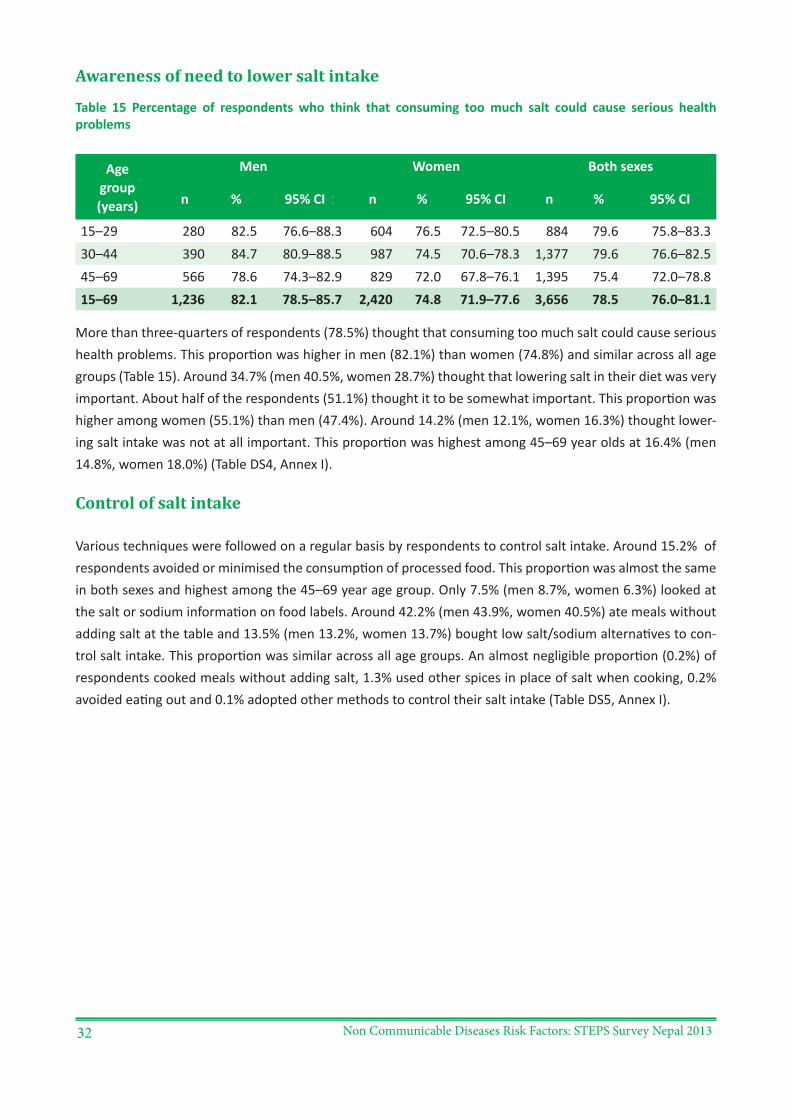
Non Communicable Diseases Risk Factors: STEPS Survey Nepal 201332
Awareness of need to lower salt intake
Table 15 Percentage of respondents who think that consuming too much salt could cause serious health problems
Age group (years)
Men Women Both sexes
n % 95% CI n % 95% CI n % 95% CI
15–29 280 82.5 76.6–88.3 604 76.5 72.5–80.5 884 79.6 75.8–83.330–44 390 84.7 80.9–88.5 987 74.5 70.6–78.3 1,377 79.6 76.6–82.545–69 566 78.6 74.3–82.9 829 72.0 67.8–76.1 1,395 75.4 72.0–78.815–69 1,236 82.1 78.5–85.7 2,420 74.8 71.9–77.6 3,656 78.5 76.0–81.1
More than three-quarters of respondents (78.5%) thought that consuming too much salt could cause serious health problems. This proportion was higher in men (82.1%) than women (74.8%) and similar across all age groups (Table 15). Around 34.7% (men 40.5%, women 28.7%) thought that lowering salt in their diet was very important. About half of the respondents (51.1%) thought it to be somewhat important. This proportion was higher among women (55.1%) than men (47.4%). Around 14.2% (men 12.1%, women 16.3%) thought lower-ing salt intake was not at all important. This proportion was highest among 45–69 year olds at 16.4% (men 14.8%, women 18.0%) (Table DS4, Annex I).
Control of salt intake
Various techniques were followed on a regular basis by respondents to control salt intake. Around 15.2% of respondents avoided or minimised the consumption of processed food. This proportion was almost the same in both sexes and highest among the 45–69 year age group. Only 7.5% (men 8.7%, women 6.3%) looked at the salt or sodium information on food labels. Around 42.2% (men 43.9%, women 40.5%) ate meals without adding salt at the table and 13.5% (men 13.2%, women 13.7%) bought low salt/sodium alternatives to con-trol salt intake. This proportion was similar across all age groups. An almost negligible proportion (0.2%) of respondents cooked meals without adding salt, 1.3% used other spices in place of salt when cooking, 0.2% avoided eating out and 0.1% adopted other methods to control their salt intake (Table DS5, Annex I).
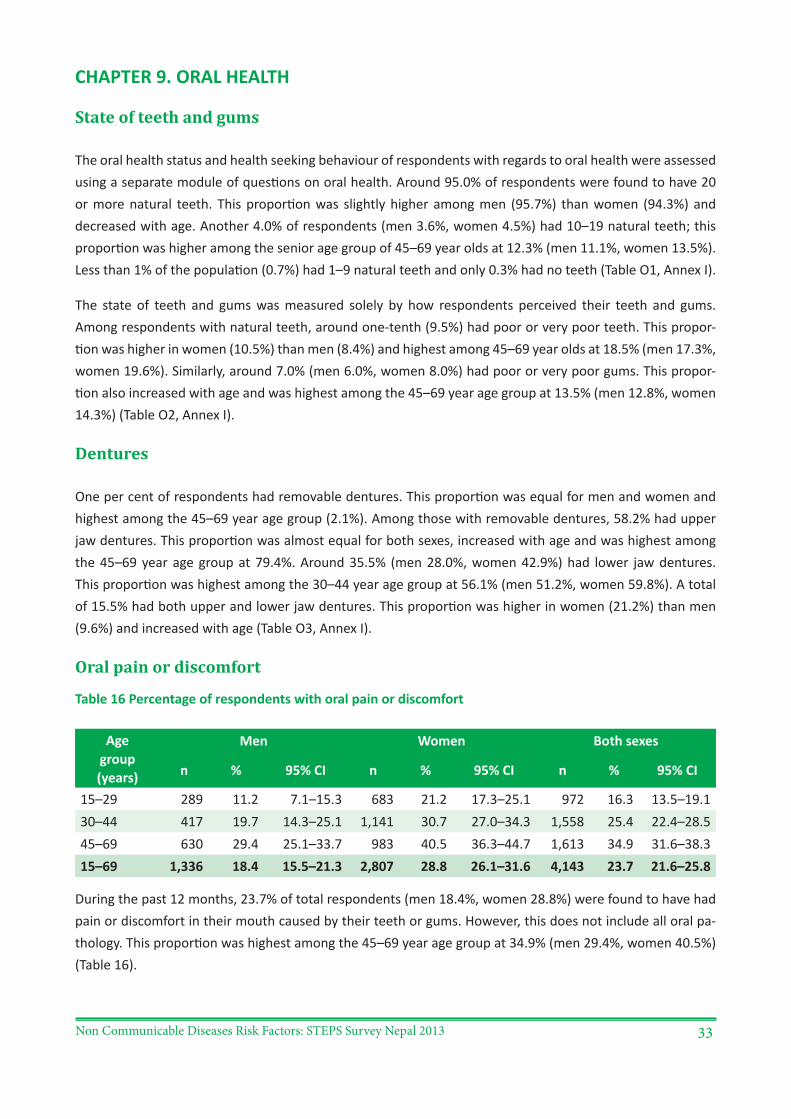
Non Communicable Diseases Risk Factors: STEPS Survey Nepal 2013 33
CHAPTER 9. ORAL HEALTH
State of teeth and gums
The oral health status and health seeking behaviour of respondents with regards to oral health were assessed using a separate module of questions on oral health. Around 95.0% of respondents were found to have 20 or more natural teeth. This proportion was slightly higher among men (95.7%) than women (94.3%) and decreased with age. Another 4.0% of respondents (men 3.6%, women 4.5%) had 10–19 natural teeth; this proportion was higher among the senior age group of 45–69 year olds at 12.3% (men 11.1%, women 13.5%). Less than 1% of the population (0.7%) had 1–9 natural teeth and only 0.3% had no teeth (Table O1, Annex I).
The state of teeth and gums was measured solely by how respondents perceived their teeth and gums. Among respondents with natural teeth, around one-tenth (9.5%) had poor or very poor teeth. This propor-tion was higher in women (10.5%) than men (8.4%) and highest among 45–69 year olds at 18.5% (men 17.3%, women 19.6%). Similarly, around 7.0% (men 6.0%, women 8.0%) had poor or very poor gums. This propor-tion also increased with age and was highest among the 45–69 year age group at 13.5% (men 12.8%, women 14.3%) (Table O2, Annex I).
Dentures
One per cent of respondents had removable dentures. This proportion was equal for men and women and highest among the 45–69 year age group (2.1%). Among those with removable dentures, 58.2% had upper jaw dentures. This proportion was almost equal for both sexes, increased with age and was highest among the 45–69 year age group at 79.4%. Around 35.5% (men 28.0%, women 42.9%) had lower jaw dentures. This proportion was highest among the 30–44 year age group at 56.1% (men 51.2%, women 59.8%). A total of 15.5% had both upper and lower jaw dentures. This proportion was higher in women (21.2%) than men (9.6%) and increased with age (Table O3, Annex I).
Oral pain or discomfort
Table 16 Percentage of respondents with oral pain or discomfort
Age group (years)
Men Women Both sexes
n % 95% CI n % 95% CI n % 95% CI
15–29 289 11.2 7.1–15.3 683 21.2 17.3–25.1 972 16.3 13.5–19.130–44 417 19.7 14.3–25.1 1,141 30.7 27.0–34.3 1,558 25.4 22.4–28.545–69 630 29.4 25.1–33.7 983 40.5 36.3–44.7 1,613 34.9 31.6–38.315–69 1,336 18.4 15.5–21.3 2,807 28.8 26.1–31.6 4,143 23.7 21.6–25.8
During the past 12 months, 23.7% of total respondents (men 18.4%, women 28.8%) were found to have had pain or discomfort in their mouth caused by their teeth or gums. However, this does not include all oral pa-thology. This proportion was highest among the 45–69 year age group at 34.9% (men 29.4%, women 40.5%) (Table 16).
Non Communicable Diseases Risk Factors: STEPS Survey Nepal 201334
Dental care
Among the total respondents, 6.2% (men 5.5%, women 6.8%) had seen a dentist in the past 12 months. This proportion was highest among the 45–69 year age group (8.4%) (Table O4). Around 83.9% of respondents had never received any dental care in their lifetime. This proportion was almost equal for men and women (Table O5, Annex I).
Among those who had ever visited a dentist, 9.3% (men 14.9%, women 3.8%) visited last time for a consulta-tion or advice with regards to their teeth or oral health. About three-quarters of respondents who had visited a dentist (72.9%) said they visited because of pain or trouble with their teeth and gums. This proportion was higher among women (78.5%) than men (67.2%) and was highest among 30–44 year olds at 80.2% (men 74.2%, women 84.3%). Around 15.5% visited a dentist for follow up treatment. This proportion was almost equal in men and women. Only 2.3% said they visited for a routine check-up. This proportion was equal for men and women (Table O6, Annex I).
Dental hygiene
The study also assessed the teeth cleaning habits of respondents. Around 94.9% (men 95.8%, women 94.1%) were found to be cleaning their teeth at least once a day. This proportion was highest among the 15–29 year age group at 98.0% (men 98.4%, women 97.6%). Nearly 10% (9.9%) cleaned their teeth at least twice a day. This proportion was almost equal in both sexes and highest among the 15–29 year age group (13.1%) (Table O7, Annex I). Among those cleaning their teeth, 87.1% (men 88.0%, women 86.3%) used toothpaste (Table O8, Annex I). Similarly, among those using toothpaste, 81.6% (men 84.3%, women 78.8%) used toothpaste containing fluoride. This was assessed by observing the toothpaste used by respondents (Table O9, Annex I).
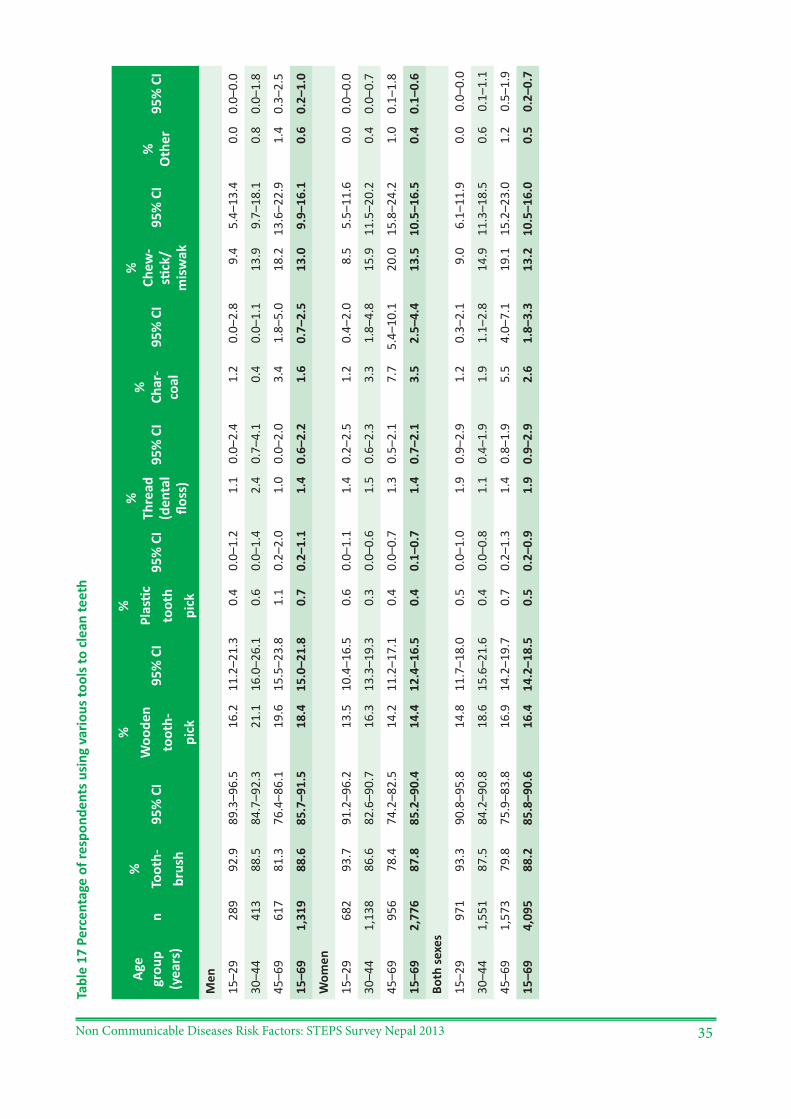
Non Communicable Diseases Risk Factors: STEPS Survey Nepal 2013 35
Tabl
e 17
Per
cent
age
of re
spon
dent
s usi
ng v
ario
us to
ols t
o cl
ean
teet
h
Age
grou
p (y
ears
)n
%
Toot
h-br
ush
95%
CI
%
Woo
den
toot
h-pi
ck
95%
CI
%
Plas
tic
toot
h pi
ck
95%
CI
%
Thre
ad
(den
tal
floss
)
95%
CI
%
Char
-co
al95
% C
I
%
Chew
-sti
ck/
mis
wak
95%
CI
%
Oth
er95
% C
I
Men
15–2
928
992
.989
.3–9
6.5
16.2
11.2
–21.
30.
40.
0–1.
21.
10.
0–2.
41.
20.
0–2.
89.
45.
4–13
.40.
00.
0–0.
0
30–4
441
388
.584
.7–9
2.3
21.1
16.0
–26.
10.
60.
0–1.
42.
40.
7–4.
10.
40.
0–1.
113
.99.
7–18
.10.
80.
0–1.
8
45–6
961
781
.376
.4–8
6.1
19.6
15.5
–23.
81.
10.
2–2.
01.
00.
0–2.
03.
41.
8–5.
018
.213
.6–2
2.9
1.4
0.3–
2.5
15–6
91,
319
88.6
85.7
–91.
518
.415
.0–2
1.8
0.7
0.2–
1.1
1.4
0.6–
2.2
1.6
0.7–
2.5
13.0
9.9–
16.1
0.6
0.2–
1.0
Wom
en
15–2
968
293
.791
.2–9
6.2
13.5
10.4
–16.
50.
60.
0–1.
11.
40.
2–2.
51.
20.
4–2.
08.
55.
5–11
.60.
00.
0–0.
0
30–4
41,
138
86.6
82.6
–90.
716
.313
.3–1
9.3
0.3
0.0–
0.6
1.5
0.6–
2.3
3.3
1.8–
4.8
15.9
11.5
–20.
20.
40.
0–0.
7
45–6
995
678
.474
.2–8
2.5
14.2
11.2
–17.
10.
40.
0–0.
71.
30.
5–2.
17.
75.
4–10
.120
.015
.8–2
4.2
1.0
0.1–
1.8
15–6
92,
776
87.8
85.2
–90.
414
.412
.4–1
6.5
0.4
0.1–
0.7
1.4
0.7–
2.1
3.5
2.5–
4.4
13.5
10.5
–16.
50.
40.
1–0.
6
Both
sexe
s
15–2
997
193
.390
.8–9
5.8
14.8
11.7
–18.
00.
50.
0–1.
01.
90.
9–2.
91.
20.
3–2.
19.
06.
1–11
.90.
00.
0–0.
0
30–4
41,
551
87.5
84.2
–90.
818
.615
.6–2
1.6
0.4
0.0–
0.8
1.1
0.4–
1.9
1.9
1.1–
2.8
14.9
11.3
–18.
50.
60.
1–1.
1
45–6
91,
573
79.8
75.9
–83.
816
.914
.2–1
9.7
0.7
0.2–
1.3
1.4
0.8–
1.9
5.5
4.0–
7.1
19.1
15.2
–23.
01.
20.
5–1.
9
15–6
94,
095
88.2
85.8
–90.
616
.414
.2–1
8.5
0.5
0.2–
0.9
1.9
0.9–
2.9
2.6
1.8–
3.3
13.2
10.5
–16.
00.
50.
2–0.
7

Non Communicable Diseases Risk Factors: STEPS Survey Nepal 201336
Among those cleaning their teeth, 88.2% (men 88.6%, women 87.8%) used a toothbrush. This proportion was highest among the 15–29 year age group (93.3%). Around 16.4% (men 18.4%, women 14.4%) used wooden toothpicks to clean their teeth. Less than 1% (0.5%) used plastic toothpicks. Nearly 2% (1.9%) used thread (dental floss). These proportions were almost the same among men and women and across all age groups. Around 2.6% used charcoal; this proportion was twice as high in women (3.5%) than in men (1.6%) and in-creased with age. More than one-tenth (13.2%) of respondents used chewsticks or miswak. This proportion was almost equal for men and women and highest among the 45–69 year age group at 19.1% (men 18.2%, women 20.0%).
Difficulty chewing or speaking
During the past 12 months, 16.2% of respondents reported having difficulty chewing food. This proportion was higher among women (19.9%) than men (12.4%) and highest (26.0%) among the 45–69 year age group. Around 5.8% of respondents (men 3.8%, women 7.6%) had difficulty with speech or trouble pronouncing words because of dental problems. Similarly, 2.8% of respondents (men 2.3%, women 3.3%) experienced stress because of problems with their teeth or mouth. Around 1.8% (men 1.3%, women 2.3%) felt embar-rassed because of the appearance of their teeth. More than 2% (2.1%) avoided smiling because of their teeth. This proportion was nearly double in women (2.6%) compared to men (1.7%). Around 7% of respondents (men 4.6%, women 9.3%) often had interrupted sleep because of teeth or oral problems. Less than 1% (0.8%) missed days at work because of their teeth or oral problems. Another 4.3% (men 2.9%, women 5.7%) had difficulty doing their usual activities because of teeth or oral problems. Less than 1% (0.6%) had been less tol-erant of their spouse or people close to them and 0.7% had reduced participation in social activities because of their teeth or oral problems. The abovementioned problems stemming from poor oral status were found to be higher in women than their male counterparts and were also highest among the 45–69 year age group (Table O10, Annex I).
Dental caries
Table 18 Percentage of respondents with dental caries
Age group (years)
Men Women Both sexes
n % 95% CI n % 95% CI n % 95% CI
15–29 289 22.6 17.7–27.6 683 32.2 27.8–36.6 972 27.5 24.0–31.030–44 417 27.2 21.9–32.6 1,141 45.0 40.9–49.1 1,558 36.5 33.2–39.945–69 630 44.0 39.4–48.7 983 55.9 51.9–59.9 1,613 49.9 46.7–53.215–69 1,336 29.7 26.2–33.1 2,807 41.9 38.9–44.9 4,143 35.9 33.5–38.3
Self reported dental caries was explored among the respondents at the time of the interview. Among the to-tal respondents, 35.9% (men 29.7%, women 41.9%) reported having had dental carries. This proportion was highest among the 45–69 year age group at 49.9% (men 44.0%, women 55.9%) (Table 18).
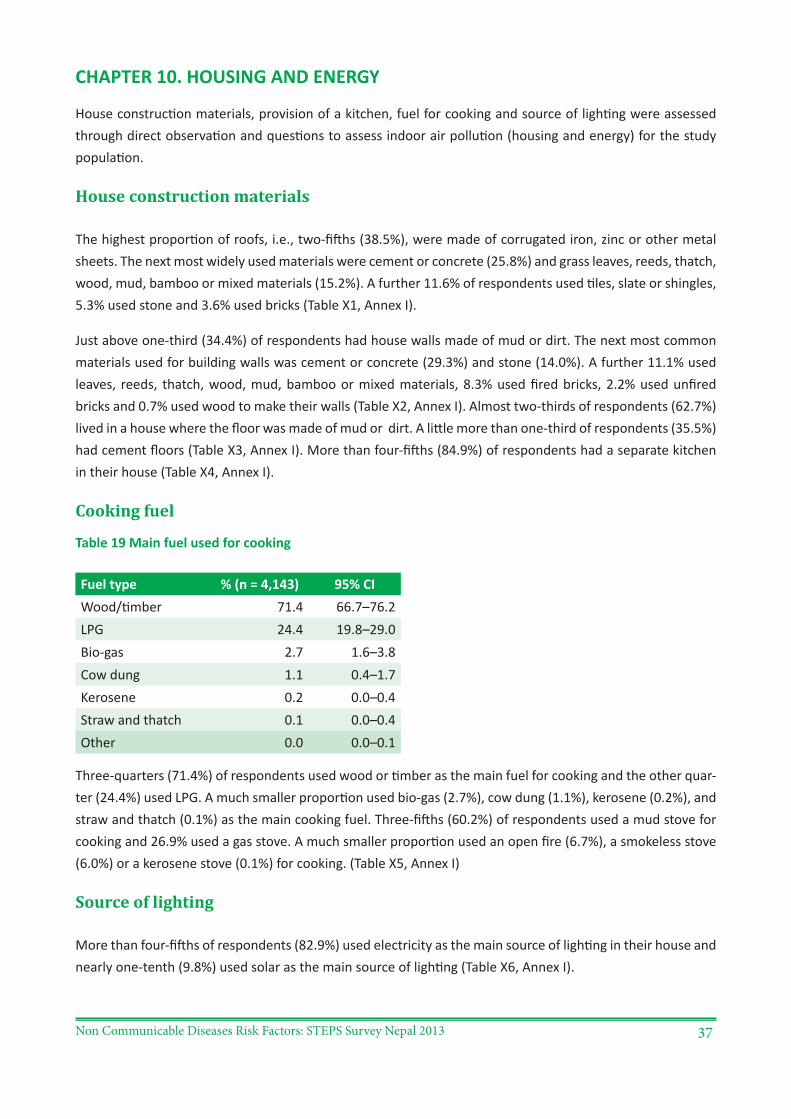
Non Communicable Diseases Risk Factors: STEPS Survey Nepal 2013 37
CHAPTER 10. HOUSING AND ENERGY
House construction materials, provision of a kitchen, fuel for cooking and source of lighting were assessed through direct observation and questions to assess indoor air pollution (housing and energy) for the study population.
House construction materials
The highest proportion of roofs, i.e., two-fifths (38.5%), were made of corrugated iron, zinc or other metal sheets. The next most widely used materials were cement or concrete (25.8%) and grass leaves, reeds, thatch, wood, mud, bamboo or mixed materials (15.2%). A further 11.6% of respondents used tiles, slate or shingles, 5.3% used stone and 3.6% used bricks (Table X1, Annex I).
Just above one-third (34.4%) of respondents had house walls made of mud or dirt. The next most common materials used for building walls was cement or concrete (29.3%) and stone (14.0%). A further 11.1% used leaves, reeds, thatch, wood, mud, bamboo or mixed materials, 8.3% used fired bricks, 2.2% used unfired bricks and 0.7% used wood to make their walls (Table X2, Annex I). Almost two-thirds of respondents (62.7%) lived in a house where the floor was made of mud or dirt. A little more than one-third of respondents (35.5%) had cement floors (Table X3, Annex I). More than four-fifths (84.9%) of respondents had a separate kitchen in their house (Table X4, Annex I).
Cooking fuel
Table 19 Main fuel used for cooking
Fuel type % (n = 4,143) 95% CIWood/timber 71.4 66.7–76.2LPG 24.4 19.8–29.0Bio-gas 2.7 1.6–3.8Cow dung 1.1 0.4–1.7Kerosene 0.2 0.0–0.4Straw and thatch 0.1 0.0–0.4Other 0.0 0.0–0.1
Three-quarters (71.4%) of respondents used wood or timber as the main fuel for cooking and the other quar-ter (24.4%) used LPG. A much smaller proportion used bio-gas (2.7%), cow dung (1.1%), kerosene (0.2%), and straw and thatch (0.1%) as the main cooking fuel. Three-fifths (60.2%) of respondents used a mud stove for cooking and 26.9% used a gas stove. A much smaller proportion used an open fire (6.7%), a smokeless stove (6.0%) or a kerosene stove (0.1%) for cooking. (Table X5, Annex I)
Source of lighting
More than four-fifths of respondents (82.9%) used electricity as the main source of lighting in their house and nearly one-tenth (9.8%) used solar as the main source of lighting (Table X6, Annex I).
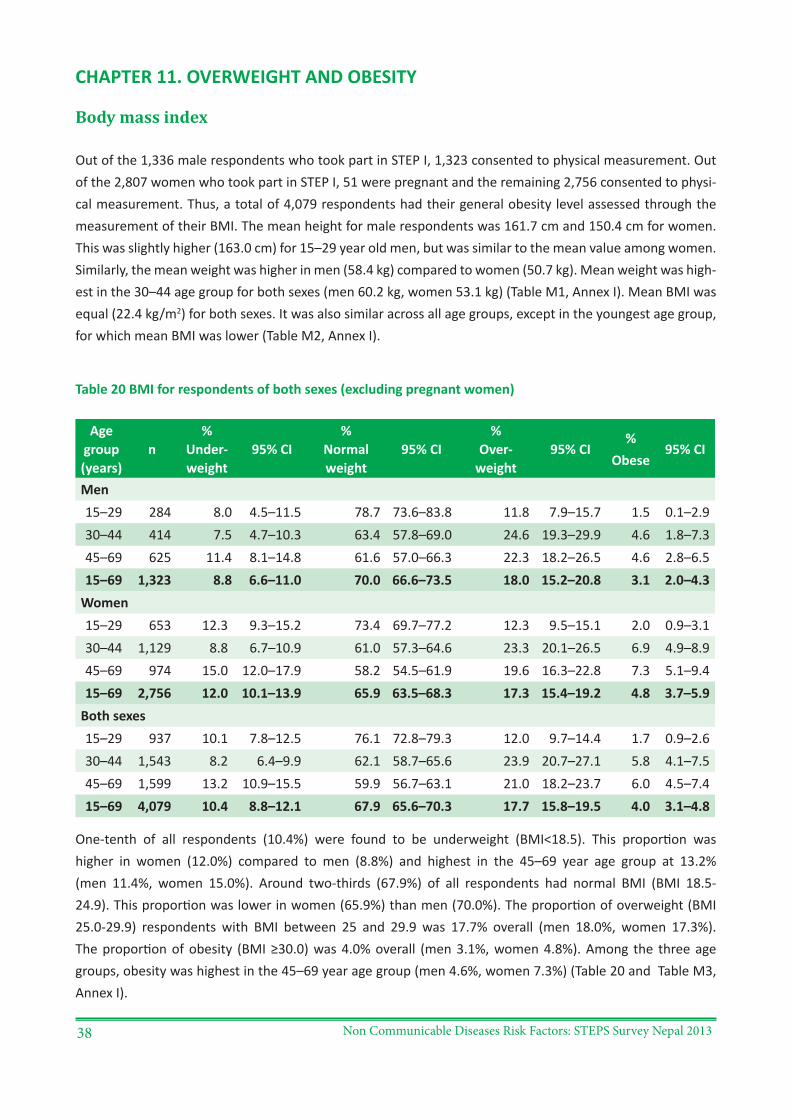
Non Communicable Diseases Risk Factors: STEPS Survey Nepal 201338
CHAPTER 11. OVERWEIGHT AND OBESITY
Body mass index
Out of the 1,336 male respondents who took part in STEP I, 1,323 consented to physical measurement. Out of the 2,807 women who took part in STEP I, 51 were pregnant and the remaining 2,756 consented to physi-cal measurement. Thus, a total of 4,079 respondents had their general obesity level assessed through the measurement of their BMI. The mean height for male respondents was 161.7 cm and 150.4 cm for women. This was slightly higher (163.0 cm) for 15–29 year old men, but was similar to the mean value among women. Similarly, the mean weight was higher in men (58.4 kg) compared to women (50.7 kg). Mean weight was high-est in the 30–44 age group for both sexes (men 60.2 kg, women 53.1 kg) (Table M1, Annex I). Mean BMI was equal (22.4 kg/m2) for both sexes. It was also similar across all age groups, except in the youngest age group, for which mean BMI was lower (Table M2, Annex I).
Table 20 BMI for respondents of both sexes (excluding pregnant women)
Age group (years)
n%
Under-weight
95% CI%
Normal weight
95% CI%
Over-weight
95% CI%
Obese95% CI
Men15–29 284 8.0 4.5–11.5 78.7 73.6–83.8 11.8 7.9–15.7 1.5 0.1–2.930–44 414 7.5 4.7–10.3 63.4 57.8–69.0 24.6 19.3–29.9 4.6 1.8–7.345–69 625 11.4 8.1–14.8 61.6 57.0–66.3 22.3 18.2–26.5 4.6 2.8–6.515–69 1,323 8.8 6.6–11.0 70.0 66.6–73.5 18.0 15.2–20.8 3.1 2.0–4.3
Women15–29 653 12.3 9.3–15.2 73.4 69.7–77.2 12.3 9.5–15.1 2.0 0.9–3.130–44 1,129 8.8 6.7–10.9 61.0 57.3–64.6 23.3 20.1–26.5 6.9 4.9–8.945–69 974 15.0 12.0–17.9 58.2 54.5–61.9 19.6 16.3–22.8 7.3 5.1–9.415–69 2,756 12.0 10.1–13.9 65.9 63.5–68.3 17.3 15.4–19.2 4.8 3.7–5.9
Both sexes15–29 937 10.1 7.8–12.5 76.1 72.8–79.3 12.0 9.7–14.4 1.7 0.9–2.630–44 1,543 8.2 6.4–9.9 62.1 58.7–65.6 23.9 20.7–27.1 5.8 4.1–7.545–69 1,599 13.2 10.9–15.5 59.9 56.7–63.1 21.0 18.2–23.7 6.0 4.5–7.415–69 4,079 10.4 8.8–12.1 67.9 65.6–70.3 17.7 15.8–19.5 4.0 3.1–4.8
One-tenth of all respondents (10.4%) were found to be underweight (BMI<18.5). This proportion was higher in women (12.0%) compared to men (8.8%) and highest in the 45–69 year age group at 13.2% (men 11.4%, women 15.0%). Around two-thirds (67.9%) of all respondents had normal BMI (BMI 18.5-24.9). This proportion was lower in women (65.9%) than men (70.0%). The proportion of overweight (BMI 25.0-29.9) respondents with BMI between 25 and 29.9 was 17.7% overall (men 18.0%, women 17.3%). The proportion of obesity (BMI ≥30.0) was 4.0% overall (men 3.1%, women 4.8%). Among the three age groups, obesity was highest in the 45–69 year age group (men 4.6%, women 7.3%) (Table 20 and Table M3, Annex I).
Non Communicable Diseases Risk Factors: STEPS Survey Nepal 2013 39
The proportion of respondents who were either overweight or obese was 21.6%. This combined figure was slightly higher in women (22.1%) than men (21.2%). Generalised overweight (BMI ≥25.0) was higher in the 30–44 year age group at 29.7% overall (men 29.1%, women 30.3%) (Table M4, Annex I).
Waist hip ratio
The average mean waist circumference was 79.8 cm for men and 76.7 cm for women. The mean hip circum-ference was 88.1 for men and 87.5 for women (Table M5, Annex I). Among the study population, mean hip circumference was higher than waist circumference for both sexes and across all age groups. The mean waist to hip ratio was 0.9 for both sexes and across all age groups (Table 20 and Table M6, Annex I).
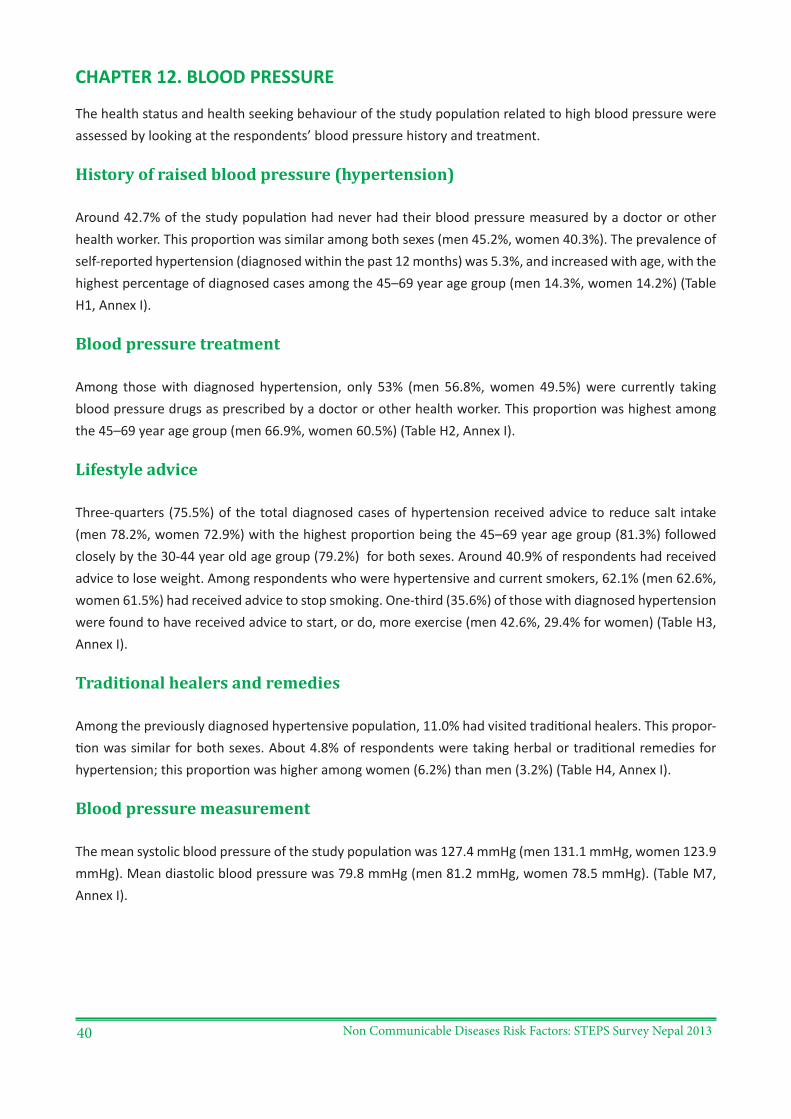
Non Communicable Diseases Risk Factors: STEPS Survey Nepal 201340
CHAPTER 12. BLOOD PRESSURE
The health status and health seeking behaviour of the study population related to high blood pressure were assessed by looking at the respondents’ blood pressure history and treatment.
History of raised blood pressure (hypertension)
Around 42.7% of the study population had never had their blood pressure measured by a doctor or other health worker. This proportion was similar among both sexes (men 45.2%, women 40.3%). The prevalence of self-reported hypertension (diagnosed within the past 12 months) was 5.3%, and increased with age, with the highest percentage of diagnosed cases among the 45–69 year age group (men 14.3%, women 14.2%) (Table H1, Annex I).
Blood pressure treatment
Among those with diagnosed hypertension, only 53% (men 56.8%, women 49.5%) were currently taking blood pressure drugs as prescribed by a doctor or other health worker. This proportion was highest among the 45–69 year age group (men 66.9%, women 60.5%) (Table H2, Annex I).
Lifestyle advice
Three-quarters (75.5%) of the total diagnosed cases of hypertension received advice to reduce salt intake (men 78.2%, women 72.9%) with the highest proportion being the 45–69 year age group (81.3%) followed closely by the 30-44 year old age group (79.2%) for both sexes. Around 40.9% of respondents had received advice to lose weight. Among respondents who were hypertensive and current smokers, 62.1% (men 62.6%, women 61.5%) had received advice to stop smoking. One-third (35.6%) of those with diagnosed hypertension were found to have received advice to start, or do, more exercise (men 42.6%, 29.4% for women) (Table H3, Annex I).
Traditional healers and remedies
Among the previously diagnosed hypertensive population, 11.0% had visited traditional healers. This propor-tion was similar for both sexes. About 4.8% of respondents were taking herbal or traditional remedies for hypertension; this proportion was higher among women (6.2%) than men (3.2%) (Table H4, Annex I).
Blood pressure measurement
The mean systolic blood pressure of the study population was 127.4 mmHg (men 131.1 mmHg, women 123.9 mmHg). Mean diastolic blood pressure was 79.8 mmHg (men 81.2 mmHg, women 78.5 mmHg). (Table M7, Annex I).
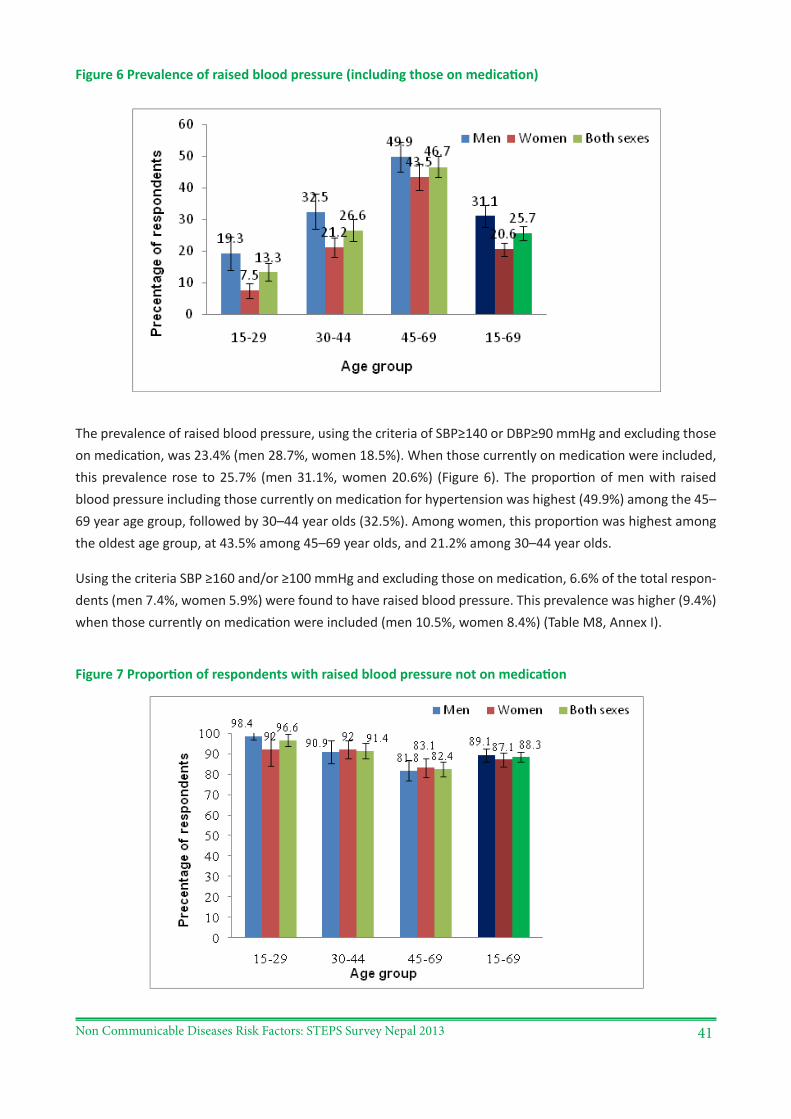
Non Communicable Diseases Risk Factors: STEPS Survey Nepal 2013 41
Figure 6 Prevalence of raised blood pressure (including those on medication)
The prevalence of raised blood pressure, using the criteria of SBP≥140 or DBP≥90 mmHg and excluding those on medication, was 23.4% (men 28.7%, women 18.5%). When those currently on medication were included, this prevalence rose to 25.7% (men 31.1%, women 20.6%) (Figure 6). The proportion of men with raised blood pressure including those currently on medication for hypertension was highest (49.9%) among the 45–69 year age group, followed by 30–44 year olds (32.5%). Among women, this proportion was highest among the oldest age group, at 43.5% among 45–69 year olds, and 21.2% among 30–44 year olds.
Using the criteria SBP ≥160 and/or ≥100 mmHg and excluding those on medication, 6.6% of the total respon-dents (men 7.4%, women 5.9%) were found to have raised blood pressure. This prevalence was higher (9.4%) when those currently on medication were included (men 10.5%, women 8.4%) (Table M8, Annex I).
Figure 7 Proportion of respondents with raised blood pressure not on medication
Non Communicable Diseases Risk Factors: STEPS Survey Nepal 201342
Among those with raised blood pressure (characterized as SBP≥140 and/or DBP≥90 mmHg), nearly 9 out of 10 were not on medication. This proportion was 89.1% for men and 87.1% for women (Figure 7 and Table M9, Annex I).
Pulse rate
The mean heart rate of respondents was 78.3 beats per minute among men, 82.3 beats per minute among women and 80.4 beats per minute among total respondents. The heart rate of the study population was within the normal range (Table M10, Annex I).
Non Communicable Diseases Risk Factors: STEPS Survey Nepal 2013 43
CHAPTER 13. BLOOD GLUCOSE
History of raised blood glucose (diabetes mellitus)
The diabetes status of the survey population was identified by looking for any documented evidence of dia-betic medication. Around 89.2% of the study population had never measured their blood glucose in their life-time. This proportion was higher among women (91.7%) than men (86.6%) and higher among the 15–29 year age group (men 92.7%, women 94.6%). Among the study population, 8.7% (men 10.8%, women 6.7%) had measured their blood glucose level in the past, but had never been diagnosed with diabetes. This proportion was higher in the older age groups. The prevalence of self-reported diabetes (within the last 12 months) was 1.9% (men 2.4%, women 1.4%). This proportion was highest among the 45–69 year age group in both sexes (men 6.6%, women 4.6%) (Table H5, Annex I).
Diabetes treatment
Among those respondents previously diagnosed with diabetes, 9.4% were taking insulin. This proportion was more than double (12.1%) among men when compared to women (5.2%). Around 63.4% (men 61.1%, women 67.0%) were taking oral drugs for diabetes. These results indicate that most of the diagnosed diabetic popu-lation is being treated with oral medication (Table H6, Annex I). Among total respondents, 1.4% (men 1.7%, women 1.1%) were found to be receiving treatment (oral medicine or insulin) for diabetes. This proportion was highest in the 45–69 year age group at 4.7% (men 5.8%, women 3.6%) (Tables M8 and M11, Annex I).
Lifestyle advice
Two-thirds (69.1%) of respondents previously diagnosed with diabetes were found to have received advice from a doctor or health worker to eat a special prescribed diet. This proportion was higher among men (74.5%) than women (60.6%). Around 51.4% of respondents with diabetes had been advised to lose weight. Among those with diabetes who were current smokers, 41.4% were advised to quit smoking. Nearly two-thirds of respondents (61.2%) were advised to start, or do more, exercise. This proportion was higher among men (70.2%) than women (47.0%) (Table H7, Annex I).
Traditional healers and remedies
Around 8.8% of the known diabetic respondents had visited a traditional healer and 14.2% were taking herbal and traditional treatments for diabetes. This proportion was similar among both sexes (Table H8, Annex I).
Blood glucose measurement
Blood glucose was measured as per STEP III following the guidelines and using the validated equipment mentioned in the data collection section. About 90% of respondents consented to biochemical measure-ment and the provision of blood samples to ascertain their biological risk factors. Among those who con-sented, the mean fasting blood glucose was 93.4 mg/dl for men, 89.7 mg/dl for women and 91.5 mg/dl for all respondents (Table M12, Annex I). The prevalence of impaired fasting glycaemia (IFG), defined as plasma venous value ≥110 mg/dl to <126mg/dl, was 4.1% (men 5.1%, women 3.2%). Among men, the proportion
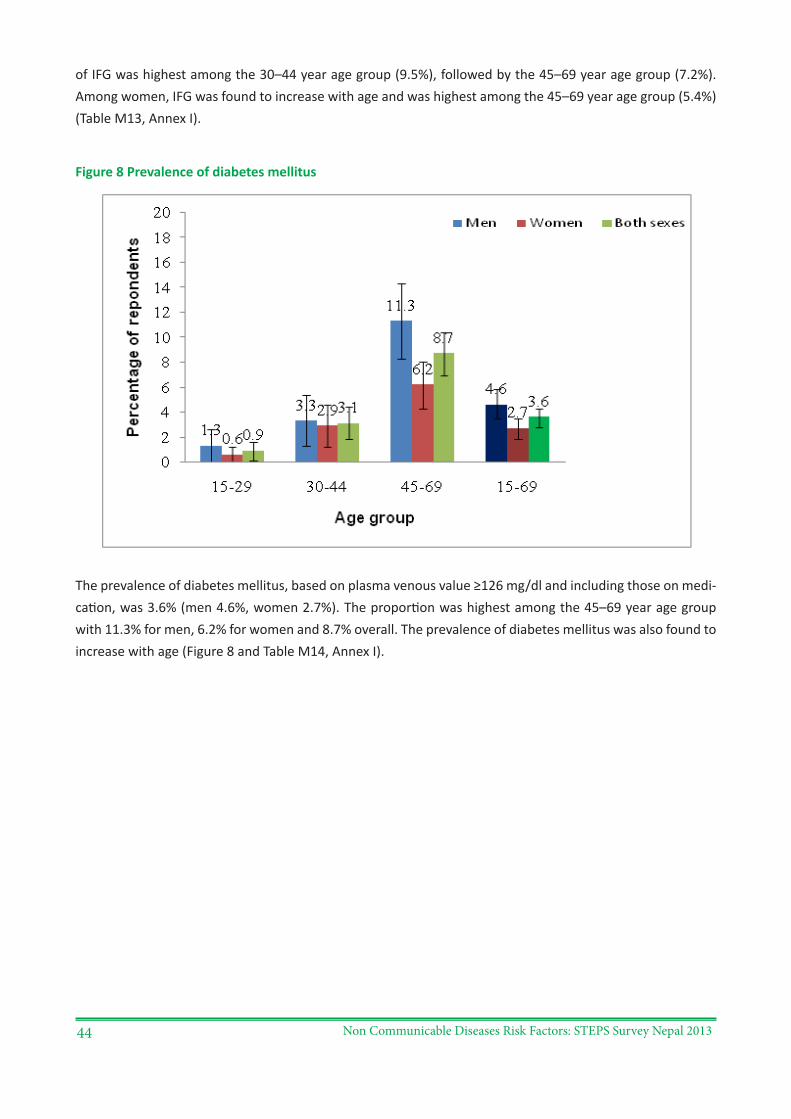
Non Communicable Diseases Risk Factors: STEPS Survey Nepal 201344
of IFG was highest among the 30–44 year age group (9.5%), followed by the 45–69 year age group (7.2%). Among women, IFG was found to increase with age and was highest among the 45–69 year age group (5.4%) (Table M13, Annex I).
Figure 8 Prevalence of diabetes mellitus
The prevalence of diabetes mellitus, based on plasma venous value ≥126 mg/dl and including those on medi-cation, was 3.6% (men 4.6%, women 2.7%). The proportion was highest among the 45–69 year age group with 11.3% for men, 6.2% for women and 8.7% overall. The prevalence of diabetes mellitus was also found to increase with age (Figure 8 and Table M14, Annex I).
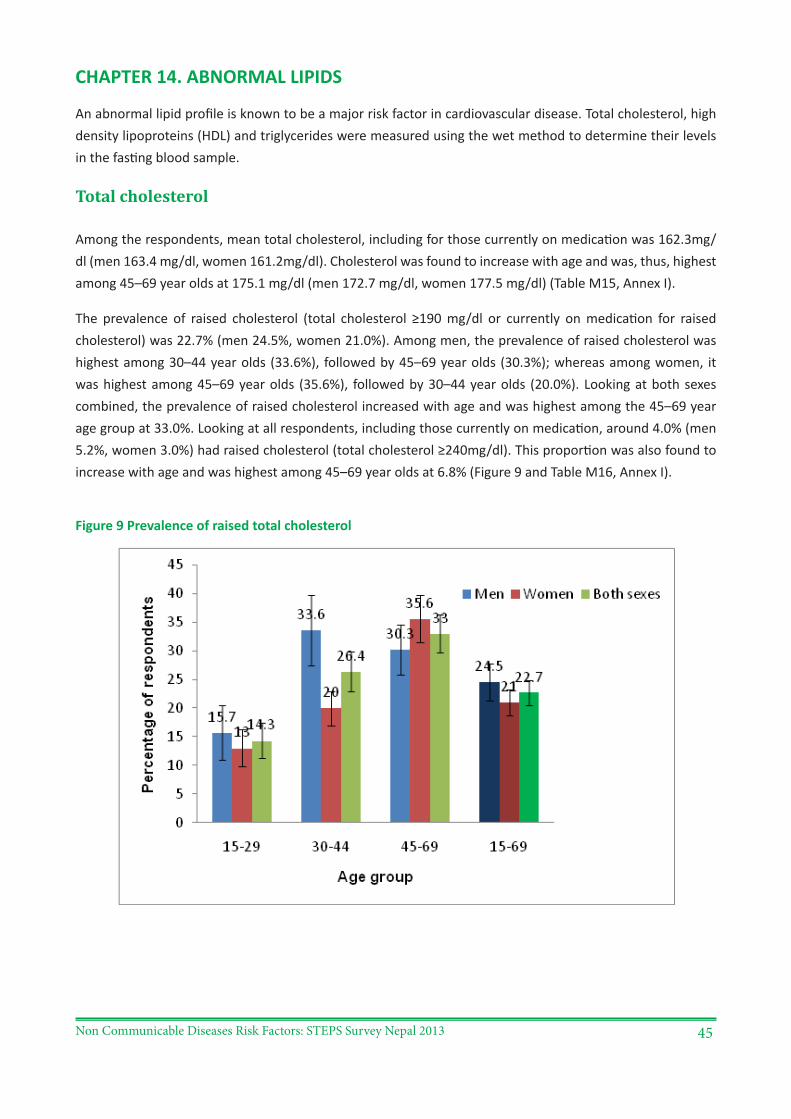
Non Communicable Diseases Risk Factors: STEPS Survey Nepal 2013 45
CHAPTER 14. ABNORMAL LIPIDS
An abnormal lipid profile is known to be a major risk factor in cardiovascular disease. Total cholesterol, high density lipoproteins (HDL) and triglycerides were measured using the wet method to determine their levels in the fasting blood sample.
Total cholesterol
Among the respondents, mean total cholesterol, including for those currently on medication was 162.3mg/dl (men 163.4 mg/dl, women 161.2mg/dl). Cholesterol was found to increase with age and was, thus, highest among 45–69 year olds at 175.1 mg/dl (men 172.7 mg/dl, women 177.5 mg/dl) (Table M15, Annex I).
The prevalence of raised cholesterol (total cholesterol ≥190 mg/dl or currently on medication for raised cholesterol) was 22.7% (men 24.5%, women 21.0%). Among men, the prevalence of raised cholesterol was highest among 30–44 year olds (33.6%), followed by 45–69 year olds (30.3%); whereas among women, it was highest among 45–69 year olds (35.6%), followed by 30–44 year olds (20.0%). Looking at both sexes combined, the prevalence of raised cholesterol increased with age and was highest among the 45–69 year age group at 33.0%. Looking at all respondents, including those currently on medication, around 4.0% (men 5.2%, women 3.0%) had raised cholesterol (total cholesterol ≥240mg/dl). This proportion was also found to increase with age and was highest among 45–69 year olds at 6.8% (Figure 9 and Table M16, Annex I).
Figure 9 Prevalence of raised total cholesterol
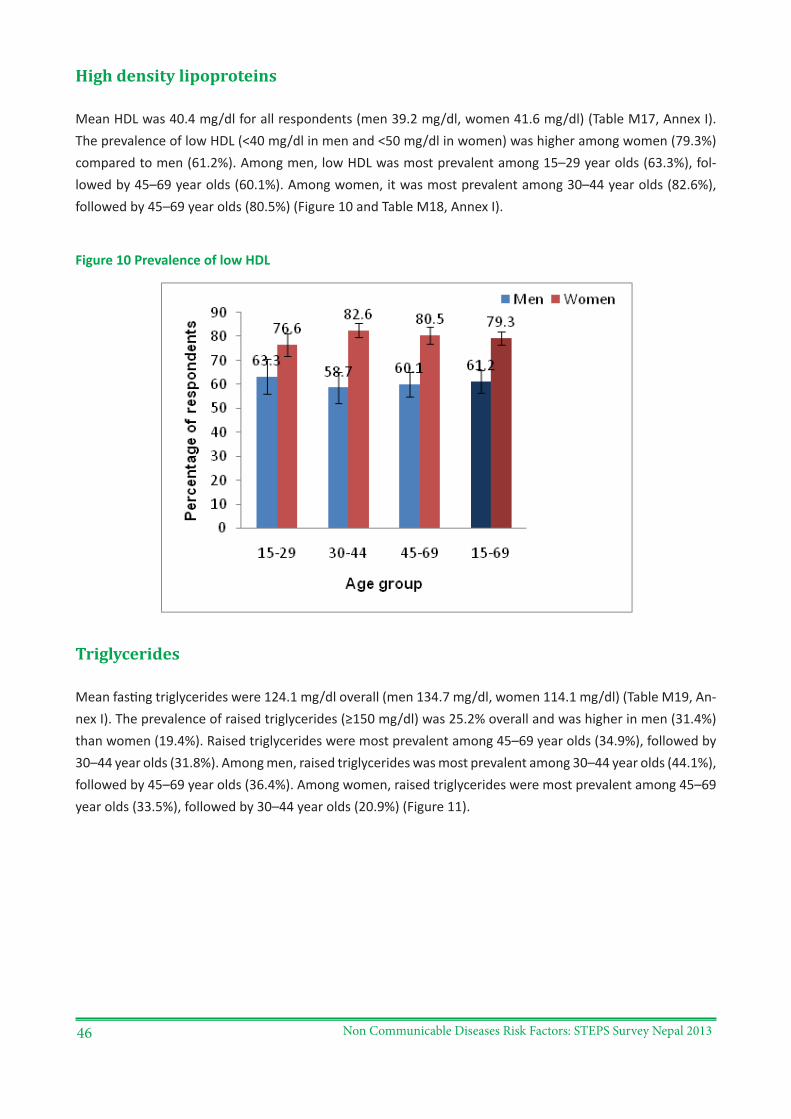
Non Communicable Diseases Risk Factors: STEPS Survey Nepal 201346
High density lipoproteins
Mean HDL was 40.4 mg/dl for all respondents (men 39.2 mg/dl, women 41.6 mg/dl) (Table M17, Annex I). The prevalence of low HDL (<40 mg/dl in men and <50 mg/dl in women) was higher among women (79.3%) compared to men (61.2%). Among men, low HDL was most prevalent among 15–29 year olds (63.3%), fol-lowed by 45–69 year olds (60.1%). Among women, it was most prevalent among 30–44 year olds (82.6%), followed by 45–69 year olds (80.5%) (Figure 10 and Table M18, Annex I).
Figure 10 Prevalence of low HDL
Triglycerides
Mean fasting triglycerides were 124.1 mg/dl overall (men 134.7 mg/dl, women 114.1 mg/dl) (Table M19, An-nex I). The prevalence of raised triglycerides (≥150 mg/dl) was 25.2% overall and was higher in men (31.4%) than women (19.4%). Raised triglycerides were most prevalent among 45–69 year olds (34.9%), followed by 30–44 year olds (31.8%). Among men, raised triglycerides was most prevalent among 30–44 year olds (44.1%), followed by 45–69 year olds (36.4%). Among women, raised triglycerides were most prevalent among 45–69 year olds (33.5%), followed by 30–44 year olds (20.9%) (Figure 11).
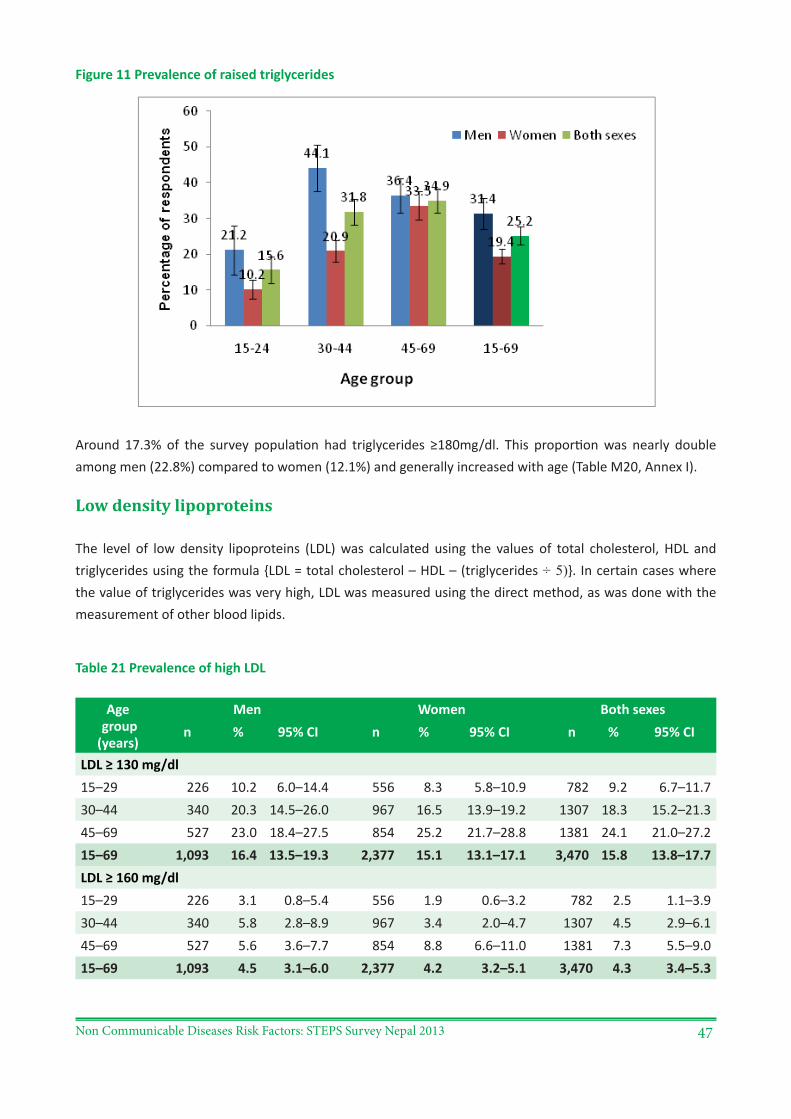
Non Communicable Diseases Risk Factors: STEPS Survey Nepal 2013 47
Figure 11 Prevalence of raised triglycerides
Around 17.3% of the survey population had triglycerides ≥180mg/dl. This proportion was nearly double among men (22.8%) compared to women (12.1%) and generally increased with age (Table M20, Annex I).
Low density lipoproteins
The level of low density lipoproteins (LDL) was calculated using the values of total cholesterol, HDL and triglycerides using the formula {LDL = total cholesterol – HDL – (triglycerides ÷ 5)}. In certain cases where the value of triglycerides was very high, LDL was measured using the direct method, as was done with the measurement of other blood lipids.
Table 21 Prevalence of high LDL
Age group (years)
Men Women Both sexesn % 95% CI n % 95% CI n % 95% CI
LDL ≥ 130 mg/dl15–29 226 10.2 6.0–14.4 556 8.3 5.8–10.9 782 9.2 6.7–11.730–44 340 20.3 14.5–26.0 967 16.5 13.9–19.2 1307 18.3 15.2–21.345–69 527 23.0 18.4–27.5 854 25.2 21.7–28.8 1381 24.1 21.0–27.215–69 1,093 16.4 13.5–19.3 2,377 15.1 13.1–17.1 3,470 15.8 13.8–17.7LDL ≥ 160 mg/dl15–29 226 3.1 0.8–5.4 556 1.9 0.6–3.2 782 2.5 1.1–3.930–44 340 5.8 2.8–8.9 967 3.4 2.0–4.7 1307 4.5 2.9–6.145–69 527 5.6 3.6–7.7 854 8.8 6.6–11.0 1381 7.3 5.5–9.015–69 1,093 4.5 3.1–6.0 2,377 4.2 3.2–5.1 3,470 4.3 3.4–5.3
Non Communicable Diseases Risk Factors: STEPS Survey Nepal 201348
Mean LDL among total respondents was found to be 99.3 mg/dl, with similar figures for men and women (Table M21, Annex I). The prevalence of raised LDL, using the criteria ≥ 130 mg/dl, was 15.8% (men 16.4%, women 15.1%). This was highest among 45–69 year olds at 24.1% followed by 30–44 year olds at 18.3%. The proportion with raised LDL was distributed in a similar pattern for the three age groups among both men and women. Only 4.3% of respondents had raised LDL ≥ 160 mg/dl (men 4.5%, women 4.2%) (Table 21).
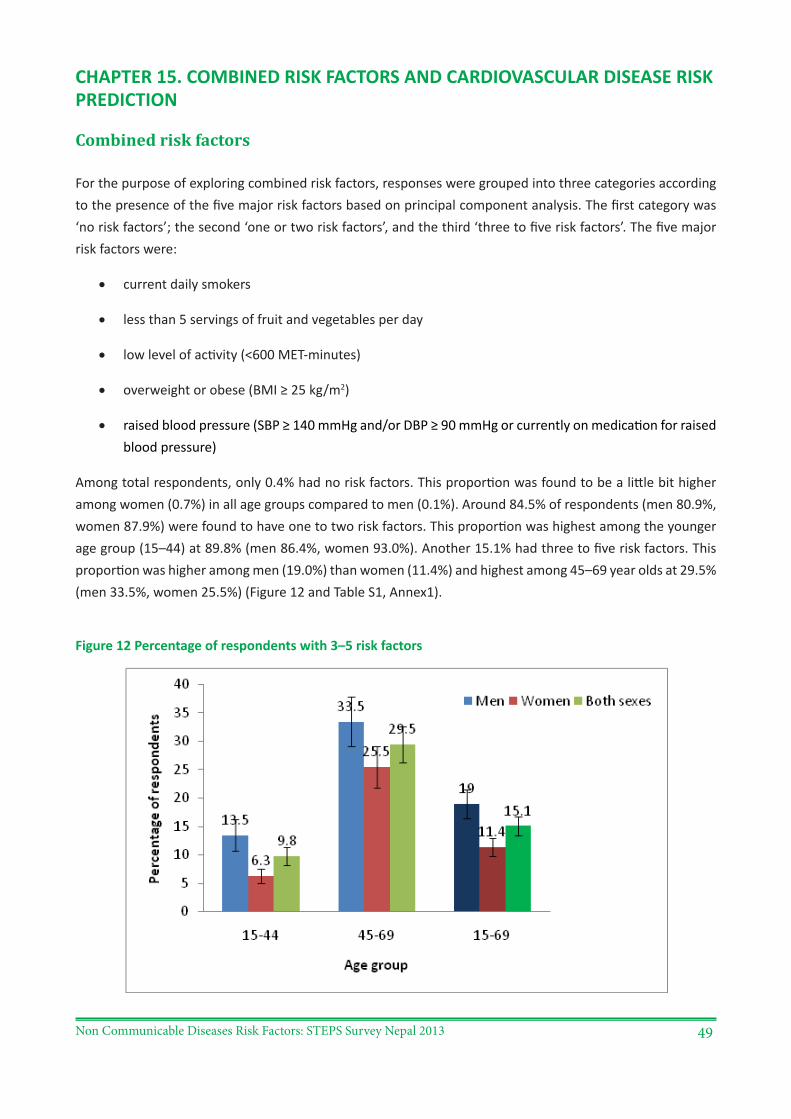
Non Communicable Diseases Risk Factors: STEPS Survey Nepal 2013 49
CHAPTER 15. COMBINED RISK FACTORS AND CARDIOVASCULAR DISEASE RISK PREDICTION
Combined risk factors
For the purpose of exploring combined risk factors, responses were grouped into three categories according to the presence of the five major risk factors based on principal component analysis. The first category was ‘no risk factors’; the second ‘one or two risk factors’, and the third ‘three to five risk factors’. The five major risk factors were:
• current daily smokers
• less than 5 servings of fruit and vegetables per day
• low level of activity (<600 MET-minutes)
• overweight or obese (BMI ≥ 25 kg/m2)
• raised blood pressure (SBP ≥ 140 mmHg and/or DBP ≥ 90 mmHg or currently on medication for raised blood pressure)
Among total respondents, only 0.4% had no risk factors. This proportion was found to be a little bit higher among women (0.7%) in all age groups compared to men (0.1%). Around 84.5% of respondents (men 80.9%, women 87.9%) were found to have one to two risk factors. This proportion was highest among the younger age group (15–44) at 89.8% (men 86.4%, women 93.0%). Another 15.1% had three to five risk factors. This proportion was higher among men (19.0%) than women (11.4%) and highest among 45–69 year olds at 29.5% (men 33.5%, women 25.5%) (Figure 12 and Table S1, Annex1).
Figure 12 Percentage of respondents with 3–5 risk factors
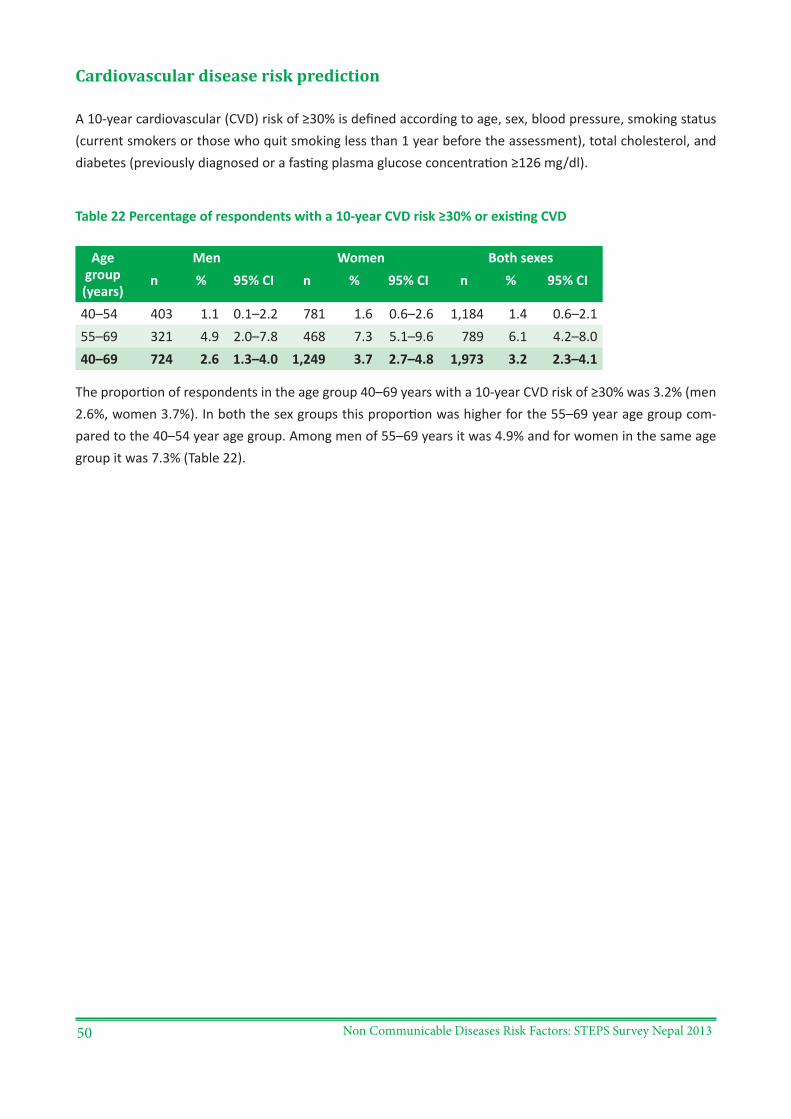
Non Communicable Diseases Risk Factors: STEPS Survey Nepal 201350
Cardiovascular disease risk prediction
A 10-year cardiovascular (CVD) risk of ≥30% is defined according to age, sex, blood pressure, smoking status (current smokers or those who quit smoking less than 1 year before the assessment), total cholesterol, and diabetes (previously diagnosed or a fasting plasma glucose concentration ≥126 mg/dl).
Table 22 Percentage of respondents with a 10-year CVD risk ≥30% or existing CVD
Age group (years)
Men Women Both sexesn % 95% CI n % 95% CI n % 95% CI
40–54 403 1.1 0.1–2.2 781 1.6 0.6–2.6 1,184 1.4 0.6–2.155–69 321 4.9 2.0–7.8 468 7.3 5.1–9.6 789 6.1 4.2–8.040–69 724 2.6 1.3–4.0 1,249 3.7 2.7–4.8 1,973 3.2 2.3–4.1
The proportion of respondents in the age group 40–69 years with a 10-year CVD risk of ≥30% was 3.2% (men 2.6%, women 3.7%). In both the sex groups this proportion was higher for the 55–69 year age group com-pared to the 40–54 year age group. Among men of 55–69 years it was 4.9% and for women in the same age group it was 7.3% (Table 22).
Non Communicable Diseases Risk Factors: STEPS Survey Nepal 2013 51
CHAPTER 16. CONCLUSION AND RECOMMENDATIONS
Conclusion
This national survey found the magnitude of the major NCD risk factors – both modifiable behavioural risk factors (tobacco use, alcohol consumption, low fruit and vegetable consumption, and physical inactivity) as well as biological risk factors (overweight, obesity, raised blood pressure, raised blood glucose and abnormal lipids) – to be remarkably high. Most of the risk factors, such as tobacco use, alcohol consumption, raised blood pressure, raised blood glucose, raised total cholesterol and raised triglycerides, were more prevalent among men than women. However, obesity and low HDL was more prevalent among women. Nearly one in every two men between 15 and 69 years was found to be consuming tobacco in either its smoke or smoke-less form. Furthermore, a quarter of the population aged 15–69 years was found to have raised blood pres-sure. Even though the prevalence of raised blood pressure was low (13.3%) among 15–29 year olds, it was high among 30–44 year olds (26.6%) and even higher among 45–69 year olds (46.7%), with similar patterns among men and women. In addition, 9 out of 10 adults with raised blood pressure were not currently receiv-ing treatment. Tobacco use, low level of physical activity, obesity, raised blood pressure, raised blood glucose and abnormal lipids were more prevalent among older respondents (aged 45–69 years) than the younger age groups. The prevalence of alcohol consumption was slightly higher among 30–44 year olds. The prevalence of raised total cholesterol is also alarming with more than one-fifths of the adult population having raised total cholesterol. As with raised blood pressure, the prevalence of raised total cholesterol was higher among the older age groups (30–44 years and 45–69 years).
Only 0.4% of the study population was found to be totally free of established NCD risk factors. Hence, a mas-sive 99.6% had at least one risk factor. This indicates that the burden of NCDs is likely to become unbearable in future if the Government of Nepal does not address the issue in time. Based on a number of risk factors (age, sex, smoking status, raised blood pressure, raised blood glucose and raised total cholesterol), the pro-portion of 40–69 year old adults with a 10-year risk of cardiovascular disease ≥30% was also substantial at 3.2%, with the proportion being almost double (6.1%) among the 55–69 year age group. Preventing and con-trolling NCD risk factors is easier and less costly than treating NCDs. However, there has been negligible action taken to prevent and control NCDs and their risk factors in Nepal so far.
Recommendations
This national NCD risk factor survey provides information on key indicators of NCD risk factors. The findings will be useful to policy makers, programme managers and researchers in the design and implementation of interventions for the prevention and control of NCD risk factors. The study shows that the use of tobac-co, harmful alcohol consumption, inadequate intake of fruit and vegetables, obesity, raised blood pressure, raised blood glucose and abnormal lipids are common in Nepal. Almost all of the respondents to the survey in Nepal had at least one of these major risk factors.
In order to reduce the risks associated with NCDs, as well as to promote interventions to prevent and control them, a comprehensive approach is needed that involves all sectors, including health, finance, home affairs, education, agriculture, and planning, among others. The attention of external development partners is also required in this fight against NCDs in Nepal.
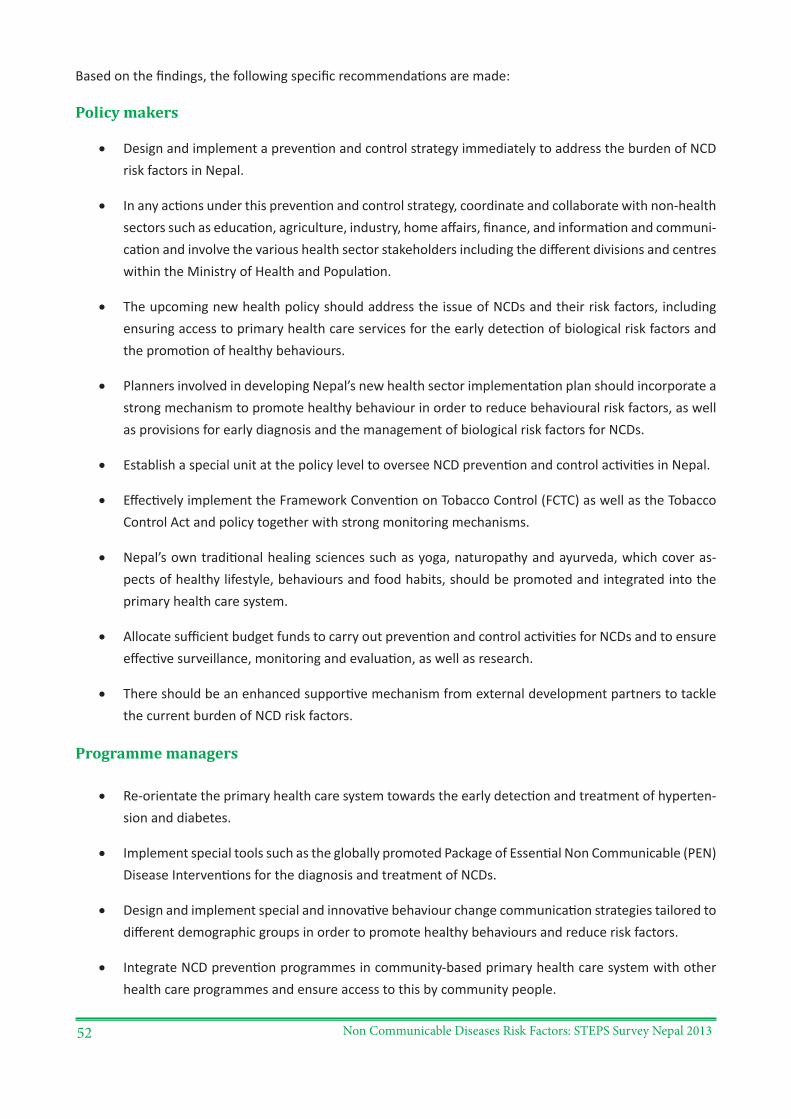
Non Communicable Diseases Risk Factors: STEPS Survey Nepal 201352
Based on the findings, the following specific recommendations are made:
Policy makers
• Design and implement a prevention and control strategy immediately to address the burden of NCD risk factors in Nepal.
• In any actions under this prevention and control strategy, coordinate and collaborate with non-health sectors such as education, agriculture, industry, home affairs, finance, and information and communi-cation and involve the various health sector stakeholders including the different divisions and centres within the Ministry of Health and Population.
• The upcoming new health policy should address the issue of NCDs and their risk factors, including ensuring access to primary health care services for the early detection of biological risk factors and the promotion of healthy behaviours.
• Planners involved in developing Nepal’s new health sector implementation plan should incorporate a strong mechanism to promote healthy behaviour in order to reduce behavioural risk factors, as well as provisions for early diagnosis and the management of biological risk factors for NCDs.
• Establish a special unit at the policy level to oversee NCD prevention and control activities in Nepal.
• Effectively implement the Framework Convention on Tobacco Control (FCTC) as well as the Tobacco Control Act and policy together with strong monitoring mechanisms.
• Nepal’s own traditional healing sciences such as yoga, naturopathy and ayurveda, which cover as-pects of healthy lifestyle, behaviours and food habits, should be promoted and integrated into the primary health care system.
• Allocate sufficient budget funds to carry out prevention and control activities for NCDs and to ensure effective surveillance, monitoring and evaluation, as well as research.
• There should be an enhanced supportive mechanism from external development partners to tackle the current burden of NCD risk factors.
Programme managers
• Re-orientate the primary health care system towards the early detection and treatment of hyperten-sion and diabetes.
• Implement special tools such as the globally promoted Package of Essential Non Communicable (PEN) Disease Interventions for the diagnosis and treatment of NCDs.
• Design and implement special and innovative behaviour change communication strategies tailored to different demographic groups in order to promote healthy behaviours and reduce risk factors.
• Integrate NCD prevention programmes in community-based primary health care system with other health care programmes and ensure access to this by community people.
Non Communicable Diseases Risk Factors: STEPS Survey Nepal 2013 53
• Strengthen health education and promotion as well as counselling to promote healthy behaviours in primary care settings.
• Formulate strategies to promote the accessibility, availability and consumption of fruit and vegeta-bles by all people all year round.
• Implement interventions at all levels with strong monitoring mechanisms.
• Ensure that an NCD surveillance system is in place (this is essential).
• Assess interventions to promote healthy behaviours and reduce the burden of NCD risk factors in order to provide locally-generated evidence for the implementation of NCD prevention and control activities by policy makers and programme managers.
• Evaluate the effectiveness of programmes implemented to prevent and control NCDs and NCD risk factors.
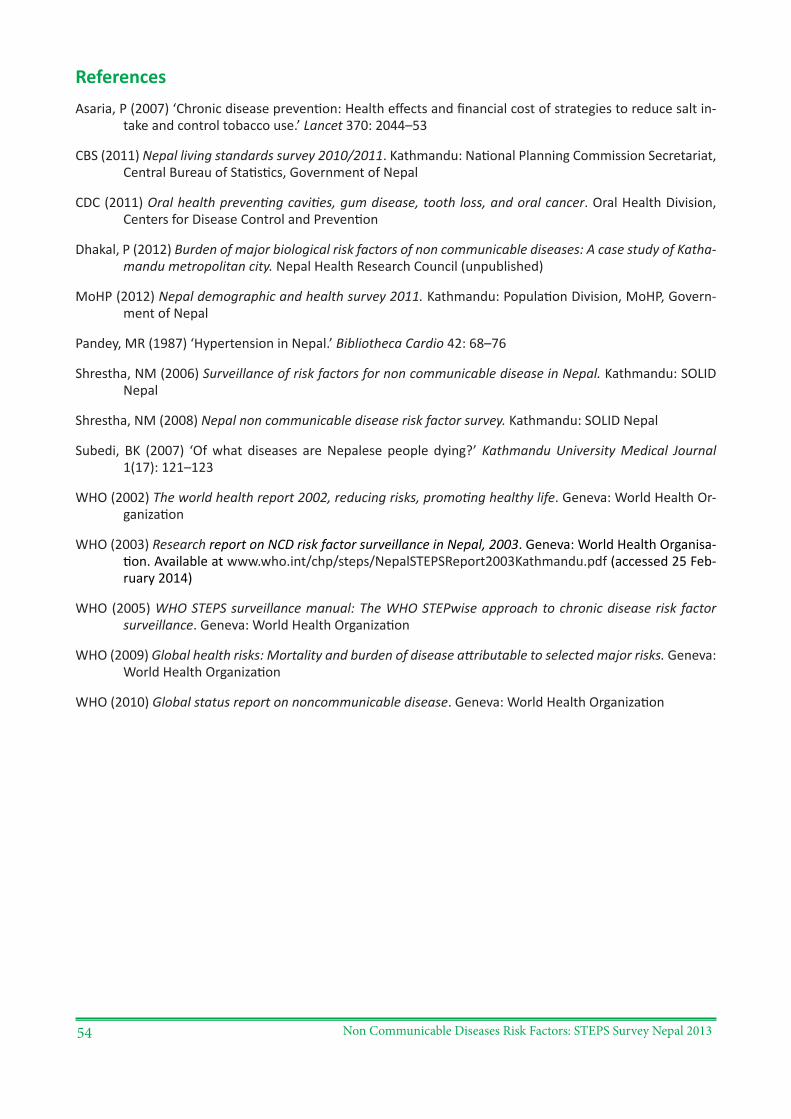
Non Communicable Diseases Risk Factors: STEPS Survey Nepal 201354
ReferencesAsaria, P (2007) ‘Chronic disease prevention: Health effects and financial cost of strategies to reduce salt in-
take and control tobacco use.’ Lancet 370: 2044–53
CBS (2011) Nepal living standards survey 2010/2011. Kathmandu: National Planning Commission Secretariat, Central Bureau of Statistics, Government of Nepal
CDC (2011) Oral health preventing cavities, gum disease, tooth loss, and oral cancer. Oral Health Division, Centers for Disease Control and Prevention
Dhakal, P (2012) Burden of major biological risk factors of non communicable diseases: A case study of Katha-mandu metropolitan city. Nepal Health Research Council (unpublished)
MoHP (2012) Nepal demographic and health survey 2011. Kathmandu: Population Division, MoHP, Govern-ment of Nepal
Pandey, MR (1987) ‘Hypertension in Nepal.’ Bibliotheca Cardio 42: 68–76
Shrestha, NM (2006) Surveillance of risk factors for non communicable disease in Nepal. Kathmandu: SOLID Nepal
Shrestha, NM (2008) Nepal non communicable disease risk factor survey. Kathmandu: SOLID Nepal
Subedi, BK (2007) ‘Of what diseases are Nepalese people dying?’ Kathmandu University Medical Journal 1(17): 121–123
WHO (2002) The world health report 2002, reducing risks, promoting healthy life. Geneva: World Health Or-ganization
WHO (2003) Research report on NCD risk factor surveillance in Nepal, 2003. Geneva: World Health Organisa-tion. Available at www.who.int/chp/steps/NepalSTEPSReport2003Kathmandu.pdf (accessed 25 Feb-ruary 2014)
WHO (2005) WHO STEPS surveillance manual: The WHO STEPwise approach to chronic disease risk factor surveillance. Geneva: World Health Organization
WHO (2009) Global health risks: Mortality and burden of disease attributable to selected major risks. Geneva: World Health Organization
WHO (2010) Global status report on noncommunicable disease. Geneva: World Health Organization
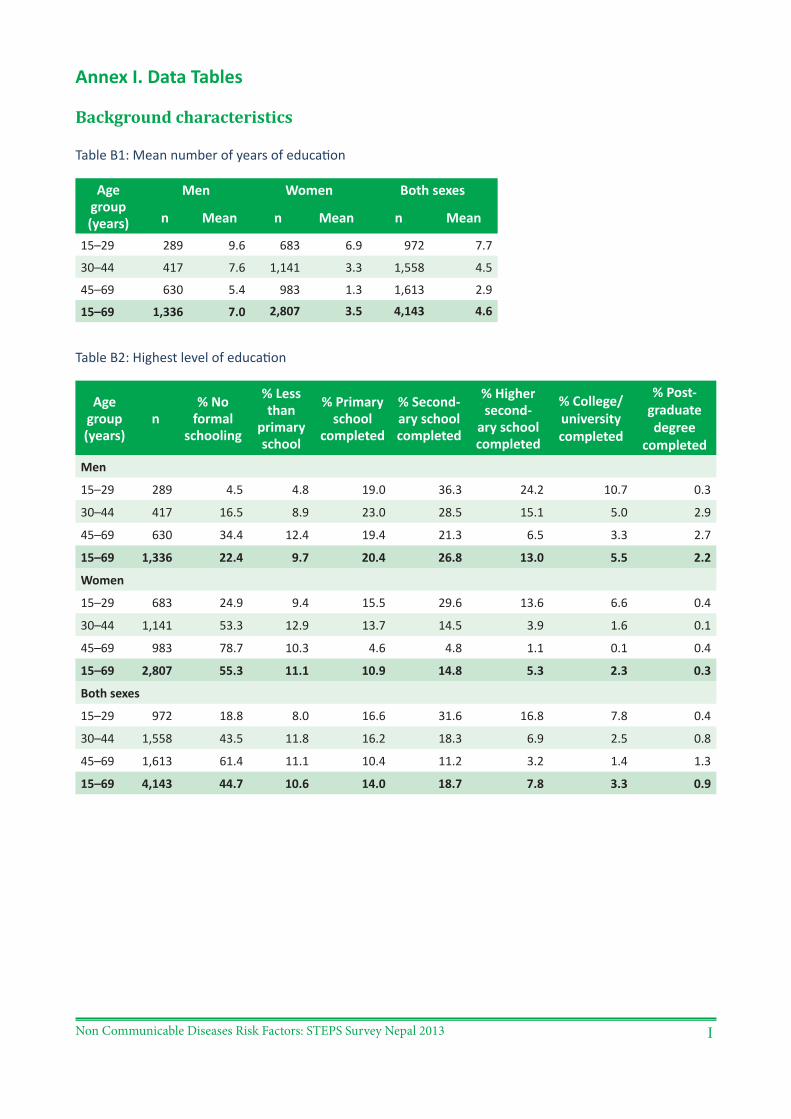
Non Communicable Diseases Risk Factors: STEPS Survey Nepal 2013 I
Annex I. Data Tables
Background characteristics
Table B1: Mean number of years of education
Age group (years)
Men Women Both sexes
n Mean n Mean n Mean
15–29 289 9.6 683 6.9 972 7.7
30–44 417 7.6 1,141 3.3 1,558 4.5
45–69 630 5.4 983 1.3 1,613 2.9
15–69 1,336 7.0 2,807 3.5 4,143 4.6
Table B2: Highest level of education
Age group (years)
n% No
formal schooling
% Less than
primary school
% Primary school
completed
% Second-ary school completed
% Higher second-
ary school completed
% College/ university completed
% Post-graduate degree
completedMen
15–29 289 4.5 4.8 19.0 36.3 24.2 10.7 0.3
30–44 417 16.5 8.9 23.0 28.5 15.1 5.0 2.9
45–69 630 34.4 12.4 19.4 21.3 6.5 3.3 2.7
15–69 1,336 22.4 9.7 20.4 26.8 13.0 5.5 2.2
Women
15–29 683 24.9 9.4 15.5 29.6 13.6 6.6 0.4
30–44 1,141 53.3 12.9 13.7 14.5 3.9 1.6 0.1
45–69 983 78.7 10.3 4.6 4.8 1.1 0.1 0.4
15–69 2,807 55.3 11.1 10.9 14.8 5.3 2.3 0.3
Both sexes
15–29 972 18.8 8.0 16.6 31.6 16.8 7.8 0.4
30–44 1,558 43.5 11.8 16.2 18.3 6.9 2.5 0.8
45–69 1,613 61.4 11.1 10.4 11.2 3.2 1.4 1.3
15–69 4,143 44.7 10.6 14.0 18.7 7.8 3.3 0.9
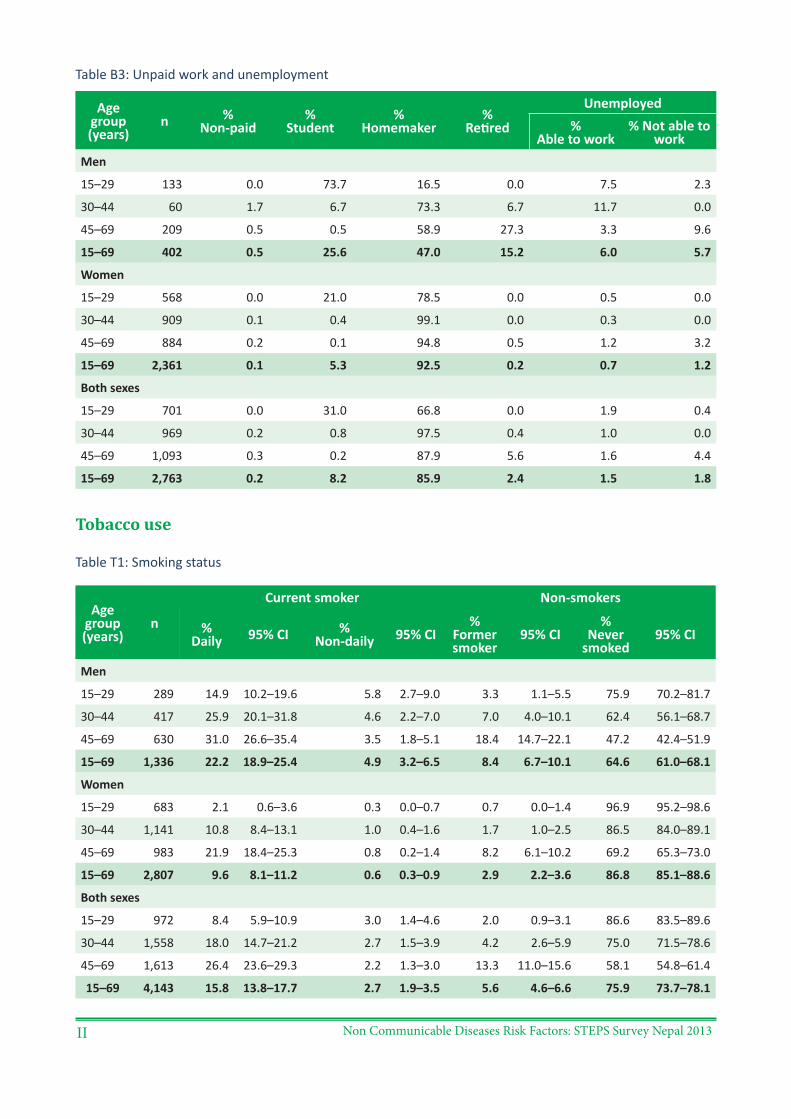
Non Communicable Diseases Risk Factors: STEPS Survey Nepal 2013II
Table B3: Unpaid work and unemployment
Age group (years)
n % Non-paid
% Student
% Homemaker
% Retired
Unemployed%
Able to work% Not able to
workMen
15–29 133 0.0 73.7 16.5 0.0 7.5 2.3
30–44 60 1.7 6.7 73.3 6.7 11.7 0.0
45–69 209 0.5 0.5 58.9 27.3 3.3 9.6
15–69 402 0.5 25.6 47.0 15.2 6.0 5.7
Women
15–29 568 0.0 21.0 78.5 0.0 0.5 0.0
30–44 909 0.1 0.4 99.1 0.0 0.3 0.0
45–69 884 0.2 0.1 94.8 0.5 1.2 3.2
15–69 2,361 0.1 5.3 92.5 0.2 0.7 1.2
Both sexes
15–29 701 0.0 31.0 66.8 0.0 1.9 0.4
30–44 969 0.2 0.8 97.5 0.4 1.0 0.0
45–69 1,093 0.3 0.2 87.9 5.6 1.6 4.4
15–69 2,763 0.2 8.2 85.9 2.4 1.5 1.8
Tobacco use
Table T1: Smoking status
Age group (years)
n
Current smoker Non-smokers
% Daily 95% CI %
Non-daily 95% CI%
Former smoker
95% CI%
Never smoked
95% CI
Men
15–29 289 14.9 10.2–19.6 5.8 2.7–9.0 3.3 1.1–5.5 75.9 70.2–81.7
30–44 417 25.9 20.1–31.8 4.6 2.2–7.0 7.0 4.0–10.1 62.4 56.1–68.7
45–69 630 31.0 26.6–35.4 3.5 1.8–5.1 18.4 14.7–22.1 47.2 42.4–51.9
15–69 1,336 22.2 18.9–25.4 4.9 3.2–6.5 8.4 6.7–10.1 64.6 61.0–68.1
Women
15–29 683 2.1 0.6–3.6 0.3 0.0–0.7 0.7 0.0–1.4 96.9 95.2–98.6
30–44 1,141 10.8 8.4–13.1 1.0 0.4–1.6 1.7 1.0–2.5 86.5 84.0–89.1
45–69 983 21.9 18.4–25.3 0.8 0.2–1.4 8.2 6.1–10.2 69.2 65.3–73.0
15–69 2,807 9.6 8.1–11.2 0.6 0.3–0.9 2.9 2.2–3.6 86.8 85.1–88.6
Both sexes
15–29 972 8.4 5.9–10.9 3.0 1.4–4.6 2.0 0.9–3.1 86.6 83.5–89.6
30–44 1,558 18.0 14.7–21.2 2.7 1.5–3.9 4.2 2.6–5.9 75.0 71.5–78.6
45–69 1,613 26.4 23.6–29.3 2.2 1.3–3.0 13.3 11.0–15.6 58.1 54.8–61.4
15–69 4,143 15.8 13.8–17.7 2.7 1.9–3.5 5.6 4.6–6.6 75.9 73.7–78.1
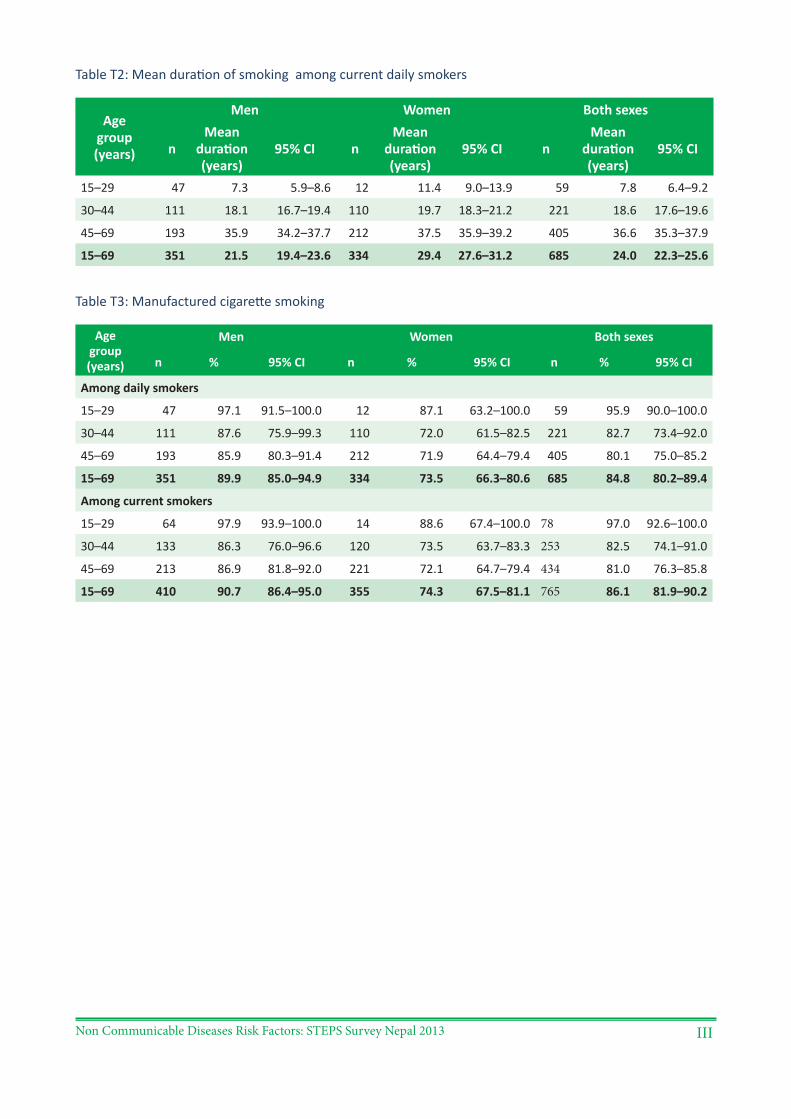
Non Communicable Diseases Risk Factors: STEPS Survey Nepal 2013 III
Table T2: Mean duration of smoking among current daily smokers
Age group (years)
Men Women Both sexes
nMean
duration (years)
95% CI nMean
duration (years)
95% CI nMean
duration (years)
95% CI
15–29 47 7.3 5.9–8.6 12 11.4 9.0–13.9 59 7.8 6.4–9.2
30–44 111 18.1 16.7–19.4 110 19.7 18.3–21.2 221 18.6 17.6–19.6
45–69 193 35.9 34.2–37.7 212 37.5 35.9–39.2 405 36.6 35.3–37.9
15–69 351 21.5 19.4–23.6 334 29.4 27.6–31.2 685 24.0 22.3–25.6
Table T3: Manufactured cigarette smoking
Age group (years)
Men Women Both sexes
n % 95% CI n % 95% CI n % 95% CI
Among daily smokers
15–29 47 97.1 91.5–100.0 12 87.1 63.2–100.0 59 95.9 90.0–100.0
30–44 111 87.6 75.9–99.3 110 72.0 61.5–82.5 221 82.7 73.4–92.0
45–69 193 85.9 80.3–91.4 212 71.9 64.4–79.4 405 80.1 75.0–85.2
15–69 351 89.9 85.0–94.9 334 73.5 66.3–80.6 685 84.8 80.2–89.4
Among current smokers
15–29 64 97.9 93.9–100.0 14 88.6 67.4–100.0 78 97.0 92.6–100.0
30–44 133 86.3 76.0–96.6 120 73.5 63.7–83.3 253 82.5 74.1–91.0
45–69 213 86.9 81.8–92.0 221 72.1 64.7–79.4 434 81.0 76.3–85.8
15–69 410 90.7 86.4–95.0 355 74.3 67.5–81.1 765 86.1 81.9–90.2
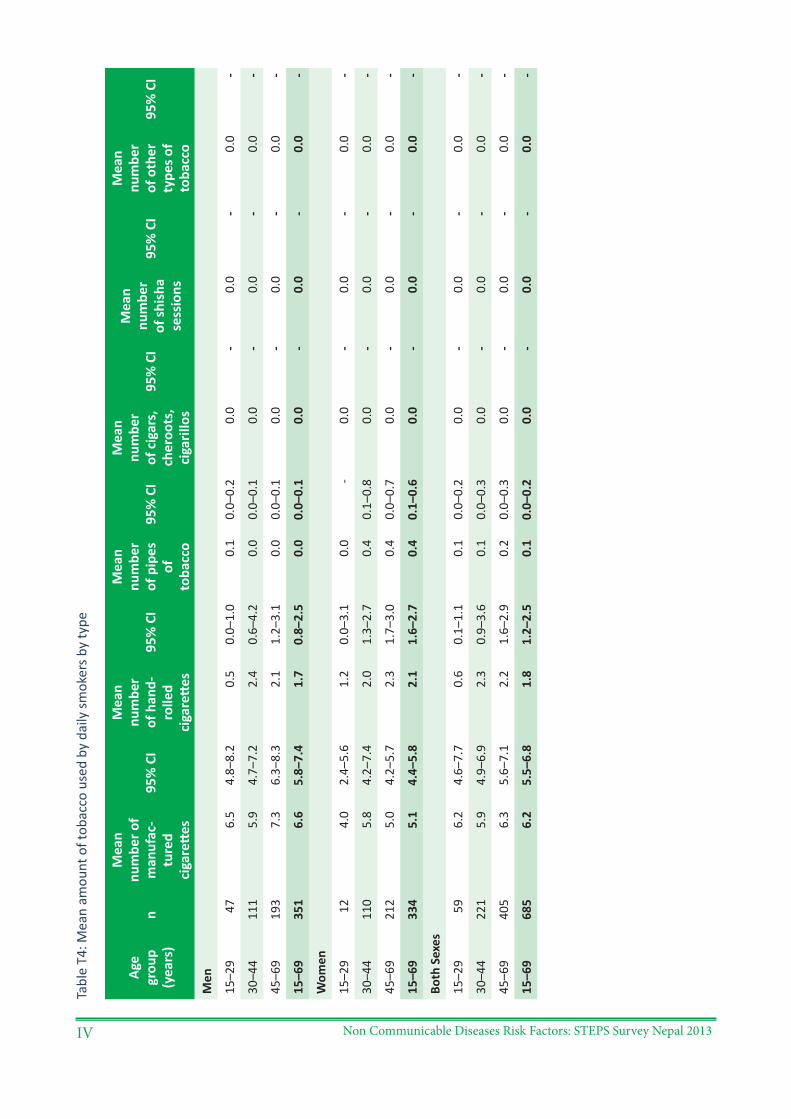
Non Communicable Diseases Risk Factors: STEPS Survey Nepal 2013IV
Tabl
e T4
: Mea
n am
ount
of t
obac
co u
sed
by d
aily
smok
ers b
y ty
pe
Age
grou
p (y
ears
)n
Mea
n
num
ber o
f m
anuf
ac-
ture
d
ciga
rett
es
95%
CI
Mea
n nu
mbe
r of
han
d-ro
lled
ciga
rett
es
95%
CI
Mea
n nu
mbe
r of
pip
es
of
toba
cco
95%
CI
Mea
n nu
mbe
r of
cig
ars,
ch
eroo
ts,
ciga
rillo
s
95%
CI
Mea
n nu
mbe
r of
shis
ha
sess
ions
95%
CI
Mea
n nu
mbe
r of
oth
er
type
s of
toba
cco
95%
CI
Men
15–2
947
6.5
4.8–
8.2
0.5
0.0–
1.0
0.1
0.0–
0.2
0.0
-0.
0-
0.0
-
30–4
411
15.
94.
7–7.
22.
40.
6–4.
20.
00.
0–0.
10.
0-
0.0
-0.
0-
45–6
919
37.
36.
3–8.
32.
11.
2–3.
10.
00.
0–0.
10.
0-
0.0
-0.
0-
15–6
935
16.
65.
8–7.
41.
70.
8–2.
50.
00.
0–0.
10.
0-
0.0
-0.
0-
Wom
en
15–2
912
4.0
2.4–
5.6
1.2
0.0–
3.1
0.0
-0.
0-
0.0
-0.
0-
30–4
411
05.
84.
2–7.
42.
01.
3–2.
70.
40.
1–0.
80.
0-
0.0
-0.
0-
45–6
921
25.
04.
2–5.
72.
31.
7–3.
00.
40.
0–0.
70.
0-
0.0
-0.
0-
15–6
933
45.
14.
4–5.
82.
11.
6–2.
70.
40.
1–0.
60.
0-
0.0
-0.
0-
Both
Sex
es
15–2
959
6.2
4.6–
7.7
0.6
0.1–
1.1
0.1
0.0–
0.2
0.0
-0.
0-
0.0
-
30–4
422
15.
94.
9–6.
92.
30.
9–3.
60.
10.
0–0.
30.
0-
0.0
-0.
0-
45–6
940
56.
35.
6–7.
12.
21.
6–2.
90.
20.
0–0.
30.
0-
0.0
-0.
0-
15–6
968
56.
25.
5–6.
81.
81.
2–2.
50.
10.
0–0.
20.
0-
0.0
-0.
0-
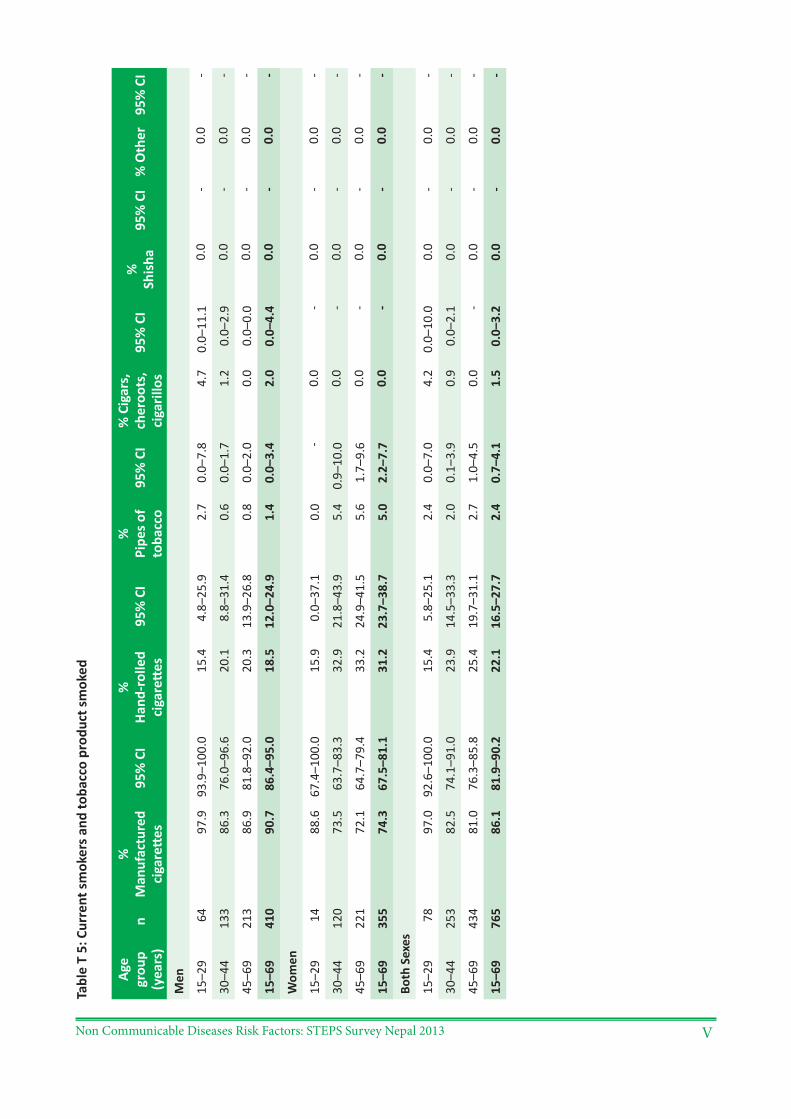
Non Communicable Diseases Risk Factors: STEPS Survey Nepal 2013 V
Tabl
e T
5: C
urre
nt sm
oker
s and
toba
cco
prod
uct s
mok
ed
Age
grou
p (y
ears
)n
%
Man
ufac
ture
d ci
gare
ttes
95%
CI
%
Hand
-rol
led
ciga
rett
es95
% C
I%
Pi
pes o
f to
bacc
o95
% C
I%
Cig
ars,
ch
eroo
ts,
ciga
rillo
s95
% C
I%
Sh
isha
95%
CI
% O
ther
95%
CI
Men
15–2
964
97.9
93.9
–100
.015
.44.
8–25
.92.
70.
0–7.
84.
70.
0–11
.10.
0-
0.0
-
30–4
413
386
.376
.0–9
6.6
20.1
8.8–
31.4
0.6
0.0–
1.7
1.2
0.0–
2.9
0.0
-0.
0-
45–6
921
386
.981
.8–9
2.0
20.3
13.9
–26.
80.
80.
0–2.
00.
00.
0–0.
00.
0-
0.0
-
15–6
941
090
.786
.4–9
5.0
18.5
12.0
–24.
91.
40.
0–3.
42.
00.
0–4.
40.
0-
0.0
-
Wom
en
15–2
914
88.6
67.4
–100
.015
.90.
0–37
.10.
0-
0.0
-0.
0-
0.0
-
30–4
412
073
.563
.7–8
3.3
32.9
21.8
–43.
95.
40.
9–10
.00.
0-
0.0
-0.
0-
45–6
922
172
.164
.7–7
9.4
33.2
24.9
–41.
55.
61.
7–9.
60.
0-
0.0
-0.
0-
15–6
935
574
.367
.5–8
1.1
31.2
23.7
–38.
75.
02.
2–7.
70.
0-
0.0
-0.
0-
Both
Sex
es
15–2
978
97.0
92.6
–100
.015
.45.
8–25
.12.
40.
0–7.
04.
20.
0–10
.00.
0-
0.0
-
30–4
425
382
.574
.1–9
1.0
23.9
14.5
–33.
32.
00.
1–3.
90.
90.
0–2.
10.
0-
0.0
-
45–6
943
481
.076
.3–8
5.8
25.4
19.7
–31.
12.
71.
0–4.
50.
0-
0.0
-0.
0-
15–6
976
586
.181
.9–9
0.2
22.1
16.5
–27.
72.
40.
7–4.
11.
50.
0–3.
20.
0-
0.0
-
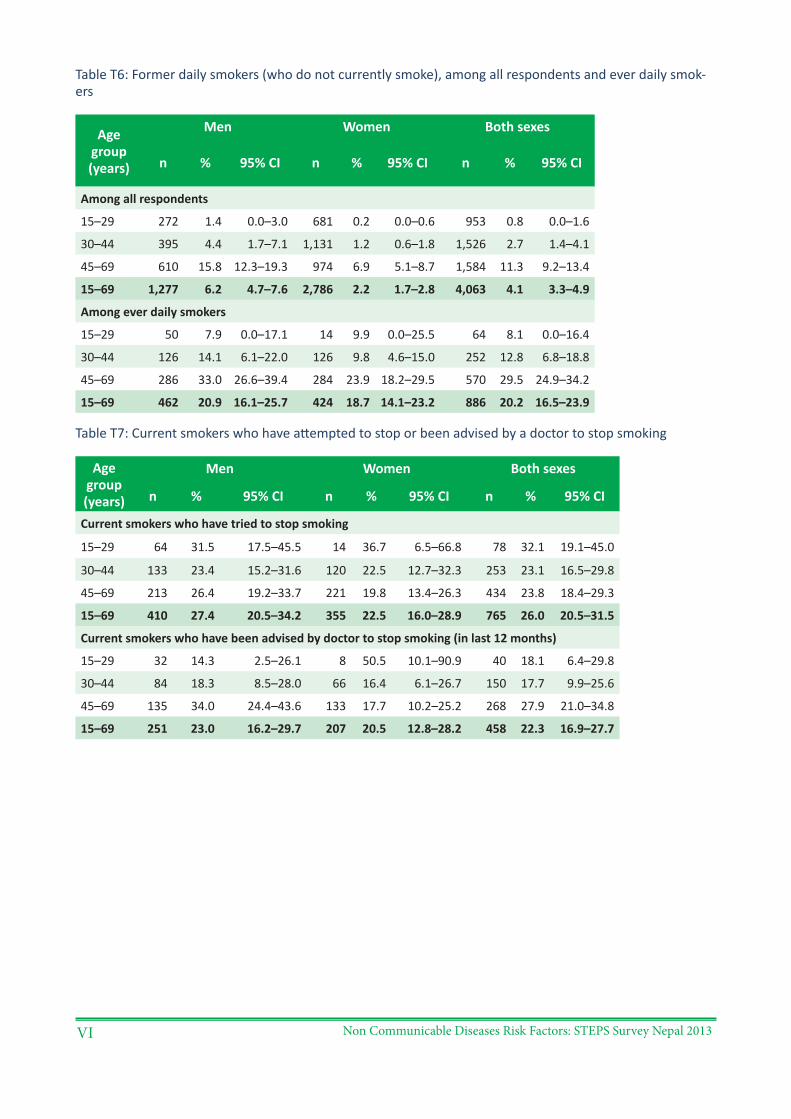
Non Communicable Diseases Risk Factors: STEPS Survey Nepal 2013VI
Table T6: Former daily smokers (who do not currently smoke), among all respondents and ever daily smok-ers
Age group (years)
Men Women Both sexes
n % 95% CI n % 95% CI n % 95% CI
Among all respondents
15–29 272 1.4 0.0–3.0 681 0.2 0.0–0.6 953 0.8 0.0–1.6
30–44 395 4.4 1.7–7.1 1,131 1.2 0.6–1.8 1,526 2.7 1.4–4.1
45–69 610 15.8 12.3–19.3 974 6.9 5.1–8.7 1,584 11.3 9.2–13.4
15–69 1,277 6.2 4.7–7.6 2,786 2.2 1.7–2.8 4,063 4.1 3.3–4.9
Among ever daily smokers
15–29 50 7.9 0.0–17.1 14 9.9 0.0–25.5 64 8.1 0.0–16.4
30–44 126 14.1 6.1–22.0 126 9.8 4.6–15.0 252 12.8 6.8–18.8
45–69 286 33.0 26.6–39.4 284 23.9 18.2–29.5 570 29.5 24.9–34.2
15–69 462 20.9 16.1–25.7 424 18.7 14.1–23.2 886 20.2 16.5–23.9
Table T7: Current smokers who have attempted to stop or been advised by a doctor to stop smoking
Age group (years)
Men Women Both sexes
n % 95% CI n % 95% CI n % 95% CI
Current smokers who have tried to stop smoking
15–29 64 31.5 17.5–45.5 14 36.7 6.5–66.8 78 32.1 19.1–45.0
30–44 133 23.4 15.2–31.6 120 22.5 12.7–32.3 253 23.1 16.5–29.8
45–69 213 26.4 19.2–33.7 221 19.8 13.4–26.3 434 23.8 18.4–29.3
15–69 410 27.4 20.5–34.2 355 22.5 16.0–28.9 765 26.0 20.5–31.5
Current smokers who have been advised by doctor to stop smoking (in last 12 months)
15–29 32 14.3 2.5–26.1 8 50.5 10.1–90.9 40 18.1 6.4–29.8
30–44 84 18.3 8.5–28.0 66 16.4 6.1–26.7 150 17.7 9.9–25.6
45–69 135 34.0 24.4–43.6 133 17.7 10.2–25.2 268 27.9 21.0–34.8
15–69 251 23.0 16.2–29.7 207 20.5 12.8–28.2 458 22.3 16.9–27.7
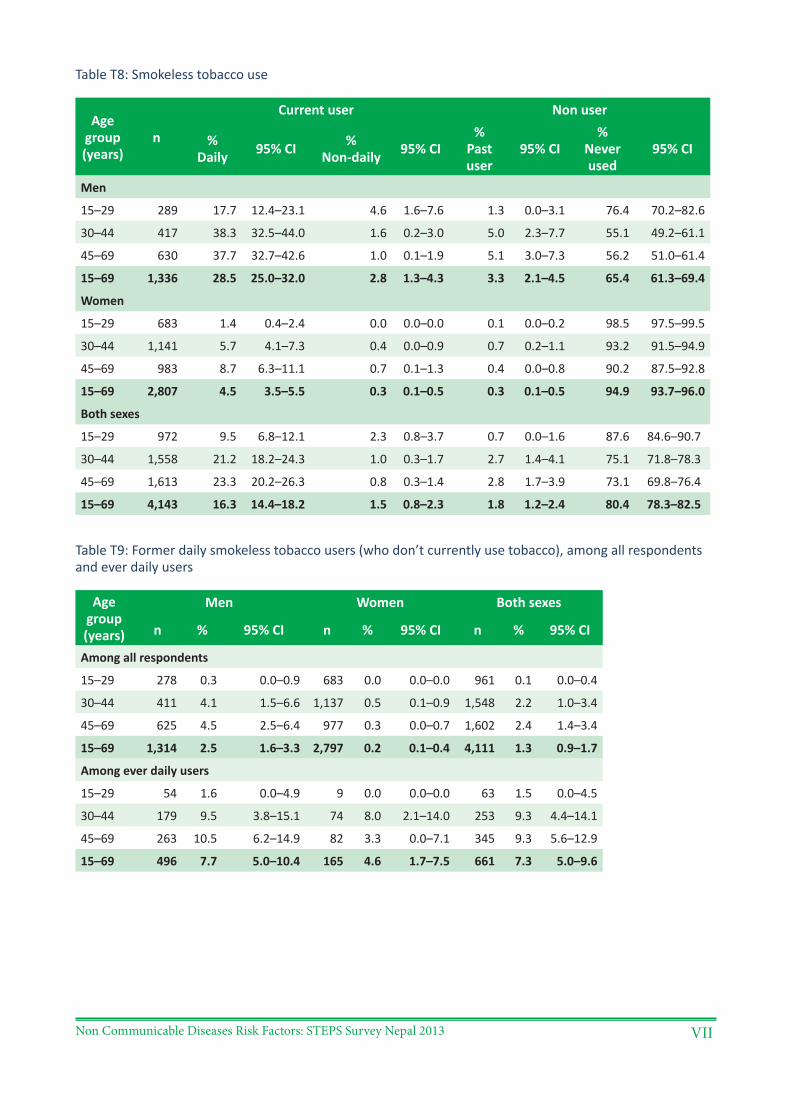
Non Communicable Diseases Risk Factors: STEPS Survey Nepal 2013 VII
Table T8: Smokeless tobacco use
Age group (years)
n
Current user Non user
% Daily 95% CI %
Non-daily 95% CI%
Past user
95% CI%
Never used
95% CI
Men
15–29 289 17.7 12.4–23.1 4.6 1.6–7.6 1.3 0.0–3.1 76.4 70.2–82.6
30–44 417 38.3 32.5–44.0 1.6 0.2–3.0 5.0 2.3–7.7 55.1 49.2–61.1
45–69 630 37.7 32.7–42.6 1.0 0.1–1.9 5.1 3.0–7.3 56.2 51.0–61.4
15–69 1,336 28.5 25.0–32.0 2.8 1.3–4.3 3.3 2.1–4.5 65.4 61.3–69.4
Women
15–29 683 1.4 0.4–2.4 0.0 0.0–0.0 0.1 0.0–0.2 98.5 97.5–99.5
30–44 1,141 5.7 4.1–7.3 0.4 0.0–0.9 0.7 0.2–1.1 93.2 91.5–94.9
45–69 983 8.7 6.3–11.1 0.7 0.1–1.3 0.4 0.0–0.8 90.2 87.5–92.8
15–69 2,807 4.5 3.5–5.5 0.3 0.1–0.5 0.3 0.1–0.5 94.9 93.7–96.0
Both sexes
15–29 972 9.5 6.8–12.1 2.3 0.8–3.7 0.7 0.0–1.6 87.6 84.6–90.7
30–44 1,558 21.2 18.2–24.3 1.0 0.3–1.7 2.7 1.4–4.1 75.1 71.8–78.3
45–69 1,613 23.3 20.2–26.3 0.8 0.3–1.4 2.8 1.7–3.9 73.1 69.8–76.4
15–69 4,143 16.3 14.4–18.2 1.5 0.8–2.3 1.8 1.2–2.4 80.4 78.3–82.5
Table T9: Former daily smokeless tobacco users (who don’t currently use tobacco), among all respondents and ever daily users
Age group (years)
Men Women Both sexes
n % 95% CI n % 95% CI n % 95% CI
Among all respondents
15–29 278 0.3 0.0–0.9 683 0.0 0.0–0.0 961 0.1 0.0–0.4
30–44 411 4.1 1.5–6.6 1,137 0.5 0.1–0.9 1,548 2.2 1.0–3.4
45–69 625 4.5 2.5–6.4 977 0.3 0.0–0.7 1,602 2.4 1.4–3.4
15–69 1,314 2.5 1.6–3.3 2,797 0.2 0.1–0.4 4,111 1.3 0.9–1.7
Among ever daily users
15–29 54 1.6 0.0–4.9 9 0.0 0.0–0.0 63 1.5 0.0–4.5
30–44 179 9.5 3.8–15.1 74 8.0 2.1–14.0 253 9.3 4.4–14.1
45–69 263 10.5 6.2–14.9 82 3.3 0.0–7.1 345 9.3 5.6–12.9
15–69 496 7.7 5.0–10.4 165 4.6 1.7–7.5 661 7.3 5.0–9.6
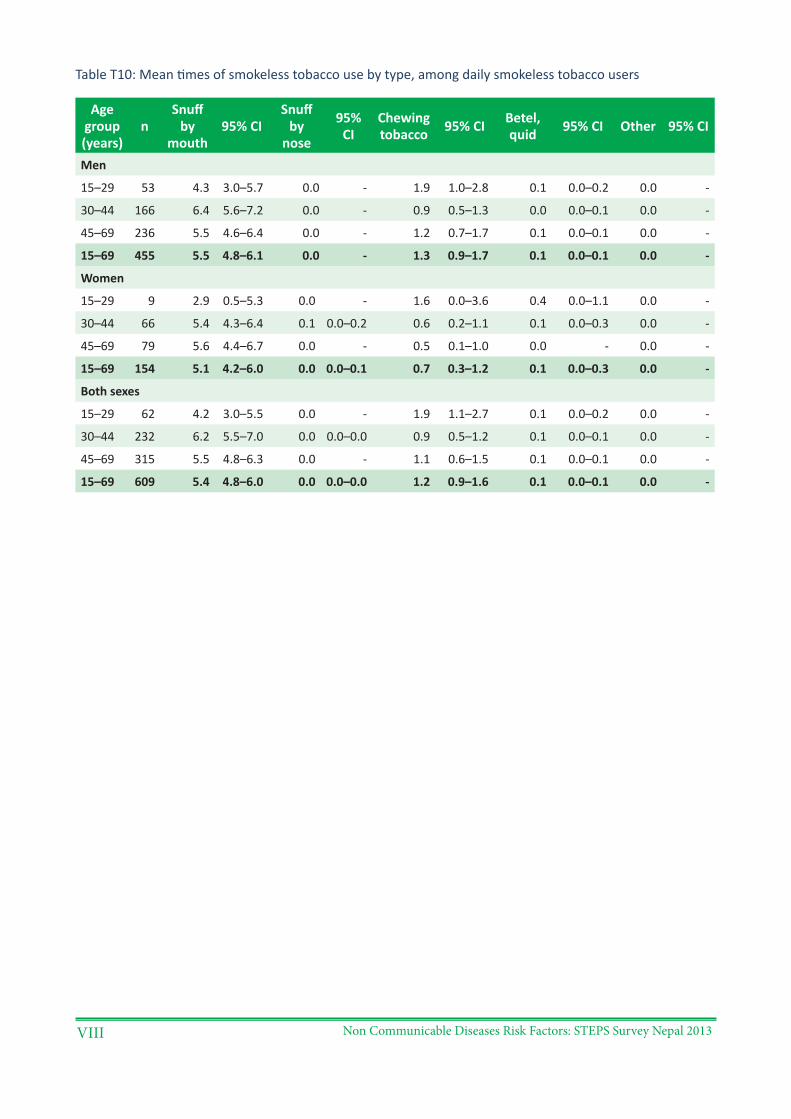
Non Communicable Diseases Risk Factors: STEPS Survey Nepal 2013VIII
Table T10: Mean times of smokeless tobacco use by type, among daily smokeless tobacco users
Age group (years)
nSnuff
by mouth
95% CISnuff
by nose
95% CI
Chewing tobacco 95% CI Betel,
quid 95% CI Other 95% CI
Men
15–29 53 4.3 3.0–5.7 0.0 - 1.9 1.0–2.8 0.1 0.0–0.2 0.0 -
30–44 166 6.4 5.6–7.2 0.0 - 0.9 0.5–1.3 0.0 0.0–0.1 0.0 -
45–69 236 5.5 4.6–6.4 0.0 - 1.2 0.7–1.7 0.1 0.0–0.1 0.0 -
15–69 455 5.5 4.8–6.1 0.0 - 1.3 0.9–1.7 0.1 0.0–0.1 0.0 -
Women
15–29 9 2.9 0.5–5.3 0.0 - 1.6 0.0–3.6 0.4 0.0–1.1 0.0 -
30–44 66 5.4 4.3–6.4 0.1 0.0–0.2 0.6 0.2–1.1 0.1 0.0–0.3 0.0 -
45–69 79 5.6 4.4–6.7 0.0 - 0.5 0.1–1.0 0.0 - 0.0 -
15–69 154 5.1 4.2–6.0 0.0 0.0–0.1 0.7 0.3–1.2 0.1 0.0–0.3 0.0 -
Both sexes
15–29 62 4.2 3.0–5.5 0.0 - 1.9 1.1–2.7 0.1 0.0–0.2 0.0 -
30–44 232 6.2 5.5–7.0 0.0 0.0–0.0 0.9 0.5–1.2 0.1 0.0–0.1 0.0 -
45–69 315 5.5 4.8–6.3 0.0 - 1.1 0.6–1.5 0.1 0.0–0.1 0.0 -
15–69 609 5.4 4.8–6.0 0.0 0.0–0.0 1.2 0.9–1.6 0.1 0.0–0.1 0.0 -
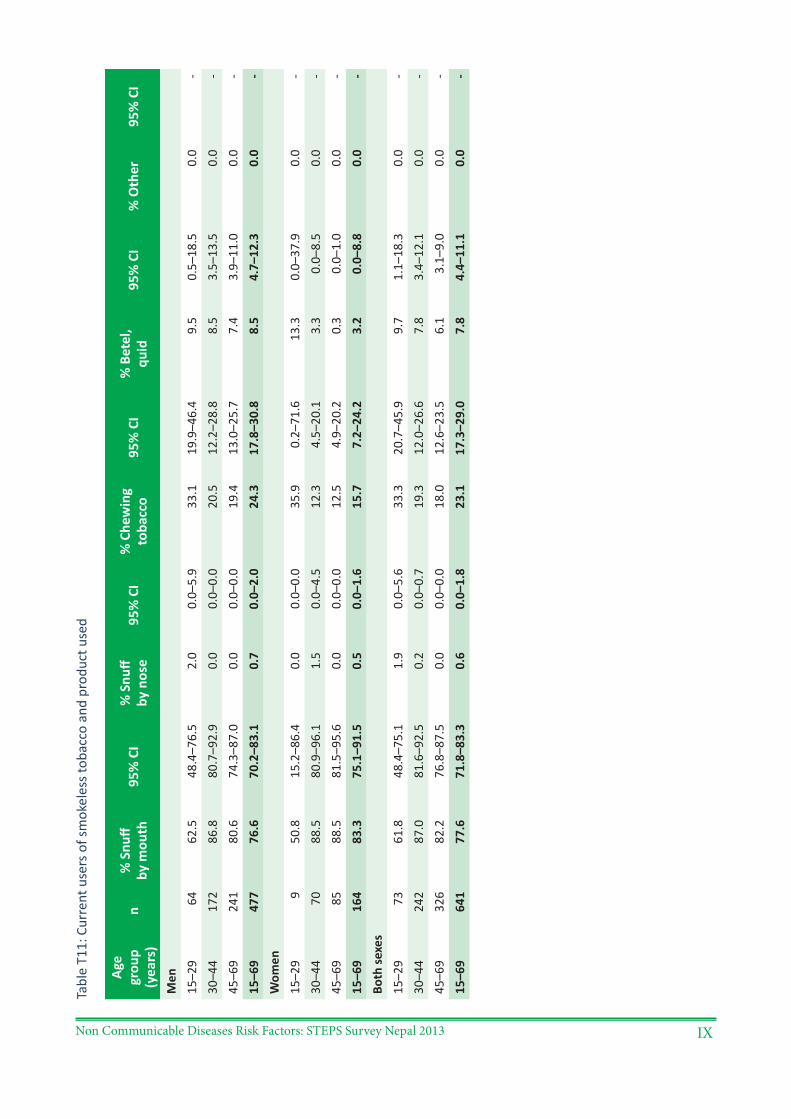
Non Communicable Diseases Risk Factors: STEPS Survey Nepal 2013 IX
Tabl
e T1
1: C
urre
nt u
sers
of s
mok
eles
s tob
acco
and
pro
duct
use
d
Age
grou
p (y
ears
)n
% S
nuff
by m
outh
95%
CI
% S
nuff
by n
ose
95%
CI
% C
hew
ing
toba
cco
95%
CI
% B
etel
, qu
id95
% C
I%
Oth
er95
% C
I
Men
15–2
964
62.5
48.4
–76.
52.
00.
0–5.
933
.119
.9–4
6.4
9.5
0.5–
18.5
0.0
-30
–44
172
86.8
80.7
–92.
90.
00.
0–0.
020
.512
.2–2
8.8
8.5
3.5–
13.5
0.0
-45
–69
241
80.6
74.3
–87.
00.
00.
0–0.
019
.413
.0–2
5.7
7.4
3.9–
11.0
0.0
-15
–69
477
76.6
70.2
–83.
10.
70.
0–2.
024
.317
.8–3
0.8
8.5
4.7–
12.3
0.0
-W
omen
15–2
99
50.8
15.2
–86.
40.
00.
0–0.
035
.90.
2–71
.613
.30.
0–37
.90.
0-
30–4
470
88.5
80.9
–96.
11.
50.
0–4.
512
.34.
5–20
.13.
30.
0–8.
50.
0-
45–6
985
88.5
81.5
–95.
60.
00.
0–0.
012
.54.
9–20
.20.
30.
0–1.
00.
0-
15–6
916
483
.375
.1–9
1.5
0.5
0.0–
1.6
15.7
7.2–
24.2
3.2
0.0–
8.8
0.0
-Bo
th se
xes
15–2
973
61.8
48.4
–75.
11.
90.
0–5.
633
.320
.7–4
5.9
9.7
1.1–
18.3
0.0
-30
–44
242
87.0
81.6
–92.
50.
20.
0–0.
719
.312
.0–2
6.6
7.8
3.4–
12.1
0.0
-45
–69
326
82.2
76.8
–87.
50.
00.
0–0.
018
.012
.6–2
3.5
6.1
3.1–
9.0
0.0
-15
–69
641
77.6
71.8
–83.
30.
60.
0–1.
823
.117
.3–2
9.0
7.8
4.4–
11.1
0.0
-
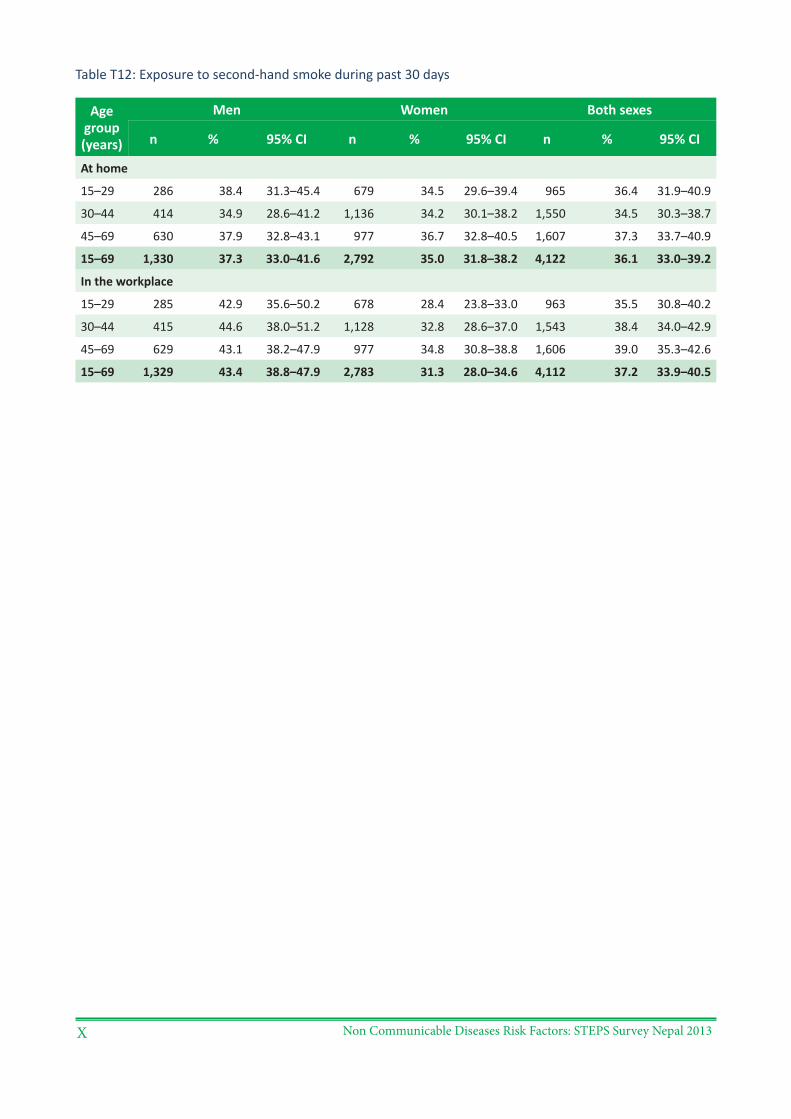
Non Communicable Diseases Risk Factors: STEPS Survey Nepal 2013X
Table T12: Exposure to second-hand smoke during past 30 days
Age group (years)
Men Women Both sexes
n % 95% CI n % 95% CI n % 95% CI
At home
15–29 286 38.4 31.3–45.4 679 34.5 29.6–39.4 965 36.4 31.9–40.9
30–44 414 34.9 28.6–41.2 1,136 34.2 30.1–38.2 1,550 34.5 30.3–38.7
45–69 630 37.9 32.8–43.1 977 36.7 32.8–40.5 1,607 37.3 33.7–40.9
15–69 1,330 37.3 33.0–41.6 2,792 35.0 31.8–38.2 4,122 36.1 33.0–39.2
In the workplace
15–29 285 42.9 35.6–50.2 678 28.4 23.8–33.0 963 35.5 30.8–40.2
30–44 415 44.6 38.0–51.2 1,128 32.8 28.6–37.0 1,543 38.4 34.0–42.9
45–69 629 43.1 38.2–47.9 977 34.8 30.8–38.8 1,606 39.0 35.3–42.6
15–69 1,329 43.4 38.8–47.9 2,783 31.3 28.0–34.6 4,112 37.2 33.9–40.5
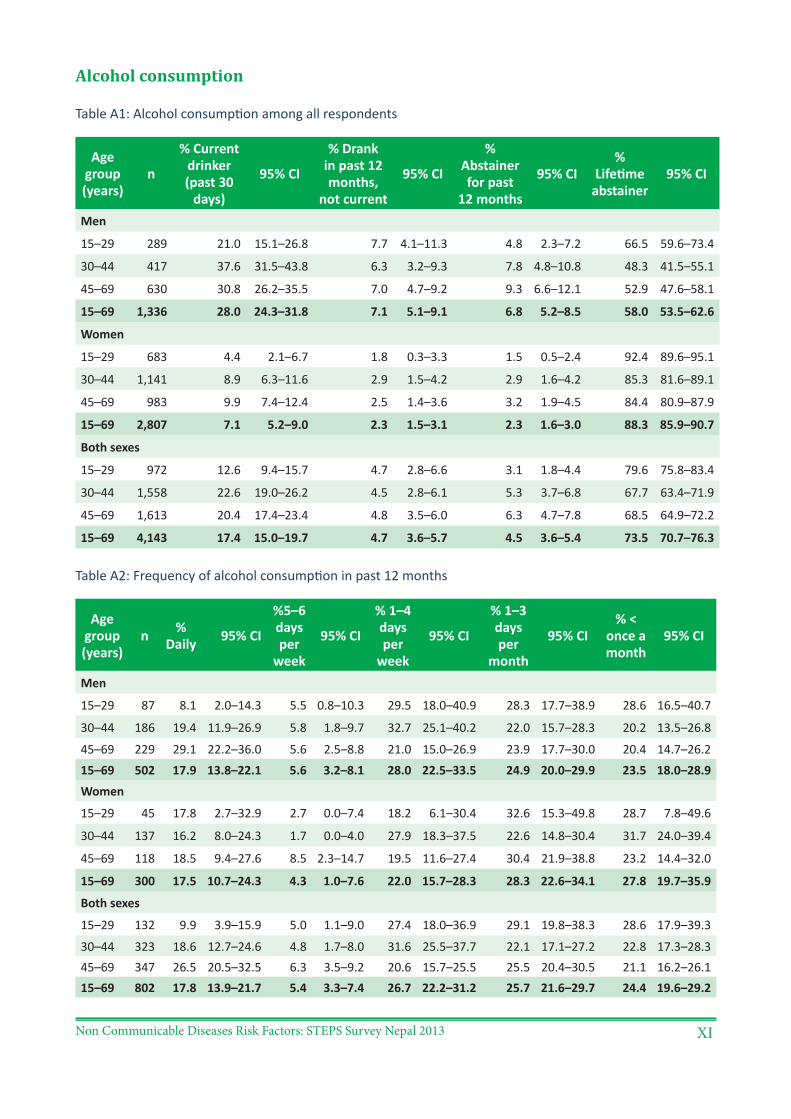
Non Communicable Diseases Risk Factors: STEPS Survey Nepal 2013 XI
Alcohol consumption
Table A1: Alcohol consumption among all respondents
Age group (years)
n
% Current drinker (past 30
days)
95% CI
% Drank in past 12 months,
not current
95% CI
% Abstainer for past
12 months
95% CI%
Lifetime abstainer
95% CI
Men
15–29 289 21.0 15.1–26.8 7.7 4.1–11.3 4.8 2.3–7.2 66.5 59.6–73.4
30–44 417 37.6 31.5–43.8 6.3 3.2–9.3 7.8 4.8–10.8 48.3 41.5–55.1
45–69 630 30.8 26.2–35.5 7.0 4.7–9.2 9.3 6.6–12.1 52.9 47.6–58.1
15–69 1,336 28.0 24.3–31.8 7.1 5.1–9.1 6.8 5.2–8.5 58.0 53.5–62.6
Women
15–29 683 4.4 2.1–6.7 1.8 0.3–3.3 1.5 0.5–2.4 92.4 89.6–95.1
30–44 1,141 8.9 6.3–11.6 2.9 1.5–4.2 2.9 1.6–4.2 85.3 81.6–89.1
45–69 983 9.9 7.4–12.4 2.5 1.4–3.6 3.2 1.9–4.5 84.4 80.9–87.9
15–69 2,807 7.1 5.2–9.0 2.3 1.5–3.1 2.3 1.6–3.0 88.3 85.9–90.7
Both sexes
15–29 972 12.6 9.4–15.7 4.7 2.8–6.6 3.1 1.8–4.4 79.6 75.8–83.4
30–44 1,558 22.6 19.0–26.2 4.5 2.8–6.1 5.3 3.7–6.8 67.7 63.4–71.9
45–69 1,613 20.4 17.4–23.4 4.8 3.5–6.0 6.3 4.7–7.8 68.5 64.9–72.2
15–69 4,143 17.4 15.0–19.7 4.7 3.6–5.7 4.5 3.6–5.4 73.5 70.7–76.3
Table A2: Frequency of alcohol consumption in past 12 months
Age group (years)
n % Daily 95% CI
%5–6 days per
week
95% CI
% 1–4 days per
week
95% CI
% 1–3 days per
month
95% CI% <
once a month
95% CI
Men
15–29 87 8.1 2.0–14.3 5.5 0.8–10.3 29.5 18.0–40.9 28.3 17.7–38.9 28.6 16.5–40.7
30–44 186 19.4 11.9–26.9 5.8 1.8–9.7 32.7 25.1–40.2 22.0 15.7–28.3 20.2 13.5–26.8
45–69 229 29.1 22.2–36.0 5.6 2.5–8.8 21.0 15.0–26.9 23.9 17.7–30.0 20.4 14.7–26.215–69 502 17.9 13.8–22.1 5.6 3.2–8.1 28.0 22.5–33.5 24.9 20.0–29.9 23.5 18.0–28.9
Women
15–29 45 17.8 2.7–32.9 2.7 0.0–7.4 18.2 6.1–30.4 32.6 15.3–49.8 28.7 7.8–49.6
30–44 137 16.2 8.0–24.3 1.7 0.0–4.0 27.9 18.3–37.5 22.6 14.8–30.4 31.7 24.0–39.4
45–69 118 18.5 9.4–27.6 8.5 2.3–14.7 19.5 11.6–27.4 30.4 21.9–38.8 23.2 14.4–32.0
15–69 300 17.5 10.7–24.3 4.3 1.0–7.6 22.0 15.7–28.3 28.3 22.6–34.1 27.8 19.7–35.9
Both sexes
15–29 132 9.9 3.9–15.9 5.0 1.1–9.0 27.4 18.0–36.9 29.1 19.8–38.3 28.6 17.9–39.3
30–44 323 18.6 12.7–24.6 4.8 1.7–8.0 31.6 25.5–37.7 22.1 17.1–27.2 22.8 17.3–28.345–69 347 26.5 20.5–32.5 6.3 3.5–9.2 20.6 15.7–25.5 25.5 20.4–30.5 21.1 16.2–26.115–69 802 17.8 13.9–21.7 5.4 3.3–7.4 26.7 22.2–31.2 25.7 21.6–29.7 24.4 19.6–29.2
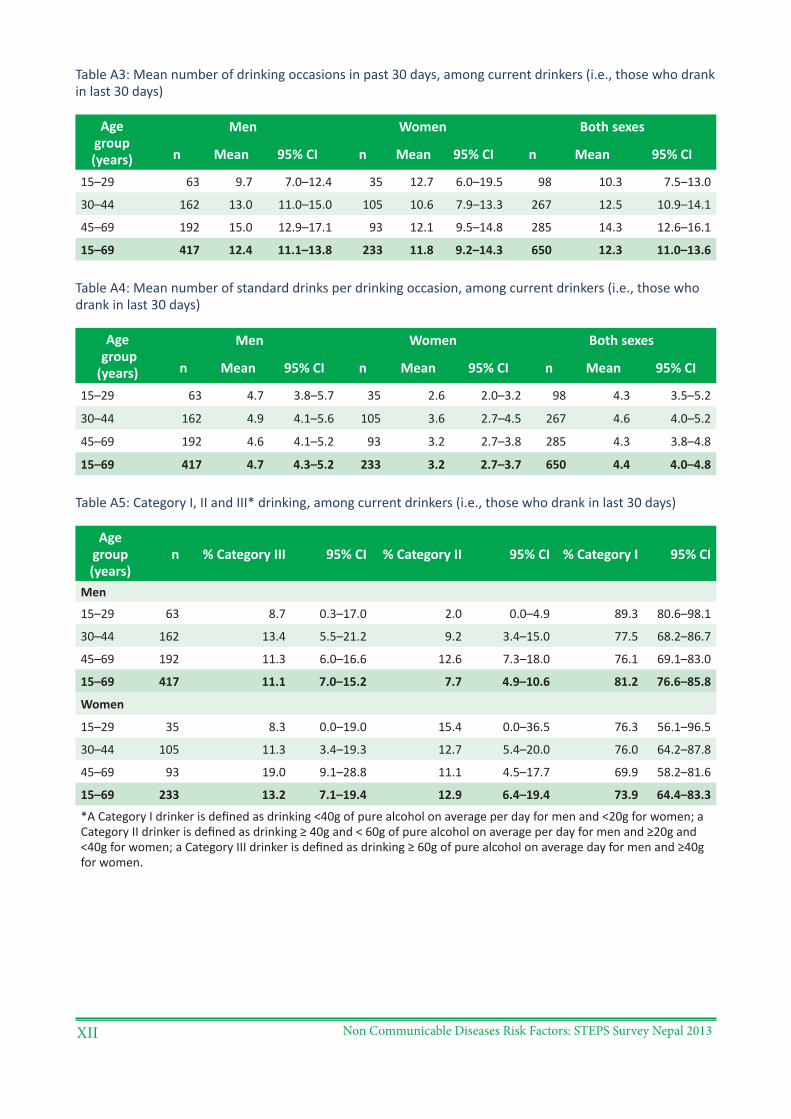
Non Communicable Diseases Risk Factors: STEPS Survey Nepal 2013XII
Table A3: Mean number of drinking occasions in past 30 days, among current drinkers (i.e., those who drank in last 30 days)
Age group (years)
Men Women Both sexes
n Mean 95% CI n Mean 95% CI n Mean 95% CI
15–29 63 9.7 7.0–12.4 35 12.7 6.0–19.5 98 10.3 7.5–13.0
30–44 162 13.0 11.0–15.0 105 10.6 7.9–13.3 267 12.5 10.9–14.1
45–69 192 15.0 12.9–17.1 93 12.1 9.5–14.8 285 14.3 12.6–16.1
15–69 417 12.4 11.1–13.8 233 11.8 9.2–14.3 650 12.3 11.0–13.6
Table A4: Mean number of standard drinks per drinking occasion, among current drinkers (i.e., those who drank in last 30 days)
Age group (years)
Men Women Both sexes
n Mean 95% CI n Mean 95% CI n Mean 95% CI
15–29 63 4.7 3.8–5.7 35 2.6 2.0–3.2 98 4.3 3.5–5.2
30–44 162 4.9 4.1–5.6 105 3.6 2.7–4.5 267 4.6 4.0–5.2
45–69 192 4.6 4.1–5.2 93 3.2 2.7–3.8 285 4.3 3.8–4.8
15–69 417 4.7 4.3–5.2 233 3.2 2.7–3.7 650 4.4 4.0–4.8
Table A5: Category I, II and III* drinking, among current drinkers (i.e., those who drank in last 30 days)
Age group (years)
n % Category III 95% CI % Category II 95% CI % Category I 95% CI
Men
15–29 63 8.7 0.3–17.0 2.0 0.0–4.9 89.3 80.6–98.1
30–44 162 13.4 5.5–21.2 9.2 3.4–15.0 77.5 68.2–86.7
45–69 192 11.3 6.0–16.6 12.6 7.3–18.0 76.1 69.1–83.0
15–69 417 11.1 7.0–15.2 7.7 4.9–10.6 81.2 76.6–85.8
Women
15–29 35 8.3 0.0–19.0 15.4 0.0–36.5 76.3 56.1–96.5
30–44 105 11.3 3.4–19.3 12.7 5.4–20.0 76.0 64.2–87.8
45–69 93 19.0 9.1–28.8 11.1 4.5–17.7 69.9 58.2–81.6
15–69 233 13.2 7.1–19.4 12.9 6.4–19.4 73.9 64.4–83.3
*A Category I drinker is defined as drinking <40g of pure alcohol on average per day for men and <20g for women; a Category II drinker is defined as drinking ≥ 40g and < 60g of pure alcohol on average per day for men and ≥20g and <40g for women; a Category III drinker is defined as drinking ≥ 60g of pure alcohol on average day for men and ≥40g for women.
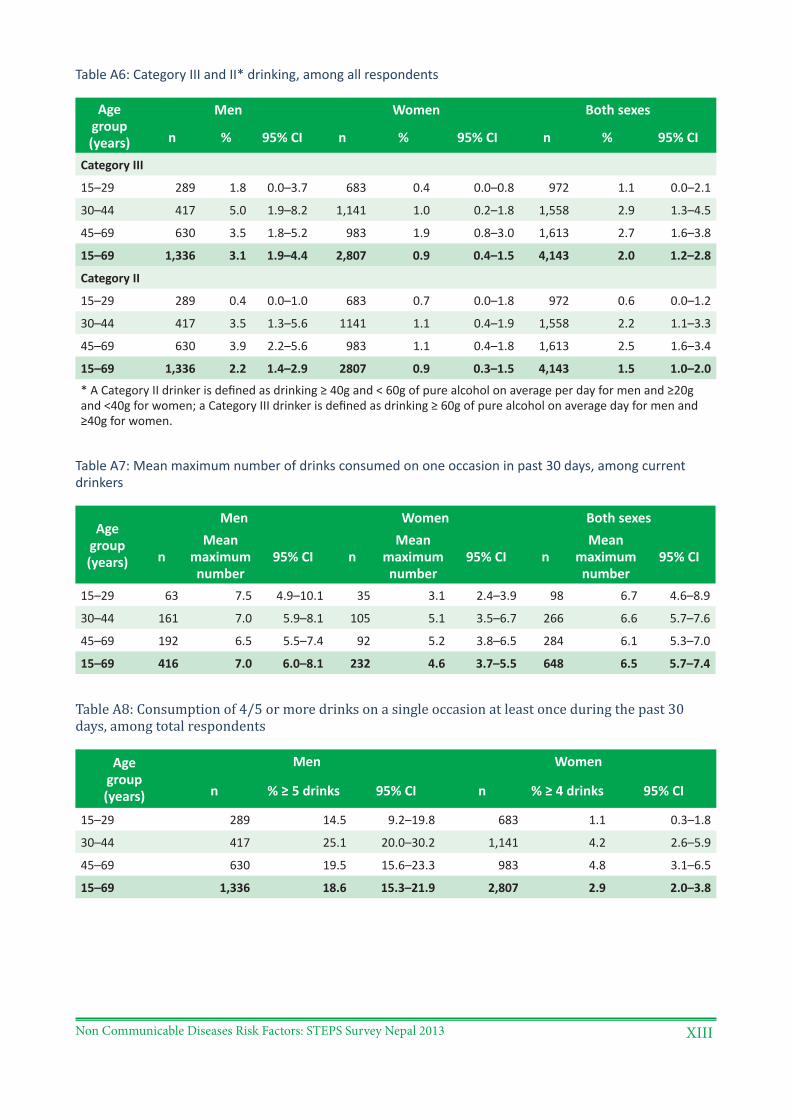
Non Communicable Diseases Risk Factors: STEPS Survey Nepal 2013 XIII
Table A6: Category III and II* drinking, among all respondents
Age group (years)
Men Women Both sexes
n % 95% CI n % 95% CI n % 95% CI
Category III
15–29 289 1.8 0.0–3.7 683 0.4 0.0–0.8 972 1.1 0.0–2.1
30–44 417 5.0 1.9–8.2 1,141 1.0 0.2–1.8 1,558 2.9 1.3–4.5
45–69 630 3.5 1.8–5.2 983 1.9 0.8–3.0 1,613 2.7 1.6–3.8
15–69 1,336 3.1 1.9–4.4 2,807 0.9 0.4–1.5 4,143 2.0 1.2–2.8
Category II
15–29 289 0.4 0.0–1.0 683 0.7 0.0–1.8 972 0.6 0.0–1.2
30–44 417 3.5 1.3–5.6 1141 1.1 0.4–1.9 1,558 2.2 1.1–3.3
45–69 630 3.9 2.2–5.6 983 1.1 0.4–1.8 1,613 2.5 1.6–3.4
15–69 1,336 2.2 1.4–2.9 2807 0.9 0.3–1.5 4,143 1.5 1.0–2.0
* A Category II drinker is defined as drinking ≥ 40g and < 60g of pure alcohol on average per day for men and ≥20g and <40g for women; a Category III drinker is defined as drinking ≥ 60g of pure alcohol on average day for men and ≥40g for women.
Table A7: Mean maximum number of drinks consumed on one occasion in past 30 days, among current drinkers
Age group (years)
Men Women Both sexes
nMean
maximum number
95% CI nMean
maximum number
95% CI nMean
maximum number
95% CI
15–29 63 7.5 4.9–10.1 35 3.1 2.4–3.9 98 6.7 4.6–8.9
30–44 161 7.0 5.9–8.1 105 5.1 3.5–6.7 266 6.6 5.7–7.6
45–69 192 6.5 5.5–7.4 92 5.2 3.8–6.5 284 6.1 5.3–7.0
15–69 416 7.0 6.0–8.1 232 4.6 3.7–5.5 648 6.5 5.7–7.4
Table A8: Consumption of 4/5 or more drinks on a single occasion at least once during the past 30 days, among total respondents
Age group (years)
Men Women
n % ≥ 5 drinks 95% CI n % ≥ 4 drinks 95% CI
15–29 289 14.5 9.2–19.8 683 1.1 0.3–1.8
30–44 417 25.1 20.0–30.2 1,141 4.2 2.6–5.9
45–69 630 19.5 15.6–23.3 983 4.8 3.1–6.5
15–69 1,336 18.6 15.3–21.9 2,807 2.9 2.0–3.8
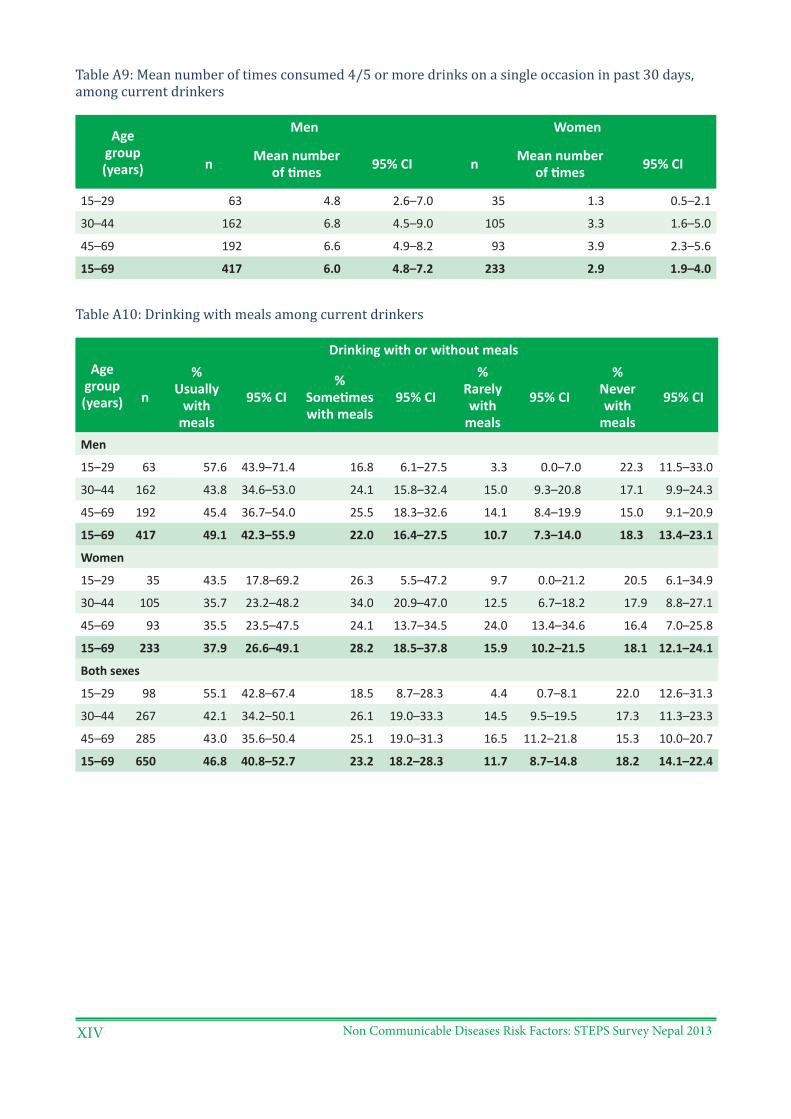
Non Communicable Diseases Risk Factors: STEPS Survey Nepal 2013XIV
Table A9: Mean number of times consumed 4/5 or more drinks on a single occasion in past 30 days, among current drinkers
Age group (years)
Men Women
n Mean number of times 95% CI n Mean number
of times 95% CI
15–29 63 4.8 2.6–7.0 35 1.3 0.5–2.1
30–44 162 6.8 4.5–9.0 105 3.3 1.6–5.0
45–69 192 6.6 4.9–8.2 93 3.9 2.3–5.6
15–69 417 6.0 4.8–7.2 233 2.9 1.9–4.0
Table A10: Drinking with meals among current drinkers
Age group (years)
Drinking with or without meals
n
% Usually
with meals
95% CI%
Sometimes with meals
95% CI
% Rarely with
meals
95% CI
% Never with
meals
95% CI
Men
15–29 63 57.6 43.9–71.4 16.8 6.1–27.5 3.3 0.0–7.0 22.3 11.5–33.0
30–44 162 43.8 34.6–53.0 24.1 15.8–32.4 15.0 9.3–20.8 17.1 9.9–24.3
45–69 192 45.4 36.7–54.0 25.5 18.3–32.6 14.1 8.4–19.9 15.0 9.1–20.9
15–69 417 49.1 42.3–55.9 22.0 16.4–27.5 10.7 7.3–14.0 18.3 13.4–23.1
Women
15–29 35 43.5 17.8–69.2 26.3 5.5–47.2 9.7 0.0–21.2 20.5 6.1–34.9
30–44 105 35.7 23.2–48.2 34.0 20.9–47.0 12.5 6.7–18.2 17.9 8.8–27.1
45–69 93 35.5 23.5–47.5 24.1 13.7–34.5 24.0 13.4–34.6 16.4 7.0–25.8
15–69 233 37.9 26.6–49.1 28.2 18.5–37.8 15.9 10.2–21.5 18.1 12.1–24.1
Both sexes
15–29 98 55.1 42.8–67.4 18.5 8.7–28.3 4.4 0.7–8.1 22.0 12.6–31.3
30–44 267 42.1 34.2–50.1 26.1 19.0–33.3 14.5 9.5–19.5 17.3 11.3–23.3
45–69 285 43.0 35.6–50.4 25.1 19.0–31.3 16.5 11.2–21.8 15.3 10.0–20.7
15–69 650 46.8 40.8–52.7 23.2 18.2–28.3 11.7 8.7–14.8 18.2 14.1–22.4
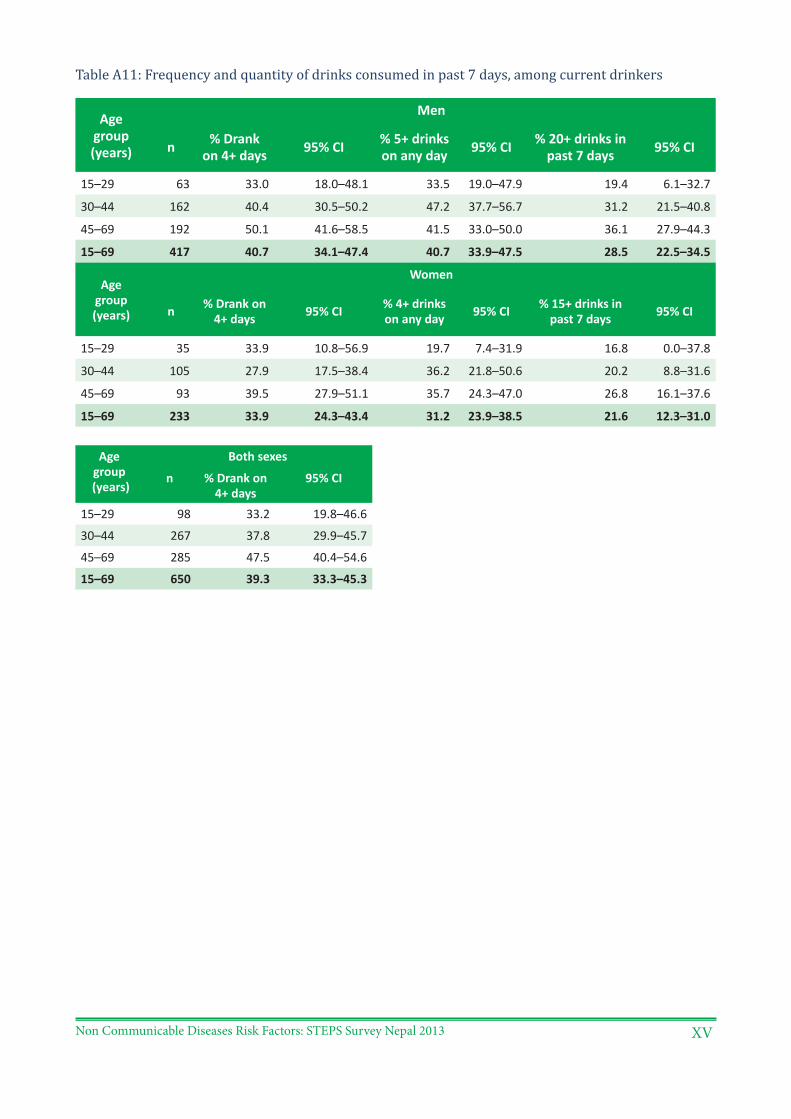
Non Communicable Diseases Risk Factors: STEPS Survey Nepal 2013 XV
Table A11: Frequency and quantity of drinks consumed in past 7 days, among current drinkers
Age group (years)
Men
n % Drank on 4+ days 95% CI % 5+ drinks
on any day 95% CI % 20+ drinks in past 7 days 95% CI
15–29 63 33.0 18.0–48.1 33.5 19.0–47.9 19.4 6.1–32.7
30–44 162 40.4 30.5–50.2 47.2 37.7–56.7 31.2 21.5–40.8
45–69 192 50.1 41.6–58.5 41.5 33.0–50.0 36.1 27.9–44.3
15–69 417 40.7 34.1–47.4 40.7 33.9–47.5 28.5 22.5–34.5
Age group (years)
Women
n % Drank on 4+ days 95% CI % 4+ drinks
on any day 95% CI % 15+ drinks in past 7 days 95% CI
15–29 35 33.9 10.8–56.9 19.7 7.4–31.9 16.8 0.0–37.8
30–44 105 27.9 17.5–38.4 36.2 21.8–50.6 20.2 8.8–31.6
45–69 93 39.5 27.9–51.1 35.7 24.3–47.0 26.8 16.1–37.6
15–69 233 33.9 24.3–43.4 31.2 23.9–38.5 21.6 12.3–31.0
Age group
(years)
Both sexes
n % Drank on 4+ days
95% CI
15–29 98 33.2 19.8–46.6
30–44 267 37.8 29.9–45.7
45–69 285 47.5 40.4–54.6
15–69 650 39.3 33.3–45.3
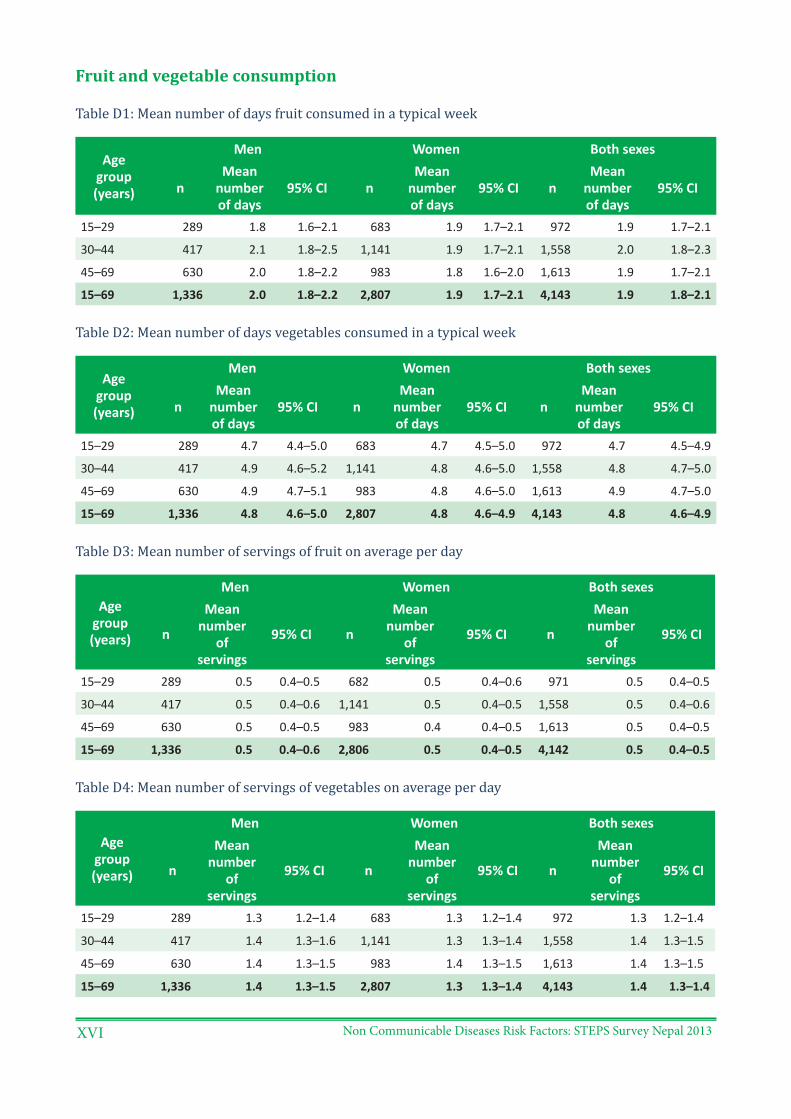
Non Communicable Diseases Risk Factors: STEPS Survey Nepal 2013XVI
Fruit and vegetable consumption
Table D1: Mean number of days fruit consumed in a typical week
Age group (years)
Men Women Both sexes
nMean
number of days
95% CI nMean
number of days
95% CI nMean
number of days
95% CI
15–29 289 1.8 1.6–2.1 683 1.9 1.7–2.1 972 1.9 1.7–2.1
30–44 417 2.1 1.8–2.5 1,141 1.9 1.7–2.1 1,558 2.0 1.8–2.3
45–69 630 2.0 1.8–2.2 983 1.8 1.6–2.0 1,613 1.9 1.7–2.1
15–69 1,336 2.0 1.8–2.2 2,807 1.9 1.7–2.1 4,143 1.9 1.8–2.1
Table D2: Mean number of days vegetables consumed in a typical week
Age group (years)
Men Women Both sexes
nMean
number of days
95% CI nMean
number of days
95% CI nMean
number of days
95% CI
15–29 289 4.7 4.4–5.0 683 4.7 4.5–5.0 972 4.7 4.5–4.9
30–44 417 4.9 4.6–5.2 1,141 4.8 4.6–5.0 1,558 4.8 4.7–5.0
45–69 630 4.9 4.7–5.1 983 4.8 4.6–5.0 1,613 4.9 4.7–5.0
15–69 1,336 4.8 4.6–5.0 2,807 4.8 4.6–4.9 4,143 4.8 4.6–4.9
Table D3: Mean number of servings of fruit on average per day
Age group (years)
Men Women Both sexes
n
Mean number
of servings
95% CI n
Mean number
of servings
95% CI n
Mean number
of servings
95% CI
15–29 289 0.5 0.4–0.5 682 0.5 0.4–0.6 971 0.5 0.4–0.5
30–44 417 0.5 0.4–0.6 1,141 0.5 0.4–0.5 1,558 0.5 0.4–0.6
45–69 630 0.5 0.4–0.5 983 0.4 0.4–0.5 1,613 0.5 0.4–0.5
15–69 1,336 0.5 0.4–0.6 2,806 0.5 0.4–0.5 4,142 0.5 0.4–0.5
Table D4: Mean number of servings of vegetables on average per day
Age group (years)
Men Women Both sexes
n
Mean number
of servings
95% CI n
Mean number
of servings
95% CI n
Mean number
of servings
95% CI
15–29 289 1.3 1.2–1.4 683 1.3 1.2–1.4 972 1.3 1.2–1.4
30–44 417 1.4 1.3–1.6 1,141 1.3 1.3–1.4 1,558 1.4 1.3–1.5
45–69 630 1.4 1.3–1.5 983 1.4 1.3–1.5 1,613 1.4 1.3–1.5
15–69 1,336 1.4 1.3–1.5 2,807 1.3 1.3–1.4 4,143 1.4 1.3–1.4
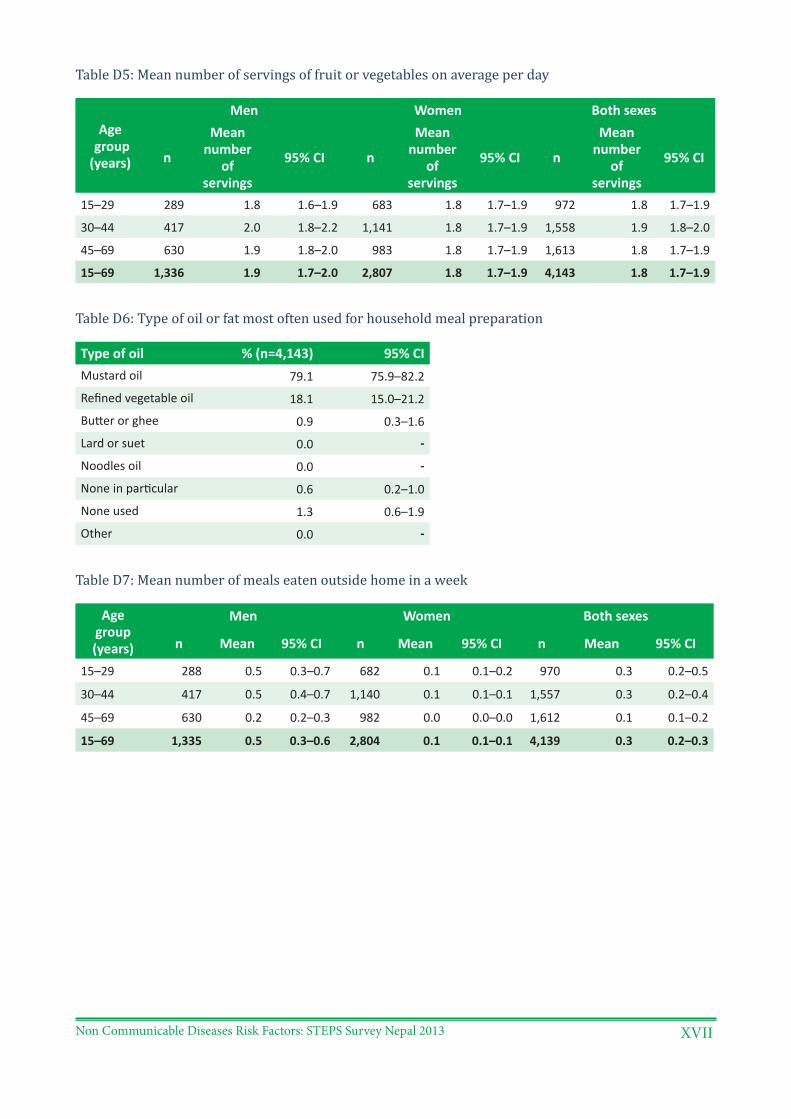
Non Communicable Diseases Risk Factors: STEPS Survey Nepal 2013 XVII
Table D5: Mean number of servings of fruit or vegetables on average per day
Age group (years)
Men Women Both sexes
n
Mean number
of servings
95% CI n
Mean number
of servings
95% CI n
Mean number
of servings
95% CI
15–29 289 1.8 1.6–1.9 683 1.8 1.7–1.9 972 1.8 1.7–1.9
30–44 417 2.0 1.8–2.2 1,141 1.8 1.7–1.9 1,558 1.9 1.8–2.0
45–69 630 1.9 1.8–2.0 983 1.8 1.7–1.9 1,613 1.8 1.7–1.9
15–69 1,336 1.9 1.7–2.0 2,807 1.8 1.7–1.9 4,143 1.8 1.7–1.9
Table D6: Type of oil or fat most often used for household meal preparation
Type of oil % (n=4,143) 95% CIMustard oil 79.1 75.9–82.2
Refined vegetable oil 18.1 15.0–21.2
Butter or ghee 0.9 0.3–1.6
Lard or suet 0.0 -
Noodles oil 0.0 -
None in particular 0.6 0.2–1.0
None used 1.3 0.6–1.9
Other 0.0 -
Table D7: Mean number of meals eaten outside home in a week
Age group (years)
Men Women Both sexes
n Mean 95% CI n Mean 95% CI n Mean 95% CI
15–29 288 0.5 0.3–0.7 682 0.1 0.1–0.2 970 0.3 0.2–0.5
30–44 417 0.5 0.4–0.7 1,140 0.1 0.1–0.1 1,557 0.3 0.2–0.4
45–69 630 0.2 0.2–0.3 982 0.0 0.0–0.0 1,612 0.1 0.1–0.2
15–69 1,335 0.5 0.3–0.6 2,804 0.1 0.1–0.1 4,139 0.3 0.2–0.3
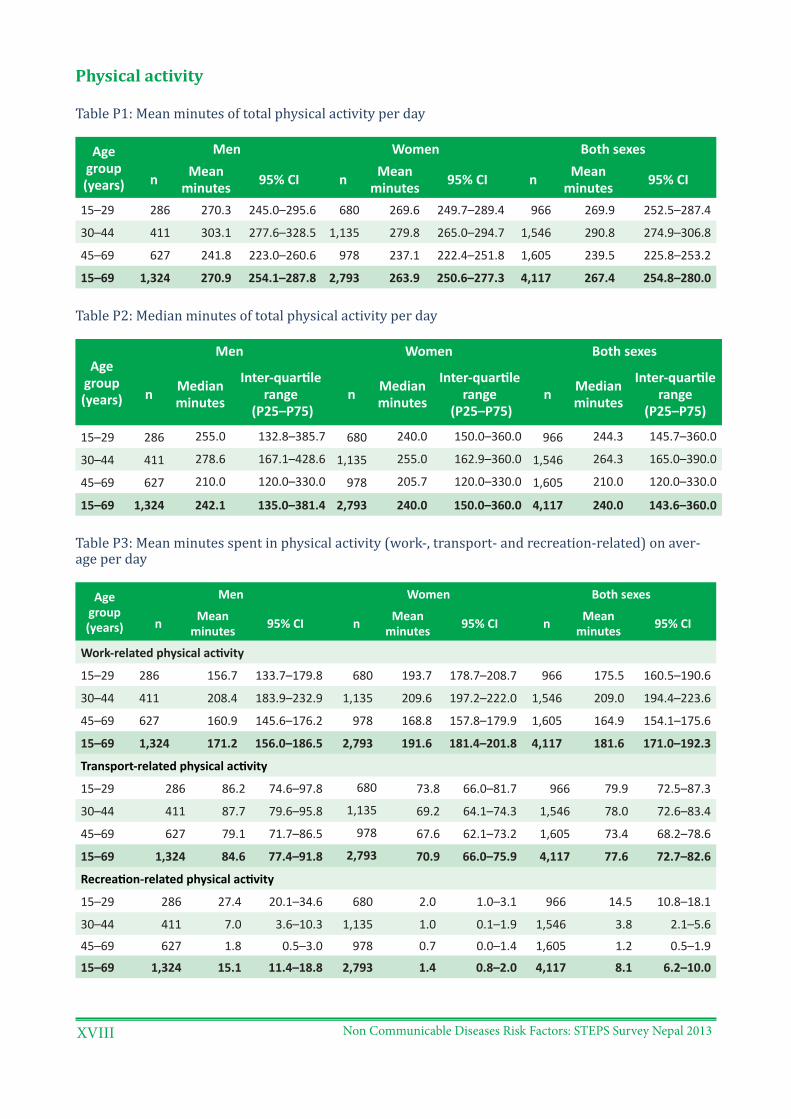
Non Communicable Diseases Risk Factors: STEPS Survey Nepal 2013XVIII
Physical activity
Table P1: Mean minutes of total physical activity per day
Age group (years)
Men Women Both sexes
n Mean minutes 95% CI n Mean
minutes 95% CI n Mean minutes 95% CI
15–29 286 270.3 245.0–295.6 680 269.6 249.7–289.4 966 269.9 252.5–287.4
30–44 411 303.1 277.6–328.5 1,135 279.8 265.0–294.7 1,546 290.8 274.9–306.8
45–69 627 241.8 223.0–260.6 978 237.1 222.4–251.8 1,605 239.5 225.8–253.2
15–69 1,324 270.9 254.1–287.8 2,793 263.9 250.6–277.3 4,117 267.4 254.8–280.0
Table P2: Median minutes of total physical activity per day
Age group (years)
Men Women Both sexes
n Median minutes
Inter-quartile range
(P25–P75)n Median
minutes
Inter-quartile range
(P25–P75)n Median
minutes
Inter-quartile range
(P25–P75)
15–29 286 255.0 132.8–385.7 680 240.0 150.0–360.0 966 244.3 145.7–360.0
30–44 411 278.6 167.1–428.6 1,135 255.0 162.9–360.0 1,546 264.3 165.0–390.0
45–69 627 210.0 120.0–330.0 978 205.7 120.0–330.0 1,605 210.0 120.0–330.0
15–69 1,324 242.1 135.0–381.4 2,793 240.0 150.0–360.0 4,117 240.0 143.6–360.0
Table P3: Mean minutes spent in physical activity (work-, transport- and recreation-related) on aver-age per day
Age group (years)
Men Women Both sexes
n Mean minutes 95% CI n Mean
minutes 95% CI n Mean minutes 95% CI
Work-related physical activity
15–29 286 156.7 133.7–179.8 680 193.7 178.7–208.7 966 175.5 160.5–190.6
30–44 411 208.4 183.9–232.9 1,135 209.6 197.2–222.0 1,546 209.0 194.4–223.6
45–69 627 160.9 145.6–176.2 978 168.8 157.8–179.9 1,605 164.9 154.1–175.6
15–69 1,324 171.2 156.0–186.5 2,793 191.6 181.4–201.8 4,117 181.6 171.0–192.3
Transport-related physical activity
15–29 286 86.2 74.6–97.8 680 73.8 66.0–81.7 966 79.9 72.5–87.3
30–44 411 87.7 79.6–95.8 1,135 69.2 64.1–74.3 1,546 78.0 72.6–83.4
45–69 627 79.1 71.7–86.5 978 67.6 62.1–73.2 1,605 73.4 68.2–78.6
15–69 1,324 84.6 77.4–91.8 2,793 70.9 66.0–75.9 4,117 77.6 72.7–82.6
Recreation-related physical activity
15–29 286 27.4 20.1–34.6 680 2.0 1.0–3.1 966 14.5 10.8–18.1
30–44 411 7.0 3.6–10.3 1,135 1.0 0.1–1.9 1,546 3.8 2.1–5.6
45–69 627 1.8 0.5–3.0 978 0.7 0.0–1.4 1,605 1.2 0.5–1.9
15–69 1,324 15.1 11.4–18.8 2,793 1.4 0.8–2.0 4,117 8.1 6.2–10.0
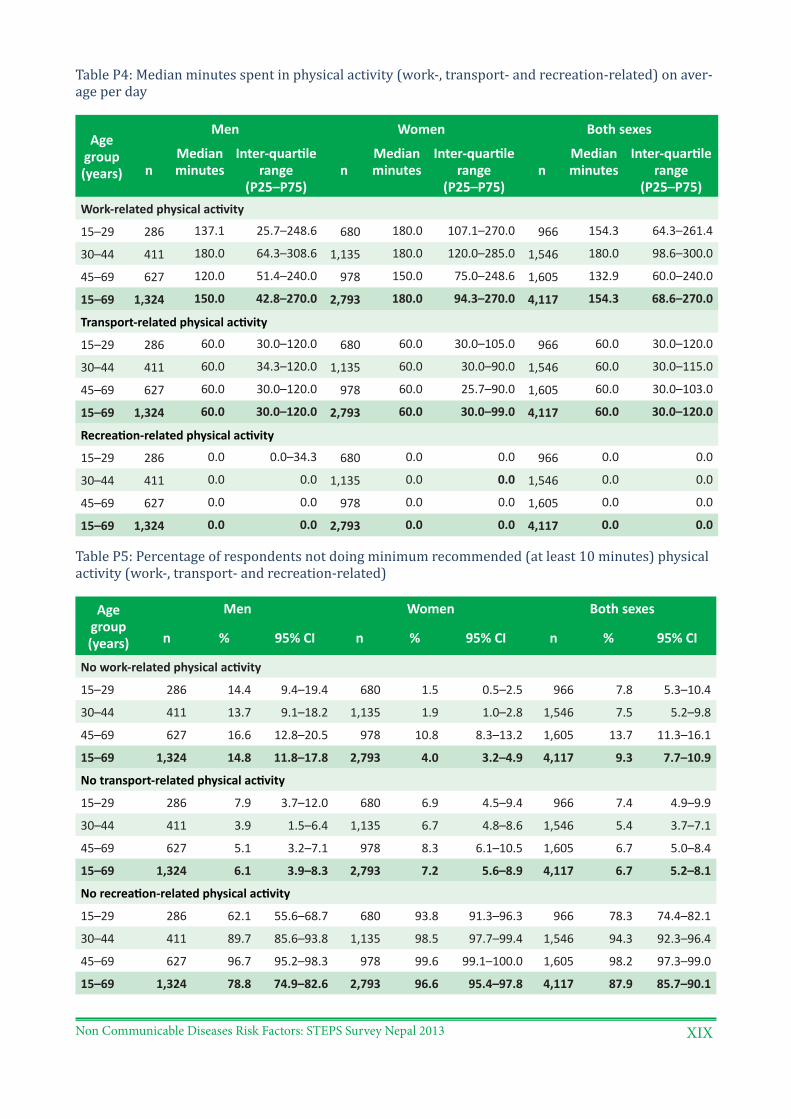
Non Communicable Diseases Risk Factors: STEPS Survey Nepal 2013 XIX
Table P4: Median minutes spent in physical activity (work-, transport- and recreation-related) on aver-age per day
Age group (years)
Men Women Both sexes
nMedian minutes
Inter-quartile range
(P25–P75)n
Median minutes
Inter-quartile range
(P25–P75)n
Median minutes
Inter-quartile range
(P25–P75)Work-related physical activity
15–29 286 137.1 25.7–248.6 680 180.0 107.1–270.0 966 154.3 64.3–261.4
30–44 411 180.0 64.3–308.6 1,135 180.0 120.0–285.0 1,546 180.0 98.6–300.0
45–69 627 120.0 51.4–240.0 978 150.0 75.0–248.6 1,605 132.9 60.0–240.0
15–69 1,324 150.0 42.8–270.0 2,793 180.0 94.3–270.0 4,117 154.3 68.6–270.0
Transport-related physical activity
15–29 286 60.0 30.0–120.0 680 60.0 30.0–105.0 966 60.0 30.0–120.0
30–44 411 60.0 34.3–120.0 1,135 60.0 30.0–90.0 1,546 60.0 30.0–115.0
45–69 627 60.0 30.0–120.0 978 60.0 25.7–90.0 1,605 60.0 30.0–103.0
15–69 1,324 60.0 30.0–120.0 2,793 60.0 30.0–99.0 4,117 60.0 30.0–120.0
Recreation-related physical activity
15–29 286 0.0 0.0–34.3 680 0.0 0.0 966 0.0 0.0
30–44 411 0.0 0.0 1,135 0.0 0.0 1,546 0.0 0.0
45–69 627 0.0 0.0 978 0.0 0.0 1,605 0.0 0.0
15–69 1,324 0.0 0.0 2,793 0.0 0.0 4,117 0.0 0.0
Table P5: Percentage of respondents not doing minimum recommended (at least 10 minutes) physical activity (work-, transport- and recreation-related)
Age group (years)
Men Women Both sexes
n % 95% CI n % 95% CI n % 95% CI
No work-related physical activity
15–29 286 14.4 9.4–19.4 680 1.5 0.5–2.5 966 7.8 5.3–10.4
30–44 411 13.7 9.1–18.2 1,135 1.9 1.0–2.8 1,546 7.5 5.2–9.8
45–69 627 16.6 12.8–20.5 978 10.8 8.3–13.2 1,605 13.7 11.3–16.1
15–69 1,324 14.8 11.8–17.8 2,793 4.0 3.2–4.9 4,117 9.3 7.7–10.9
No transport-related physical activity
15–29 286 7.9 3.7–12.0 680 6.9 4.5–9.4 966 7.4 4.9–9.9
30–44 411 3.9 1.5–6.4 1,135 6.7 4.8–8.6 1,546 5.4 3.7–7.1
45–69 627 5.1 3.2–7.1 978 8.3 6.1–10.5 1,605 6.7 5.0–8.4
15–69 1,324 6.1 3.9–8.3 2,793 7.2 5.6–8.9 4,117 6.7 5.2–8.1
No recreation-related physical activity
15–29 286 62.1 55.6–68.7 680 93.8 91.3–96.3 966 78.3 74.4–82.1
30–44 411 89.7 85.6–93.8 1,135 98.5 97.7–99.4 1,546 94.3 92.3–96.4
45–69 627 96.7 95.2–98.3 978 99.6 99.1–100.0 1,605 98.2 97.3–99.0
15–69 1,324 78.8 74.9–82.6 2,793 96.6 95.4–97.8 4,117 87.9 85.7–90.1
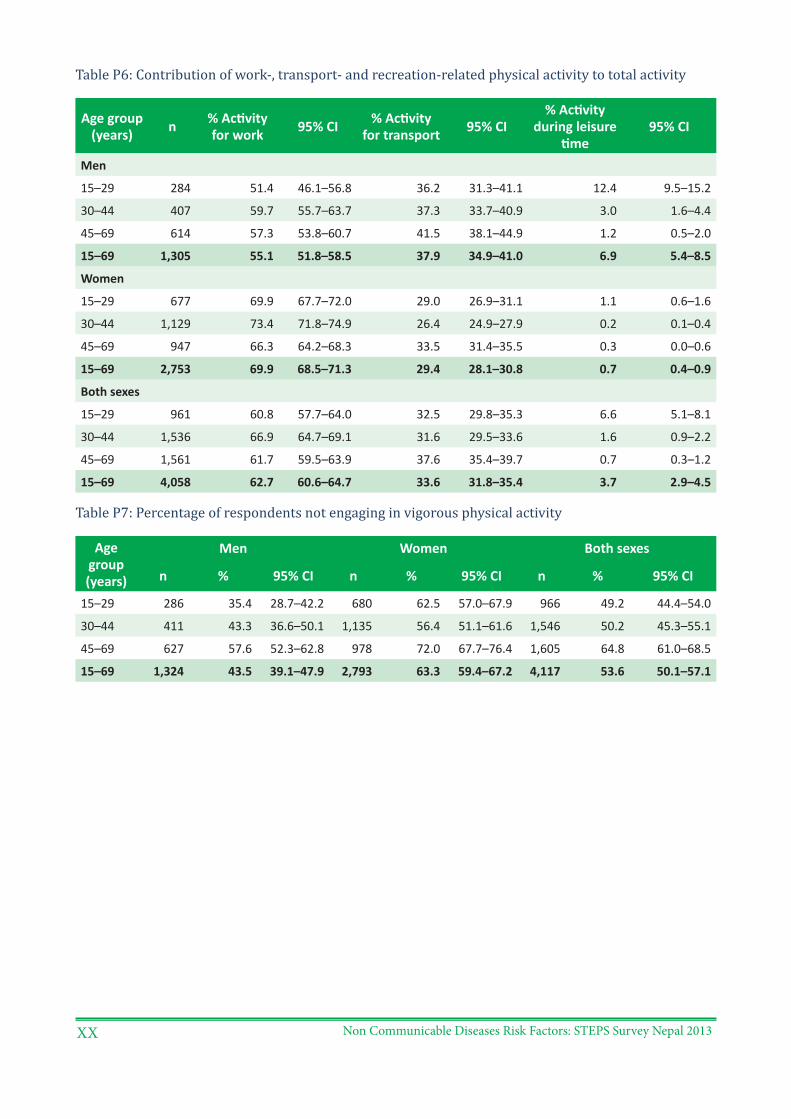
Non Communicable Diseases Risk Factors: STEPS Survey Nepal 2013XX
Table P6: Contribution of work-, transport- and recreation-related physical activity to total activity
Age group (years) n % Activity
for work 95% CI % Activity for transport 95% CI
% Activity during leisure
time95% CI
Men
15–29 284 51.4 46.1–56.8 36.2 31.3–41.1 12.4 9.5–15.2
30–44 407 59.7 55.7–63.7 37.3 33.7–40.9 3.0 1.6–4.4
45–69 614 57.3 53.8–60.7 41.5 38.1–44.9 1.2 0.5–2.0
15–69 1,305 55.1 51.8–58.5 37.9 34.9–41.0 6.9 5.4–8.5
Women
15–29 677 69.9 67.7–72.0 29.0 26.9–31.1 1.1 0.6–1.6
30–44 1,129 73.4 71.8–74.9 26.4 24.9–27.9 0.2 0.1–0.4
45–69 947 66.3 64.2–68.3 33.5 31.4–35.5 0.3 0.0–0.6
15–69 2,753 69.9 68.5–71.3 29.4 28.1–30.8 0.7 0.4–0.9
Both sexes
15–29 961 60.8 57.7–64.0 32.5 29.8–35.3 6.6 5.1–8.1
30–44 1,536 66.9 64.7–69.1 31.6 29.5–33.6 1.6 0.9–2.2
45–69 1,561 61.7 59.5–63.9 37.6 35.4–39.7 0.7 0.3–1.2
15–69 4,058 62.7 60.6–64.7 33.6 31.8–35.4 3.7 2.9–4.5
Table P7: Percentage of respondents not engaging in vigorous physical activity
Age group (years)
Men Women Both sexes
n % 95% CI n % 95% CI n % 95% CI
15–29 286 35.4 28.7–42.2 680 62.5 57.0–67.9 966 49.2 44.4–54.0
30–44 411 43.3 36.6–50.1 1,135 56.4 51.1–61.6 1,546 50.2 45.3–55.1
45–69 627 57.6 52.3–62.8 978 72.0 67.7–76.4 1,605 64.8 61.0–68.5
15–69 1,324 43.5 39.1–47.9 2,793 63.3 59.4–67.2 4,117 53.6 50.1–57.1
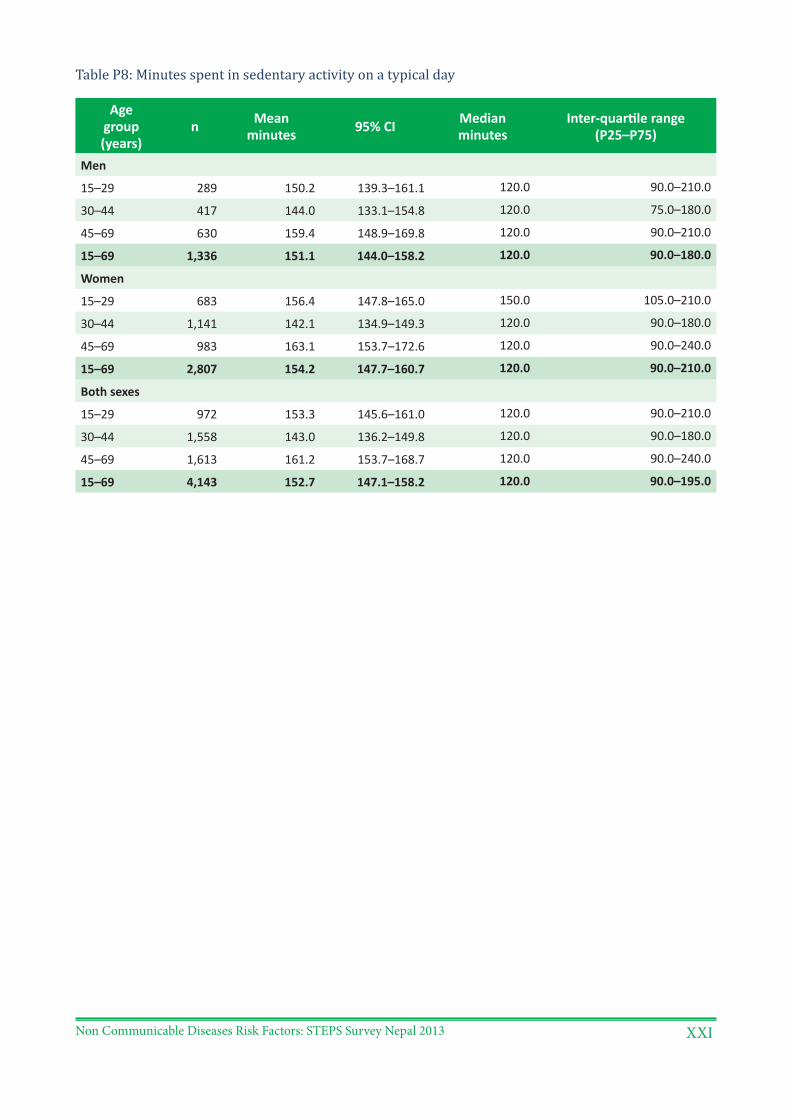
Non Communicable Diseases Risk Factors: STEPS Survey Nepal 2013 XXI
Table P8: Minutes spent in sedentary activity on a typical day
Age group (years)
n Mean minutes 95% CI Median
minutesInter-quartile range
(P25–P75)
Men
15–29 289 150.2 139.3–161.1 120.0 90.0–210.0
30–44 417 144.0 133.1–154.8 120.0 75.0–180.0
45–69 630 159.4 148.9–169.8 120.0 90.0–210.0
15–69 1,336 151.1 144.0–158.2 120.0 90.0–180.0
Women
15–29 683 156.4 147.8–165.0 150.0 105.0–210.0
30–44 1,141 142.1 134.9–149.3 120.0 90.0–180.0
45–69 983 163.1 153.7–172.6 120.0 90.0–240.0
15–69 2,807 154.2 147.7–160.7 120.0 90.0–210.0
Both sexes
15–29 972 153.3 145.6–161.0 120.0 90.0–210.0
30–44 1,558 143.0 136.2–149.8 120.0 90.0–180.0
45–69 1,613 161.2 153.7–168.7 120.0 90.0–240.0
15–69 4,143 152.7 147.1–158.2 120.0 90.0–195.0
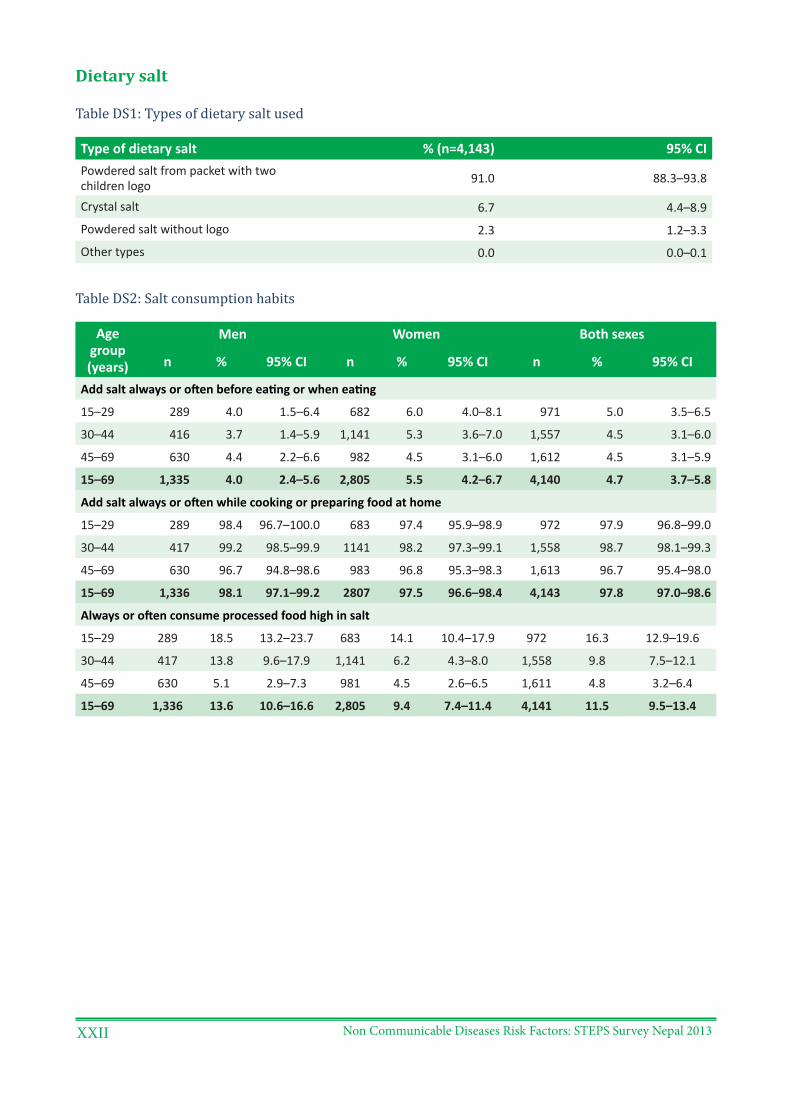
Non Communicable Diseases Risk Factors: STEPS Survey Nepal 2013XXII
Dietary salt
Table DS1: Types of dietary salt used
Type of dietary salt % (n=4,143) 95% CIPowdered salt from packet with two children logo 91.0 88.3–93.8
Crystal salt 6.7 4.4–8.9
Powdered salt without logo 2.3 1.2–3.3
Other types 0.0 0.0–0.1
Table DS2: Salt consumption habits
Age group (years)
Men Women Both sexes
n % 95% CI n % 95% CI n % 95% CI
Add salt always or often before eating or when eating
15–29 289 4.0 1.5–6.4 682 6.0 4.0–8.1 971 5.0 3.5–6.5
30–44 416 3.7 1.4–5.9 1,141 5.3 3.6–7.0 1,557 4.5 3.1–6.0
45–69 630 4.4 2.2–6.6 982 4.5 3.1–6.0 1,612 4.5 3.1–5.9
15–69 1,335 4.0 2.4–5.6 2,805 5.5 4.2–6.7 4,140 4.7 3.7–5.8
Add salt always or often while cooking or preparing food at home
15–29 289 98.4 96.7–100.0 683 97.4 95.9–98.9 972 97.9 96.8–99.0
30–44 417 99.2 98.5–99.9 1141 98.2 97.3–99.1 1,558 98.7 98.1–99.3
45–69 630 96.7 94.8–98.6 983 96.8 95.3–98.3 1,613 96.7 95.4–98.0
15–69 1,336 98.1 97.1–99.2 2807 97.5 96.6–98.4 4,143 97.8 97.0–98.6
Always or often consume processed food high in salt
15–29 289 18.5 13.2–23.7 683 14.1 10.4–17.9 972 16.3 12.9–19.6
30–44 417 13.8 9.6–17.9 1,141 6.2 4.3–8.0 1,558 9.8 7.5–12.1
45–69 630 5.1 2.9–7.3 981 4.5 2.6–6.5 1,611 4.8 3.2–6.4
15–69 1,336 13.6 10.6–16.6 2,805 9.4 7.4–11.4 4,141 11.5 9.5–13.4
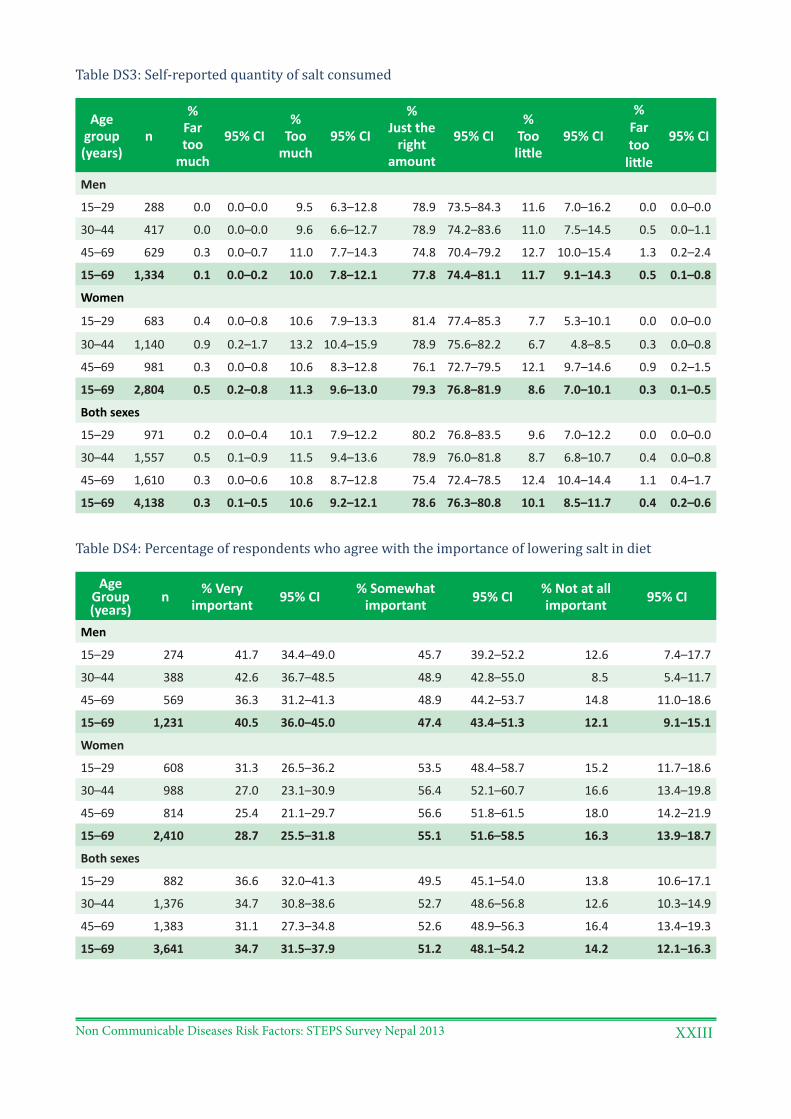
Non Communicable Diseases Risk Factors: STEPS Survey Nepal 2013 XXIII
Table DS3: Self-reported quantity of salt consumed
Age group (years)
n
% Far too
much
95% CI%
Too much
95% CI
% Just the
right amount
95% CI%
Too little
95% CI
% Far too
little
95% CI
Men
15–29 288 0.0 0.0–0.0 9.5 6.3–12.8 78.9 73.5–84.3 11.6 7.0–16.2 0.0 0.0–0.0
30–44 417 0.0 0.0–0.0 9.6 6.6–12.7 78.9 74.2–83.6 11.0 7.5–14.5 0.5 0.0–1.1
45–69 629 0.3 0.0–0.7 11.0 7.7–14.3 74.8 70.4–79.2 12.7 10.0–15.4 1.3 0.2–2.4
15–69 1,334 0.1 0.0–0.2 10.0 7.8–12.1 77.8 74.4–81.1 11.7 9.1–14.3 0.5 0.1–0.8
Women
15–29 683 0.4 0.0–0.8 10.6 7.9–13.3 81.4 77.4–85.3 7.7 5.3–10.1 0.0 0.0–0.0
30–44 1,140 0.9 0.2–1.7 13.2 10.4–15.9 78.9 75.6–82.2 6.7 4.8–8.5 0.3 0.0–0.8
45–69 981 0.3 0.0–0.8 10.6 8.3–12.8 76.1 72.7–79.5 12.1 9.7–14.6 0.9 0.2–1.5
15–69 2,804 0.5 0.2–0.8 11.3 9.6–13.0 79.3 76.8–81.9 8.6 7.0–10.1 0.3 0.1–0.5
Both sexes
15–29 971 0.2 0.0–0.4 10.1 7.9–12.2 80.2 76.8–83.5 9.6 7.0–12.2 0.0 0.0–0.0
30–44 1,557 0.5 0.1–0.9 11.5 9.4–13.6 78.9 76.0–81.8 8.7 6.8–10.7 0.4 0.0–0.8
45–69 1,610 0.3 0.0–0.6 10.8 8.7–12.8 75.4 72.4–78.5 12.4 10.4–14.4 1.1 0.4–1.7
15–69 4,138 0.3 0.1–0.5 10.6 9.2–12.1 78.6 76.3–80.8 10.1 8.5–11.7 0.4 0.2–0.6
Table DS4: Percentage of respondents who agree with the importance of lowering salt in diet
Age Group (years)
n % Very important 95% CI % Somewhat
important 95% CI % Not at all important 95% CI
Men
15–29 274 41.7 34.4–49.0 45.7 39.2–52.2 12.6 7.4–17.7
30–44 388 42.6 36.7–48.5 48.9 42.8–55.0 8.5 5.4–11.7
45–69 569 36.3 31.2–41.3 48.9 44.2–53.7 14.8 11.0–18.6
15–69 1,231 40.5 36.0–45.0 47.4 43.4–51.3 12.1 9.1–15.1
Women
15–29 608 31.3 26.5–36.2 53.5 48.4–58.7 15.2 11.7–18.6
30–44 988 27.0 23.1–30.9 56.4 52.1–60.7 16.6 13.4–19.8
45–69 814 25.4 21.1–29.7 56.6 51.8–61.5 18.0 14.2–21.9
15–69 2,410 28.7 25.5–31.8 55.1 51.6–58.5 16.3 13.9–18.7
Both sexes
15–29 882 36.6 32.0–41.3 49.5 45.1–54.0 13.8 10.6–17.1
30–44 1,376 34.7 30.8–38.6 52.7 48.6–56.8 12.6 10.3–14.9
45–69 1,383 31.1 27.3–34.8 52.6 48.9–56.3 16.4 13.4–19.3
15–69 3,641 34.7 31.5–37.9 51.2 48.1–54.2 14.2 12.1–16.3
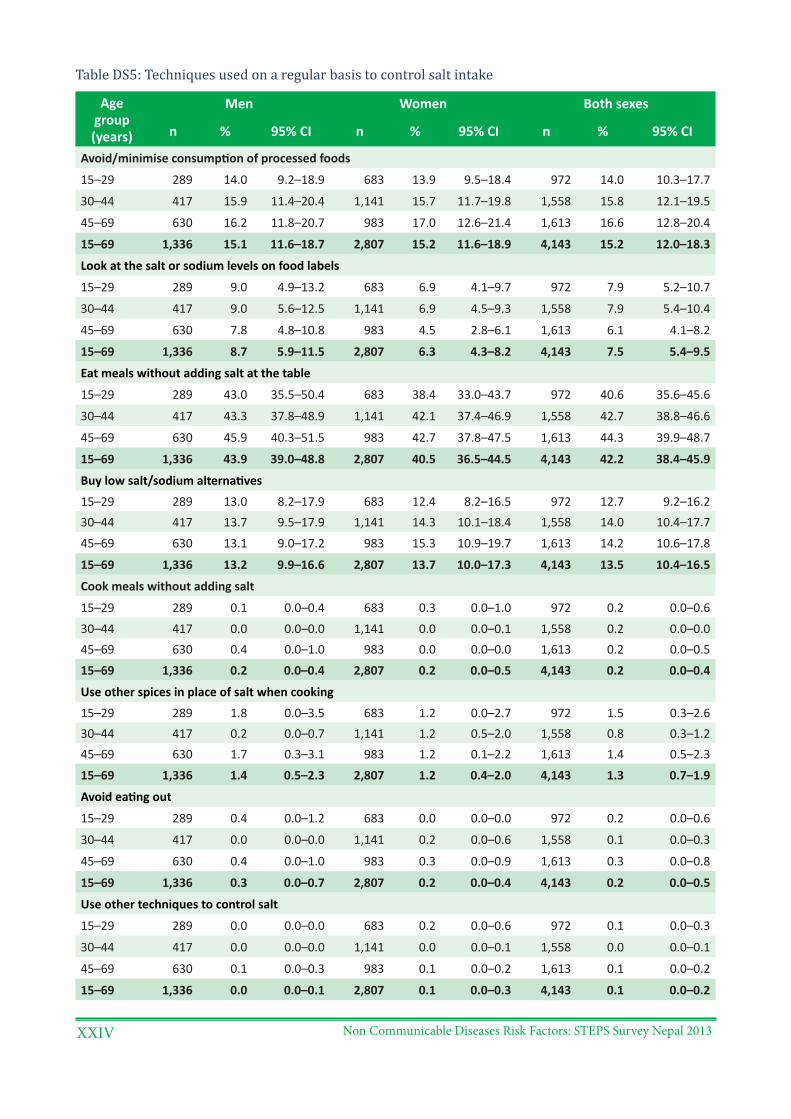
Non Communicable Diseases Risk Factors: STEPS Survey Nepal 2013XXIV
Table DS5: Techniques used on a regular basis to control salt intake
Age group (years)
Men Women Both sexes
n % 95% CI n % 95% CI n % 95% CI
Avoid/minimise consumption of processed foods
15–29 289 14.0 9.2–18.9 683 13.9 9.5–18.4 972 14.0 10.3–17.7
30–44 417 15.9 11.4–20.4 1,141 15.7 11.7–19.8 1,558 15.8 12.1–19.5
45–69 630 16.2 11.8–20.7 983 17.0 12.6–21.4 1,613 16.6 12.8–20.4
15–69 1,336 15.1 11.6–18.7 2,807 15.2 11.6–18.9 4,143 15.2 12.0–18.3
Look at the salt or sodium levels on food labels
15–29 289 9.0 4.9–13.2 683 6.9 4.1–9.7 972 7.9 5.2–10.7
30–44 417 9.0 5.6–12.5 1,141 6.9 4.5–9.3 1,558 7.9 5.4–10.4
45–69 630 7.8 4.8–10.8 983 4.5 2.8–6.1 1,613 6.1 4.1–8.2
15–69 1,336 8.7 5.9–11.5 2,807 6.3 4.3–8.2 4,143 7.5 5.4–9.5
Eat meals without adding salt at the table
15–29 289 43.0 35.5–50.4 683 38.4 33.0–43.7 972 40.6 35.6–45.6
30–44 417 43.3 37.8–48.9 1,141 42.1 37.4–46.9 1,558 42.7 38.8–46.6
45–69 630 45.9 40.3–51.5 983 42.7 37.8–47.5 1,613 44.3 39.9–48.7
15–69 1,336 43.9 39.0–48.8 2,807 40.5 36.5–44.5 4,143 42.2 38.4–45.9
Buy low salt/sodium alternatives
15–29 289 13.0 8.2–17.9 683 12.4 8.2–16.5 972 12.7 9.2–16.230–44 417 13.7 9.5–17.9 1,141 14.3 10.1–18.4 1,558 14.0 10.4–17.7
45–69 630 13.1 9.0–17.2 983 15.3 10.9–19.7 1,613 14.2 10.6–17.8
15–69 1,336 13.2 9.9–16.6 2,807 13.7 10.0–17.3 4,143 13.5 10.4–16.5
Cook meals without adding salt
15–29 289 0.1 0.0–0.4 683 0.3 0.0–1.0 972 0.2 0.0–0.6
30–44 417 0.0 0.0–0.0 1,141 0.0 0.0–0.1 1,558 0.2 0.0–0.045–69 630 0.4 0.0–1.0 983 0.0 0.0–0.0 1,613 0.2 0.0–0.5
15–69 1,336 0.2 0.0–0.4 2,807 0.2 0.0–0.5 4,143 0.2 0.0–0.4
Use other spices in place of salt when cooking
15–29 289 1.8 0.0–3.5 683 1.2 0.0–2.7 972 1.5 0.3–2.630–44 417 0.2 0.0–0.7 1,141 1.2 0.5–2.0 1,558 0.8 0.3–1.245–69 630 1.7 0.3–3.1 983 1.2 0.1–2.2 1,613 1.4 0.5–2.3
15–69 1,336 1.4 0.5–2.3 2,807 1.2 0.4–2.0 4,143 1.3 0.7–1.9
Avoid eating out
15–29 289 0.4 0.0–1.2 683 0.0 0.0–0.0 972 0.2 0.0–0.6
30–44 417 0.0 0.0–0.0 1,141 0.2 0.0–0.6 1,558 0.1 0.0–0.3
45–69 630 0.4 0.0–1.0 983 0.3 0.0–0.9 1,613 0.3 0.0–0.8
15–69 1,336 0.3 0.0–0.7 2,807 0.2 0.0–0.4 4,143 0.2 0.0–0.5
Use other techniques to control salt
15–29 289 0.0 0.0–0.0 683 0.2 0.0–0.6 972 0.1 0.0–0.3
30–44 417 0.0 0.0–0.0 1,141 0.0 0.0–0.1 1,558 0.0 0.0–0.1
45–69 630 0.1 0.0–0.3 983 0.1 0.0–0.2 1,613 0.1 0.0–0.2
15–69 1,336 0.0 0.0–0.1 2,807 0.1 0.0–0.3 4,143 0.1 0.0–0.2
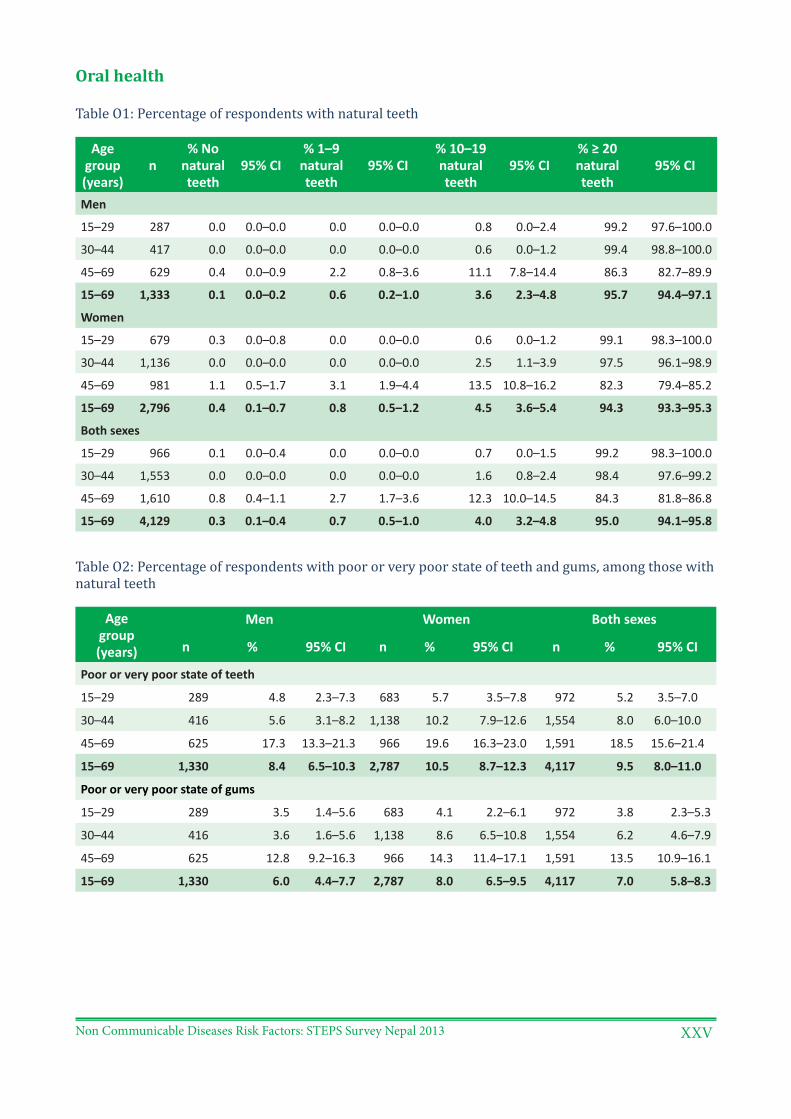
Non Communicable Diseases Risk Factors: STEPS Survey Nepal 2013 XXV
Oral health
Table O1: Percentage of respondents with natural teeth
Age group (years)
n% No
natural teeth
95% CI% 1–9
natural teeth
95% CI% 10–19 natural teeth
95% CI% ≥ 20 natural teeth
95% CI
Men
15–29 287 0.0 0.0–0.0 0.0 0.0–0.0 0.8 0.0–2.4 99.2 97.6–100.0
30–44 417 0.0 0.0–0.0 0.0 0.0–0.0 0.6 0.0–1.2 99.4 98.8–100.0
45–69 629 0.4 0.0–0.9 2.2 0.8–3.6 11.1 7.8–14.4 86.3 82.7–89.9
15–69 1,333 0.1 0.0–0.2 0.6 0.2–1.0 3.6 2.3–4.8 95.7 94.4–97.1
Women
15–29 679 0.3 0.0–0.8 0.0 0.0–0.0 0.6 0.0–1.2 99.1 98.3–100.0
30–44 1,136 0.0 0.0–0.0 0.0 0.0–0.0 2.5 1.1–3.9 97.5 96.1–98.9
45–69 981 1.1 0.5–1.7 3.1 1.9–4.4 13.5 10.8–16.2 82.3 79.4–85.2
15–69 2,796 0.4 0.1–0.7 0.8 0.5–1.2 4.5 3.6–5.4 94.3 93.3–95.3
Both sexes
15–29 966 0.1 0.0–0.4 0.0 0.0–0.0 0.7 0.0–1.5 99.2 98.3–100.0
30–44 1,553 0.0 0.0–0.0 0.0 0.0–0.0 1.6 0.8–2.4 98.4 97.6–99.2
45–69 1,610 0.8 0.4–1.1 2.7 1.7–3.6 12.3 10.0–14.5 84.3 81.8–86.8
15–69 4,129 0.3 0.1–0.4 0.7 0.5–1.0 4.0 3.2–4.8 95.0 94.1–95.8
Table O2: Percentage of respondents with poor or very poor state of teeth and gums, among those with natural teeth
Age group (years)
Men Women Both sexes
n % 95% CI n % 95% CI n % 95% CI
Poor or very poor state of teeth
15–29 289 4.8 2.3–7.3 683 5.7 3.5–7.8 972 5.2 3.5–7.0
30–44 416 5.6 3.1–8.2 1,138 10.2 7.9–12.6 1,554 8.0 6.0–10.0
45–69 625 17.3 13.3–21.3 966 19.6 16.3–23.0 1,591 18.5 15.6–21.4
15–69 1,330 8.4 6.5–10.3 2,787 10.5 8.7–12.3 4,117 9.5 8.0–11.0
Poor or very poor state of gums
15–29 289 3.5 1.4–5.6 683 4.1 2.2–6.1 972 3.8 2.3–5.3
30–44 416 3.6 1.6–5.6 1,138 8.6 6.5–10.8 1,554 6.2 4.6–7.9
45–69 625 12.8 9.2–16.3 966 14.3 11.4–17.1 1,591 13.5 10.9–16.1
15–69 1,330 6.0 4.4–7.7 2,787 8.0 6.5–9.5 4,117 7.0 5.8–8.3
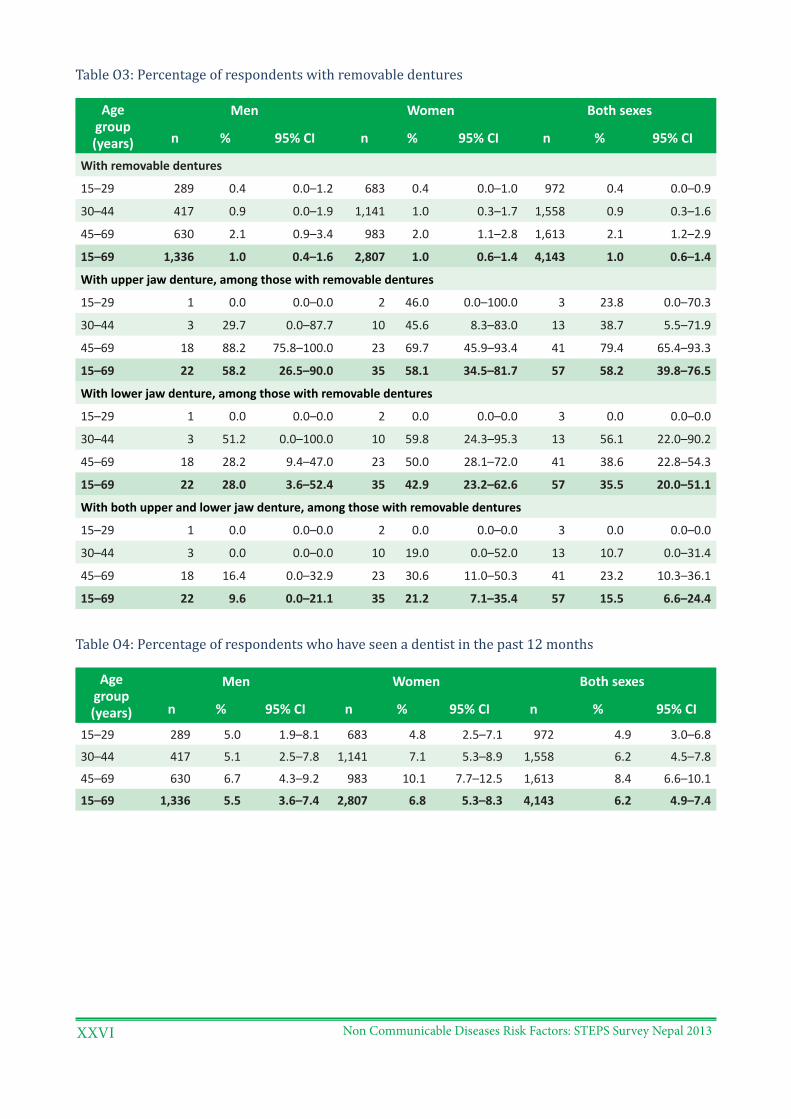
Non Communicable Diseases Risk Factors: STEPS Survey Nepal 2013XXVI
Table O3: Percentage of respondents with removable dentures
Age group (years)
Men Women Both sexes
n % 95% CI n % 95% CI n % 95% CI
With removable dentures
15–29 289 0.4 0.0–1.2 683 0.4 0.0–1.0 972 0.4 0.0–0.9
30–44 417 0.9 0.0–1.9 1,141 1.0 0.3–1.7 1,558 0.9 0.3–1.6
45–69 630 2.1 0.9–3.4 983 2.0 1.1–2.8 1,613 2.1 1.2–2.9
15–69 1,336 1.0 0.4–1.6 2,807 1.0 0.6–1.4 4,143 1.0 0.6–1.4
With upper jaw denture, among those with removable dentures
15–29 1 0.0 0.0–0.0 2 46.0 0.0–100.0 3 23.8 0.0–70.3
30–44 3 29.7 0.0–87.7 10 45.6 8.3–83.0 13 38.7 5.5–71.9
45–69 18 88.2 75.8–100.0 23 69.7 45.9–93.4 41 79.4 65.4–93.3
15–69 22 58.2 26.5–90.0 35 58.1 34.5–81.7 57 58.2 39.8–76.5
With lower jaw denture, among those with removable dentures
15–29 1 0.0 0.0–0.0 2 0.0 0.0–0.0 3 0.0 0.0–0.0
30–44 3 51.2 0.0–100.0 10 59.8 24.3–95.3 13 56.1 22.0–90.2
45–69 18 28.2 9.4–47.0 23 50.0 28.1–72.0 41 38.6 22.8–54.3
15–69 22 28.0 3.6–52.4 35 42.9 23.2–62.6 57 35.5 20.0–51.1
With both upper and lower jaw denture, among those with removable dentures
15–29 1 0.0 0.0–0.0 2 0.0 0.0–0.0 3 0.0 0.0–0.0
30–44 3 0.0 0.0–0.0 10 19.0 0.0–52.0 13 10.7 0.0–31.4
45–69 18 16.4 0.0–32.9 23 30.6 11.0–50.3 41 23.2 10.3–36.1
15–69 22 9.6 0.0–21.1 35 21.2 7.1–35.4 57 15.5 6.6–24.4
Table O4: Percentage of respondents who have seen a dentist in the past 12 months
Age group (years)
Men Women Both sexes
n % 95% CI n % 95% CI n % 95% CI
15–29 289 5.0 1.9–8.1 683 4.8 2.5–7.1 972 4.9 3.0–6.8
30–44 417 5.1 2.5–7.8 1,141 7.1 5.3–8.9 1,558 6.2 4.5–7.8
45–69 630 6.7 4.3–9.2 983 10.1 7.7–12.5 1,613 8.4 6.6–10.1
15–69 1,336 5.5 3.6–7.4 2,807 6.8 5.3–8.3 4,143 6.2 4.9–7.4
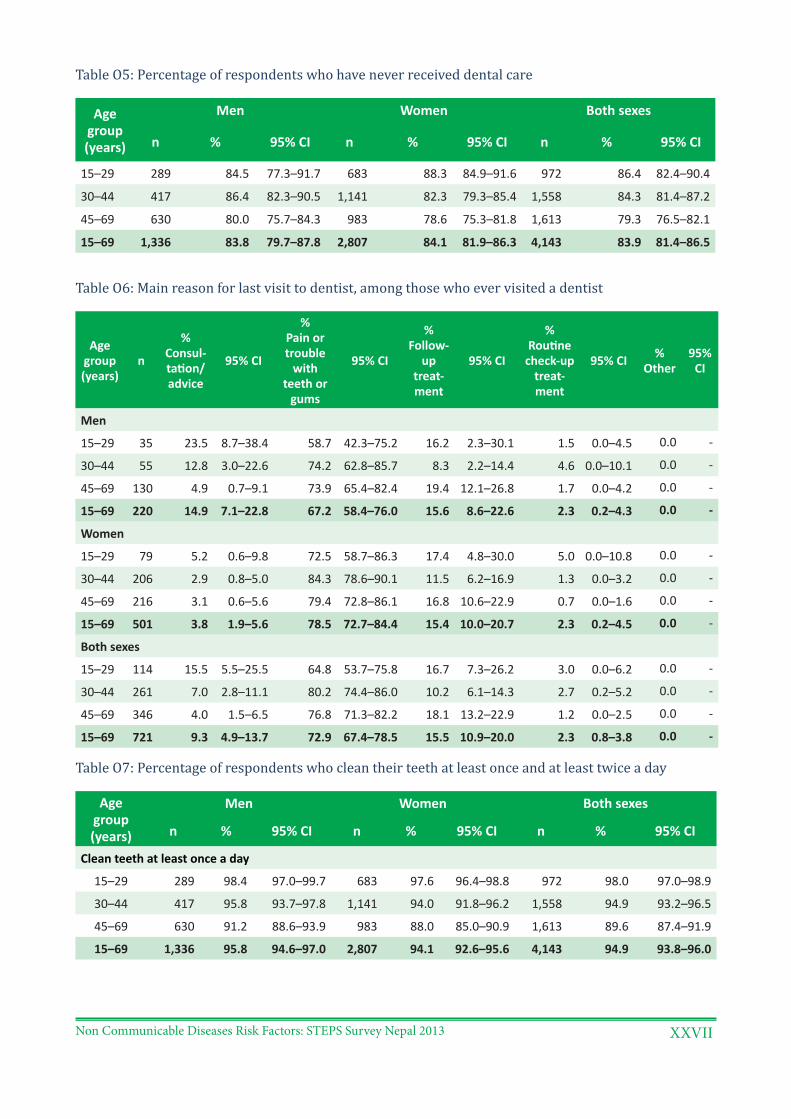
Non Communicable Diseases Risk Factors: STEPS Survey Nepal 2013 XXVII
Table O5: Percentage of respondents who have never received dental care
Age group (years)
Men Women Both sexes
n % 95% CI n % 95% CI n % 95% CI
15–29 289 84.5 77.3–91.7 683 88.3 84.9–91.6 972 86.4 82.4–90.4
30–44 417 86.4 82.3–90.5 1,141 82.3 79.3–85.4 1,558 84.3 81.4–87.2
45–69 630 80.0 75.7–84.3 983 78.6 75.3–81.8 1,613 79.3 76.5–82.1
15–69 1,336 83.8 79.7–87.8 2,807 84.1 81.9–86.3 4,143 83.9 81.4–86.5
Table O6: Main reason for last visit to dentist, among those who ever visited a dentist
Age group (years)
n
% Consul-tation/ advice
95% CI
% Pain or trouble
with teeth or
gums
95% CI
% Follow-
up treat-ment
95% CI
% Routine
check-up treat-ment
95% CI % Other
95% CI
Men
15–29 35 23.5 8.7–38.4 58.7 42.3–75.2 16.2 2.3–30.1 1.5 0.0–4.5 0.0 -
30–44 55 12.8 3.0–22.6 74.2 62.8–85.7 8.3 2.2–14.4 4.6 0.0–10.1 0.0 -
45–69 130 4.9 0.7–9.1 73.9 65.4–82.4 19.4 12.1–26.8 1.7 0.0–4.2 0.0 -
15–69 220 14.9 7.1–22.8 67.2 58.4–76.0 15.6 8.6–22.6 2.3 0.2–4.3 0.0 -
Women
15–29 79 5.2 0.6–9.8 72.5 58.7–86.3 17.4 4.8–30.0 5.0 0.0–10.8 0.0 -
30–44 206 2.9 0.8–5.0 84.3 78.6–90.1 11.5 6.2–16.9 1.3 0.0–3.2 0.0 -
45–69 216 3.1 0.6–5.6 79.4 72.8–86.1 16.8 10.6–22.9 0.7 0.0–1.6 0.0 -
15–69 501 3.8 1.9–5.6 78.5 72.7–84.4 15.4 10.0–20.7 2.3 0.2–4.5 0.0 -
Both sexes
15–29 114 15.5 5.5–25.5 64.8 53.7–75.8 16.7 7.3–26.2 3.0 0.0–6.2 0.0 -
30–44 261 7.0 2.8–11.1 80.2 74.4–86.0 10.2 6.1–14.3 2.7 0.2–5.2 0.0 -
45–69 346 4.0 1.5–6.5 76.8 71.3–82.2 18.1 13.2–22.9 1.2 0.0–2.5 0.0 -
15–69 721 9.3 4.9–13.7 72.9 67.4–78.5 15.5 10.9–20.0 2.3 0.8–3.8 0.0 -
Table O7: Percentage of respondents who clean their teeth at least once and at least twice a day
Age group (years)
Men Women Both sexes
n % 95% CI n % 95% CI n % 95% CI
Clean teeth at least once a day
15–29 289 98.4 97.0–99.7 683 97.6 96.4–98.8 972 98.0 97.0–98.9
30–44 417 95.8 93.7–97.8 1,141 94.0 91.8–96.2 1,558 94.9 93.2–96.5
45–69 630 91.2 88.6–93.9 983 88.0 85.0–90.9 1,613 89.6 87.4–91.9
15–69 1,336 95.8 94.6–97.0 2,807 94.1 92.6–95.6 4,143 94.9 93.8–96.0
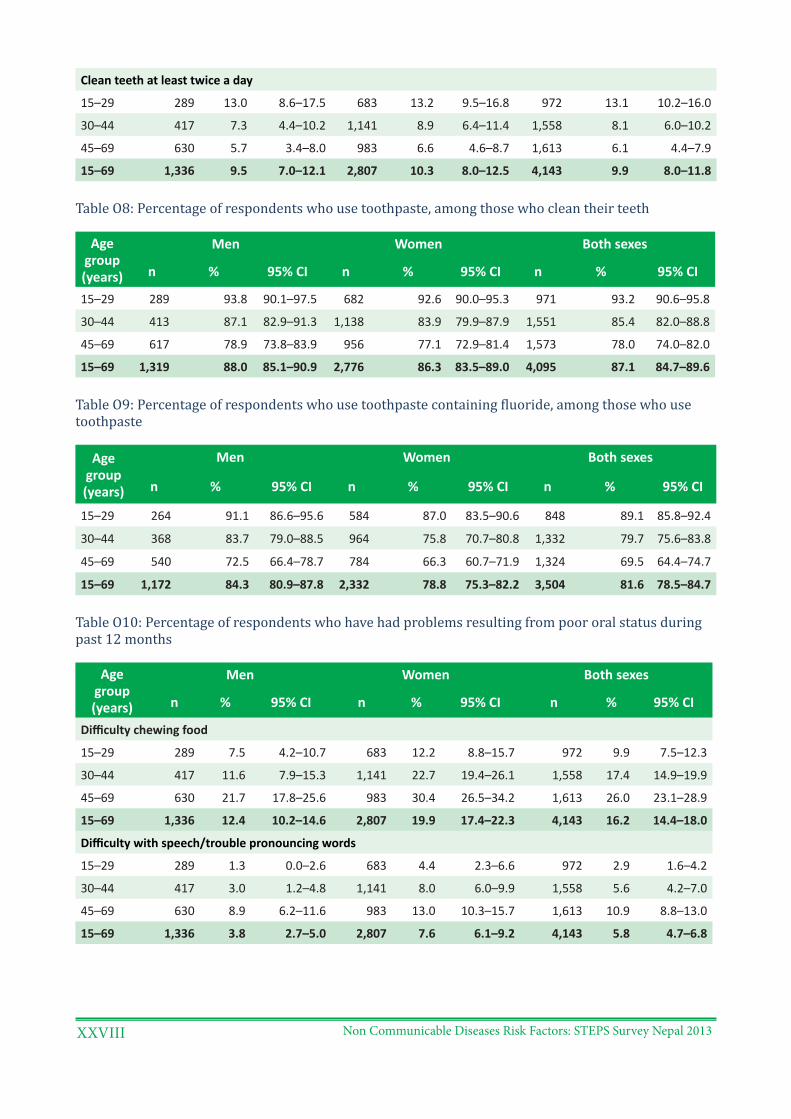
Non Communicable Diseases Risk Factors: STEPS Survey Nepal 2013XXVIII
Clean teeth at least twice a day
15–29 289 13.0 8.6–17.5 683 13.2 9.5–16.8 972 13.1 10.2–16.0
30–44 417 7.3 4.4–10.2 1,141 8.9 6.4–11.4 1,558 8.1 6.0–10.2
45–69 630 5.7 3.4–8.0 983 6.6 4.6–8.7 1,613 6.1 4.4–7.9
15–69 1,336 9.5 7.0–12.1 2,807 10.3 8.0–12.5 4,143 9.9 8.0–11.8
Table O8: Percentage of respondents who use toothpaste, among those who clean their teeth
Age group (years)
Men Women Both sexes
n % 95% CI n % 95% CI n % 95% CI
15–29 289 93.8 90.1–97.5 682 92.6 90.0–95.3 971 93.2 90.6–95.8
30–44 413 87.1 82.9–91.3 1,138 83.9 79.9–87.9 1,551 85.4 82.0–88.8
45–69 617 78.9 73.8–83.9 956 77.1 72.9–81.4 1,573 78.0 74.0–82.0
15–69 1,319 88.0 85.1–90.9 2,776 86.3 83.5–89.0 4,095 87.1 84.7–89.6
Table O9: Percentage of respondents who use toothpaste containing fluoride, among those who use toothpaste
Age group (years)
Men Women Both sexes
n % 95% CI n % 95% CI n % 95% CI
15–29 264 91.1 86.6–95.6 584 87.0 83.5–90.6 848 89.1 85.8–92.4
30–44 368 83.7 79.0–88.5 964 75.8 70.7–80.8 1,332 79.7 75.6–83.8
45–69 540 72.5 66.4–78.7 784 66.3 60.7–71.9 1,324 69.5 64.4–74.7
15–69 1,172 84.3 80.9–87.8 2,332 78.8 75.3–82.2 3,504 81.6 78.5–84.7
Table O10: Percentage of respondents who have had problems resulting from poor oral status during past 12 months
Age group (years)
Men Women Both sexes
n % 95% CI n % 95% CI n % 95% CI
Difficulty chewing food
15–29 289 7.5 4.2–10.7 683 12.2 8.8–15.7 972 9.9 7.5–12.3
30–44 417 11.6 7.9–15.3 1,141 22.7 19.4–26.1 1,558 17.4 14.9–19.9
45–69 630 21.7 17.8–25.6 983 30.4 26.5–34.2 1,613 26.0 23.1–28.9
15–69 1,336 12.4 10.2–14.6 2,807 19.9 17.4–22.3 4,143 16.2 14.4–18.0
Difficulty with speech/trouble pronouncing words
15–29 289 1.3 0.0–2.6 683 4.4 2.3–6.6 972 2.9 1.6–4.2
30–44 417 3.0 1.2–4.8 1,141 8.0 6.0–9.9 1,558 5.6 4.2–7.0
45–69 630 8.9 6.2–11.6 983 13.0 10.3–15.7 1,613 10.9 8.8–13.0
15–69 1,336 3.8 2.7–5.0 2,807 7.6 6.1–9.2 4,143 5.8 4.7–6.8
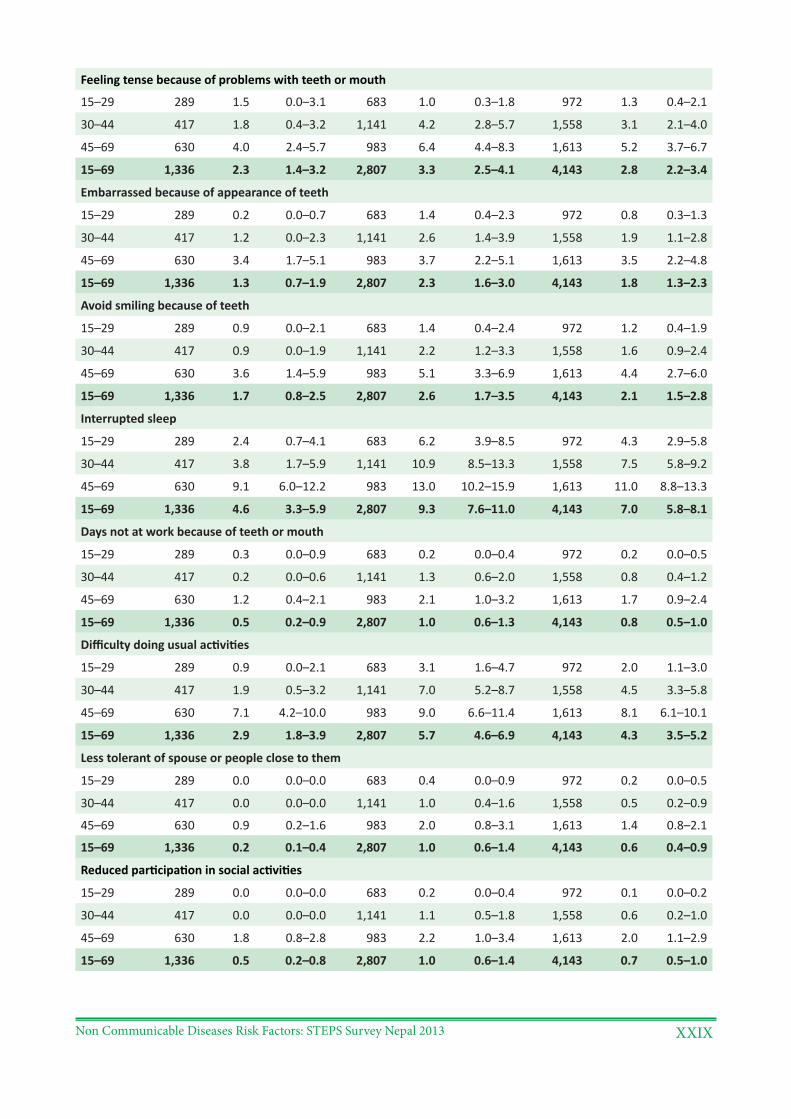
Non Communicable Diseases Risk Factors: STEPS Survey Nepal 2013 XXIX
Feeling tense because of problems with teeth or mouth
15–29 289 1.5 0.0–3.1 683 1.0 0.3–1.8 972 1.3 0.4–2.1
30–44 417 1.8 0.4–3.2 1,141 4.2 2.8–5.7 1,558 3.1 2.1–4.0
45–69 630 4.0 2.4–5.7 983 6.4 4.4–8.3 1,613 5.2 3.7–6.7
15–69 1,336 2.3 1.4–3.2 2,807 3.3 2.5–4.1 4,143 2.8 2.2–3.4
Embarrassed because of appearance of teeth
15–29 289 0.2 0.0–0.7 683 1.4 0.4–2.3 972 0.8 0.3–1.3
30–44 417 1.2 0.0–2.3 1,141 2.6 1.4–3.9 1,558 1.9 1.1–2.8
45–69 630 3.4 1.7–5.1 983 3.7 2.2–5.1 1,613 3.5 2.2–4.8
15–69 1,336 1.3 0.7–1.9 2,807 2.3 1.6–3.0 4,143 1.8 1.3–2.3
Avoid smiling because of teeth
15–29 289 0.9 0.0–2.1 683 1.4 0.4–2.4 972 1.2 0.4–1.9
30–44 417 0.9 0.0–1.9 1,141 2.2 1.2–3.3 1,558 1.6 0.9–2.4
45–69 630 3.6 1.4–5.9 983 5.1 3.3–6.9 1,613 4.4 2.7–6.0
15–69 1,336 1.7 0.8–2.5 2,807 2.6 1.7–3.5 4,143 2.1 1.5–2.8
Interrupted sleep
15–29 289 2.4 0.7–4.1 683 6.2 3.9–8.5 972 4.3 2.9–5.8
30–44 417 3.8 1.7–5.9 1,141 10.9 8.5–13.3 1,558 7.5 5.8–9.2
45–69 630 9.1 6.0–12.2 983 13.0 10.2–15.9 1,613 11.0 8.8–13.3
15–69 1,336 4.6 3.3–5.9 2,807 9.3 7.6–11.0 4,143 7.0 5.8–8.1
Days not at work because of teeth or mouth
15–29 289 0.3 0.0–0.9 683 0.2 0.0–0.4 972 0.2 0.0–0.5
30–44 417 0.2 0.0–0.6 1,141 1.3 0.6–2.0 1,558 0.8 0.4–1.2
45–69 630 1.2 0.4–2.1 983 2.1 1.0–3.2 1,613 1.7 0.9–2.4
15–69 1,336 0.5 0.2–0.9 2,807 1.0 0.6–1.3 4,143 0.8 0.5–1.0
Difficulty doing usual activities
15–29 289 0.9 0.0–2.1 683 3.1 1.6–4.7 972 2.0 1.1–3.0
30–44 417 1.9 0.5–3.2 1,141 7.0 5.2–8.7 1,558 4.5 3.3–5.8
45–69 630 7.1 4.2–10.0 983 9.0 6.6–11.4 1,613 8.1 6.1–10.1
15–69 1,336 2.9 1.8–3.9 2,807 5.7 4.6–6.9 4,143 4.3 3.5–5.2
Less tolerant of spouse or people close to them
15–29 289 0.0 0.0–0.0 683 0.4 0.0–0.9 972 0.2 0.0–0.5
30–44 417 0.0 0.0–0.0 1,141 1.0 0.4–1.6 1,558 0.5 0.2–0.9
45–69 630 0.9 0.2–1.6 983 2.0 0.8–3.1 1,613 1.4 0.8–2.1
15–69 1,336 0.2 0.1–0.4 2,807 1.0 0.6–1.4 4,143 0.6 0.4–0.9
Reduced participation in social activities
15–29 289 0.0 0.0–0.0 683 0.2 0.0–0.4 972 0.1 0.0–0.2
30–44 417 0.0 0.0–0.0 1,141 1.1 0.5–1.8 1,558 0.6 0.2–1.0
45–69 630 1.8 0.8–2.8 983 2.2 1.0–3.4 1,613 2.0 1.1–2.9
15–69 1,336 0.5 0.2–0.8 2,807 1.0 0.6–1.4 4,143 0.7 0.5–1.0
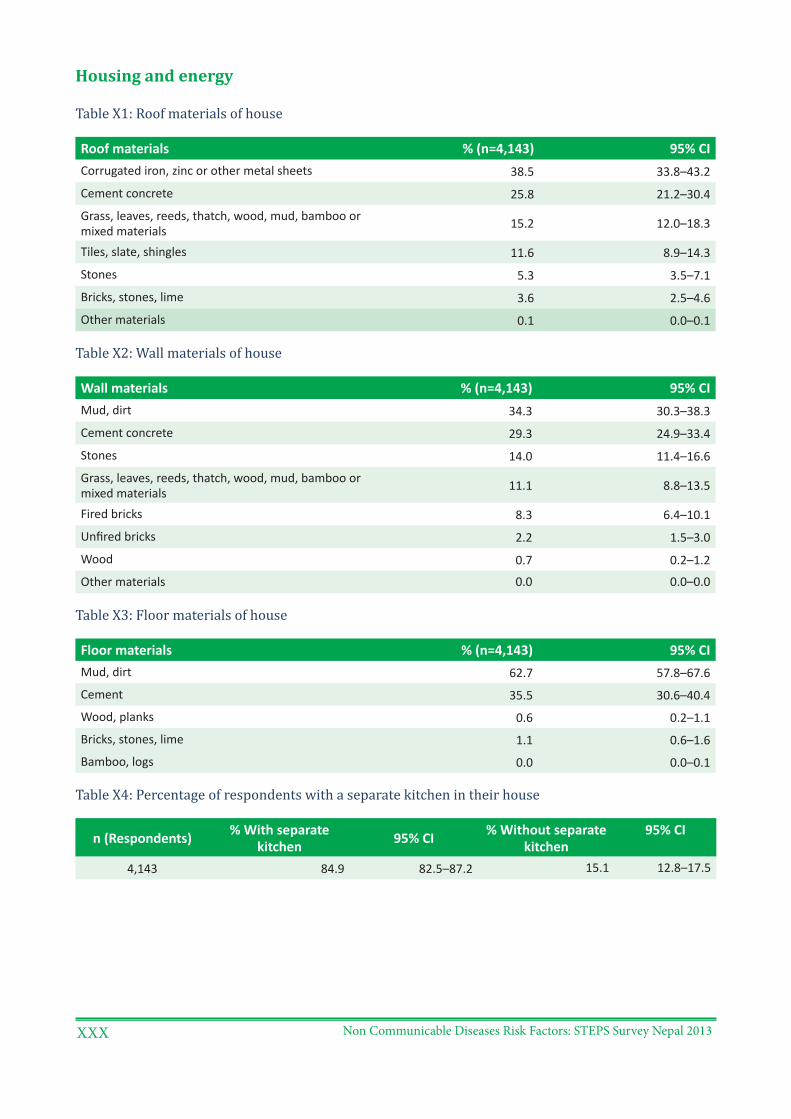
Non Communicable Diseases Risk Factors: STEPS Survey Nepal 2013XXX
Housing and energy
Table X1: Roof materials of house
Roof materials % (n=4,143) 95% CICorrugated iron, zinc or other metal sheets 38.5 33.8–43.2
Cement concrete 25.8 21.2–30.4
Grass, leaves, reeds, thatch, wood, mud, bamboo or mixed materials 15.2 12.0–18.3
Tiles, slate, shingles 11.6 8.9–14.3
Stones 5.3 3.5–7.1
Bricks, stones, lime 3.6 2.5–4.6
Other materials 0.1 0.0–0.1
Table X2: Wall materials of house
Wall materials % (n=4,143) 95% CIMud, dirt 34.3 30.3–38.3
Cement concrete 29.3 24.9–33.4
Stones 14.0 11.4–16.6
Grass, leaves, reeds, thatch, wood, mud, bamboo or mixed materials 11.1 8.8–13.5
Fired bricks 8.3 6.4–10.1
Unfired bricks 2.2 1.5–3.0
Wood 0.7 0.2–1.2
Other materials 0.0 0.0–0.0
Table X3: Floor materials of house
Floor materials % (n=4,143) 95% CIMud, dirt 62.7 57.8–67.6
Cement 35.5 30.6–40.4
Wood, planks 0.6 0.2–1.1
Bricks, stones, lime 1.1 0.6–1.6
Bamboo, logs 0.0 0.0–0.1
Table X4: Percentage of respondents with a separate kitchen in their house
n (Respondents) % With separate kitchen 95% CI % Without separate
kitchen95% CI
4,143 84.9 82.5–87.2 15.1 12.8–17.5
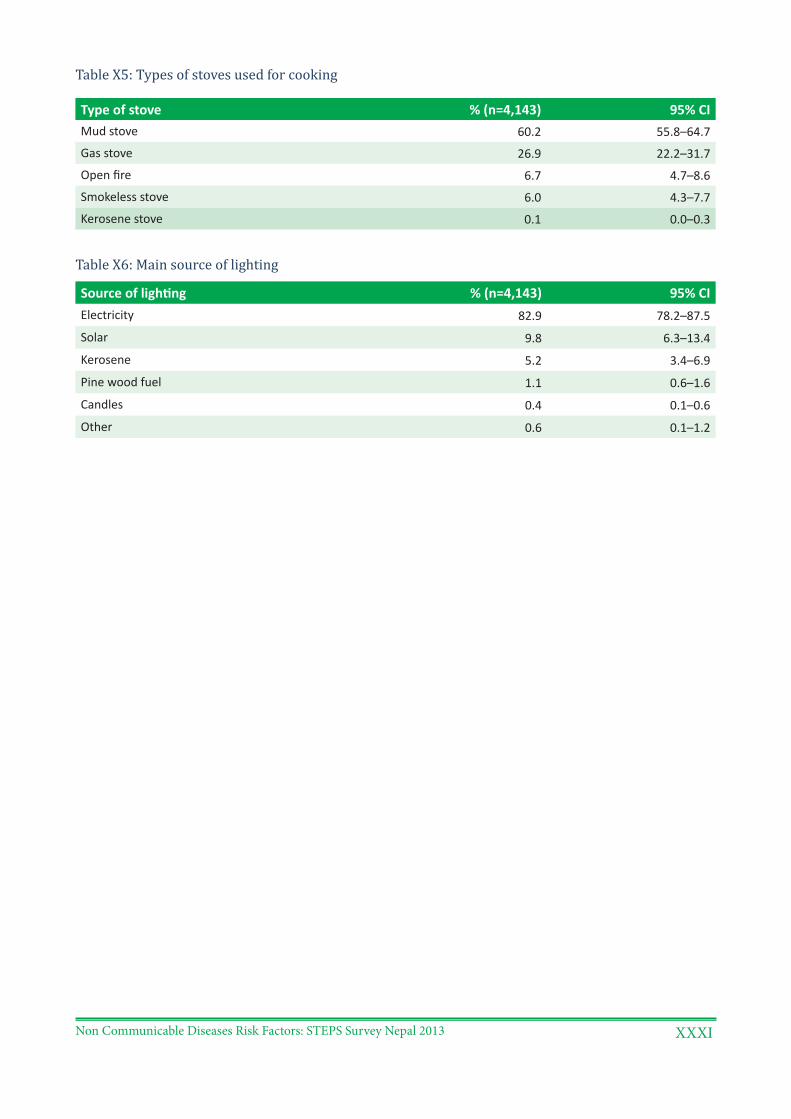
Non Communicable Diseases Risk Factors: STEPS Survey Nepal 2013 XXXI
Table X5: Types of stoves used for cooking
Type of stove % (n=4,143) 95% CIMud stove 60.2 55.8–64.7
Gas stove 26.9 22.2–31.7
Open fire 6.7 4.7–8.6
Smokeless stove 6.0 4.3–7.7
Kerosene stove 0.1 0.0–0.3
Table X6: Main source of lighting
Source of lighting % (n=4,143) 95% CIElectricity 82.9 78.2–87.5
Solar 9.8 6.3–13.4
Kerosene 5.2 3.4–6.9
Pine wood fuel 1.1 0.6–1.6
Candles 0.4 0.1–0.6
Other 0.6 0.1–1.2
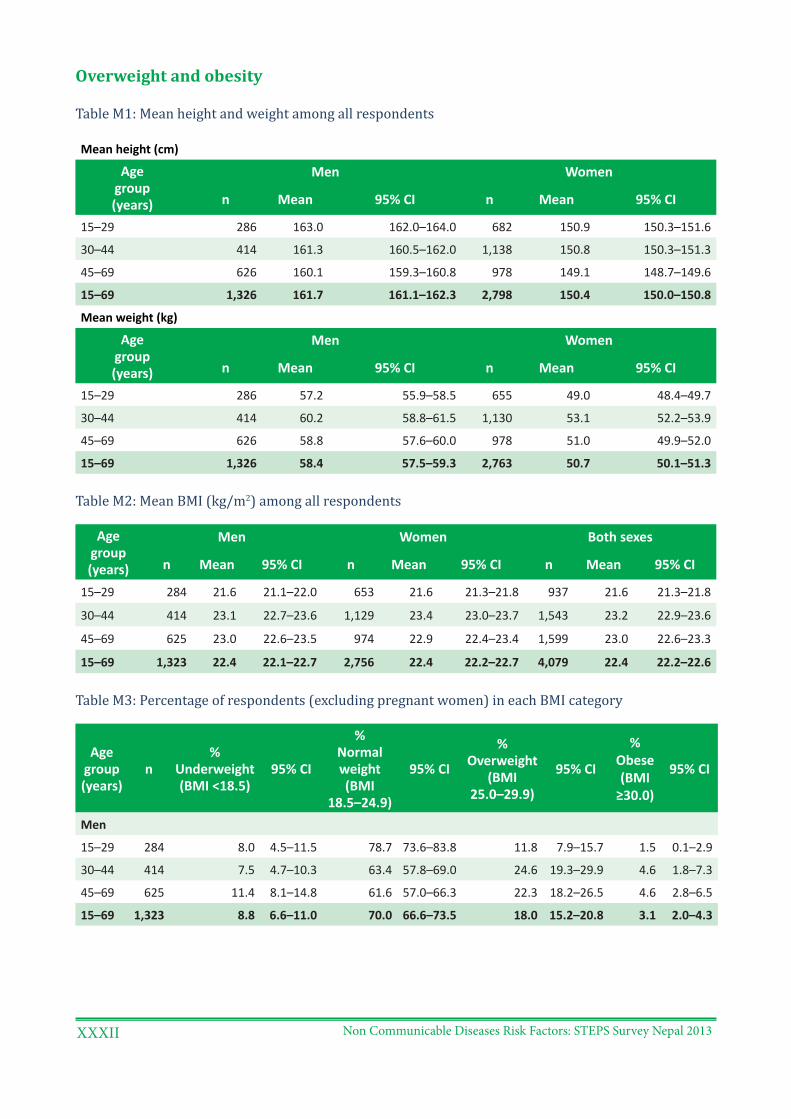
Non Communicable Diseases Risk Factors: STEPS Survey Nepal 2013XXXII
Overweight and obesity
Table M1: Mean height and weight among all respondents
Mean height (cm)
Age group (years)
Men Women
n Mean 95% CI n Mean 95% CI
15–29 286 163.0 162.0–164.0 682 150.9 150.3–151.6
30–44 414 161.3 160.5–162.0 1,138 150.8 150.3–151.3
45–69 626 160.1 159.3–160.8 978 149.1 148.7–149.6
15–69 1,326 161.7 161.1–162.3 2,798 150.4 150.0–150.8
Mean weight (kg)
Age group (years)
Men Women
n Mean 95% CI n Mean 95% CI
15–29 286 57.2 55.9–58.5 655 49.0 48.4–49.7
30–44 414 60.2 58.8–61.5 1,130 53.1 52.2–53.9
45–69 626 58.8 57.6–60.0 978 51.0 49.9–52.0
15–69 1,326 58.4 57.5–59.3 2,763 50.7 50.1–51.3
Table M2: Mean BMI (kg/m2) among all respondents
Age group (years)
Men Women Both sexes
n Mean 95% CI n Mean 95% CI n Mean 95% CI
15–29 284 21.6 21.1–22.0 653 21.6 21.3–21.8 937 21.6 21.3–21.8
30–44 414 23.1 22.7–23.6 1,129 23.4 23.0–23.7 1,543 23.2 22.9–23.6
45–69 625 23.0 22.6–23.5 974 22.9 22.4–23.4 1,599 23.0 22.6–23.3
15–69 1,323 22.4 22.1–22.7 2,756 22.4 22.2–22.7 4,079 22.4 22.2–22.6
Table M3: Percentage of respondents (excluding pregnant women) in each BMI category
Age group (years)
n%
Underweight (BMI <18.5)
95% CI
% Normal weight (BMI
18.5–24.9)
95% CI
% Overweight
(BMI 25.0–29.9)
95% CI
% Obese (BMI
≥30.0)
95% CI
Men
15–29 284 8.0 4.5–11.5 78.7 73.6–83.8 11.8 7.9–15.7 1.5 0.1–2.9
30–44 414 7.5 4.7–10.3 63.4 57.8–69.0 24.6 19.3–29.9 4.6 1.8–7.3
45–69 625 11.4 8.1–14.8 61.6 57.0–66.3 22.3 18.2–26.5 4.6 2.8–6.5
15–69 1,323 8.8 6.6–11.0 70.0 66.6–73.5 18.0 15.2–20.8 3.1 2.0–4.3
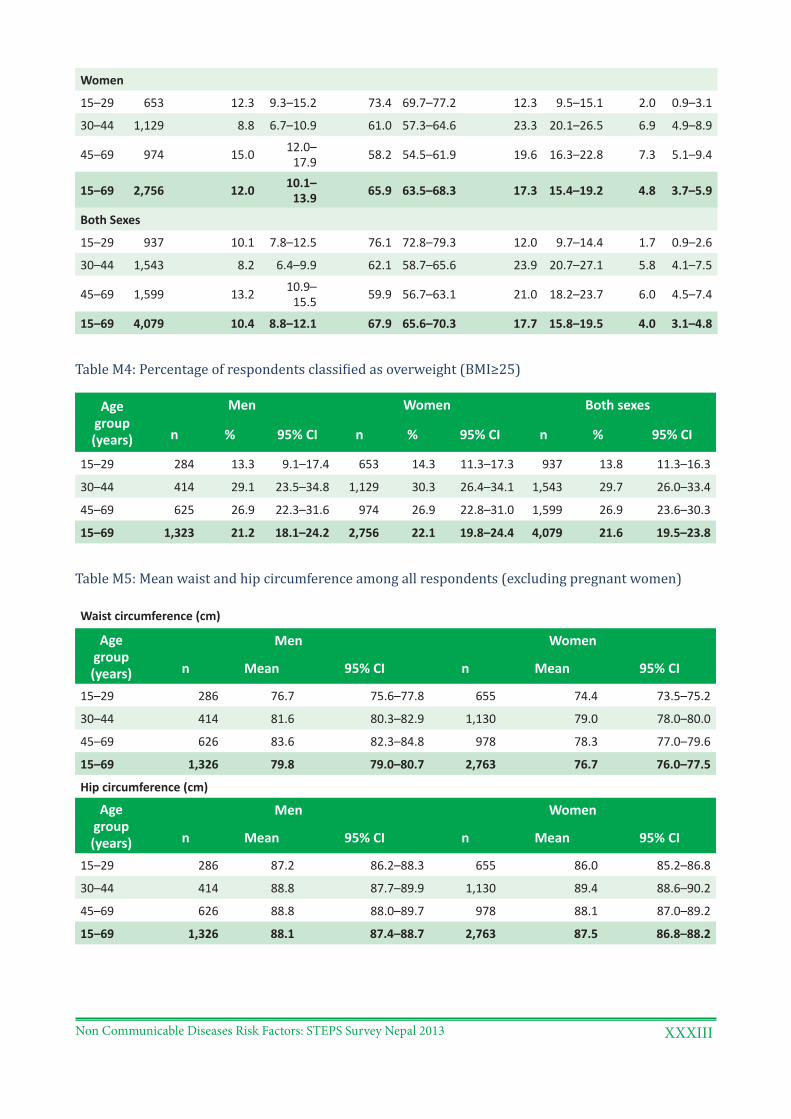
Non Communicable Diseases Risk Factors: STEPS Survey Nepal 2013 XXXIII
Women
15–29 653 12.3 9.3–15.2 73.4 69.7–77.2 12.3 9.5–15.1 2.0 0.9–3.1
30–44 1,129 8.8 6.7–10.9 61.0 57.3–64.6 23.3 20.1–26.5 6.9 4.9–8.9
45–69 974 15.0 12.0–17.9 58.2 54.5–61.9 19.6 16.3–22.8 7.3 5.1–9.4
15–69 2,756 12.0 10.1–13.9 65.9 63.5–68.3 17.3 15.4–19.2 4.8 3.7–5.9
Both Sexes
15–29 937 10.1 7.8–12.5 76.1 72.8–79.3 12.0 9.7–14.4 1.7 0.9–2.6
30–44 1,543 8.2 6.4–9.9 62.1 58.7–65.6 23.9 20.7–27.1 5.8 4.1–7.5
45–69 1,599 13.2 10.9–15.5 59.9 56.7–63.1 21.0 18.2–23.7 6.0 4.5–7.4
15–69 4,079 10.4 8.8–12.1 67.9 65.6–70.3 17.7 15.8–19.5 4.0 3.1–4.8
Table M4: Percentage of respondents classified as overweight (BMI≥25)
Age group (years)
Men Women Both sexes
n % 95% CI n % 95% CI n % 95% CI
15–29 284 13.3 9.1–17.4 653 14.3 11.3–17.3 937 13.8 11.3–16.3
30–44 414 29.1 23.5–34.8 1,129 30.3 26.4–34.1 1,543 29.7 26.0–33.4
45–69 625 26.9 22.3–31.6 974 26.9 22.8–31.0 1,599 26.9 23.6–30.3
15–69 1,323 21.2 18.1–24.2 2,756 22.1 19.8–24.4 4,079 21.6 19.5–23.8
Table M5: Mean waist and hip circumference among all respondents (excluding pregnant women)
Waist circumference (cm)
Age group (years)
Men Women
n Mean 95% CI n Mean 95% CI
15–29 286 76.7 75.6–77.8 655 74.4 73.5–75.2
30–44 414 81.6 80.3–82.9 1,130 79.0 78.0–80.0
45–69 626 83.6 82.3–84.8 978 78.3 77.0–79.6
15–69 1,326 79.8 79.0–80.7 2,763 76.7 76.0–77.5
Hip circumference (cm)
Age group (years)
Men Women
n Mean 95% CI n Mean 95% CI
15–29 286 87.2 86.2–88.3 655 86.0 85.2–86.8
30–44 414 88.8 87.7–89.9 1,130 89.4 88.6–90.2
45–69 626 88.8 88.0–89.7 978 88.1 87.0–89.2
15–69 1,326 88.1 87.4–88.7 2,763 87.5 86.8–88.2
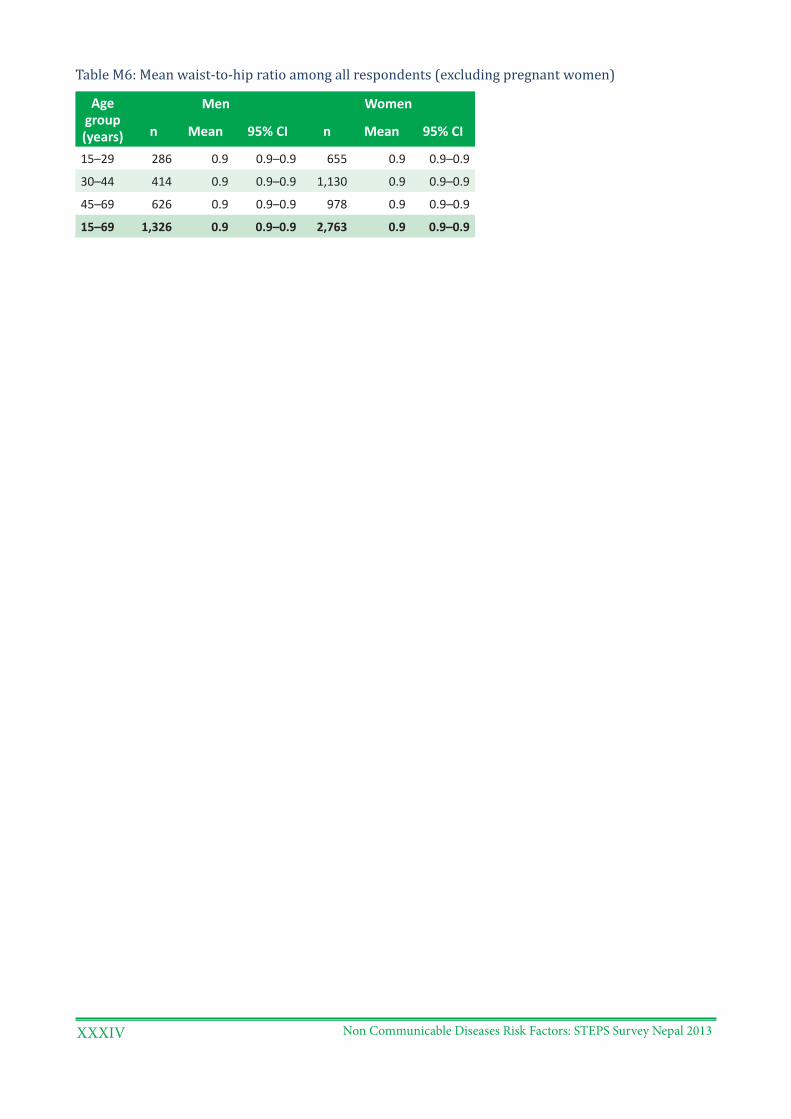
Non Communicable Diseases Risk Factors: STEPS Survey Nepal 2013XXXIV
Table M6: Mean waist-to-hip ratio among all respondents (excluding pregnant women)
Age group (years)
Men Women
n Mean 95% CI n Mean 95% CI
15–29 286 0.9 0.9–0.9 655 0.9 0.9–0.9
30–44 414 0.9 0.9–0.9 1,130 0.9 0.9–0.9
45–69 626 0.9 0.9–0.9 978 0.9 0.9–0.9
15–69 1,326 0.9 0.9–0.9 2,763 0.9 0.9–0.9
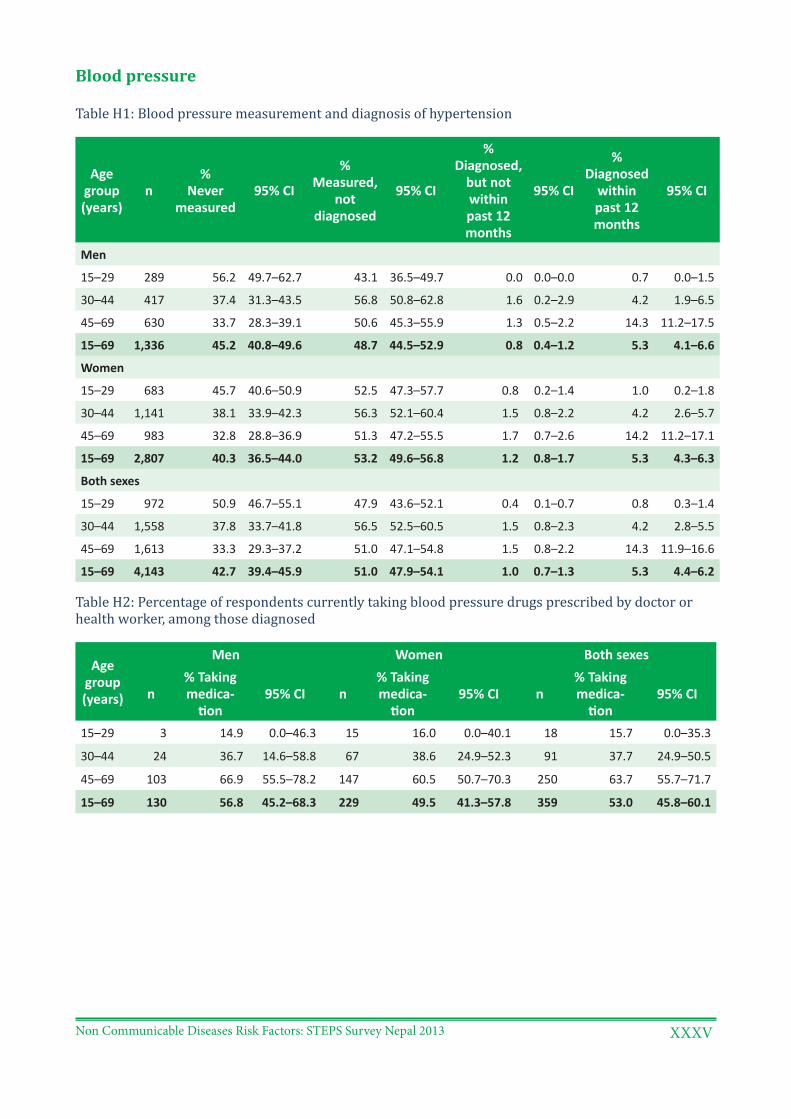
Non Communicable Diseases Risk Factors: STEPS Survey Nepal 2013 XXXV
Blood pressure
Table H1: Blood pressure measurement and diagnosis of hypertension
Age group (years)
n%
Never measured
95% CI
% Measured,
not diagnosed
95% CI
% Diagnosed,
but not within past 12 months
95% CI
% Diagnosed
within past 12 months
95% CI
Men
15–29 289 56.2 49.7–62.7 43.1 36.5–49.7 0.0 0.0–0.0 0.7 0.0–1.5
30–44 417 37.4 31.3–43.5 56.8 50.8–62.8 1.6 0.2–2.9 4.2 1.9–6.5
45–69 630 33.7 28.3–39.1 50.6 45.3–55.9 1.3 0.5–2.2 14.3 11.2–17.5
15–69 1,336 45.2 40.8–49.6 48.7 44.5–52.9 0.8 0.4–1.2 5.3 4.1–6.6
Women
15–29 683 45.7 40.6–50.9 52.5 47.3–57.7 0.8 0.2–1.4 1.0 0.2–1.8
30–44 1,141 38.1 33.9–42.3 56.3 52.1–60.4 1.5 0.8–2.2 4.2 2.6–5.7
45–69 983 32.8 28.8–36.9 51.3 47.2–55.5 1.7 0.7–2.6 14.2 11.2–17.1
15–69 2,807 40.3 36.5–44.0 53.2 49.6–56.8 1.2 0.8–1.7 5.3 4.3–6.3
Both sexes
15–29 972 50.9 46.7–55.1 47.9 43.6–52.1 0.4 0.1–0.7 0.8 0.3–1.4
30–44 1,558 37.8 33.7–41.8 56.5 52.5–60.5 1.5 0.8–2.3 4.2 2.8–5.5
45–69 1,613 33.3 29.3–37.2 51.0 47.1–54.8 1.5 0.8–2.2 14.3 11.9–16.6
15–69 4,143 42.7 39.4–45.9 51.0 47.9–54.1 1.0 0.7–1.3 5.3 4.4–6.2
Table H2: Percentage of respondents currently taking blood pressure drugs prescribed by doctor or health worker, among those diagnosed
Age group (years)
Men Women Both sexes
n% Taking medica-
tion95% CI n
% Taking medica-
tion95% CI n
% Taking medica-
tion95% CI
15–29 3 14.9 0.0–46.3 15 16.0 0.0–40.1 18 15.7 0.0–35.3
30–44 24 36.7 14.6–58.8 67 38.6 24.9–52.3 91 37.7 24.9–50.5
45–69 103 66.9 55.5–78.2 147 60.5 50.7–70.3 250 63.7 55.7–71.7
15–69 130 56.8 45.2–68.3 229 49.5 41.3–57.8 359 53.0 45.8–60.1
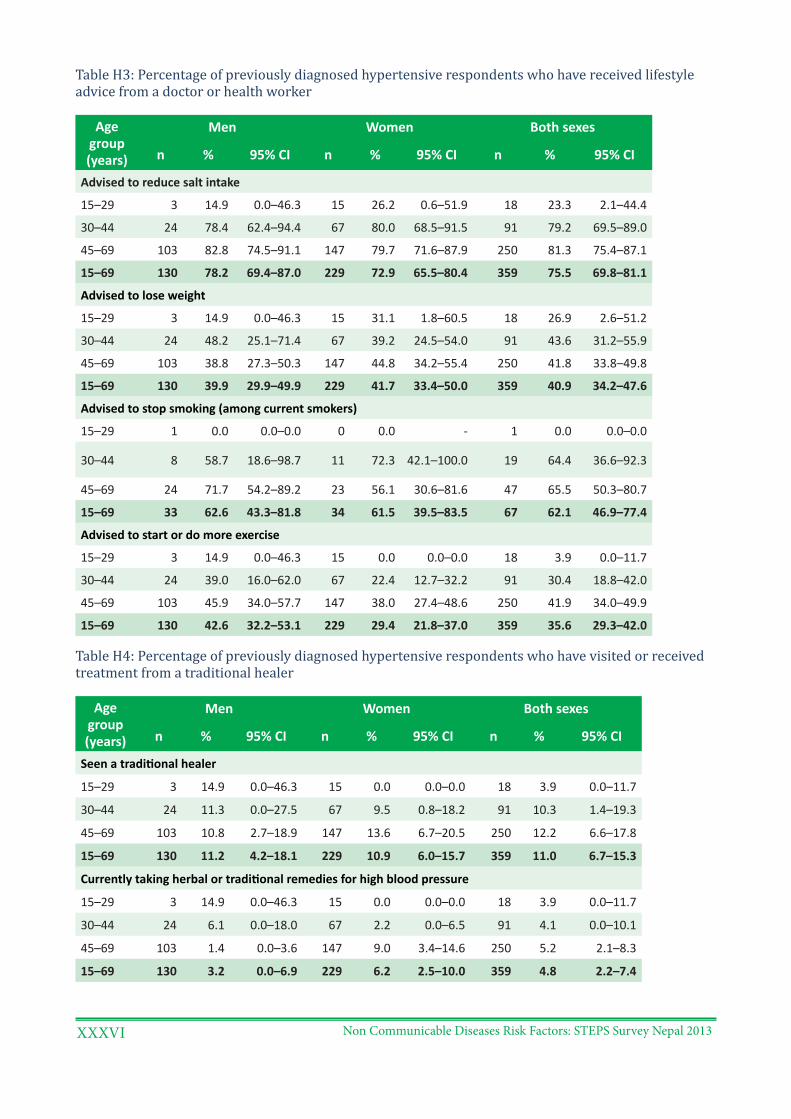
Non Communicable Diseases Risk Factors: STEPS Survey Nepal 2013XXXVI
Table H3: Percentage of previously diagnosed hypertensive respondents who have received lifestyle advice from a doctor or health worker
Age group (years)
Men Women Both sexes
n % 95% CI n % 95% CI n % 95% CI
Advised to reduce salt intake
15–29 3 14.9 0.0–46.3 15 26.2 0.6–51.9 18 23.3 2.1–44.4
30–44 24 78.4 62.4–94.4 67 80.0 68.5–91.5 91 79.2 69.5–89.0
45–69 103 82.8 74.5–91.1 147 79.7 71.6–87.9 250 81.3 75.4–87.1
15–69 130 78.2 69.4–87.0 229 72.9 65.5–80.4 359 75.5 69.8–81.1
Advised to lose weight
15–29 3 14.9 0.0–46.3 15 31.1 1.8–60.5 18 26.9 2.6–51.2
30–44 24 48.2 25.1–71.4 67 39.2 24.5–54.0 91 43.6 31.2–55.9
45–69 103 38.8 27.3–50.3 147 44.8 34.2–55.4 250 41.8 33.8–49.8
15–69 130 39.9 29.9–49.9 229 41.7 33.4–50.0 359 40.9 34.2–47.6
Advised to stop smoking (among current smokers)
15–29 1 0.0 0.0–0.0 0 0.0 - 1 0.0 0.0–0.0
30–44 8 58.7 18.6–98.7 11 72.3 42.1–100.0 19 64.4 36.6–92.3
45–69 24 71.7 54.2–89.2 23 56.1 30.6–81.6 47 65.5 50.3–80.7
15–69 33 62.6 43.3–81.8 34 61.5 39.5–83.5 67 62.1 46.9–77.4
Advised to start or do more exercise
15–29 3 14.9 0.0–46.3 15 0.0 0.0–0.0 18 3.9 0.0–11.7
30–44 24 39.0 16.0–62.0 67 22.4 12.7–32.2 91 30.4 18.8–42.0
45–69 103 45.9 34.0–57.7 147 38.0 27.4–48.6 250 41.9 34.0–49.9
15–69 130 42.6 32.2–53.1 229 29.4 21.8–37.0 359 35.6 29.3–42.0
Table H4: Percentage of previously diagnosed hypertensive respondents who have visited or received treatment from a traditional healer
Age group (years)
Men Women Both sexes
n % 95% CI n % 95% CI n % 95% CI
Seen a traditional healer
15–29 3 14.9 0.0–46.3 15 0.0 0.0–0.0 18 3.9 0.0–11.7
30–44 24 11.3 0.0–27.5 67 9.5 0.8–18.2 91 10.3 1.4–19.3
45–69 103 10.8 2.7–18.9 147 13.6 6.7–20.5 250 12.2 6.6–17.8
15–69 130 11.2 4.2–18.1 229 10.9 6.0–15.7 359 11.0 6.7–15.3
Currently taking herbal or traditional remedies for high blood pressure
15–29 3 14.9 0.0–46.3 15 0.0 0.0–0.0 18 3.9 0.0–11.7
30–44 24 6.1 0.0–18.0 67 2.2 0.0–6.5 91 4.1 0.0–10.1
45–69 103 1.4 0.0–3.6 147 9.0 3.4–14.6 250 5.2 2.1–8.3
15–69 130 3.2 0.0–6.9 229 6.2 2.5–10.0 359 4.8 2.2–7.4
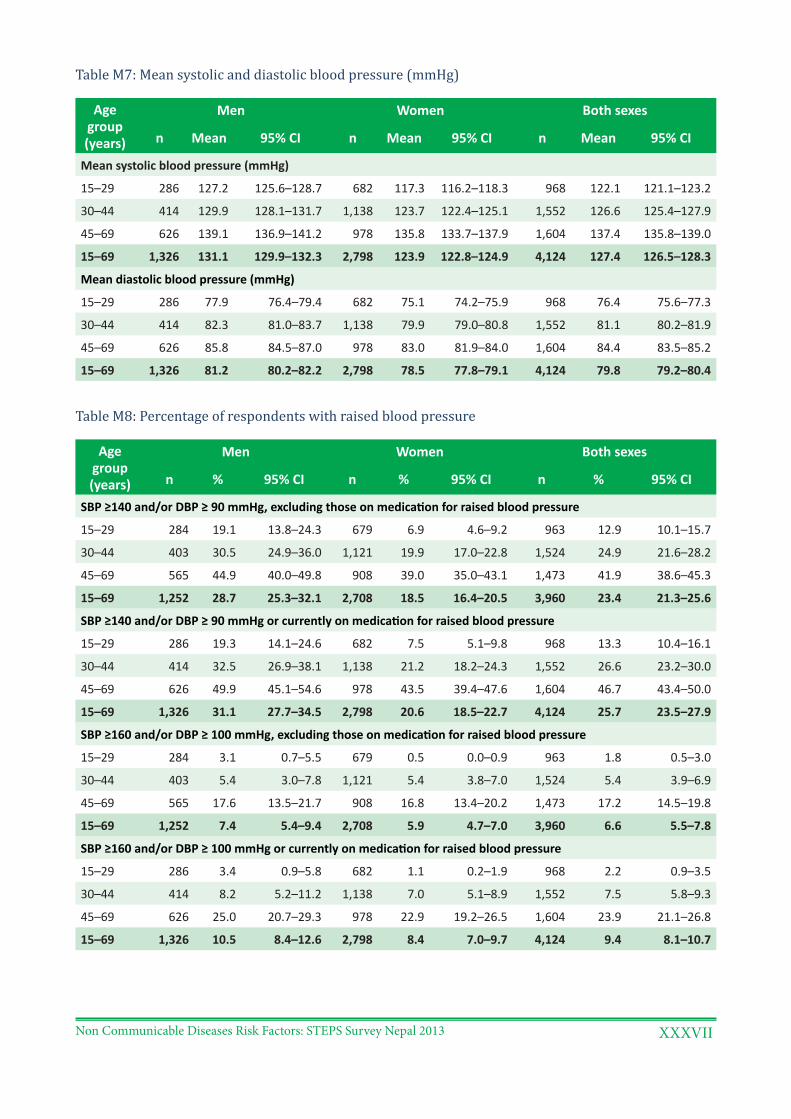
Non Communicable Diseases Risk Factors: STEPS Survey Nepal 2013 XXXVII
Table M7: Mean systolic and diastolic blood pressure (mmHg)
Age group (years)
Men Women Both sexes
n Mean 95% CI n Mean 95% CI n Mean 95% CI
Mean systolic blood pressure (mmHg)
15–29 286 127.2 125.6–128.7 682 117.3 116.2–118.3 968 122.1 121.1–123.2
30–44 414 129.9 128.1–131.7 1,138 123.7 122.4–125.1 1,552 126.6 125.4–127.9
45–69 626 139.1 136.9–141.2 978 135.8 133.7–137.9 1,604 137.4 135.8–139.0
15–69 1,326 131.1 129.9–132.3 2,798 123.9 122.8–124.9 4,124 127.4 126.5–128.3
Mean diastolic blood pressure (mmHg)
15–29 286 77.9 76.4–79.4 682 75.1 74.2–75.9 968 76.4 75.6–77.3
30–44 414 82.3 81.0–83.7 1,138 79.9 79.0–80.8 1,552 81.1 80.2–81.9
45–69 626 85.8 84.5–87.0 978 83.0 81.9–84.0 1,604 84.4 83.5–85.2
15–69 1,326 81.2 80.2–82.2 2,798 78.5 77.8–79.1 4,124 79.8 79.2–80.4
Table M8: Percentage of respondents with raised blood pressure
Age group (years)
Men Women Both sexes
n % 95% CI n % 95% CI n % 95% CI
SBP ≥140 and/or DBP ≥ 90 mmHg, excluding those on medication for raised blood pressure
15–29 284 19.1 13.8–24.3 679 6.9 4.6–9.2 963 12.9 10.1–15.7
30–44 403 30.5 24.9–36.0 1,121 19.9 17.0–22.8 1,524 24.9 21.6–28.2
45–69 565 44.9 40.0–49.8 908 39.0 35.0–43.1 1,473 41.9 38.6–45.3
15–69 1,252 28.7 25.3–32.1 2,708 18.5 16.4–20.5 3,960 23.4 21.3–25.6
SBP ≥140 and/or DBP ≥ 90 mmHg or currently on medication for raised blood pressure
15–29 286 19.3 14.1–24.6 682 7.5 5.1–9.8 968 13.3 10.4–16.1
30–44 414 32.5 26.9–38.1 1,138 21.2 18.2–24.3 1,552 26.6 23.2–30.0
45–69 626 49.9 45.1–54.6 978 43.5 39.4–47.6 1,604 46.7 43.4–50.0
15–69 1,326 31.1 27.7–34.5 2,798 20.6 18.5–22.7 4,124 25.7 23.5–27.9
SBP ≥160 and/or DBP ≥ 100 mmHg, excluding those on medication for raised blood pressure
15–29 284 3.1 0.7–5.5 679 0.5 0.0–0.9 963 1.8 0.5–3.0
30–44 403 5.4 3.0–7.8 1,121 5.4 3.8–7.0 1,524 5.4 3.9–6.9
45–69 565 17.6 13.5–21.7 908 16.8 13.4–20.2 1,473 17.2 14.5–19.8
15–69 1,252 7.4 5.4–9.4 2,708 5.9 4.7–7.0 3,960 6.6 5.5–7.8
SBP ≥160 and/or DBP ≥ 100 mmHg or currently on medication for raised blood pressure
15–29 286 3.4 0.9–5.8 682 1.1 0.2–1.9 968 2.2 0.9–3.5
30–44 414 8.2 5.2–11.2 1,138 7.0 5.1–8.9 1,552 7.5 5.8–9.3
45–69 626 25.0 20.7–29.3 978 22.9 19.2–26.5 1,604 23.9 21.1–26.8
15–69 1,326 10.5 8.4–12.6 2,798 8.4 7.0–9.7 4,124 9.4 8.1–10.7
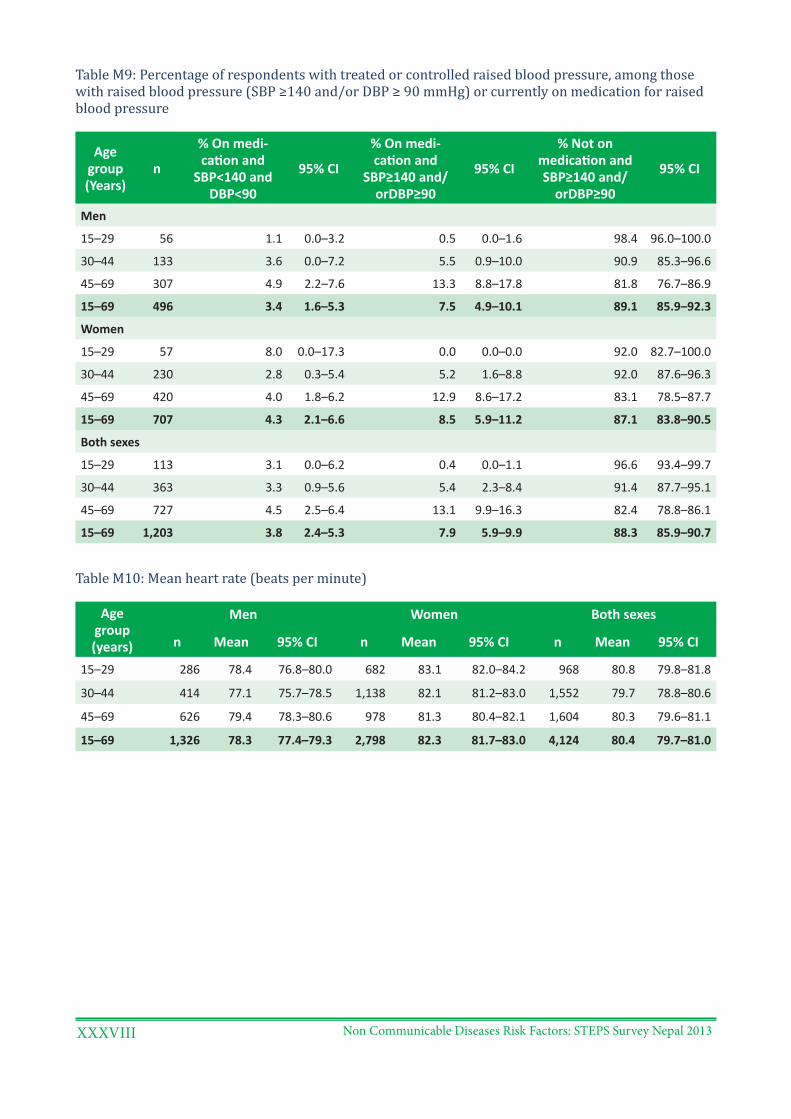
Non Communicable Diseases Risk Factors: STEPS Survey Nepal 2013XXXVIII
Table M9: Percentage of respondents with treated or controlled raised blood pressure, among those with raised blood pressure (SBP ≥140 and/or DBP ≥ 90 mmHg) or currently on medication for raised blood pressure
Age group (Years)
n
% On medi-cation and
SBP<140 and DBP<90
95% CI
% On medi-cation and
SBP≥140 and/orDBP≥90
95% CI
% Not on medication and SBP≥140 and/
orDBP≥90
95% CI
Men
15–29 56 1.1 0.0–3.2 0.5 0.0–1.6 98.4 96.0–100.0
30–44 133 3.6 0.0–7.2 5.5 0.9–10.0 90.9 85.3–96.6
45–69 307 4.9 2.2–7.6 13.3 8.8–17.8 81.8 76.7–86.9
15–69 496 3.4 1.6–5.3 7.5 4.9–10.1 89.1 85.9–92.3
Women
15–29 57 8.0 0.0–17.3 0.0 0.0–0.0 92.0 82.7–100.0
30–44 230 2.8 0.3–5.4 5.2 1.6–8.8 92.0 87.6–96.3
45–69 420 4.0 1.8–6.2 12.9 8.6–17.2 83.1 78.5–87.7
15–69 707 4.3 2.1–6.6 8.5 5.9–11.2 87.1 83.8–90.5
Both sexes
15–29 113 3.1 0.0–6.2 0.4 0.0–1.1 96.6 93.4–99.7
30–44 363 3.3 0.9–5.6 5.4 2.3–8.4 91.4 87.7–95.1
45–69 727 4.5 2.5–6.4 13.1 9.9–16.3 82.4 78.8–86.1
15–69 1,203 3.8 2.4–5.3 7.9 5.9–9.9 88.3 85.9–90.7
Table M10: Mean heart rate (beats per minute)
Age group (years)
Men Women Both sexes
n Mean 95% CI n Mean 95% CI n Mean 95% CI
15–29 286 78.4 76.8–80.0 682 83.1 82.0–84.2 968 80.8 79.8–81.8
30–44 414 77.1 75.7–78.5 1,138 82.1 81.2–83.0 1,552 79.7 78.8–80.6
45–69 626 79.4 78.3–80.6 978 81.3 80.4–82.1 1,604 80.3 79.6–81.1
15–69 1,326 78.3 77.4–79.3 2,798 82.3 81.7–83.0 4,124 80.4 79.7–81.0
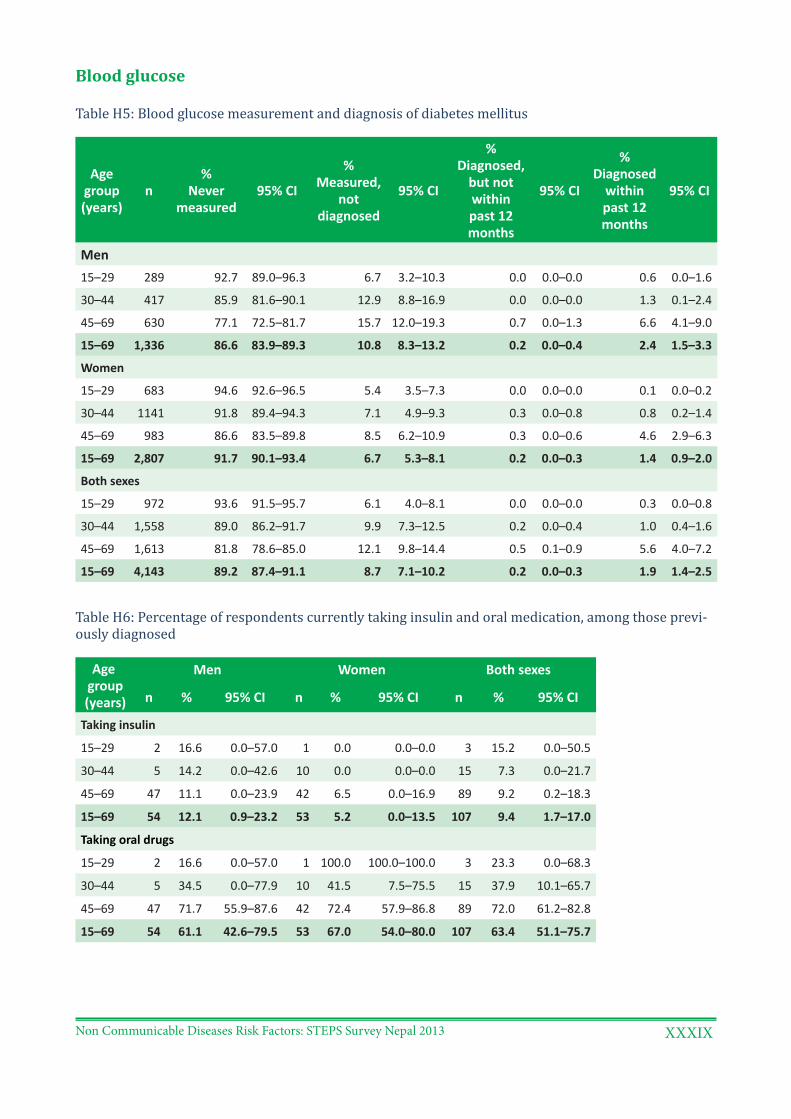
Non Communicable Diseases Risk Factors: STEPS Survey Nepal 2013 XXXIX
Blood glucose
Table H5: Blood glucose measurement and diagnosis of diabetes mellitus
Age group (years)
n%
Never measured
95% CI
% Measured,
not diagnosed
95% CI
% Diagnosed,
but not within past 12 months
95% CI
% Diagnosed
within past 12 months
95% CI
Men15–29 289 92.7 89.0–96.3 6.7 3.2–10.3 0.0 0.0–0.0 0.6 0.0–1.6
30–44 417 85.9 81.6–90.1 12.9 8.8–16.9 0.0 0.0–0.0 1.3 0.1–2.4
45–69 630 77.1 72.5–81.7 15.7 12.0–19.3 0.7 0.0–1.3 6.6 4.1–9.0
15–69 1,336 86.6 83.9–89.3 10.8 8.3–13.2 0.2 0.0–0.4 2.4 1.5–3.3
Women
15–29 683 94.6 92.6–96.5 5.4 3.5–7.3 0.0 0.0–0.0 0.1 0.0–0.2
30–44 1141 91.8 89.4–94.3 7.1 4.9–9.3 0.3 0.0–0.8 0.8 0.2–1.4
45–69 983 86.6 83.5–89.8 8.5 6.2–10.9 0.3 0.0–0.6 4.6 2.9–6.3
15–69 2,807 91.7 90.1–93.4 6.7 5.3–8.1 0.2 0.0–0.3 1.4 0.9–2.0
Both sexes
15–29 972 93.6 91.5–95.7 6.1 4.0–8.1 0.0 0.0–0.0 0.3 0.0–0.8
30–44 1,558 89.0 86.2–91.7 9.9 7.3–12.5 0.2 0.0–0.4 1.0 0.4–1.6
45–69 1,613 81.8 78.6–85.0 12.1 9.8–14.4 0.5 0.1–0.9 5.6 4.0–7.2
15–69 4,143 89.2 87.4–91.1 8.7 7.1–10.2 0.2 0.0–0.3 1.9 1.4–2.5
Table H6: Percentage of respondents currently taking insulin and oral medication, among those previ-ously diagnosed
Age group (years)
Men Women Both sexes
n % 95% CI n % 95% CI n % 95% CI
Taking insulin
15–29 2 16.6 0.0–57.0 1 0.0 0.0–0.0 3 15.2 0.0–50.5
30–44 5 14.2 0.0–42.6 10 0.0 0.0–0.0 15 7.3 0.0–21.7
45–69 47 11.1 0.0–23.9 42 6.5 0.0–16.9 89 9.2 0.2–18.3
15–69 54 12.1 0.9–23.2 53 5.2 0.0–13.5 107 9.4 1.7–17.0
Taking oral drugs
15–29 2 16.6 0.0–57.0 1 100.0 100.0–100.0 3 23.3 0.0–68.3
30–44 5 34.5 0.0–77.9 10 41.5 7.5–75.5 15 37.9 10.1–65.7
45–69 47 71.7 55.9–87.6 42 72.4 57.9–86.8 89 72.0 61.2–82.8
15–69 54 61.1 42.6–79.5 53 67.0 54.0–80.0 107 63.4 51.1–75.7
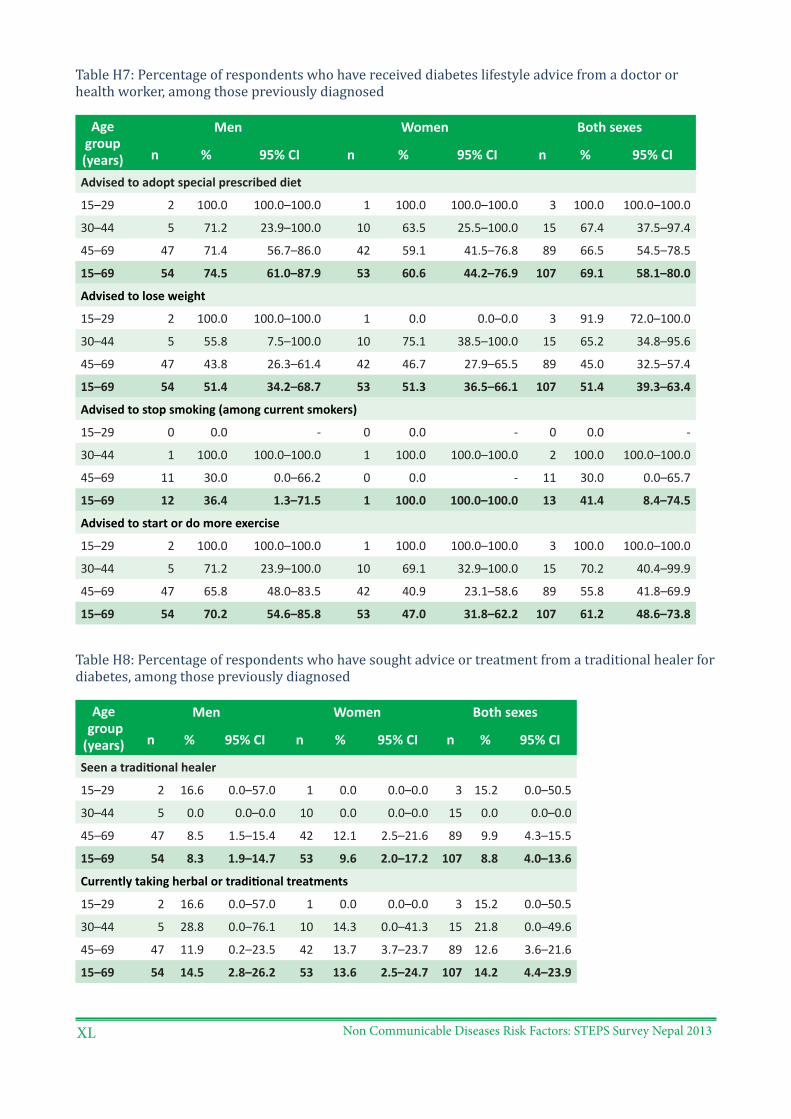
Non Communicable Diseases Risk Factors: STEPS Survey Nepal 2013XL
Table H7: Percentage of respondents who have received diabetes lifestyle advice from a doctor or health worker, among those previously diagnosed
Age group (years)
Men Women Both sexes
n % 95% CI n % 95% CI n % 95% CI
Advised to adopt special prescribed diet
15–29 2 100.0 100.0–100.0 1 100.0 100.0–100.0 3 100.0 100.0–100.0
30–44 5 71.2 23.9–100.0 10 63.5 25.5–100.0 15 67.4 37.5–97.4
45–69 47 71.4 56.7–86.0 42 59.1 41.5–76.8 89 66.5 54.5–78.5
15–69 54 74.5 61.0–87.9 53 60.6 44.2–76.9 107 69.1 58.1–80.0
Advised to lose weight
15–29 2 100.0 100.0–100.0 1 0.0 0.0–0.0 3 91.9 72.0–100.0
30–44 5 55.8 7.5–100.0 10 75.1 38.5–100.0 15 65.2 34.8–95.6
45–69 47 43.8 26.3–61.4 42 46.7 27.9–65.5 89 45.0 32.5–57.4
15–69 54 51.4 34.2–68.7 53 51.3 36.5–66.1 107 51.4 39.3–63.4
Advised to stop smoking (among current smokers)
15–29 0 0.0 - 0 0.0 - 0 0.0 -
30–44 1 100.0 100.0–100.0 1 100.0 100.0–100.0 2 100.0 100.0–100.0
45–69 11 30.0 0.0–66.2 0 0.0 - 11 30.0 0.0–65.7
15–69 12 36.4 1.3–71.5 1 100.0 100.0–100.0 13 41.4 8.4–74.5
Advised to start or do more exercise
15–29 2 100.0 100.0–100.0 1 100.0 100.0–100.0 3 100.0 100.0–100.0
30–44 5 71.2 23.9–100.0 10 69.1 32.9–100.0 15 70.2 40.4–99.9
45–69 47 65.8 48.0–83.5 42 40.9 23.1–58.6 89 55.8 41.8–69.9
15–69 54 70.2 54.6–85.8 53 47.0 31.8–62.2 107 61.2 48.6–73.8
Table H8: Percentage of respondents who have sought advice or treatment from a traditional healer for diabetes, among those previously diagnosed
Age group (years)
Men Women Both sexes
n % 95% CI n % 95% CI n % 95% CI
Seen a traditional healer
15–29 2 16.6 0.0–57.0 1 0.0 0.0–0.0 3 15.2 0.0–50.5
30–44 5 0.0 0.0–0.0 10 0.0 0.0–0.0 15 0.0 0.0–0.0
45–69 47 8.5 1.5–15.4 42 12.1 2.5–21.6 89 9.9 4.3–15.5
15–69 54 8.3 1.9–14.7 53 9.6 2.0–17.2 107 8.8 4.0–13.6
Currently taking herbal or traditional treatments
15–29 2 16.6 0.0–57.0 1 0.0 0.0–0.0 3 15.2 0.0–50.5
30–44 5 28.8 0.0–76.1 10 14.3 0.0–41.3 15 21.8 0.0–49.6
45–69 47 11.9 0.2–23.5 42 13.7 3.7–23.7 89 12.6 3.6–21.6
15–69 54 14.5 2.8–26.2 53 13.6 2.5–24.7 107 14.2 4.4–23.9
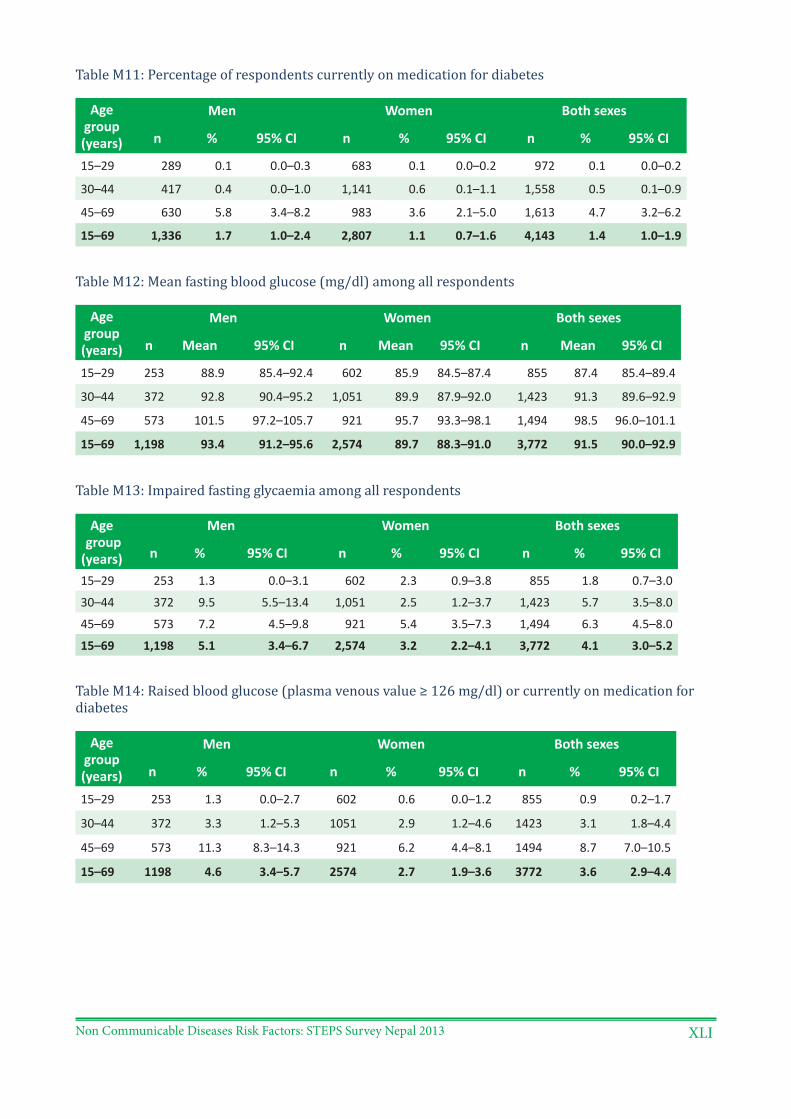
Non Communicable Diseases Risk Factors: STEPS Survey Nepal 2013 XLI
Table M11: Percentage of respondents currently on medication for diabetes
Age group (years)
Men Women Both sexes
n % 95% CI n % 95% CI n % 95% CI
15–29 289 0.1 0.0–0.3 683 0.1 0.0–0.2 972 0.1 0.0–0.2
30–44 417 0.4 0.0–1.0 1,141 0.6 0.1–1.1 1,558 0.5 0.1–0.9
45–69 630 5.8 3.4–8.2 983 3.6 2.1–5.0 1,613 4.7 3.2–6.2
15–69 1,336 1.7 1.0–2.4 2,807 1.1 0.7–1.6 4,143 1.4 1.0–1.9
Table M12: Mean fasting blood glucose (mg/dl) among all respondents
Age group (years)
Men Women Both sexes
n Mean 95% CI n Mean 95% CI n Mean 95% CI
15–29 253 88.9 85.4–92.4 602 85.9 84.5–87.4 855 87.4 85.4–89.4
30–44 372 92.8 90.4–95.2 1,051 89.9 87.9–92.0 1,423 91.3 89.6–92.9
45–69 573 101.5 97.2–105.7 921 95.7 93.3–98.1 1,494 98.5 96.0–101.1
15–69 1,198 93.4 91.2–95.6 2,574 89.7 88.3–91.0 3,772 91.5 90.0–92.9
Table M13: Impaired fasting glycaemia among all respondents
Age group (years)
Men Women Both sexes
n % 95% CI n % 95% CI n % 95% CI
15–29 253 1.3 0.0–3.1 602 2.3 0.9–3.8 855 1.8 0.7–3.0
30–44 372 9.5 5.5–13.4 1,051 2.5 1.2–3.7 1,423 5.7 3.5–8.0
45–69 573 7.2 4.5–9.8 921 5.4 3.5–7.3 1,494 6.3 4.5–8.0
15–69 1,198 5.1 3.4–6.7 2,574 3.2 2.2–4.1 3,772 4.1 3.0–5.2
Table M14: Raised blood glucose (plasma venous value ≥ 126 mg/dl) or currently on medication for diabetes
Age group (years)
Men Women Both sexes
n % 95% CI n % 95% CI n % 95% CI
15–29 253 1.3 0.0–2.7 602 0.6 0.0–1.2 855 0.9 0.2–1.7
30–44 372 3.3 1.2–5.3 1051 2.9 1.2–4.6 1423 3.1 1.8–4.4
45–69 573 11.3 8.3–14.3 921 6.2 4.4–8.1 1494 8.7 7.0–10.5
15–69 1198 4.6 3.4–5.7 2574 2.7 1.9–3.6 3772 3.6 2.9–4.4
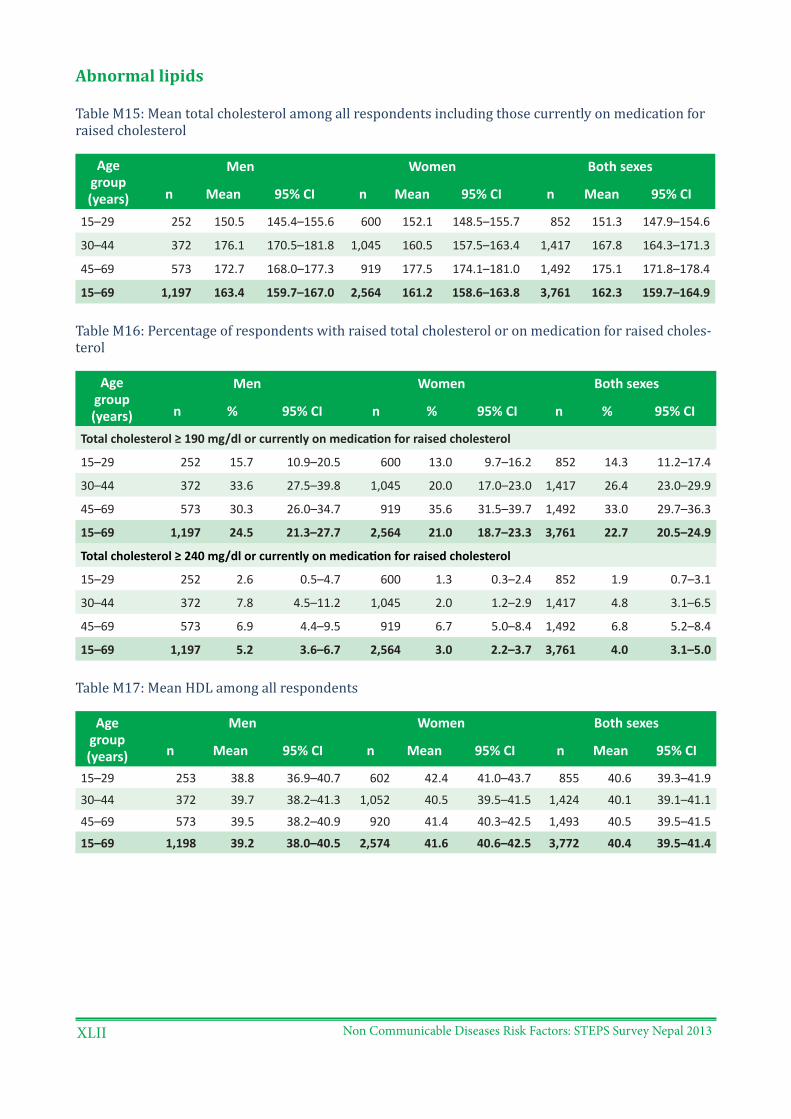
Non Communicable Diseases Risk Factors: STEPS Survey Nepal 2013XLII
Abnormal lipids
Table M15: Mean total cholesterol among all respondents including those currently on medication for raised cholesterol
Age group (years)
Men Women Both sexes
n Mean 95% CI n Mean 95% CI n Mean 95% CI
15–29 252 150.5 145.4–155.6 600 152.1 148.5–155.7 852 151.3 147.9–154.6
30–44 372 176.1 170.5–181.8 1,045 160.5 157.5–163.4 1,417 167.8 164.3–171.3
45–69 573 172.7 168.0–177.3 919 177.5 174.1–181.0 1,492 175.1 171.8–178.4
15–69 1,197 163.4 159.7–167.0 2,564 161.2 158.6–163.8 3,761 162.3 159.7–164.9
Table M16: Percentage of respondents with raised total cholesterol or on medication for raised choles-terol
Age group (years)
Men Women Both sexes
n % 95% CI n % 95% CI n % 95% CI
Total cholesterol ≥ 190 mg/dl or currently on medication for raised cholesterol
15–29 252 15.7 10.9–20.5 600 13.0 9.7–16.2 852 14.3 11.2–17.4
30–44 372 33.6 27.5–39.8 1,045 20.0 17.0–23.0 1,417 26.4 23.0–29.9
45–69 573 30.3 26.0–34.7 919 35.6 31.5–39.7 1,492 33.0 29.7–36.3
15–69 1,197 24.5 21.3–27.7 2,564 21.0 18.7–23.3 3,761 22.7 20.5–24.9
Total cholesterol ≥ 240 mg/dl or currently on medication for raised cholesterol
15–29 252 2.6 0.5–4.7 600 1.3 0.3–2.4 852 1.9 0.7–3.1
30–44 372 7.8 4.5–11.2 1,045 2.0 1.2–2.9 1,417 4.8 3.1–6.5
45–69 573 6.9 4.4–9.5 919 6.7 5.0–8.4 1,492 6.8 5.2–8.4
15–69 1,197 5.2 3.6–6.7 2,564 3.0 2.2–3.7 3,761 4.0 3.1–5.0
Table M17: Mean HDL among all respondents
Age group (years)
Men Women Both sexes
n Mean 95% CI n Mean 95% CI n Mean 95% CI
15–29 253 38.8 36.9–40.7 602 42.4 41.0–43.7 855 40.6 39.3–41.9
30–44 372 39.7 38.2–41.3 1,052 40.5 39.5–41.5 1,424 40.1 39.1–41.1
45–69 573 39.5 38.2–40.9 920 41.4 40.3–42.5 1,493 40.5 39.5–41.5
15–69 1,198 39.2 38.0–40.5 2,574 41.6 40.6–42.5 3,772 40.4 39.5–41.4
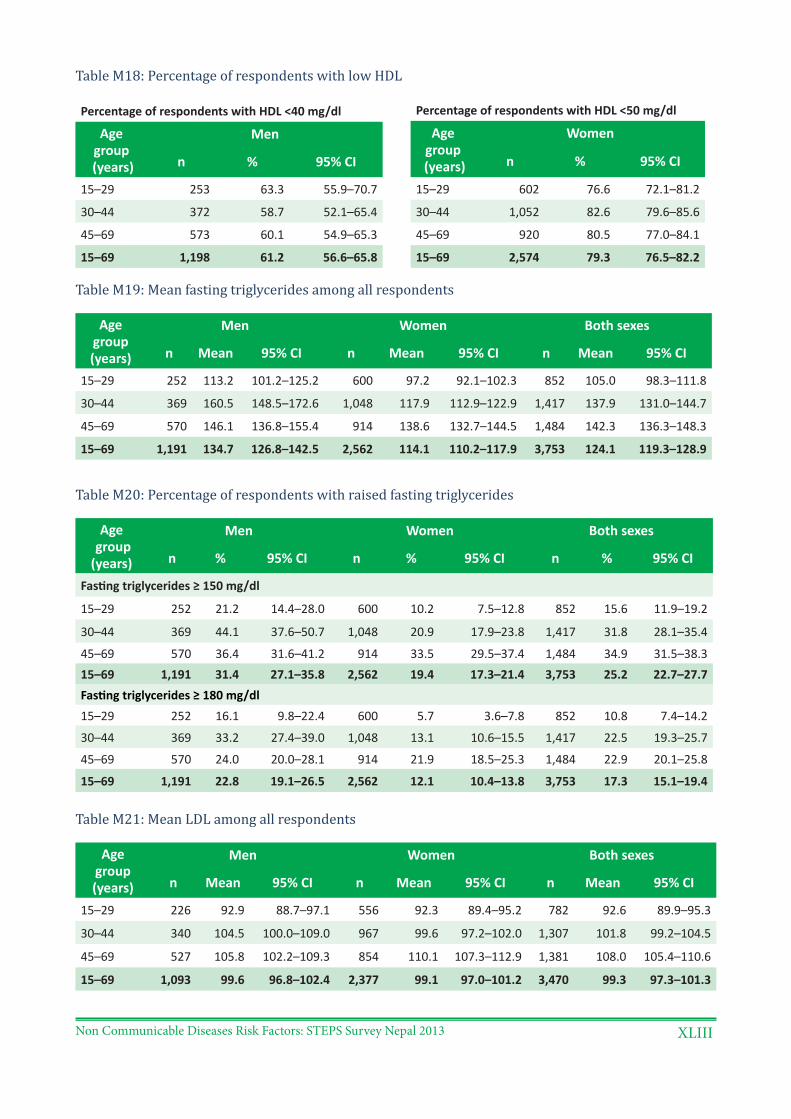
Non Communicable Diseases Risk Factors: STEPS Survey Nepal 2013 XLIII
Table M18: Percentage of respondents with low HDL
Percentage of respondents with HDL <40 mg/dl
Age group
(years)
Men
n % 95% CI
15–29 253 63.3 55.9–70.7
30–44 372 58.7 52.1–65.4
45–69 573 60.1 54.9–65.3
15–69 1,198 61.2 56.6–65.8
Table M19: Mean fasting triglycerides among all respondents
Age group (years)
Men Women Both sexes
n Mean 95% CI n Mean 95% CI n Mean 95% CI
15–29 252 113.2 101.2–125.2 600 97.2 92.1–102.3 852 105.0 98.3–111.8
30–44 369 160.5 148.5–172.6 1,048 117.9 112.9–122.9 1,417 137.9 131.0–144.7
45–69 570 146.1 136.8–155.4 914 138.6 132.7–144.5 1,484 142.3 136.3–148.3
15–69 1,191 134.7 126.8–142.5 2,562 114.1 110.2–117.9 3,753 124.1 119.3–128.9
Table M20: Percentage of respondents with raised fasting triglycerides
Age group (years)
Men Women Both sexes
n % 95% CI n % 95% CI n % 95% CI
Fasting triglycerides ≥ 150 mg/dl
15–29 252 21.2 14.4–28.0 600 10.2 7.5–12.8 852 15.6 11.9–19.2
30–44 369 44.1 37.6–50.7 1,048 20.9 17.9–23.8 1,417 31.8 28.1–35.4
45–69 570 36.4 31.6–41.2 914 33.5 29.5–37.4 1,484 34.9 31.5–38.315–69 1,191 31.4 27.1–35.8 2,562 19.4 17.3–21.4 3,753 25.2 22.7–27.7Fasting triglycerides ≥ 180 mg/dl15–29 252 16.1 9.8–22.4 600 5.7 3.6–7.8 852 10.8 7.4–14.2
30–44 369 33.2 27.4–39.0 1,048 13.1 10.6–15.5 1,417 22.5 19.3–25.7
45–69 570 24.0 20.0–28.1 914 21.9 18.5–25.3 1,484 22.9 20.1–25.8
15–69 1,191 22.8 19.1–26.5 2,562 12.1 10.4–13.8 3,753 17.3 15.1–19.4
Table M21: Mean LDL among all respondents
Age group (years)
Men Women Both sexes
n Mean 95% CI n Mean 95% CI n Mean 95% CI
15–29 226 92.9 88.7–97.1 556 92.3 89.4–95.2 782 92.6 89.9–95.3
30–44 340 104.5 100.0–109.0 967 99.6 97.2–102.0 1,307 101.8 99.2–104.5
45–69 527 105.8 102.2–109.3 854 110.1 107.3–112.9 1,381 108.0 105.4–110.6
15–69 1,093 99.6 96.8–102.4 2,377 99.1 97.0–101.2 3,470 99.3 97.3–101.3
Percentage of respondents with HDL <50 mg/dl
Age group
(years)
Women
n % 95% CI
15–29 602 76.6 72.1–81.2
30–44 1,052 82.6 79.6–85.6
45–69 920 80.5 77.0–84.1
15–69 2,574 79.3 76.5–82.2
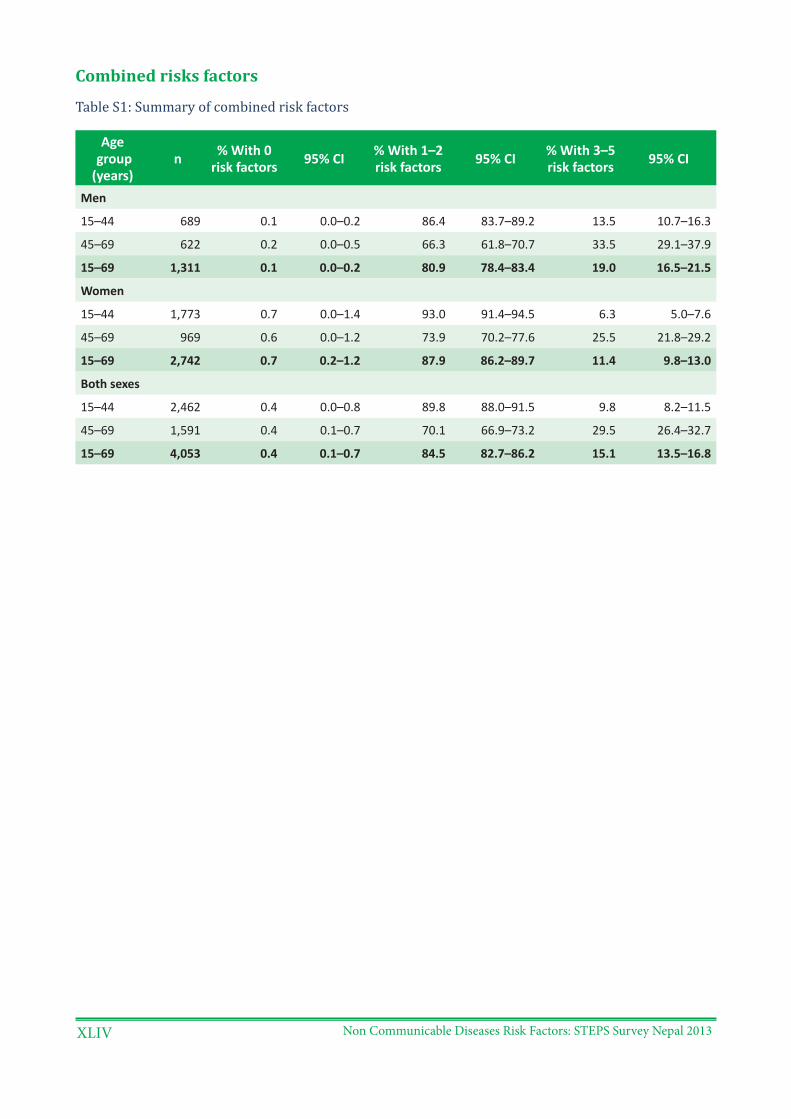
Non Communicable Diseases Risk Factors: STEPS Survey Nepal 2013XLIV
Combined risks factors
Table S1: Summary of combined risk factors
Age group (years)
n % With 0 risk factors 95% CI % With 1–2
risk factors 95% CI % With 3–5 risk factors 95% CI
Men
15–44 689 0.1 0.0–0.2 86.4 83.7–89.2 13.5 10.7–16.3
45–69 622 0.2 0.0–0.5 66.3 61.8–70.7 33.5 29.1–37.9
15–69 1,311 0.1 0.0–0.2 80.9 78.4–83.4 19.0 16.5–21.5
Women
15–44 1,773 0.7 0.0–1.4 93.0 91.4–94.5 6.3 5.0–7.6
45–69 969 0.6 0.0–1.2 73.9 70.2–77.6 25.5 21.8–29.2
15–69 2,742 0.7 0.2–1.2 87.9 86.2–89.7 11.4 9.8–13.0
Both sexes
15–44 2,462 0.4 0.0–0.8 89.8 88.0–91.5 9.8 8.2–11.5
45–69 1,591 0.4 0.1–0.7 70.1 66.9–73.2 29.5 26.4–32.7
15–69 4,053 0.4 0.1–0.7 84.5 82.7–86.2 15.1 13.5–16.8
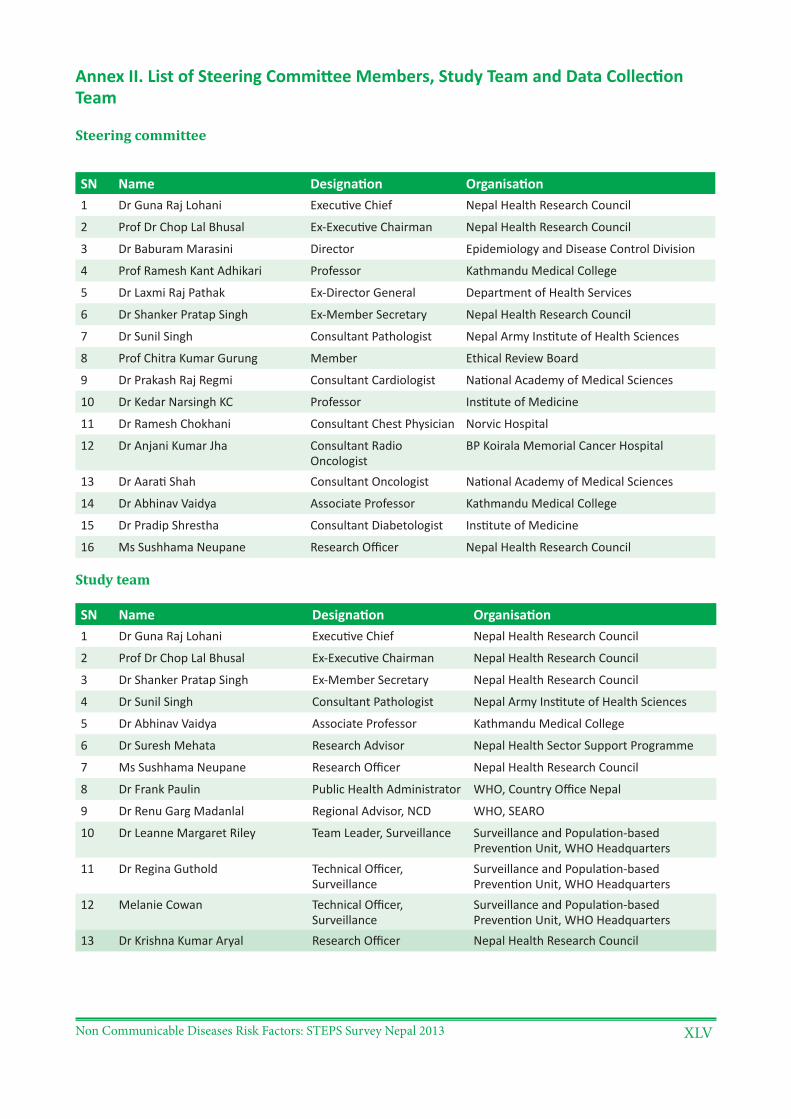
Non Communicable Diseases Risk Factors: STEPS Survey Nepal 2013 XLV
Annex II. List of Steering Committee Members, Study Team and Data Collection Team
Steering committee
SN Name Designation Organisation1 Dr Guna Raj Lohani Executive Chief Nepal Health Research Council
2 Prof Dr Chop Lal Bhusal Ex-Executive Chairman Nepal Health Research Council
3 Dr Baburam Marasini Director Epidemiology and Disease Control Division
4 Prof Ramesh Kant Adhikari Professor Kathmandu Medical College
5 Dr Laxmi Raj Pathak Ex-Director General Department of Health Services
6 Dr Shanker Pratap Singh Ex-Member Secretary Nepal Health Research Council
7 Dr Sunil Singh Consultant Pathologist Nepal Army Institute of Health Sciences
8 Prof Chitra Kumar Gurung Member Ethical Review Board
9 Dr Prakash Raj Regmi Consultant Cardiologist National Academy of Medical Sciences
10 Dr Kedar Narsingh KC Professor Institute of Medicine
11 Dr Ramesh Chokhani Consultant Chest Physician Norvic Hospital
12 Dr Anjani Kumar Jha Consultant Radio Oncologist
BP Koirala Memorial Cancer Hospital
13 Dr Aarati Shah Consultant Oncologist National Academy of Medical Sciences
14 Dr Abhinav Vaidya Associate Professor Kathmandu Medical College
15 Dr Pradip Shrestha Consultant Diabetologist Institute of Medicine
16 Ms Sushhama Neupane Research Officer Nepal Health Research Council
Study team
SN Name Designation Organisation1 Dr Guna Raj Lohani Executive Chief Nepal Health Research Council
2 Prof Dr Chop Lal Bhusal Ex-Executive Chairman Nepal Health Research Council
3 Dr Shanker Pratap Singh Ex-Member Secretary Nepal Health Research Council
4 Dr Sunil Singh Consultant Pathologist Nepal Army Institute of Health Sciences
5 Dr Abhinav Vaidya Associate Professor Kathmandu Medical College
6 Dr Suresh Mehata Research Advisor Nepal Health Sector Support Programme
7 Ms Sushhama Neupane Research Officer Nepal Health Research Council
8 Dr Frank Paulin Public Health Administrator WHO, Country Office Nepal
9 Dr Renu Garg Madanlal Regional Advisor, NCD WHO, SEARO
10 Dr Leanne Margaret Riley Team Leader, Surveillance Surveillance and Population-based Prevention Unit, WHO Headquarters
11 Dr Regina Guthold Technical Officer, Surveillance
Surveillance and Population-based Prevention Unit, WHO Headquarters
12 Melanie Cowan Technical Officer, Surveillance
Surveillance and Population-based Prevention Unit, WHO Headquarters
13 Dr Krishna Kumar Aryal Research Officer Nepal Health Research Council
Non Communicable Diseases Risk Factors: STEPS Survey Nepal 2013XLVI
Supervisors and enumerators
Supervisors
Mr Baivab Man Shrestha
Mr Anurag Singh Ghimire
Laboratory technologists
Mr Laxman Panthi
Mr Lok Nath Chaudhary
Mr Sameer Basnet
Laboratory technicians
Ms Lila Chaulagain
Ms Poonam Yadav
Enumerators
Ms Laxmi Dhoju Ms Renu SharmaMr Kiran Chatakuli Ms Manju PokhrelMr Roshan Ansari Ms Samita KhadkaMr Krishna Bahadur Ranabhat Ms Chumma BishwakarmaMr Purna Bdr Gharti Ms Jonny ShresthaMs Amrita Adhikari Ms Parmilashree ShresthaMs Jharna Shrestha Mr Prakash KandelMs Samjhana Thapa Mr Bishwanath ThakurMr Abhishek Kr Chaudary Ms Sanju Shah Mr Bishnu Khatri Ms Yubika GhimireMr Chandan Kr Pandey
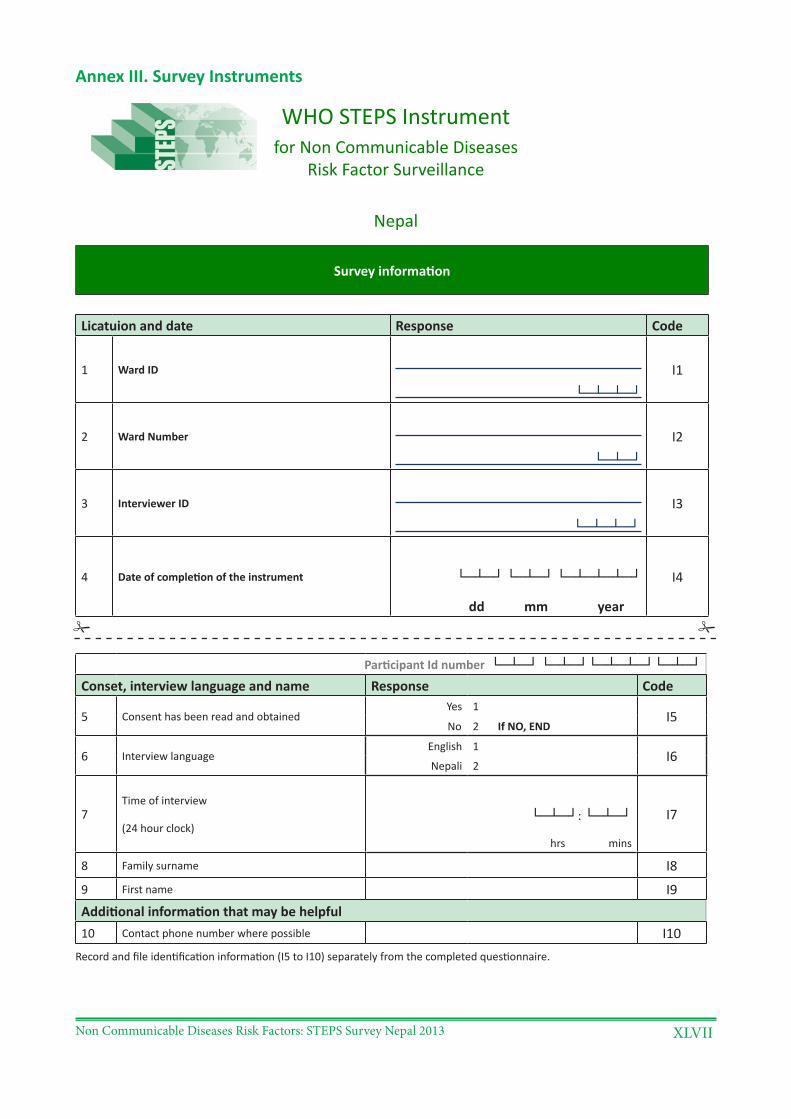
Non Communicable Diseases Risk Factors: STEPS Survey Nepal 2013 XLVII
Annex III. Survey Instruments
WHO STEPS Instrumentfor Non Communicable Diseases
Risk Factor Surveillance
Nepal
Survey information
Licatuion and date Response Code
1 Ward ID
└─┴─┴─┘I1
2 Ward Number
└─┴─┘
I2
3 Interviewer ID
└─┴─┴─┘I3
4 Date of completion of the instrument └─┴─┘ └─┴─┘ └─┴─┴─┴─┘
dd mm year
I4
Participant Id number └─┴─┘ └─┴─┘└─┴─┴─┘└─┴─┘Conset, interview language and name Response Code
5 Consent has been read and obtainedYes 1
I5 No 2 If NO, END
6 Interview language English 1
I6Nepali 2
7Time of interview
(24 hour clock)└─┴─┘: └─┴─┘
hrs mins
I7
8 Family surname I8
9 First name I9Additional information that may be helpful10 Contact phone number where possible I10
Record and file identification information (I5 to I10) separately from the completed questionnaire.
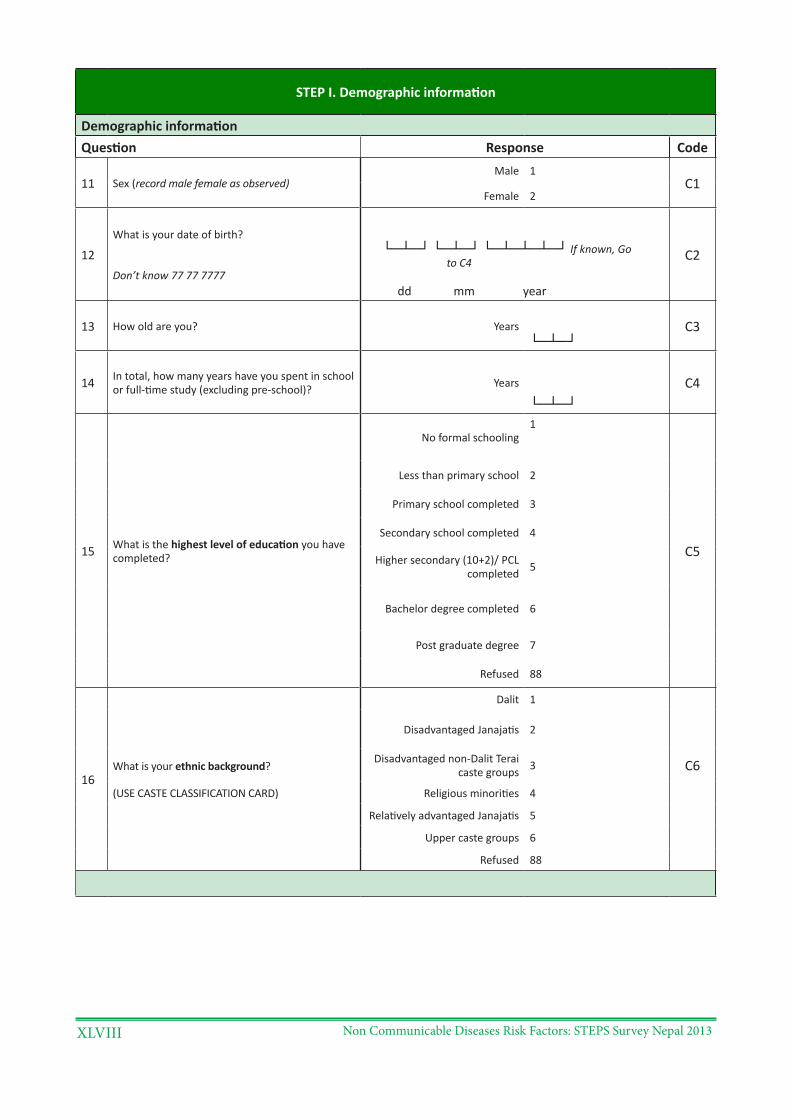
Non Communicable Diseases Risk Factors: STEPS Survey Nepal 2013XLVIII
STEP I. Demographic information
Demographic informationQuestion Response Code
11 Sex (record male female as observed)Male 1
C1Female 2
12What is your date of birth?
Don’t know 77 77 7777
└─┴─┘ └─┴─┘ └─┴─┴─┴─┘ If known, Go to C4
dd mm year
C2
13 How old are you? Years└─┴─┘
C3
14 In total, how many years have you spent in school or full-time study (excluding pre-school)? Years
└─┴─┘C4
15 What is the highest level of education you have completed?
No formal schooling 1
C5
Less than primary school 2
Primary school completed 3
Secondary school completed 4
Higher secondary (10+2)/ PCL completed 5
Bachelor degree completed 6
Post graduate degree 7
Refused 88
16What is your ethnic background?
(USE CASTE CLASSIFICATION CARD)
Dalit 1
Disadvantaged Janajatis 2
Disadvantaged non-Dalit Terai caste groups 3 C6
Religious minorities 4
Relatively advantaged Janajatis 5
Upper caste groups 6
Refused 88
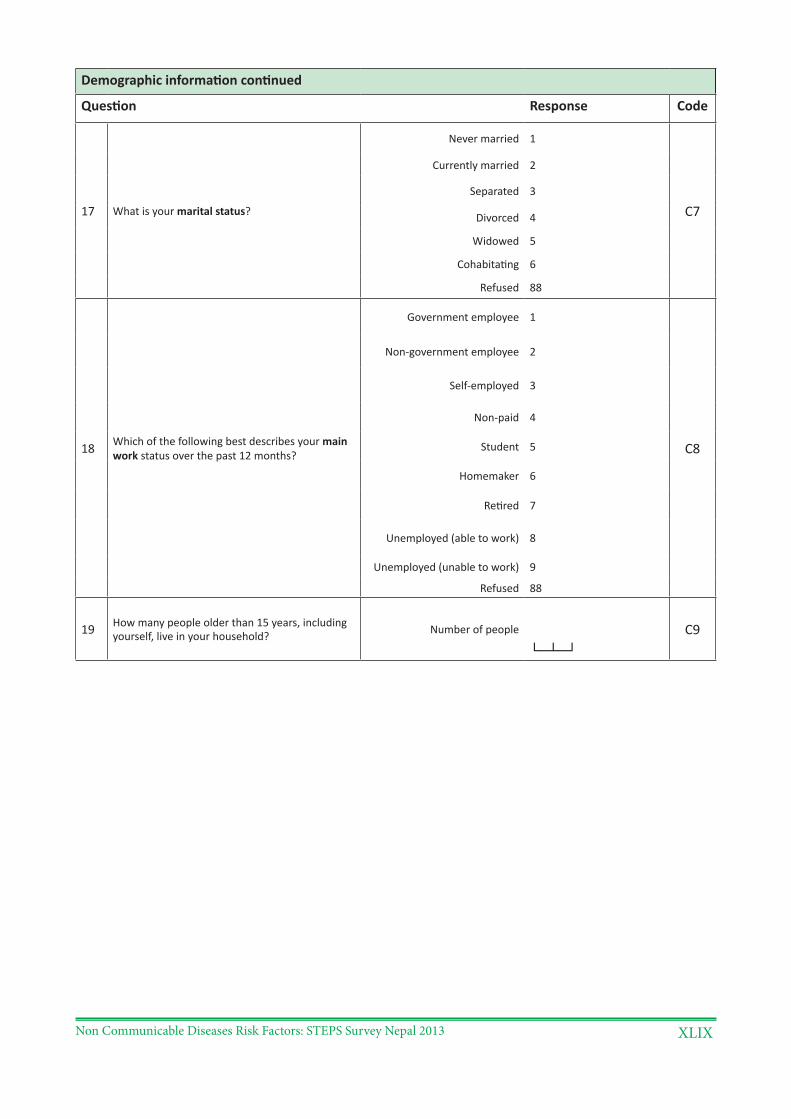
Non Communicable Diseases Risk Factors: STEPS Survey Nepal 2013 XLIX
Demographic information continued
Question Response Code
17 What is your marital status?
Never married 1
C7
Currently married 2
Separated 3
Divorced 4
Widowed 5
Cohabitating 6
Refused 88
18 Which of the following best describes your main work status over the past 12 months?
Government employee 1
C8
Non-government employee 2
Self-employed 3
Non-paid 4
Student 5
Homemaker 6
Retired 7
Unemployed (able to work) 8
Unemployed (unable to work) 9
Refused 88
19 How many people older than 15 years, including yourself, live in your household? Number of people
└─┴─┘C9
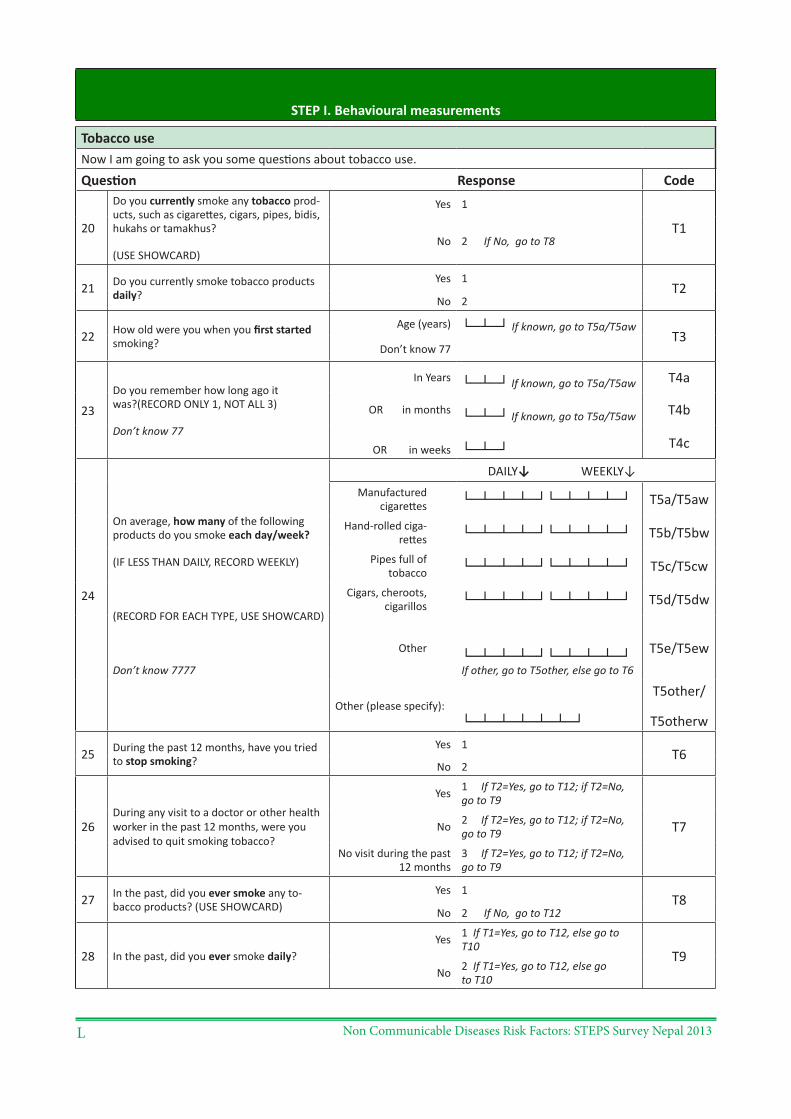
Non Communicable Diseases Risk Factors: STEPS Survey Nepal 2013L
STEP I. Behavioural measurements
Tobacco useNow I am going to ask you some questions about tobacco use.
Question Response Code
20
Do you currently smoke any tobacco prod-ucts, such as cigarettes, cigars, pipes, bidis, hukahs or tamakhus?
(USE SHOWCARD)
Yes 1
T1No 2 If No, go to T8
21 Do you currently smoke tobacco products daily?
Yes 1T2
No 2
22 How old were you when you first started smoking?
Age (years) └─┴─┘ If known, go to T5a/T5awT3
Don’t know 77
23Do you remember how long ago it was?(RECORD ONLY 1, NOT ALL 3)
Don’t know 77
In Years └─┴─┘ If known, go to T5a/T5aw T4a
OR in months └─┴─┘ If known, go to T5a/T5aw T4b
OR in weeks └─┴─┘ T4c
24
On average, how many of the following products do you smoke each day/week?
(IF LESS THAN DAILY, RECORD WEEKLY)
(RECORD FOR EACH TYPE, USE SHOWCARD)
Don’t know 7777
DAILY↓ WEEKLY↓Manufactured
cigarettes └─┴─┴─┴─┘└─┴─┴─┴─┘ T5a/T5aw
Hand-rolled ciga-rettes └─┴─┴─┴─┘└─┴─┴─┴─┘ T5b/T5bw
Pipes full of tobacco └─┴─┴─┴─┘└─┴─┴─┴─┘ T5c/T5cw
Cigars, cheroots, cigarillos └─┴─┴─┴─┘└─┴─┴─┴─┘ T5d/T5dw
Other └─┴─┴─┴─┘└─┴─┴─┴─┘ If other, go to T5other, else go to T6
T5e/T5ew
Other (please specify):└─┴─┴─┴─┴─┴─┘
T5other/
T5otherw
25 During the past 12 months, have you tried to stop smoking?
Yes 1 T6
No 2
26During any visit to a doctor or other health worker in the past 12 months, were you advised to quit smoking tobacco?
Yes 1 If T2=Yes, go to T12; if T2=No, go to T9
T7No 2 If T2=Yes, go to T12; if T2=No, go to T9
No visit during the past 12 months
3 If T2=Yes, go to T12; if T2=No, go to T9
27 In the past, did you ever smoke any to-bacco products? (USE SHOWCARD)
Yes 1T8
No 2 If No, go to T12
28 In the past, did you ever smoke daily?Yes 1 If T1=Yes, go to T12, else go to
T10T9
No 2 If T1=Yes, go to T12, else go to T10
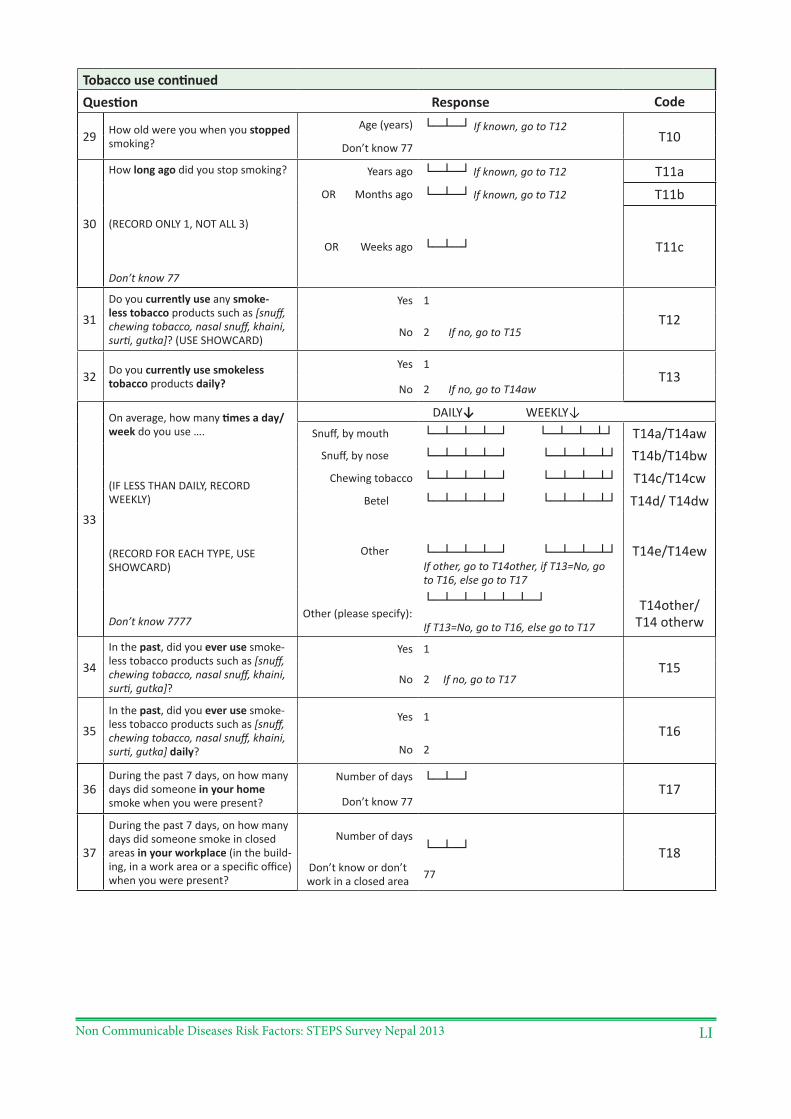
Non Communicable Diseases Risk Factors: STEPS Survey Nepal 2013 LI
Tobacco use continuedQuestion Response Code
29 How old were you when you stopped smoking?
Age (years) └─┴─┘ If known, go to T12T10
Don’t know 77
30
How long ago did you stop smoking?
(RECORD ONLY 1, NOT ALL 3)
Don’t know 77
Years ago └─┴─┘ If known, go to T12 T11aOR Months ago └─┴─┘ If known, go to T12 T11b
OR Weeks ago └─┴─┘ T11c
31
Do you currently use any smoke-less tobacco products such as [snuff, chewing tobacco, nasal snuff, khaini, surti, gutka]? (USE SHOWCARD)
Yes 1
T12No 2 If no, go to T15
32 Do you currently use smokeless tobacco products daily?
Yes 1 T13
No 2 If no, go to T14aw
33
On average, how many times a day/week do you use ….
(IF LESS THAN DAILY, RECORD WEEKLY)
(RECORD FOR EACH TYPE, USE SHOWCARD)
Don’t know 7777
DAILY↓ WEEKLY↓Snuff, by mouth └─┴─┴─┴─┘ └─┴─┴─┴┘ T14a/T14aw
Snuff, by nose └─┴─┴─┴─┘ └─┴─┴─┴┘ T14b/T14bwChewing tobacco └─┴─┴─┴─┘ └─┴─┴─┴┘ T14c/T14cw
Betel └─┴─┴─┴─┘ └─┴─┴─┴┘ T14d/ T14dw
Other └─┴─┴─┴─┘ └─┴─┴─┴┘ If other, go to T14other, if T13=No, go to T16, else go to T17
T14e/T14ew
Other (please specify):└─┴─┴─┴─┴─┴─┘
If T13=No, go to T16, else go to T17
T14other/T14 otherw
34
In the past, did you ever use smoke-less tobacco products such as [snuff, chewing tobacco, nasal snuff, khaini, surti, gutka]?
Yes 1
T15No 2 If no, go to T17
35
In the past, did you ever use smoke-less tobacco products such as [snuff, chewing tobacco, nasal snuff, khaini, surti, gutka] daily?
Yes 1T16
No 2
36During the past 7 days, on how many days did someone in your home smoke when you were present?
Number of days └─┴─┘T17
Don’t know 77
37
During the past 7 days, on how many days did someone smoke in closed areas in your workplace (in the build-ing, in a work area or a specific office) when you were present?
Number of days└─┴─┘ T18
Don’t know or don’t work in a closed area 77
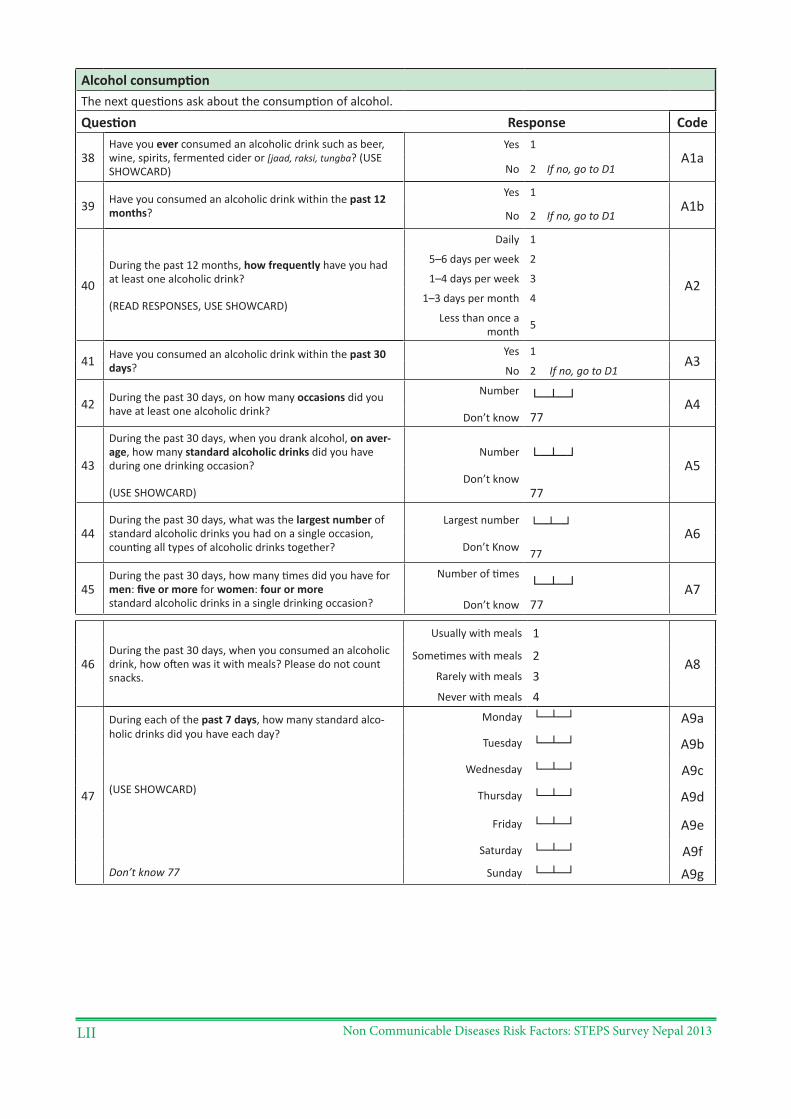
Non Communicable Diseases Risk Factors: STEPS Survey Nepal 2013LII
Alcohol consumptionThe next questions ask about the consumption of alcohol.
Question Response Code
38Have you ever consumed an alcoholic drink such as beer, wine, spirits, fermented cider or [jaad, raksi, tungba? (USE SHOWCARD)
Yes 1A1a
No 2 If no, go to D1
39 Have you consumed an alcoholic drink within the past 12 months?
Yes 1A1b
No 2 If no, go to D1
40During the past 12 months, how frequently have you had at least one alcoholic drink?
(READ RESPONSES, USE SHOWCARD)
Daily 1
A2
5–6 days per week 2
1–4 days per week 3
1–3 days per month 4
Less than once a month 5
41 Have you consumed an alcoholic drink within the past 30 days?
Yes 1A3
No 2 If no, go to D1
42 During the past 30 days, on how many occasions did you have at least one alcoholic drink?
Number
Don’t know
└─┴─┘ A477
43
During the past 30 days, when you drank alcohol, on aver-age, how many standard alcoholic drinks did you have during one drinking occasion?
(USE SHOWCARD)
Number
Don’t know
└─┴─┘A5
77
44During the past 30 days, what was the largest number of standard alcoholic drinks you had on a single occasion, counting all types of alcoholic drinks together?
Largest number
Don’t Know
└─┴─┘A6
77
45During the past 30 days, how many times did you have for men: five or more for women: four or more standard alcoholic drinks in a single drinking occasion?
Number of times
Don’t know
└─┴─┘ A777
46During the past 30 days, when you consumed an alcoholic drink, how often was it with meals? Please do not count snacks.
Usually with meals 1
A8Sometimes with meals 2
Rarely with meals 3Never with meals 4
47
During each of the past 7 days, how many standard alco-holic drinks did you have each day?
(USE SHOWCARD)
Don’t know 77
Monday └─┴─┘ A9a
Tuesday └─┴─┘ A9b
Wednesday └─┴─┘ A9c
Thursday └─┴─┘ A9d
Friday └─┴─┘ A9e
Saturday └─┴─┘ A9fSunday └─┴─┘ A9g
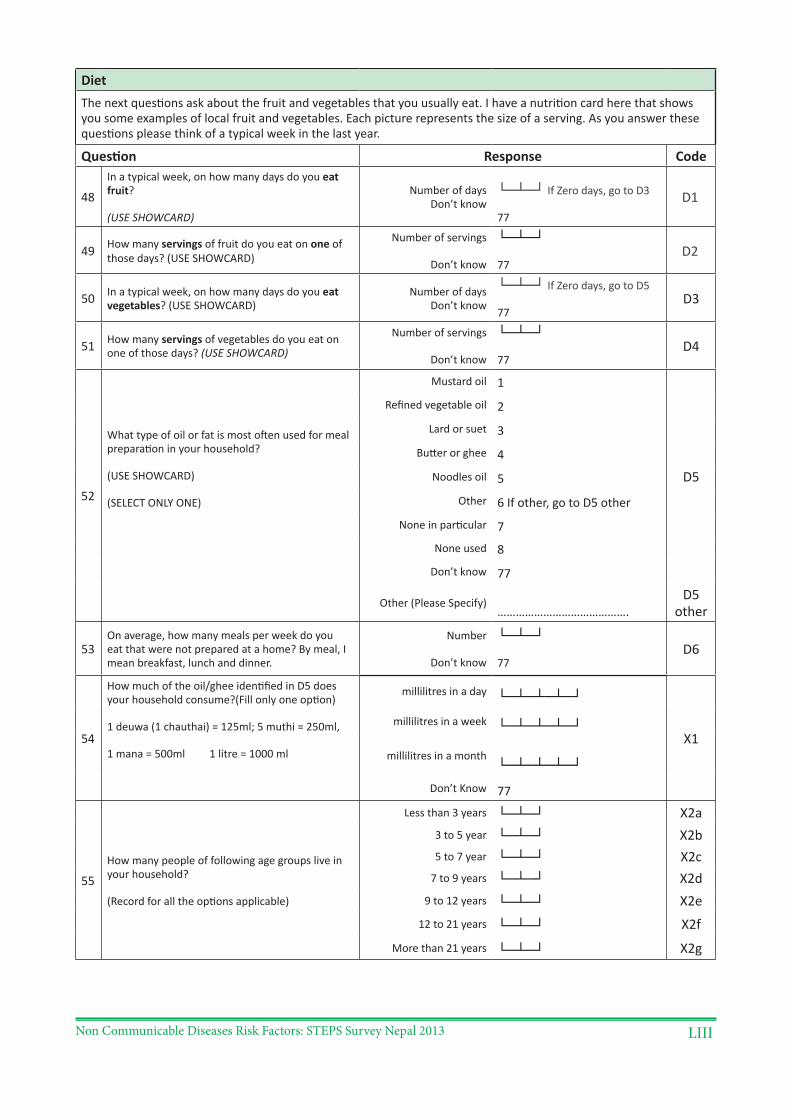
Non Communicable Diseases Risk Factors: STEPS Survey Nepal 2013 LIII
DietThe next questions ask about the fruit and vegetables that you usually eat. I have a nutrition card here that shows you some examples of local fruit and vegetables. Each picture represents the size of a serving. As you answer these questions please think of a typical week in the last year.
Question Response Code
48In a typical week, on how many days do you eat fruit?
(USE SHOWCARD)
Number of days Don’t know
└─┴─┘ If Zero days, go to D3
77
D1
49 How many servings of fruit do you eat on one of those days? (USE SHOWCARD)
Number of servings
Don’t know
└─┴─┘
77 D2
50 In a typical week, on how many days do you eat vegetables? (USE SHOWCARD)
Number of days Don’t know
└─┴─┘ If Zero days, go to D5
77D3
51 How many servings of vegetables do you eat on one of those days? (USE SHOWCARD)
Number of servings
Don’t know
└─┴─┘
77D4
52
What type of oil or fat is most often used for meal preparation in your household?
(USE SHOWCARD)
(SELECT ONLY ONE)
Mustard oil 1
D5
Refined vegetable oil 2
Lard or suet 3
Butter or ghee 4
Noodles oil 5
Other 6 If other, go to D5 other
None in particular 7
None used 8
Don’t know 77
Other (Please Specify)…………………………………….
D5 other
53On average, how many meals per week do you eat that were not prepared at a home? By meal, I mean breakfast, lunch and dinner.
Number
Don’t know
└─┴─┘
77D6
54
How much of the oil/ghee identified in D5 does your household consume?(Fill only one option)
1 deuwa (1 chauthai) = 125ml; 5 muthi = 250ml,
1 mana = 500ml 1 litre = 1000 ml
millilitres in a day └─┴─┴─┴─┘
X1millilitres in a week └─┴─┴─┴─┘
millilitres in a month└─┴─┴─┴─┘
Don’t Know 77
55How many people of following age groups live in your household?
(Record for all the options applicable)
Less than 3 years └─┴─┘ X2a3 to 5 year └─┴─┘ X2b5 to 7 year └─┴─┘ X2c
7 to 9 years └─┴─┘ X2d9 to 12 years └─┴─┘ X2e
12 to 21 years └─┴─┘ X2fMore than 21 years └─┴─┘ X2g
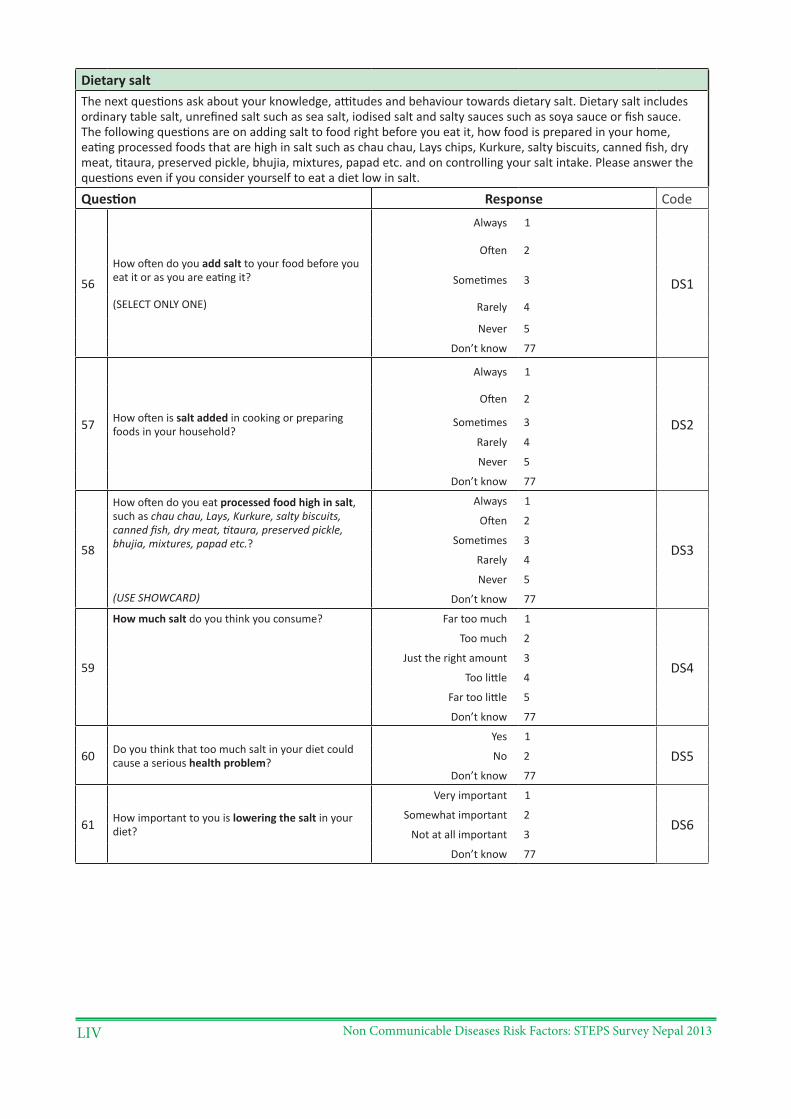
Non Communicable Diseases Risk Factors: STEPS Survey Nepal 2013LIV
Dietary saltThe next questions ask about your knowledge, attitudes and behaviour towards dietary salt. Dietary salt includes ordinary table salt, unrefined salt such as sea salt, iodised salt and salty sauces such as soya sauce or fish sauce. The following questions are on adding salt to food right before you eat it, how food is prepared in your home, eating processed foods that are high in salt such as chau chau, Lays chips, Kurkure, salty biscuits, canned fish, dry meat, titaura, preserved pickle, bhujia, mixtures, papad etc. and on controlling your salt intake. Please answer the questions even if you consider yourself to eat a diet low in salt.
Question Response Code
56How often do you add salt to your food before you eat it or as you are eating it?
(SELECT ONLY ONE)
Always 1
DS1
Often 2
Sometimes 3
Rarely 4
Never 5
Don’t know 77
57 How often is salt added in cooking or preparing foods in your household?
Always 1
DS2
Often 2
Sometimes 3
Rarely 4
Never 5
Don’t know 77
58
How often do you eat processed food high in salt, such as chau chau, Lays, Kurkure, salty biscuits, canned fish, dry meat, titaura, preserved pickle, bhujia, mixtures, papad etc.?
(USE SHOWCARD)
Always 1
DS3
Often 2
Sometimes 3
Rarely 4
Never 5
Don’t know 77
59
How much salt do you think you consume? Far too much 1
DS4
Too much 2
Just the right amount 3
Too little 4
Far too little 5
Don’t know 77
60 Do you think that too much salt in your diet could cause a serious health problem?
Yes 1
DS5No 2
Don’t know 77
61 How important to you is lowering the salt in your diet?
Very important 1
DS6Somewhat important 2
Not at all important 3
Don’t know 77
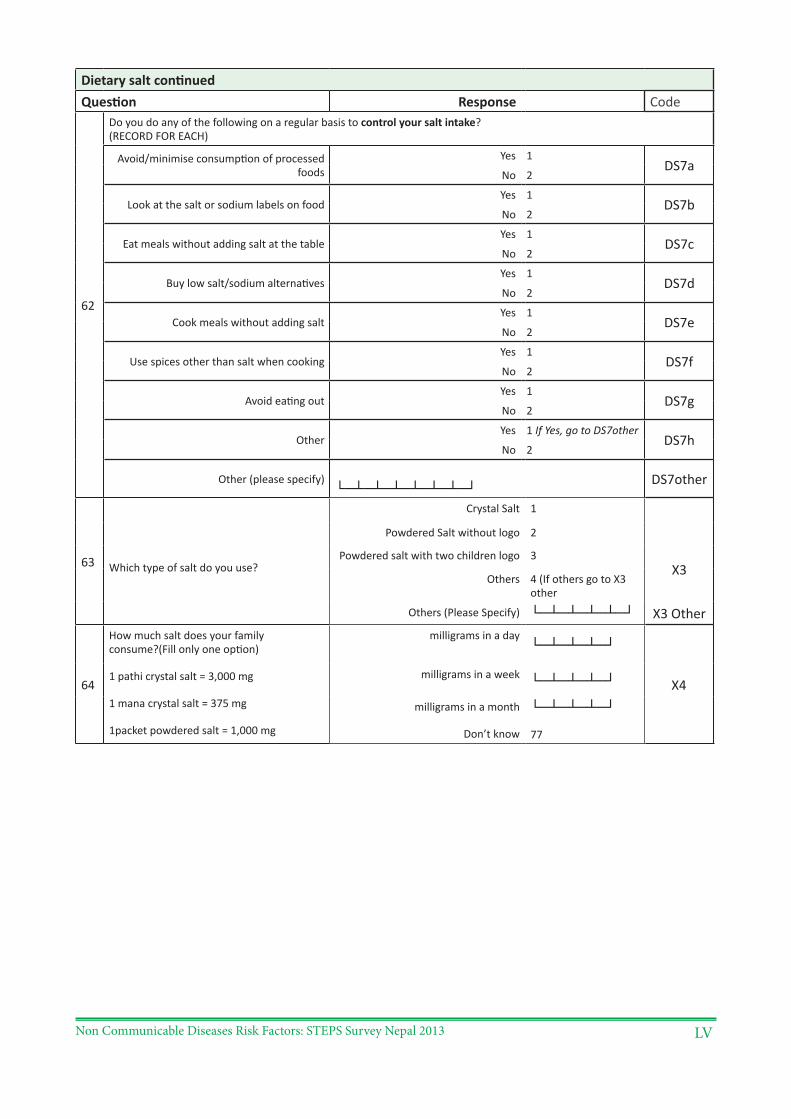
Non Communicable Diseases Risk Factors: STEPS Survey Nepal 2013 LV
Dietary salt continuedQuestion Response Code
62
Do you do any of the following on a regular basis to control your salt intake? (RECORD FOR EACH)
Avoid/minimise consumption of processed foods
Yes 1DS7a
No 2
Look at the salt or sodium labels on foodYes 1
DS7bNo 2
Eat meals without adding salt at the tableYes 1
DS7cNo 2
Buy low salt/sodium alternativesYes 1
DS7dNo 2
Cook meals without adding saltYes 1
DS7eNo 2
Use spices other than salt when cookingYes 1
DS7fNo 2
Avoid eating outYes 1
DS7gNo 2
OtherYes 1 If Yes, go to DS7other
DS7hNo 2
Other (please specify)└─┴─┴─┴─┴─┴─┴─┘ DS7other
63 Which type of salt do you use?
Crystal Salt 1
X3
Powdered Salt without logo 2
Powdered salt with two children logo 3
Others 4 (If others go to X3 other
Others (Please Specify) └─┴─┴─┴─┴─┘ X3 Other
64
How much salt does your family consume?(Fill only one option)
1 pathi crystal salt = 3,000 mg
1 mana crystal salt = 375 mg
1packet powdered salt = 1,000 mg
milligrams in a day└─┴─┴─┴─┘
X4milligrams in a week └─┴─┴─┴─┘
milligrams in a month
Don’t know
└─┴─┴─┴─┘
77
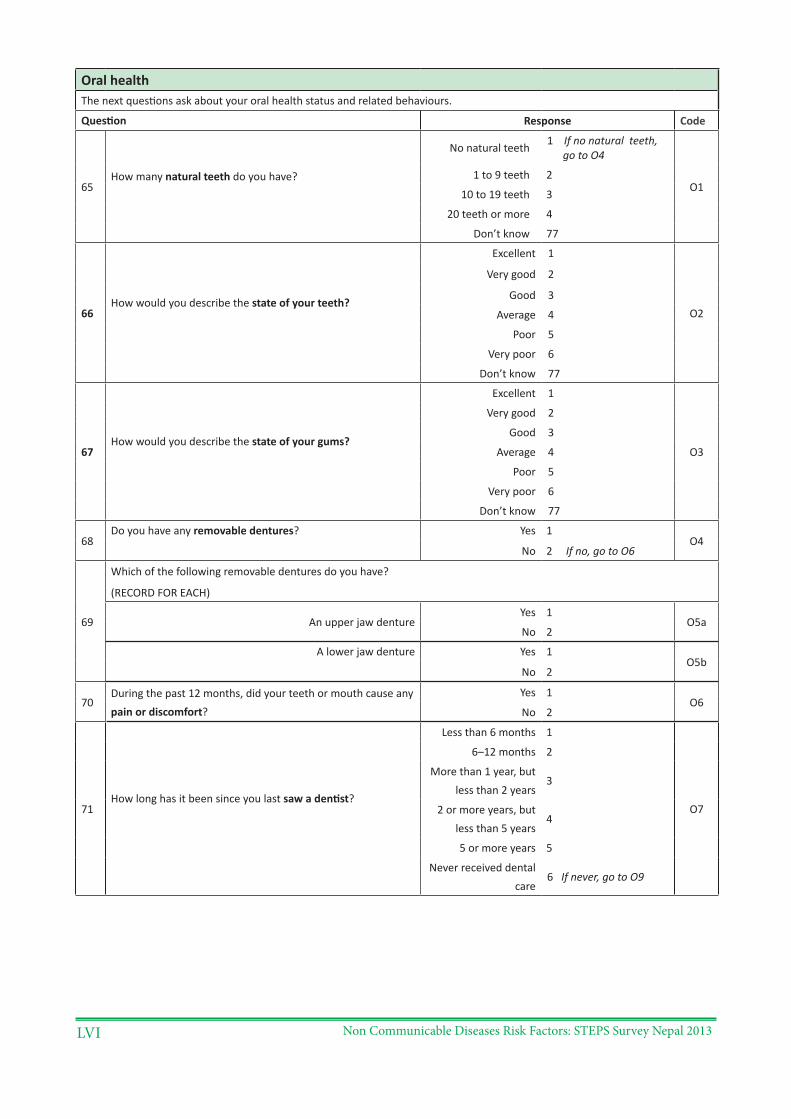
Non Communicable Diseases Risk Factors: STEPS Survey Nepal 2013LVI
Oral healthThe next questions ask about your oral health status and related behaviours.
Question Response Code
65How many natural teeth do you have?
No natural teeth 1 If no natural teeth, go to O4
O11 to 9 teeth 2
10 to 19 teeth 3
20 teeth or more 4
Don’t know 77
66How would you describe the state of your teeth?
Excellent 1
O2
Very good 2
Good 3
Average 4
Poor 5
Very poor 6
Don’t know 77
67How would you describe the state of your gums?
Excellent 1
O3
Very good 2
Good 3
Average 4
Poor 5
Very poor 6
Don’t know 77
68Do you have any removable dentures? Yes 1
O4No 2 If no, go to O6
69
Which of the following removable dentures do you have?
(RECORD FOR EACH)
An upper jaw dentureYes 1
O5aNo 2
A lower jaw denture Yes 1O5b
No 2
70During the past 12 months, did your teeth or mouth cause any pain or discomfort?
Yes 1O6
No 2
71How long has it been since you last saw a dentist?
Less than 6 months 1
O7
6–12 months 2
More than 1 year, but less than 2 years
3
2 or more years, but less than 5 years
4
5 or more years 5
Never received dental care
6 If never, go to O9
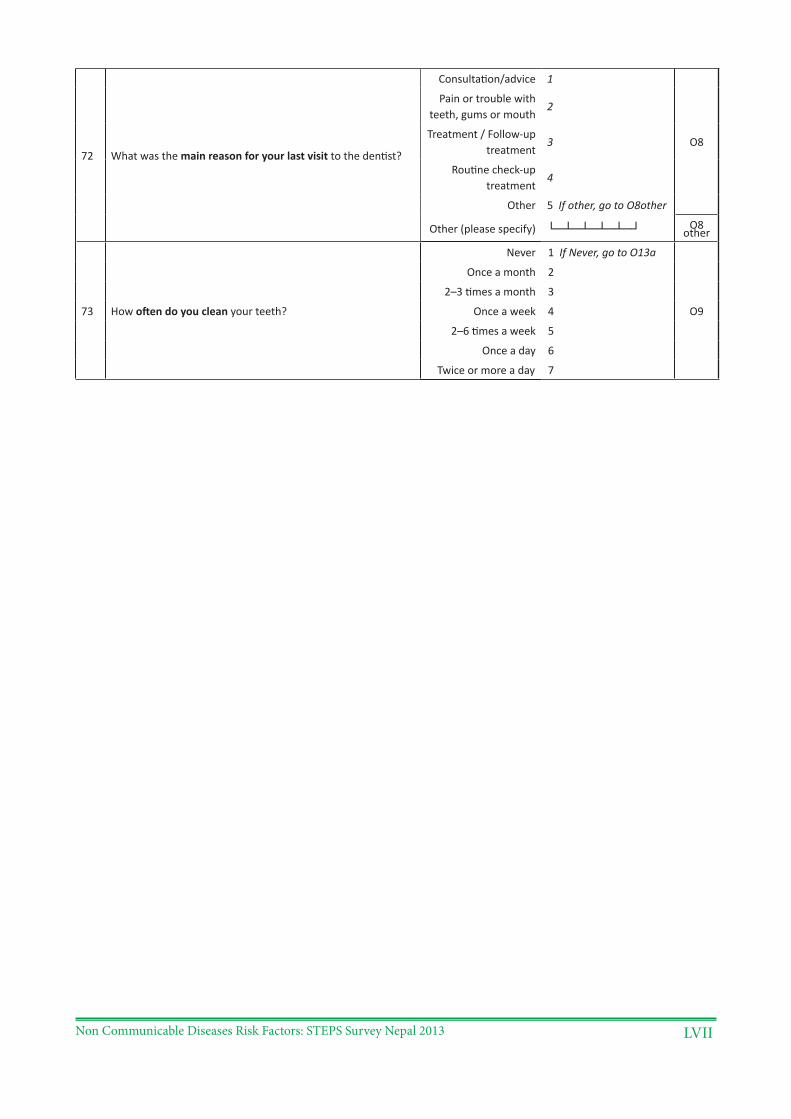
Non Communicable Diseases Risk Factors: STEPS Survey Nepal 2013 LVII
72 What was the main reason for your last visit to the dentist?
Consultation/advice 1
O8
Pain or trouble with teeth, gums or mouth
2
Treatment / Follow-up treatment
3
Routine check-up treatment
4
Other 5 If other, go to O8other
Other (please specify) └─┴─┴─┴─┴─┘ O8 other
73 How often do you clean your teeth?
Never 1 If Never, go to O13a
O9
Once a month 2
2–3 times a month 3
Once a week 4
2–6 times a week 5
Once a day 6
Twice or more a day 7
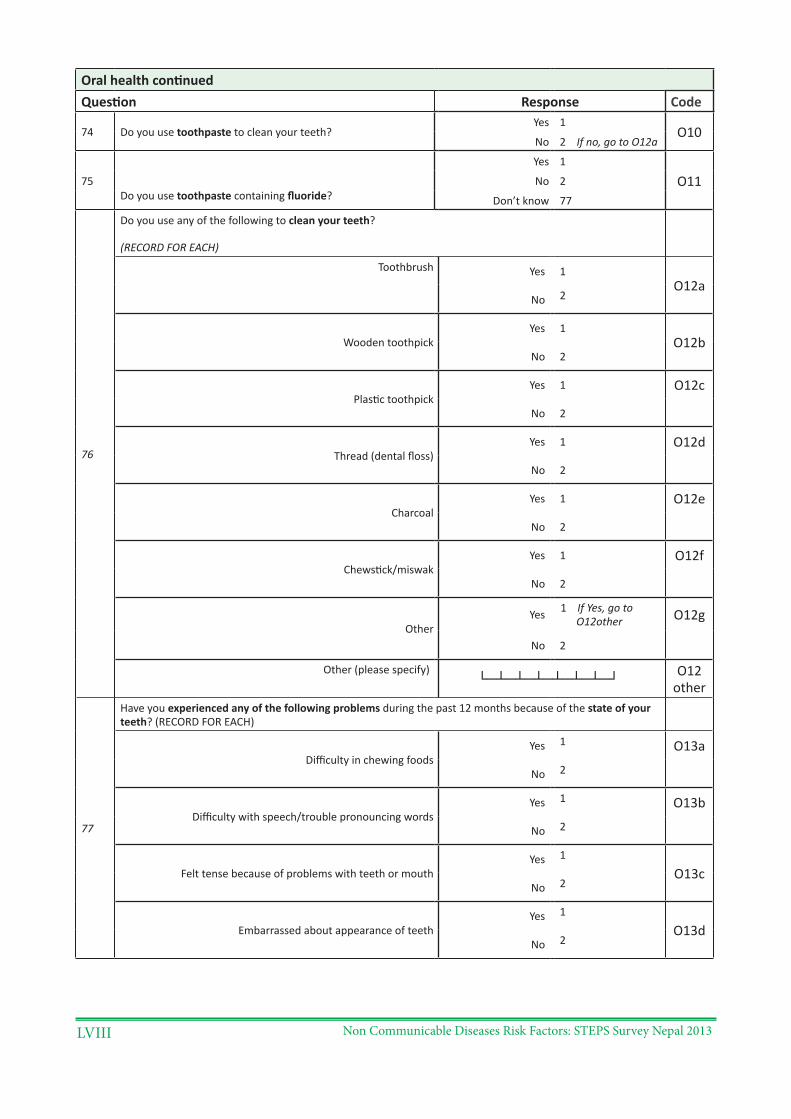
Non Communicable Diseases Risk Factors: STEPS Survey Nepal 2013LVIII
Oral health continuedQuestion Response Code
74 Do you use toothpaste to clean your teeth?Yes 1
O10No 2 If no, go to O12a
75Do you use toothpaste containing fluoride?
Yes 1
O11No 2
Don’t know 77
76
Do you use any of the following to clean your teeth?
(RECORD FOR EACH)
Toothbrush Yes 1O12a
No 2
Wooden toothpickYes 1
O12bNo 2
Plastic toothpickYes 1 O12c
No 2
Thread (dental floss)Yes 1 O12d
No 2
CharcoalYes 1 O12e
No 2
Chewstick/miswakYes 1 O12f
No 2
OtherYes 1 If Yes, go to
O12other O12g
No 2
Other (please specify) └─┴─┴─┴─┴─┴─┴─┘ O12
other
77
Have you experienced any of the following problems during the past 12 months because of the state of your teeth? (RECORD FOR EACH)
Difficulty in chewing foodsYes 1 O13a
No 2
Difficulty with speech/trouble pronouncing wordsYes 1 O13b
No 2
Felt tense because of problems with teeth or mouthYes 1
O13cNo 2
Embarrassed about appearance of teethYes 1
O13dNo 2
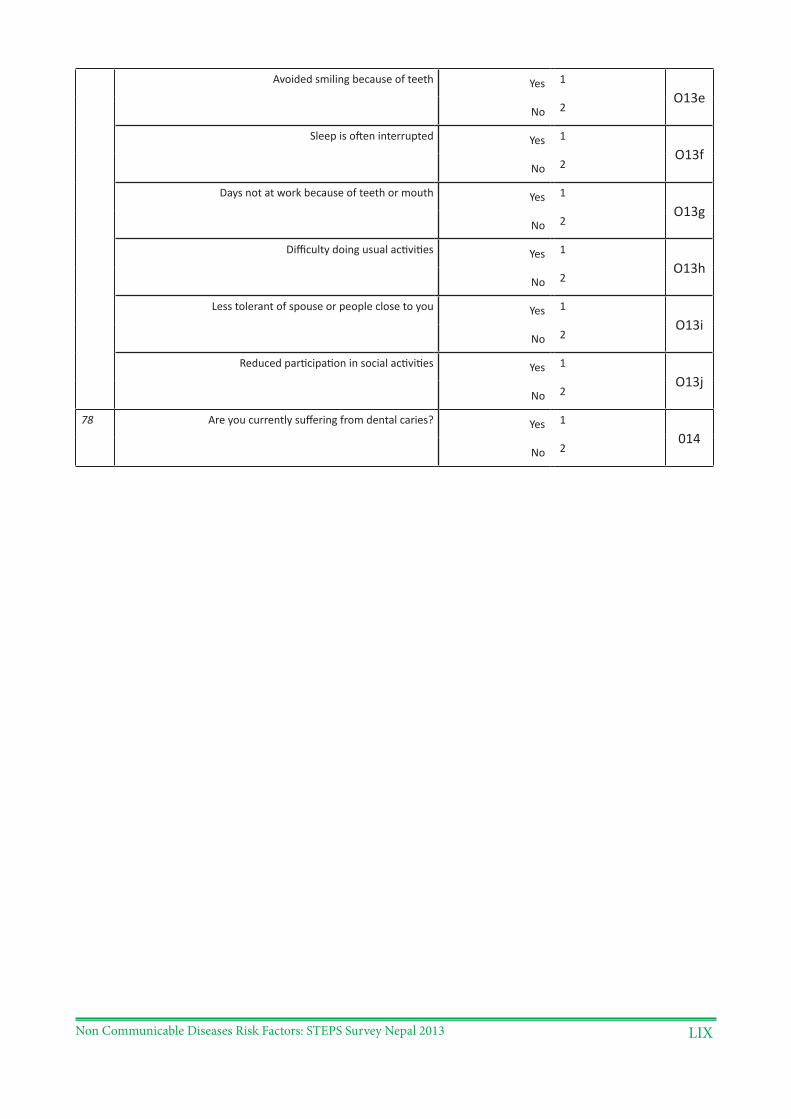
Non Communicable Diseases Risk Factors: STEPS Survey Nepal 2013 LIX
Avoided smiling because of teeth Yes 1
O13eNo 2
Sleep is often interrupted Yes 1
O13fNo 2
Days not at work because of teeth or mouth Yes 1
O13gNo 2
Difficulty doing usual activities Yes 1
O13hNo 2
Less tolerant of spouse or people close to you Yes 1
O13iNo 2
Reduced participation in social activities Yes 1
O13jNo 2
78 Are you currently suffering from dental caries? Yes 1
014No 2
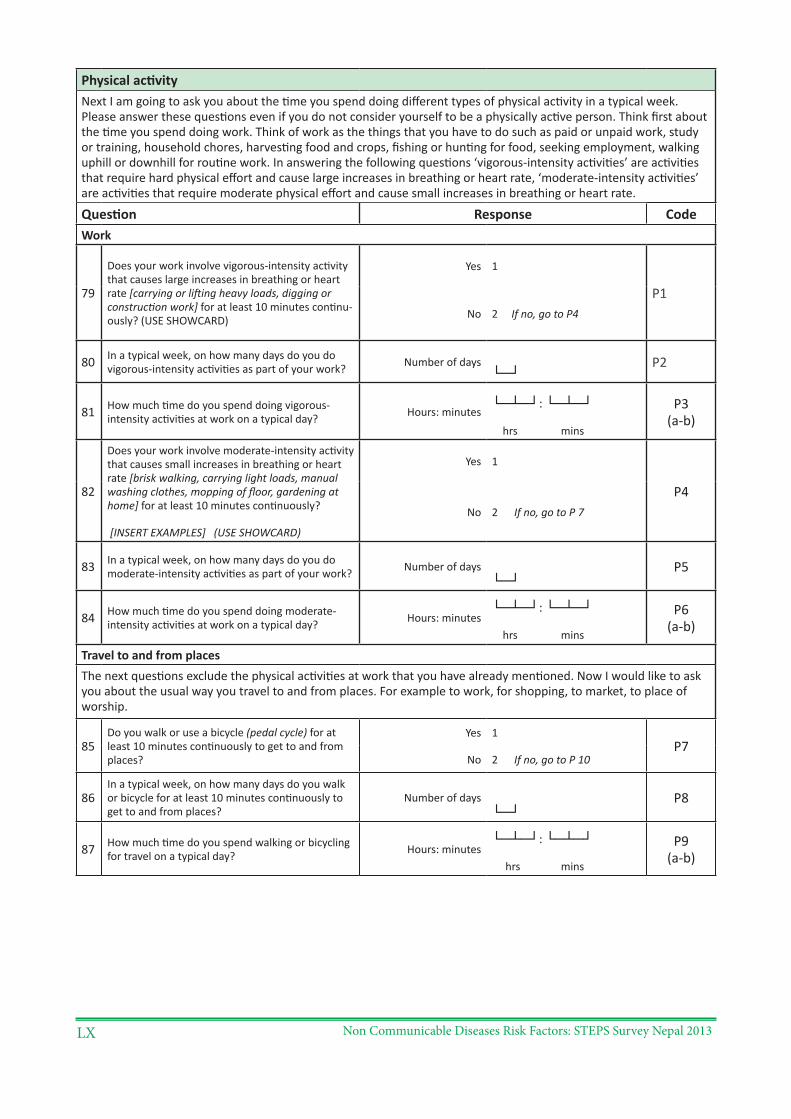
Non Communicable Diseases Risk Factors: STEPS Survey Nepal 2013LX
Physical activityNext I am going to ask you about the time you spend doing different types of physical activity in a typical week. Please answer these questions even if you do not consider yourself to be a physically active person. Think first about the time you spend doing work. Think of work as the things that you have to do such as paid or unpaid work, study or training, household chores, harvesting food and crops, fishing or hunting for food, seeking employment, walking uphill or downhill for routine work. In answering the following questions ‘vigorous-intensity activities’ are activities that require hard physical effort and cause large increases in breathing or heart rate, ‘moderate-intensity activities’ are activities that require moderate physical effort and cause small increases in breathing or heart rate.
Question Response CodeWork
79
Does your work involve vigorous-intensity activity that causes large increases in breathing or heart rate [carrying or lifting heavy loads, digging or construction work] for at least 10 minutes continu-ously? (USE SHOWCARD)
Yes 1
P1No 2 If no, go to P4
80 In a typical week, on how many days do you do vigorous-intensity activities as part of your work? Number of days
└─┘P2
81 How much time do you spend doing vigorous-intensity activities at work on a typical day? Hours: minutes
└─┴─┘: └─┴─┘
hrs mins
P3 (a-b)
82
Does your work involve moderate-intensity activity that causes small increases in breathing or heart rate [brisk walking, carrying light loads, manual washing clothes, mopping of floor, gardening at home] for at least 10 minutes continuously?
[INSERT EXAMPLES] (USE SHOWCARD)
Yes 1
P4No 2 If no, go to P 7
83 In a typical week, on how many days do you do moderate-intensity activities as part of your work? Number of days
└─┘P5
84 How much time do you spend doing moderate-intensity activities at work on a typical day? Hours: minutes
└─┴─┘: └─┴─┘
hrs mins
P6 (a-b)
Travel to and from placesThe next questions exclude the physical activities at work that you have already mentioned. Now I would like to ask you about the usual way you travel to and from places. For example to work, for shopping, to market, to place of worship.
85Do you walk or use a bicycle (pedal cycle) for at least 10 minutes continuously to get to and from places?
Yes 1P7
No 2 If no, go to P 10
86In a typical week, on how many days do you walk or bicycle for at least 10 minutes continuously to get to and from places?
Number of days└─┘
P8
87 How much time do you spend walking or bicycling for travel on a typical day? Hours: minutes
└─┴─┘: └─┴─┘
hrs mins
P9 (a-b)
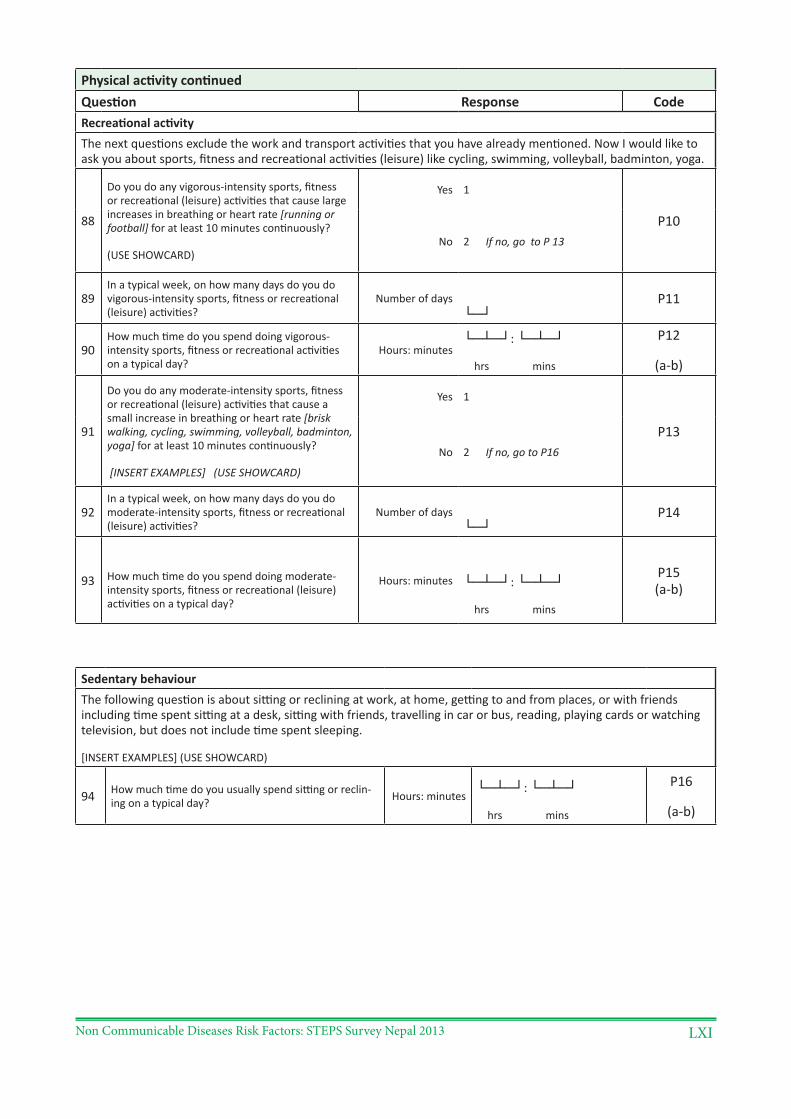
Non Communicable Diseases Risk Factors: STEPS Survey Nepal 2013 LXI
Physical activity continuedQuestion Response CodeRecreational activityThe next questions exclude the work and transport activities that you have already mentioned. Now I would like to ask you about sports, fitness and recreational activities (leisure) like cycling, swimming, volleyball, badminton, yoga.
88
Do you do any vigorous-intensity sports, fitness or recreational (leisure) activities that cause large increases in breathing or heart rate [running or football] for at least 10 minutes continuously?
(USE SHOWCARD)
Yes 1
P10No 2 If no, go to P 13
89In a typical week, on how many days do you do vigorous-intensity sports, fitness or recreational (leisure) activities?
Number of days└─┘
P11
90How much time do you spend doing vigorous-intensity sports, fitness or recreational activities on a typical day?
Hours: minutes└─┴─┘: └─┴─┘
hrs mins
P12
(a-b)
91
Do you do any moderate-intensity sports, fitness or recreational (leisure) activities that cause a small increase in breathing or heart rate [brisk walking, cycling, swimming, volleyball, badminton, yoga] for at least 10 minutes continuously?
[INSERT EXAMPLES] (USE SHOWCARD)
Yes 1
P13No 2 If no, go to P16
92In a typical week, on how many days do you do moderate-intensity sports, fitness or recreational (leisure) activities?
Number of days└─┘
P14
93 How much time do you spend doing moderate-intensity sports, fitness or recreational (leisure) activities on a typical day?
Hours: minutes └─┴─┘: └─┴─┘
hrs mins
P15 (a-b)
Sedentary behaviourThe following question is about sitting or reclining at work, at home, getting to and from places, or with friends including time spent sitting at a desk, sitting with friends, travelling in car or bus, reading, playing cards or watching television, but does not include time spent sleeping.
[INSERT EXAMPLES] (USE SHOWCARD)
94 How much time do you usually spend sitting or reclin-ing on a typical day? Hours: minutes
└─┴─┘: └─┴─┘
hrs mins
P16
(a-b)
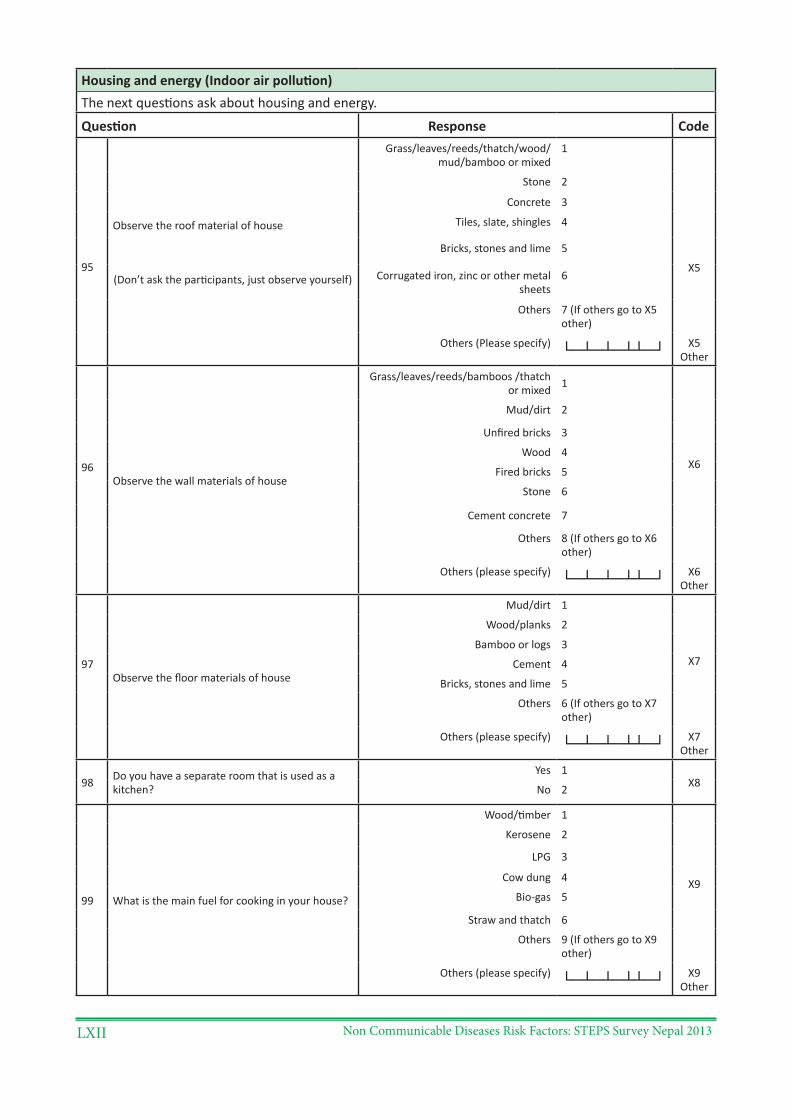
Non Communicable Diseases Risk Factors: STEPS Survey Nepal 2013LXII
Housing and energy (Indoor air pollution)The next questions ask about housing and energy.
Question Response Code
95
Observe the roof material of house
(Don’t ask the participants, just observe yourself)
Grass/leaves/reeds/thatch/wood/mud/bamboo or mixed
1
X5
Stone 2
Concrete 3
Tiles, slate, shingles 4
Bricks, stones and lime 5
Corrugated iron, zinc or other metal sheets
6
Others 7 (If others go to X5 other)
Others (Please specify) └─┴─┴─┴┴─┘ X5 Other
96Observe the wall materials of house
Grass/leaves/reeds/bamboos /thatch or mixed 1
X6
Mud/dirt 2
Unfired bricks 3
Wood 4
Fired bricks 5
Stone 6
Cement concrete 7
Others 8 (If others go to X6 other)
Others (please specify) └─┴─┴─┴┴─┘ X6 Other
97Observe the floor materials of house
Mud/dirt 1
X7
Wood/planks 2
Bamboo or logs 3
Cement 4
Bricks, stones and lime 5
Others 6 (If others go to X7 other)
Others (please specify) └─┴─┴─┴┴─┘ X7 Other
98 Do you have a separate room that is used as a kitchen?
Yes 1X8 No 2
99 What is the main fuel for cooking in your house?
Wood/timber 1
X9
Kerosene 2
LPG 3
Cow dung 4
Bio-gas 5
Straw and thatch 6
Others 9 (If others go to X9 other)
Others (please specify) └─┴─┴─┴┴─┘ X9 Other
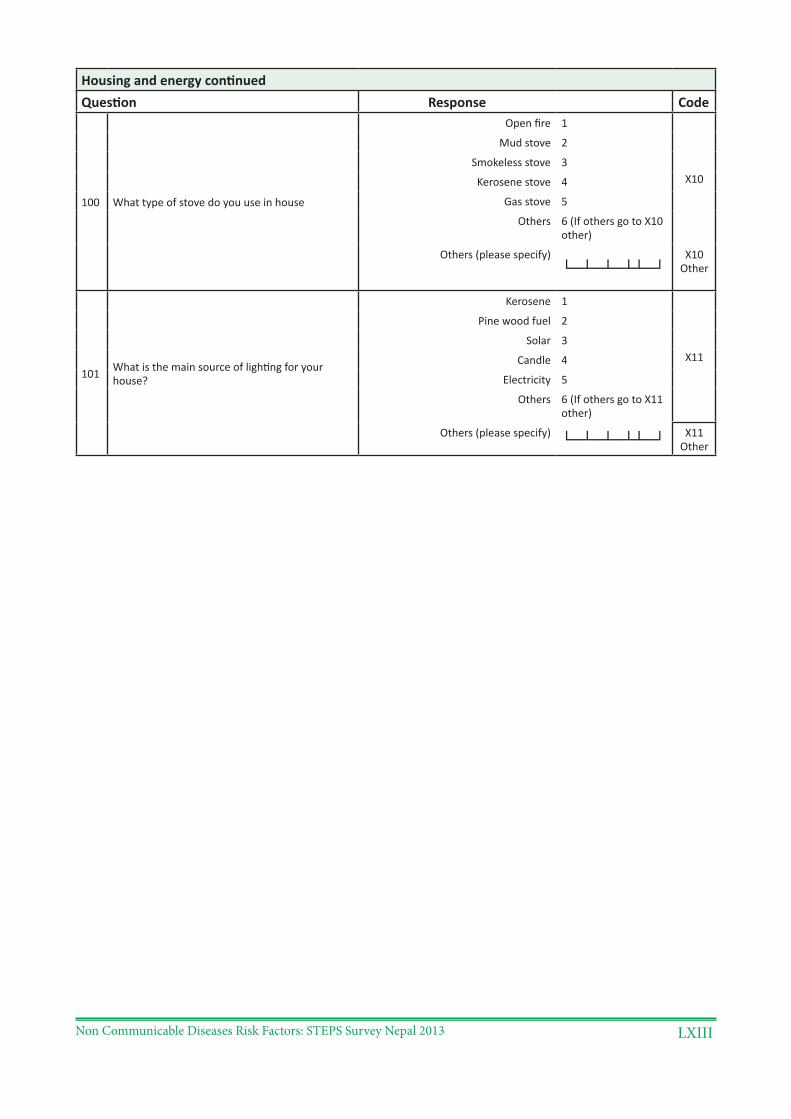
Non Communicable Diseases Risk Factors: STEPS Survey Nepal 2013 LXIII
Housing and energy continuedQuestion Response Code
100 What type of stove do you use in house
Open fire 1
X10
Mud stove 2
Smokeless stove 3
Kerosene stove 4
Gas stove 5
Others 6 (If others go to X10 other)
Others (please specify)└─┴─┴─┴┴─┘
X10 Other
101 What is the main source of lighting for your house?
Kerosene 1
X11
Pine wood fuel 2
Solar 3
Candle 4
Electricity 5
Others 6 (If others go to X11 other)
Others (please specify) └─┴─┴─┴┴─┘ X11 Other
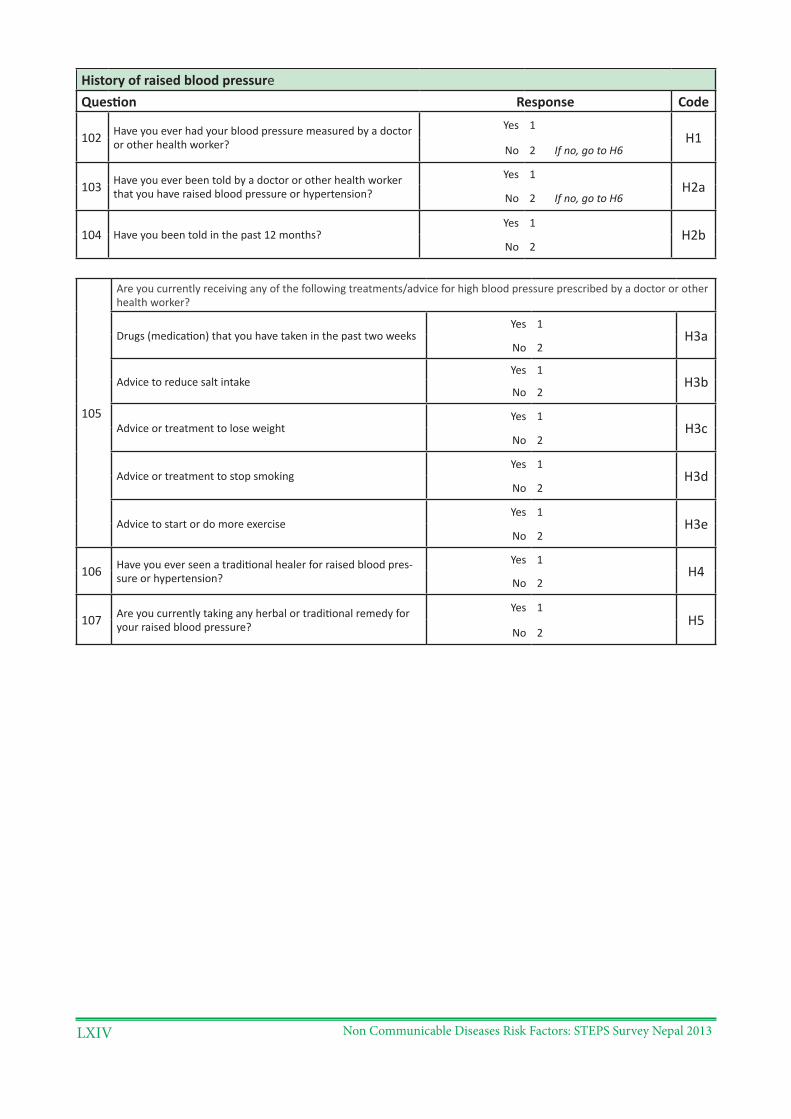
Non Communicable Diseases Risk Factors: STEPS Survey Nepal 2013LXIV
History of raised blood pressureQuestion Response Code
102 Have you ever had your blood pressure measured by a doctor or other health worker?
Yes 1H1
No 2 If no, go to H6
103 Have you ever been told by a doctor or other health worker that you have raised blood pressure or hypertension?
Yes 1H2a
No 2 If no, go to H6
104 Have you been told in the past 12 months?Yes 1
H2bNo 2
105
Are you currently receiving any of the following treatments/advice for high blood pressure prescribed by a doctor or other health worker?
Drugs (medication) that you have taken in the past two weeksYes 1
H3aNo 2
Advice to reduce salt intakeYes 1
H3bNo 2
Advice or treatment to lose weightYes 1
H3cNo 2
Advice or treatment to stop smokingYes 1
H3dNo 2
Advice to start or do more exerciseYes 1
H3eNo 2
106 Have you ever seen a traditional healer for raised blood pres-sure or hypertension?
Yes 1H4
No 2
107 Are you currently taking any herbal or traditional remedy for your raised blood pressure?
Yes 1H5
No 2
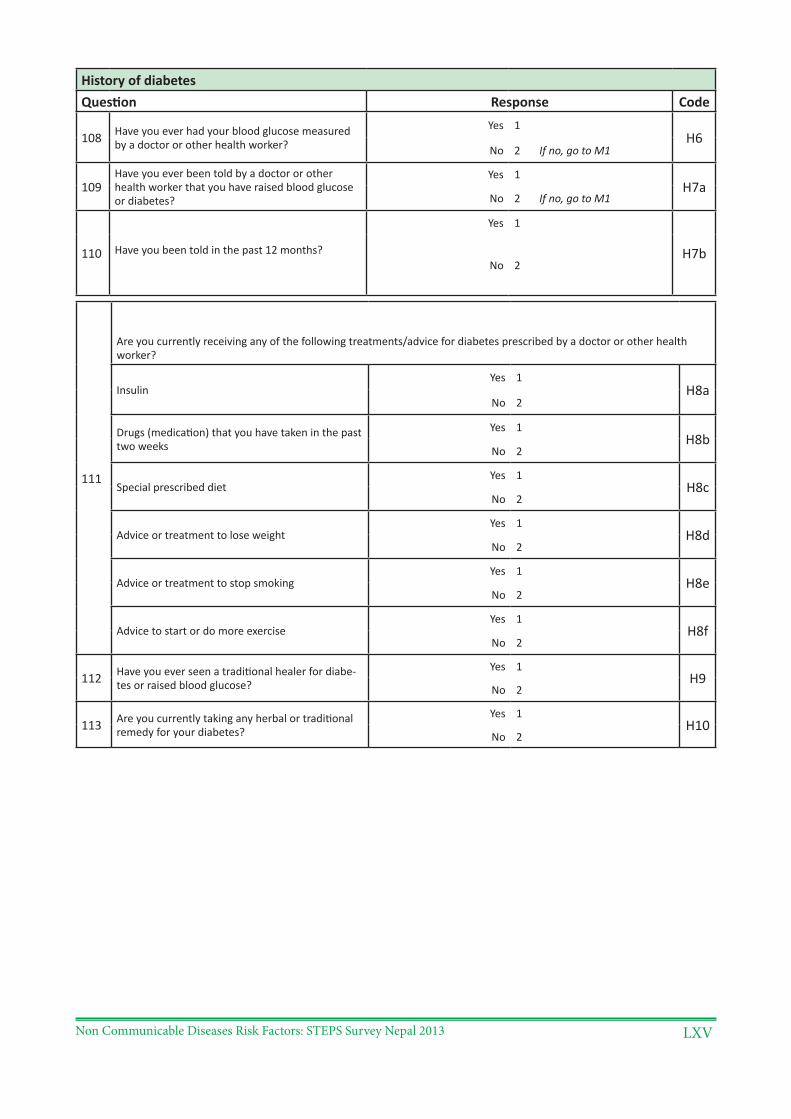
Non Communicable Diseases Risk Factors: STEPS Survey Nepal 2013 LXV
History of diabetesQuestion Response Code
108 Have you ever had your blood glucose measured by a doctor or other health worker?
Yes 1H6
No 2 If no, go to M1
109Have you ever been told by a doctor or other health worker that you have raised blood glucose or diabetes?
Yes 1H7a
No 2 If no, go to M1
110 Have you been told in the past 12 months?
Yes 1
H7bNo 2
111
Are you currently receiving any of the following treatments/advice for diabetes prescribed by a doctor or other health worker?
InsulinYes 1
H8aNo 2
Drugs (medication) that you have taken in the past two weeks
Yes 1H8b
No 2
Special prescribed dietYes 1
H8cNo 2
Advice or treatment to lose weightYes 1
H8dNo 2
Advice or treatment to stop smokingYes 1
H8eNo 2
Advice to start or do more exerciseYes 1
H8fNo 2
112 Have you ever seen a traditional healer for diabe-tes or raised blood glucose?
Yes 1H9
No 2
113 Are you currently taking any herbal or traditional remedy for your diabetes?
Yes 1H10
No 2
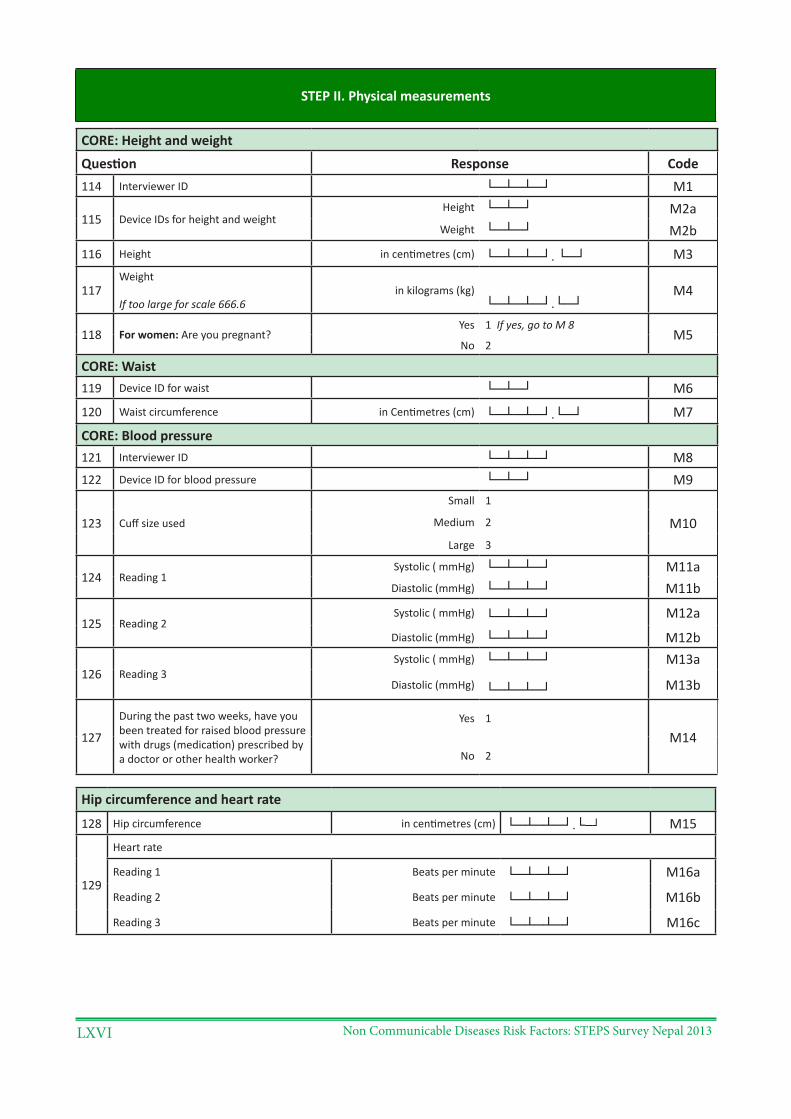
Non Communicable Diseases Risk Factors: STEPS Survey Nepal 2013LXVI
STEP II. Physical measurements
CORE: Height and weight
Question Response Code114 Interviewer ID └─┴─┴─┘ M1
115 Device IDs for height and weightHeight └─┴─┘ M2a
Weight └─┴─┘ M2b116 Height in centimetres (cm) └─┴─┴─┘. └─┘ M3
117Weight
If too large for scale 666.6in kilograms (kg)
└─┴─┴─┘.└─┘M4
118 For women: Are you pregnant?Yes 1 If yes, go to M 8
M5No 2
CORE: Waist119 Device ID for waist └─┴─┘ M6
120 Waist circumference in Centimetres (cm) └─┴─┴─┘.└─┘ M7
CORE: Blood pressure121 Interviewer ID └─┴─┴─┘ M8122 Device ID for blood pressure └─┴─┘ M9
123 Cuff size used
Small 1
M10Medium 2
Large 3
124 Reading 1Systolic ( mmHg) └─┴─┴─┘ M11aDiastolic (mmHg) └─┴─┴─┘ M11b
125 Reading 2Systolic ( mmHg) └─┴─┴─┘ M12a
Diastolic (mmHg) └─┴─┴─┘ M12b
126 Reading 3Systolic ( mmHg) └─┴─┴─┘ M13a
Diastolic (mmHg) └─┴─┴─┘ M13b
127
During the past two weeks, have you been treated for raised blood pressure with drugs (medication) prescribed by a doctor or other health worker?
Yes 1
M14No 2
Hip circumference and heart rate
128 Hip circumference in centimetres (cm) └─┴─┴─┘.└─┘ M15
129
Heart rate
Reading 1 Beats per minute └─┴─┴─┘ M16a
Reading 2 Beats per minute └─┴─┴─┘ M16b
Reading 3 Beats per minute └─┴─┴─┘ M16c
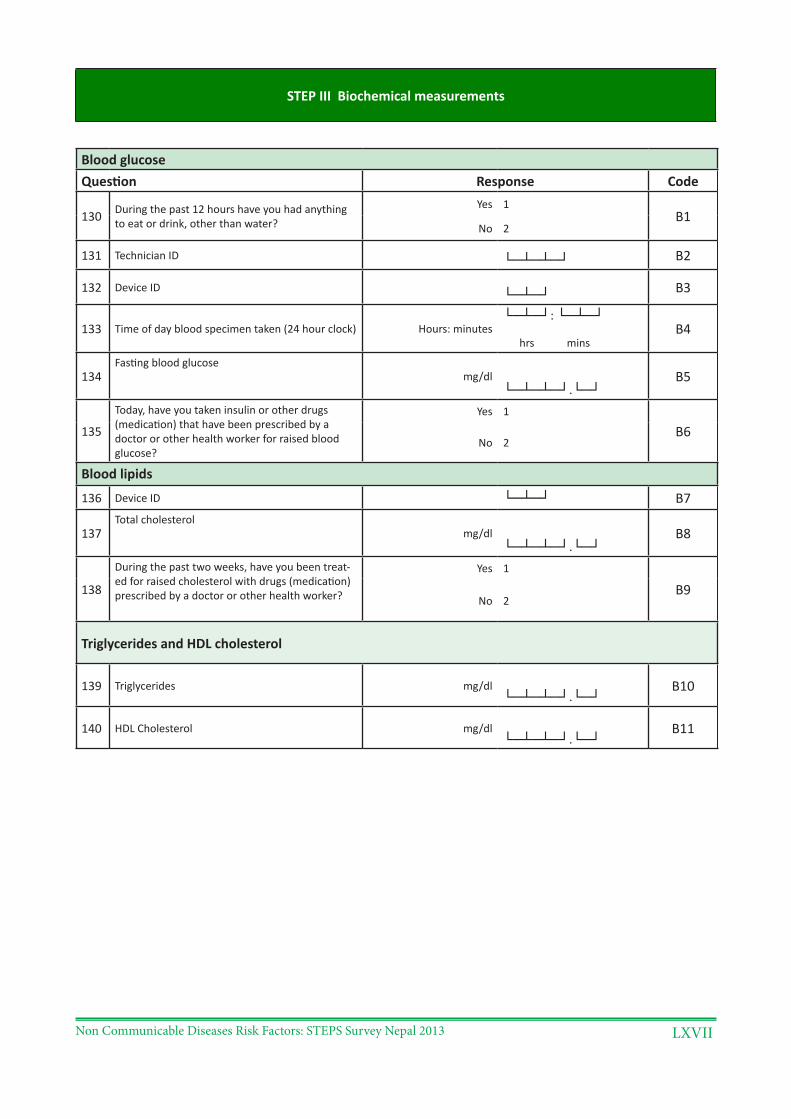
Non Communicable Diseases Risk Factors: STEPS Survey Nepal 2013 LXVII
STEP III Biochemical measurements
Blood glucoseQuestion Response Code
130 During the past 12 hours have you had anything to eat or drink, other than water?
Yes 1B1
No 2
131 Technician ID └─┴─┴─┘ B2
132 Device ID └─┴─┘ B3
133 Time of day blood specimen taken (24 hour clock) Hours: minutes└─┴─┘: └─┴─┘
hrs minsB4
134Fasting blood glucose
mg/dl└─┴─┴─┘.└─┘
B5
135
Today, have you taken insulin or other drugs (medication) that have been prescribed by a doctor or other health worker for raised blood glucose?
Yes 1
B6No 2
Blood lipids
136 Device ID └─┴─┘ B7
137Total cholesterol
mg/dl└─┴─┴─┘.└─┘
B8
138
During the past two weeks, have you been treat-ed for raised cholesterol with drugs (medication) prescribed by a doctor or other health worker?
Yes 1
B9No 2
Triglycerides and HDL cholesterol
139 Triglycerides mg/dl└─┴─┴─┘.└─┘
B10
140 HDL Cholesterol mg/dl└─┴─┴─┘.└─┘
B11
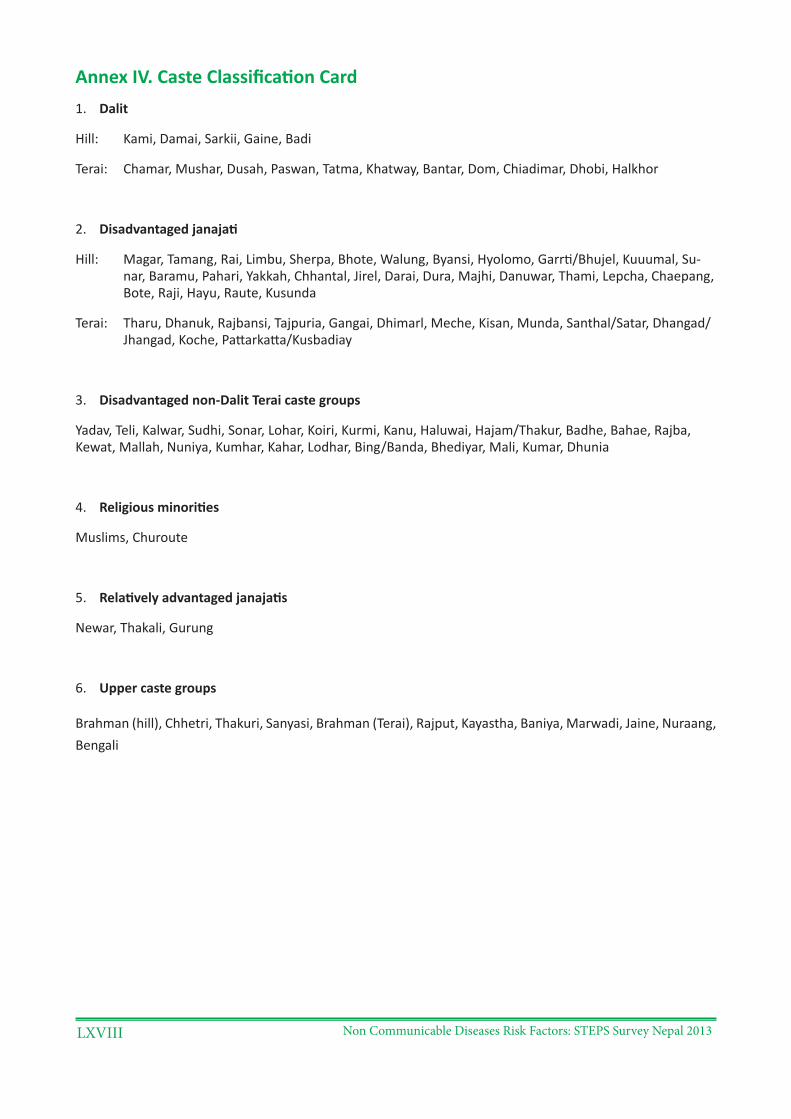
Non Communicable Diseases Risk Factors: STEPS Survey Nepal 2013LXVIII
Annex IV. Caste Classification Card1. Dalit
Hill: Kami, Damai, Sarkii, Gaine, Badi
Terai: Chamar, Mushar, Dusah, Paswan, Tatma, Khatway, Bantar, Dom, Chiadimar, Dhobi, Halkhor
2. Disadvantaged janajati
Hill: Magar, Tamang, Rai, Limbu, Sherpa, Bhote, Walung, Byansi, Hyolomo, Garrti/Bhujel, Kuuumal, Su-nar, Baramu, Pahari, Yakkah, Chhantal, Jirel, Darai, Dura, Majhi, Danuwar, Thami, Lepcha, Chaepang, Bote, Raji, Hayu, Raute, Kusunda
Terai: Tharu, Dhanuk, Rajbansi, Tajpuria, Gangai, Dhimarl, Meche, Kisan, Munda, Santhal/Satar, Dhangad/Jhangad, Koche, Pattarkatta/Kusbadiay
3. Disadvantaged non-Dalit Terai caste groups
Yadav, Teli, Kalwar, Sudhi, Sonar, Lohar, Koiri, Kurmi, Kanu, Haluwai, Hajam/Thakur, Badhe, Bahae, Rajba, Kewat, Mallah, Nuniya, Kumhar, Kahar, Lodhar, Bing/Banda, Bhediyar, Mali, Kumar, Dhunia
4. Religious minorities
Muslims, Churoute
5. Relatively advantaged janajatis
Newar, Thakali, Gurung
6. Upper caste groups
Brahman (hill), Chhetri, Thakuri, Sanyasi, Brahman (Terai), Rajput, Kayastha, Baniya, Marwadi, Jaine, Nuraang, Bengali
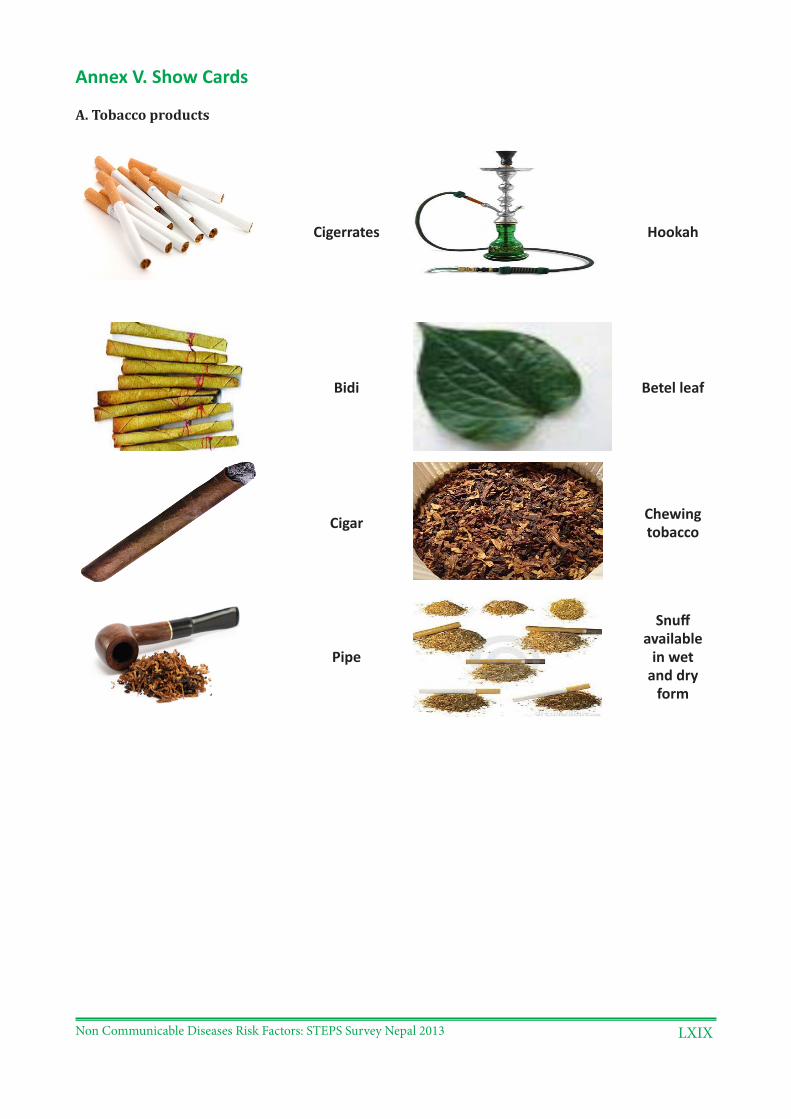
Non Communicable Diseases Risk Factors: STEPS Survey Nepal 2013 LXIX
Annex V. Show Cards
A. Tobacco products
Cigerrates Hookah
Bidi Betel leaf
Cigar Chewing tobacco
Pipe
Snuff available
in wet and dry
form
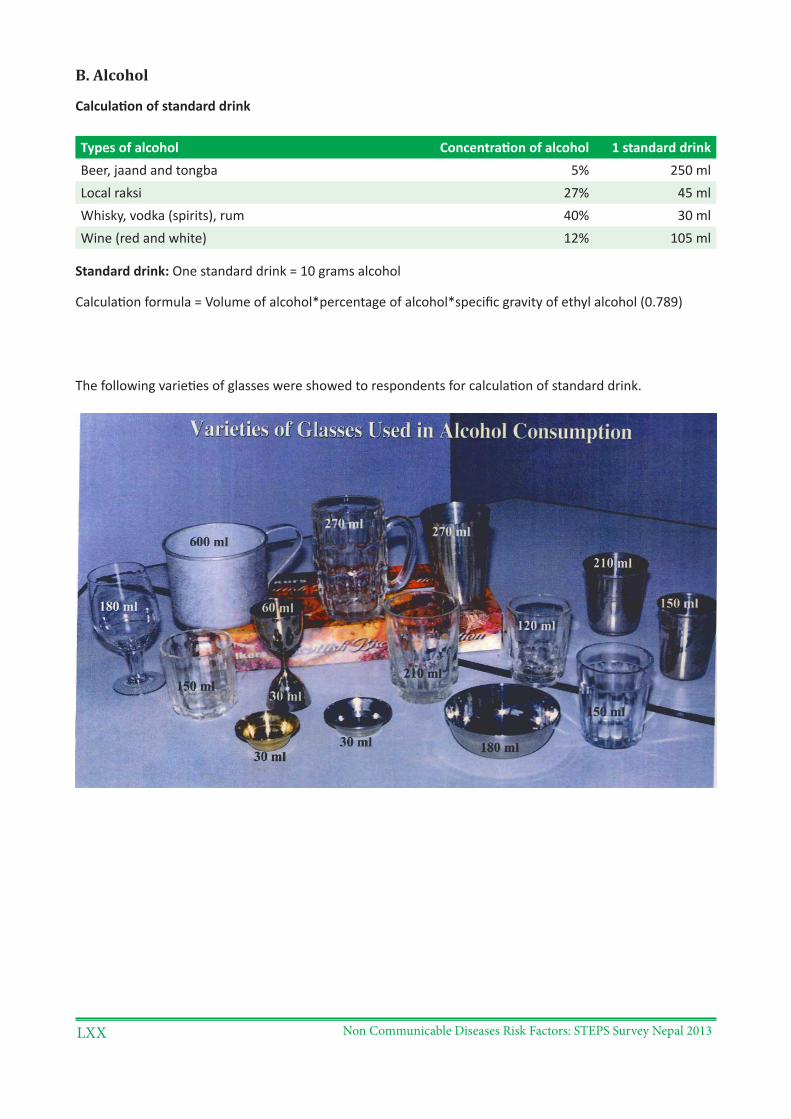
Non Communicable Diseases Risk Factors: STEPS Survey Nepal 2013LXX
B. Alcohol
Calculation of standard drink
Types of alcohol Concentration of alcohol 1 standard drinkBeer, jaand and tongba 5% 250 mlLocal raksi 27% 45 mlWhisky, vodka (spirits), rum 40% 30 mlWine (red and white) 12% 105 ml
Standard drink: One standard drink = 10 grams alcohol
Calculation formula = Volume of alcohol*percentage of alcohol*specific gravity of ethyl alcohol (0.789)
The following varieties of glasses were showed to respondents for calculation of standard drink.
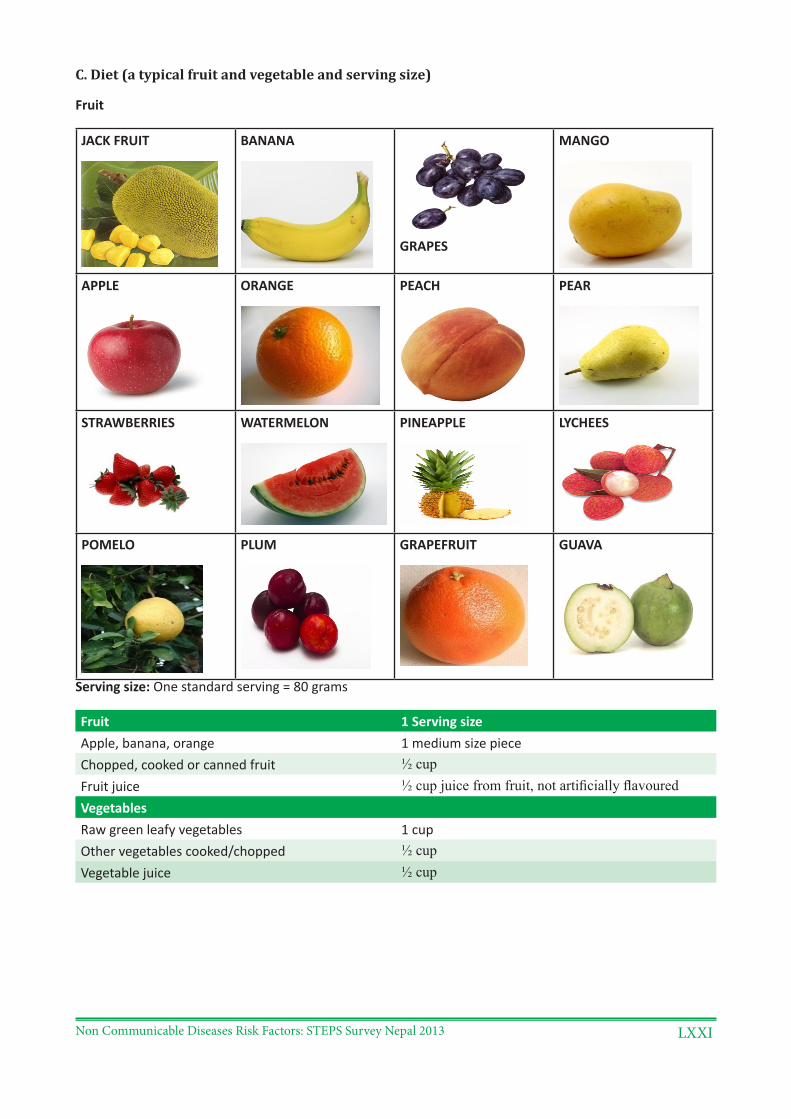
Non Communicable Diseases Risk Factors: STEPS Survey Nepal 2013 LXXI
C. Diet (a typical fruit and vegetable and serving size)
Fruit
JACK FRUIT BANANA
GRAPES
MANGO
APPLE ORANGE PEACH PEAR
STRAWBERRIES WATERMELON PINEAPPLE LYCHEES
POMELO PLUM GRAPEFRUIT GUAVA
Serving size: One standard serving = 80 grams
Fruit 1 Serving sizeApple, banana, orange 1 medium size pieceChopped, cooked or canned fruit ½ cupFruit juice ½ cup juice from fruit, not artificially flavouredVegetablesRaw green leafy vegetables 1 cupOther vegetables cooked/chopped ½ cupVegetable juice ½ cup
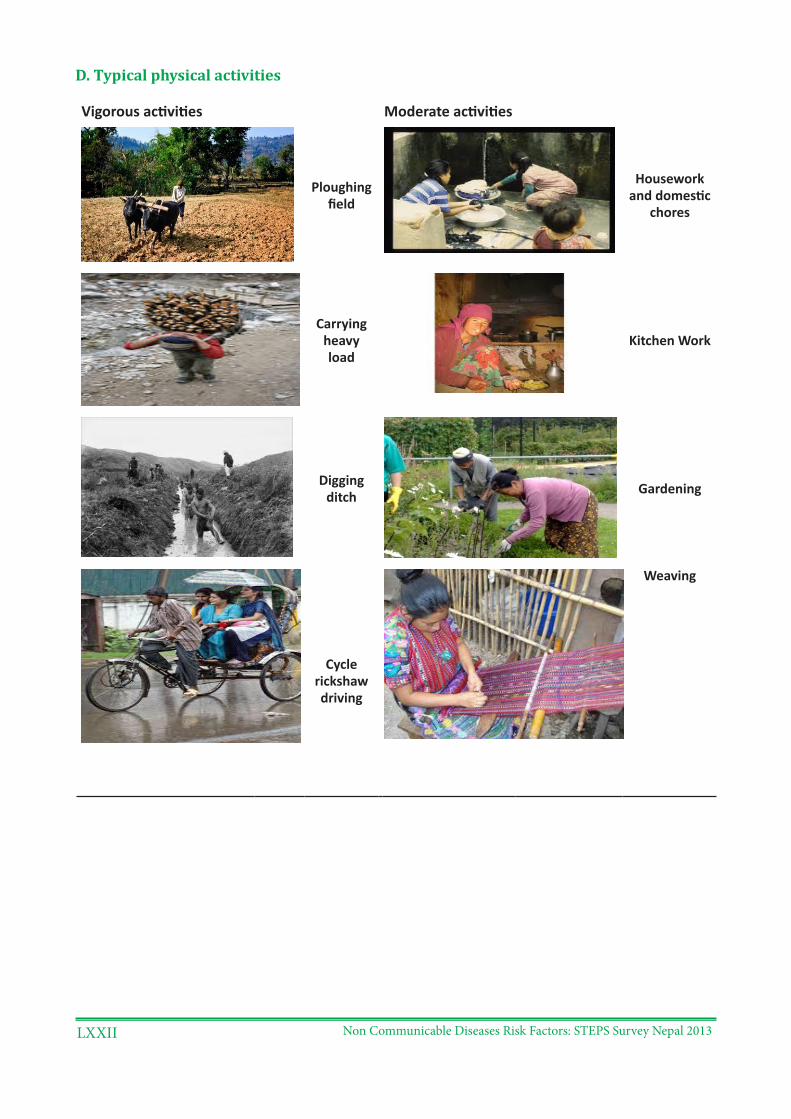
Non Communicable Diseases Risk Factors: STEPS Survey Nepal 2013LXXII
D. Typical physical activities
Vigorous activities Moderate activities
Ploughing field
Housework and domestic
chores
Carrying heavy load
Kitchen Work
Digging ditch Gardening
Cycle rickshaw driving
Weaving
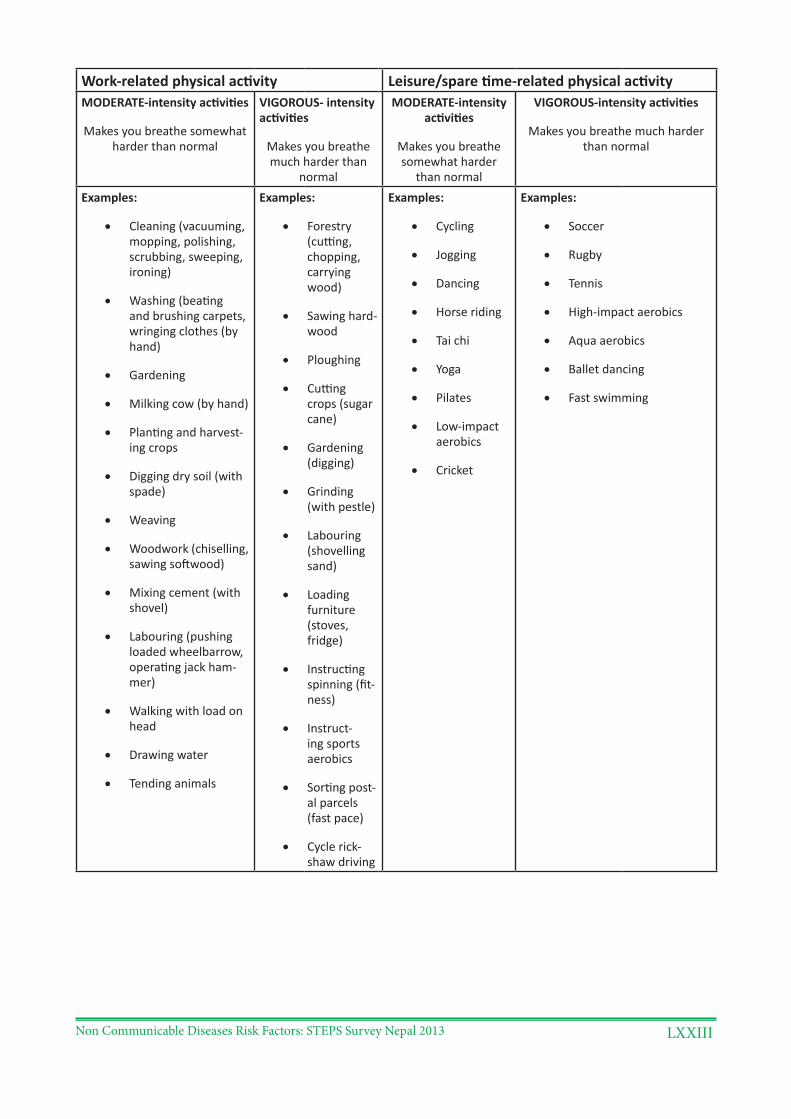
Non Communicable Diseases Risk Factors: STEPS Survey Nepal 2013 LXXIII
Work-related physical activity Leisure/spare time-related physical activityMODERATE-intensity activities
Makes you breathe somewhat harder than normal
VIGOROUS- intensity activities
Makes you breathe much harder than
normal
MODERATE-intensity activities
Makes you breathe somewhat harder
than normal
VIGOROUS-intensity activities
Makes you breathe much harder than normal
Examples:
• Cleaning (vacuuming, mopping, polishing, scrubbing, sweeping, ironing)
• Washing (beating and brushing carpets, wringing clothes (by hand)
• Gardening
• Milking cow (by hand)
• Planting and harvest-ing crops
• Digging dry soil (with spade)
• Weaving
• Woodwork (chiselling, sawing softwood)
• Mixing cement (with shovel)
• Labouring (pushing loaded wheelbarrow, operating jack ham-mer)
• Walking with load on head
• Drawing water
• Tending animals
Examples:
• Forestry (cutting, chopping, carrying wood)
• Sawing hard-wood
• Ploughing
• Cutting crops (sugar cane)
• Gardening (digging)
• Grinding (with pestle)
• Labouring (shovelling sand)
• Loading furniture (stoves, fridge)
• Instructing spinning (fit-ness)
• Instruct-ing sports aerobics
• Sorting post-al parcels (fast pace)
• Cycle rick-shaw driving
Examples:
• Cycling
• Jogging
• Dancing
• Horse riding
• Tai chi
• Yoga
• Pilates
• Low-impact aerobics
• Cricket
Examples:
• Soccer
• Rugby
• Tennis
• High-impact aerobics
• Aqua aerobics
• Ballet dancing
• Fast swimming
Non Communicable Diseases Risk Factors: STEPS Survey Nepal 2013LXXIV
Annex VI: Reference LaboratoriesNational Public Health Laboratory, Kathmandu, Nepal
Kantipur Hospital, Kathmandu, Nepal
BP Koirala Institute of Health Science (BPKIHS), Dharan, Nepal
BP Koirala Cancer Hospital, Chitwan, Nepal
Nepalgunj Medical College, Koholpur, Nepal
Manipal Medical College, Pokhara, Nepal
�������
������
�����
������
������
���� �
����������
����
������
���
�������������������������
��������� ����
�������������������
������������
������������������������������ �����
���������� ����� �������������
�������� ����������������� ��������
�����������������������
����� ������������������
�������
��������
������
�������� ������������
�������
�������������������
�������������������������
������������
�����������������
������� ������
�����
�����
� ��������
�������
���������
�����
�����
� ��������
�������
���������
�������� �� �����
�������� �� ������ �� ����������
� ������������������ �
������� ������ ��� ���������� ������ �������� �������