Embed Size (px)
Citation preview
2015年 5月 21日 www.oecd.org/social/inequality-and-poverty.htm
格差縮小に向けて なぜ格差縮小は皆の利益となり得るか。
日本カントリーノート
問題点とは?
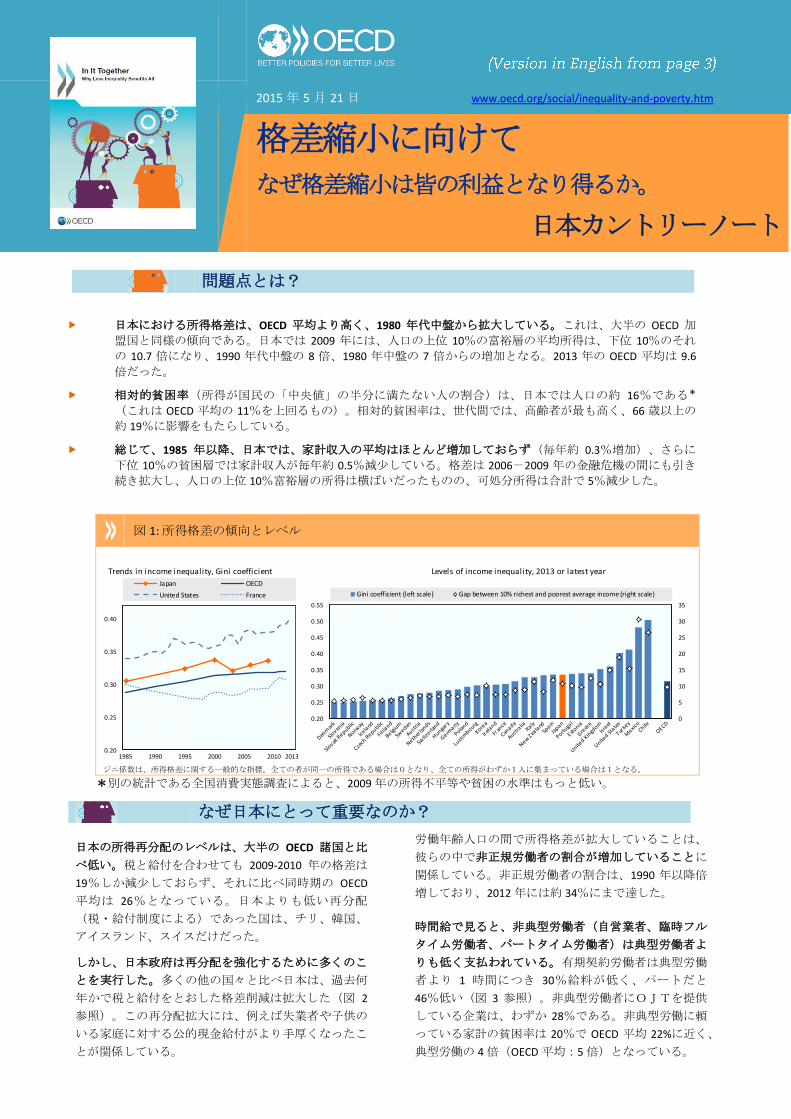
日本における所得格差は、OECD 平均より高く、1980 年代中盤から拡大している。これは、大半の OECD 加
盟国と同様の傾向である。日本では 2009 年には、人口の上位 10%の富裕層の平均所得は、下位 10%のそれ
の 10.7 倍になり、1990 年代中盤の 8 倍、1980 年中盤の 7 倍からの増加となる。2013 年の OECD 平均は 9.6
倍だった。
相対的貧困率(所得が国民の「中央値」の半分に満たない人の割合)は、日本では人口の約 16%である*
(これは OECD 平均の 11%を上回るもの)。相対的貧困率は、世代間では、高齢者が最も高く、66 歳以上の
約 19%に影響をもたらしている。
総じて、1985 年以降、日本では、家計収入の平均はほとんど増加しておらず(毎年約 0.3%増加)、さらに
下位 10%の貧困層では家計収入が毎年約 0.5%減少している。格差は 2006-2009 年の金融危機の間にも引き
続き拡大し、人口の上位 10%富裕層の所得は横ばいだったものの、可処分所得は合計で 5%減少した。
図 1: 所得格差の傾向とレベル
ジニ係数は、所得格差に関する一般的な指標。全ての者が同一の所得である場合は0となり、全ての所得がわずか1人に集まっている場合は1となる。
*別の統計である全国消費実態調査によると、2009年の所得不平等や貧困の水準はもっと低い。
日本の所得再分配のレベルは、大半の OECD 諸国と比
べ低い。税と給付を合わせても 2009-2010 年の格差は
19%しか減少しておらず、それに比べ同時期の OECD
平均は 26%となっている。日本よりも低い再分配
(税・給付制度による)であった国は、チリ、韓国、
アイスランド、スイスだけだった。
しかし、日本政府は再分配を強化するために多くのこ
とを実行した。多くの他の国々と比べ日本は、過去何
年かで税と給付をとおした格差削減は拡大した(図 2
参照)。この再分配拡大には、例えば失業者や子供の
いる家庭に対する公的現金給付がより手厚くなったこ
とが関係している。
労働年齢人口の間で所得格差が拡大していることは、
彼らの中で非正規労働者の割合が増加していることに
関係している。非正規労働者の割合は、1990 年以降倍
増しており、2012年には約 34%にまで達した。
時間給で見ると、非典型労働者(自営業者、臨時フル
タイム労働者、パートタイム労働者)は典型労働者よ
りも低く支払われている。有期契約労働者は典型労働
者より 1 時間につき 30%給料が低く、パートだと
46%低い(図 3 参照)。非典型労働者にOJTを提供
している企業は、わずか 28%である。非典型労働に頼
っている家計の貧困率は 20%で OECD 平均 22%に近く、
典型労働の 4倍(OECD平均:5倍)となっている。
Levels of income inequality, 2013 or latest yearTrends in income inequality, Gini coefficient
0
5
10
15
20
25
30
35
0.20
0.25
0.30
0.35
0.40
0.45
0.50
0.55
Gini coefficient (left scale) Gap between 10% richest and poorest average income (right scale)
0.20
0.25
0.30
0.35
0.40
1985 1990 1995 2000 2005 2010 2013
Japan OECD
United States France
なぜ日本にとって重要なのか?

税・給付制度は、被扶養者である配偶者が所得税を払
わなくてよくなるため、女性の所得を増やす動機を削
ぐ。これが一つの原因で、日本では非典型労働者の
64%が家計の第二の稼ぎ手であって、これは OECD の
中で最も高い割合であり、また、日本では他の国より
も多くの低賃金労働者がより高い世帯所得階層に含ま
れる。
自営業及びパート労働者(週 20 時間未満の労働)に
は、失業手当を受ける資格がない。非正規労働者の 3
分の 2 しか雇用保険に加入しておらず、職場ベースの
健康・社会保険に加入しているのは半数以下である。
より一般的に、日本では 2010 年時点で、税・給付制
度は、パートタイム労働からフルタイム労働への移行
を阻んでいる。追加収入の 3 分の 2 以上が、減らされ
た給付(特に住宅給付)やより高い税金にとられてし
まうからだ。
図 2: 現金給付と所得税による再分配
図 3: 典型と非典型労働者の時間給中間値の比(典型労働者を
1とした場合)。2012年。
再分配の割合は、生産年齢人口における再分配前後のジニ係数の差
により算出される。
政策決定者に求められることとは?
格差に対応し、万人への機会均等を推進するためには、各国政府は包括的な政策パッケージを取り入れるべきである。
そのパッケージには以下の 4 つの主要分野が中核となるべきである:女性の労働市場参入を一層推進すること、雇用機
会を強化するとともに質の良い仕事を提供すること、質の良い教育やスキル開発、仕事における適応を強化すること、
より効果的な再分配のためにより良い税・給付制度を構築することである。日本において、これらを実現するためには
以下のようなイニシアチブが必要となる。
職場ベースの社会保険制度によって非正規労働者の社会保障を拡大する。そのためには例えばコンプライアンス
の向上や、フルタイムに近い実質労働時間のパートタイムへの適用拡大などがあげられる。
非正規労働者が正規労働に移行しやすくするために研修機会を推進したり、昇進ができるように日本版職業能力
評価制度を構築する。
特に家計における第二の稼ぎ手に働く意欲を与えるために、就業中の給付や財政措置を強化する。
利用しやすい保育を増やし、父親に育児休暇取得を推進する等、仕事と家庭のバランスを改善できるような対策
を発展させることで、女性の労働市場参加を増やす。
低所得者のために勤労所得税額控除の導入を検討する。
10%
15%
20%
25%
30%
35%
40%
45%
1985 1990 1995 2000 2005 2012
0
0.1
0.2
0.3
0.4
0.5
0.6
0.7
0.8
0.9
1
1.1
1.2
Full-time temporary (↘) Part-time permanent Part-time temporary

May 21
st 2015 www.oecd.org/social/inequality-and-poverty.htm
In It Together
Why Less Inequality Benefits All
…in Japan
What is the issue?
Income inequality in Japan is above the OECD average and increased since the mid-1980s, as in the majority of OECD countries. In 2009, the average income of the top 10% of Japanese was 10.7 times that of the bottom 10%, up from a ratio of 8 to 1 in the mid-1990s and 7 to 1 in the mid-1980s. This compares to an OECD average of 9.6 to 1 in 2013.
Income poverty (measured as half of the national median household income), concerns around 16% of the population in Japan, a rate that is also above the OECD average of 11% *. Across age groups, the income poverty rate is highest among senior citizens (above 66 years of age), affecting about 19% of them.
Overall, since 1985 real average household income increased little in Japan (about 0.3% per year), while for the poorest 10% it actually fell, by about 0.5% per annum. Inequality continued to increase during the crisis period (2006 – 2009) as real disposable income fell by a cumulated 5%, while the income of the top 10% remained stable.
Figure 1: Trends and levels of disposable income inequality
The Gini coefficient is a common measure of income inequality that scores 0 when everybody has identical incomes and 1 when all the income goes to only one person.
* Other surveys, such as the National Survey of Family Income and Expenditure, suggest lower levels of income inequality and poverty in 2009.
Why is it important for Japan?
The level of redistribution is lower in Japan than in most
OECD countries. Taxes and benefits together reduced
inequality by 19% in 2009-10, compared to the OECD
average of 26%. Only Chile, Korea, Iceland and Switzerland
achieved lower redistribution via the tax/benefit system.
However, the Japanese government has done much to
strengthen redistribution: contrary to many other
countries, the reduction in inequality through taxes and
transfers increased over the years (Figure 2). This
strengthening is linked to a higher weight of public cash
transfers, such as more generous income support for the
unemployed or families with children.
Rising income inequality among the working-age population
is related to the increasing share of non-regular workers.
Their share in employment doubled since 1990, up to
almost 34% in 2012.
Non-standard workers (self-employed, temporary full-
time, part-time employees) earn lower hourly wages than
standard workers: workers on temporary contracts earn
30% less per hour than those on standard contracts, while
the pay gap reaches 46% for part-time workers (Figure 3).
Only 28% of firms provide on-the-job training for non-
standard workers. Poverty rates for households relying on
non-standard work are 20%, close to the OECD average of
22%. That is 4 times higher than for standard work
Levels of income inequality, 2013 or latest yearTrends in income inequality, Gini coefficient
0
5
10
15
20
25
30
35
0.20
0.25
0.30
0.35
0.40
0.45
0.50
0.55
Gini coefficient (left scale) Gap between 10% richest and poorest average income (right scale)
0.20
0.25
0.30
0.35
0.40
1985 1990 1995 2000 2005 2010 2013
Japan OECD
United States France

households, compared with 5 times higher for the OECD
average.
Women are overrepresented in non-standard work,
comprising more than 60% of non-standard workers. In the
dual Japanese labour market, women often end up in
relatively lowly-paid non-standard employment. The
tax/benefit system creates disincentives for dependent
spouses to increase earnings in order to avoid paying
income tax. This is one of the reasons why Japan is the
OECD country with the highest share of secondary earners
among non-standard workers, at 64%, and why Japan is
where more low-paid individuals are to be found in higher
income brackets than elsewhere.
Self-employed and part-time workers (below 20 hours per
week) do not qualify for job seekers allowance. Only two-
thirds of non-regular workers make Employment Insurance
contributions and less than half pay work-related health
and social insurance contributions.
More generally, as of 2010 the tax and benefit system
discourages the transition from part-time to full-time
work in Japan as over two-thirds of additional earnings
would be taken away by reduced benefits, in particular
housing benefits, and by higher taxes.
Figure 2: Redistribution due to cash transfers and income taxes
Figure 3: Median hourly earnings ratio, between standard and non-standard employees (standard workers = 1), in 2012
Redistribution is measured as the percentage difference between inequality (Gini coefficient) of gross market income and inequality of disposable income for the working-age population.
What can policy makers do?
To tackle inequality and promote opportunities for all, countries should adopt a comprehensive policy package, centred around four main areas: Promoting greater participation of women into the labour market, fostering employment opportunities and good-quality jobs; strengthening quality education and skills development and adaptation during the working life; and a better design of tax and benefits systems for efficient redistribution. In Japan, this would include initiatives such as:
Expand the social protection coverage of non-regular workers by workplace-based social insurance systems, notably by improving compliance and by extension to part-time work with actual hours close to full-time hours;
Promote training opportunities for non-regular workers to enhance the transition to regular employment, and step up plans to create a Japanese national vocational qualification system;
Strengthen in-work benefits and fiscal measures that increase work incentives, especially for second earners;
Increase the availability of affordable child care and develop measures to encourage a better work and family balance such as promoting fathers to take paternity leave, to increase female labour force participation.
Consider introducing an earned-income tax credit for low-wage workers
10%
15%
20%
25%
30%
35%
40%
45%
1985 1990 1995 2000 2005 2012
0
0.1
0.2
0.3
0.4
0.5
0.6
0.7
0.8
0.9
1
1.1
1.2
Full-time temporary (↘) Part-time permanent Part-time temporary


![男女の雇用格差と賃金格差 - JIL€¦ · Ⅱ 雇用格差の経済学 男女の雇用格差を検討している経済理論として, Becker [971] やMadden [1975], Phelps](https://img.pdfslide.tips/doc/110x75/5f05c4d17e708231d4149cee/cecefe-jil-a-eccoe-cecoeecoece.jpg)