Embed Size (px)
Citation preview
I. ESG Initiatives / Vision & Policy III. Social IV. Governance VI. ESG DataV. ESG Initiatives / Overseas BusinessII. Environmental
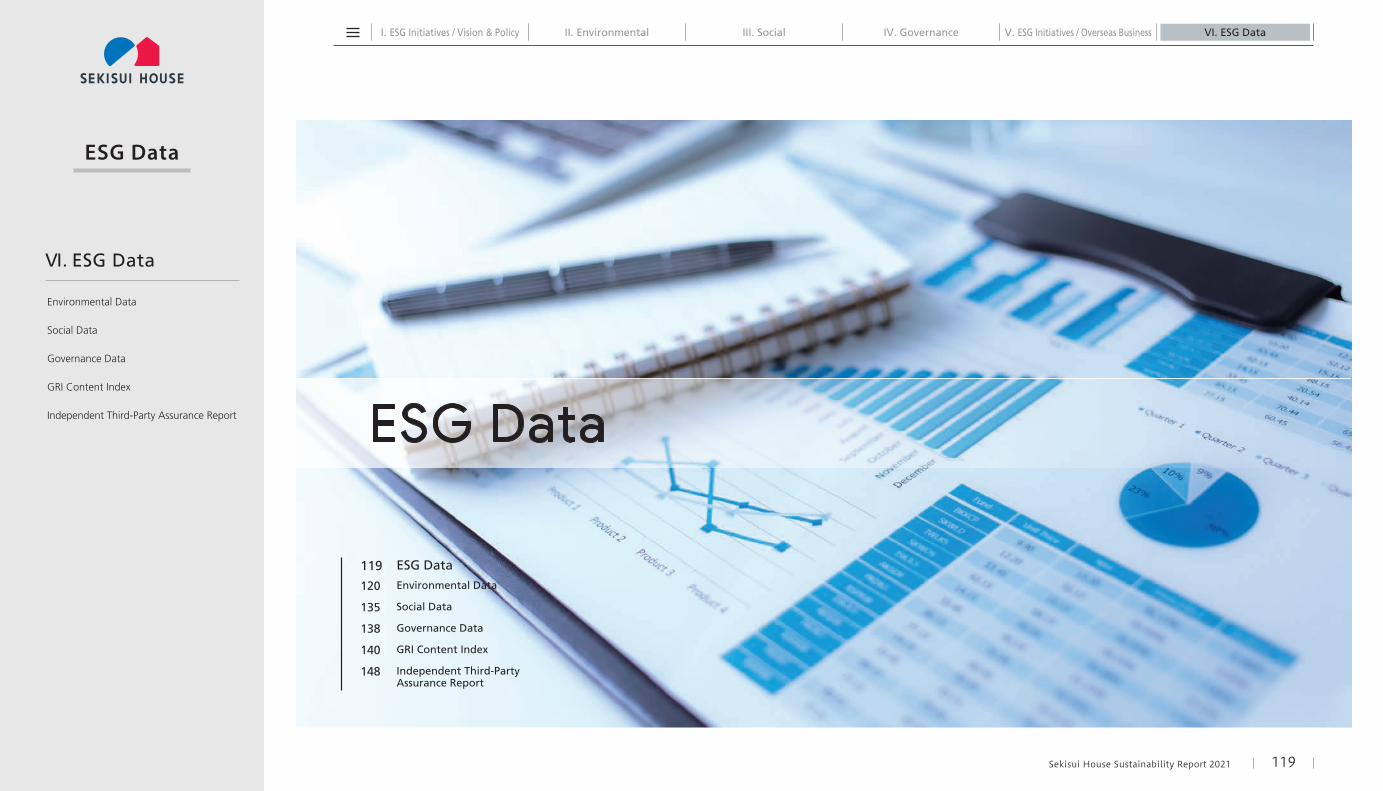
ESG Data
ESG Data
119
120
135
138
140
148
ESG DataEnvironmental Data
Social Data
Governance Data
GRI Content Index
Independent Third-Party Assurance Report
Sekisui House Sustainability Report 2021 119
Environmental Data
Social Data
Governance Data
GRI Content Index
Independent Third-Party Assurance Report
VI. ESG Data
I. ESG Initiatives / Vision & Policy III. Social IV. Governance VI. ESG DataV. ESG Initiatives / Overseas BusinessII. Environmental
ESG Data
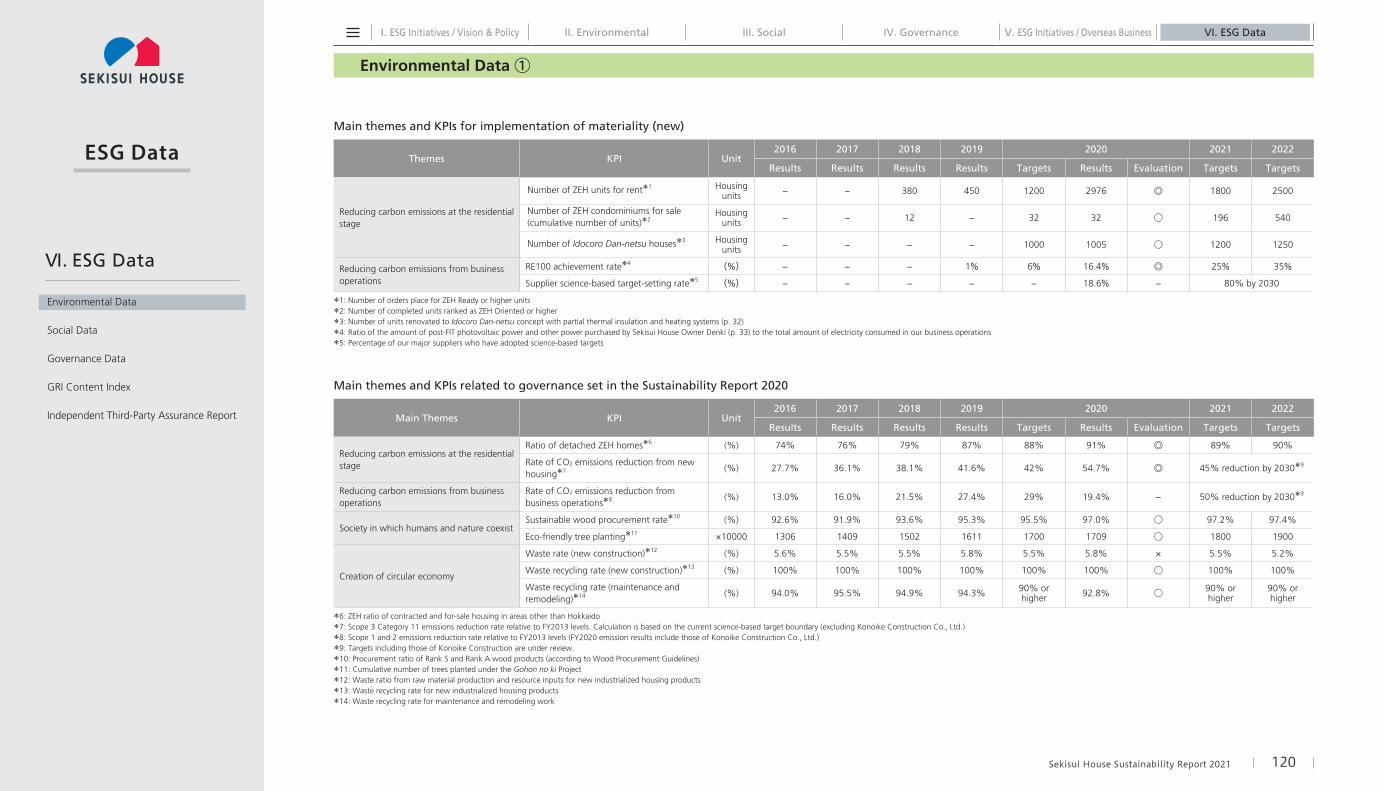
Environmental Data ①
Sekisui House Sustainability Report 2021 120
Main themes and KPIs for implementation of materiality (new)
Themes KPI Unit2016 2017 2018 2019 2020 2021 2022
Results Results Results Results Targets Results Evaluation Targets Targets
Reducing carbon emissions at the residential stage
Number of ZEH units for rent*1 Housing units − − 380 450 1200 2976 ◎ 1800 2500
Number of ZEH condominiums for sale (cumulative number of units)*2
Housing units − − 12 − 32 32 ○ 196 540
Number of Idocoro Dan-netsu houses*3 Housing units − − − − 1000 1005 ○ 1200 1250
Reducing carbon emissions from business operations
RE100 achievement rate*4 (%) − − − 1% 6% 16.4% ◎ 25% 35%
Supplier science-based target-setting rate*5 (%) − − − − − 18.6% − 80% by 2030
*1: Number of orders place for ZEH Ready or higher units
*2: Number of completed units ranked as ZEH Oriented or higher
*3: Number of units renovated to Idocoro Dan-netsu concept with partial thermal insulation and heating systems (p. 32)
*4: Ratio of the amount of post-FIT photovoltaic power and other power purchased by Sekisui House Owner Denki (p. 33) to the total amount of electricity consumed in our business operations
*5: Percentage of our major suppliers who have adopted science-based targets
Main themes and KPIs related to governance set in the Sustainability Report 2020
Main Themes KPI Unit2016 2017 2018 2019 2020 2021 2022
Results Results Results Results Targets Results Evaluation Targets Targets
Reducing carbon emissions at the residential stage
Ratio of detached ZEH homes*6 (%) 74% 76% 79% 87% 88% 91% ◎ 89% 90%
Rate of CO2 emissions reduction from new housing*7 (%) 27.7% 36.1% 38.1% 41.6% 42% 54.7% ◎ 45% reduction by 2030*9
Reducing carbon emissions from business operations
Rate of CO2 emissions reduction from business operations*8 (%) 13.0% 16.0% 21.5% 27.4% 29% 19.4% − 50% reduction by 2030*9
Society in which humans and nature coexistSustainable wood procurement rate*10 (%) 92.6% 91.9% 93.6% 95.3% 95.5% 97.0% ○ 97.2% 97.4%
Eco-friendly tree planting*11 ×10000 1306 1409 1502 1611 1700 1709 ○ 1800 1900
Creation of circular economy
Waste rate (new construction)*12 (%) 5.6% 5.5% 5.5% 5.8% 5.5% 5.8% × 5.5% 5.2%
Waste recycling rate (new construction)*13 (%) 100% 100% 100% 100% 100% 100% ○ 100% 100%
Waste recycling rate (maintenance and remodeling)*14 (%) 94.0% 95.5% 94.9% 94.3% 90% or
higher 92.8% ○ 90% or higher
90% or higher
*6: ZEH ratio of contracted and for-sale housing in areas other than Hokkaido
*7: Scope 3 Category 11 emissions reduction rate relative to FY2013 levels. Calculation is based on the current science-based target boundary (excluding Konoike Construction Co., Ltd.)
*8: Scope 1 and 2 emissions reduction rate relative to FY2013 levels (FY2020 emission results include those of Konoike Construction Co., Ltd.)
*9: Targets including those of Konoike Construction are under review.
*10: Procurement ratio of Rank S and Rank A wood products (according to Wood Procurement Guidelines)
*11: Cumulative number of trees planted under the Gohon no ki Project
*12: Waste ratio from raw material production and resource inputs for new industrialized housing products
*13: Waste recycling rate for new industrialized housing products
*14: Waste recycling rate for maintenance and remodeling work
Environmental Data
Social Data
Governance Data
GRI Content Index
Independent Third-Party Assurance Report
VI. ESG Data
I. ESG Initiatives / Vision & Policy III. Social IV. Governance VI. ESG DataV. ESG Initiatives / Overseas BusinessII. Environmental
ESG Data
Environmental Data ②
Sekisui House Sustainability Report 2021 121
All the figures for waste from business activities include valuables.Scope: The subjects of this survey are Sekisui House, Ltd., its major consolidated subsidiaries in Japan (40 companies), and major consolidated subsidiaries overseas (12 companies). Scope 3 CO2 emissions include those attributable to parties outside the Sekisui House Group.Period: The data is for FY2020 (from February 2020 to January 2021). The figures include estimates in cases where final data was unavailable at the time of calculation.
ElectricityGasolineLight oilNatural gasPropane gasKeroseneCold water / hot water / steam
Water supply
50,353 12,298
333 565
36 24
19,504
237
MWhklklthous. m3
thous. m3
kl GJ
thous. m3
Energy
Water
GJ979,357
237
PaperOther
61 27
tt
Waste*1
t-CO2
t(Recycling rate: 78.8%)
50,643
88
Glass/ceramicsMetalSludgeWoodOther
5,589 4,328 1,815 1,294
754
ttttt
Waste
t-CO2
t
34,214
13,780
Concrete SludgeDebris, etc.Asphalt concreteOther
324,932 149,670
54,044 49,567
121,973
ttttt
Waste
t-CO2
t
48,796
700,186
ConcreteWood Debris, etc.Mixtures (including those properly controlled)Other
210,744 77,007 37,540
23,966 44,054
ttt tt
Waste
t-CO2
t
975
393,310
ElectricityNatural gasLPGLNGKeroseneLight oilGasoline
Water supplyIndustrial-use waterGroundwater
39,198 3,337 1,729 1,333
186 55 21
130 27
462
MWhthous. m3
ttklklkl
thous. m3
thous. m3
thous. m3
Energy
Water
GJ702,975
619
25,488 14,178
66
MWhklkl
Energy GJ785,734
Light oil 377
Below are the figures for energy consumption, water consumption, waste, and CO2 emissions resulting from the demolition of old buildings prior to new construction.
kl
Energy GJ14,218
Development and design
Material balance (monitoring of environmental impact of business activities in FY2020)
To make its environmental-conservation activities as effective as possible, the Sekisui House Group monitors and reports on environmental impacts at each stage of the housing-product lifecycle, including development and design, factory production, construction and demolition in Japan and overseas.
INPU
TB
usi
nes
sac
tivi
ties
OU
TPU
T
Factory production
Construction Demolition
*1: Amount of waste from the head office building
Environmental Data
Social Data
Governance Data
GRI Content Index
Independent Third-Party Assurance Report
VI. ESG Data
Water supply Water supply198 31thous. m3 thous. m3
Water Water198 31
ElectricityGasolineLight oil
CO2 emissions CO2 emissions CO2 emissions CO2 emissions
thous. m3 thous. m3 thous. m3 thous. m3
(Recycling rate: 100%) (Recycling rate: 97.5%) (Recycling rate: 96.3%)
I. ESG Initiatives / Vision & Policy III. Social IV. Governance VI. ESG DataV. ESG Initiatives / Overseas BusinessII. Environmental
ESG Data
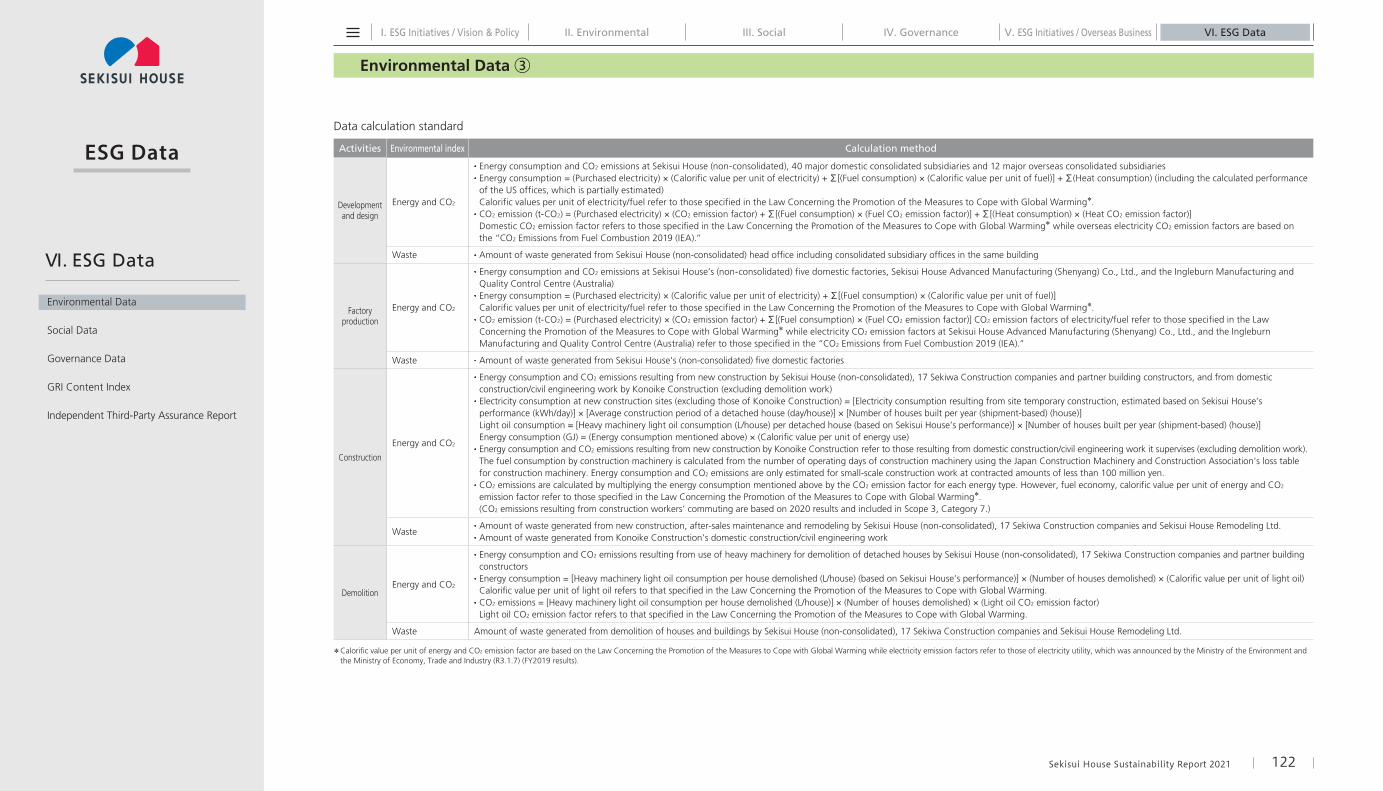
Environmental Data ③
Sekisui House Sustainability Report 2021 122
Data calculation standard
Activities Environmental index Calculation method
Development and design
Energy and CO2
· Energy consumption and CO2 emissions at Sekisui House (non-consolidated), 40 major domestic consolidated subsidiaries and 12 major overseas consolidated subsidiaries· Energy consumption = (Purchased electricity) × (Calorific value per unit of electricity) + Σ[(Fuel consumption) × (Calorific value per unit of fuel)] + Σ(Heat consumption) (including the calculated performance of the US offices, which is partially estimated) Calorific values per unit of electricity/fuel refer to those specified in the Law Concerning the Promotion of the Measures to Cope with Global Warming*.
· CO2 emission (t-CO2) = (Purchased electricity) × (CO2 emission factor) + Σ[(Fuel consumption) × (Fuel CO2 emission factor)] + Σ[(Heat consumption) × (Heat CO2 emission factor)] Domestic CO2 emission factor refers to those specified in the Law Concerning the Promotion of the Measures to Cope with Global Warming* while overseas electricity CO2 emission factors are based on the “CO2 Emissions from Fuel Combustion 2019 (IEA).”
Waste · Amount of waste generated from Sekisui House (non-consolidated) head office including consolidated subsidiary offices in the same building
Factory production
Energy and CO2
· Energy consumption and CO2 emissions at Sekisui House’s (non-consolidated) five domestic factories, Sekisui House Advanced Manufacturing (Shenyang) Co., Ltd., and the Ingleburn Manufacturing and Quality Control Centre (Australia)
· Energy consumption = (Purchased electricity) × (Calorific value per unit of electricity) + Σ[(Fuel consumption) × (Calorific value per unit of fuel)] Calorific values per unit of electricity/fuel refer to those specified in the Law Concerning the Promotion of the Measures to Cope with Global Warming*.
· CO2 emission (t-CO2) = (Purchased electricity) × (CO2 emission factor) + Σ[(Fuel consumption) × (Fuel CO2 emission factor)] CO2 emission factors of electricity/fuel refer to those specified in the Law Concerning the Promotion of the Measures to Cope with Global Warming* while electricity CO2 emission factors at Sekisui House Advanced Manufacturing (Shenyang) Co., Ltd., and the Ingleburn Manufacturing and Quality Control Centre (Australia) refer to those specified in the “CO2 Emissions from Fuel Combustion 2019 (IEA).”
Waste · Amount of waste generated from Sekisui House’s (non-consolidated) five domestic factories
Construction
Energy and CO2
· Energy consumption and CO2 emissions resulting from new construction by Sekisui House (non-consolidated), 17 Sekiwa Construction companies and partner building constructors, and from domestic construction/civil engineering work by Konoike Construction (excluding demolition work)
· Electricity consumption at new construction sites (excluding those of Konoike Construction) = [Electricity consumption resulting from site temporary construction, estimated based on Sekisui House’s performance (kWh/day)] × [Average construction period of a detached house (day/house)] × [Number of houses built per year (shipment-based) (house)] Light oil consumption = [Heavy machinery light oil consumption (L/house) per detached house (based on Sekisui House’s performance)] × [Number of houses built per year (shipment-based) (house)] Energy consumption (GJ) = (Energy consumption mentioned above) × (Calorific value per unit of energy use)
· Energy consumption and CO2 emissions resulting from new construction by Konoike Construction refer to those resulting from domestic construction/civil engineering work it supervises (excluding demolition work). The fuel consumption by construction machinery is calculated from the number of operating days of construction machinery using the Japan Construction Machinery and Construction Association’s loss table for construction machinery. Energy consumption and CO2 emissions are only estimated for small-scale construction work at contracted amounts of less than 100 million yen.
· CO2 emissions are calculated by multiplying the energy consumption mentioned above by the CO2 emission factor for each energy type. However, fuel economy, calorific value per unit of energy and CO2 emission factor refer to those specified in the Law Concerning the Promotion of the Measures to Cope with Global Warming*. (CO2 emissions resulting from construction workers’ commuting are based on 2020 results and included in Scope 3, Category 7.)
Waste· Amount of waste generated from new construction, after-sales maintenance and remodeling by Sekisui House (non-consolidated), 17 Sekiwa Construction companies and Sekisui House Remodeling Ltd.· Amount of waste generated from Konoike Construction’s domestic construction/civil engineering work
DemolitionEnergy and CO2
· Energy consumption and CO2 emissions resulting from use of heavy machinery for demolition of detached houses by Sekisui House (non-consolidated), 17 Sekiwa Construction companies and partner building constructors
· Energy consumption = [Heavy machinery light oil consumption per house demolished (L/house) (based on Sekisui House’s performance)] × (Number of houses demolished) × (Calorific value per unit of light oil) Calorific value per unit of light oil refers to that specified in the Law Concerning the Promotion of the Measures to Cope with Global Warming.
· CO2 emissions = [Heavy machinery light oil consumption per house demolished (L/house)] × (Number of houses demolished) × (Light oil CO2 emission factor) Light oil CO2 emission factor refers to that specified in the Law Concerning the Promotion of the Measures to Cope with Global Warming.
Waste Amount of waste generated from demolition of houses and buildings by Sekisui House (non-consolidated), 17 Sekiwa Construction companies and Sekisui House Remodeling Ltd.
* Calorific value per unit of energy and CO2 emission factor are based on the Law Concerning the Promotion of the Measures to Cope with Global Warming while electricity emission factors refer to those of electricity utility, which was announced by the Ministry of the Environment and the Ministry of Economy, Trade and Industry (R3.1.7) (FY2019 results).
Environmental Data
Social Data
Governance Data
GRI Content Index
Independent Third-Party Assurance Report
VI. ESG Data
I. ESG Initiatives / Vision & Policy III. Social IV. Governance VI. ESG DataV. ESG Initiatives / Overseas BusinessII. Environmental
ESG Data
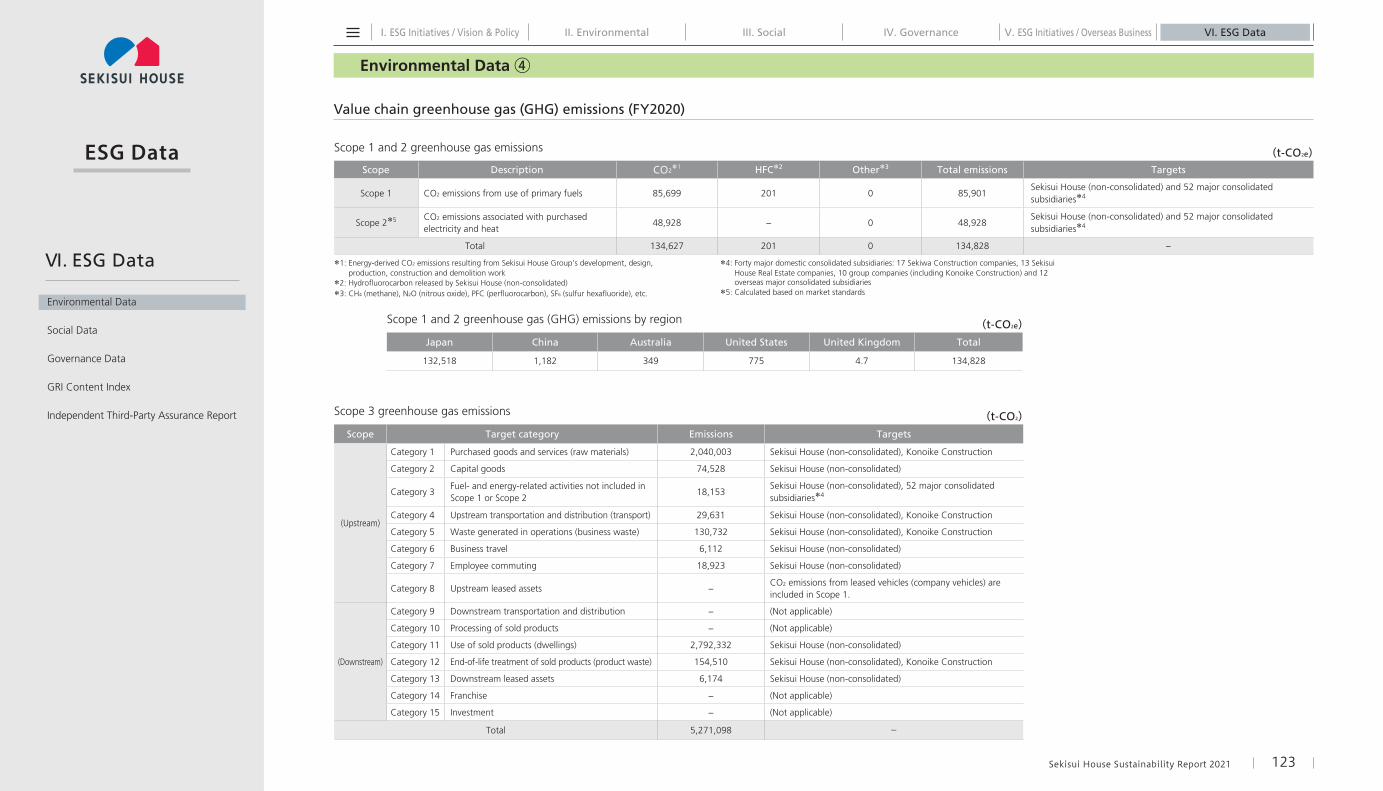
Environmental Data ④
Sekisui House Sustainability Report 2021 123
Scope 1 and 2 greenhouse gas emissions (t-CO2e)Scope Description CO2*1 HFC*2 Other*3 Total emissions Targets
Scope 1 CO2 emissions from use of primary fuels 85,699 201 0 85,901Sekisui House (non-consolidated) and 52 major consolidated subsidiaries*4
Scope 2*5 CO2 emissions associated with purchased electricity and heat
48,928 − 0 48,928Sekisui House (non-consolidated) and 52 major consolidated subsidiaries*4
Total 134,627 201 0 134,828 −
*1: Energy-derived CO2 emissions resulting from Sekisui House Group’s development, design, production, construction and demolition work
*2: Hydrofluorocarbon released by Sekisui House (non-consolidated)
*3: CH4 (methane), N2O (nitrous oxide), PFC (perfluorocarbon), SF6 (sulfur hexafluoride), etc.
*4: Forty major domestic consolidated subsidiaries: 17 Sekiwa Construction companies, 13 Sekisui House Real Estate companies, 10 group companies (including Konoike Construction) and 12 overseas major consolidated subsidiaries
*5: Calculated based on market standards
Scope 1 and 2 greenhouse gas (GHG) emissions by region (t-CO2e)Japan China Australia United States United Kingdom Total
132,518 1,182 349 775 4.7 134,828
Scope 3 greenhouse gas emissions (t-CO2)Scope Target category Emissions Targets
(Upstream)
Category 1 Purchased goods and services (raw materials) 2,040,003 Sekisui House (non-consolidated), Konoike Construction
Category 2 Capital goods 74,528 Sekisui House (non-consolidated)
Category 3Fuel- and energy-related activities not included in Scope 1 or Scope 2
18,153Sekisui House (non-consolidated), 52 major consolidated subsidiaries*4
Category 4 Upstream transportation and distribution (transport) 29,631 Sekisui House (non-consolidated), Konoike Construction
Category 5 Waste generated in operations (business waste) 130,732 Sekisui House (non-consolidated), Konoike Construction
Category 6 Business travel 6,112 Sekisui House (non-consolidated)
Category 7 Employee commuting 18,923 Sekisui House (non-consolidated)
Category 8 Upstream leased assets −CO2 emissions from leased vehicles (company vehicles) are included in Scope 1.
(Downstream)
Category 9 Downstream transportation and distribution − (Not applicable)
Category 10 Processing of sold products − (Not applicable)
Category 11 Use of sold products (dwellings) 2,792,332 Sekisui House (non-consolidated)
Category 12 End-of-life treatment of sold products (product waste) 154,510 Sekisui House (non-consolidated), Konoike Construction
Category 13 Downstream leased assets 6,174 Sekisui House (non-consolidated)
Category 14 Franchise − (Not applicable)
Category 15 Investment − (Not applicable)
Total 5,271,098 −
Value chain greenhouse gas (GHG) emissions (FY2020)
Environmental Data
Social Data
Governance Data
GRI Content Index
Independent Third-Party Assurance Report
VI. ESG Data
I. ESG Initiatives / Vision & Policy III. Social IV. Governance VI. ESG DataV. ESG Initiatives / Overseas BusinessII. Environmental
ESG Data
Environmental Data ⑤
Sekisui House Sustainability Report 2021 124
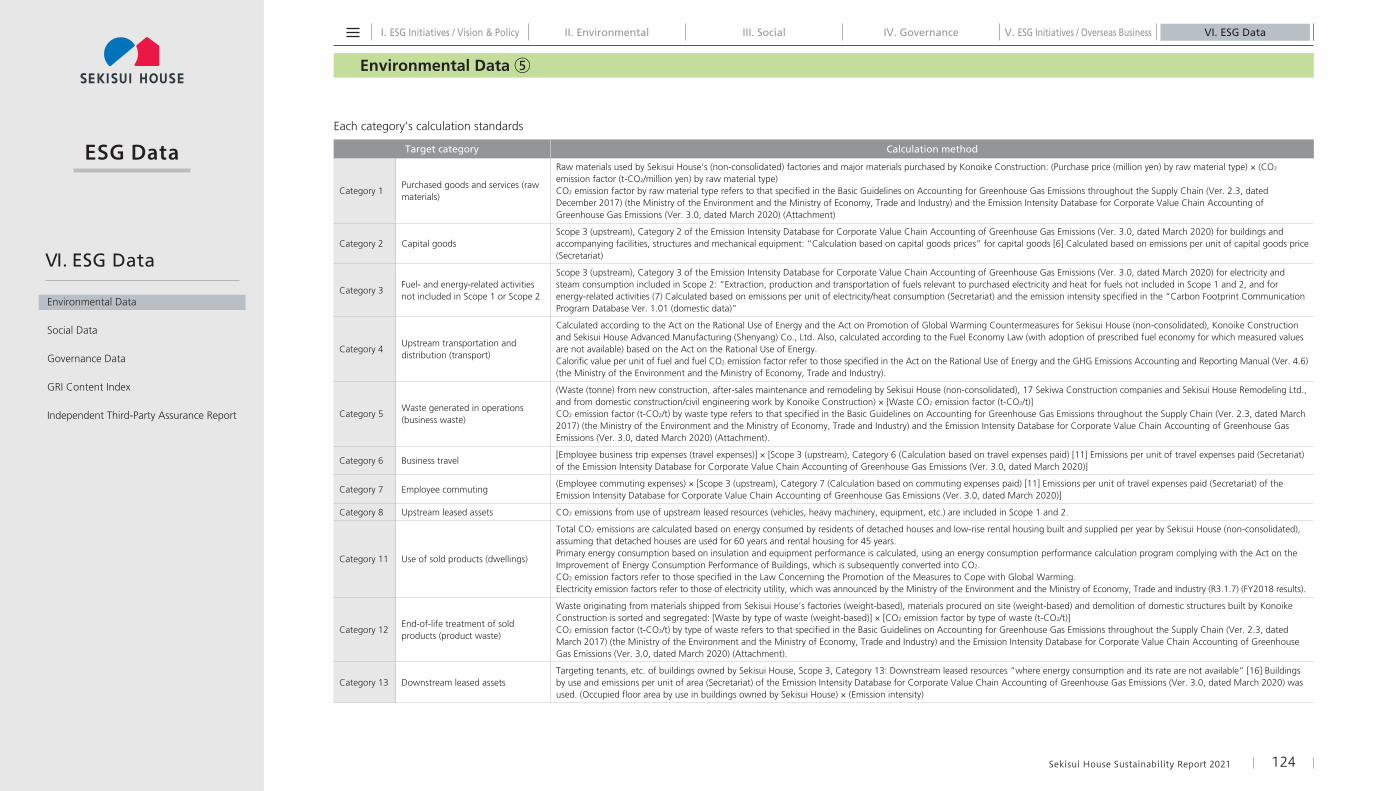
Target category Calculation method
Category 1Purchased goods and services (raw materials)
Raw materials used by Sekisui House’s (non-consolidated) factories and major materials purchased by Konoike Construction: (Purchase price (million yen) by raw material type) × (CO2 emission factor (t-CO2/million yen) by raw material type)CO2 emission factor by raw material type refers to that specified in the Basic Guidelines on Accounting for Greenhouse Gas Emissions throughout the Supply Chain (Ver. 2.3, dated December 2017) (the Ministry of the Environment and the Ministry of Economy, Trade and Industry) and the Emission Intensity Database for Corporate Value Chain Accounting of Greenhouse Gas Emissions (Ver. 3.0, dated March 2020) (Attachment)
Category 2 Capital goodsScope 3 (upstream), Category 2 of the Emission Intensity Database for Corporate Value Chain Accounting of Greenhouse Gas Emissions (Ver. 3.0, dated March 2020) for buildings and accompanying facilities, structures and mechanical equipment: “Calculation based on capital goods prices” for capital goods [6] Calculated based on emissions per unit of capital goods price (Secretariat)
Category 3Fuel- and energy-related activities not included in Scope 1 or Scope 2
Scope 3 (upstream), Category 3 of the Emission Intensity Database for Corporate Value Chain Accounting of Greenhouse Gas Emissions (Ver. 3.0, dated March 2020) for electricity and steam consumption included in Scope 2: “Extraction, production and transportation of fuels relevant to purchased electricity and heat for fuels not included in Scope 1 and 2, and for energy-related activities (7) Calculated based on emissions per unit of electricity/heat consumption (Secretariat) and the emission intensity specified in the “Carbon Footprint Communication Program Database Ver. 1.01 (domestic data)”
Category 4Upstream transportation and distribution (transport)
Calculated according to the Act on the Rational Use of Energy and the Act on Promotion of Global Warming Countermeasures for Sekisui House (non-consolidated), Konoike Construction and Sekisui House Advanced Manufacturing (Shenyang) Co., Ltd. Also, calculated according to the Fuel Economy Law (with adoption of prescribed fuel economy for which measured values are not available) based on the Act on the Rational Use of Energy.Calorific value per unit of fuel and fuel CO2 emission factor refer to those specified in the Act on the Rational Use of Energy and the GHG Emissions Accounting and Reporting Manual (Ver. 4.6) (the Ministry of the Environment and the Ministry of Economy, Trade and Industry).
Category 5Waste generated in operations (business waste)
(Waste (tonne) from new construction, after-sales maintenance and remodeling by Sekisui House (non-consolidated), 17 Sekiwa Construction companies and Sekisui House Remodeling Ltd., and from domestic construction/civil engineering work by Konoike Construction) × [Waste CO2 emission factor (t-CO2/t)] CO2 emission factor (t-CO2/t) by waste type refers to that specified in the Basic Guidelines on Accounting for Greenhouse Gas Emissions throughout the Supply Chain (Ver. 2.3, dated March 2017) (the Ministry of the Environment and the Ministry of Economy, Trade and Industry) and the Emission Intensity Database for Corporate Value Chain Accounting of Greenhouse Gas Emissions (Ver. 3.0, dated March 2020) (Attachment).
Category 6 Business travel[Employee business trip expenses (travel expenses)] × [Scope 3 (upstream), Category 6 (Calculation based on travel expenses paid) [11] Emissions per unit of travel expenses paid (Secretariat) of the Emission Intensity Database for Corporate Value Chain Accounting of Greenhouse Gas Emissions (Ver. 3.0, dated March 2020)]
Category 7 Employee commuting(Employee commuting expenses) × [Scope 3 (upstream), Category 7 (Calculation based on commuting expenses paid) [11] Emissions per unit of travel expenses paid (Secretariat) of the Emission Intensity Database for Corporate Value Chain Accounting of Greenhouse Gas Emissions (Ver. 3.0, dated March 2020)]
Category 8 Upstream leased assets CO2 emissions from use of upstream leased resources (vehicles, heavy machinery, equipment, etc.) are included in Scope 1 and 2.
Category 11 Use of sold products (dwellings)
Total CO2 emissions are calculated based on energy consumed by residents of detached houses and low-rise rental housing built and supplied per year by Sekisui House (non-consolidated), assuming that detached houses are used for 60 years and rental housing for 45 years. Primary energy consumption based on insulation and equipment performance is calculated, using an energy consumption performance calculation program complying with the Act on the Improvement of Energy Consumption Performance of Buildings, which is subsequently converted into CO2. CO2 emission factors refer to those specified in the Law Concerning the Promotion of the Measures to Cope with Global Warming. Electricity emission factors refer to those of electricity utility, which was announced by the Ministry of the Environment and the Ministry of Economy, Trade and Industry (R3.1.7) (FY2018 results).
Category 12End-of-life treatment of sold products (product waste)
Waste originating from materials shipped from Sekisui House’s factories (weight-based), materials procured on site (weight-based) and demolition of domestic structures built by Konoike Construction is sorted and segregated: [Waste by type of waste (weight-based)] × [CO2 emission factor by type of waste (t-CO2/t)] CO2 emission factor (t-CO2/t) by type of waste refers to that specified in the Basic Guidelines on Accounting for Greenhouse Gas Emissions throughout the Supply Chain (Ver. 2.3, dated March 2017) (the Ministry of the Environment and the Ministry of Economy, Trade and Industry) and the Emission Intensity Database for Corporate Value Chain Accounting of Greenhouse Gas Emissions (Ver. 3.0, dated March 2020) (Attachment).
Category 13 Downstream leased assetsTargeting tenants, etc. of buildings owned by Sekisui House, Scope 3, Category 13: Downstream leased resources “where energy consumption and its rate are not available” [16] Buildings by use and emissions per unit of area (Secretariat) of the Emission Intensity Database for Corporate Value Chain Accounting of Greenhouse Gas Emissions (Ver. 3.0, dated March 2020) was used. (Occupied floor area by use in buildings owned by Sekisui House) × (Emission intensity)
Each category’s calculation standards
Environmental Data
Social Data
Governance Data
GRI Content Index
Independent Third-Party Assurance Report
VI. ESG Data
I. ESG Initiatives / Vision & Policy III. Social IV. Governance VI. ESG DataV. ESG Initiatives / Overseas BusinessII. Environmental
ESG Data
Environmental Data ⑥
Sekisui House Sustainability Report 2021 125
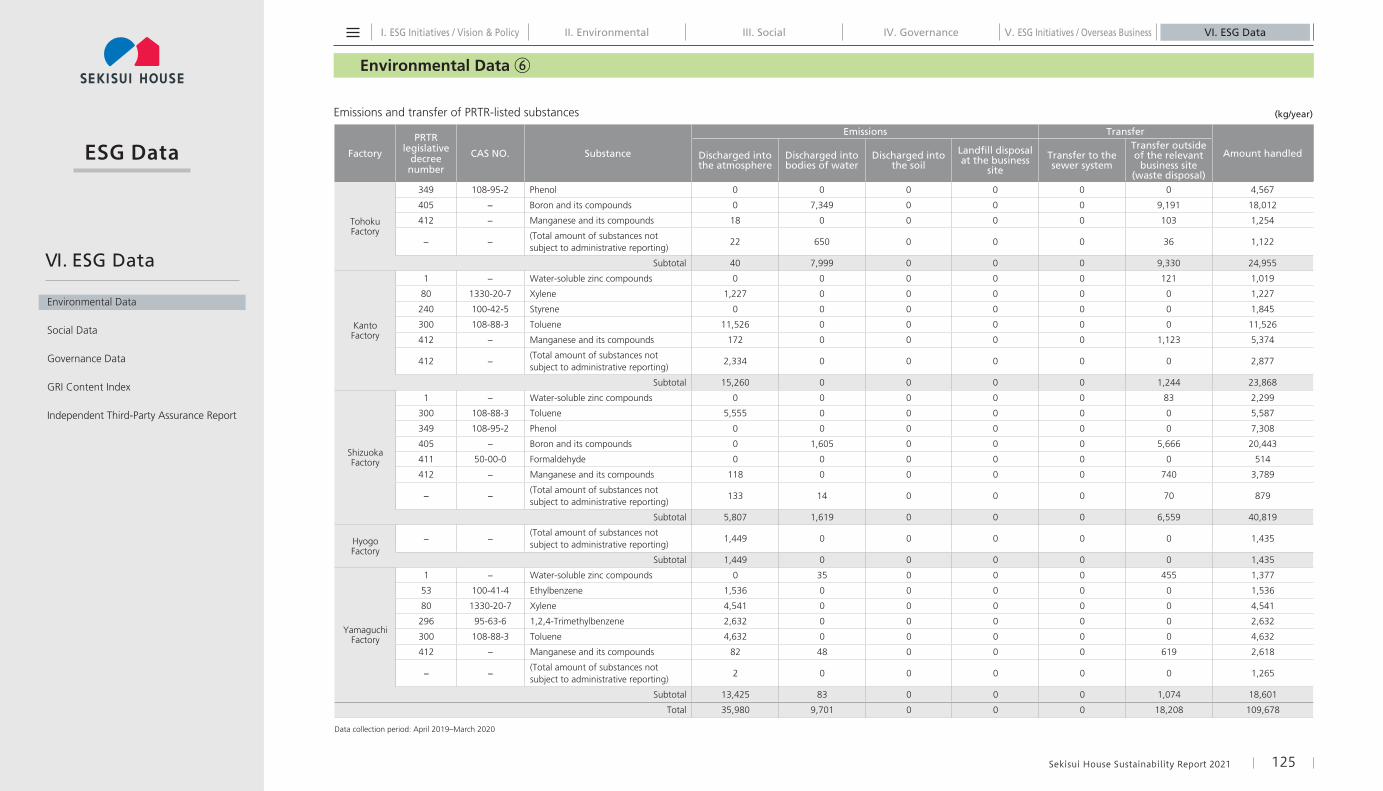
Emissions and transfer of PRTR-listed substances
Factory
PRTR legislative
decree number
CAS NO. Substance
Emissions Transfer
Amount handledDischarged into the atmosphere
Discharged into bodies of water
Discharged into the soil
Landfill disposal at the business
site
Transfer to the sewer system
Transfer outside of the relevant
business site (waste disposal)
Tohoku Factory
349 108-95-2 Phenol 0 0 0 0 0 0 4,567
405 − Boron and its compounds 0 7,349 0 0 0 9,191 18,012
412 − Manganese and its compounds 18 0 0 0 0 103 1,254
− −(Total amount of substances not subject to administrative reporting)
22 650 0 0 0 36 1,122
Subtotal 40 7,999 0 0 0 9,330 24,955
Kanto Factory
1 − Water-soluble zinc compounds 0 0 0 0 0 121 1,019
80 1330-20-7 Xylene 1,227 0 0 0 0 0 1,227
240 100-42-5 Styrene 0 0 0 0 0 0 1,845
300 108-88-3 Toluene 11,526 0 0 0 0 0 11,526
412 − Manganese and its compounds 172 0 0 0 0 1,123 5,374
412 −(Total amount of substances not subject to administrative reporting)
2,334 0 0 0 0 0 2,877
Subtotal 15,260 0 0 0 0 1,244 23,868
Shizuoka Factory
1 − Water-soluble zinc compounds 0 0 0 0 0 83 2,299
300 108-88-3 Toluene 5,555 0 0 0 0 0 5,587
349 108-95-2 Phenol 0 0 0 0 0 0 7,308
405 − Boron and its compounds 0 1,605 0 0 0 5,666 20,443
411 50-00-0 Formaldehyde 0 0 0 0 0 0 514
412 − Manganese and its compounds 118 0 0 0 0 740 3,789
− −(Total amount of substances not subject to administrative reporting)
133 14 0 0 0 70 879
Subtotal 5,807 1,619 0 0 0 6,559 40,819
Hyogo Factory
− −(Total amount of substances not subject to administrative reporting)
1,449 0 0 0 0 0 1,435
Subtotal 1,449 0 0 0 0 0 1,435
Yamaguchi Factory
1 − Water-soluble zinc compounds 0 35 0 0 0 455 1,377
53 100-41-4 Ethylbenzene 1,536 0 0 0 0 0 1,536
80 1330-20-7 Xylene 4,541 0 0 0 0 0 4,541
296 95-63-6 1,2,4-Trimethylbenzene 2,632 0 0 0 0 0 2,632
300 108-88-3 Toluene 4,632 0 0 0 0 0 4,632
412 − Manganese and its compounds 82 48 0 0 0 619 2,618
− −(Total amount of substances not subject to administrative reporting)
2 0 0 0 0 0 1,265
Subtotal 13,425 83 0 0 0 1,074 18,601
Total 35,980 9,701 0 0 0 18,208 109,678
Data collection period: April 2019–March 2020
(kg/year)
Environmental Data
Social Data
Governance Data
GRI Content Index
Independent Third-Party Assurance Report
VI. ESG Data
I. ESG Initiatives / Vision & Policy III. Social IV. Governance VI. ESG DataV. ESG Initiatives / Overseas BusinessII. Environmental
ESG Data
Environmental Data ⑦
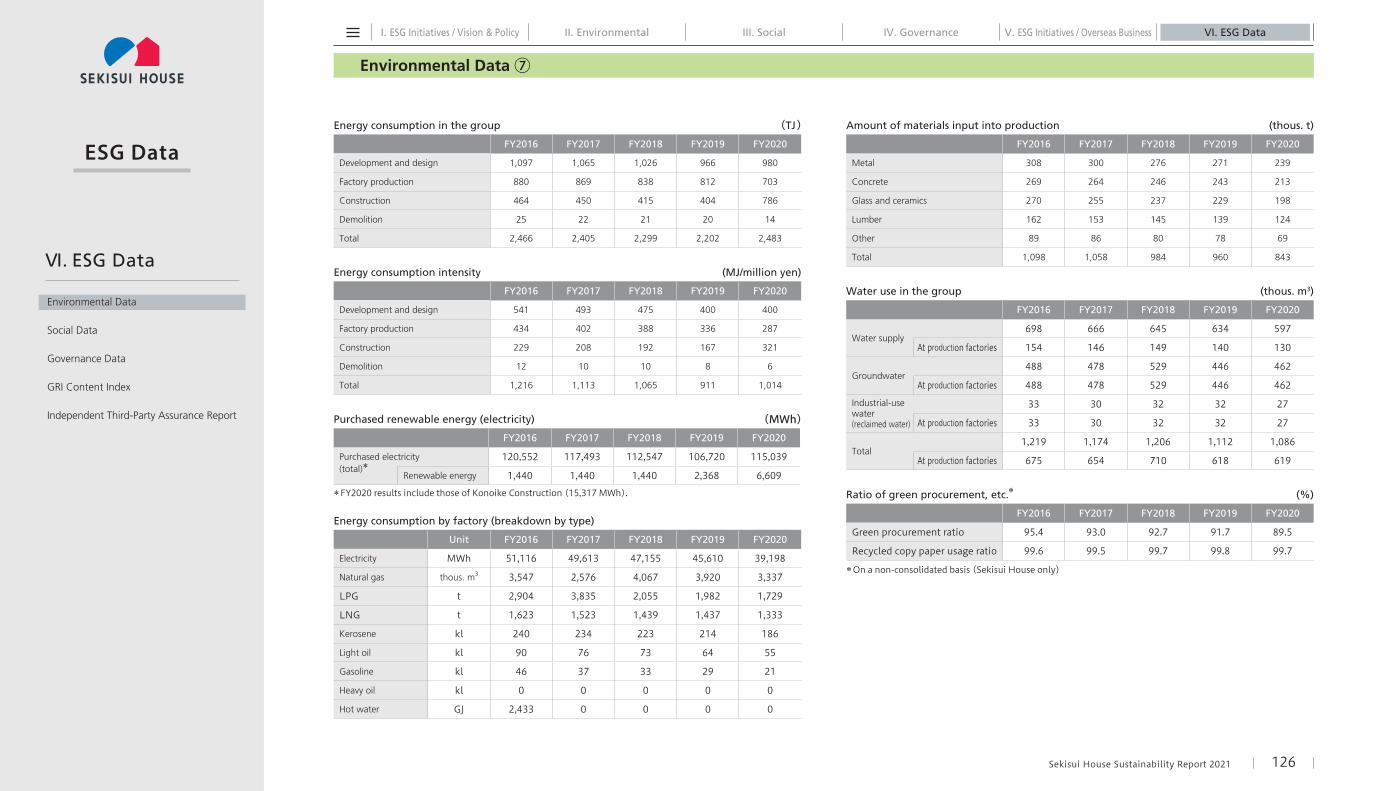
Sekisui House Sustainability Report 2021 126
Energy consumption in the group (TJ)FY2016 FY2017 FY2018 FY2019 FY2020
Development and design 1,097 1,065 1,026 966 980
Factory production 880 869 838 812 703
Construction 464 450 415 404 786
Demolition 25 22 21 20 14
Total 2,466 2,405 2,299 2,202 2,483
Energy consumption intensity (MJ/million yen)
FY2016 FY2017 FY2018 FY2019 FY2020
Development and design 541 493 475 400 400
Factory production 434 402 388 336 287
Construction 229 208 192 167 321
Demolition 12 10 10 8 6
Total 1,216 1,113 1,065 911 1,014
Purchased renewable energy (electricity) (MWh)FY2016 FY2017 FY2018 FY2019 FY2020
Purchased electricity 120,552 117,493 112,547 106,720 115,039 (total)*
Renewable energy 1,440 1,440 1,440 2,368 6,609
* FY2020 results include those of Konoike Construction (15,317 MWh).
Energy consumption by factory (breakdown by type)
Unit FY2016 FY2017 FY2018 FY2019 FY2020
Electricity MWh 51,116 49,613 47,155 45,610 39,198
Natural gas thous. m3 3,547 2,576 4,067 3,920 3,337
LPG t 2,904 3,835 2,055 1,982 1,729
LNG t 1,623 1,523 1,439 1,437 1,333
Kerosene kl 240 234 223 214 186
Light oil kl 90 76 73 64 55
Gasoline kl 46 37 33 29 21
Heavy oil kl 0 0 0 0 0
Hot water GJ 2,433 0 0 0 0
Amount of materials input into production (thous. t)
FY2016 FY2017 FY2018 FY2019 FY2020
Metal 308 300 276 271 239
Concrete 269 264 246 243 213
Glass and ceramics 270 255 237 229 198
Lumber 162 153 145 139 124
Other 89 86 80 78 69
Total 1,098 1,058 984 960 843
Water use in the group (thous. m3)
FY2016 FY2017 FY2018 FY2019 FY2020
Water supply698 666 645 634 597
At production factories 154 146 149 140 130
Groundwater488 478 529 446 462
At production factories 488 478 529 446 462
Industrial-use water(reclaimed water)
33 30 32 32 27
At production factories 33 30 32 32 27
Total1,219 1,174 1,206 1,112 1,086
At production factories 675 654 710 618 619
Ratio of green procurement, etc.* (%)
FY2016 FY2017 FY2018 FY2019 FY2020
Green procurement ratio 95.4 93.0 92.7 91.7 89.5
Recycled copy paper usage ratio 99.6 99.5 99.7 99.8 99.7
* On a non-consolidated basis (Sekisui House only)
Environmental Data
Social Data
Governance Data
GRI Content Index
Independent Third-Party Assurance Report
VI. ESG Data
I. ESG Initiatives / Vision & Policy III. Social IV. Governance VI. ESG DataV. ESG Initiatives / Overseas BusinessII. Environmental
ESG Data
Environmental Data ⑧
Sekisui House Sustainability Report 2021 127
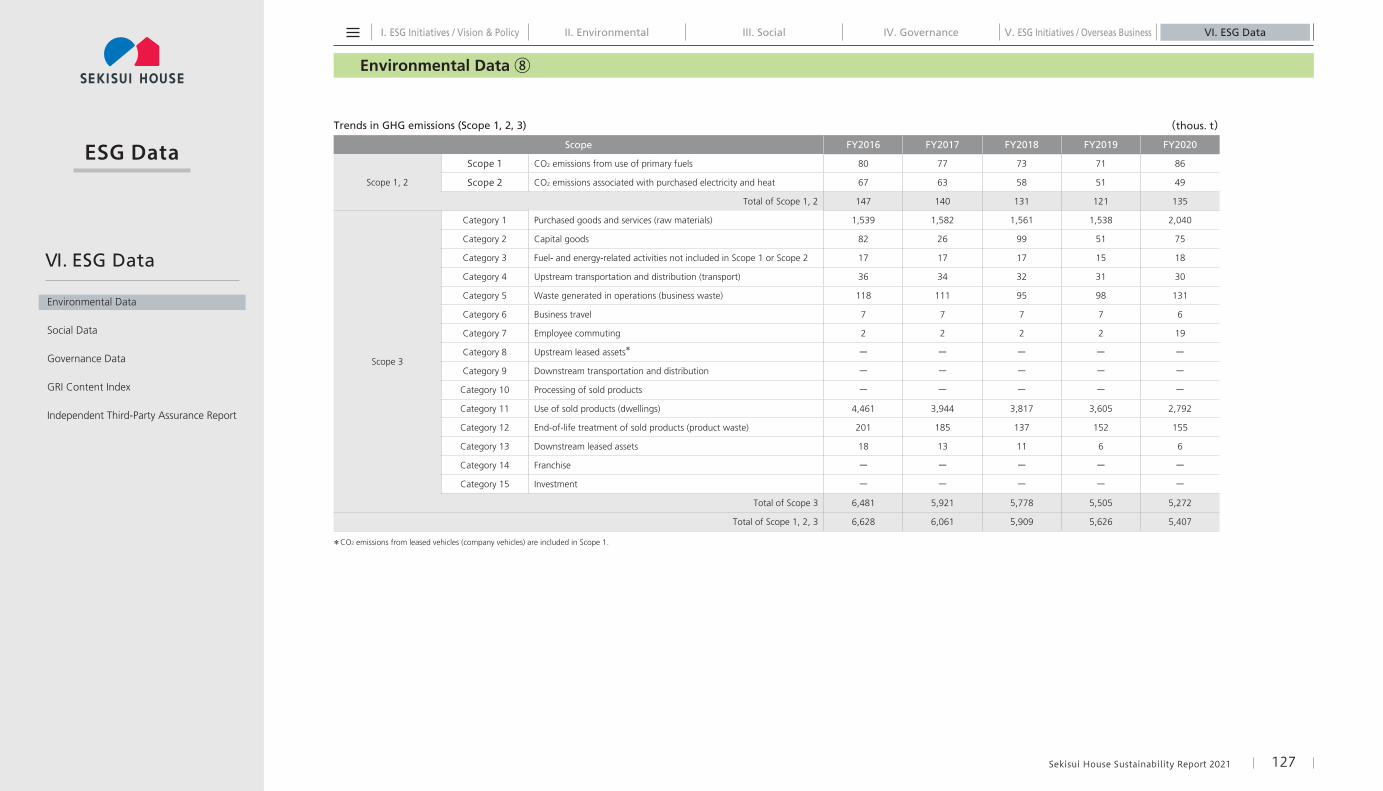
Scope FY2016 FY2017 FY2018 FY2019 FY2020
Scope 1, 2
Scope 1 CO2 emissions from use of primary fuels 80 77 73 71 86
Scope 2 CO2 emissions associated with purchased electricity and heat 67 63 58 51 49
Total of Scope 1, 2 147 140 131 121 135
Scope 3
Category 1 Purchased goods and services (raw materials) 1,539 1,582 1,561 1,538 2,040
Category 2 Capital goods 82 26 99 51 75
Category 3 Fuel- and energy-related activities not included in Scope 1 or Scope 2 17 17 17 15 18
Category 4 Upstream transportation and distribution (transport) 36 34 32 31 30
Category 5 Waste generated in operations (business waste) 118 111 95 98 131
Category 6 Business travel 7 7 7 7 6
Category 7 Employee commuting 2 2 2 2 19
Category 8 Upstream leased assets* ー ー ー ー ー
Category 9 Downstream transportation and distribution ー ー ー ー ー
Category 10 Processing of sold products ー ー ー ー ー
Category 11 Use of sold products (dwellings) 4,461 3,944 3,817 3,605 2,792
Category 12 End-of-life treatment of sold products (product waste) 201 185 137 152 155
Category 13 Downstream leased assets 18 13 11 6 6
Category 14 Franchise ー ー ー ー ー
Category 15 Investment ー ー ー ー ー
Total of Scope 3 6,481 5,921 5,778 5,505 5,272
Total of Scope 1, 2, 3 6,628 6,061 5,909 5,626 5,407
* CO2 emissions from leased vehicles (company vehicles) are included in Scope 1.
Trends in GHG emissions (Scope 1, 2, 3) (thous. t)
Environmental Data
Social Data
Governance Data
GRI Content Index
Independent Third-Party Assurance Report
VI. ESG Data
I. ESG Initiatives / Vision & Policy III. Social IV. Governance VI. ESG DataV. ESG Initiatives / Overseas BusinessII. Environmental
ESG Data
Environmental Data ⑨
Sekisui House Sustainability Report 2021 128
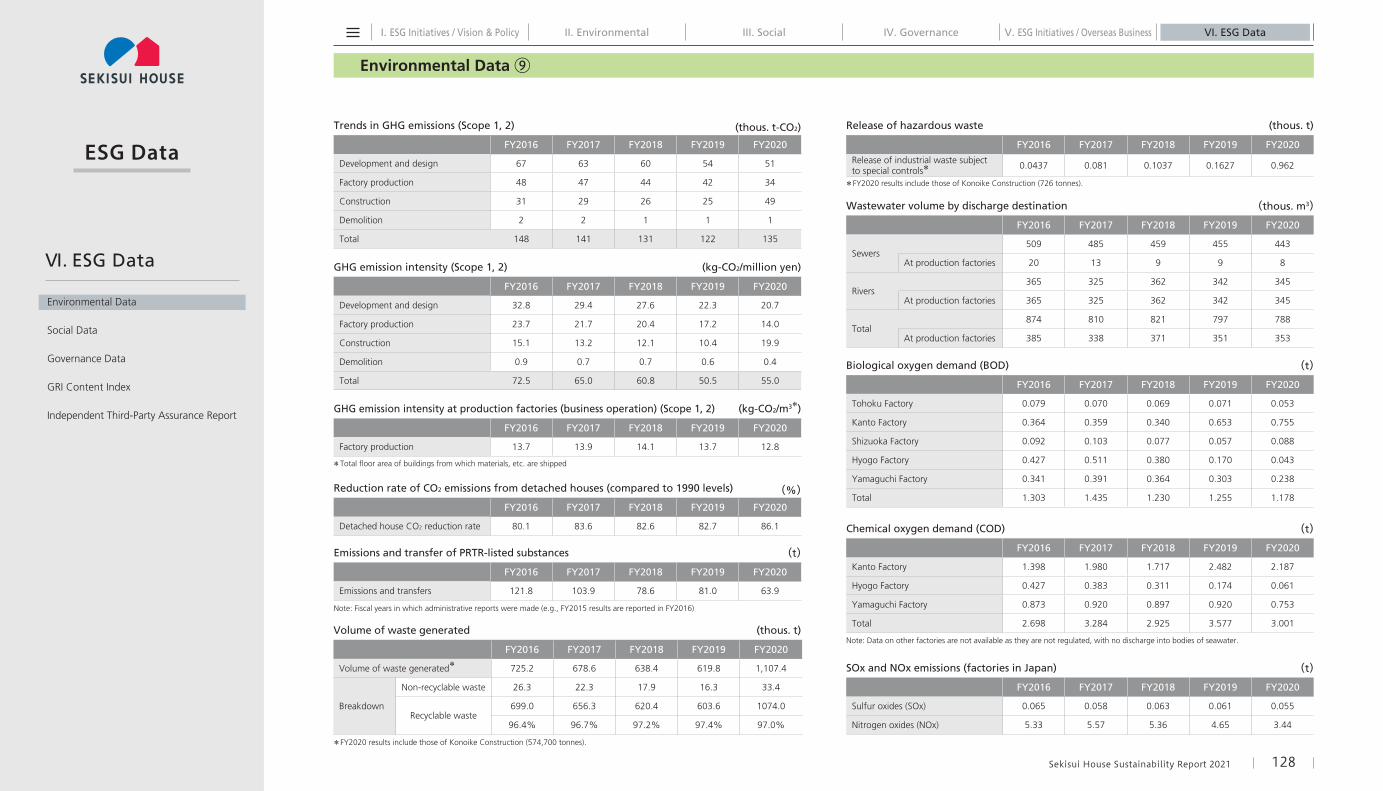
FY2016 FY2017 FY2018 FY2019 FY2020
Development and design 67 63 60 54 51
Factory production 48 47 44 42 34
Construction 31 29 26 25 49
Demolition 2 2 1 1 1
Total 148 141 131 122 135
FY2016 FY2017 FY2018 FY2019 FY2020
Development and design 32.8 29.4 27.6 22.3 20.7
Factory production 23.7 21.7 20.4 17.2 14.0
Construction 15.1 13.2 12.1 10.4 19.9
Demolition 0.9 0.7 0.7 0.6 0.4
Total 72.5 65.0 60.8 50.5 55.0
FY2016 FY2017 FY2018 FY2019 FY2020
Detached house CO2 reduction rate 80.1 83.6 82.6 82.7 86.1
FY2016 FY2017 FY2018 FY2019 FY2020
Emissions and transfers 121.8 103.9 78.6 81.0 63.9
FY2016 FY2017 FY2018 FY2019 FY2020
Factory production 13.7 13.9 14.1 13.7 12.8
Trends in GHG emissions (Scope 1, 2)
GHG emission intensity (Scope 1, 2)
Reduction rate of CO2 emissions from detached houses (compared to 1990 levels)
Emissions and transfer of PRTR-listed substances
GHG emission intensity at production factories (business operation) (Scope 1, 2)
(thous. t-CO2)
FY2016 FY2017 FY2018 FY2019 FY2020
Sewers509 485 459 455 443
At production factories 20 13 9 9 8
Rivers365 325 362 342 345
At production factories 365 325 362 342 345
Total874 810 821 797 788
At production factories 385 338 371 351 353
Wastewater volume by discharge destination (thous. m3)
FY2016 FY2017 FY2018 FY2019 FY2020
Tohoku Factory 0.079 0.070 0.069 0.071 0.053
Kanto Factory 0.364 0.359 0.340 0.653 0.755
Shizuoka Factory 0.092 0.103 0.077 0.057 0.088
Hyogo Factory 0.427 0.511 0.380 0.170 0.043
Yamaguchi Factory 0.341 0.391 0.364 0.303 0.238
Total 1.303 1.435 1.230 1.255 1.178
Biological oxygen demand (BOD) (t)
(kg-CO2/million yen)
(%)
(t)
(kg-CO2/m3*)
FY2016 FY2017 FY2018 FY2019 FY2020
Release of industrial waste subject to special controls* 0.0437 0.081 0.1037 0.1627 0.962
Release of hazardous waste (thous. t)
(thous. t)
FY2016 FY2017 FY2018 FY2019 FY2020
Kanto Factory 1.398 1.980 1.717 2.482 2.187
Hyogo Factory 0.427 0.383 0.311 0.174 0.061
Yamaguchi Factory 0.873 0.920 0.897 0.920 0.753
Total 2.698 3.284 2.925 3.577 3.001
Chemical oxygen demand (COD) (t)
Note: Data on other factories are not available as they are not regulated, with no discharge into bodies of seawater.
FY2016 FY2017 FY2018 FY2019 FY2020
Sulfur oxides (SOx) 0.065 0.058 0.063 0.061 0.055
Nitrogen oxides (NOx) 5.33 5.57 5.36 4.65 3.44
SOx and NOx emissions (factories in Japan) (t)
FY2016 FY2017 FY2018 FY2019 FY2020
Volume of waste generated* 725.2 678.6 638.4 619.8 1,107.4
Breakdown
Non-recyclable waste 26.3 22.3 17.9 16.3 33.4
Recyclable waste699.0 656.3 620.4 603.6 1074.0
96.4% 96.7% 97.2% 97.4% 97.0%
Volume of waste generated
* FY2020 results include those of Konoike Construction (726 tonnes).
* FY2020 results include those of Konoike Construction (574,700 tonnes).
* Total floor area of buildings from which materials, etc. are shipped
Note: Fiscal years in which administrative reports were made (e.g., FY2015 results are reported in FY2016)
Environmental Data
Social Data
Governance Data
GRI Content Index
Independent Third-Party Assurance Report
VI. ESG Data
I. ESG Initiatives / Vision & Policy III. Social IV. Governance VI. ESG DataV. ESG Initiatives / Overseas BusinessII. Environmental
ESG Data
Environmental Data ⑩
Sekisui House Sustainability Report 2021 129
Tohoku Factory
Hyogo Factory
Kanto Factory
Yamaguchi Factory
Shizuoka Factory
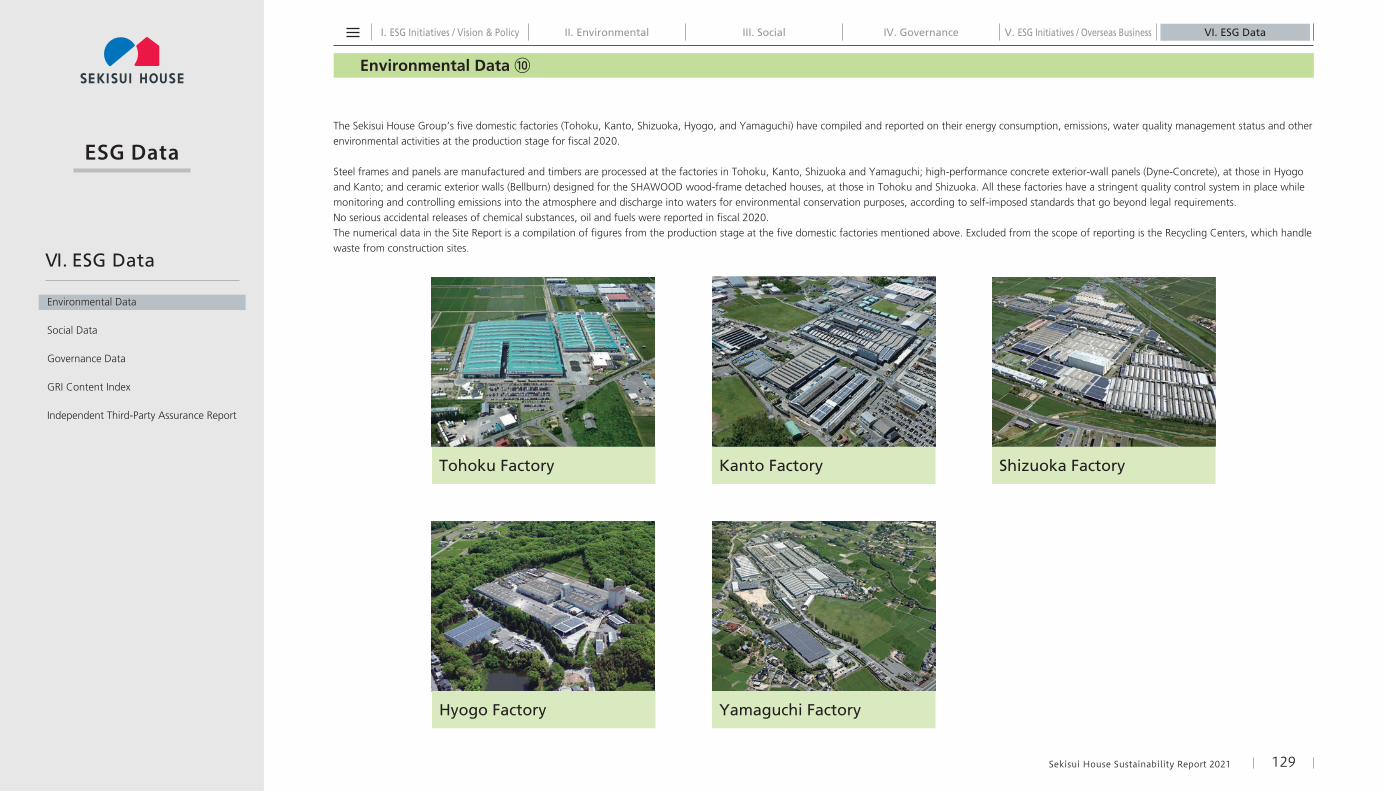
The Sekisui House Group’s five domestic factories (Tohoku, Kanto, Shizuoka, Hyogo, and Yamaguchi) have compiled and reported on their energy consumption, emissions, water quality management status and other environmental activities at the production stage for fiscal 2020.
Steel frames and panels are manufactured and timbers are processed at the factories in Tohoku, Kanto, Shizuoka and Yamaguchi; high-performance concrete exterior-wall panels (Dyne-Concrete), at those in Hyogo and Kanto; and ceramic exterior walls (Bellburn) designed for the SHAWOOD wood-frame detached houses, at those in Tohoku and Shizuoka. All these factories have a stringent quality control system in place while monitoring and controlling emissions into the atmosphere and discharge into waters for environmental conservation purposes, according to self-imposed standards that go beyond legal requirements.No serious accidental releases of chemical substances, oil and fuels were reported in fiscal 2020.The numerical data in the Site Report is a compilation of figures from the production stage at the five domestic factories mentioned above. Excluded from the scope of reporting is the Recycling Centers, which handle waste from construction sites.
Environmental Data
Social Data
Governance Data
GRI Content Index
Independent Third-Party Assurance Report
VI. ESG Data
I. ESG Initiatives / Vision & Policy III. Social IV. Governance VI. ESG DataV. ESG Initiatives / Overseas BusinessII. Environmental
ESG Data
Environmental Data ⑪ (Site Report)
Sekisui House Sustainability Report 2021 130
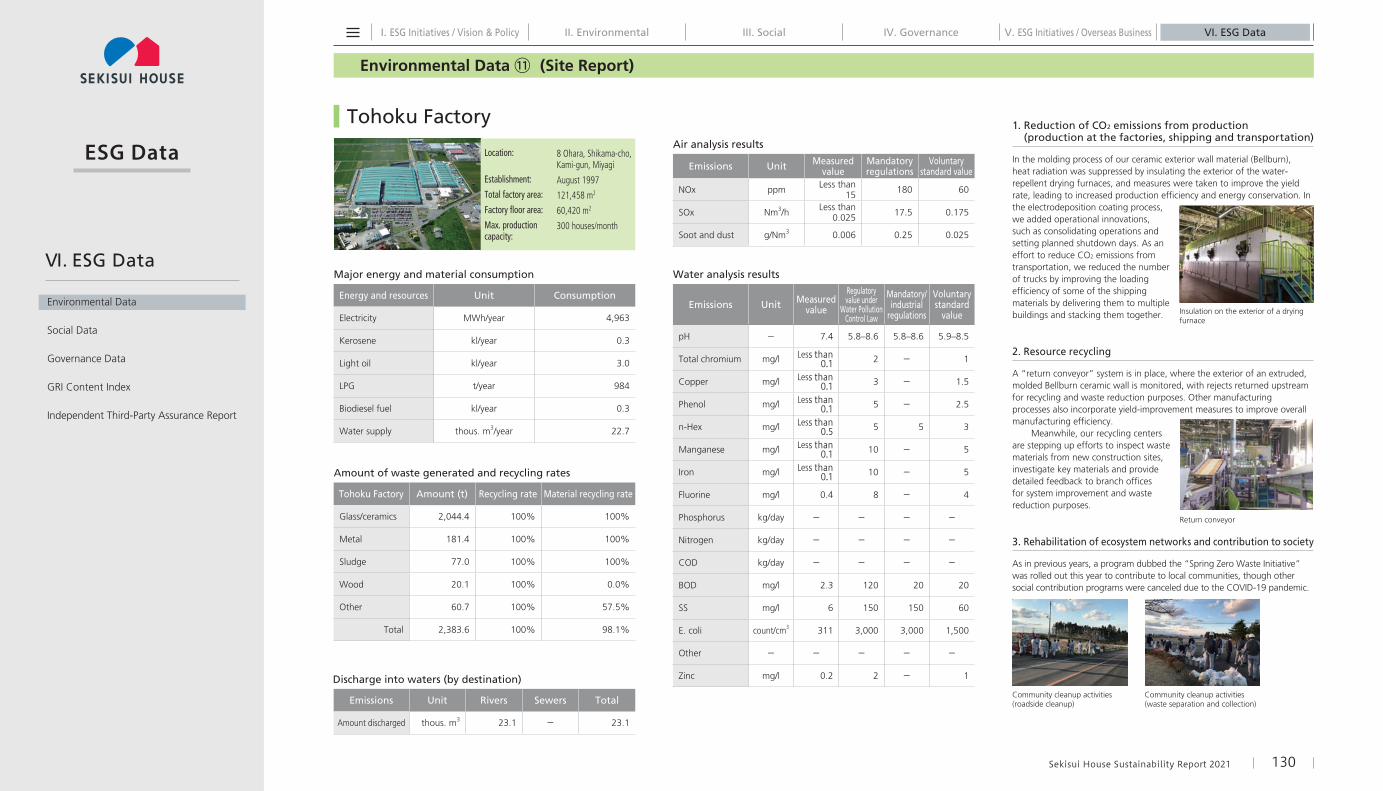
Location:
Establishment:
Total factory area:
Factory floor area:
Max. production capacity:
8 Ohara, Shikama-cho, Kami-gun, Miyagi
August 1997
121,458 m2
60,420 m2
300 houses/month
Energy and resources Unit Consumption
Electricity MWh/year 4,963
Kerosene kl/year 0.3
Light oil kl/year 3.0
LPG t/year 984
Biodiesel fuel kl/year 0.3
Water supply thous. m3/year 22.7
Tohoku Factory Amount (t) Recycling rate Material recycling rate
Glass/ceramics 2,044.4 100% 100%
Metal 181.4 100% 100%
Sludge 77.0 100% 100%
Wood 20.1 100% 0.0%
Other 60.7 100% 57.5%
Total 2,383.6 100% 98.1%
Emissions Unit Measured value
Mandatory regulations
Voluntary standard value
NOx ppm Less than 15 180 60
SOx Nm3/h Less than 0.025 17.5 0.175
Soot and dust g/Nm3 0.006 0.25 0.025
Emissions Unit Measured value
Regulatory value under
Water Pollution Control Law
Mandatory/industrial
regulations
Voluntary standard
value
pH − 7.4 5.8–8.6 5.8–8.6 5.9–8.5
Total chromium mg/l Less than 0.1 2 − 1
Copper mg/l Less than 0.1 3 − 1.5
Phenol mg/l Less than 0.1 5 − 2.5
n-Hex mg/l Less than 0.5 5 5 3
Manganese mg/l Less than 0.1 10 − 5
Iron mg/l Less than 0.1 10 − 5
Fluorine mg/l 0.4 8 − 4
Phosphorus kg/day − − − −
Nitrogen kg/day − − − −
COD kg/day − − − −
BOD mg/l 2.3 120 20 20
SS mg/l 6 150 150 60
E. coli count/cm3 311 3,000 3,000 1,500
Other − − − − −
Zinc mg/l 0.2 2 − 1
Emissions Unit Rivers Sewers Total
Amount discharged thous. m3 23.1 − 23.1
Major energy and material consumption
Tohoku Factory
Amount of waste generated and recycling rates
Air analysis results
Water analysis results
Discharge into waters (by destination)
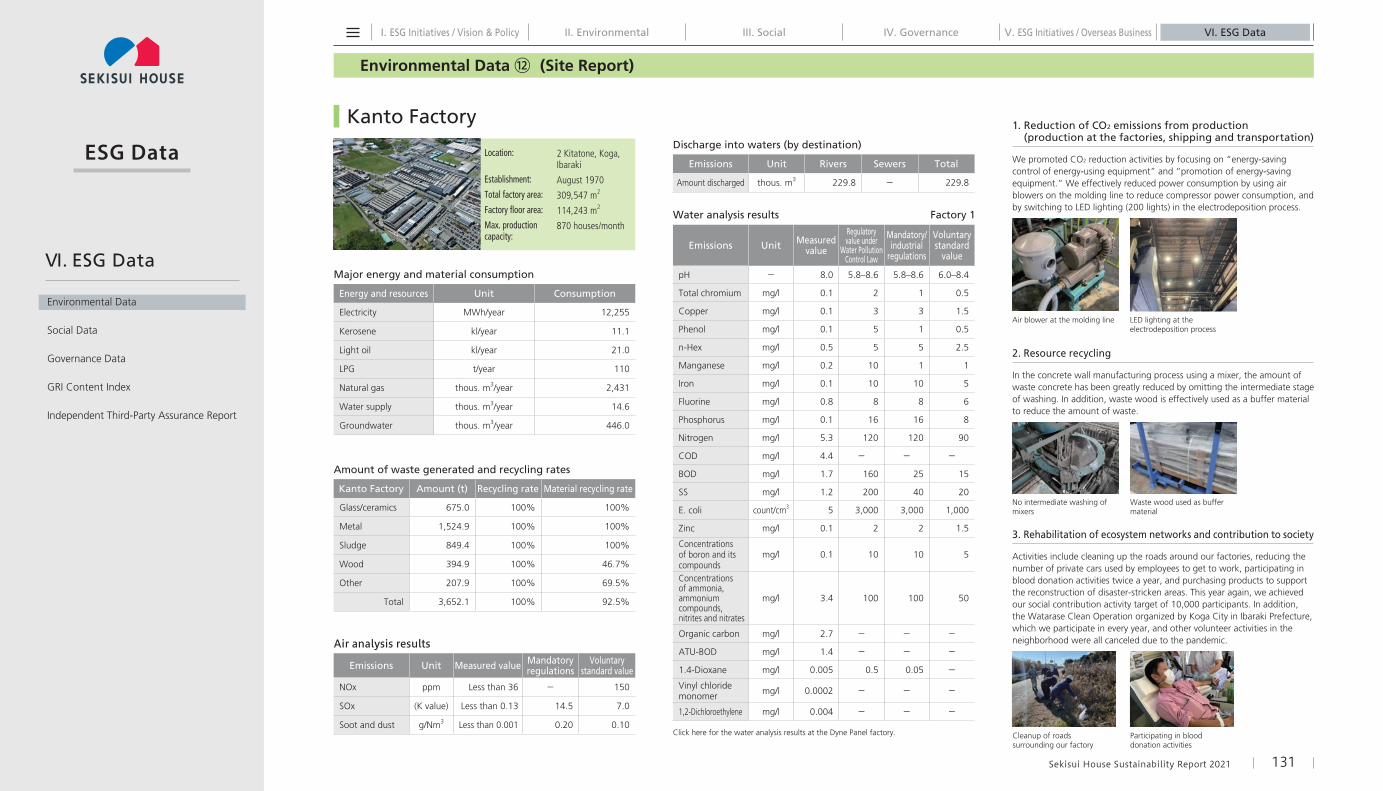
1. Reduction of CO2 emissions from production (production at the factories, shipping and transportation)
In the molding process of our ceramic exterior wall material (Bellburn), heat radiation was suppressed by insulating the exterior of the water-repellent drying furnaces, and measures were taken to improve the yield rate, leading to increased production efficiency and energy conservation. In the electrodeposition coating process, we added operational innovations, such as consolidating operations and setting planned shutdown days. As an effort to reduce CO2 emissions from transportation, we reduced the number of trucks by improving the loading efficiency of some of the shipping materials by delivering them to multiple buildings and stacking them together.
2. Resource recycling
A “return conveyor” system is in place, where the exterior of an extruded, molded Bellburn ceramic wall is monitored, with rejects returned upstream for recycling and waste reduction purposes. Other manufacturing processes also incorporate yield-improvement measures to improve overall manufacturing efficiency.
Meanwhile, our recycling centers are stepping up efforts to inspect waste materials from new construction sites, investigate key materials and provide detailed feedback to branch offices for system improvement and waste reduction purposes.
3. Rehabilitation of ecosystem networks and contribution to society
As in previous years, a program dubbed the “Spring Zero Waste Initiative” was rolled out this year to contribute to local communities, though other social contribution programs were canceled due to the COVID-19 pandemic.
Community cleanup activities (roadside cleanup)
Community cleanup activities (waste separation and collection)
Insulation on the exterior of a drying furnace
Return conveyor
Environmental Data
Social Data
Governance Data
GRI Content Index
Independent Third-Party Assurance Report
VI. ESG Data
I. ESG Initiatives / Vision & Policy III. Social IV. Governance VI. ESG DataV. ESG Initiatives / Overseas BusinessII. Environmental
ESG Data
Environmental Data ⑫ (Site Report)
Sekisui House Sustainability Report 2021 131
Energy and resources Unit Consumption
Electricity MWh/year 12,255
Kerosene kl/year 11.1
Light oil kl/year 21.0
LPG t/year 110
Natural gas thous. m3/year 2,431
Water supply thous. m3/year 14.6
Groundwater thous. m3/year 446.0
Kanto Factory Amount (t) Recycling rate Material recycling rate
Glass/ceramics 675.0 100% 100%
Metal 1,524.9 100% 100%
Sludge 849.4 100% 100%
Wood 394.9 100% 46.7%
Other 207.9 100% 69.5%
Total 3,652.1 100% 92.5%
Emissions Unit Measured value Mandatory regulations
Voluntary standard value
NOx ppm Less than 36 − 150
SOx (K value) Less than 0.13 14.5 7.0
Soot and dust g/Nm3 Less than 0.001 0.20 0.10
Emissions Unit Measured value
Regulatory value under
Water Pollution Control Law
Mandatory/industrial
regulations
Voluntary standard
value
pH − 8.0 5.8–8.6 5.8–8.6 6.0–8.4
Total chromium mg/l 0.1 2 1 0.5
Copper mg/l 0.1 3 3 1.5
Phenol mg/l 0.1 5 1 0.5
n-Hex mg/l 0.5 5 5 2.5
Manganese mg/l 0.2 10 1 1
Iron mg/l 0.1 10 10 5
Fluorine mg/l 0.8 8 8 6
Phosphorus mg/l 0.1 16 16 8
Nitrogen mg/l 5.3 120 120 90
COD mg/l 4.4 − − −BOD mg/l 1.7 160 25 15
SS mg/l 1.2 200 40 20
E. coli count/cm3 5 3,000 3,000 1,000
Zinc mg/l 0.1 2 2 1.5
Concentrations of boron and its compounds
mg/l 0.1 10 10 5
Concentrations of ammonia, ammonium compounds, nitrites and nitrates
mg/l 3.4 100 100 50
Organic carbon mg/l 2.7 − − −ATU-BOD mg/l 1.4 − − −1.4-Dioxane mg/l 0.005 0.5 0.05 −Vinyl chloride monomer mg/l 0.0002 − − −
1,2-Dichloroethylene mg/l 0.004 − − −
Click here for the water analysis results at the Dyne Panel factory.
Emissions Unit Rivers Sewers Total
Amount discharged thous. m3 229.8 − 229.8
Major energy and material consumption
Kanto Factory
Amount of waste generated and recycling rates
Air analysis results
Water analysis results Factory 1
Discharge into waters (by destination)
1. Reduction of CO2 emissions from production (production at the factories, shipping and transportation)
We promoted CO2 reduction activities by focusing on “energy-saving control of energy-using equipment” and “promotion of energy-saving equipment.” We effectively reduced power consumption by using air blowers on the molding line to reduce compressor power consumption, and by switching to LED lighting (200 lights) in the electrodeposition process.
LED lighting at the electrodeposition process
Air blower at the molding line
2. Resource recycling
In the concrete wall manufacturing process using a mixer, the amount of waste concrete has been greatly reduced by omitting the intermediate stage of washing. In addition, waste wood is effectively used as a buffer material to reduce the amount of waste.
No intermediate washing of mixers
Waste wood used as buffer material
3. Rehabilitation of ecosystem networks and contribution to society
Activities include cleaning up the roads around our factories, reducing the number of private cars used by employees to get to work, participating in blood donation activities twice a year, and purchasing products to support the reconstruction of disaster-stricken areas. This year again, we achieved our social contribution activity target of 10,000 participants. In addition, the Watarase Clean Operation organized by Koga City in Ibaraki Prefecture, which we participate in every year, and other volunteer activities in the neighborhood were all canceled due to the pandemic.
Cleanup of roads surrounding our factory
Participating in blood donation activities
Location:
Establishment:
Total factory area:
Factory floor area:
Max. production capacity:
2 Kitatone, Koga, Ibaraki
August 1970
309,547 m2
114,243 m2
870 houses/month
Environmental Data
Social Data
Governance Data
GRI Content Index
Independent Third-Party Assurance Report
VI. ESG Data
I. ESG Initiatives / Vision & Policy III. Social IV. Governance VI. ESG DataV. ESG Initiatives / Overseas BusinessII. Environmental
ESG Data
Environmental Data ⑬ (Site Report)
Sekisui House Sustainability Report 2021 132
Energy and resources Unit Consumption
Electricity MWh/year 12,778
Kerosene kl/year 0.3
Light oil kl/year 0.4
LPG t/year 152
LNG thous. m3/year 1,333
Water supply thous. m3/year 32.1
Industrial-use water thous. m3/year 26.5
Shizuoka Factory Amount (t) Recycling rate Material recycling rate
Glass/ceramics 2,064.6 100% 100%
Metal 1,541.3 100% 100%
Sludge 596.2 100% 78.2%
Wood 551.0 100% 100.0%
Other 345.7 100% 55.3%
Total 5,098.8 100% 94.4%
Emissions Unit Measured value
Mandatory regulations
Voluntary standard value
NOx cm3/Nm3 2 230 42
SOx Nm3/h 0.1 1.77 0.62
Soot and dust g/Nm3 Less than 0.010 0.2 0.05
Emissions Unit Measured value
Regulatory value under
Water Pollution Control Law
Mandatory/industrial
regulations
Voluntary standard
value
pH − 7.7 5.8–8.6 5.8–8.6 6–8
Total chromium mg/l Less than 0.1 2 2 −
Copper mg/l Less than 0.05 3 1 −
Phenol mg/l Less than 0.05 5 5 −
n-Hex mg/l Less than 0.5 5 3 2
Manganese mg/l Less than 0.1 10 10 −
Iron mg/l 0.1 10 10 3
Fluorine mg/l Less than 0.2 8 0.8 −
Phosphorus kg/day − − − −
Nitrogen kg/day − − − −
COD kg/day − − − −
BOD mg/l 1.9 160 20 10
SS mg/l 2.2 160 30 10
E. coli count/cm3 0 3,000 3,000 100
Other − − − − −Ammonia, ammonium compounds, nitrites and nitrates
mg/l 1.8 100 10 5
Zinc concentration mg/l 0.07 2 1 0.5
Emissions Unit Rivers Sewers Total
Amount discharged thous. m3 46.5 2.3 48.9
Major energy and material consumption
Shizuoka Factory
Amount of waste generated and recycling rates
Air analysis results
Water analysis results
Discharge into waters (by destination)
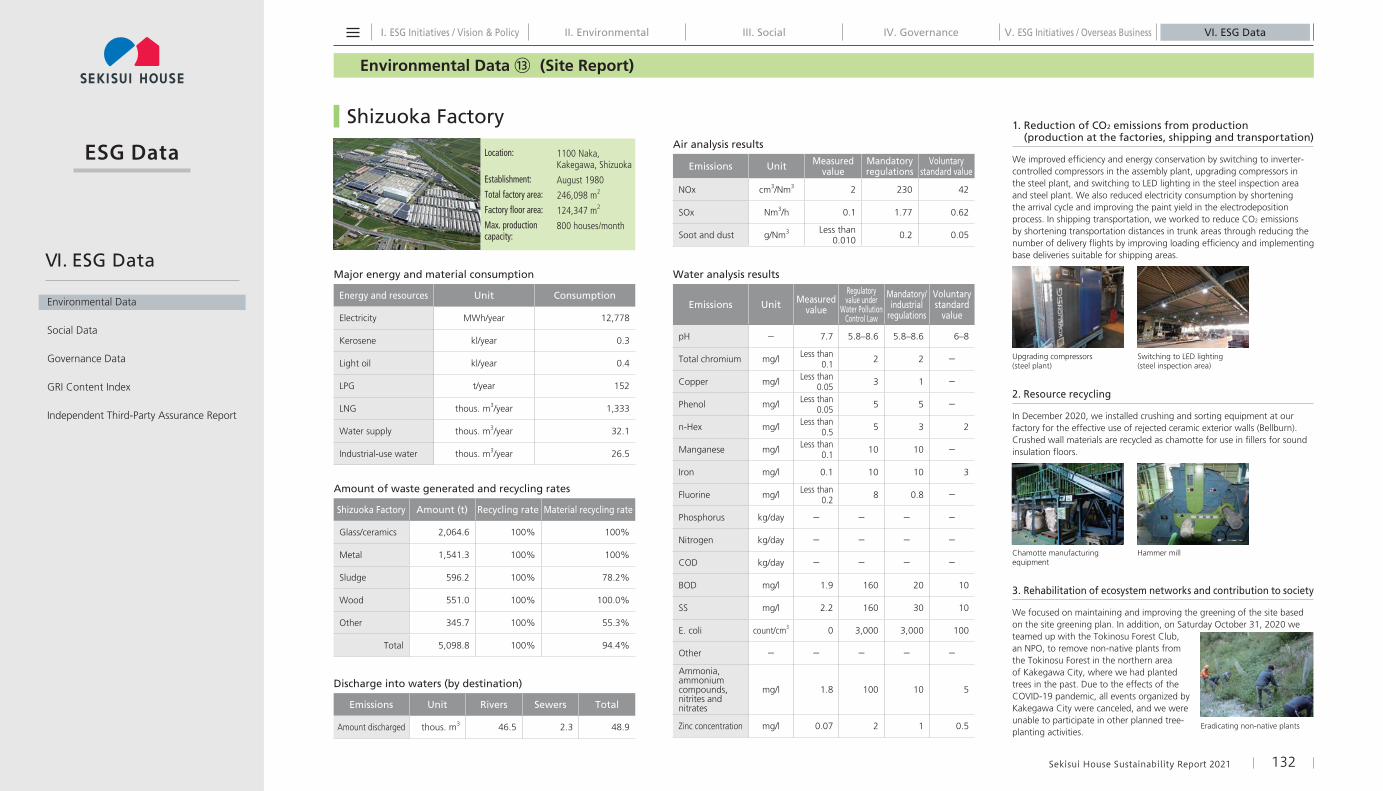
1. Reduction of CO2 emissions from production (production at the factories, shipping and transportation)
We improved efficiency and energy conservation by switching to inverter-controlled compressors in the assembly plant, upgrading compressors in the steel plant, and switching to LED lighting in the steel inspection area and steel plant. We also reduced electricity consumption by shortening the arrival cycle and improving the paint yield in the electrodeposition process. In shipping transportation, we worked to reduce CO2 emissions by shortening transportation distances in trunk areas through reducing the number of delivery flights by improving loading efficiency and implementing base deliveries suitable for shipping areas.
Upgrading compressors (steel plant)
Switching to LED lighting (steel inspection area)
2. Resource recycling
In December 2020, we installed crushing and sorting equipment at our factory for the effective use of rejected ceramic exterior walls (Bellburn). Crushed wall materials are recycled as chamotte for use in fillers for sound insulation floors.
Chamotte manufacturing equipment
Hammer mill
3. Rehabilitation of ecosystem networks and contribution to society
We focused on maintaining and improving the greening of the site based on the site greening plan. In addition, on Saturday October 31, 2020 we teamed up with the Tokinosu Forest Club, an NPO, to remove non-native plants from the Tokinosu Forest in the northern area of Kakegawa City, where we had planted trees in the past. Due to the effects of the COVID-19 pandemic, all events organized by Kakegawa City were canceled, and we were unable to participate in other planned tree-planting activities.
Eradicating non-native plants
Location:
Establishment:
Total factory area:
Factory floor area:
Max. production capacity:
1100 Naka, Kakegawa, Shizuoka
August 1980
246,098 m2
124,347 m2
800 houses/month
Environmental Data
Social Data
Governance Data
GRI Content Index
Independent Third-Party Assurance Report
VI. ESG Data
I. ESG Initiatives / Vision & Policy III. Social IV. Governance VI. ESG DataV. ESG Initiatives / Overseas BusinessII. Environmental
ESG Data
Environmental Data ⑭ (Site Report)
Sekisui House Sustainability Report 2021 133
Energy and resources Unit Consumption
Electricity MWh/year 2,196
Light oil kl/year 17.0
LPG t/year 26
Natural gas thous. m3/year 906
Water supply thous. m3/year 25.7
Groundwater thous. m3/year 3.7
Hyogo Factory Amount (t) Recycling rate Material recycling rate
Glass/ceramics 726.6 100% 100%
Metal 15.3 100% 100%
Sludge 58.0 100% 100%
Wood 2.1 100% 100%
Other 68.4 100% 100%
Total 870.4 100% 100%
Emissions Unit Measured value
Mandatory regulations
Voluntary standard value
NOx ppm 33 150 75
SOx Nm3/h 0.0026 1.5 0.01
Soot and dust g/Nm3 0.0018 0.1 0.01
Emissions Unit Measured value
Regulatory value under
Water Pollution Control Law
Mandatory/industrial
regulations
Voluntary standard
value
pH − 7.7 − − 6.2–8.2
Total chromium mg/l − − − −
Copper mg/l − − − −
Phenol mg/l − − − −
n-Hex mg/l ≤1 − − 2
Manganese mg/l − − − −
Iron mg/l − − − −
Fluorine mg/l − − − −
Phosphorus kg/day − − − −
Nitrogen kg/day − − − −
COD mg/l 12.58 − − 70
BOD mg/l 9.00 − − 70
SS mg/l 5.15 − − 25
E. coli count/cm3 5.5 − − 1,500
Other − − − − −Ammonia and ammonium compounds
mg/l − − − −
Zinc mg/l 0.02 − − 2
Note: The Water Pollution Control Law does not apply to the Hyogo Factory.
Emissions Unit Rivers Sewers Total
Amount discharged thous. m3 4.8 5.7 10.5
Major energy and material consumption
Hyogo Factory
Amount of waste generated and recycling rates
Air analysis results
Water analysis results
Discharge into waters (by destination)
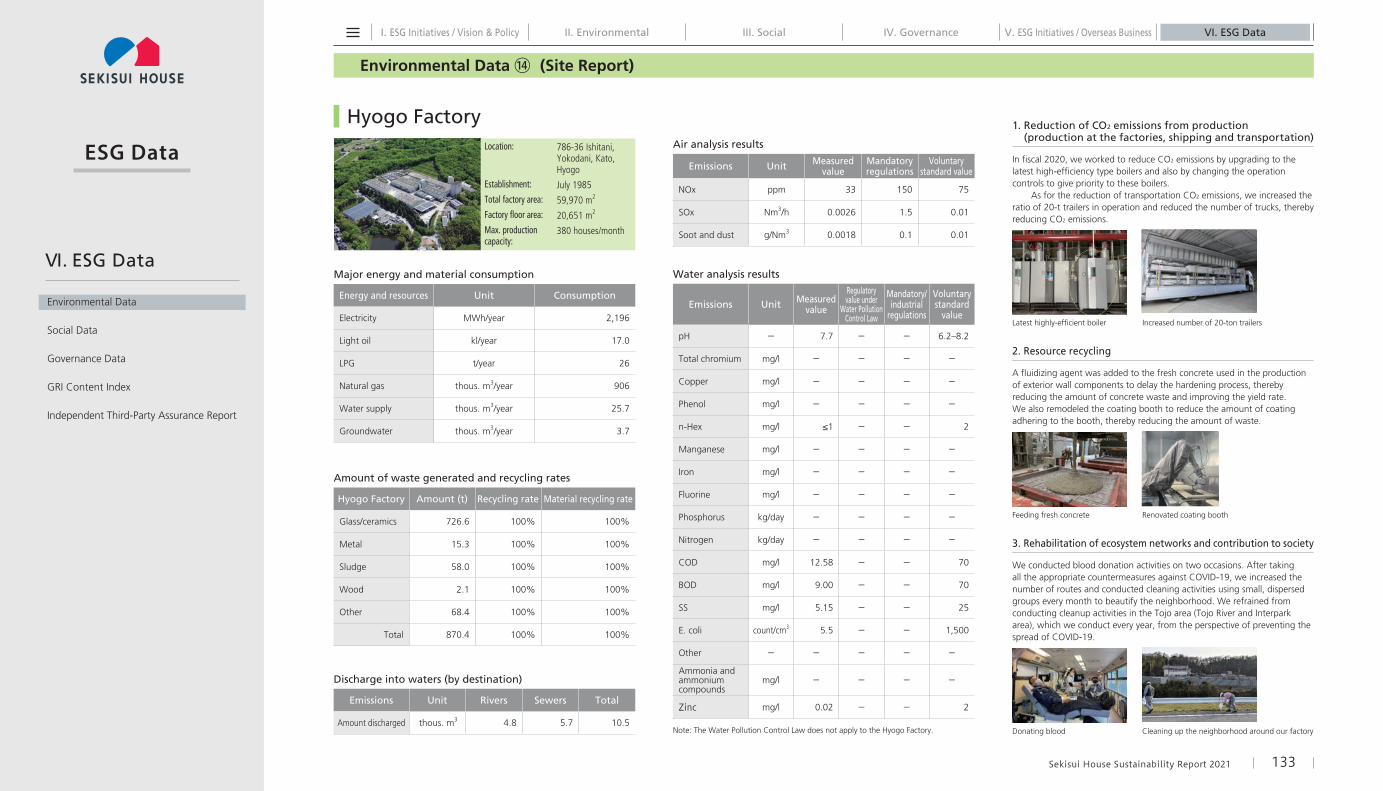
1. Reduction of CO2 emissions from production (production at the factories, shipping and transportation)
In fiscal 2020, we worked to reduce CO2 emissions by upgrading to the latest high-efficiency type boilers and also by changing the operation controls to give priority to these boilers.
As for the reduction of transportation CO2 emissions, we increased the ratio of 20-t trailers in operation and reduced the number of trucks, thereby reducing CO2 emissions.
Latest highly-efficient boiler Increased number of 20-ton trailers
2. Resource recycling
A fluidizing agent was added to the fresh concrete used in the production of exterior wall components to delay the hardening process, thereby reducing the amount of concrete waste and improving the yield rate. We also remodeled the coating booth to reduce the amount of coating adhering to the booth, thereby reducing the amount of waste.
Feeding fresh concrete Renovated coating booth
3. Rehabilitation of ecosystem networks and contribution to society
We conducted blood donation activities on two occasions. After taking all the appropriate countermeasures against COVID-19, we increased the number of routes and conducted cleaning activities using small, dispersed groups every month to beautify the neighborhood. We refrained from conducting cleanup activities in the Tojo area (Tojo River and Interpark area), which we conduct every year, from the perspective of preventing the spread of COVID-19.
Donating blood Cleaning up the neighborhood around our factory
Location:
Establishment:
Total factory area:
Factory floor area:
Max. production capacity:
786-36 Ishitani, Yokodani, Kato, Hyogo
July 1985
59,970 m2
20,651 m2
380 houses/month
Environmental Data
Social Data
Governance Data
GRI Content Index
Independent Third-Party Assurance Report
VI. ESG Data
I. ESG Initiatives / Vision & Policy III. Social IV. Governance VI. ESG DataV. ESG Initiatives / Overseas BusinessII. Environmental
ESG Data
Environmental Data ⑮ (Site Report)
Sekisui House Sustainability Report 2021 134
Energy and resources Unit Consumption
Electricity MWh/year 5,984
Kerosene kl/year 172.4
Light oil kl/year 1.8
LPG t/year 457
Water supply thous. m3/year 30.7
Groundwater thous. m3/year 12.7
Yamaguchi Factory Amount (t) Recycling rate Material recycling rate
Glass/ceramics 23.5 100% 100%
Metal 610.8 100% 100%
Sludge 151.4 100% 100%
Wood 310.4 100% 68.7%
Other 109.4 100% 45.5%
Total 1,205.5 100% 87.0%
Emissions Unit Measured value
Mandatory regulations
Voluntary standard value
NOx ppm 45 250 125
SOx Nm3/h 0 3.43 1.72
Soot and dust g/Nm3 0.013 0.3 0.25
Emissions Unit Measured value
Regulatory value under
Water Pollution Control Law
Mandatory/industrial
regulations
Voluntary standard
value
pH − 7.1 5.8–8.6 5.8–8.6 6.0–8.0
Total chromium mg/l 0 2 2 *
Copper mg/l 0 3 3 0.1
Phenol mg/l 0 5 5 2.5
n-Hex mg/l 0 5 5 2.5
Manganese mg/l 1.0 10 10 5
Iron mg/l 0 10 10 5
Fluorine mg/l 1.2 8 8 5
Phosphorus kg/day 0.1 1.56 − 1.5
Nitrogen kg/day 1.7 11.88 − 6
COD kg/day 3.2 10.4 − 10
BOD mg/l 5.8 160 160 60
SS mg/l 4.3 200 200 75
E. coli count/cm3 0.3 3,000 3,000 1,500
Ammonia and ammonium compounds
mg/l 6.6 100 − 50
Zinc mg/l 0.58 2 − 1.8
* Should not be detectedEmissions Unit Rivers Sewers Total
Amount discharged thous. m3 41.0 − 41.0
Major energy and material consumption
Yamaguchi Factory
Amount of waste generated and recycling rates
Air analysis results
Water analysis results
Discharge into waters (by destination)
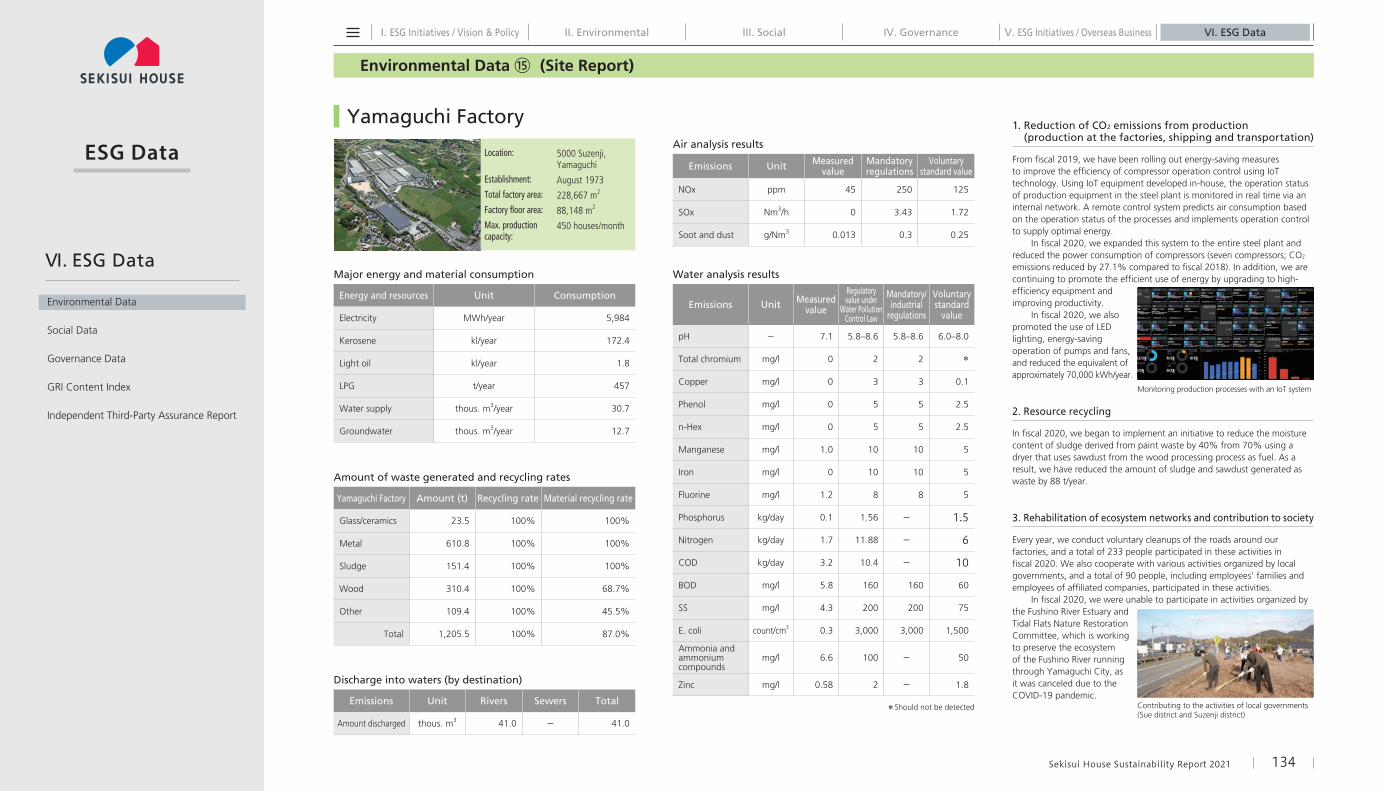
1. Reduction of CO2 emissions from production (production at the factories, shipping and transportation)
From fiscal 2019, we have been rolling out energy-saving measures to improve the efficiency of compressor operation control using IoT technology. Using IoT equipment developed in-house, the operation status of production equipment in the steel plant is monitored in real time via an internal network. A remote control system predicts air consumption based on the operation status of the processes and implements operation control to supply optimal energy.
In fiscal 2020, we expanded this system to the entire steel plant and reduced the power consumption of compressors (seven compressors; CO2 emissions reduced by 27.1% compared to fiscal 2018). In addition, we are continuing to promote the efficient use of energy by upgrading to high-efficiency equipment and improving productivity.
In fiscal 2020, we also promoted the use of LED lighting, energy-saving operation of pumps and fans, and reduced the equivalent of approximately 70,000 kWh/year.
2. Resource recycling
In fiscal 2020, we began to implement an initiative to reduce the moisture content of sludge derived from paint waste by 40% from 70% using a dryer that uses sawdust from the wood processing process as fuel. As a result, we have reduced the amount of sludge and sawdust generated as waste by 88 t/year.
3. Rehabilitation of ecosystem networks and contribution to society
Every year, we conduct voluntary cleanups of the roads around our factories, and a total of 233 people participated in these activities in fiscal 2020. We also cooperate with various activities organized by local governments, and a total of 90 people, including employees’ families and employees of affiliated companies, participated in these activities.
In fiscal 2020, we were unable to participate in activities organized by the Fushino River Estuary and Tidal Flats Nature Restoration Committee, which is working to preserve the ecosystem of the Fushino River running through Yamaguchi City, as it was canceled due to the COVID-19 pandemic.
Monitoring production processes with an IoT system
Contributing to the activities of local governments (Sue district and Suzenji district)
Location:
Establishment:
Total factory area:
Factory floor area:
Max. production capacity:
5000 Suzenji, Yamaguchi
August 1973
228,667 m2
88,148 m2
450 houses/month
Environmental Data
Social Data
Governance Data
GRI Content Index
Independent Third-Party Assurance Report
VI. ESG Data
I. ESG Initiatives / Vision & Policy III. Social IV. Governance VI. ESG DataV. ESG Initiatives / Overseas BusinessII. Environmental
ESG Data
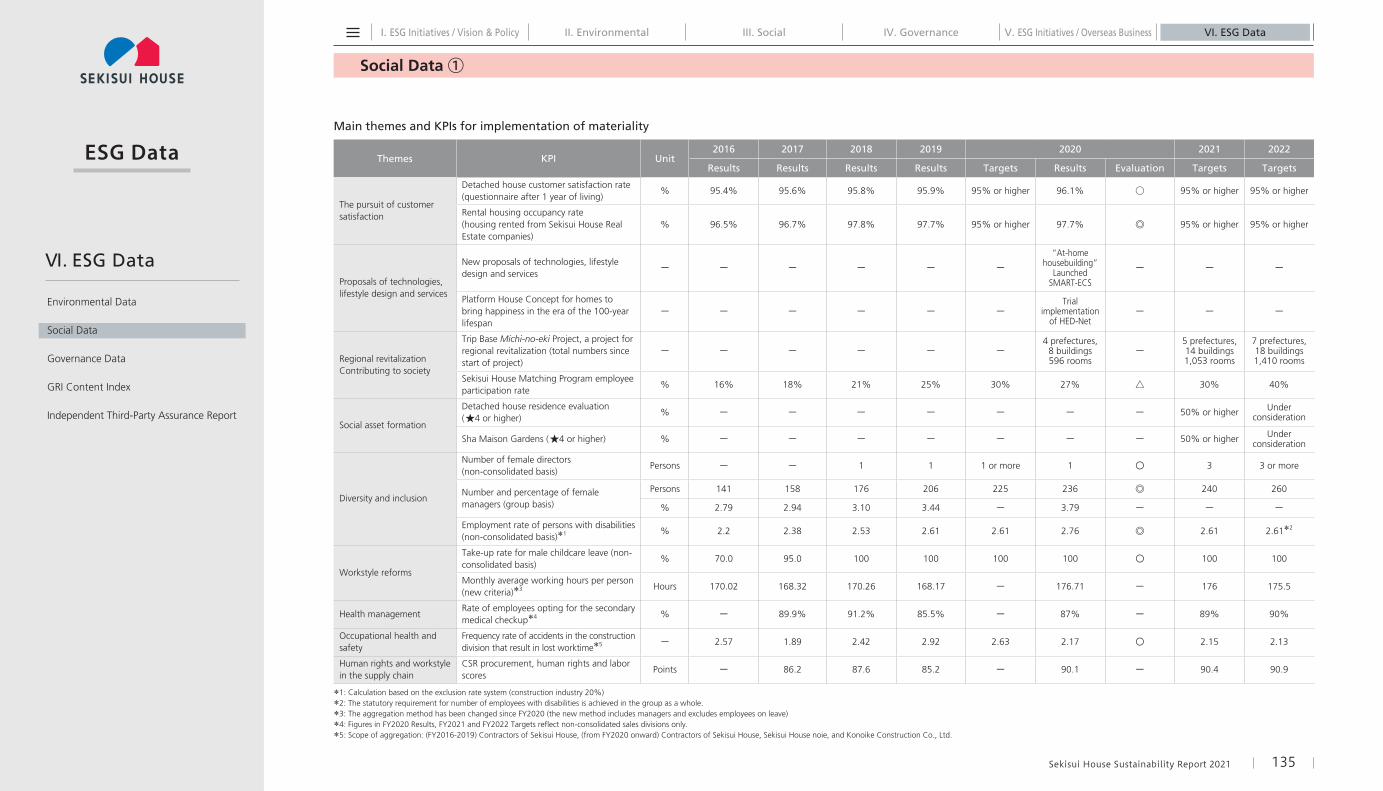
Social Data ①
Sekisui House Sustainability Report 2021 135
Main themes and KPIs for implementation of materiality
Themes KPI Unit2016 2017 2018 2019 2020 2021 2022
Results Results Results Results Targets Results Evaluation Targets Targets
The pursuit of customer satisfaction
Detached house customer satisfaction rate (questionnaire after 1 year of living)
% 95.4% 95.6% 95.8% 95.9% 95% or higher 96.1% ○ 95% or higher 95% or higher
Rental housing occupancy rate (housing rented from Sekisui House Real Estate companies)
% 96.5% 96.7% 97.8% 97.7% 95% or higher 97.7% ◎ 95% or higher 95% or higher
Proposals of technologies, lifestyle design and services
New proposals of technologies, lifestyle design and services
ー ー ー ー ー ー“At-home
housebuilding” Launched
SMART-ECS
ー ー ー
Platform House Concept for homes to bring happiness in the era of the 100-year lifespan
ー ー ー ー ー ーTrial
implementation of HED-Net
ー ー ー
Regional revitalization Contributing to society
Trip Base Michi-no-eki Project, a project for regional revitalization (total numbers since start of project)
ー ー ー ー ー ー4 prefectures,
8 buildings596 rooms
ー5 prefectures, 14 buildings1,053 rooms
7 prefectures, 18 buildings1,410 rooms
Sekisui House Matching Program employee participation rate
% 16% 18% 21% 25% 30% 27% △ 30% 40%
Social asset formation
Detached house residence evaluation (★4 or higher)
% ー ー ー ー ー ー ー 50% or higher Under consideration
Sha Maison Gardens (★4 or higher) % ー ー ー ー ー ー ー 50% or higher Under consideration
Diversity and inclusion
Number of female directors (non-consolidated basis)
Persons ー ー 1 1 1 or more 1 〇 3 3 or more
Number and percentage of female managers (group basis)
Persons 141 158 176 206 225 236 ◎ 240 260
% 2.79 2.94 3.10 3.44 ー 3.79 ー ー ー
Employment rate of persons with disabilities (non-consolidated basis)*1 % 2.2 2.38 2.53 2.61 2.61 2.76 ◎ 2.61 2.61*2
Workstyle reforms
Take-up rate for male childcare leave (non-consolidated basis)
% 70.0 95.0 100 100 100 100 〇 100 100
Monthly average working hours per person (new criteria)*3 Hours 170.02 168.32 170.26 168.17 ー 176.71 ー 176 175.5
Health managementRate of employees opting for the secondary medical checkup*4 % ー 89.9% 91.2% 85.5% ー 87% ー 89% 90%
Occupational health and safety
Frequency rate of accidents in the construction division that result in lost worktime*5 ー 2.57 1.89 2.42 2.92 2.63 2.17 〇 2.15 2.13
Human rights and workstyle in the supply chain
CSR procurement, human rights and labor scores
Points ー 86.2 87.6 85.2 ー 90.1 ー 90.4 90.9
*1: Calculation based on the exclusion rate system (construction industry 20%)
*2: The statutory requirement for number of employees with disabilities is achieved in the group as a whole.
*3: The aggregation method has been changed since FY2020 (the new method includes managers and excludes employees on leave)
*4: Figures in FY2020 Results, FY2021 and FY2022 Targets reflect non-consolidated sales divisions only.
*5: Scope of aggregation: (FY2016-2019) Contractors of Sekisui House, (from FY2020 onward) Contractors of Sekisui House, Sekisui House noie, and Konoike Construction Co., Ltd.
Environmental Data
Social Data
Governance Data
GRI Content Index
Independent Third-Party Assurance Report
VI. ESG Data
I. ESG Initiatives / Vision & Policy III. Social IV. Governance VI. ESG DataV. ESG Initiatives / Overseas BusinessII. Environmental
ESG Data
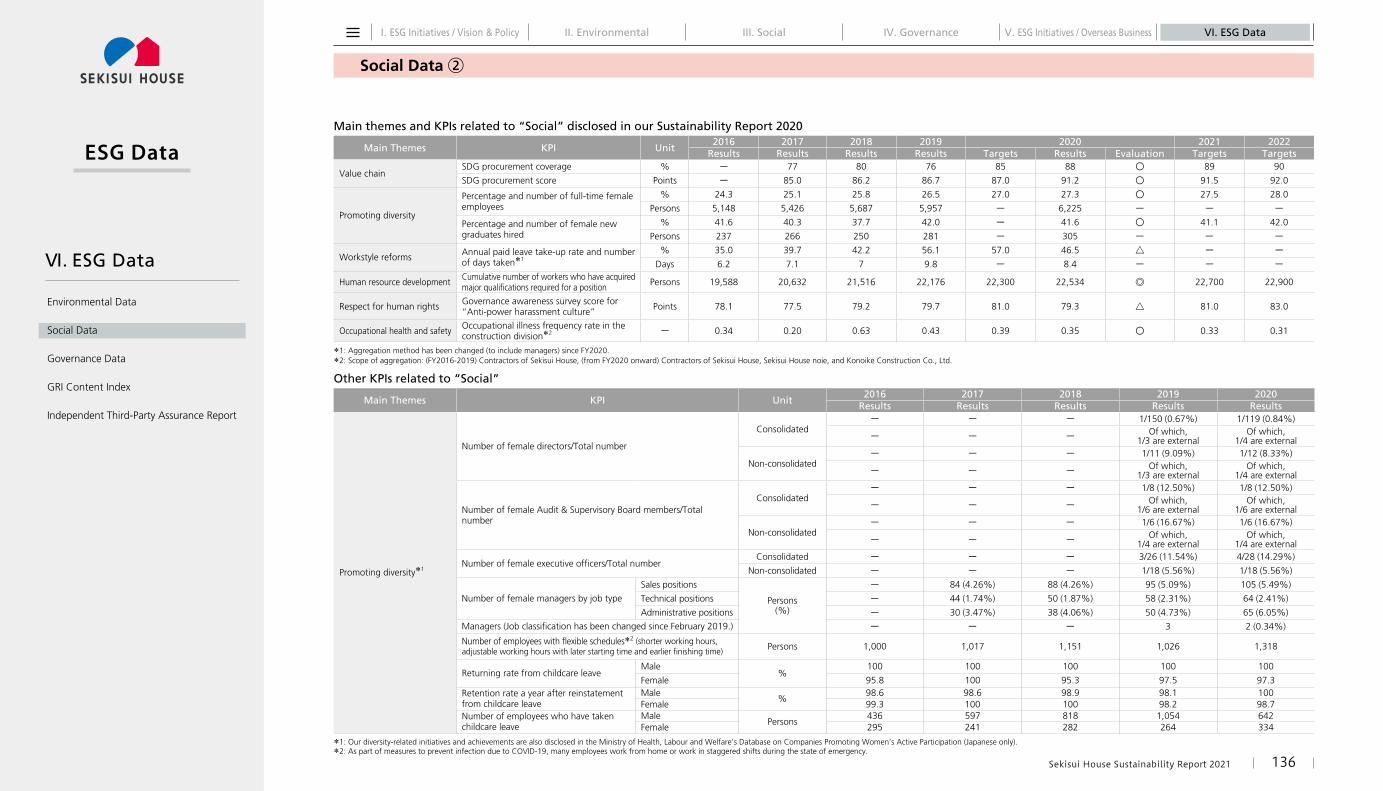
Social Data ②
Sekisui House Sustainability Report 2021 136
Main themes and KPIs related to “Social” disclosed in our Sustainability Report 2020
Main Themes KPI Unit2016 2017 2018 2019 2020 2021 2022
Results Results Results Results Targets Results Evaluation Targets Targets
Value chainSDG procurement coverage % ー 77 80 76 85 88 〇 89 90
SDG procurement score Points ー 85.0 86.2 86.7 87.0 91.2 〇 91.5 92.0
Promoting diversity
Percentage and number of full-time female employees
% 24.3 25.1 25.8 26.5 27.0 27.3 〇 27.5 28.0
Persons 5,148 5,426 5,687 5,957 ー 6,225 ー ー ーPercentage and number of female new graduates hired
% 41.6 40.3 37.7 42.0 ー 41.6 〇 41.1 42.0
Persons 237 266 250 281 ー 305 ー ー ー
Workstyle reforms Annual paid leave take-up rate and number of days taken*1
% 35.0 39.7 42.2 56.1 57.0 46.5 △ ー ーDays 6.2 7.1 7 9.8 ー 8.4 ー ー ー
Human resource development Cumulative number of workers who have acquired major qualifications required for a position Persons 19,588 20,632 21,516 22,176 22,300 22,534 ◎ 22,700 22,900
Respect for human rights Governance awareness survey score for “Anti-power harassment culture” Points 78.1 77.5 79.2 79.7 81.0 79.3 △ 81.0 83.0
Occupational health and safety Occupational illness frequency rate in the construction division*2 ー 0.34 0.20 0.63 0.43 0.39 0.35 〇 0.33 0.31
*1: Aggregation method has been changed (to include managers) since FY2020.
*2: Scope of aggregation: (FY2016-2019) Contractors of Sekisui House, (from FY2020 onward) Contractors of Sekisui House, Sekisui House noie, and Konoike Construction Co., Ltd.
Other KPIs related to “Social”
Main Themes KPI Unit2016 2017 2018 2019 2020
Results Results Results Results Results
Promoting diversity*1
Number of female directors/Total number
Consolidated ー ー ー 1/150 (0.67%) 1/119 (0.84%)
ー ー ー Of which, 1/3 are external
Of which, 1/4 are external
Non-consolidated ー ー ー 1/11 (9.09%) 1/12 (8.33%)
ー ー ー Of which, 1/3 are external
Of which, 1/4 are external
Number of female Audit & Supervisory Board members/Total number
Consolidated ー ー ー 1/8 (12.50%) 1/8 (12.50%)
ー ー ー Of which, 1/6 are external
Of which, 1/6 are external
Non-consolidated ー ー ー 1/6 (16.67%) 1/6 (16.67%)
ー ー ー Of which, 1/4 are external
Of which, 1/4 are external
Number of female executive officers/Total numberConsolidated ー ー ー 3/26 (11.54%) 4/28 (14.29%)
Non-consolidated ー ー ー 1/18 (5.56%) 1/18 (5.56%)
Number of female managers by job type
Sales positions
Persons(%)
ー 84 (4.26%) 88 (4.26%) 95 (5.09%) 105 (5.49%)
Technical positions ー 44 (1.74%) 50 (1.87%) 58 (2.31%) 64 (2.41%)
Administrative positions ー 30 (3.47%) 38 (4.06%) 50 (4.73%) 65 (6.05%)
Managers (Job classification has been changed since February 2019.) ー ー ー 3 2 (0.34%)
Number of employees with flexible schedules*2 (shorter working hours, adjustable working hours with later starting time and earlier finishing time) Persons 1,000 1,017 1,151 1,026 1,318
Returning rate from childcare leaveMale
%100 100 100 100 100
Female 95.8 100 95.3 97.5 97.3Retention rate a year after reinstatement from childcare leave
Male %
98.6 98.6 98.9 98.1 100Female 99.3 100 100 98.2 98.7
Number of employees who have taken childcare leave
Male Persons
436 597 818 1,054 642Female 295 241 282 264 334
*1: Our diversity-related initiatives and achievements are also disclosed in the Ministry of Health, Labour and Welfare’s Database on Companies Promoting Women’s Active Participation (Japanese only).*2: As part of measures to prevent infection due to COVID-19, many employees work from home or work in staggered shifts during the state of emergency.
Environmental Data
Social Data
Governance Data
GRI Content Index
Independent Third-Party Assurance Report
VI. ESG Data
I. ESG Initiatives / Vision & Policy III. Social IV. Governance VI. ESG DataV. ESG Initiatives / Overseas BusinessII. Environmental
ESG Data
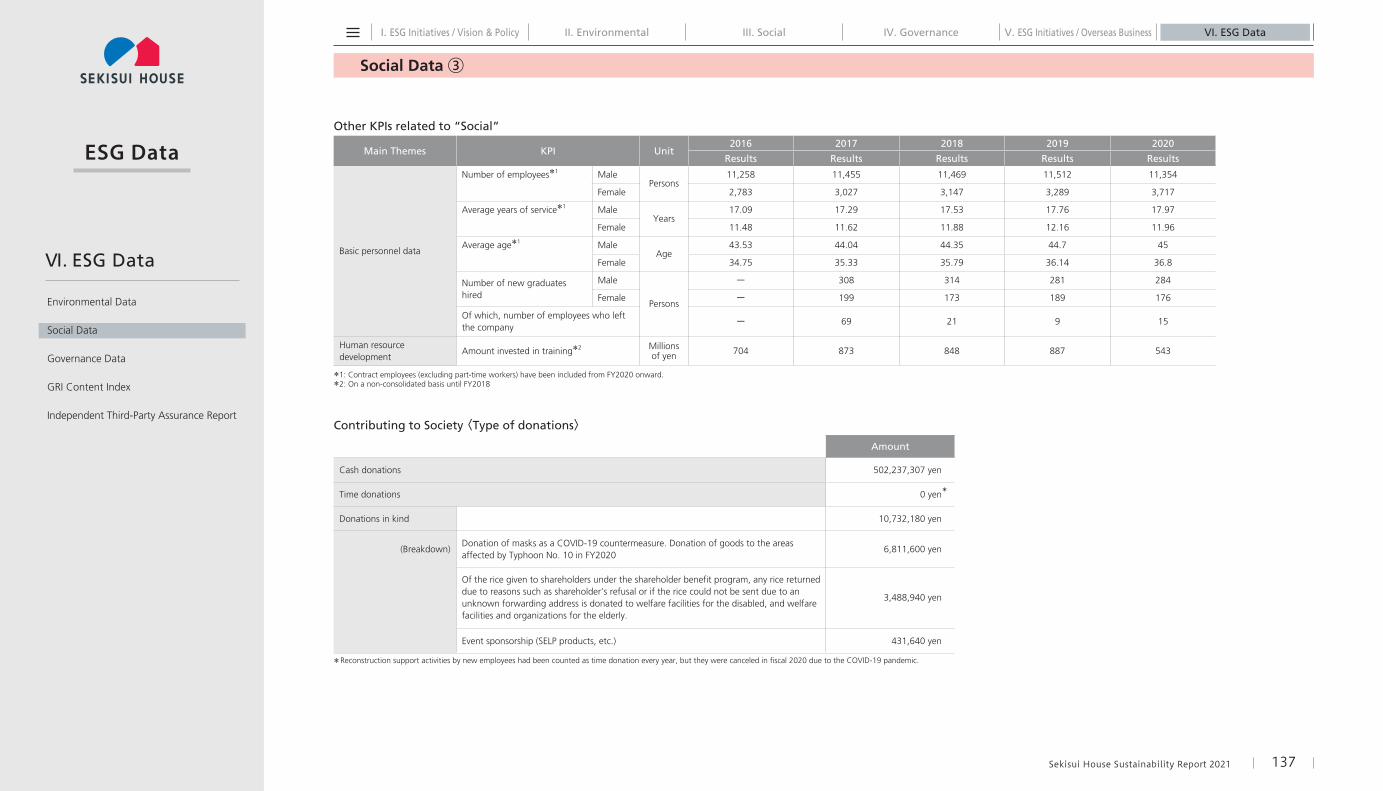
Social Data ③
Other KPIs related to “Social”
Main Themes KPI Unit2016 2017 2018 2019 2020
Results Results Results Results Results
Basic personnel data
Number of employees*1 MalePersons
11,258 11,455 11,469 11,512 11,354
Female 2,783 3,027 3,147 3,289 3,717
Average years of service*1 MaleYears
17.09 17.29 17.53 17.76 17.97
Female 11.48 11.62 11.88 12.16 11.96
Average age*1 MaleAge
43.53 44.04 44.35 44.7 45
Female 34.75 35.33 35.79 36.14 36.8
Number of new graduates hired
Male
Persons
ー 308 314 281 284
Female ー 199 173 189 176
Of which, number of employees who left the company
ー 69 21 9 15
Human resource development
Amount invested in training*2 Millions of yen 704 873 848 887 543
*1: Contract employees (excluding part-time workers) have been included from FY2020 onward.*2: On a non-consolidated basis until FY2018
Contributing to Society 〈Type of donations〉Amount
Cash donations 502,237,307 yen
Time donations 0 yen*
Donations in kind 10,732,180 yen
(Breakdown)Donation of masks as a COVID-19 countermeasure. Donation of goods to the areas affected by Typhoon No. 10 in FY2020
6,811,600 yen
Of the rice given to shareholders under the shareholder benefit program, any rice returned due to reasons such as shareholder’s refusal or if the rice could not be sent due to an unknown forwarding address is donated to welfare facilities for the disabled, and welfare facilities and organizations for the elderly.
3,488,940 yen
Event sponsorship (SELP products, etc.) 431,640 yen
* Reconstruction support activities by new employees had been counted as time donation every year, but they were canceled in fiscal 2020 due to the COVID-19 pandemic.
Sekisui House Sustainability Report 2021 137
Environmental Data
Social Data
Governance Data
GRI Content Index
Independent Third-Party Assurance Report
VI. ESG Data
I. ESG Initiatives / Vision & Policy III. Social IV. Governance VI. ESG DataV. ESG Initiatives / Overseas BusinessII. Environmental
ESG Data
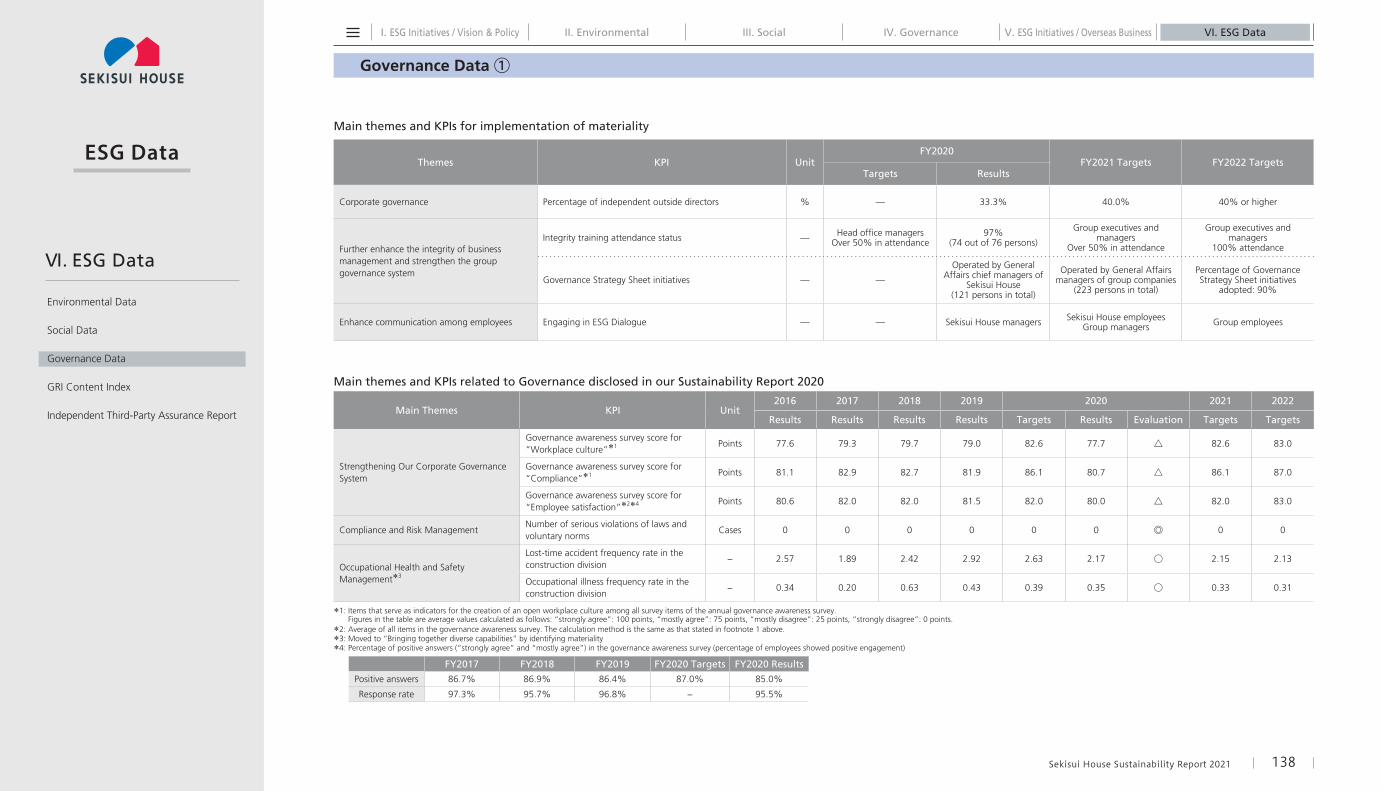
Governance Data ①
Sekisui House Sustainability Report 2021 138
Main themes and KPIs for implementation of materiality
Themes KPI UnitFY2020
FY2021 Targets FY2022 TargetsTargets Results
Corporate governance Percentage of independent outside directors % — 33.3% 40.0% 40% or higher
Further enhance the integrity of business management and strengthen the group governance system
Integrity training attendance status — Head office managers Over 50% in attendance
97%(74 out of 76 persons)
Group executives and managers
Over 50% in attendance
Group executives and managers
100% attendance
Governance Strategy Sheet initiatives — —
Operated by General Affairs chief managers of
Sekisui House (121 persons in total)
Operated by General Affairs managers of group companies
(223 persons in total)
Percentage of Governance Strategy Sheet initiatives
adopted: 90%
Enhance communication among employees Engaging in ESG Dialogue — — Sekisui House managers Sekisui House employees Group managers Group employees
Main themes and KPIs related to Governance disclosed in our Sustainability Report 2020
Main Themes KPI Unit2016 2017 2018 2019 2020 2021 2022
Results Results Results Results Targets Results Evaluation Targets Targets
Strengthening Our Corporate Governance System
Governance awareness survey score for “Workplace culture”*1 Points 77.6 79.3 79.7 79.0 82.6 77.7 △ 82.6 83.0
Governance awareness survey score for “Compliance”*1 Points 81.1 82.9 82.7 81.9 86.1 80.7 △ 86.1 87.0
Governance awareness survey score for “Employee satisfaction”*2*4 Points 80.6 82.0 82.0 81.5 82.0 80.0 △ 82.0 83.0
Compliance and Risk ManagementNumber of serious violations of laws and voluntary norms
Cases 0 0 0 0 0 0 ◎ 0 0
Occupational Health and Safety Management*3
Lost-time accident frequency rate in the construction division
− 2.57 1.89 2.42 2.92 2.63 2.17 ○ 2.15 2.13
Occupational illness frequency rate in the construction division
− 0.34 0.20 0.63 0.43 0.39 0.35 ○ 0.33 0.31
*1: Items that serve as indicators for the creation of an open workplace culture among all survey items of the annual governance awareness survey. Figures in the table are average values calculated as follows: “strongly agree”: 100 points, “mostly agree”: 75 points, “mostly disagree”: 25 points, “strongly disagree”: 0 points.
*2: Average of all items in the governance awareness survey. The calculation method is the same as that stated in footnote 1 above.*3: Moved to “Bringing together diverse capabilities” by identifying materiality*4: Percentage of positive answers (“strongly agree” and “mostly agree”) in the governance awareness survey (percentage of employees showed positive engagement)
FY2017 FY2018 FY2019 FY2020 Targets FY2020 ResultsPositive answers 86.7% 86.9% 86.4% 87.0% 85.0%
Response rate 97.3% 95.7% 96.8% − 95.5%
Environmental Data
Social Data
Governance Data
GRI Content Index
Independent Third-Party Assurance Report
VI. ESG Data
I. ESG Initiatives / Vision & Policy III. Social IV. Governance VI. ESG DataV. ESG Initiatives / Overseas BusinessII. Environmental
ESG Data
Governance Data ②
Sekisui House Sustainability Report 2021 139
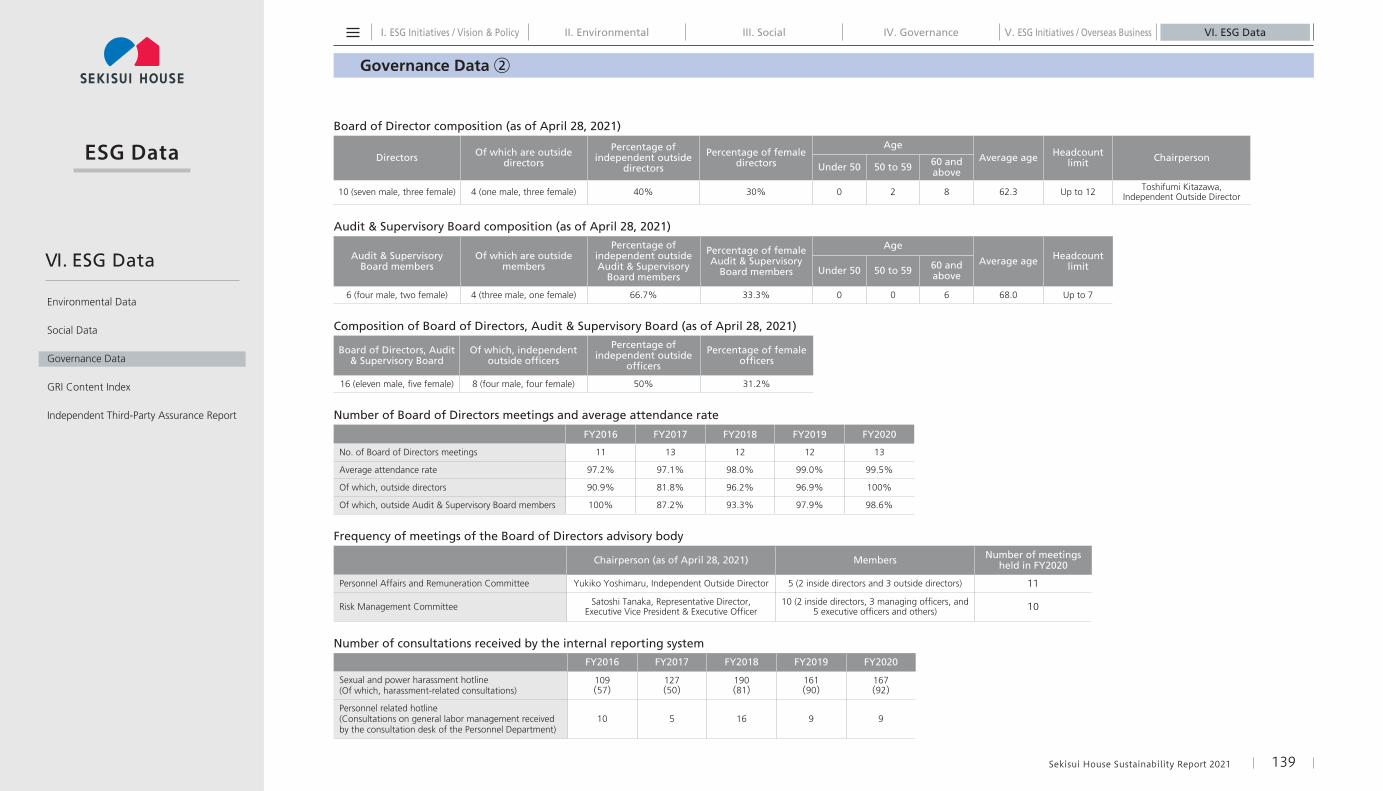
Board of Director composition (as of April 28, 2021)
Directors Of which are outside directors
Percentage of independent outside
directors
Percentage of female directors
AgeAverage age Headcount
limit ChairpersonUnder 50 50 to 59 60 and
above
10 (seven male, three female) 4 (one male, three female) 40% 30% 0 2 8 62.3 Up to 12 Toshifumi Kitazawa,Independent Outside Director
Audit & Supervisory Board composition (as of April 28, 2021)
Audit & Supervisory Board members
Of which are outside members
Percentage of independent outside Audit & Supervisory
Board members
Percentage of female Audit & Supervisory
Board members
Age
Average age Headcount limitUnder 50 50 to 59 60 and
above
6 (four male, two female) 4 (three male, one female) 66.7% 33.3% 0 0 6 68.0 Up to 7
Composition of Board of Directors, Audit & Supervisory Board (as of April 28, 2021)
Board of Directors, Audit & Supervisory Board
Of which, independent outside officers
Percentage of independent outside
officers
Percentage of female officers
16 (eleven male, five female) 8 (four male, four female) 50% 31.2%
Number of Board of Directors meetings and average attendance rate
FY2016 FY2017 FY2018 FY2019 FY2020
No. of Board of Directors meetings 11 13 12 12 13
Average attendance rate 97.2% 97.1% 98.0% 99.0% 99.5%
Of which, outside directors 90.9% 81.8% 96.2% 96.9% 100%
Of which, outside Audit & Supervisory Board members 100% 87.2% 93.3% 97.9% 98.6%
Frequency of meetings of the Board of Directors advisory body
Chairperson (as of April 28, 2021) Members Number of meetings held in FY2020
Personnel Affairs and Remuneration Committee Yukiko Yoshimaru, Independent Outside Director 5 (2 inside directors and 3 outside directors) 11
Risk Management Committee Satoshi Tanaka, Representative Director, Executive Vice President & Executive Officer
10 (2 inside directors, 3 managing officers, and 5 executive officers and others) 10
Number of consultations received by the internal reporting system
FY2016 FY2017 FY2018 FY2019 FY2020
Sexual and power harassment hotline(Of which, harassment-related consultations)
109(57)
127(50)
190(81)
161(90)
167(92)
Personnel related hotline(Consultations on general labor management received by the consultation desk of the Personnel Department)
10 5 16 9 9
Environmental Data
Social Data
Governance Data
GRI Content Index
Independent Third-Party Assurance Report
VI. ESG Data
I. ESG Initiatives / Vision & Policy III. Social IV. Governance VI. ESG DataV. ESG Initiatives / Overseas BusinessII. Environmental
ESG Data
GRI Content Index
Sekisui House Sustainability Report 2021 140
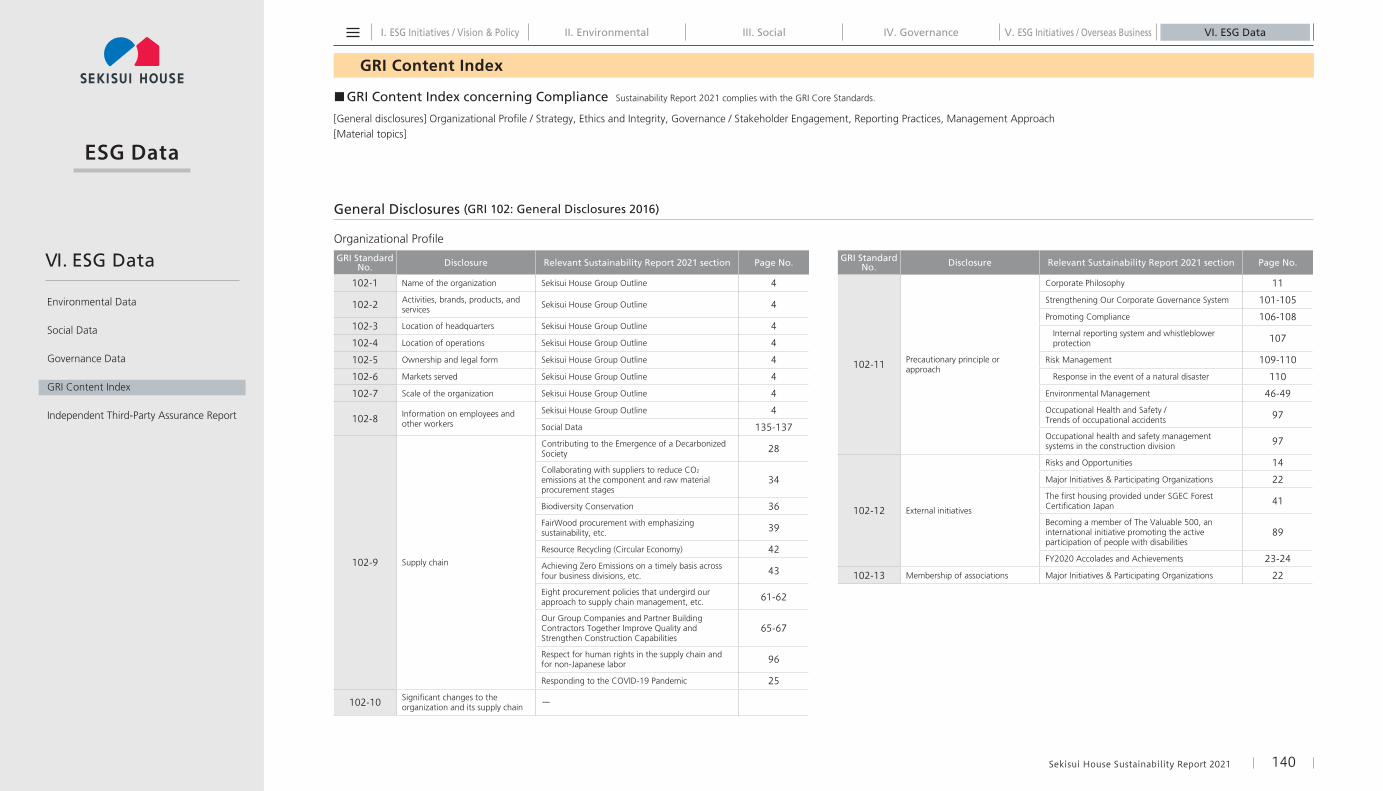
GRI Standard No. Disclosure Relevant Sustainability Report 2021 section Page No.
102-1 Name of the organization Sekisui House Group Outline 4
102-2 Activities, brands, products, and services Sekisui House Group Outline 4
102-3 Location of headquarters Sekisui House Group Outline 4
102-4 Location of operations Sekisui House Group Outline 4
102-5 Ownership and legal form Sekisui House Group Outline 4
102-6 Markets served Sekisui House Group Outline 4
102-7 Scale of the organization Sekisui House Group Outline 4
102-8 Information on employees and other workers
Sekisui House Group Outline 4
Social Data 135-137
102-9 Supply chain
Contributing to the Emergence of a Decarbonized Society 28
Collaborating with suppliers to reduce CO2 emissions at the component and raw material procurement stages
34
Biodiversity Conservation 36FairWood procurement with emphasizing sustainability, etc. 39
Resource Recycling (Circular Economy) 42Achieving Zero Emissions on a timely basis across four business divisions, etc. 43
Eight procurement policies that undergird our approach to supply chain management, etc. 61-62
Our Group Companies and Partner Building Contractors Together Improve Quality and Strengthen Construction Capabilities
65-67
Respect for human rights in the supply chain and for non-Japanese labor 96
Responding to the COVID-19 Pandemic 25
102-10 Significant changes to the organization and its supply chain ー
GRI Standard No. Disclosure Relevant Sustainability Report 2021 section Page No.
102-11 Precautionary principle or approach
Corporate Philosophy 11
Strengthening Our Corporate Governance System 101-105
Promoting Compliance 106-108 Internal reporting system and whistleblower
protection 107
Risk Management 109-110
Response in the event of a natural disaster 110
Environmental Management 46-49Occupational Health and Safety / Trends of occupational accidents 97
Occupational health and safety management systems in the construction division 97
102-12 External initiatives
Risks and Opportunities 14
Major Initiatives & Participating Organizations 22The first housing provided under SGEC Forest Certification Japan 41
Becoming a member of The Valuable 500, an international initiative promoting the active participation of people with disabilities
89
FY2020 Accolades and Achievements 23-24
102-13 Membership of associations Major Initiatives & Participating Organizations 22
■GRI Content Index concerning Compliance Sustainability Report 2021 complies with the GRI Core Standards.
[General disclosures] Organizational Profile / Strategy, Ethics and Integrity, Governance / Stakeholder Engagement, Reporting Practices, Management Approach[Material topics]
General Disclosures (GRI 102: General Disclosures 2016)
Organizational Profile
Environmental Data
Social Data
Governance Data
GRI Content Index
Independent Third-Party Assurance Report
VI. ESG Data

I. ESG Initiatives / Vision & Policy III. Social IV. Governance VI. ESG DataV. ESG Initiatives / Overseas BusinessII. Environmental
ESG Data
GRI Content Index
Sekisui House Sustainability Report 2021 141
StrategyGRI Standard
No. Disclosure Relevant Sustainability Report 2021 section Page No.
102-14 Statement from senior decision-maker
Message from Management 7-10Yoshihiro NakaiRepresentative DirectorPresident & Executive Officer, CEO
7-8
Yosuke HoriuchiRepresentative DirectorVice Chairman & Executive OfficerFinance & ESG Division
9-10
102-15 Key impacts, risks, and opportunities
Risks and Opportunities 14-15
Material Issues 16-17
Sustainability Vision 2050 18
Ethics and IntegrityGRI Standard
No. Disclosure Relevant Sustainability Report 2021 section Page No.
102-16 Values, principles, standards, and norms of behavior
Corporate Philosophy / Global Vision 11
Material Issues 16-17
Eco-First Promise 50
Wood Procurement Guidelines 39
Human Resource Sustainability 87Sekisui House Group’s “happiness” health management 93
Sekisui House Group Human Rights Policy 95(Full text is on the web.)
Sekisui House Group Corporate Code of Conduct / Corporate Ethics Guidelines
106(Full text is on the web.)
Sekisui House, Ltd. Basic Policy on Corporate Governance
108(Full text is on the web.)
102-17 Mechanisms for advice and concerns about ethics Risk Management 109-110
GovernanceGRI Standard
No. Disclosure Relevant Sustainability Report 2021 section Page No.
102-18 Governance structure Strengthening Our Corporate Governance System 101-105
102-19 Delegating authority Strengthening Our Corporate Governance System 101-105
102-20Executive-level responsibility for economic, environmental, and social topics
ESG Management Promotion Structure 19
ESG Promotion Committee 104
102-21Consulting stakeholders on economic, environmental, and social topics
Stakeholder Engagement 20-21
Major Initiatives & Participating Organizations 22
GRI Standard No. Disclosure Relevant Sustainability Report 2021 section Page No.
102-22Composition of the highest governance body and its committees
Strengthening Our Corporate Governance System 101-105
102-23 Chair of the highest governance body Strengthening Our Corporate Governance System 101-105
102-24 Nominating and selecting the highest governance body Strengthening Our Corporate Governance System 101-105
102-25 Conflicts of interest Strengthening Our Corporate Governance System 101-105
102-26Role of highest governance body in setting purpose, values, and strategy
Strengthening Our Corporate Governance System 101-105
102-27 Collective knowledge of highest governance body Strengthening Our Corporate Governance System 101-105
102-28 Evaluating the highest governance body’s performance Strengthening Our Corporate Governance System 101-105
102-29Identifying and managing economic, environmental, and social impacts
Risks and Opportunities 14-15
ESG Management Promotion Structure 19
Strengthening Our Corporate Governance System 101-105
102-30 Effectiveness of risk management processes
ESG Management Promotion Structure 19
ESG Promotion Committee 104
102-31 Review of economic, environmental, and social topics Strengthening Our Corporate Governance System 101-105
102-32 Highest governance body’s role in sustainability reporting Strengthening Our Corporate Governance System 101-105
102-33 Communicating critical concerns
Promoting Compliance 106-108
Risk Management 109-111
Strengthening Our Corporate Governance System 101-105
102-34 Nature and total number of critical concerns
Comprehensive Evaluation Report on Problems with the Purchase of Land for Condominiums 111
102-35 Remuneration policies Integrated Report (p. 98-99) WEB
102-36 Process for determining remuneration Integrated Report (p. 98-99) WEB
102-37 Stakeholders’ involvement in remuneration Integrated Report (p. 98-99) WEB
102-38 Annual total compensation ratio ―
102-39 Percentage increase in annual total compensation ratio ―
Environmental Data
Social Data
Governance Data
GRI Content Index
Independent Third-Party Assurance Report
VI. ESG Data
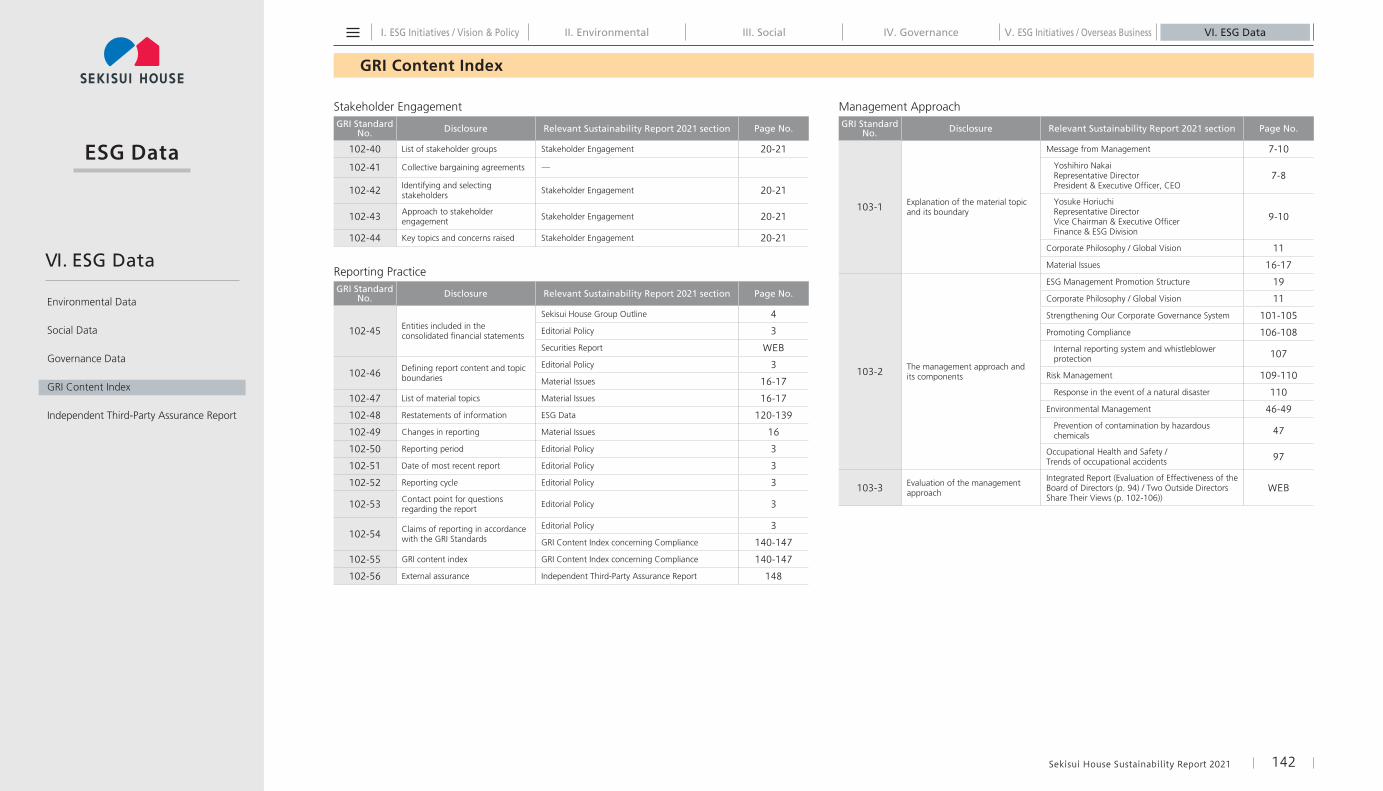
I. ESG Initiatives / Vision & Policy III. Social IV. Governance VI. ESG DataV. ESG Initiatives / Overseas BusinessII. Environmental
ESG Data
GRI Content Index
Sekisui House Sustainability Report 2021 142
Stakeholder EngagementGRI Standard
No. Disclosure Relevant Sustainability Report 2021 section Page No.
102-40 List of stakeholder groups Stakeholder Engagement 20-21
102-41 Collective bargaining agreements ―
102-42 Identifying and selecting stakeholders Stakeholder Engagement 20-21
102-43 Approach to stakeholder engagement Stakeholder Engagement 20-21
102-44 Key topics and concerns raised Stakeholder Engagement 20-21
Reporting PracticeGRI Standard
No. Disclosure Relevant Sustainability Report 2021 section Page No.
102-45 Entities included in the consolidated financial statements
Sekisui House Group Outline 4
Editorial Policy 3
Securities Report WEB
102-46 Defining report content and topic boundaries
Editorial Policy 3
Material Issues 16-17
102-47 List of material topics Material Issues 16-17
102-48 Restatements of information ESG Data 120-139
102-49 Changes in reporting Material Issues 16
102-50 Reporting period Editorial Policy 3
102-51 Date of most recent report Editorial Policy 3
102-52 Reporting cycle Editorial Policy 3
102-53 Contact point for questions regarding the report Editorial Policy 3
102-54 Claims of reporting in accordance with the GRI Standards
Editorial Policy 3
GRI Content Index concerning Compliance 140-147
102-55 GRI content index GRI Content Index concerning Compliance 140-147
102-56 External assurance Independent Third-Party Assurance Report 148
Management ApproachGRI Standard
No. Disclosure Relevant Sustainability Report 2021 section Page No.
103-1 Explanation of the material topic and its boundary
Message from Management 7-10Yoshihiro NakaiRepresentative DirectorPresident & Executive Officer, CEO
7-8
Yosuke HoriuchiRepresentative DirectorVice Chairman & Executive OfficerFinance & ESG Division
9-10
Corporate Philosophy / Global Vision 11
Material Issues 16-17
103-2 The management approach and its components
ESG Management Promotion Structure 19
Corporate Philosophy / Global Vision 11
Strengthening Our Corporate Governance System 101-105
Promoting Compliance 106-108 Internal reporting system and whistleblower
protection 107
Risk Management 109-110
Response in the event of a natural disaster 110
Environmental Management 46-49 Prevention of contamination by hazardous
chemicals 47
Occupational Health and Safety / Trends of occupational accidents 97
103-3 Evaluation of the management approach
Integrated Report (Evaluation of Effectiveness of the Board of Directors (p. 94) / Two Outside Directors Share Their Views (p. 102-106))
WEB
Environmental Data
Social Data
Governance Data
GRI Content Index
Independent Third-Party Assurance Report
VI. ESG Data
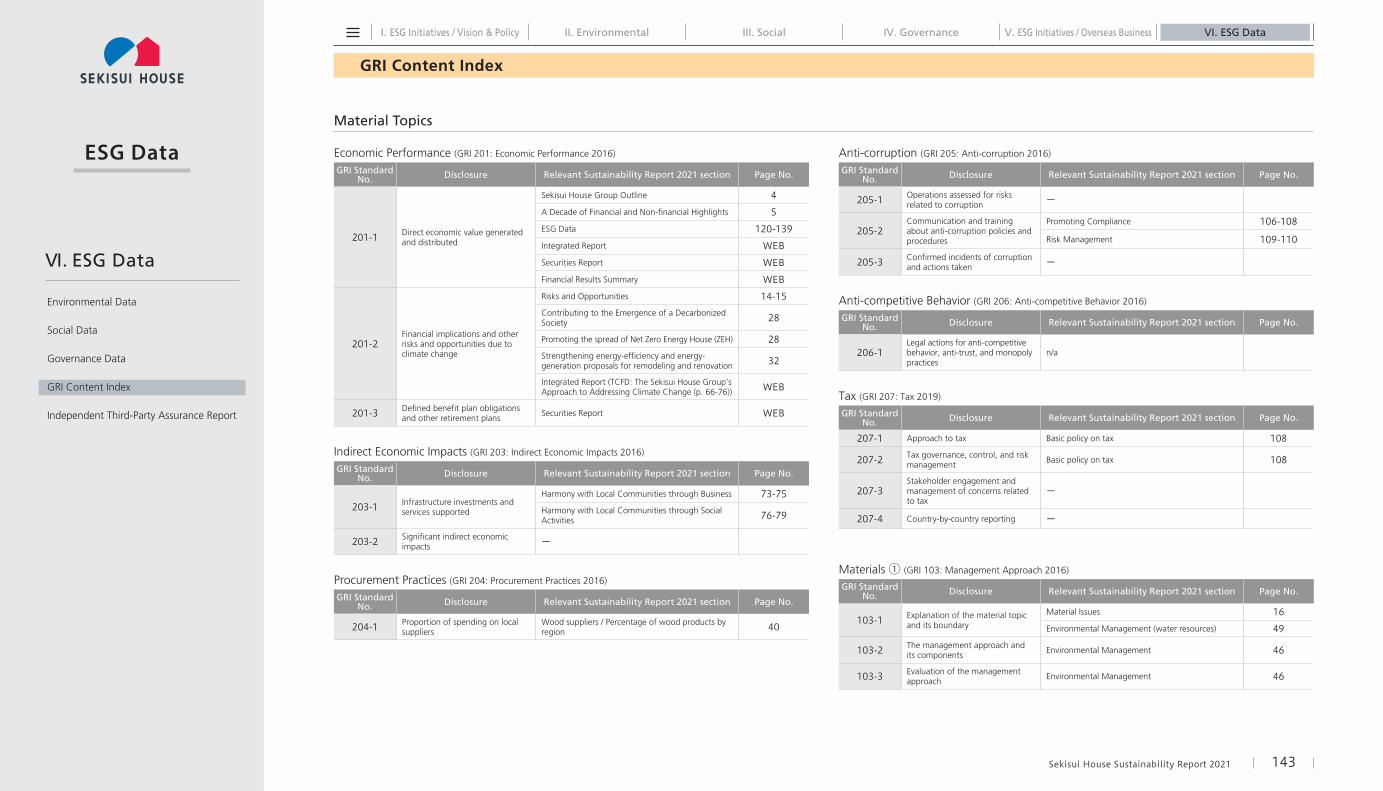
I. ESG Initiatives / Vision & Policy III. Social IV. Governance VI. ESG DataV. ESG Initiatives / Overseas BusinessII. Environmental
ESG Data
GRI Content Index
Sekisui House Sustainability Report 2021 143
Economic Performance (GRI 201: Economic Performance 2016)
GRI Standard No. Disclosure Relevant Sustainability Report 2021 section Page No.
201-1 Direct economic value generated and distributed
Sekisui House Group Outline 4
A Decade of Financial and Non-financial Highlights 5
ESG Data 120-139
Integrated Report WEB
Securities Report WEB
Financial Results Summary WEB
201-2Financial implications and other risks and opportunities due toclimate change
Risks and Opportunities 14-15Contributing to the Emergence of a Decarbonized Society 28
Promoting the spread of Net Zero Energy House (ZEH) 28Strengthening energy-efficiency and energy-generation proposals for remodeling and renovation 32
Integrated Report (TCFD: The Sekisui House Group’s Approach to Addressing Climate Change (p. 66-76)) WEB
201-3 Defined benefit plan obligations and other retirement plans Securities Report WEB
Indirect Economic Impacts (GRI 203: Indirect Economic Impacts 2016)
GRI Standard No. Disclosure Relevant Sustainability Report 2021 section Page No.
203-1 Infrastructure investments and services supported
Harmony with Local Communities through Business 73-75Harmony with Local Communities through Social Activities 76-79
203-2 Significant indirect economic impacts ー
Procurement Practices (GRI 204: Procurement Practices 2016)
GRI Standard No. Disclosure Relevant Sustainability Report 2021 section Page No.
204-1 Proportion of spending on local suppliers
Wood suppliers / Percentage of wood products by region 40
Anti-corruption (GRI 205: Anti-corruption 2016)
GRI Standard No. Disclosure Relevant Sustainability Report 2021 section Page No.
205-1 Operations assessed for risks related to corruption ー
205-2Communication and training about anti-corruption policies and procedures
Promoting Compliance 106-108
Risk Management 109-110
205-3 Confirmed incidents of corruption and actions taken ー
Anti-competitive Behavior (GRI 206: Anti-competitive Behavior 2016)
GRI Standard No. Disclosure Relevant Sustainability Report 2021 section Page No.
206-1Legal actions for anti-competitive behavior, anti-trust, and monopoly practices
n/a
Tax (GRI 207: Tax 2019)
GRI Standard No. Disclosure Relevant Sustainability Report 2021 section Page No.
207-1 Approach to tax Basic policy on tax 108
207-2 Tax governance, control, and risk management Basic policy on tax 108
207-3Stakeholder engagement and management of concerns related to tax
ー
207-4 Country-by-country reporting ー
Materials ① (GRI 103: Management Approach 2016)
GRI Standard No. Disclosure Relevant Sustainability Report 2021 section Page No.
103-1 Explanation of the material topic and its boundary
Material Issues 16
Environmental Management (water resources) 49
103-2 The management approach and its components Environmental Management 46
103-3 Evaluation of the management approach Environmental Management 46
Material Topics
Environmental Data
Social Data
Governance Data
GRI Content Index
Independent Third-Party Assurance Report
VI. ESG Data
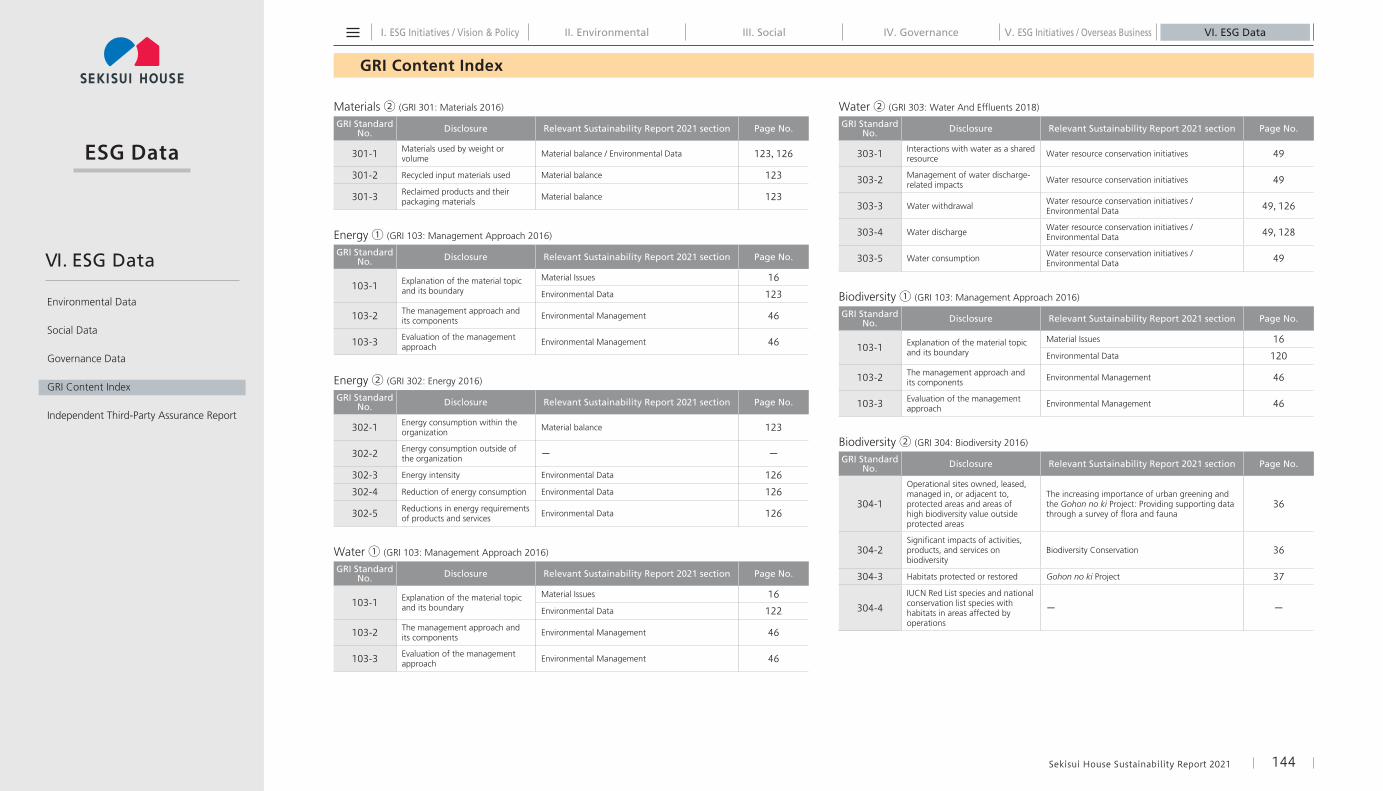
I. ESG Initiatives / Vision & Policy III. Social IV. Governance VI. ESG DataV. ESG Initiatives / Overseas BusinessII. Environmental
ESG Data
GRI Content Index
Sekisui House Sustainability Report 2021 144
Materials ② (GRI 301: Materials 2016)
GRI Standard No. Disclosure Relevant Sustainability Report 2021 section Page No.
301-1 Materials used by weight or volume Material balance / Environmental Data 123, 126
301-2 Recycled input materials used Material balance 123
301-3 Reclaimed products and their packaging materials Material balance 123
Energy ① (GRI 103: Management Approach 2016)
GRI Standard No. Disclosure Relevant Sustainability Report 2021 section Page No.
103-1 Explanation of the material topic and its boundary
Material Issues 16
Environmental Data 123
103-2 The management approach and its components Environmental Management 46
103-3 Evaluation of the management approach Environmental Management 46
Energy ② (GRI 302: Energy 2016)
GRI Standard No. Disclosure Relevant Sustainability Report 2021 section Page No.
302-1 Energy consumption within the organization Material balance 123
302-2 Energy consumption outside of the organization ー ー
302-3 Energy intensity Environmental Data 126
302-4 Reduction of energy consumption Environmental Data 126
302-5 Reductions in energy requirements of products and services Environmental Data 126
Water ① (GRI 103: Management Approach 2016)
GRI Standard No. Disclosure Relevant Sustainability Report 2021 section Page No.
103-1 Explanation of the material topic and its boundary
Material Issues 16
Environmental Data 122
103-2 The management approach and its components Environmental Management 46
103-3 Evaluation of the management approach Environmental Management 46
Water ② (GRI 303: Water And Effluents 2018)
GRI Standard No. Disclosure Relevant Sustainability Report 2021 section Page No.
303-1 Interactions with water as a shared resource Water resource conservation initiatives 49
303-2 Management of water discharge-related impacts Water resource conservation initiatives 49
303-3 Water withdrawal Water resource conservation initiatives / Environmental Data 49, 126
303-4 Water discharge Water resource conservation initiatives / Environmental Data 49, 128
303-5 Water consumption Water resource conservation initiatives / Environmental Data 49
Biodiversity ① (GRI 103: Management Approach 2016)
GRI Standard No. Disclosure Relevant Sustainability Report 2021 section Page No.
103-1 Explanation of the material topic and its boundary
Material Issues 16
Environmental Data 120
103-2 The management approach and its components Environmental Management 46
103-3 Evaluation of the management approach Environmental Management 46
Biodiversity ② (GRI 304: Biodiversity 2016)
GRI Standard No. Disclosure Relevant Sustainability Report 2021 section Page No.
304-1
Operational sites owned, leased, managed in, or adjacent to, protected areas and areas of high biodiversity value outside protected areas
The increasing importance of urban greening and the Gohon no ki Project: Providing supporting data through a survey of flora and fauna
36
304-2Significant impacts of activities, products, and services on biodiversity
Biodiversity Conservation 36
304-3 Habitats protected or restored Gohon no ki Project 37
304-4IUCN Red List species and national conservation list species with habitats in areas affected by operations
ー ー
Environmental Data
Social Data
Governance Data
GRI Content Index
Independent Third-Party Assurance Report
VI. ESG Data

I. ESG Initiatives / Vision & Policy III. Social IV. Governance VI. ESG DataV. ESG Initiatives / Overseas BusinessII. Environmental
ESG Data
GRI Content Index
Sekisui House Sustainability Report 2021 145
Emissions ① (GRI 103: Management Approach 2016)
GRI Standard No. Disclosure Relevant Sustainability Report 2021 section Page No.
103-1 Explanation of the material topic and its boundary
Material Issues 16
Environmental Data 125
103-2 The management approach and its components Environmental Management 46
103-3 Evaluation of the management approach Environmental Management 46
Emissions ② (GRI 305: Emissions 2016)
GRI Standard No. Disclosure Relevant Sustainability Report 2021 section Page No.
305-1 Direct (Scope 1) GHG emissions Material balance / Scope 1 and 2 greenhouse gas (GHG) emissions 123, 127
305-2 Energy indirect (Scope 2) GHG emissions
Material balance / Scope 1 and 2 greenhouse gas (GHG) emissions 123, 127
305-3 Other indirect (Scope 3) GHG emissions Scope 3 greenhouse gas (GHG) emissions 123, 127
305-4 GHG emissions intensity Environmental Data 128
305-5 Reduction of GHG emissions
Trends in GHG emissions (Scope 1, 2, 3) 127
Promoting the spread of Net Zero Energy House (ZEH) 28Strengthening energy-efficiency and energy-generation proposals for remodeling and renovation 32
Sekisui House Owner Denki initiative 33
305-6 Emissions of ozone-depleting substances (ODS) ー
305-7Nitrogen oxides (NOx), sulfur oxides (SOx), and other significant air emissions
Environmental Data 128
Effluents and Waste ① (GRI 103: Management Approach 2016)
GRI Standard No. Disclosure Relevant Sustainability Report 2021 section Page No.
103-1 Explanation of the material topic and its boundary
Material Issues 16
Material balance 124
103-2 The management approach and its components Environmental Management 46
103-3 Evaluation of the management approach Environmental Management 46
Effluents and Waste ② (GRI 306: Effluents and Waste 2016)
GRI Standard No. Disclosure Relevant Sustainability Report 2021 section Page No.
306-1 Water discharge by quality and destination
Water resource conservation initiatives / Environmental Data 49, 128
Water resource conservation initiatives 49
306-2 Waste by type and disposal method
Material balance 123Water resource conservation initiatives / Environmental Data 49, 128
306-3 Significant spills Legal compliance status 107
306-4 Transport of hazardous waste ー ―
306-5 Water bodies affected by water discharges and/or runoff ー ―
Environmental Compliance ① (GRI 103: Management Approach 2016)
GRI Standard No. Disclosure Relevant Sustainability Report 2021 section Page No.
103-1 Explanation of the material topic and its boundary
Material Issues 16
Environmental Data 120
103-2 The management approach and its components Environmental Management 46
103-3 Evaluation of the management approach Environmental Management 46
Environmental Compliance ② (GRI 307: Environmental Compliance 2016)
GRI Standard No. Disclosure Relevant Sustainability Report 2021 section Page No.
307-1Non-compliance with environmental laws and regulations
Environmental Management 46
Supplier Environmental Assessment ① (GRI 103: Management Approach 2016)
GRI Standard No. Disclosure Relevant Sustainability Report 2021 section Page No.
103-1 Explanation of the material topic and its boundary
Material Issues 16
Environmental Data 120
103-2 The management approach and its components Environmental Management 46
103-3 Evaluation of the management approach Environmental Management 46
Environmental Data
Social Data
Governance Data
GRI Content Index
Independent Third-Party Assurance Report
VI. ESG Data
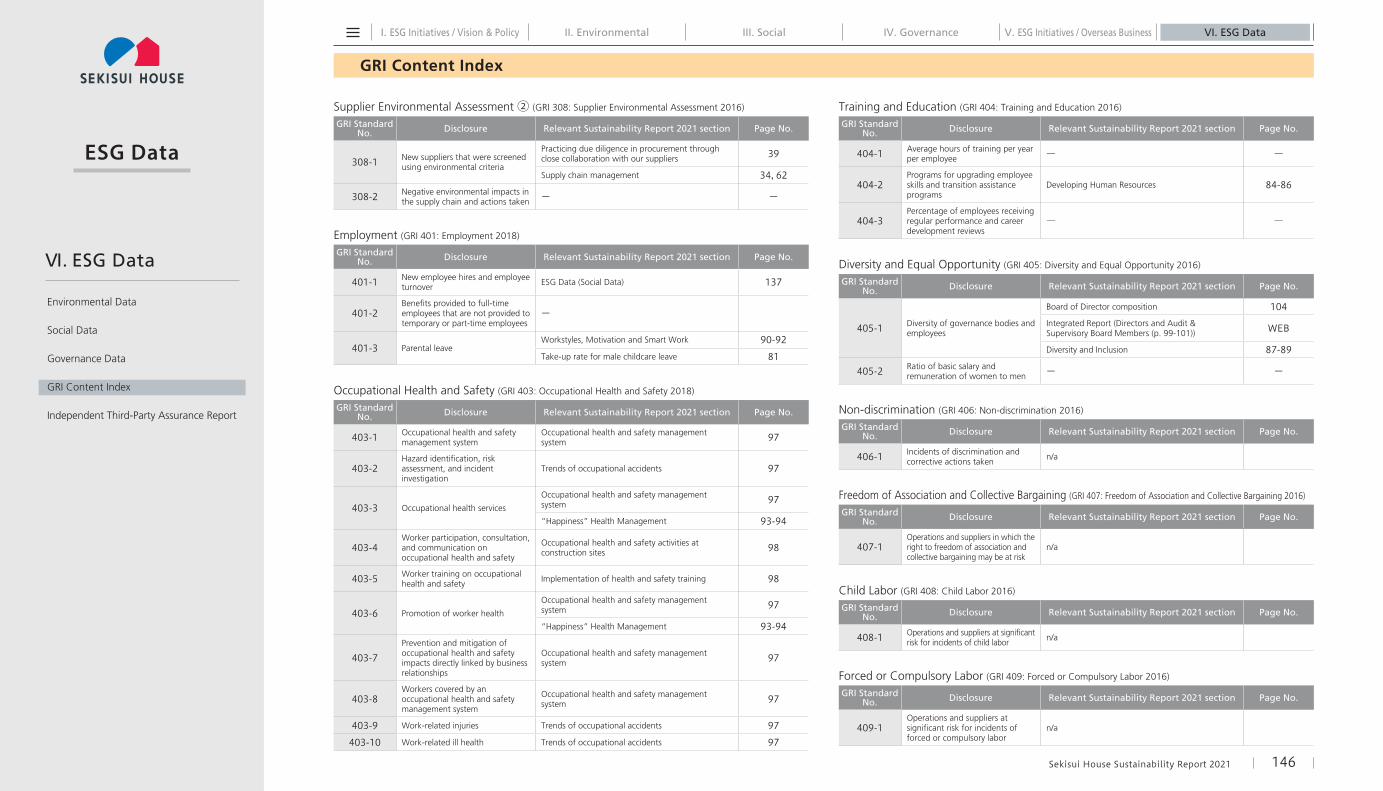
I. ESG Initiatives / Vision & Policy III. Social IV. Governance VI. ESG DataV. ESG Initiatives / Overseas BusinessII. Environmental
ESG Data
GRI Content Index
Sekisui House Sustainability Report 2021 146
Supplier Environmental Assessment ② (GRI 308: Supplier Environmental Assessment 2016)
GRI Standard No. Disclosure Relevant Sustainability Report 2021 section Page No.
308-1 New suppliers that were screened using environmental criteria
Practicing due diligence in procurement through close collaboration with our suppliers 39
Supply chain management 34, 62
308-2 Negative environmental impacts in the supply chain and actions taken ー ー
Employment (GRI 401: Employment 2018)
GRI Standard No. Disclosure Relevant Sustainability Report 2021 section Page No.
401-1 New employee hires and employee turnover ESG Data (Social Data) 137
401-2Benefits provided to full-time employees that are not provided to temporary or part-time employees
ー
401-3 Parental leaveWorkstyles, Motivation and Smart Work 90-92
Take-up rate for male childcare leave 81
Occupational Health and Safety (GRI 403: Occupational Health and Safety 2018)
GRI Standard No. Disclosure Relevant Sustainability Report 2021 section Page No.
403-1 Occupational health and safety management system
Occupational health and safety management system 97
403-2Hazard identification, risk assessment, and incident investigation
Trends of occupational accidents 97
403-3 Occupational health services
Occupational health and safety management system 97
“Happiness” Health Management 93-94
403-4Worker participation, consultation, and communication on occupational health and safety
Occupational health and safety activities at construction sites 98
403-5 Worker training on occupational health and safety Implementation of health and safety training 98
403-6 Promotion of worker health
Occupational health and safety management system 97
“Happiness” Health Management 93-94
403-7Prevention and mitigation of occupational health and safety impacts directly linked by business relationships
Occupational health and safety management system 97
403-8Workers covered by an occupational health and safety management system
Occupational health and safety management system 97
403-9 Work-related injuries Trends of occupational accidents 97
403-10 Work-related ill health Trends of occupational accidents 97
Training and Education (GRI 404: Training and Education 2016)
GRI Standard No. Disclosure Relevant Sustainability Report 2021 section Page No.
404-1 Average hours of training per year per employee ― ―
404-2Programs for upgrading employee skills and transition assistance programs
Developing Human Resources 84-86
404-3Percentage of employees receiving regular performance and career development reviews
― ―
Diversity and Equal Opportunity (GRI 405: Diversity and Equal Opportunity 2016)
GRI Standard No. Disclosure Relevant Sustainability Report 2021 section Page No.
405-1 Diversity of governance bodies and employees
Board of Director composition 104Integrated Report (Directors and Audit & Supervisory Board Members (p. 99-101)) WEB
Diversity and Inclusion 87-89
405-2 Ratio of basic salary and remuneration of women to men ー ー
Non-discrimination (GRI 406: Non-discrimination 2016)
GRI Standard No. Disclosure Relevant Sustainability Report 2021 section Page No.
406-1 Incidents of discrimination and corrective actions taken n/a
Freedom of Association and Collective Bargaining (GRI 407: Freedom of Association and Collective Bargaining 2016)
GRI Standard No. Disclosure Relevant Sustainability Report 2021 section Page No.
407-1Operations and suppliers in which the right to freedom of association and collective bargaining may be at risk
n/a
Child Labor (GRI 408: Child Labor 2016)
GRI Standard No. Disclosure Relevant Sustainability Report 2021 section Page No.
408-1 Operations and suppliers at significant risk for incidents of child labor n/a
Forced or Compulsory Labor (GRI 409: Forced or Compulsory Labor 2016)
GRI Standard No. Disclosure Relevant Sustainability Report 2021 section Page No.
409-1Operations and suppliers at significant risk for incidents of forced or compulsory labor
n/a
Environmental Data
Social Data
Governance Data
GRI Content Index
Independent Third-Party Assurance Report
VI. ESG Data
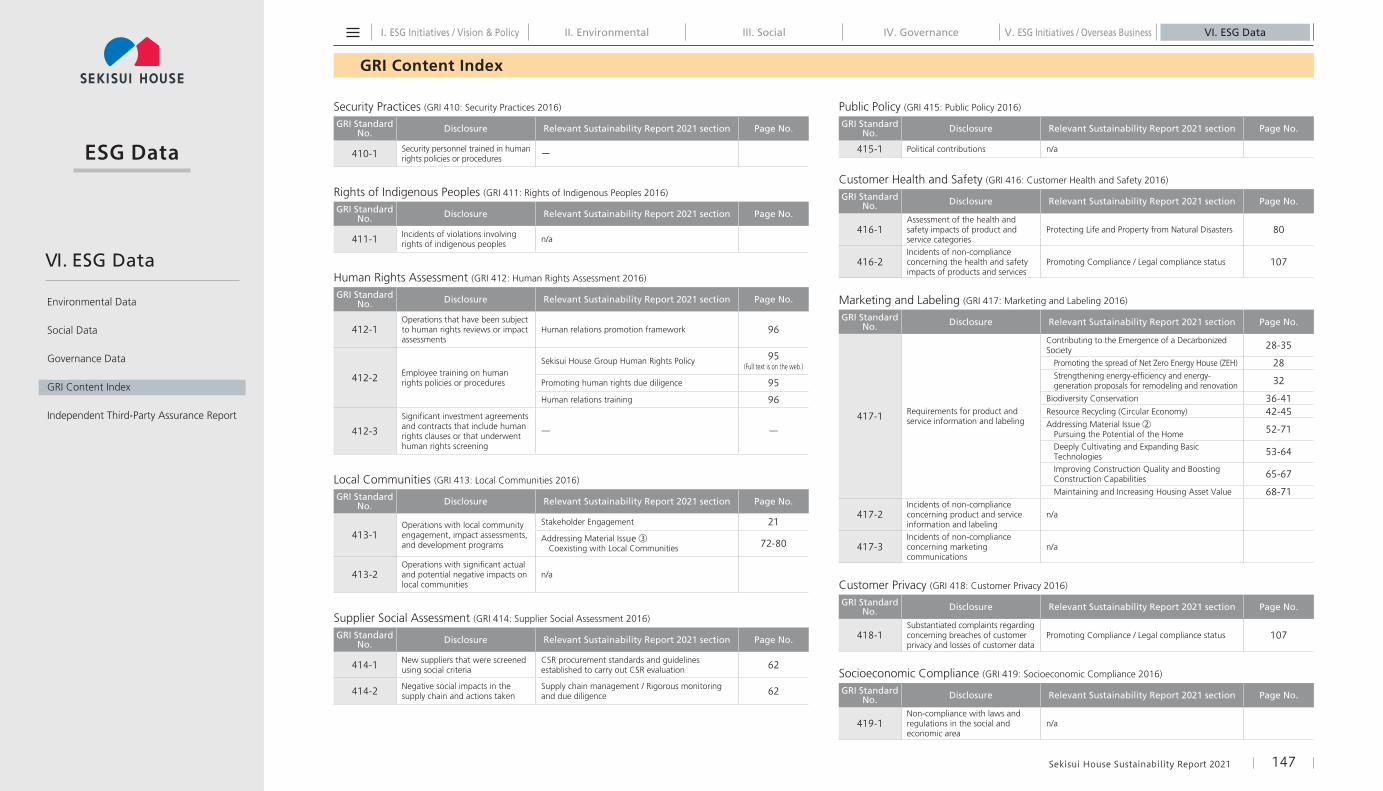
I. ESG Initiatives / Vision & Policy III. Social IV. Governance VI. ESG DataV. ESG Initiatives / Overseas BusinessII. Environmental
ESG Data
GRI Content Index
Sekisui House Sustainability Report 2021 147
Security Practices (GRI 410: Security Practices 2016)
GRI Standard No. Disclosure Relevant Sustainability Report 2021 section Page No.
410-1 Security personnel trained in human rights policies or procedures ー
Rights of Indigenous Peoples (GRI 411: Rights of Indigenous Peoples 2016)
GRI Standard No. Disclosure Relevant Sustainability Report 2021 section Page No.
411-1 Incidents of violations involving rights of indigenous peoples n/a
Human Rights Assessment (GRI 412: Human Rights Assessment 2016)
GRI Standard No. Disclosure Relevant Sustainability Report 2021 section Page No.
412-1Operations that have been subject to human rights reviews or impact assessments
Human relations promotion framework 96
412-2 Employee training on human rights policies or procedures
Sekisui House Group Human Rights Policy 95(Full text is on the web.)
Promoting human rights due diligence 95
Human relations training 96
412-3Significant investment agreements and contracts that include human rights clauses or that underwent human rights screening
― ―
Local Communities (GRI 413: Local Communities 2016)
GRI Standard No. Disclosure Relevant Sustainability Report 2021 section Page No.
413-1Operations with local community engagement, impact assessments, and development programs
Stakeholder Engagement 21Addressing Material Issue ③
Coexisting with Local Communities 72-80
413-2Operations with significant actual and potential negative impacts on local communities
n/a
Supplier Social Assessment (GRI 414: Supplier Social Assessment 2016)
GRI Standard No. Disclosure Relevant Sustainability Report 2021 section Page No.
414-1 New suppliers that were screened using social criteria
CSR procurement standards and guidelines established to carry out CSR evaluation 62
414-2 Negative social impacts in the supply chain and actions taken
Supply chain management / Rigorous monitoring and due diligence 62
Public Policy (GRI 415: Public Policy 2016)
GRI Standard No. Disclosure Relevant Sustainability Report 2021 section Page No.
415-1 Political contributions n/a
Customer Health and Safety (GRI 416: Customer Health and Safety 2016)
GRI Standard No. Disclosure Relevant Sustainability Report 2021 section Page No.
416-1Assessment of the health and safety impacts of product and service categories
Protecting Life and Property from Natural Disasters 80
416-2Incidents of non-compliance concerning the health and safety impacts of products and services
Promoting Compliance / Legal compliance status 107
Marketing and Labeling (GRI 417: Marketing and Labeling 2016)
GRI Standard No. Disclosure Relevant Sustainability Report 2021 section Page No.
417-1 Requirements for product and service information and labeling
Contributing to the Emergence of a Decarbonized Society 28-35
Promoting the spread of Net Zero Energy House (ZEH) 28Strengthening energy-efficiency and energy-generation proposals for remodeling and renovation 32
Biodiversity Conservation 36-41Resource Recycling (Circular Economy) 42-45Addressing Material Issue ②
Pursuing the Potential of the Home 52-71
Deeply Cultivating and Expanding Basic Technologies 53-64
Improving Construction Quality and Boosting Construction Capabilities 65-67
Maintaining and Increasing Housing Asset Value 68-71
417-2Incidents of non-compliance concerning product and service information and labeling
n/a
417-3Incidents of non-compliance concerning marketing communications
n/a
Customer Privacy (GRI 418: Customer Privacy 2016)
GRI Standard No. Disclosure Relevant Sustainability Report 2021 section Page No.
418-1Substantiated complaints regarding concerning breaches of customer privacy and losses of customer data
Promoting Compliance / Legal compliance status 107
Socioeconomic Compliance (GRI 419: Socioeconomic Compliance 2016)
GRI Standard No. Disclosure Relevant Sustainability Report 2021 section Page No.
419-1Non-compliance with laws and regulations in the social and economic area
n/a
Environmental Data
Social Data
Governance Data
GRI Content Index
Independent Third-Party Assurance Report
VI. ESG Data
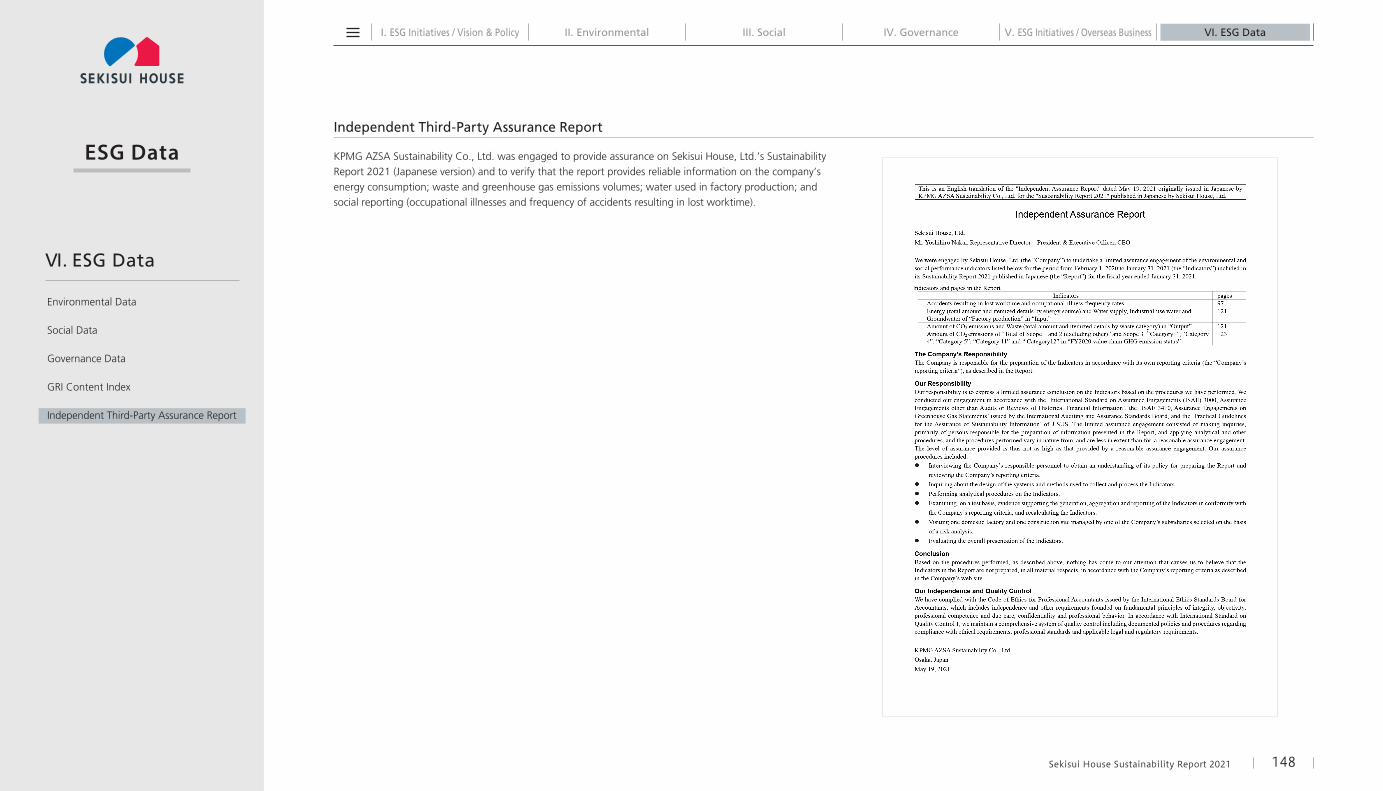
I. ESG Initiatives / Vision & Policy III. Social IV. Governance VI. ESG DataV. ESG Initiatives / Overseas BusinessII. Environmental
ESG Data
Sekisui House Sustainability Report 2021 148
Independent Third-Party Assurance Report
KPMG AZSA Sustainability Co., Ltd. was engaged to provide assurance on Sekisui House, Ltd.’s Sustainability Report 2021 (Japanese version) and to verify that the report provides reliable information on the company’s energy consumption; waste and greenhouse gas emissions volumes; water used in factory production; and social reporting (occupational illnesses and frequency of accidents resulting in lost worktime).
Environmental Data
Social Data
Governance Data
GRI Content Index
Independent Third-Party Assurance Report
VI. ESG Data