Embed Size (px)
Citation preview
63
Journal of ICT, 15, No. 2 (December) 2016, pp: 63–84
23
Maximize: λ Objective
function
∑ 𝐹𝐹𝑎𝑎(𝑃𝑃)𝑃𝑃∈𝑃𝑃𝑎𝑎
= 𝑘𝑘(𝑎𝑎)λ, ∀a ∈ A Fairness
constraint
𝑓𝑓(𝑒𝑒) = ∑ 𝑓𝑓𝑚𝑚𝑈𝑈(𝑒𝑒)𝑚𝑚∈𝑀𝑀
+ ∑ ∑ 𝑓𝑓𝑚𝑚𝑁𝑁𝑁𝑁(𝐿𝐿)𝐿𝐿∈𝐿𝐿(𝑒𝑒)𝑚𝑚∈𝑀𝑀
, ∀𝑒𝑒 ∈ 𝐸𝐸
𝑓𝑓(𝑒𝑒) = ∑ ∑ 𝐹𝐹𝑎𝑎(𝑃𝑃)𝑃𝑃∈𝑃𝑃𝑎𝑎:𝑃𝑃∋𝑒𝑒𝑎𝑎∈𝐴𝐴
, ∀𝑒𝑒 ∈ 𝐸𝐸
Link flow
constraint
∑ 𝑓𝑓(𝑒𝑒)𝑒𝑒∈𝐸𝐸+(𝑣𝑣)
− ∑ 𝑓𝑓(𝑒𝑒)𝑒𝑒∈𝐸𝐸−(𝑣𝑣)
= {𝑜𝑜, ∀𝑣𝑣 ≠ 𝑠𝑠(𝑎𝑎),𝑑𝑑(𝑎𝑎),∀𝑎𝑎 ∈ 𝐴𝐴
∑ ∑ 𝐹𝐹𝑎𝑎(𝑃𝑃)− ∑ ∑ 𝐹𝐹𝑎𝑎(𝑃𝑃)𝑃𝑃∈𝑃𝑃𝑎𝑎𝑎𝑎∈𝐴𝐴,𝑑𝑑(𝑎𝑎)=𝑣𝑣𝑃𝑃∈𝑃𝑃𝑎𝑎𝑎𝑎∈𝐴𝐴,𝑠𝑠(𝑎𝑎)=𝑣𝑣
, ∀𝑣𝑣 = 𝑠𝑠(𝑎𝑎),𝑑𝑑(𝑎𝑎),∀𝑎𝑎 ∈ 𝐴𝐴
Flow
conservation
constraint
𝑥𝑥𝑚𝑚𝑈𝑈 (𝑒𝑒) = {𝑓𝑓𝑚𝑚𝑈𝑈(𝑒𝑒)𝑐𝑐𝑚𝑚(𝑒𝑒) , 𝑐𝑐𝑚𝑚(𝑒𝑒) > 0
0, 𝑜𝑜𝑜𝑜ℎ𝑒𝑒𝑒𝑒𝑒𝑒𝑒𝑒𝑠𝑠𝑒𝑒
𝑥𝑥𝑚𝑚𝑁𝑁𝑁𝑁(𝐿𝐿) = {𝑓𝑓𝑚𝑚𝑁𝑁𝑁𝑁(𝐿𝐿)
min𝑒𝑒∈𝐿𝐿
{𝑐𝑐𝑚𝑚(𝑒𝑒)} , min𝑒𝑒∈𝐿𝐿
{𝑐𝑐𝑚𝑚(𝑒𝑒)} > 0
0, 𝑜𝑜𝑜𝑜ℎ𝑒𝑒𝑒𝑒𝑒𝑒𝑒𝑒𝑠𝑠𝑒𝑒
∑ 𝑥𝑥𝑚𝑚𝑈𝑈 (𝑒𝑒′)𝑒𝑒′∈𝐸𝐸𝐶𝐶(𝑒𝑒)
+ ∑ 𝑥𝑥𝑚𝑚𝑁𝑁𝑁𝑁(𝐿𝐿) ≤ 1, ∀𝑚𝑚 ∈ 𝑀𝑀 & ∀𝑒𝑒 ∈ 𝐸𝐸 ∪ 𝐼𝐼 𝑳𝑳∈𝐿𝐿𝑚𝑚𝐶𝐶 (𝑒𝑒)
Transmis
sion
interference
constraint
0 ≤ 𝑓𝑓𝑚𝑚𝑁𝑁𝑁𝑁(𝐿𝐿) ≤ min𝑒𝑒∈𝐿𝐿
{𝑐𝑐𝑚𝑚(𝑒𝑒)} , ∀𝑚𝑚 ∈ 𝑀𝑀 & ∀L ∈ 𝑳𝑳
0 ≤ 𝑓𝑓𝑚𝑚𝑈𝑈(𝑒𝑒) ≤ 𝑐𝑐𝑚𝑚(𝑒𝑒), ∀𝑚𝑚 ∈ 𝑀𝑀 & ∀𝑒𝑒 ∈ 𝐸𝐸
Link
capacity
constraint
∑ ( ∑ 𝑥𝑥𝑚𝑚𝑈𝑈 (𝑒𝑒) + ∑ 𝑥𝑥𝑚𝑚𝑁𝑁𝑁𝑁(𝐿𝐿) )L∈∪𝑒𝑒∈𝐸𝐸(𝑣𝑣)𝐿𝐿(𝑒𝑒)𝑒𝑒∈𝐸𝐸(𝑣𝑣)𝑚𝑚∈𝑀𝑀
≤ 𝑊𝑊(𝑣𝑣) Node
radio
constraint
EVALUATION ON RAPID PROFILING WITH CLUSTERING ALGORITHMS FOR PLANTATION STOCKS
ON BURSA MALAYSIA
Keng-Hoong Ng & Kok-Chin KhorMultimedia University, Malaysia
[email protected]; [email protected]
ABSTRACT
Building a stock portfolio often requires extensive financial knowledge and Herculean efforts looking at the amount of financial data to analyse. In this study, we utilized Expectation Maximization (EM), K-Means (KM), and Hierarchical Clustering (HC) algorithms to cluster the 38 plantation stocks listed on Bursa Malaysia using 14 financial ratios derived from the fundamental analysis. The clustering allows investors to profile each resulted cluster statistically and assists them in selecting stocks for their stock portfolios rapidly. The performance of each cluster was then assessed using 1-year stock price movement. The result showed that a cluster resulted from EM had a better profile and obtained a higher average capital gain as compared with the other clusters.
Keywords: Stock profiling, stock portfolio, financial ratios, expectation maximization, K-means, hierarchical clustering.
INTRODUCTION
Investing in stock markets is not an easy task for many people as stock markets are complex and dynamic systems. Short term movements or patterns in stock markets are always unpredictable and difficult to trace. Thus, lucrative returns are difficult to gain from stock investments. However, investors and financial researchers still keen to adopt different approaches to understand the behaviour of stock markets. As a result, the research into stock markets remains interesting and appealing to them. In the early years, research on the stock price movements and predictions was primarily based on statistical
http
://jic
t.uum
.edu
.my
Journal of ICT, 15, No. 2 (December) 2016, pp: 63–84
64
approaches (Brown & Warner, 1985; Pearce, 1984). But in recent years, the focus of the stock research has been shifted to applying data mining techniques (Ou & Wang, 2009).
Data mining is a process of identifying interesting patterns in data for decision making (Ngai, Hu, Wong, Chen, & Sun, 2011). Historical data, i.e., financial data or time series data of stocks are readily available and huge in size. Applying data mining techniques on the data will definitely allow researchers in identifying and uncovering the hidden patterns of a particular stock or even a stock market. Classification, clustering and generalization are among the commonly used data mining techniques to analyse and predict the movement of stock prices or stock market indexes. In this research, clustering algorithms were adopted on the financial data of plantation stocks listed on Bursa Malaysia. Clustering in the data mining context refers to unsupervised classification of data into clusters/groups, and the data in the same cluster exhibit a certain degree of pattern similarity (Jain, Murty, & Flynn, 1999). The clustering algorithms have been widely used in many disciplines such as Bioinformatics (Ng, Ho, & Phon-Amnuaisuk, 2012), big data analytics (Feldman, Schmidt, & Sohler, 2013), multi-level Kohonen network learning (Shamsuddin, Zainal, & Mohd Yusof, 2008), etc.
Although clustering research on stock market data is not new, but the research remains challenging. This is because the size of stock market data can be substantially huge and they often need to be pre-processed carefully and accurately before use. Furthermore, the patterns exist in the data of a particular stock market data might be different from others. Hence, the stock research with clustering is still intact and attractive to many researchers. In a study by Nanda, Mahanty, & Tiwari (2010), clustering was performed on stocks listed on Bombay Stock Exchange (BSE) with the objective of building a stock portfolio via the selection of stocks from the resulted clusters, and then compared the investment returns with the Sensex index; the research indicated that KM clustering yielded better results as compared to Self-organizing Map (SOM) and Fuzzy C-Means. Lee, Lin, Kao, & Chen (2010) applied hierarchical agglomerative and KM clustering to predict the short-term movement of stock prices after releasing the financial reports.
Clustering technique was also applied to predict and assess the stock market co-movement (Aghabozorgi & Teh, 2014). The researchers proposed a three-phase clustering method to group the stocks listed on the Kuala Lumpur Stock Exchange (now known as Bursa Malaysia). It started the first phase with the approximate clustering of the stocks using a low-resolution time series data. The clusters formed were further refined by splitting them into sub-clusters in
http
://jic
t.uum
.edu
.my
65
Journal of ICT, 15, No. 2 (December) 2016, pp: 63–84
the second phase. The third phase involved the merging of sub-clusters into the final clusters. Hsu (2011) proposed a hybrid method to predict the prices of stocks listed on Taiwan Stock Exchange; the hybrid method was formed by integrating the SOM and genetic programming. The researcher claimed that the hybrid method was effective for stock price prediction.
Classification technique was also employed in the stock market research. A fuzzy rule based system was proposed by Chang and Liu (2008) to predict the electronic stock prices in Taiwan Stock Exchange. Besides, Tan, Yong, & Tay (2012) applied Bayesian Networks (BN) to model the financial ratios of plantation stocks listed in Malaysia; the developed model can be used to forecast the future price performance of the plantation stocks. Much early research employed Artificial Neural Network (ANN) to predict the stock market. Thus, there were quite a number of ANN-based stock prediction models reported by financial researchers (Zhang & Wu, 2009; Ishikawa, Fukuhara, & Nakamura, 1997; Yoon & Swales, 1991).
Data mining research in stock markets generally uses (1) fundamental analysis or (2) technical analysis to analyse stocks (Lam, 2004). Fundamental analysis refers to the finding of the intrinsic value of a stock that can be measured from the stock’s quantitative and qualitative data (Tan et al., 2012; Lee et al., 2010; Nanda et al., 2010; Yoon & Swales, 1991). Quantitative data mainly comprise of financial ratios such as profit margin, debt ratio, price earnings ratio, etc. Qualitative data, on the other hand, link to the quality of key management, company policy, brand, marketing strategy, etc. Unlike fundamental analysis, technical analysis emphasises on the patterns and trends of a stock trading information; it gathers and analyses statistics generated by stock activities, i.e., price movement and volume. The patterns or trends discovered by the technical analysis are used as indicators to predict future stock price performance (Aghabozorgi & Teh, 2014; Hsu, 2011; Zhang & Wu, 2009; Chang & Liu, 2008). These two analyses produced relevant stock information that is beneficial to investors in building stock portfolios.
A stock portfolio is a collection of stocks possessed by an individual or a company. Building a stock portfolio often needs Herculean efforts from an investor. This is because of the large number of stocks in a stock market. For instance, there are more than 900 common stocks (excluding financial derivatives) listed on Bursa Malaysia. Thus, building a good stock portfolio is always not an easy task for an amateur or even a professional fund manager. It is always important for a stock investor to find an efficient way to build a good stock portfolio which can generate excellent investment returns.
http
://jic
t.uum
.edu
.my
Journal of ICT, 15, No. 2 (December) 2016, pp: 63–84
66
Thus, the primary objective of this study is to perform a rapid profiling on the 38 plantation stocks listed on Bursa Malaysia using quantitative data of stocks and clustering algorithms. Selecting the plantation stocks for this study is mainly because these stocks play an important role in the economy of Malaysia. Besides, Malaysia is also among the world largest exporters of palm oil (Sulaiman, Abdullah, Gerhauser, & Shariff, 2011) and rubber (Nambiar, 2010).
The organization of this paper is as follows. The second section provides the detail of the research methodology. The third section covers the clustering results for these three clustering algorithms, as well as the analysis and discussion of the results. The last section concludes the paper and suggests the future directions of this research.
METHODOLOGY
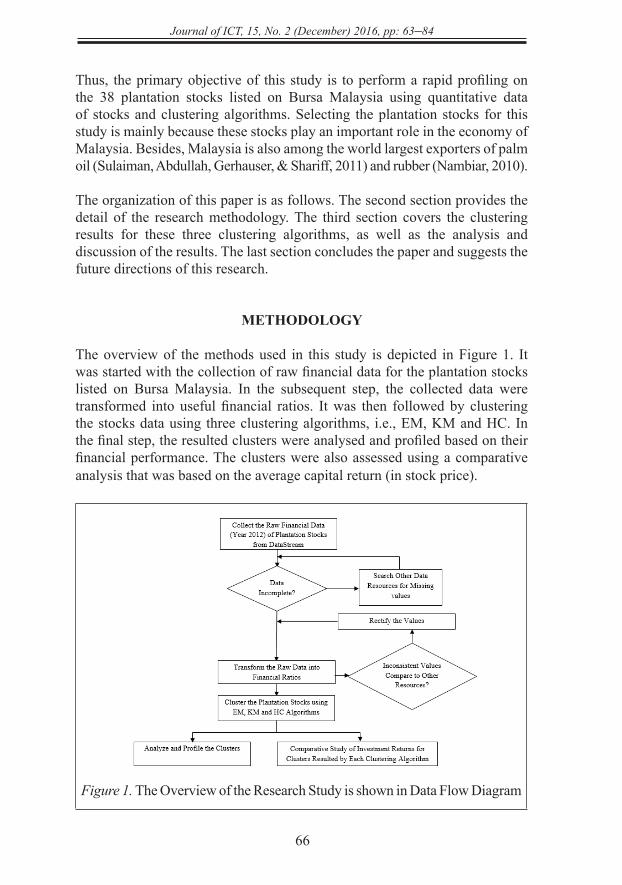
The overview of the methods used in this study is depicted in Figure 1. It was started with the collection of raw financial data for the plantation stocks listed on Bursa Malaysia. In the subsequent step, the collected data were transformed into useful financial ratios. It was then followed by clustering the stocks data using three clustering algorithms, i.e., EM, KM and HC. In the final step, the resulted clusters were analysed and profiled based on their financial performance. The clusters were also assessed using a comparative analysis that was based on the average capital return (in stock price).
Figure 1. The Overview of the Research Study is shown in Data Flow Diagram
http
://jic
t.uum
.edu
.my
67
Journal of ICT, 15, No. 2 (December) 2016, pp: 63–84
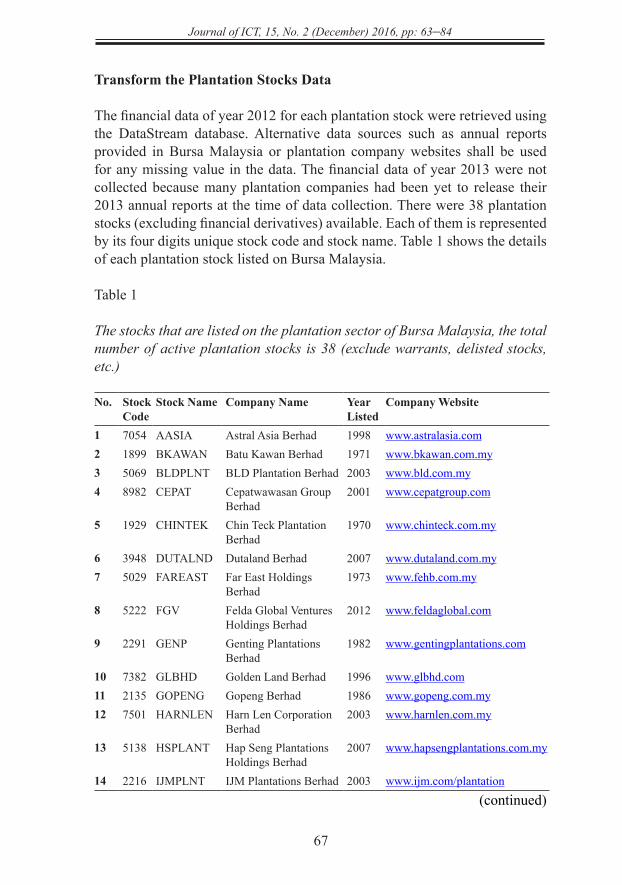
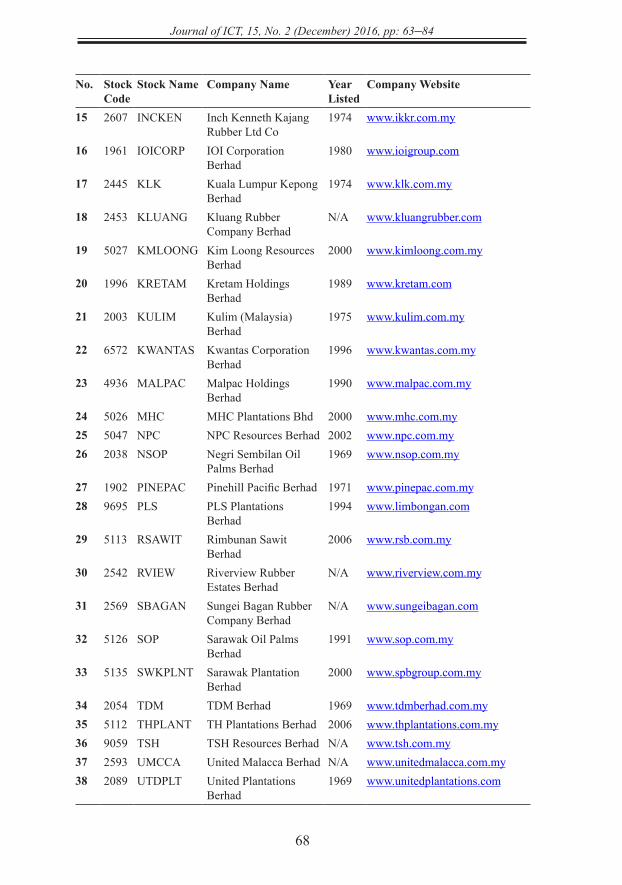
Transform the Plantation Stocks Data
The financial data of year 2012 for each plantation stock were retrieved using the DataStream database. Alternative data sources such as annual reports provided in Bursa Malaysia or plantation company websites shall be used for any missing value in the data. The financial data of year 2013 were not collected because many plantation companies had been yet to release their 2013 annual reports at the time of data collection. There were 38 plantation stocks (excluding financial derivatives) available. Each of them is represented by its four digits unique stock code and stock name. Table 1 shows the details of each plantation stock listed on Bursa Malaysia.
Table 1
The stocks that are listed on the plantation sector of Bursa Malaysia, the total number of active plantation stocks is 38 (exclude warrants, delisted stocks, etc.)
No. Stock Code
Stock Name Company Name Year Listed
Company Website
1 7054 AASIA Astral Asia Berhad 1998 www.astralasia.com2 1899 BKAWAN Batu Kawan Berhad 1971 www.bkawan.com.my3 5069 BLDPLNT BLD Plantation Berhad 2003 www.bld.com.my4 8982 CEPAT Cepatwawasan Group
Berhad2001 www.cepatgroup.com
5 1929 CHINTEK Chin Teck Plantation Berhad
1970 www.chinteck.com.my
6 3948 DUTALND Dutaland Berhad 2007 www.dutaland.com.my7 5029 FAREAST Far East Holdings
Berhad1973 www.fehb.com.my
8 5222 FGV Felda Global Ventures Holdings Berhad
2012 www.feldaglobal.com
9 2291 GENP Genting Plantations Berhad
1982 www.gentingplantations.com
10 7382 GLBHD Golden Land Berhad 1996 www.glbhd.com11 2135 GOPENG Gopeng Berhad 1986 www.gopeng.com.my12 7501 HARNLEN Harn Len Corporation
Berhad2003 www.harnlen.com.my
13 5138 HSPLANT Hap Seng Plantations Holdings Berhad
2007 www.hapsengplantations.com.my
14 2216 IJMPLNT IJM Plantations Berhad 2003 www.ijm.com/plantation
(continued)
http
://jic
t.uum
.edu
.my
Journal of ICT, 15, No. 2 (December) 2016, pp: 63–84
68
No. Stock Code
Stock Name Company Name Year Listed
Company Website
15 2607 INCKEN Inch Kenneth Kajang Rubber Ltd Co
1974 www.ikkr.com.my
16 1961 IOICORP IOI Corporation Berhad
1980 www.ioigroup.com
17 2445 KLK Kuala Lumpur Kepong Berhad
1974 www.klk.com.my
18 2453 KLUANG Kluang Rubber Company Berhad
N/A www.kluangrubber.com
19 5027 KMLOONG Kim Loong Resources Berhad
2000 www.kimloong.com.my
20 1996 KRETAM Kretam Holdings Berhad
1989 www.kretam.com
21 2003 KULIM Kulim (Malaysia) Berhad
1975 www.kulim.com.my
22 6572 KWANTAS Kwantas Corporation Berhad
1996 www.kwantas.com.my
23 4936 MALPAC Malpac Holdings Berhad
1990 www.malpac.com.my
24 5026 MHC MHC Plantations Bhd 2000 www.mhc.com.my25 5047 NPC NPC Resources Berhad 2002 www.npc.com.my26 2038 NSOP Negri Sembilan Oil
Palms Berhad1969 www.nsop.com.my
27 1902 PINEPAC Pinehill Pacific Berhad 1971 www.pinepac.com.my28 9695 PLS PLS Plantations
Berhad1994 www.limbongan.com
29 5113 RSAWIT Rimbunan Sawit Berhad
2006 www.rsb.com.my
30 2542 RVIEW Riverview Rubber Estates Berhad
N/A www.riverview.com.my
31 2569 SBAGAN Sungei Bagan Rubber Company Berhad
N/A www.sungeibagan.com
32 5126 SOP Sarawak Oil Palms Berhad
1991 www.sop.com.my
33 5135 SWKPLNT Sarawak Plantation Berhad
2000 www.spbgroup.com.my
34 2054 TDM TDM Berhad 1969 www.tdmberhad.com.my35 5112 THPLANT TH Plantations Berhad 2006 www.thplantations.com.my36 9059 TSH TSH Resources Berhad N/A www.tsh.com.my37 2593 UMCCA United Malacca Berhad N/A www.unitedmalacca.com.my38 2089 UTDPLT United Plantations
Berhad1969 www.unitedplantations.com
http
://jic
t.uum
.edu
.my
69
Journal of ICT, 15, No. 2 (December) 2016, pp: 63–84
The collected financial data were raw data and inappropriate to be used directly. For instance, we cannot claim that two plantation companies with different scales are equivalent in financial performance even though they are generating the same amount of profit; the plantation company with the smaller scale is more remarkable as compared with a plantation company with a bigger scale. To effectively compare them, financial ratios such as earnings per share (EPS) or return on equity (ROE) are more suitable than just looking at the amount of profit. Financial ratios are crucial indicators to evaluate the “health” or financial status of a stock (Sim & Liu, 2011). They have been used extensively in the data mining research on financial and stock data (Baresa, Bogdan & Ivanovic, 2013; Tan et al., 2012; Sim & Liu, 2011; Lee et al., 2010; Kloptchenko et al., 2004). Thus, the next step was to pre-process the raw financial data and convert it into useful financial ratios. The consistency of these financial ratios was checked against other resources such as online trading portals. Rectification was conducted for any value inconsistency in these financial ratios.
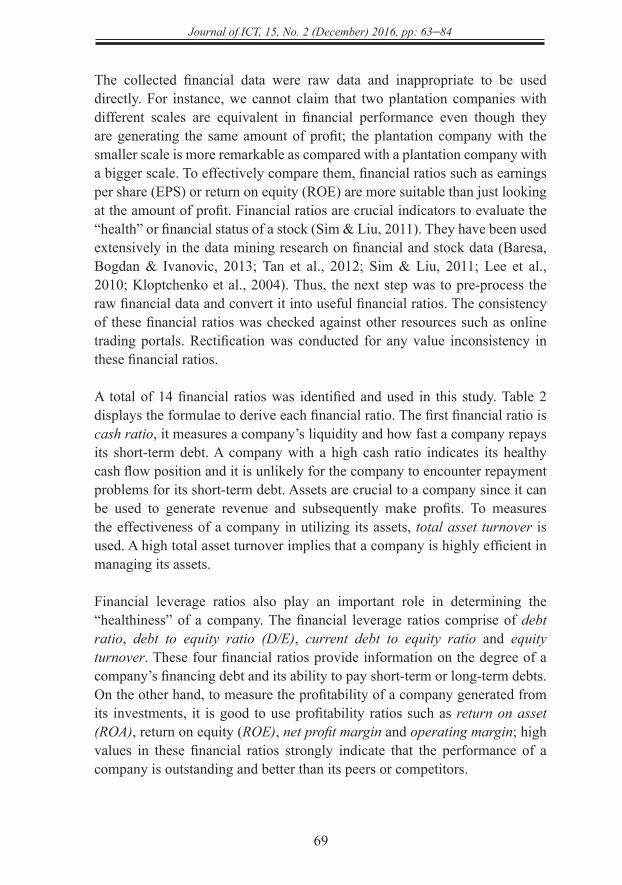
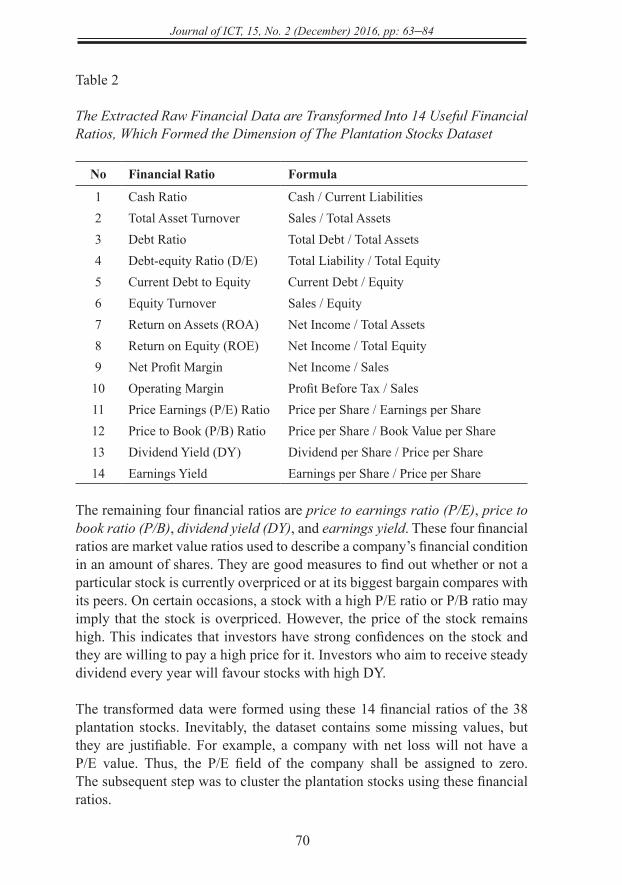
A total of 14 financial ratios was identified and used in this study. Table 2 displays the formulae to derive each financial ratio. The first financial ratio is cash ratio, it measures a company’s liquidity and how fast a company repays its short-term debt. A company with a high cash ratio indicates its healthy cash flow position and it is unlikely for the company to encounter repayment problems for its short-term debt. Assets are crucial to a company since it can be used to generate revenue and subsequently make profits. To measures the effectiveness of a company in utilizing its assets, total asset turnover is used. A high total asset turnover implies that a company is highly efficient in managing its assets.
Financial leverage ratios also play an important role in determining the “healthiness” of a company. The financial leverage ratios comprise of debt ratio, debt to equity ratio (D/E), current debt to equity ratio and equity turnover. These four financial ratios provide information on the degree of a company’s financing debt and its ability to pay short-term or long-term debts. On the other hand, to measure the profitability of a company generated from its investments, it is good to use profitability ratios such as return on asset (ROA), return on equity (ROE), net profit margin and operating margin; high values in these financial ratios strongly indicate that the performance of a company is outstanding and better than its peers or competitors.
http
://jic
t.uum
.edu
.my
Journal of ICT, 15, No. 2 (December) 2016, pp: 63–84
70
Table 2
The Extracted Raw Financial Data are Transformed Into 14 Useful Financial Ratios, Which Formed the Dimension of The Plantation Stocks Dataset
No Financial Ratio Formula
1 Cash Ratio Cash / Current Liabilities2 Total Asset Turnover Sales / Total Assets3 Debt Ratio Total Debt / Total Assets4 Debt-equity Ratio (D/E) Total Liability / Total Equity5 Current Debt to Equity Current Debt / Equity6 Equity Turnover Sales / Equity7 Return on Assets (ROA) Net Income / Total Assets8 Return on Equity (ROE) Net Income / Total Equity9 Net Profit Margin Net Income / Sales10 Operating Margin Profit Before Tax / Sales11 Price Earnings (P/E) Ratio Price per Share / Earnings per Share12 Price to Book (P/B) Ratio Price per Share / Book Value per Share13 Dividend Yield (DY) Dividend per Share / Price per Share14 Earnings Yield Earnings per Share / Price per Share
The remaining four financial ratios are price to earnings ratio (P/E), price to book ratio (P/B), dividend yield (DY), and earnings yield. These four financial ratios are market value ratios used to describe a company’s financial condition in an amount of shares. They are good measures to find out whether or not a particular stock is currently overpriced or at its biggest bargain compares with its peers. On certain occasions, a stock with a high P/E ratio or P/B ratio may imply that the stock is overpriced. However, the price of the stock remains high. This indicates that investors have strong confidences on the stock and they are willing to pay a high price for it. Investors who aim to receive steady dividend every year will favour stocks with high DY.
The transformed data were formed using these 14 financial ratios of the 38 plantation stocks. Inevitably, the dataset contains some missing values, but they are justifiable. For example, a company with net loss will not have a P/E value. Thus, the P/E field of the company shall be assigned to zero. The subsequent step was to cluster the plantation stocks using these financial ratios.
http
://jic
t.uum
.edu
.my
71
Journal of ICT, 15, No. 2 (December) 2016, pp: 63–84
Clustering Algorithms
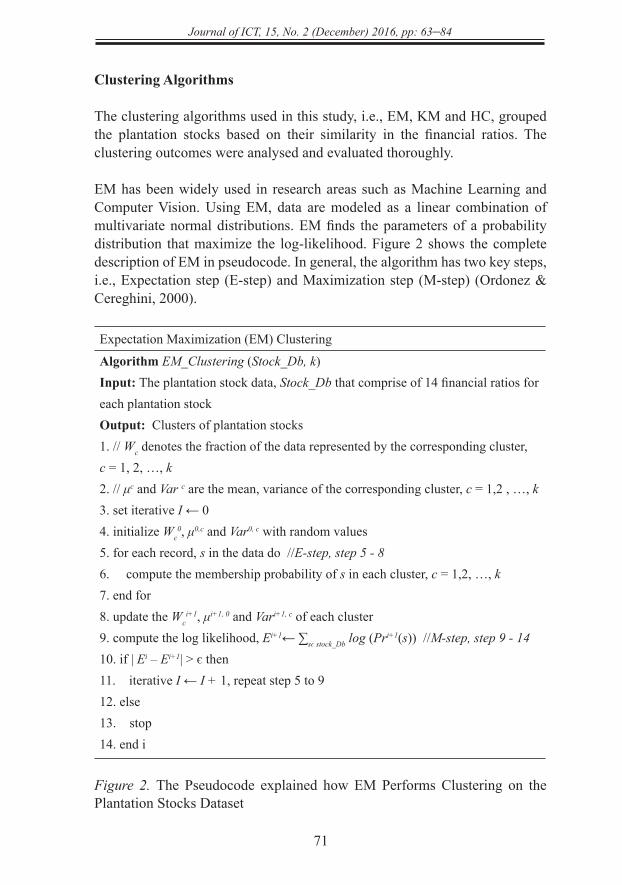
The clustering algorithms used in this study, i.e., EM, KM and HC, grouped the plantation stocks based on their similarity in the financial ratios. The clustering outcomes were analysed and evaluated thoroughly.
EM has been widely used in research areas such as Machine Learning and Computer Vision. Using EM, data are modeled as a linear combination of multivariate normal distributions. EM finds the parameters of a probability distribution that maximize the log-likelihood. Figure 2 shows the complete description of EM in pseudocode. In general, the algorithm has two key steps, i.e., Expectation step (E-step) and Maximization step (M-step) (Ordonez & Cereghini, 2000).
Expectation Maximization (EM) Clustering
Algorithm EM_Clustering (Stock_Db, k)Input: The plantation stock data, Stock_Db that comprise of 14 financial ratios for each plantation stock Output: Clusters of plantation stocks1. // Wc denotes the fraction of the data represented by the corresponding cluster, c = 1, 2, …, k2. // μc and Var c are the mean, variance of the corresponding cluster, c = 1,2 , …, k3. set iterative I ← 04. initialize Wc
0, μ0,c and Var0, c with random values5. for each record, s in the data do //E-step, step 5 - 86. compute the membership probability of s in each cluster, c = 1,2, …, k7. end for 8. update the Wc
i+1, μi+1, 0 and Vari+1, c of each cluster9. compute the log likelihood, Ei+1← ∑sϵ stock_Db log (Pri+1(s)) //M-step, step 9 - 1410. if | Ei – Ei+1| > є then11. iterative I ← I + 1, repeat step 5 to 912. else 13. stop14. end i
Figure 2. The Pseudocode explained how EM Performs Clustering on the Plantation Stocks Dataset
http
://jic
t.uum
.edu
.my
Journal of ICT, 15, No. 2 (December) 2016, pp: 63–84
72
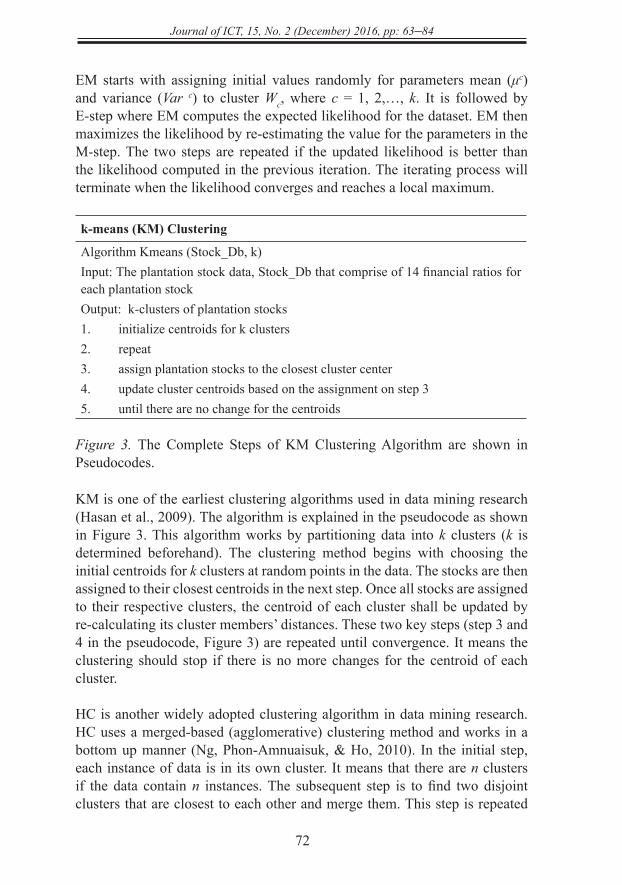
EM starts with assigning initial values randomly for parameters mean (μc) and variance (Var c) to cluster Wc, where c = 1, 2,…, k. It is followed by E-step where EM computes the expected likelihood for the dataset. EM then maximizes the likelihood by re-estimating the value for the parameters in the M-step. The two steps are repeated if the updated likelihood is better than the likelihood computed in the previous iteration. The iterating process will terminate when the likelihood converges and reaches a local maximum.
k-means (KM) Clustering
Algorithm Kmeans (Stock_Db, k)Input: The plantation stock data, Stock_Db that comprise of 14 financial ratios for each plantation stockOutput: k-clusters of plantation stocks1. initialize centroids for k clusters2. repeat3. assign plantation stocks to the closest cluster center 4. update cluster centroids based on the assignment on step 35. until there are no change for the centroids
Figure 3. The Complete Steps of KM Clustering Algorithm are shown in Pseudocodes.
KM is one of the earliest clustering algorithms used in data mining research (Hasan et al., 2009). The algorithm is explained in the pseudocode as shown in Figure 3. This algorithm works by partitioning data into k clusters (k is determined beforehand). The clustering method begins with choosing the initial centroids for k clusters at random points in the data. The stocks are then assigned to their closest centroids in the next step. Once all stocks are assigned to their respective clusters, the centroid of each cluster shall be updated by re-calculating its cluster members’ distances. These two key steps (step 3 and 4 in the pseudocode, Figure 3) are repeated until convergence. It means the clustering should stop if there is no more changes for the centroid of each cluster.
HC is another widely adopted clustering algorithm in data mining research. HC uses a merged-based (agglomerative) clustering method and works in a bottom up manner (Ng, Phon-Amnuaisuk, & Ho, 2010). In the initial step, each instance of data is in its own cluster. It means that there are n clusters if the data contain n instances. The subsequent step is to find two disjoint clusters that are closest to each other and merge them. This step is repeated
http
://jic
t.uum
.edu
.my

73
Journal of ICT, 15, No. 2 (December) 2016, pp: 63–84
until all clusters are merged into the specified k clusters. Figure 4 shows the detail of the HC algorithm in pseudocode.
Hierarchical Clustering (HC)
Algorithm Hierarchical (Stock_Db, k)Input: The plantation stocks dataset, Stock_Db that comprises of 14 financial ratios for each plantation stockOutput: k-clusters of plantation stocks1. for a ← 1 to n // n denotes the plantation stock quantity in the dataset 2. let Ca = {sa} // start with n cluster, each cluster has only one plantation
stock, s 3. repeat 4. find a pair of non-merged clusters, e.g. Ca and Cb so that the cluster
resulting from their union has the smallest diameter5. merge Ca and Cb6. until n plantation stocks are clustered into k clusters
Figure 4. The Pseudocode for the HC Algorithm.
The three clustering algorithms were used in this study because of the justifications as follows. Firstly, these algorithms are well-established and commonly used in the data mining research. Secondly, the computational efficiency of these clustering algorithms is considered acceptable (Abbas, 2008). Thus, the time consumption and memory space are feasible for processing the transformed data using a low end computer. The next section reveals and discusses the clustering results of the plantation stocks. The statistical properties of the resulted clusters were used for stock analysing and profiling. A comparative study of investment returns for each of the resulted clusters was conducted based on the capital gain (in stock price) from January till December 2013.
RESULTS & DISCUSSION
The clustering results of these three clustering algorithms are displayed in Table 3. The statistical properties of the resulted clusters are also shown in the table. In this study, the mean and the 5-number summary (minimum, 1st quartile, median, 3rd quartile and maximum) were used to discuss the clustering results and to understand the data dispersion of the resulted clusters, respectively. The mean is the average of a financial ratio in a cluster. In case
http
://jic
t.uum
.edu
.my

Journal of ICT, 15, No. 2 (December) 2016, pp: 63–84
74
a cluster has extreme values or asymmetric data dispersion, they may greatly influence the mean value. However, the mean was used in this study because it can be understood easily as it has convenient mathematical properties that allow it to be used in many statistical contexts (Whitley & Ball, 2002).
The data were first clustered using EM. The number of clusters was not set beforehand as there was no prior information about the dataset. The number of clusters was determined by EM itself based on the patterns discovered in the data. As a result, EM yielded two clusters, i.e., cluster 0 and cluster 1 which contain 18 and 20 stocks, respectively. To allow the comparative analysis among these three clustering algorithms, the number of clusters was set to two for KM and HC.
Comparing Clusters
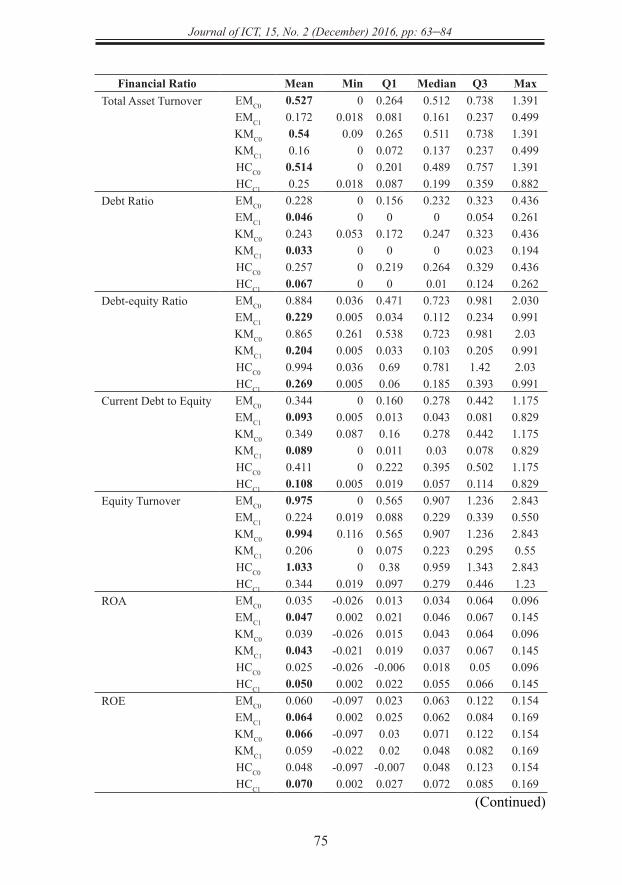
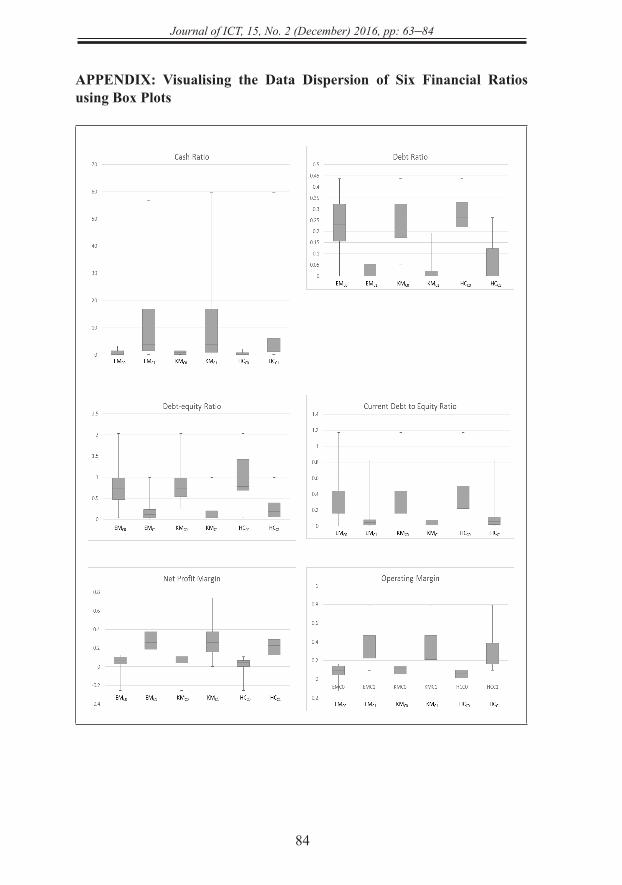
Table 3 shows the statistics of clusters generated by the algorithms. Each cluster is represented using a specific name. For instance, EMC0 denotes cluster 0 resulted from EM. By comparing the clusters, it was observed that generally the plantation stocks in cluster 1 had a better financial profile than those in cluster 0 regardless of the clustering algorithms used (Table 3). This was because cluster 1s scored better than cluster 0s in 11 out of 14 financial ratios, particularly with major differences in cash ratio, debt ratio, debt-equity ratio, current debt to equity ratio, net profit margin, and operating margin (also refer to Appendix). The profile of the clusters shall be discussed as follows using these six financial ratios. The financial ratios of cluster 0s and 1s were compared regardless of the clustering algorithms used as they exhibit the same phenomenon as follows.
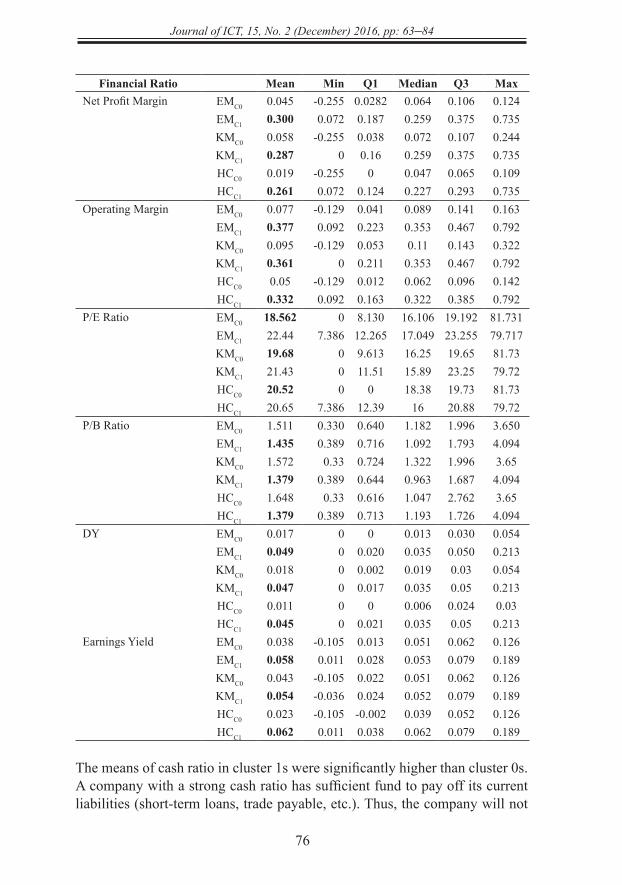
Table 3
The Statistics (Mean And 5-Number Summary) of Clusters Generated by EM, KM, and HC Algorithms. Comparing the Clusters Resulted from the Same Algorithm, the Numbers in Bold Indicate a Better Financial Ratio of a Cluster than the Other
Financial Ratio Mean Min Q1 Median Q3 MaxCash Ratio EMC0 0.890 0 0.095 0.658 1.466 3.237
EMC1 12.89 0.076 1.447 3.818 16.90 56.65KMC0 1.047 0.039 0.106 0.903 1.532 3.237KMC1 12.75 0 0.956 3.818 16.90 59.65HCC0 0.597 0 0.074 0.109 0.767 2.161HCC1 10.65 0.076 1.178 3.237 6.108 59.65
(Continued)
http
://jic
t.uum
.edu
.my
75
Journal of ICT, 15, No. 2 (December) 2016, pp: 63–84
Financial Ratio Mean Min Q1 Median Q3 MaxTotal Asset Turnover EMC0 0.527 0 0.264 0.512 0.738 1.391
EMC1 0.172 0.018 0.081 0.161 0.237 0.499KMC0 0.54 0.09 0.265 0.511 0.738 1.391KMC1 0.16 0 0.072 0.137 0.237 0.499HCC0 0.514 0 0.201 0.489 0.757 1.391HCC1 0.25 0.018 0.087 0.199 0.359 0.882
Debt Ratio EMC0 0.228 0 0.156 0.232 0.323 0.436EMC1 0.046 0 0 0 0.054 0.261KMC0 0.243 0.053 0.172 0.247 0.323 0.436KMC1 0.033 0 0 0 0.023 0.194HCC0 0.257 0 0.219 0.264 0.329 0.436HCC1 0.067 0 0 0.01 0.124 0.262
Debt-equity Ratio EMC0 0.884 0.036 0.471 0.723 0.981 2.030EMC1 0.229 0.005 0.034 0.112 0.234 0.991KMC0 0.865 0.261 0.538 0.723 0.981 2.03KMC1 0.204 0.005 0.033 0.103 0.205 0.991HCC0 0.994 0.036 0.69 0.781 1.42 2.03HCC1 0.269 0.005 0.06 0.185 0.393 0.991
Current Debt to Equity EMC0 0.344 0 0.160 0.278 0.442 1.175EMC1 0.093 0.005 0.013 0.043 0.081 0.829KMC0 0.349 0.087 0.16 0.278 0.442 1.175KMC1 0.089 0 0.011 0.03 0.078 0.829HCC0 0.411 0 0.222 0.395 0.502 1.175HCC1 0.108 0.005 0.019 0.057 0.114 0.829
Equity Turnover EMC0 0.975 0 0.565 0.907 1.236 2.843EMC1 0.224 0.019 0.088 0.229 0.339 0.550KMC0 0.994 0.116 0.565 0.907 1.236 2.843KMC1 0.206 0 0.075 0.223 0.295 0.55HCC0 1.033 0 0.38 0.959 1.343 2.843HCC1 0.344 0.019 0.097 0.279 0.446 1.23
ROA EMC0 0.035 -0.026 0.013 0.034 0.064 0.096EMC1 0.047 0.002 0.021 0.046 0.067 0.145KMC0 0.039 -0.026 0.015 0.043 0.064 0.096KMC1 0.043 -0.021 0.019 0.037 0.067 0.145HCC0 0.025 -0.026 -0.006 0.018 0.05 0.096HCC1 0.050 0.002 0.022 0.055 0.066 0.145
ROE EMC0 0.060 -0.097 0.023 0.063 0.122 0.154EMC1 0.064 0.002 0.025 0.062 0.084 0.169KMC0 0.066 -0.097 0.03 0.071 0.122 0.154KMC1 0.059 -0.022 0.02 0.048 0.082 0.169HCC0 0.048 -0.097 -0.007 0.048 0.123 0.154HCC1 0.070 0.002 0.027 0.072 0.085 0.169
(Continued)
http
://jic
t.uum
.edu
.my
Journal of ICT, 15, No. 2 (December) 2016, pp: 63–84
76
Financial Ratio Mean Min Q1 Median Q3 MaxNet Profit Margin EMC0 0.045 -0.255 0.0282 0.064 0.106 0.124
EMC1 0.300 0.072 0.187 0.259 0.375 0.735KMC0 0.058 -0.255 0.038 0.072 0.107 0.244KMC1 0.287 0 0.16 0.259 0.375 0.735HCC0 0.019 -0.255 0 0.047 0.065 0.109HCC1 0.261 0.072 0.124 0.227 0.293 0.735
Operating Margin EMC0 0.077 -0.129 0.041 0.089 0.141 0.163EMC1 0.377 0.092 0.223 0.353 0.467 0.792KMC0 0.095 -0.129 0.053 0.11 0.143 0.322KMC1 0.361 0 0.211 0.353 0.467 0.792HCC0 0.05 -0.129 0.012 0.062 0.096 0.142HCC1 0.332 0.092 0.163 0.322 0.385 0.792
P/E Ratio EMC0 18.562 0 8.130 16.106 19.192 81.731EMC1 22.44 7.386 12.265 17.049 23.255 79.717KMC0 19.68 0 9.613 16.25 19.65 81.73KMC1 21.43 0 11.51 15.89 23.25 79.72HCC0 20.52 0 0 18.38 19.73 81.73HCC1 20.65 7.386 12.39 16 20.88 79.72
P/B Ratio EMC0 1.511 0.330 0.640 1.182 1.996 3.650EMC1 1.435 0.389 0.716 1.092 1.793 4.094KMC0 1.572 0.33 0.724 1.322 1.996 3.65KMC1 1.379 0.389 0.644 0.963 1.687 4.094HCC0 1.648 0.33 0.616 1.047 2.762 3.65HCC1 1.379 0.389 0.713 1.193 1.726 4.094
DY EMC0 0.017 0 0 0.013 0.030 0.054EMC1 0.049 0 0.020 0.035 0.050 0.213KMC0 0.018 0 0.002 0.019 0.03 0.054KMC1 0.047 0 0.017 0.035 0.05 0.213HCC0 0.011 0 0 0.006 0.024 0.03HCC1 0.045 0 0.021 0.035 0.05 0.213
Earnings Yield EMC0 0.038 -0.105 0.013 0.051 0.062 0.126EMC1 0.058 0.011 0.028 0.053 0.079 0.189KMC0 0.043 -0.105 0.022 0.051 0.062 0.126KMC1 0.054 -0.036 0.024 0.052 0.079 0.189HCC0 0.023 -0.105 -0.002 0.039 0.052 0.126HCC1 0.062 0.011 0.038 0.062 0.079 0.189
The means of cash ratio in cluster 1s were significantly higher than cluster 0s. A company with a strong cash ratio has sufficient fund to pay off its current liabilities (short-term loans, trade payable, etc.). Thus, the company will not
http
://jic
t.uum
.edu
.my
77
Journal of ICT, 15, No. 2 (December) 2016, pp: 63–84
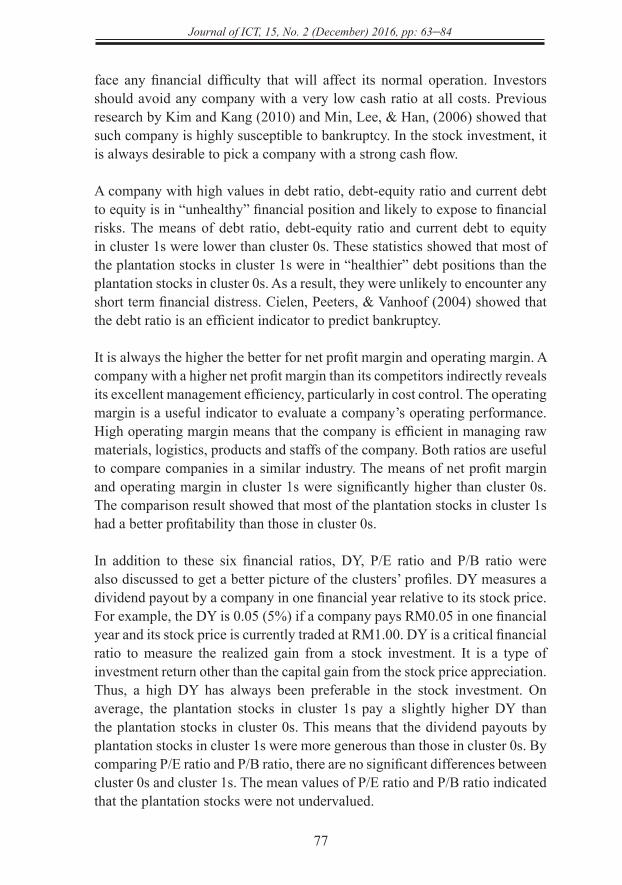
face any financial difficulty that will affect its normal operation. Investors should avoid any company with a very low cash ratio at all costs. Previous research by Kim and Kang (2010) and Min, Lee, & Han, (2006) showed that such company is highly susceptible to bankruptcy. In the stock investment, it is always desirable to pick a company with a strong cash flow. A company with high values in debt ratio, debt-equity ratio and current debt to equity is in “unhealthy” financial position and likely to expose to financial risks. The means of debt ratio, debt-equity ratio and current debt to equity in cluster 1s were lower than cluster 0s. These statistics showed that most of the plantation stocks in cluster 1s were in “healthier” debt positions than the plantation stocks in cluster 0s. As a result, they were unlikely to encounter any short term financial distress. Cielen, Peeters, & Vanhoof (2004) showed that the debt ratio is an efficient indicator to predict bankruptcy. It is always the higher the better for net profit margin and operating margin. A company with a higher net profit margin than its competitors indirectly reveals its excellent management efficiency, particularly in cost control. The operating margin is a useful indicator to evaluate a company’s operating performance. High operating margin means that the company is efficient in managing raw materials, logistics, products and staffs of the company. Both ratios are useful to compare companies in a similar industry. The means of net profit margin and operating margin in cluster 1s were significantly higher than cluster 0s. The comparison result showed that most of the plantation stocks in cluster 1s had a better profitability than those in cluster 0s. In addition to these six financial ratios, DY, P/E ratio and P/B ratio were also discussed to get a better picture of the clusters’ profiles. DY measures a dividend payout by a company in one financial year relative to its stock price. For example, the DY is 0.05 (5%) if a company pays RM0.05 in one financial year and its stock price is currently traded at RM1.00. DY is a critical financial ratio to measure the realized gain from a stock investment. It is a type of investment return other than the capital gain from the stock price appreciation. Thus, a high DY has always been preferable in the stock investment. On average, the plantation stocks in cluster 1s pay a slightly higher DY than the plantation stocks in cluster 0s. This means that the dividend payouts by plantation stocks in cluster 1s were more generous than those in cluster 0s. By comparing P/E ratio and P/B ratio, there are no significant differences between cluster 0s and cluster 1s. The mean values of P/E ratio and P/B ratio indicated that the plantation stocks were not undervalued.
http
://jic
t.uum
.edu
.my
Journal of ICT, 15, No. 2 (December) 2016, pp: 63–84
78
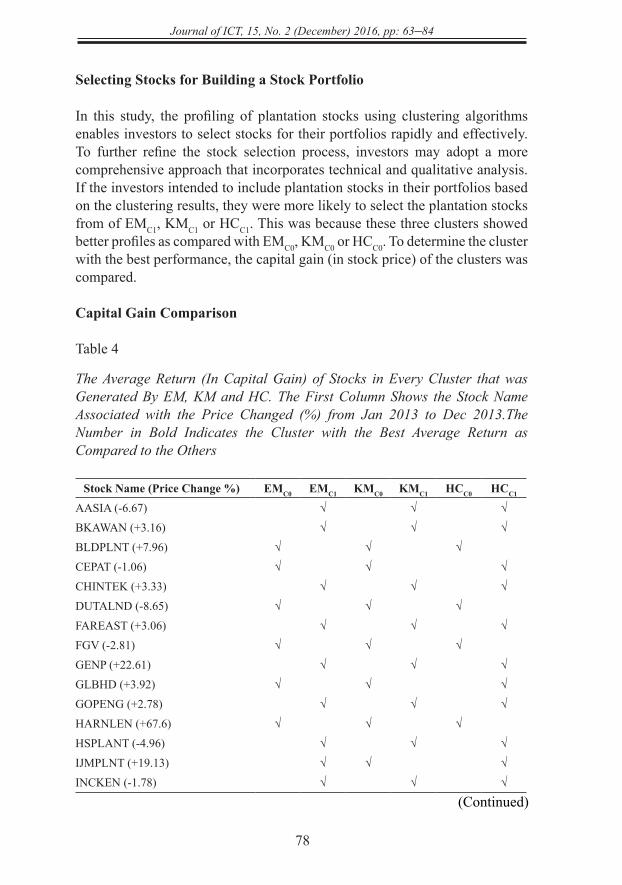
Selecting Stocks for Building a Stock Portfolio
In this study, the profiling of plantation stocks using clustering algorithms enables investors to select stocks for their portfolios rapidly and effectively. To further refine the stock selection process, investors may adopt a more comprehensive approach that incorporates technical and qualitative analysis. If the investors intended to include plantation stocks in their portfolios based on the clustering results, they were more likely to select the plantation stocks from of EMC1, KMC1 or HCC1. This was because these three clusters showed better profiles as compared with EMC0, KMC0 or HCC0. To determine the cluster with the best performance, the capital gain (in stock price) of the clusters was compared.
Capital Gain Comparison
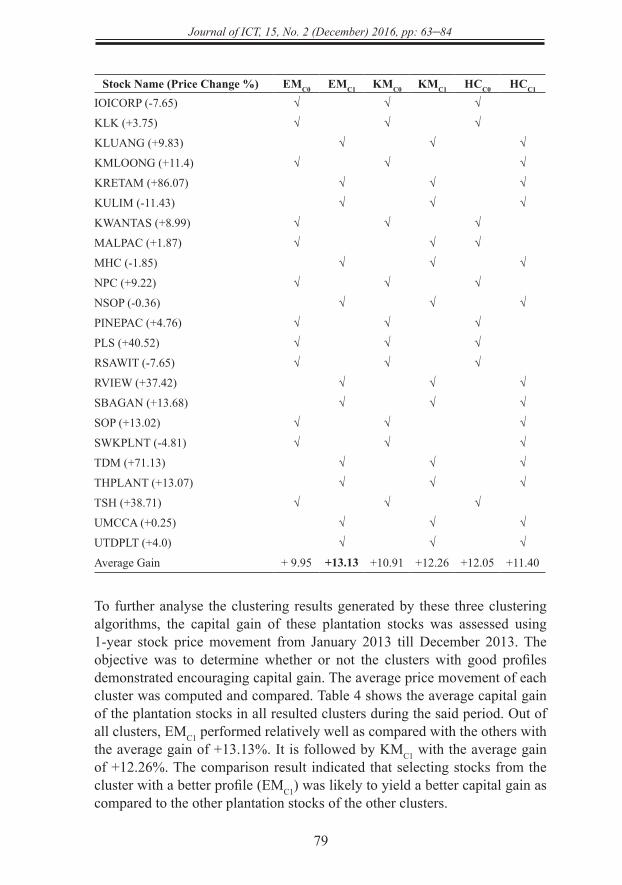
Table 4
The Average Return (In Capital Gain) of Stocks in Every Cluster that was Generated By EM, KM and HC. The First Column Shows the Stock Name Associated with the Price Changed (%) from Jan 2013 to Dec 2013.The Number in Bold Indicates the Cluster with the Best Average Return as Compared to the Others
Stock Name (Price Change %) EMC0 EMC1 KMC0 KMC1 HCC0 HCC1
AASIA (-6.67) √ √ √BKAWAN (+3.16) √ √ √BLDPLNT (+7.96) √ √ √CEPAT (-1.06) √ √ √CHINTEK (+3.33) √ √ √DUTALND (-8.65) √ √ √FAREAST (+3.06) √ √ √FGV (-2.81) √ √ √GENP (+22.61) √ √ √GLBHD (+3.92) √ √ √GOPENG (+2.78) √ √ √HARNLEN (+67.6) √ √ √HSPLANT (-4.96) √ √ √IJMPLNT (+19.13) √ √ √INCKEN (-1.78) √ √ √
(Continued)
http
://jic
t.uum
.edu
.my
79
Journal of ICT, 15, No. 2 (December) 2016, pp: 63–84
Stock Name (Price Change %) EMC0 EMC1 KMC0 KMC1 HCC0 HCC1
IOICORP (-7.65) √ √ √
KLK (+3.75) √ √ √
KLUANG (+9.83) √ √ √
KMLOONG (+11.4) √ √ √
KRETAM (+86.07) √ √ √
KULIM (-11.43) √ √ √
KWANTAS (+8.99) √ √ √
MALPAC (+1.87) √ √ √
MHC (-1.85) √ √ √
NPC (+9.22) √ √ √
NSOP (-0.36) √ √ √
PINEPAC (+4.76) √ √ √
PLS (+40.52) √ √ √
RSAWIT (-7.65) √ √ √
RVIEW (+37.42) √ √ √
SBAGAN (+13.68) √ √ √
SOP (+13.02) √ √ √
SWKPLNT (-4.81) √ √ √
TDM (+71.13) √ √ √
THPLANT (+13.07) √ √ √
TSH (+38.71) √ √ √
UMCCA (+0.25) √ √ √
UTDPLT (+4.0) √ √ √
Average Gain + 9.95 +13.13 +10.91 +12.26 +12.05 +11.40
To further analyse the clustering results generated by these three clustering algorithms, the capital gain of these plantation stocks was assessed using 1-year stock price movement from January 2013 till December 2013. The objective was to determine whether or not the clusters with good profiles demonstrated encouraging capital gain. The average price movement of each cluster was computed and compared. Table 4 shows the average capital gain of the plantation stocks in all resulted clusters during the said period. Out of all clusters, EMC1 performed relatively well as compared with the others with the average gain of +13.13%. It is followed by KMC1 with the average gain of +12.26%. The comparison result indicated that selecting stocks from the cluster with a better profile (EMC1) was likely to yield a better capital gain as compared to the other plantation stocks of the other clusters.
http
://jic
t.uum
.edu
.my
Journal of ICT, 15, No. 2 (December) 2016, pp: 63–84
80
CONCLUSION
In this study, a rapid profiling on the plantation stocks listed on Bursa Malaysia was performed using EM, KM and HC algorithms. The profiles of the resulted clusters were described using the mean and the 5-number summary. It was observed that EMC1 had a better profile as compared with the others. The capital gain of the resulted clusters was then compared and EMC1 gave the best investment return. In conclusion, the proposed profiling has demonstrated that it is able to identify clusters with good profiles and assist investors in building stock portfolios. Furthermore, the profiling is considered effective since it could provide beneficial investment information to investors.
The future directions of this research have been identified. These include: (1) the incorporation of other non-financial data (such as technical data) into the dataset for clustering purpose and (2) further dividing the existing clusters to narrow down the search for companies with outstanding performance.
REFERENCES
Abbas, O. A. (2008). Comparisons between data clustering algorithms. Int. Arab J. Inf. Technol., 5(3), 320-325.
Aghabozorgi, S., & Teh, Y. W. (2014). Stock market co-movement assessment using a three-phase clustering method. Expert Systems with Applications, 41(4), 1301-1314.
Baresa, S., Bogdan, S., & Ivanovic, Z. (2013). Strategy of stock valuation by fundamental analysis. UTMS Journal of Economics, 4(1), 45-51.
Brown, S. J., & Warner, J. B. (1985). Using daily stock returns: The case of event studies. Journal of financial economics, 14(1), 3-31.
Chang, P. C., & Liu, C. H. (2008). A TSK type fuzzy rule based system for stock price prediction. Expert Systems with applications, 34(1), 135-144.
Cielen, A., Peeters, L., & Vanhoof, K. (2004). Bankruptcy prediction using a data envelopment analysis. European Journal of Operational Research, 154(2), 526-532.
http
://jic
t.uum
.edu
.my
81
Journal of ICT, 15, No. 2 (December) 2016, pp: 63–84
Feldman, D., Schmidt, M., & Sohler, C. (2013, January). Turning big data into tiny data: Constant-size coresets for k-means, pca and projective clustering. In Proceedings of the Twenty-Fourth Annual ACM-SIAM Symposium on Discrete Algorithms (pp. 1434-1453). SIAM.
Al Hasan, M., Chaoji, V., Salem, S., & Zaki, M. J. (2009). Robust partitional clustering by outlier and density insensitive seeding. Pattern Recognition Letters, 30(11), 994-1002.
Hsu, C. M. (2011). A hybrid procedure for stock price prediction by integrating self-organizing map and genetic programming. Expert Systems with Applications, 38(11), 14026-14036.
Jain, A. K., Murty, M. N., & Flynn, P. J. (1999). Data clustering: a review. ACM computing surveys (CSUR), 31(3), 264-323.
Kim, M. J., & Kang, D. K. (2010). Ensemble with neural networks for bankruptcy prediction. Expert Systems with Applications, 37(4), 3373-3379.
Kim, Y. J., & Patel, J. M. (2006). A framework for protein structure classification and identification of novel protein structures. BMC bioinformatics, 7(1), 456.
Kloptchenko, A., Eklund, T., Karlsson, J., Back, B., Vanharanta, H., & Visa, A. (2004). Combining data and text mining techniques for analysing financial reports. Intelligent systems in accounting, finance and management, 12(1), 29-41.
Kohara, K., Ishikawa, T., Fukuhara, Y., & Nakamura, Y. (1997). Stock price prediction using prior knowledge and neural networks. Intelligent systems in accounting, finance and management, 6(1), 11-22.
Lam, M. (2004). Neural network techniques for financial performance prediction: integrating fundamental and technical analysis. Decision Support Systems, 37(4), 567-581.
Lee, A. J., Lin, M. C., Kao, R. T., & Chen, K. T. (2010). An Effective Clustering Approach to Stock Market Prediction. In PACIS (p. 54).
http
://jic
t.uum
.edu
.my
Journal of ICT, 15, No. 2 (December) 2016, pp: 63–84
82
Min, S. H., Lee, J., & Han, I. (2006). Hybrid genetic algorithms and support vector machines for bankruptcy prediction. Expert systems with applications, 31(3), 652-660.
Nambiar, H. (2010). India auto boom to boost tyre output 25 pct. Retrieved from http://in.reuters.com/article/2010/10/11/idINIndia-52111320101011.
Nanda, S. R., Mahanty, B., & Tiwari, M. K. (2010). Clustering Indian stock market data for portfolio management. Expert Systems with Applications, 37(12), 8793-8798.
Ng, K. H, Ho, C. K, & Phon-Amnuaisuk, S (2012). A Hybrid Distance Measure for Clustering Expressed Sequence Tags Originating from the Same Gene Family. PLoS ONE 7(10): e47216. doi:10.1371/journal.pone.0047216
Ng, K. H., Phon-Amnuaisuk, S., & Ho, C. K. (2010). Clustering of Expressed Sequence Tag Using Global and Local Features: A Performance Study. In Intelligent Automation and Computer Engineering (pp. 401-414). Springer Netherlands.
Ngai, E. W. T., Hu, Y., Wong, Y. H., Chen, Y., & Sun, X. (2011). The application of data mining techniques in financial fraud detection: A classification framework and an academic review of literature. Decision Support Systems, 50(3), 559-569.
Ordonez, C., & Cereghini, P. (2000, May). SQLEM: Fast clustering in SQL using the EM algorithm. In ACM SIGMOD Record (Vol. 29, No. 2, pp. 559-570). ACM.
Ou, P., & Wang, H. (2009). Prediction of stock market index movement by ten data mining techniques. Modern Applied Science, 3(12), p28.
Pearce, D. K. (1984). An empirical analysis of expected stock price movements. Journal of Money, Credit and Banking, 317-327.
Shamsuddin, S. M., Zainal, A., & Mohd Yusof, N. (2008). Multilevel kohonen network learning for clustering problems. Journal of ICT, 7, 1-25.
Sim, K., Liu, G., Gopalkrishnan, V., & Li, J. (2011). A case study on financial ratios via cross-graph quasi-bicliques. Information Sciences, 181(1), 201-216.
http
://jic
t.uum
.edu
.my
83
Journal of ICT, 15, No. 2 (December) 2016, pp: 63–84
Sulaiman, F., Abdullah, N., Gerhauser, H., & Shariff, A. (2011). An outlook of Malaysian energy, oil palm industry and its utilization of wastes as useful resources. Biomass and bioenergy, 35(9), 3775-3786.
Tan, C. S., Yong, C. K., & Tay, Y. H. (2012, October). Modeling financial ratios of Malaysian plantation stocks using Bayesian Networks. In Sustainable Utilization and Development in Engineering and Technology (STUDENT) (pp. 7-12). IEEE.
Whitley, E., & Ball, J. (2002). Statistics review 1: Presenting and summarising data. Critical Care, 6(1), 66.
Yoon, Y., & Swales, G. (1991). Predicting stock price performance: A neural network approach. In System Sciences, 1991. Proceedings of the Twenty-Fourth Annual Hawaii International Conference (Vol. 4, pp. 156-162). IEEE.
Zhang, Y., & Wu, L. (2009). Stock market prediction of S&P 500 via combination of improved BCO approach and BP neural network. Expert systems with applications, 36(5), 8849-8854.
http
://jic
t.uum
.edu
.my
Journal of ICT, 15, No. 2 (December) 2016, pp: 63–84
84
APPENDIX: Visualising the Data Dispersion of Six Financial Ratios using Box Plots
21
APPENDIX: Visualising the Data Dispersion of Six Financial Ratios using Box Plots
http
://jic
t.uum
.edu
.my