Embed Size (px)
Citation preview
warwick.ac.uk/lib-publications
Original citation: Sorokowska, Agnieszka, Sorokowski, Piotr, Hilpert, Peter, Cantarero, Katarzyna, Frackowiak, Tomasz, Ahmadi, Khodabakhsh, Alghraibeh, Ahmad M., Aryeetey, Richmond, Bertoni, Anna, Bettache, Karim et al. (2017) Preferred interpersonal distances : a global comparison. Journal of Cross-Cultural Psychology, 48 (4). pp. 577-592.doi:10.1177/0022022117698039 Permanent WRAP URL: http://wrap.warwick.ac.uk/100226 Copyright and reuse: The Warwick Research Archive Portal (WRAP) makes this work by researchers of the University of Warwick available open access under the following conditions. Copyright © and all moral rights to the version of the paper presented here belong to the individual author(s) and/or other copyright owners. To the extent reasonable and practicable the material made available in WRAP has been checked for eligibility before being made available. Copies of full items can be used for personal research or study, educational, or not-for profit purposes without prior permission or charge. Provided that the authors, title and full bibliographic details are credited, a hyperlink and/or URL is given for the original metadata page and the content is not changed in any way. Publisher’s statement: Sorokowska, Agnieszka, Sorokowski, Piotr, Hilpert, Peter, Cantarero, Katarzyna, Frackowiak, Tomasz, Ahmadi, Khodabakhsh, Alghraibeh, Ahmad M., Aryeetey, Richmond, Bertoni, Anna, Bettache, Karim et al. (2017) Preferred interpersonal distances : a global comparison. Journal of Cross-Cultural Psychology, 48 (4). pp. 577-592.doi:10.1177/0022022117698039 Copyright © 2017 The Authors Reprinted by permission of SAGE Publications. Published version: http://dx.doi.org/10.1177/0022022117698039 A note on versions: The version presented here may differ from the published version or, version of record, if you wish to cite this item you are advised to consult the publisher’s version. Please see the ‘permanent WRAP url’ above for details on accessing the published version and note that access may require a subscription. For more information, please contact the WRAP Team at: [email protected]
Preferred interpersonal distance: a global comparative analysis
Corresponding author:
Agnieszka Sorokowska
Smell & Taste Clinic, Department of Otorhinolaryngology, TU Dresden, Fetscherstrasse 74, 01307 Dresden, Germany
Institute of Psychology, University of Wroclaw, ul. Dawida 1, 50-527 Wroclaw, Poland
Email: [email protected];
+48691800047
List of authors:
Author
First (given) name
Last (Family) name Institution email Country
1 Agnieszka Sorokowska TU Dresden; Uniwersytet Wroclawski [email protected] Poland
2 Piotr Sorokowski University of Wroclaw [email protected] Poland
3 Peter Hilpert University of Washington [email protected] USA
4 Katarzyna Cantarero SWPS University of Social Sciences and Humanities, Faculty in Sopot
[email protected] Poland
5 Tomasz Frackowiak University of Wroclaw [email protected]
Poland
6 Khodabakhsh Ahmadi Baqiyatallah University of Medical Sciences Kh_Ahmady@
yahoo.com Iran
7 Ahmad M. Alghraibeh King Saud University [email protected]
Saudi Arabia
8 Richmond Aryeetey University of Ghana [email protected] Ghana
9 Anna Bertoni Catholic University of Milan [email protected] Italy
10 Karim Bettache The Chinese University of Hong Kong [email protected]
Hong Kong
11 Sheyla Blumen Pontificia Universidad Católica Del Perú [email protected] Peru
12 Marta Błażejewska University of Wroclaw [email protected] Poland
13 Tiago Bortolini
Graduate Program in Morphological Sciences, Federal University of Rio de Janeiro; Cognitive and Behavioral Neuroscience Unit, D’Or Institute for Research and Education
[email protected] Brazil
14 Marina Butovskaya Institute of Ethnology and Anthropology; Moscow State University
Russia
15 Felipe Nalon Castro Federal University of Rio Grande do Norte castrofn@gmai
l.com Brazil
16 Hakan Cetinkaya Ankara University cetinkayah@an Turkey
kara.edu.tr
17 Diana Cunha University of Coimbra [email protected] Portugal
18 Daniel David Babes-Bolyai University Cluj-Napoca [email protected]
Romania
19 Oana A. David Babes-Bolyai University Cluj-Napoca [email protected]
Romania
20 Fahd A. Dileym King Saud University [email protected]
Saudi Arabia
21 Alejandra del Carmen
Domínguez Espinosa Universidad Iberoamericana
Mexico
22 Silvia Donato Catholic University of Milan [email protected] Italy
23 Daria Dronova Russian Academy of Sciences [email protected] Russia
24 Seda Dural Izmir University of Economics [email protected]
Turkey
25 Jitka Fialová Faculty of Science, Charles University [email protected]
Czech Republic
26 Maryanne Fisher Saint Mary’s University [email protected] Canada
27 Evrim Gulbetekin Akdeniz University [email protected] Turkey
28 Aslıhan Hamamcıoğlu Akkaya
Cumhuriyet University Faculty of Literature, Department of Anthropology, SIvas
Turkey
29 Ivana Hromatko University of Zagreb, Faculty of Humanities and Social Sciences
[email protected] Croatia
30 Raffaella Iafrate Catholic University of Milan [email protected] Italy
31 Mariana Iesyp Ivan Franko National University of Lviv [email protected] Ukraine
32 Bawo James Federal Neuro-Psychiatric Hospital, Benin-City [email protected] Nigeria
33 Jelena Jaranovic Belgrade University [email protected] Serbia
34 Feng Jiang Central University of Finance and Economics [email protected] China
35 Charles Obadiah Kimamo University of Nairobi conkimamo@y
ahoo.com Kenya
36 Grete Kjelvik The Nord-Trøndelag Health Study (HUNT) [email protected] Norway
37 Fırat Koç Cumhuriyet University [email protected] Turkey
38 Amos Laar University of Ghana [email protected] Ghana
39 Fívia de Araújo Lopes Federal University of Rio Grande do Norte fivialopes@gm
ail.com Brazil
40 Guillermo Macbeth National University of Entre Rios [email protected]
Argentina
41 Nicole M. Marcano Philadelphia University [email protected] USA
42 Rocio Martinez University of Granada [email protected] Spain
43 Norbert Mesko University of Pécs [email protected] Hungary
44 Natalya Molodovska University of Wroclaw natalipol.kz@ Poland

ya mail.ru
45 Khadijeh Moradi Razi University [email protected] Iran
46 Zahrasadat Motahari University of Science & Culture [email protected] Iran
47 Alexandra Mühlhauser University of Vienna [email protected]
Austria
48 Jean Carlos Natividade Pontifical Catholic University of Rio de Janeiro [email protected] Brazil
49 Joseph Ntayi Makerere University Business School [email protected] Uganda
50 Elisabeth Oberzaucher University of Vienna [email protected]
Austria
51 Oluyinka Ojedokun Department of Pure & Applied Psychology, Adekunle Ajasin University
Nigeria
52 Mohd Sofian Bin Omar-Fauzee Universiti Utara Malaysia, School of Educational
Studies and Modern Languages [email protected]
Malaysia
53 Ike E. Onyishi University of Nigeria [email protected] Nigeria
54 Anna Paluszak University of Wroclaw [email protected] Poland
55 Alda Portugal University of Coimbra [email protected] Portugal
56 Eugenia Razumiejczyk National University of Entre Rios eugeniaraz@ho
tmail.com Argentina
57 Anu Realo University of Warwick; University of Tartu [email protected] Estonia
58 Ana Paula Relvas University of Coimbra [email protected] Portugal
59 Maria Rivas Universidad del Magdalena [email protected]
Colombia
60 Muhammad Rizwan University of Karachi muhammad29p
[email protected] Pakistan
61 Svjetlana Salkičević University of Zagreb, Faculty of Humanities and Social Sciences
[email protected] Croatia
62 Ivan Sarmány-Schuller Constantine the Philosopher University in Nitra expssarm@sav
ba.sk Slovakia
63 Susanne Schmehl University of Vienna [email protected]
Austria
64 Oksana Senyk Ivan Franko National University of Lviv [email protected] Ukraine
65 Charlotte Sinding Department of Otorhinolaryngology, TU Dresden [email protected] France
66 Eftychia Stamkou University of Amsterdam [email protected]
The Netherlands
67 Stanislava Stoyanova South-West University “Neofit Rilski” [email protected] Bulgaria
68 Denisa Šukolová Matej Bel University in Banská Bystrica [email protected] Slovakia
69 Nina Sutresna Universitas Pendidikan Indonesia [email protected]
Indonesia
70 Meri Tadinac University of Zagreb, Faculty of Humanities and Social Sciences
[email protected] Croatia
71 Andero Teras Mõttemaru OÜ anderoteras@g Estonia
mail.com
72 Edna Lúcia Tinoco Ponciano University of the State of Rio de Janeiro ednaponciano
@uol.com.br Brazil
73 Ritu Tripathi Indian Institute of Management Bangalore [email protected] India
74 Nachiketa Tripathi Indian Institute of Technology Guwahati [email protected] India
75 Mamta Tripathi Indian Institute of Technology Guwahati [email protected] India
76 Olja Uhryn Lviv State University of Internal Affairs [email protected] Ukraine
77 Maria Emília Yamamoto Federal University of Rio Grande do Norte emiliayamamot
[email protected] Brazil
78 Gyesook Yoo Kyung Hee University [email protected]
South Korea
79 John D. Pierce, Jr. Philadelphia University [email protected] USA
Acknowledgements
We would like to thank Chinwe Frances Inogbo, Regina Cejudo de la Sierra, Maria Fernanda Morales Perez,
Barbara Baranyai, Adrienn Bálint, Gabriella Kuch, Tímea Kiss, Emese Kozma, Margaréta Nagy, Zsófia
Magyar, and Éva Virág for their help with data collection; we would also like to thank prof. Corey L.
Fincher and prof. Randy Thornhill for kindly permitting us to use their data on parasite stress.
Preferred interpersonal distances across the globe
1
Preferred Interpersonal Distances: A Global Comparison
Preferred interpersonal distances across the globe
2
Abstract
Human spatial behavior has been the focus of hundreds of previous research studies.
However, the conclusions and generalizability of previous studies on interpersonal distance
preferences were limited by some important methodological and sampling issues. The
objective of the present study was to compare preferred interpersonal distances across the
world and to overcome the problems observed in previous studies. We present an extensive
analysis of interpersonal distances over a large data set (N = 8,943 participants from 42
countries). We attempted to relate the preferred social, personal and intimate distances
observed in each country to a set of individual characteristics of the participants, and some
attributes of their cultures. Our study indicates that individual characteristics (age and gender)
influence interpersonal space preferences and that some variation in results can be explained
by temperature in a given region. We also present objective values of preferred interpersonal
distances in different regions, which might be used as a reference datapoint in future studies.
Keywords: interpersonal distance; spatial behavior; culture; cultural psychology
Preferred interpersonal distances across the globe
3
Introduction
Interpersonal space, or interpersonal distance, is an essential feature of individuals’ social
behavior in relation to their physical environment and social interactions (Hall, 1966; Hayduk,
1983). It is a distance we maintain in interpersonal interactions, or in other words, “breathing
space”, an abstract area that surrounds each individual (Hall, 1966; Madanipour, 2003;
Sommer, 1969); comparable to either a shell, a soap bubble, or aura (Sommer, 1969).
According to Hall (1966), this space helps regulate intimacy in social situations by controlling
sensory exposure. The possibility of increased visual, tactile, auditory, and olfactory
stimulation is enhanced at closer distances, and people may feel intruded and react negatively
when others adopt and maintain too close of an interpersonal distance (Felipe & Sommer,
1966; Hall, 1966; Mazur, 1977; Sawada, 2003; Smith, 1981; Sommer, 1969).
Classifying social distance
The classical proxemic theory (Hall, 1966) classifies interpersonal distance into four
categories, each of which reflects a different relationship between individuals (Baldassare &
Feller, 1975). These four types of distance are (1) public distance (above 210 cm; in this
distance voice shifts to higher volumes, and eye contact is minimized); (2) social distance,
maintained during more formal interactions (122-210 cm, this distance precludes all but visual
and auditory stimuli); (3) personal distance, maintained during interactions with friends
(about 46 to 122 cm, vision is no longer blurred, vocalizations increase), and (4) intimate
distance, maintained in close relationships (from 0 to 46 cm, this distance is characterized by
poor and blurred vision, and increased perception of heat and olfactory stimuli) (Hall, 1966).
Based on Hall’s theory (1966), the interpersonal distance people choose while
interacting with others depends on the personal attitude towards another person, but also on
certain characteristics of dyads, like their gender or age, and the social environment where the
interaction takes place. Indeed, studies confirm that the preferred interpersonal distance might
Preferred interpersonal distances across the globe
4
be influenced by gender (Aiello, 1987; Horenstein & Downey 2003; Ozdemir, 2008;
Patterson & Edinger, 1987; Smith, 1981; Vranic, 2003). Furthermore, age seems to be an
important factor for predicting dyad distances (Aiello, 1987; Burgess, 1983; Gérin-Lajoie,
Richards, & McFadyen, 2006; Ozdemir, 2008; Rapp & Gutzmann, 2000; Webb & Weber,
2003); younger people generally prefer closer interpersonal distances than older individuals.
According to Hall’s theory (1966), cultural norms are the most important factors to
describe the preferred social distance. Hall (1966) stated that what is intimate in one culture
may be personal or social in another, and suggested that there are specific customs regarding
the spatial behavior. He grouped the cultures into two different classes: contact and
noncontact cultures. Contact cultures use closer interpersonal distances and engage in more
touching, whereas people noncontact cultures exhibit opposite preferences and behaviors
(Hall, 1966). The general rule of grouping suggested by Hall (1966) was the geographic
location, with Southern European, Latin American, and Arabian countries being the so-called
contact cultures, and North America, Northern Europe and Asian populations – the
noncontact cultures (Hall, 1966). Although Hall’s theory was frequently supported just by
anecdotal evidence (see: Baldassare & Feller, 1975), this notion constituted a basis for
classical research on the cultural effects on human spatial behaviors. Below, we present a
short overview of the previous findings and conclude with proposing some variables that
could possibly account for previously observed variability.
Cultural Differences
Early cross-cultural research on spatial behaviors indicates that contact and noncontact groups
differ significantly in preferred social distance. Studies show that Mediterranean societies
prefer closer interactive distances than northern European and northern American societies
(Evans & Howard, 1973; Ford & Graves, 1977; Hayduk, 1983; Little, 1968; Triandis &
Triandis, 1967; Watson & Graves, 1966). Notably, many of these early cross-cultural studies
Preferred interpersonal distances across the globe
5
were performed in the USA with foreign and native students as participants (Baldassare &
Feller, 1975). Although some results were later confirmed (Beaulieu, 2004; Evans, Lepore, &
Allen, 2000; Remland, Jones, & Brinkman, 1995; Sommer, 2002), other empirical findings do
not fully support the notion that interpersonal distances are closer in Southern European, Latin
American, and Arab countries than in North America, Northern Europe and Asian populations
(Forston & Larson, 1968; Mazur, 1977; Remland, Jones, & Brinkman, 1995). The original
classification of Asian societies as predominantly noncontact is also problematic given the
mixed results of previous studies (Beaulieu, 2004; Sussman & Rosenfeld, 1982; Watson,
1970). Further, the spacing preferences in African countries have never been examined.
While showing variability of interpersonal distancing across cultures, previous results
lack explanations as to why this variability occurs. It is an open question if the division of
cultures onto contact/noncontact based on geographical location is a detailed enough
grouping rule for all populations across the globe, especially given that contact norms can
vary widely across countries within the same continent even though they share cultural
similarities (Shuter, 1976). It is likely that what has been explained in terms of vaguely
defined cultural norms is underpinned by some psychological and ecological variables. Thus,
we consider here several new variables that could be enumerated as distinguishing the
countries that were previously found to be contact and noncontact – environmental factors
(temperature of the inhabited region, parasite stress in a given country, and population growth
rate) and socio-psychological factors (collectivism/individualism level, and wealth of the
society, defined as Human Development Index). We briefly justify our choices below.
Environmental factors. In the group of environmental factors, temperature may
likely be related to the differences in cultural patterns of social proximity, as it was found to
influence social distances during shorter interactions (IJzerman & Semin, 2010; Williams &
Bargh, 2008; Zhong & Leonardelli, 2008). Hotter climate affects emotional intensity
Preferred interpersonal distances across the globe
6
(Sorokowski et al., 2013), which is likely related to intense and closer interpersonal contacts.
Importantly, the hypothesized relationship of distance preferences and temperature might be
associated with Hall’s theory (1966), as countries classified previously as contact cultures
were also at the same time rather warm (see: Sommer, 2002).
However, increased temperatures result in increased parasite stress. This relationship
offers an alternative, competing hypothesis on temperature-distance association that would
include the indirect effect temperature has on interpersonal distance. Many diseases can
spread by a simple touch (Schweon, Edmonds, Kirk, Rowland, & Acosta, 2013), and a recent
study showed that people were able to detect some infection cues in the body odor of others –
this early innate immune response altered the pleasantness of body odor samples (Olsson et
al., 2014). Reduction of interpersonal contacts or increasing the interpersonal distance has for
centuries been a part of behavioral adaptation against epidemics (Fenichel, 2013), and in
regions that have historically suffered from high levels of infectious diseases, people are
indeed less extraverted and open (Schaller & Murray, 2008). Interpersonal distancing pattern
might be thus another important factor in pathogen avoidance, since maintaining farther
distance can decrease potential contamination risk. As regions of higher temperature typically
suffer from higher parasite stress than regions of lower temperature, the increased parasite
stress might indirectly lead to higher interpersonal distances in cultures of warmer climate.
Further, maintaining too close interpersonal distance may result in increased arousal
(Epstein & Karlin, 1975) and various forms of aggression and violence (see: Regoeczi, 2008,
for a review). It is therefore not surprising that social crowding produces avoidant response –
this might be a way of avoiding conflicts (Worchel & Teddlie, 1976). Therefore, people from
countries of rapidly increasing number of inhabitants might be more likely to prefer farther
interpersonal distances, thus reducing the risk for potential conflicts. Withdrawal response in
Preferred interpersonal distances across the globe
7
such situations might be of particular importance in regions of higher temperature, since heat
might increase aggression (Anderson, 1987) and social unrest (Yeeles, 2015).
Socio-psychological factors. In the group of social-psychological factors, regions
characterized by closer interpersonal distances were rather poorer than regions characterized
by farther preferred distances. The putative relationship of this variable to interpersonal
distance is further suggested by the recent finding that the Human Development Index (HDI)
was related to the level of social trust in a country (Özcan & Bjørnskov, 2011). We tested this
observation by including HDI as one of the grouping variables in our study. Also,
interpersonal distance might increase when interacting dyads differ in social status (Aiello &
Jones, 1971; Dean, Willis & Hewitt, 1975; Little, 1968). Possibly, in countries characterized
with higher social inequality (i.e., lower HDI) the preferred distances might be greater.
Further, the Individualism-Collectivism dimension (IC), first defined by Hofstede
(1981), is one of the most important constructs used for the classification of cultures. People
from collectivistic cultures rely to a considerable degree on close intra-group relationships,
whereas people from individualistic cultures are highly independent and have strong feelings
of autonomy within the group (Hofstede, 2001). In the present study, a 178-nation index of
collectivism called ingroup favoritism from Van de Vliert (2011) study was utilized. Contrary
to Hofstede’s (2001) index, Van de Vliert index includes data on almost all countries around
the world, which enabled us to analyze all the regions participating in our research.
Conclusions
In all, there is compelling evidence of cross-cultural variations in proxemic behaviors. Such
differences might be underpinned by cultural norms, but at the same time these norms could
be associated with certain psychological and ecological variables. To replace previous
speculations with solid empirical evidence, in the present study we examined interpersonal
distance preferences of 8,943 people inhabiting 53 study sites (42 countries) across the globe
Preferred interpersonal distances across the globe
8
and across different social contexts. Given the exploratory nature of our empirical
investigation, we are aware that at this stage of research we cannot yet explain the exact
mechanisms of influence of these variables on interpersonal distance preferences (although in
the Discussion section we speculate about the nature of relationship between the distance
preferences and their significant predictors).
Hypotheses
Based on the prior assumption that people from different cultures differ in interpersonal
distance preferences in different social contexts (social, personal and intimate; Hall, 1966), we
hypothesize significant variability in preferred interpersonal distances across countries when
approaching a stranger (i.e., social distance), an acquaintance (i.e., personal distance) or a
close person (i.e., intimate distance). Second, consistent with numerous previous studies, we
hypothesize that certain characteristics of interacting individuals, like gender or age, influence
the preferences they have for interpersonal distance, with women and younger people
maintaining closer interpersonal distances. Third, we assume that cultural differences in
interpersonal distancing are to some degree universally related to environmental and socio-
psychological factors. Based on earlier research and our assumptions, we hypothesize that
some environmental and psychological factors could predict variability of interpersonal
distance across countries. Lower population growth rate, higher ingroup favoritism and higher
HDI should be associated with closer interpersonal distance preferences. Further, closer
interpersonal distances should be observed in cultures of higher temperature, but it needs to be
remembered that higher temperature increments parasite stress. Thus, two competing
hypotheses might be presented regarding the temperature and distance preferences. If the
effect of temperature on personal distance preferences is direct, closer interpersonal distances
should be observed in cultures of higher annual average temperature. If the effect of
temperature is indirect, we expect the opposite association.
Preferred interpersonal distances across the globe
9
Materials and methods
Participants
Our study was comprised of 8,943 participants (4,013 men, 4,887 women and 43
unidentifieds) inhabiting 53 study sites in 42 countries. All participants provided informed
consent prior to their inclusion in the study. In every country, authors recruited the
participants personally. We intended to conduct our study among community members, and
not students, with as diverse a sample of inhabitants as possible for each study site. Therefore,
participants were recruited through advertisements, personal contacts, in shopping malls, etc.;
the recruitment methods were very similar across all study sites. All participants were
specifically recruited for this study, and the study was conducted during the same time across
all locations. The participants were ensured anonymity of their responses. Demographic
characteristics of the samples, as well as a list of all study sites, are presented in Table 1.
[Table 1]
Procedure
Participants completed a questionnaire consisting of demographic questions (age, sex) and
three graphic questions concerning their preferred interpersonal distance. Based on the
classical Halls’s theory (1966), we measured three separate categories of preferred
interpersonal distances – distance to (1) a stranger, (2) an acquaintance and (3) a close person.
These measures reflected the previously defined categories of interpersonal distance: (1)
social distance; (2) personal distance; and (3) intimate distance (Hall, 1966), respectively.
In order to conduct cross-cultural comparisons, the questions asked needed to be easily
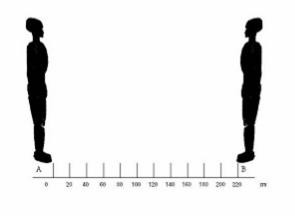
understood by participants all over the world (the task could not be demanding or ambiguous).
Thus, we decided to use a simple, graphic task, because it was mostly language independent
(see Fig. 1). Answers were given on a distance (0-220 cm) scale anchored by two human-like
figures, labelled A for the left one and B for the right one (Fig. 1). Participants were asked to
Preferred interpersonal distances across the globe
10
imagine that he/she is Person A. The participant was asked to rate how close a Person B could
approach, so that he/she would feel comfortable in a conversation with Person B. The
participants marked the distance at which Person B should stop on the scale below the figures.
Details on the applied method can be found in Supplementary File 1. In every country, the
participants completed paper-and-pencil questionnaires individually.
[Figure 1]
In addition to participants’ report on gender and age, we analyzed country specific
environmental and socio-psychological factors: Zoontic and nonzoontic parasite stress in a
given region (Fincher & Thornhill, 2012), population growth rate (United Nations report),
ingroup favoritism (Van de Vliert, 2011), average, yearly temperature in a given study site
(provided by coauthors from given study sites), and the Human Development Index (HDI;
Human Development Report 2013; http://hdr.undp.org).
Statistical Analyses
Our hypotheses focused on the general assumption that people across different cultures
universally vary in the distances they prefer when interacting with others. The presented
analyses aimed to explain the cultural similarities and variability. In the current sample,
participants were nested within countries and, therefore, we used multilevel modeling
(Raudenbush & Bryk, 2002). In order to test the first hypothesis about variability in
interpersonal distance across cultures, we used a stepwise approach. First, we computed three
null models for social, personal, and intimate interpersonal distance, respectively (see
supplementary File 1 for details of the models). To test significant differences of interpersonal
distance across countries, we used a graphical method developed by Goldstein and Healy
(1995), which allows comparing large groups of means simultaneously (see supplementary
Preferred interpersonal distances across the globe
11
File 1 for details of the method). Significant difference is suggested when the confidence
intervals of two countries do not overlap.
To test our second hypothesis of predicting the variability in interpersonal distance
across countries, we computed three models (for social distance, personal distance, and
intimate distance) including all predictors discussed in the Introduction in the three multilevel
models (see supplementary File 1 for details of the models).
We used SPSS 19 for descriptive statistics. For multilevel modeling, we used the lme4
package (Bates, Maechler, Bolker, & Walker, 2014) in R Version 3.0.2 (R Core Team, 2014).
To find the best fitting model, we followed Zuur and colleagues (Zuur et al., 2009) suggestion
to compare the inclusion of different random and fixed effects by deviance tests.
Results
Supplementary Table S1 shows means and standard deviations of each type of interpersonal
distance for each sample. Overall, average interpersonal distance differed across various types
of distance (social distance, personal distance, intimate distance; Msocial = 135.1 cm; Mpersonal
= 91.7 cm; Mintimate = 31.9 cm), supporting prior findings.
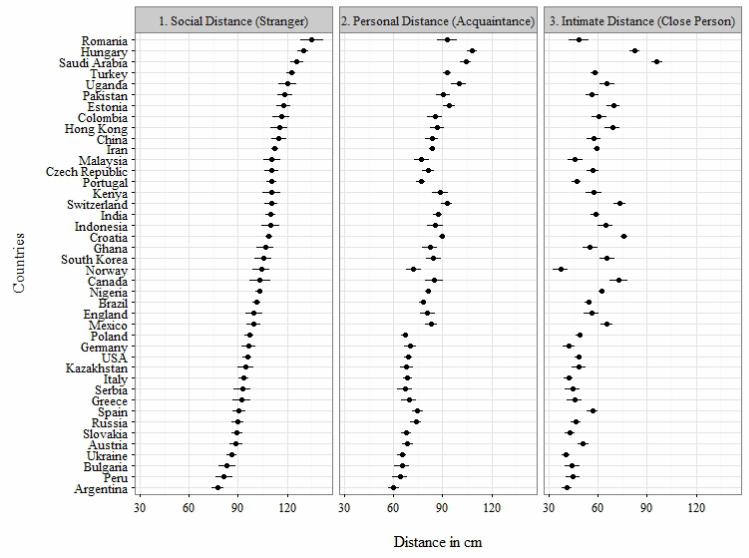
Variability of Interpersonal Distance across Countries
We hypothesized that people differ in their preferred interpersonal distance across countries.
Figure 2 shows the results of the graphical mean comparison across all 42 countries for
interpersonal distance with strangers, acquaintances, and partner (i.e., social distance,
personal distance, intimate distance). Inspecting the mean comparions in Figure 2 shows
significant variability in interpersonal distance across countries for different social
interactions, supporting Hypothesis 1. In addition, as means for social distance are rank
ordered, the order for personal and intimate distances provides insights in distance preferences
pattern in relation to distance with strangers. The order for preferred personal distance
Preferred interpersonal distances across the globe
12
indicates that the variability of this distance is in similar rank, whereas the social distance in a
country is less predictive for the preferred intimate distance. This result is additionally
confirmed by the inter-correlations between certain distance types. Pearsons r correlations
showed high correlations of social and personal distance (r = .69) and personal and intimate
distance (r = .70); the correlation between social and intimate distance was significant as well
(r = .38), but not equally high as in the other cases.
[Figure 2]
Factors Predicting Variability in Interpersonal Distance across Countries
We assumed certain environmental and psychological predictors of interpersonal distance
across countries. Results of the three multilevel models are shown in Table 2.
[Table 2]
We found that the variability of social distance across cultures was predicted by
temperature (β1 = -.82; p = .01) and gender (β8 = 3.67; p = .04). The higher the annual
temperature of a country was, the closer was the preferred distance to strangers. Further,
women on average preferred to maintain greater distance with strangers. The result for
personal distance show that age (β7 = .08; p = .01) and gender (β8 = 2.65; p = .03) predicted
the variability, suggesting that older people preferred greater distance and, again, women
preferred greater distance with acquaintances. Finally, the results show that the intimate
distance is predicted by age (β7 = .08; p = .02) and temperature (β1 = 1.27; p < .001). This
indicates that older people preferred greater physical distance to people they considered close,
whereas the effect of temperature was reversed in comparison with interpersonal distance
with strangers – the higher the annual temperature of a country, the greater was the preferred

Preferred interpersonal distances across the globe
13
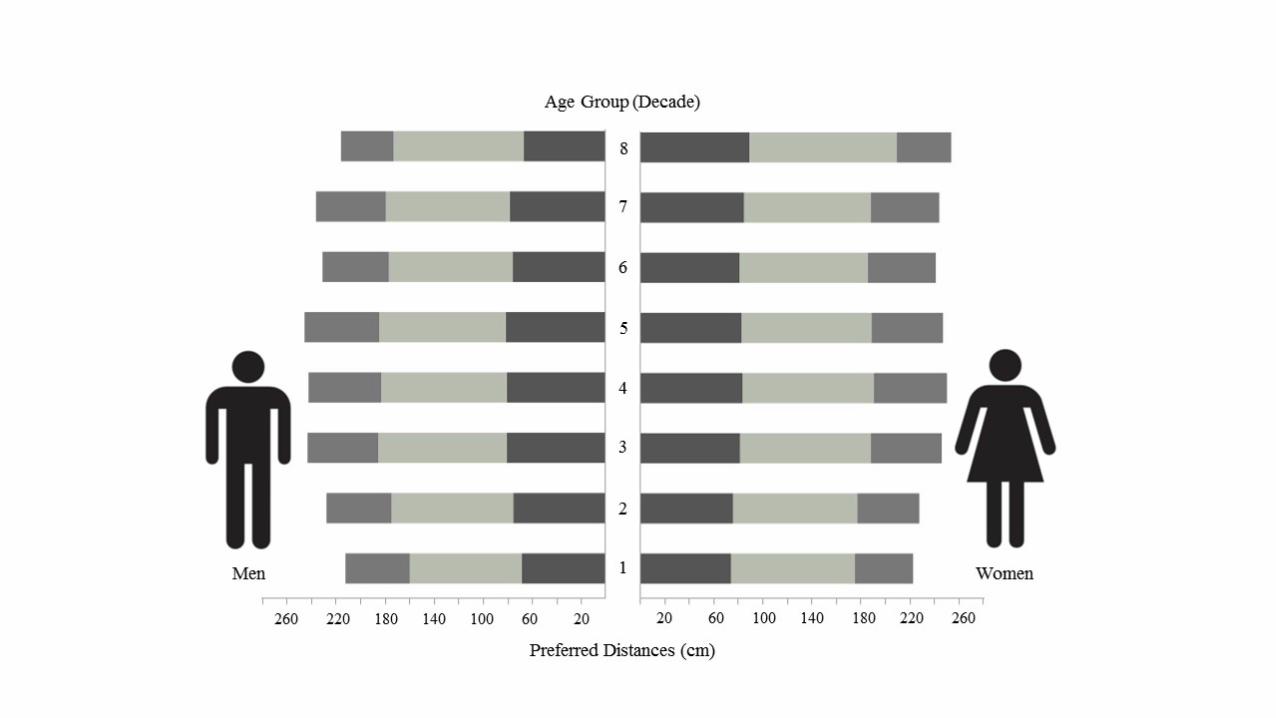
personal distance to a close person. Figure 3 illustrates the three types of preferred distances
with regard to participants’ gender and age.
[Figure 3]
Discussion
Owing to the quality and quantity of the data collected so far on the topic of cultural
differences in proxemic behaviors, it was necessary and desirable to update the questionnaires
and variables measured in order to erase the bias observed in previous studies. We present
here an analysis of interpersonal distance preferences over a large data set (8,943 participants
from 42 countries). As hypothesized, we observed significant variability in social, personal
and intimate distances across countries. Variability in preferred social distance was predicted
by participants’ gender and county’s average temperature, indicating that women and people
in colder countries prefer greater distance toward strangers. Furthermore, the variability of
preferred personal distance was predicted by participants’ age and gender; older people and
women prefer greater distance to an acquaintance. Finally, variability of intimate distance was
explained by age and temperature, indicating that older people and people in warmer
countries prefer greater distance with people they consider close.
Compared with previous studies, the present design had six distinctive features: (a) our
study involved a large-scale analysis among thousands of people; (b) all the participants
answered the same questionnaire illustrated with graphic representation of interpersonal
distance; (c) all the participants took part in the study in the same year (2013); (d) samples of
populations were heterogenous in terms of age, sex and professions; (e) we considered five
different regions of the world, also Africa, which was not included from previous analyses; (f)
and we examined several environmental and socio-psychological variables that possibly could
explain the variability in social distance. We also present up-to-date values of three categories
Preferred interpersonal distances across the globe
14
of preferred interpersonal distances in different regions, which might be used as a reference
datapoint in future studies. This dataset is especially important given that cross-cultural
comparison studies are becoming more popular in social sciences.
Cultural differences in proxemic behaviors
Among environmental factors, our results regarding temperature are consistent with findings
showing that climatic demands interact with wealth resources in influencing a variety of
cultural tendencies (Fischer & Van de Vliert, 2011; Van de Vliert, 2013, Van de Vliert et al.,
1999). However, we observed a meaningful association between distance preferences and
mean temperature, without distinguishing between demanding winter cold and demanding
summer heat. Thus, our results and previous research (Van de Vliert et al., 1999) suggest that
the unipolar, mean temperature might be a reasonable predictor of some psychological
variables that could be used instead, or in addition to, the climatic demand variable (Fischer &
Van de Vliert, 2011; Van de Vliert, 2013), depending on the hypotheses and study aims.
It is worth noticing that in our study the direction of temperature effect differed for
social and intimate distance. In warmer countries, people preferred to maintain closer
distances towards strangers – but farther towards the intimate partners. The result regarding
closer distance in hotter climates is consistent with the literature. IJzerman and Semin (2010)
showed that compared with colder conditions, warmer conditions induced greater social
proximity; even within the United States people in warm latitudes were shown to exhibit a
closer contact behavior with more touch than their counterparts in colder climates (Andersen,
1988). IJzerman and Semin (2010) explained their findings in the context of Lakoff and
Johnson's (1999) embodied realism, i.e., grounding the abstract idea (in this case – warmer
feelings) in the physical situation (warmer temperature). Relatedly, other studies showed that
social exclusion induces perceptions of lower temperature (Zhong & Leonardelli, 2008), and
physical proximity of other people induce perceptions of higher temperature (IJzerman &
Preferred interpersonal distances across the globe
15
Semin, 2010). However, in the case of intimate distance, the result of our study differed from
those obtained previously. Perhaps, this outcome resulted from specificity of distancing
preferences in colder (and not in hotter) countries. Although both heat and cold are
demanding environmental conditions (Fischer & Van de Vliert, 2011), it is possible that some
negative effects of colder climate can be alleviated through closer intimate distances. Another
explanation could be that although the increased temperatures might directly lead to smaller
social distances, augmented parasite prevalence in hotter climates might also indirectly affect
distance preferences in close relationships by increased risk of certain infections.
Overall, we found no direct effect of cultural-level parasitic stress (zoontic and
nonzoontic parasite stress; Fincher & Thornhill, 2012), which seems particularly interesting,
given that evolved disease-avoidance mechanisms and contemporary social cognition are
indeed related (Faulkner, Schaller, Park, & Duncan, 2004). Therefore, perhaps other health-
related variables would provide a better fit to our model, like e.g., prevalence of different
infectious diseases. Also, the parasitic threat could play a more important role in real dyad
behavior while being unrelated to preferences. Finally, as discussed above, it is probable that
parasitic diseases would be good predictors of interpersonal distances as long as the strong,
direct impact of temperatures was excluded. This hypothesis consistent with previous
research, showing that interactive impacts of climatic demands and income resources alleviate
any effects parasitic stress might have on culture (Van de Vliert & Postmes, 2012).
In the group of socio-psychological factors, significant fixed effects revealed gender
differences in preferred social and personal distance, with women generally preferring greater
distances. However, the random effects showed in more detail that gender effect was
especially pronounced in Switzerland, Malaysia, Saudi Arabia, Hong Kong, Brazil, Austria,
and India for social distance, and Switzerland, Malaysia, China, Saudi Arabia, Brazil, Poland,
and Nigeria for personal distance. As our study is a preliminary exploration of possible, cross-
Preferred interpersonal distances across the globe
16
cultural determinants of preferred distances, it is hard to present any definite explanations of
such findings. Generally, enforcing closer proximinity during dyad interactions conveys
higher dominance (Burgoon, 1991). Dominance is typically related to male psychological
characteristics, and behaviors consistent such stereotype might be especially strong in some
cultures. In addition, women in some cultures can be more sensitive to social situations and
avoid dominant “invasions” of personal space of people they are not highly familiar with.
This explanation would be consistent with the notion that the interpersonal distance people
choose depends also on the degree of understanding of a social situation, i.e., familiarity with
social norms (Bogardus, 1954). Also, our findings might be partially due to the methodology
used in our study – we did not specify the sex of an approaching individual, and it is possible
that interaction distances might differ depending on the assumed sex of interlocutor.
Still, it needs to be remembered that higher distances preferred by women are
inconsistent with most previous studies (Aiello, 1987; Horenstein & Downey 2003; Ozdemir,
2008; Patterson & Edinger, 1987; Smith, 1981; Vranic, 2003), suggesting that women rather
prefer closer interpersonal distances than men (but see Heshka & Nelson, 1972). There are
some possible reasons as to why these differences emerged. First, many of the previous
studies were conducted many years ago, and maybe the social norms related to dyadic
interactions in these times were different than they are now. Further, the differences may
reflect the marked increase in globalization and increased internationalization over the last
several decades. Finally, it is also unclear whether most previous findings refer to distances
between strangers, acquaintances, or close persons (e.g., Gérin-Lajoie, Richards, &
McFadyen, 2006; Ozdemir, 2008; Smith, 1981; Webb & Weber, 2003). Perhaps the observed
discrepancies result from a simple fact that in our study, the specified context influenced the
declarations of participating men and women.
Preferred interpersonal distances across the globe
17
We also observed that age was a significant predictor of personal and intimate
distance. As discussed in the introduction, our findings are consistent with previously
observed outcomes (Aiello, 1987; Burgess, 1983; Gérin-Lajoie, Richards, & McFadyen,
2006; Rapp & Gutzmann, 2000; Webb & Weber, 2003). Overall, younger people are more
likely to engage in physical contact with others (Rands & Levinger, 1979). Possibly, this
result could be explained with changes in social norms across generations.
Limitations and future directions
Although the distinction proposed in our study provides a novel alternative for previous,
geographic division on contact vs noncontact cultures, and the presented data might stimulate
new research on proxemic behaviors, there exist some limitations of our findings.
First – perhaps, other variables, not analyzed in the current study, could also explain
the interpersonal distance preferences. To create better and more exact models, future studies
should include more predicting variables of various categories, including different individual-
level variables, like e.g., height of interacting individuals, or their disease susceptibility.
Second, we concentrated on preferences for interpersonal distance, and not on real
choices. These two might be different, as shown for example by studies regarding mate
preferences and mate choices (Sorokowski, Sabiniewicz, & Sorokowska, 2015; Todd, Penke,
Fasolo, & Lenton, 2007). On the other hand, some of our findings are consistent with results
of experimental studies regarding real dyadic interactions (Borisova & Butovskaya, 2004).
Nevertheless, further studies should experimentally test the findings of our research.
Third, in our study, we measured distance preferences across three predefined
categories of interpersonal distance (stranger, acquaintance and a close person). It needs to be
mentioned that descriptors of these categories (“a close relationship”) could evoke some
spatial associations (“close distance”). Also, simultaneous assessment of three types of
distance could result in responses being slightly interdependent. Researchers in future works
Preferred interpersonal distances across the globe
18
could control this factor by separating answer sheets for distance categories by some unrelated
tasks, or by using a between-subject design, with each participant in each country assessing
his/her preferences for one type of distance only.
Finally and ideally, in future studies it could be tested how reliably the sample like
ours represents the interpersonal distancing phenomena on a global level. Such an approach
would allow researchers to be more precise in estimating generalizability of the findings. Still,
in the case of our research, the participating sample represents many nations and the observed
findings should be a close proxy of global preferences for interpersonal distances.
Preferred interpersonal distances across the globe
19
Figure captions
Figure 1. Graphic of distance shown to participants.
Figure 2. Mean values (cm) of social, personal and intimate distance across all nations. Non-
overlap of the confidence intervals between any two countries indicates significant mean
differences. Means for interpersonal distance with strangers are rank ordered.
Figure 3. Mean values (cm) of social (grey), personal (light grey), and intimate distance (dark
grey) for men and women in different age groups summed for all nations.
Preferred interpersonal distances across the globe
20
References
Aiello, J. R. (1987). Human spatial behavior. In D. Stokols & I. Altman (Eds.), Handbook of
Environmental Psychology (pp. 389-504). New York: Wiley.
Aiello, J. R., & Jones, S. E. (1971). Field study of the proxemic behavior of young school
children in three subcultural groups. Journal of Personality and Social Psychology,
19(3), 351-356.
Andersen, P. (1988). Explaining intercultural differences in nonverbal communication. In L.
A. Samovar and R. E. Porter (Eds.), Intercultural Communication: A reader (5 ed.), (pp.
272-281). Belmont, CA: Wadsworth.
Anderson, C. A. (1987). Temperature and aggression: effects on quarterly, yearly, and city
rates of violent and nonviolent crime. Journal of Personality and Social
Psychology, 52(6), 1161-1173.
Baldassare, M., & Feller, S. (1975). Cultural variations in personal space. Ethos, 3(4), 481-
503.
Bates, D., Maechler, M., Bolker, B., & Walker, S. (2014). lme4: Linear mixed-effects models
using Eigen and S4. R package version, 1(7). 1-23.
Beaulieu, C. (2004). Intercultural study of personal space: A case study. Journal of Applied
Social Psychology, 34(4), 794-805.
Bogardus, E. (1954). Sociology. New York: The Macmillan company.
Borisova L.V., & Butovskaya M.L. (2004) Spatial behavior in modern Russian urban culture:
age and gender factors. In: M.L. Butovskaya (Ed.) Human Ethology:
Modern Quantitative Methods (pp. 13-20). Moscow, Russia.
Burgess, J. W. (1983). Interpersonal spacing behavior between surrounding nearest neighbors
reflects both familiarity and environmental density. Ethology and Sociobiology, 4(1),
11-17.
Preferred interpersonal distances across the globe
21
Burgoon, J. K. (1991). Relational message interpretations of touch, conversational distance,
and posture. Journal of Nonverbal Behavior, 15(4), 233-259.
Dean, L. M., Willis, F. N., & Hewitt, J. (1975). Initial interaction distance among individuals
equal and unequal in military rank. Journal of Personality and Social Psychology,
32(2), 294-299.
Epstein, Y. M., & Karlin, R. A. (1975). Effects of Acute Experimental Crowding. Journal of
Applied Social Psychology, 5(1), 34-53.
Evans, G. W., & Howard, R. B. (1973). Personal space. Psychological Bulletin, 80(4), 334-
344.
Evans, G. W., Lepore, S. J., & Allen, K. M. (2000). Cross-cultural differences in tolerance for
crowding: fact or fiction? Journal of Personality and Social Psychology, 79(2), 204-
210.
Faulkner, J., Schaller, M., Park, J. H., & Duncan, L. A. (2004). Evolved disease-avoidance
mechanisms and contemporary xenophobic attitudes. Group Processes & Intergroup
Relations, 7(4), 333-353.
Felipe, N. J., & Sommer, R. (1966). Invasions of personal space. Social Problems, 206-214.
Fenichel, E. P. (2013). Economic considerations for social distancing and behavioral based
policies during an epidemic. Journal of Health Economics,32(2), 440-451.
Fincher, C. L., & Thornhill, R. (2012). Parasite-stress promotes in-group assortative sociality:
The cases of strong family ties and heightened religiosity. Behavioral and Brain
Sciences, 35(2), 61-79.
Fischer, R., & Van de Vliert, E. (2011). Does climate undermine subjective well-being? A 58-
nation study. Personality and Social Psychology Bulletin, 37(8), 1031-1041.
Preferred interpersonal distances across the globe
22
Ford, J. G., & Graves, J. R. (1977). Differences between Mexican-American and White
children in interpersonal distance and social touching. Perceptual and Motor
Skills, 45(3), 779-785.
Forston, R. F., & Larson, C. U. (1968). The dynamics of space: An experimental study in
proxemic behavior among Latin Americans and North Americans. Journal of
Communication, 18(2), 109-116.
Gérin-Lajoie, M., Richards, C. L., & McFadyen, B. J. (2006). The circumvention of obstacles
during walking in different environmental contexts: a comparison between older and
younger adults. Gait & Posture, 24(3), 364-369.
Goldstein, H., & Healy, M. J. (1995). The graphical presentation of a collection of means.
Journal of the Royal Statistical Society. Series A (Statistics in Society), 158, 175-177.
Hall, E. T. (1966). The Hidden Dimension. New York: Doubleday.
Hayduk, L. A. (1983). Personal space: Where we now stand. Psychological Bulletin, 94(2),
293-335.
Heshka, S., & Nelson, Y. (1972). Interpersonal speaking distance as a function of age, sex,
and relationship. Sociometry, 35, 491-498.
Hofstede, G. (1981). Culture and organizations. International Studies of Management and
Organizations, 10, 15–41.
Hofstede, G. (2001). Culture’s consequences: comparing values, behaviors, institutions and
organizations across nations. Thousands Oaks: Sage Publications.
Horenstein, V. D. P., & Downey, J. L. (2003). A Cross-Cultural Investigation of Self-
Disclosure. North American Journal of Psychology, 5(3), 373-386.
Human Development Report 2013;
http://hdr.undp.org/sites/default/files/reports/14/hdr2013_en_complete.pdf , accessed
19.12.2013.
Preferred interpersonal distances across the globe
23
IJzerman, H., & Semin, G. R. (2010). Temperature perceptions as a ground for social
proximity. Journal of Experimental Social Psychology, 46(6), 867-873.
Lakoff, G., & Johnson, M. (1999). Philosophy in the flesh: The embodied mind and its
challenge to western thought. New York: Basic books.
Little, K. B. (1968). Cultural variations in social schemata. Journal of Personality and Social
Psychology, 10(1), 1-7.
Mazur, A. (1977). Interpersonal spacing on public benches in “contact” vs. “noncontact”
cultures. The Journal of Social Psychology, 101(1), 53-58.
Madanipour, A. (2003). Public and Private Spaces of the City. London: Routledge.
Olsson, M. J., Lundström, J. N., Kimball, B. A., Gordon, A. R., Karshikoff, B., Hosseini, N.,
... & Lekander, M. (2014). The Scent of Disease Human Body Odor Contains an Early
Chemosensory Cue of Sickness. Psychological Science, 25(3), 817–823.
Özcan, B., & Bjørnskov, C. (2011). Social trust and human development. The Journal of
Socio-Economics, 40(6), 753-762.
Ozdemir, A. (2008). Shopping malls: Measuring interpersonal distance under changing
conditions and across cultures. Field Methods, 20(3), 226-248.
Patterson, M. L., & Edinger, J. A. (1987). A functional analysis of space in social
interaction. Nonverbal Behavior and Communication, 523-562.
Rands, M., & Levinger, G. (1979). Implicit theories of relationship: An intergenerational
study. Journal of Personality and Social Psychology, 37(5), 645-661.
Rapp, M. A., & Gutzmann, H. (2000). Invasions of personal space in demented and
nondemented elderly persons. International Psychogeriatrics, 12(3), 345-352.
Raudenbush, S.W., Bryk, A.S. (2002). Hierarchical linear models: Applications and data
analysis methods. Thousand Oaks: Sage Publications.
Preferred interpersonal distances across the globe
24
R Core Team (2014). R: A language and environment for statistical computing. R Foundation
for Statistical Computing, Vienna, Austria. URL http://www.R-project.org/
Regoeczi, W. C. (2008). Crowding in context: An examination of the differential responses of
men and women to high-density living environments. Journal of Health and Social
Behavior, 49(3), 254-268.
Remland, M. S., Jones, T. S., & Brinkman, H. (1995). Interpersonal distance, body
orientation, and touch: Effects of culture, gender, and age. The Journal of Social
Psychology, 135(3), 281-297.
Sawada, Y. (2003). Blood pressure and heart rate responses to an intrusion on personal
space. Japanese Psychological Research, 45(2), 115-121.
Schaller, M., & Murray, D. R. (2008). Pathogens, personality, and culture: disease prevalence
predicts worldwide variability in sociosexuality, extraversion, and openness to
experience. Journal of Personality and Social Psychology, 95(1), 212-221.
Schweon, S. J., Edmonds, S. L., Kirk, J., Rowland, D. Y., & Acosta, C. (2013). Effectiveness
of a comprehensive hand hygiene program for reduction of infection rates in a long-
term care facility. American Journal of Infection Control, 41(1), 39-44.
Shuter, P. (1976). Proxemics and tactility in Latin America. Journal of Communication, 26,
46-52.
Smith, H. W. (1981). Territorial spacing on a beach revisited: A cross-national
exploration. Social Psychology Quarterly, 44, 132-137.
Sommer, R. (2002). Personal space in a digital age. Handbook of Environmental Psychology,
647-660.
Sommer, R. (1969). Personal Space: the Behavioural Basis of Design. Englewood Cliffs,
New Jersey: Prentice-Hall.

Preferred interpersonal distances across the globe
25
Sorokowski, P., Sabiniewicz, A., & Sorokowska, A. (2015). The impact of dominance on
partner’s height preferences and height-related mate choices. Personality and Individual
Differences, 74, 220-224.
Sorokowski, P., Sorokowska, A., Onyishi, I. E., & Szarota, P. (2013). Montesquieu
hypothesis and football: players from hot countries are more expressive after scoring a
goal. Polish Psychological Bulletin, 44(4), 421-430.
Sussman, N. M., & Rosenfeld, H. M. (1982). Influence of culture, language, and sex on
conversational distance. Journal of Personality and Social Psychology, 42(1), 66-74.
Todd, P. M., Penke, L., Fasolo, B., & Lenton, A. P. (2007). Different cognitive processes
underlie human mate choices and mate preferences. Proceedings of the National
Academy of Sciences, 104(38), 15011-15016.
Triandis, H., & Triandis, L. (1967). Some Studies of Social Distance. In M. Fishbein (Ed.), Readings
in Attitude Theory and Measurement (pp. 199-206). New York: John Wiley & Sons.
United Nations Report; http://esa.un.org/unpd/wpp/Excel-Data/population.htm, accessed
19.12.2013.
Van de Vliert, E. (2013). Climato-economic habitats support patterns of human needs,
stresses, and freedoms. Behavioral and Brain Sciences, 36(5), 465-480.
Van de Vliert, E. (2011). Climato-economic origins of variation in ingroup favoritism.
Journal of Cross-Cultural Psychology, 42, 494-515.
Van de Vliert, E., & Postmes, T. (2012). Climato-economic livability predicts societal
collectivism and political autocracy better than parasitic stress does. Behavioral and
Brain Sciences, 35, 94-95.
Van de Vliert, E., Schwartz, S. H., Huismans, S. E., Hofstede, G., & Daan, S. (1999).
Temperature, Cultural Masculinity, and Domestic Political Violence A Cross-National
Study. Journal of Cross-Cultural Psychology, 30(3), 291-314.
Preferred interpersonal distances across the globe
26
Vranic, A. (2003). Personal space in physically abused children. Environment and
Behavior, 35(4), 550-565.
Watson, O. M., & Graves, T. D. (1966). Quantitative research in proxemic behavior.
American Anthropologist, 68, 971-985.
Watson, O. M. (1970). Proxemic Behavior: A Cross-Cultural Study. Hague: Mouton.
Webb, J. D., & Weber, M. J. (2003). Influence of sensory abilities on the interpersonal
distance of the elderly. Environment and Behavior, 35(5), 695-711.
Williams, L. E., & Bargh, J. A. (2008). Experiencing physical warmth promotes interpersonal
warmth. Science, 322(5901), 606-607.
Worchel, S., & Teddlie, C. (1976). The experience of crowding: A two-factor theory. Journal
of Personality and Social Psychology, 34(1), 30–40.
Yeeles, A. (2015). Weathering unrest. The ecology of urban social disturbances in Africa and
Asia. Journal of Peace Research, 52(2), 158-170.
Zhong, C. B., & Leonardelli, G. J. (2008). Cold and lonely does social exclusion literally feel
cold? Psychological Science, 19(9), 838-842.
Zuur, A.F., Ieno, E.N., Walker, N., Saveliev, A.A., Smith, G.M. (2009). Mixed effects models
and extensions in ecology with R [Internet]. New York, NY: Springer New York.
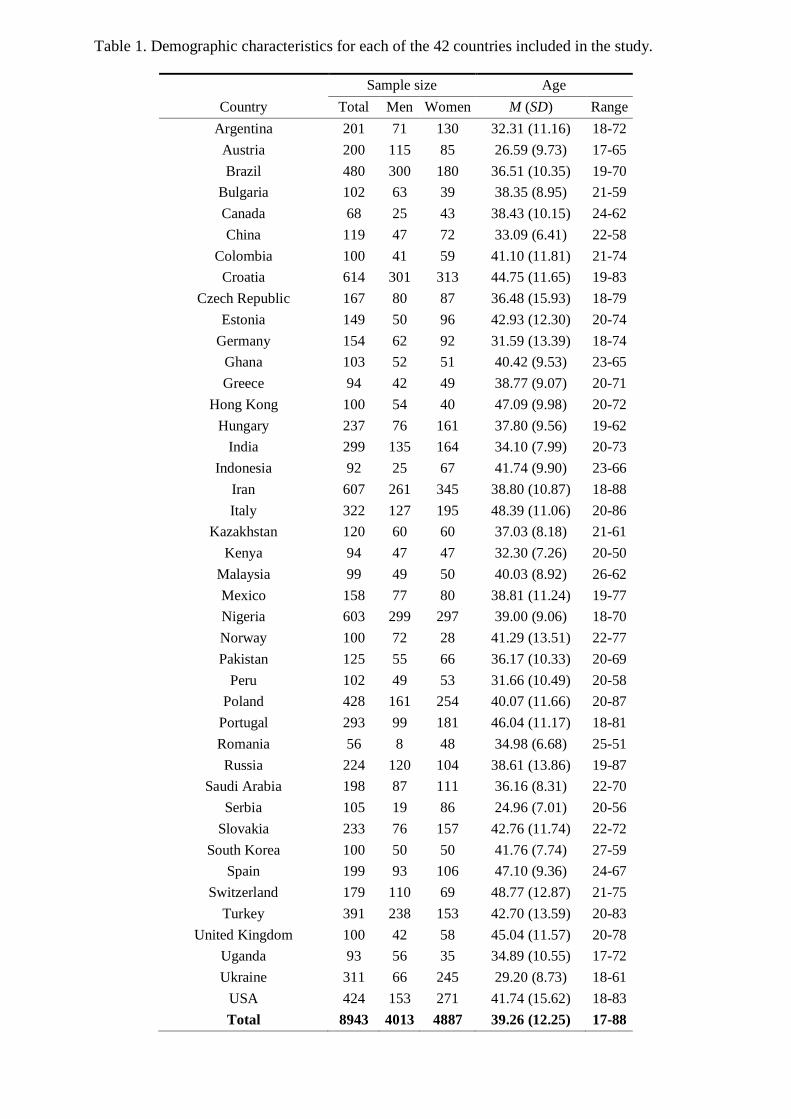
Table 1. Demographic characteristics for each of the 42 countries included in the study.
Sample size Age Country Total Men Women M (SD) Range
Argentina 201 71 130 32.31 (11.16) 18-72 Austria 200 115 85 26.59 (9.73) 17-65 Brazil 480 300 180 36.51 (10.35) 19-70
Bulgaria 102 63 39 38.35 (8.95) 21-59 Canada 68 25 43 38.43 (10.15) 24-62 China 119 47 72 33.09 (6.41) 22-58
Colombia 100 41 59 41.10 (11.81) 21-74 Croatia 614 301 313 44.75 (11.65) 19-83
Czech Republic 167 80 87 36.48 (15.93) 18-79 Estonia 149 50 96 42.93 (12.30) 20-74
Germany 154 62 92 31.59 (13.39) 18-74 Ghana 103 52 51 40.42 (9.53) 23-65 Greece 94 42 49 38.77 (9.07) 20-71
Hong Kong 100 54 40 47.09 (9.98) 20-72 Hungary 237 76 161 37.80 (9.56) 19-62
India 299 135 164 34.10 (7.99) 20-73 Indonesia 92 25 67 41.74 (9.90) 23-66
Iran 607 261 345 38.80 (10.87) 18-88 Italy 322 127 195 48.39 (11.06) 20-86
Kazakhstan 120 60 60 37.03 (8.18) 21-61 Kenya 94 47 47 32.30 (7.26) 20-50
Malaysia 99 49 50 40.03 (8.92) 26-62 Mexico 158 77 80 38.81 (11.24) 19-77 Nigeria 603 299 297 39.00 (9.06) 18-70 Norway 100 72 28 41.29 (13.51) 22-77 Pakistan 125 55 66 36.17 (10.33) 20-69
Peru 102 49 53 31.66 (10.49) 20-58 Poland 428 161 254 40.07 (11.66) 20-87
Portugal 293 99 181 46.04 (11.17) 18-81 Romania 56 8 48 34.98 (6.68) 25-51 Russia 224 120 104 38.61 (13.86) 19-87
Saudi Arabia 198 87 111 36.16 (8.31) 22-70 Serbia 105 19 86 24.96 (7.01) 20-56
Slovakia 233 76 157 42.76 (11.74) 22-72 South Korea 100 50 50 41.76 (7.74) 27-59
Spain 199 93 106 47.10 (9.36) 24-67 Switzerland 179 110 69 48.77 (12.87) 21-75
Turkey 391 238 153 42.70 (13.59) 20-83 United Kingdom 100 42 58 45.04 (11.57) 20-78
Uganda 93 56 35 34.89 (10.55) 17-72 Ukraine 311 66 245 29.20 (8.73) 18-61
USA 424 153 271 41.74 (15.62) 18-83 Total 8943 4013 4887 39.26 (12.25) 17-88
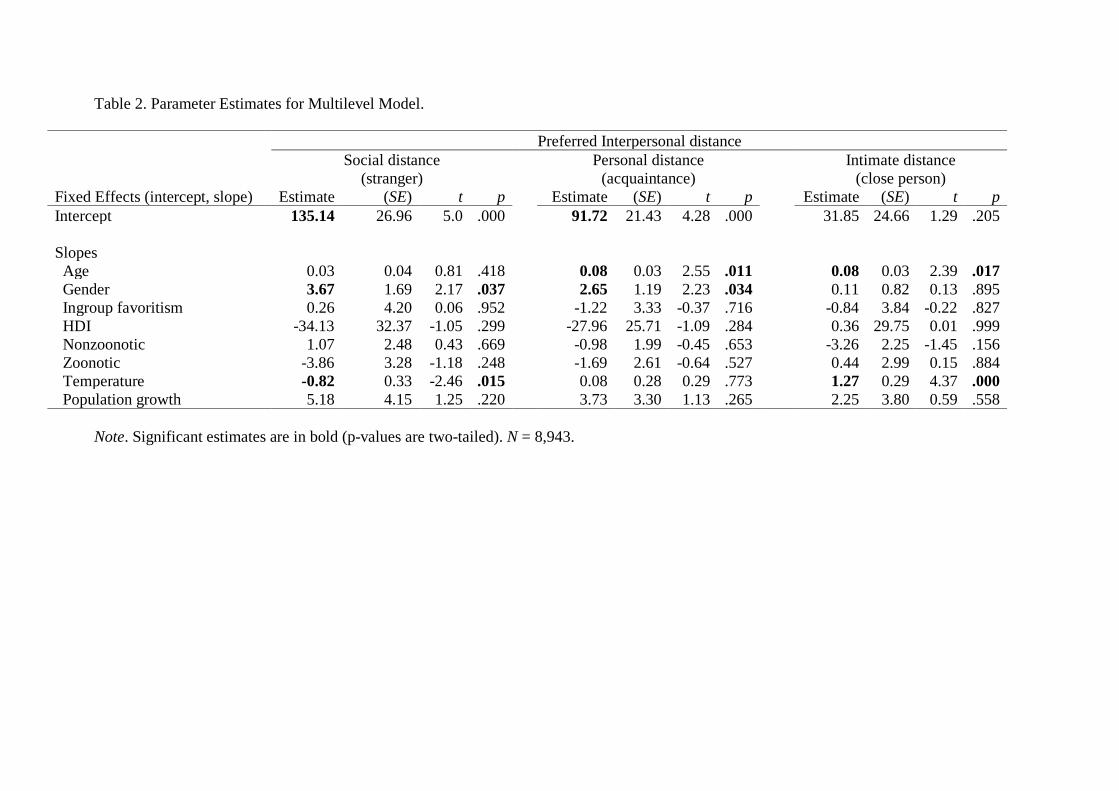
Table 2. Parameter Estimates for Multilevel Model.
Preferred Interpersonal distance Social distance
(stranger) Personal distance
(acquaintance) Intimate distance
(close person) Fixed Effects (intercept, slope) Estimate (SE) t p Estimate (SE) t p Estimate (SE) t p Intercept 135.14 26.96 5.0 .000 91.72 21.43 4.28 .000 31.85 24.66 1.29 .205 Slopes Age 0.03 0.04 0.81 .418 0.08 0.03 2.55 .011 0.08 0.03 2.39 .017 Gender 3.67 1.69 2.17 .037 2.65 1.19 2.23 .034 0.11 0.82 0.13 .895 Ingroup favoritism 0.26 4.20 0.06 .952 -1.22 3.33 -0.37 .716 -0.84 3.84 -0.22 .827 HDI -34.13 32.37 -1.05 .299 -27.96 25.71 -1.09 .284 0.36 29.75 0.01 .999 Nonzoonotic 1.07 2.48 0.43 .669 -0.98 1.99 -0.45 .653 -3.26 2.25 -1.45 .156 Zoonotic -3.86 3.28 -1.18 .248 -1.69 2.61 -0.64 .527 0.44 2.99 0.15 .884 Temperature -0.82 0.33 -2.46 .015 0.08 0.28 0.29 .773 1.27 0.29 4.37 .000 Population growth 5.18 4.15 1.25 .220 3.73 3.30 1.13 .265 2.25 3.80 0.59 .558
Note. Significant estimates are in bold (p-values are two-tailed). N = 8,943.


![warwick.ac.uk/lib-publicationswrap.warwick.ac.uk/97168/1/WRAP-spectrally...GHz-spaced 4 × 168 Gb/s WDM SSB 64-QAM Nyquist subcarrier modulation (Nyquist-SCM) signals [28-31] to achieve](https://img.pdfslide.tips/doc/110x75/6012511ac5f68536dd2d10dd/-ghz-spaced-4-168-gbs-wdm-ssb-64-qam-nyquist-subcarrier-modulation-nyquist-scm.jpg)