Embed Size (px)
Citation preview
Article J. Braz. Chem. Soc., Vol. 25, No. 1, 50-64, 2014.Printed in Brazil - ©2014 Sociedade Brasileira de Química0103 - 5053 $6.00+0.00Ahttp://dx.doi.org/10.5935/0103-5053.20130268
*e-mail: [email protected], [email protected]
Evaluating Sedimentation Rates in the Estuary and Shelf Region of the Paraíba do Sul River, Southeastern Brazil
Cristiana V. A. Wanderley,a José Marcus Godoy,*,a,b Maria Luiza D. P. Godoy,b Carlos Eduardo Rezende,c Luiz D. Lacerda,d Isabel Moreiraa and Zenildo L. Carvalhob
aDepartamento de Química, Pontifícia Universidade Católica do Rio de Janeiro, Rua Marquês de São Vicente, 225, Gávea, 22451-900 Rio de Janeiro-RJ, Brazil
bInstituto de Radioproteção e Dosimetria, Avenida Salvador Allende s/n, Jacarepaguá, 22780-160 Rio de Janeiro-RJ, Brazil
cLaboratório de Ciências Ambientais, Centro de Biociências e Biotecnologia, Universidade Estadual Norte Fluminense Darcy Ribeiro, UENF, 28013-602 Campos dos Goytacazes-RJ, Brazil
dInstituto de Ciências do Mar, Universidade Federal do Ceará, 60165-081 Fortaleza-CE, Brazil
Este estudo é uma avaliação das taxas de sedimentação na região do delta do Rio Paraíba do Sul e sua correlação com a forte erosão que ocorre em Atafona, Rio de Janeiro. Os resultados obtidos são baseados 14 testemunhos de sedimentos, com um total de aproximadamente 540 amostras, coletados em janeiro de 2010 e fevereiro de 2011. Os inventários de 210Pb nos pontos de amostragem ao sul da desembocadura do Rio Paraíba do Sul foram maiores do que aqueles observados para os pontos de coleta na região norte e central, o que sugere que os sedimentos são transportados ao longo da costa com as correntes nesta direção. Os resultados da datação 210Pb foram validados com base na variação de concentração elementar ao longo de dois dos testemunhos. Concentrações de Cd e Zn aumentaram significativamente em 1982 e atingindo valores máximos (0,5 mg kg-1 e 139 mg kg-1, respectivamente) em 1984. Estes máximos correspondem ao acidente da indústria Cia Paraibuna de Metais, que ocorreu em 1982.
This study aims to evaluate sedimentation rates in the Paraíba do Sul estuary and its shelf regions. These sedimentation rates were correlated with strong erosion occurring in Atafona, Rio de Janeiro. The results were based on four transects, from which 14 sediment cores with approximately 540 sediment samples were collected in January 2010 and February 2011. At sampling points south of the Paraíba do Sul River (PSR) mouth, 210Pb inventories were higher than those at the northern and central sampling locations, suggesting that sediment is transported southward by the alongshore current. The 210Pb dating results were validated based on the elemental concentration variation throughout two of the sediment cores. Heavy metal concentrations, such as Cd and Zn, increased significantly in 1982 and reached maximum values (0.5 mg kg-1 and 139 mg kg-1, respectively) in 1984. These maxima correspond to the Cia Paraibuna de Metais industry accident, which occurred in 1982.
Keywords: 210Pb dating, sedimentation rate, sediments, heavy metals, Paraíba do Sul River, Brazil
Introduction
Brazil has sufficient water supply for domestic, industrial and agricultural use, as well as for electricity generation. This potential for water use is exemplified by the Paraíba do Sul River (PSR) in Southeastern Brazil.
The conditions in the PSR have deteriorated because of degradation that has occurred along the course of the river. The causes of this degradation include deforestation of the margins, leading to erosion; the use of agricultural pesticides; domestic sewage discharge and solid waste disposal; gold mining activities (like gold prospecting); and the construction of numerous dams.1 The primary purpose of these dams is to divert water to the Guandu
Wanderley et al. 51Vol. 25, No. 1, 2014
River, which is the main water supply source for the city of Rio de Janeiro. The construction of dams on the PSR has reduced the amount of sediment and water reaching the sea, thus decreasing the deposition of sand to adjacent beaches and increasing the intensity of erosion.1 In recent years, the PSR has experienced a continuous modification of its delta, characterized by saline intrusion and strong erosion of the Atafona beach.2 The coastline of Atafona is receding, and the advancement of the sea has destroyed most shoreline structures. The retrogradation rate associated with erosion was estimated to be 7.5 m per year, based on photographic data from 1976 and on the determination of the front line by a global positioning system (GPS) in 1996.1 This erosion has destroyed 183 buildings in 14 km2.3 The most significant causes of this erosion are the combined effects of natural factors, such as wind, waves and tides, and human activities (i.e., dam construction). Another important factor affecting the coastline is the loss of approximately 30% of the mangrove area in the estuarine ecosystem.4 This ecosystem has an important role in coastal stability, and this deforestation promotes serious changes in the dynamics of coastal sedimentation.4
The use of radionuclides in the environment (e.g., 210Pb, 226Ra and 137Cs) as sediment tracers offers considerable potential for determining sediment sources and sedimentation rates in a drainage basin. The excess 210Pb (210Pbexc) dating method is a commonly used chronometer for the reconstruction of anthropogenic inputs, including the reconstruction of historical trace metal and organic contamination, because of its applicability for dating recently deposited sediments (i.e., those deposited in the last ca.100 year).5-11
Based on these assumptions, we have determined a 210Pb-based chronology and mass sedimentation rates to investigate the changes in sediment supply in this region over the last 50 years, aiming to evaluate human and natural impacts on the river’s estuarine region.
Experimental
Study area
The PSR, together with its tributaries, form the largest hydrographic basin in Southeastern Brazil, traversing three states (São Paulo, Minas Gerais and Rio de Janeiro) with an area of approximately 55,400 km² and a length of 1,500 km. The PSR estuary is located in a coastal plain formed by the PSR delta in the northern part of the state of Rio de Janeiro, near São João da Barra (21o36’ S and 41o05’ W).12 The PSR is a major river in the hydrographic basin of this region and has variable discharge, mainly due
to anthropogenic and natural interventions along its course. Atafona is a town in the São João da Barra Municipality situated near the PSR estuary. In the 1950s, this town was a popular tourist and holiday destination, but Atafona has since suffered from erosion caused by shoreline recession.
Materials and methods
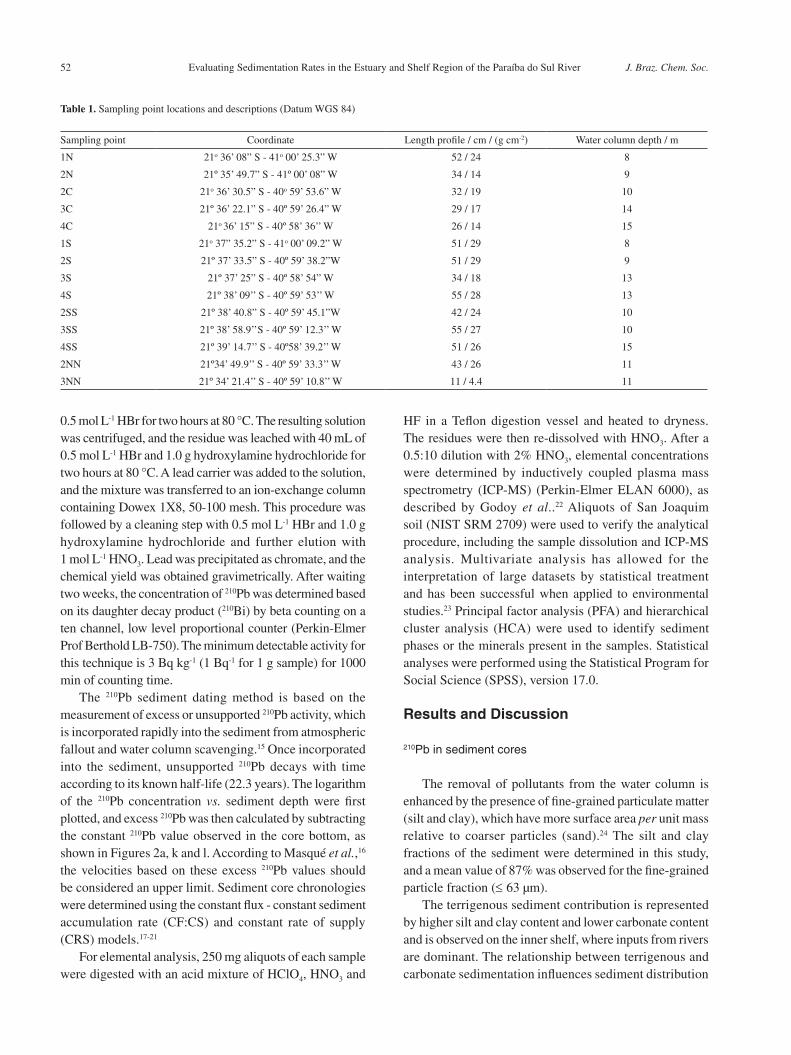
This work was based on four transects which were traced with respect to the outfall of the PSR. The first transect is toward the river outlet, than it was marked one at north and two at south. There were four points marked at 1 km intervals for each transect resulting 14 sediment cores with 546 sediment samples collected in January 2010 and February 2011 (Figure 1 and Table 1). The sediment core 3NN was very short and was not analyzed. The sediment cores were collected with a UWITEC corer and immediately sliced into 1 cm layers. Once sliced, the samples were weighed, and one aliquot was taken for grain size determination at Universidade do Norte Fluminense (UENF) laboratories. The fractions above 2 mm were separated by sieving, whereas the fractions smaller than 2 mm were evaluated using a particle analyzer with laser diffraction (Shimadzu Model SALD-3101) in several fractions according to the Wentworth scale.13 The analytical coefficient of variation was < 10% for each grain size fraction, and the accuracy was ca. 97% using the reference material (JIS S11, Lycopodium and Glass beads, Association of Powder Process Industry and Engineering, Japan). The remaining fraction was dried at 70 °C in an oven with circulating air until a constant weight was achieved and then ground to a fine powder with a porcelain mortar.
210Pb concentrations were determined according to the procedure described by Godoy et al..14 To briefly summarize this procedure, 3 g aliquots were leached with 40 mL of
Figure 1. Sediment sampling stations and Atafona city.
Evaluating Sedimentation Rates in the Estuary and Shelf Region of the Paraíba do Sul River J. Braz. Chem. Soc.52
0.5 mol L-1 HBr for two hours at 80 °C. The resulting solution was centrifuged, and the residue was leached with 40 mL of 0.5 mol L-1 HBr and 1.0 g hydroxylamine hydrochloride for two hours at 80 °C. A lead carrier was added to the solution, and the mixture was transferred to an ion-exchange column containing Dowex 1X8, 50-100 mesh. This procedure was followed by a cleaning step with 0.5 mol L-1 HBr and 1.0 g hydroxylamine hydrochloride and further elution with 1 mol L-1 HNO3. Lead was precipitated as chromate, and the chemical yield was obtained gravimetrically. After waiting two weeks, the concentration of 210Pb was determined based on its daughter decay product (210Bi) by beta counting on a ten channel, low level proportional counter (Perkin-Elmer Prof Berthold LB-750). The minimum detectable activity for this technique is 3 Bq kg-1 (1 Bq-1 for 1 g sample) for 1000 min of counting time.
The 210Pb sediment dating method is based on the measurement of excess or unsupported 210Pb activity, which is incorporated rapidly into the sediment from atmospheric fallout and water column scavenging.15 Once incorporated into the sediment, unsupported 210Pb decays with time according to its known half-life (22.3 years). The logarithm of the 210Pb concentration vs. sediment depth were first plotted, and excess 210Pb was then calculated by subtracting the constant 210Pb value observed in the core bottom, as shown in Figures 2a, k and l. According to Masqué et al.,16 the velocities based on these excess 210Pb values should be considered an upper limit. Sediment core chronologies were determined using the constant flux - constant sediment accumulation rate (CF:CS) and constant rate of supply (CRS) models.17-21
For elemental analysis, 250 mg aliquots of each sample were digested with an acid mixture of HClO4, HNO3 and
HF in a Teflon digestion vessel and heated to dryness. The residues were then re-dissolved with HNO3. After a 0.5:10 dilution with 2% HNO3, elemental concentrations were determined by inductively coupled plasma mass spectrometry (ICP-MS) (Perkin-Elmer ELAN 6000), as described by Godoy et al..22 Aliquots of San Joaquim soil (NIST SRM 2709) were used to verify the analytical procedure, including the sample dissolution and ICP-MS analysis. Multivariate analysis has allowed for the interpretation of large datasets by statistical treatment and has been successful when applied to environmental studies.23 Principal factor analysis (PFA) and hierarchical cluster analysis (HCA) were used to identify sediment phases or the minerals present in the samples. Statistical analyses were performed using the Statistical Program for Social Science (SPSS), version 17.0.
Results and Discussion
210Pb in sediment cores
The removal of pollutants from the water column is enhanced by the presence of fine-grained particulate matter (silt and clay), which have more surface area per unit mass relative to coarser particles (sand).24 The silt and clay fractions of the sediment were determined in this study, and a mean value of 87% was observed for the fine-grained particle fraction (≤ 63 μm).
The terrigenous sediment contribution is represented by higher silt and clay content and lower carbonate content and is observed on the inner shelf, where inputs from rivers are dominant. The relationship between terrigenous and carbonate sedimentation influences sediment distribution
Table 1. Sampling point locations and descriptions (Datum WGS 84)
Sampling point Coordinate Length profile / cm / (g cm-2) Water column depth / m
1N 21o 36’ 08” S - 41o 00’ 25.3” W 52 / 24 8
2N 21º 35’ 49.7” S - 41º 00’ 08” W 34 / 14 9
2C 21o 36’ 30.5” S - 40o 59’ 53.6” W 32 / 19 10
3C 21º 36’ 22.1” S - 40º 59’ 26.4” W 29 / 17 14
4C 21o 36’ 15” S - 40º 58’ 36’’ W 26 / 14 15
1S 21o 37” 35.2” S - 41o 00’ 09.2” W 51 / 29 8
2S 21º 37’ 33.5” S - 40º 59’ 38.2”W 51 / 29 9
3S 21º 37’ 25” S - 40º 58’ 54” W 34 / 18 13
4S 21º 38’ 09’’ S - 40º 59’ 53’’ W 55 / 28 13
2SS 21º 38’ 40.8” S - 40º 59’ 45.1”W 42 / 24 10
3SS 21º 38’ 58.9’’S - 40º 59’ 12.3’’ W 55 / 27 10
4SS 21º 39’ 14.7’’ S - 40º58’ 39.2’’ W 51 / 26 15
2NN 21º34’ 49.9’’ S - 40º 59’ 33.3’’ W 43 / 26 11
3NN 21º 34’ 21.4’’ S - 40º 59’ 10.8’’ W 11 / 4.4 11
Wanderley et al. 53Vol. 25, No. 1, 2014
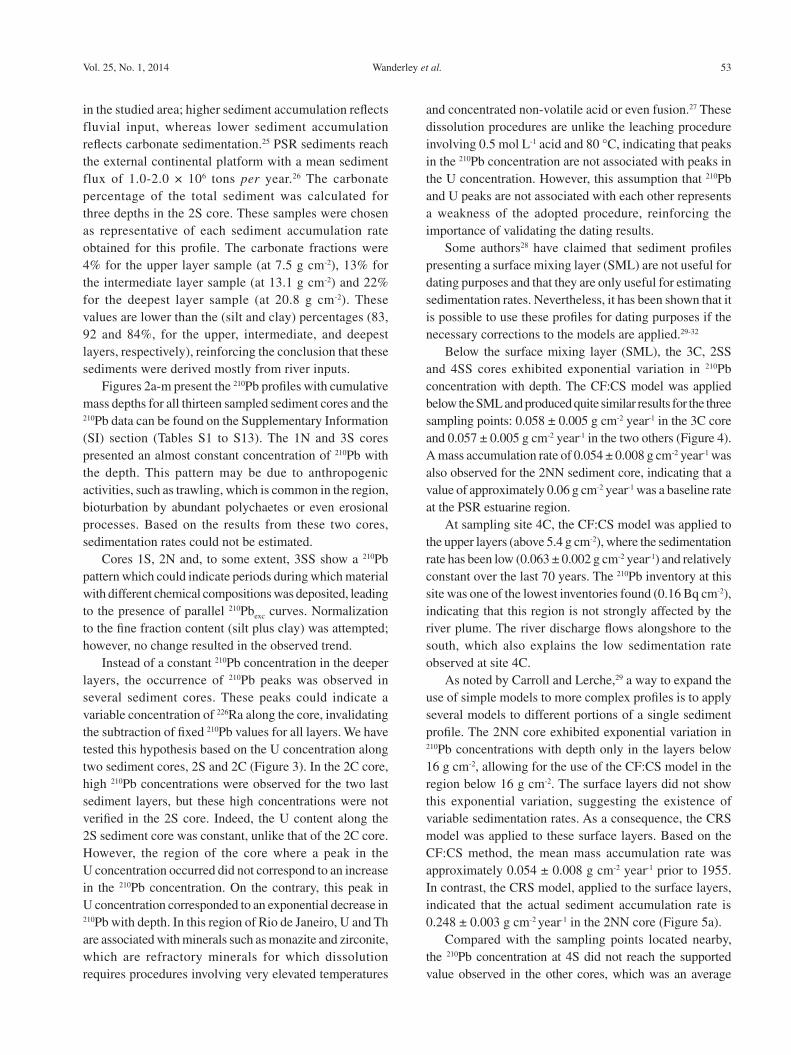
in the studied area; higher sediment accumulation reflects fluvial input, whereas lower sediment accumulation reflects carbonate sedimentation.25 PSR sediments reach the external continental platform with a mean sediment flux of 1.0-2.0 × 10⁶ tons per year.26 The carbonate percentage of the total sediment was calculated for three depths in the 2S core. These samples were chosen as representative of each sediment accumulation rate obtained for this profile. The carbonate fractions were 4% for the upper layer sample (at 7.5 g cm-2), 13% for the intermediate layer sample (at 13.1 g cm-2) and 22% for the deepest layer sample (at 20.8 g cm-2). These values are lower than the (silt and clay) percentages (83, 92 and 84%, for the upper, intermediate, and deepest layers, respectively), reinforcing the conclusion that these sediments were derived mostly from river inputs.
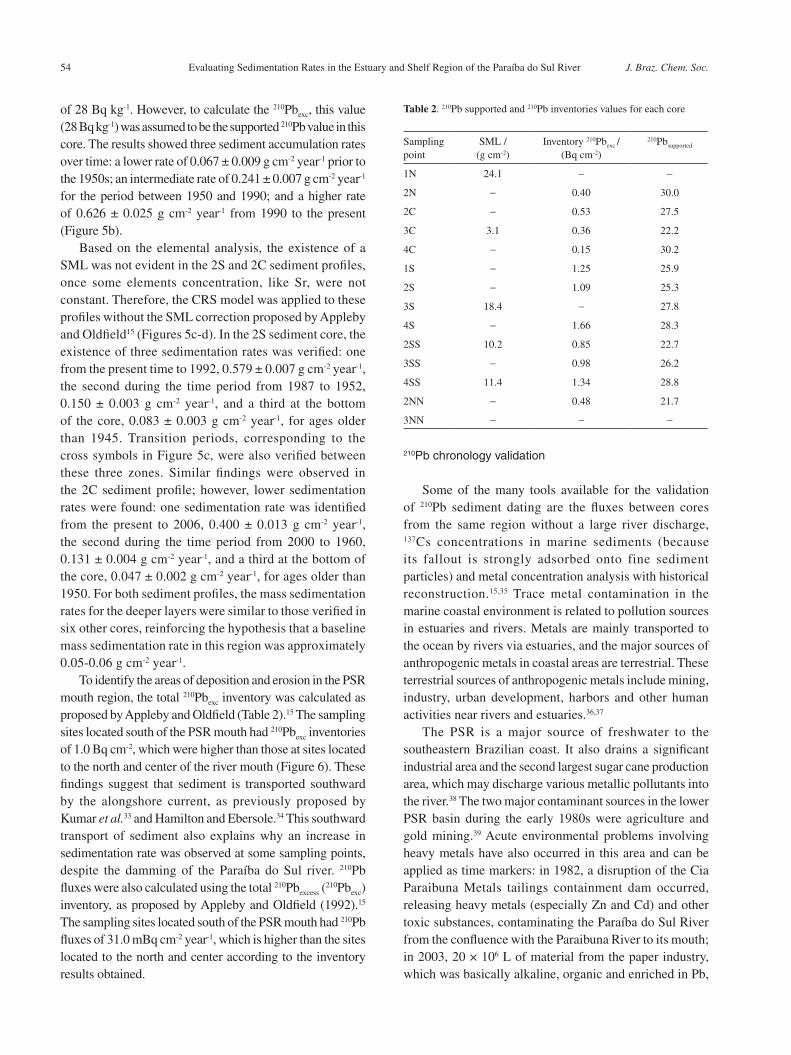
Figures 2a-m present the 210Pb profiles with cumulative mass depths for all thirteen sampled sediment cores and the 210Pb data can be found on the Supplementary Information (SI) section (Tables S1 to S13). The 1N and 3S cores presented an almost constant concentration of 210Pb with the depth. This pattern may be due to anthropogenic activities, such as trawling, which is common in the region, bioturbation by abundant polychaetes or even erosional processes. Based on the results from these two cores, sedimentation rates could not be estimated.
Cores 1S, 2N and, to some extent, 3SS show a 210Pb pattern which could indicate periods during which material with different chemical compositions was deposited, leading to the presence of parallel 210Pbexc curves. Normalization to the fine fraction content (silt plus clay) was attempted; however, no change resulted in the observed trend.
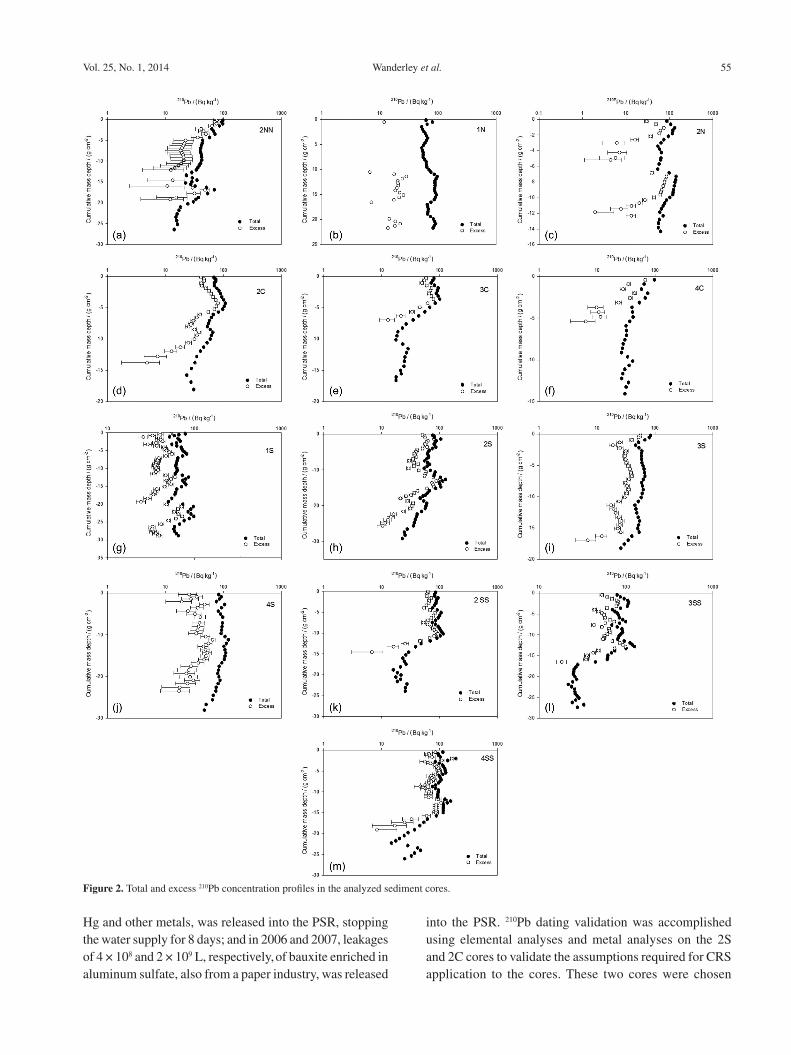
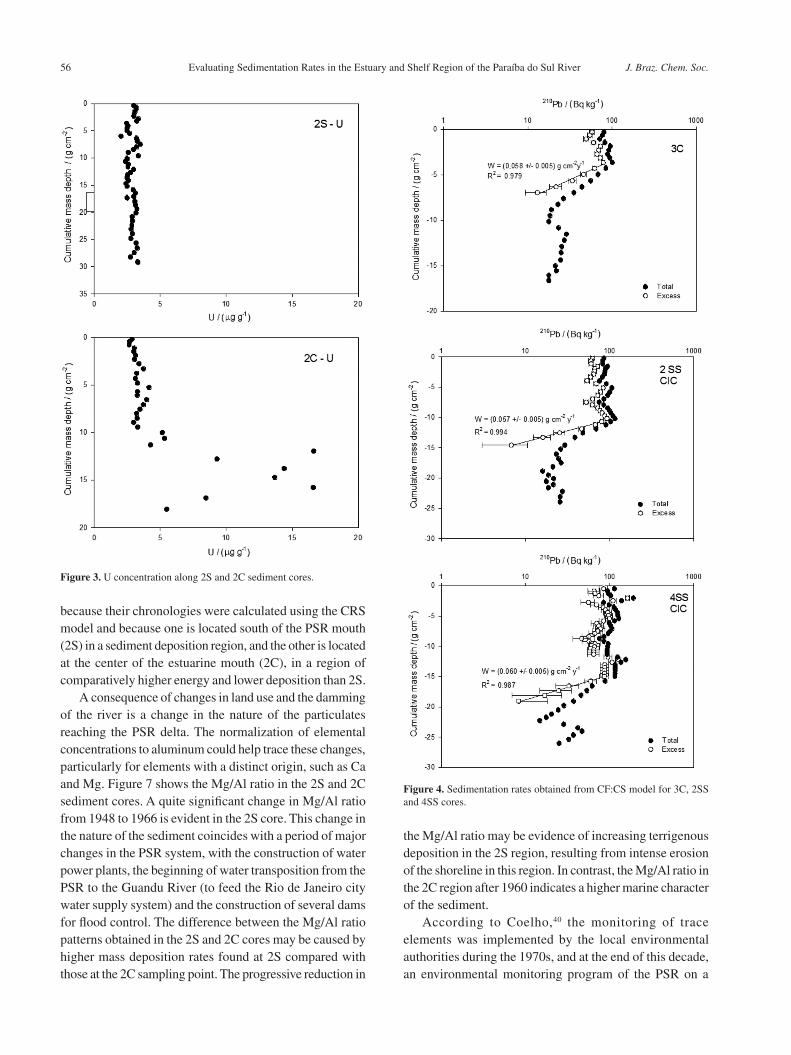
Instead of a constant 210Pb concentration in the deeper layers, the occurrence of 210Pb peaks was observed in several sediment cores. These peaks could indicate a variable concentration of 226Ra along the core, invalidating the subtraction of fixed 210Pb values for all layers. We have tested this hypothesis based on the U concentration along two sediment cores, 2S and 2C (Figure 3). In the 2C core, high 210Pb concentrations were observed for the two last sediment layers, but these high concentrations were not verified in the 2S core. Indeed, the U content along the 2S sediment core was constant, unlike that of the 2C core. However, the region of the core where a peak in the U concentration occurred did not correspond to an increase in the 210Pb concentration. On the contrary, this peak in U concentration corresponded to an exponential decrease in 210Pb with depth. In this region of Rio de Janeiro, U and Th are associated with minerals such as monazite and zirconite, which are refractory minerals for which dissolution requires procedures involving very elevated temperatures
and concentrated non-volatile acid or even fusion.27 These dissolution procedures are unlike the leaching procedure involving 0.5 mol L-1 acid and 80 °C, indicating that peaks in the 210Pb concentration are not associated with peaks in the U concentration. However, this assumption that 210Pb and U peaks are not associated with each other represents a weakness of the adopted procedure, reinforcing the importance of validating the dating results.
Some authors28 have claimed that sediment profiles presenting a surface mixing layer (SML) are not useful for dating purposes and that they are only useful for estimating sedimentation rates. Nevertheless, it has been shown that it is possible to use these profiles for dating purposes if the necessary corrections to the models are applied.29-32
Below the surface mixing layer (SML), the 3C, 2SS and 4SS cores exhibited exponential variation in 210Pb concentration with depth. The CF:CS model was applied below the SML and produced quite similar results for the three sampling points: 0.058 ± 0.005 g cm-2 year-1 in the 3C core and 0.057 ± 0.005 g cm-2 year-1 in the two others (Figure 4). A mass accumulation rate of 0.054 ± 0.008 g cm-2 year-1 was also observed for the 2NN sediment core, indicating that a value of approximately 0.06 g cm-2 year-1 was a baseline rate at the PSR estuarine region.
At sampling site 4C, the CF:CS model was applied to the upper layers (above 5.4 g cm-2), where the sedimentation rate has been low (0.063 ± 0.002 g cm-2 year-1) and relatively constant over the last 70 years. The 210Pb inventory at this site was one of the lowest inventories found (0.16 Bq cm-2), indicating that this region is not strongly affected by the river plume. The river discharge flows alongshore to the south, which also explains the low sedimentation rate observed at site 4C.
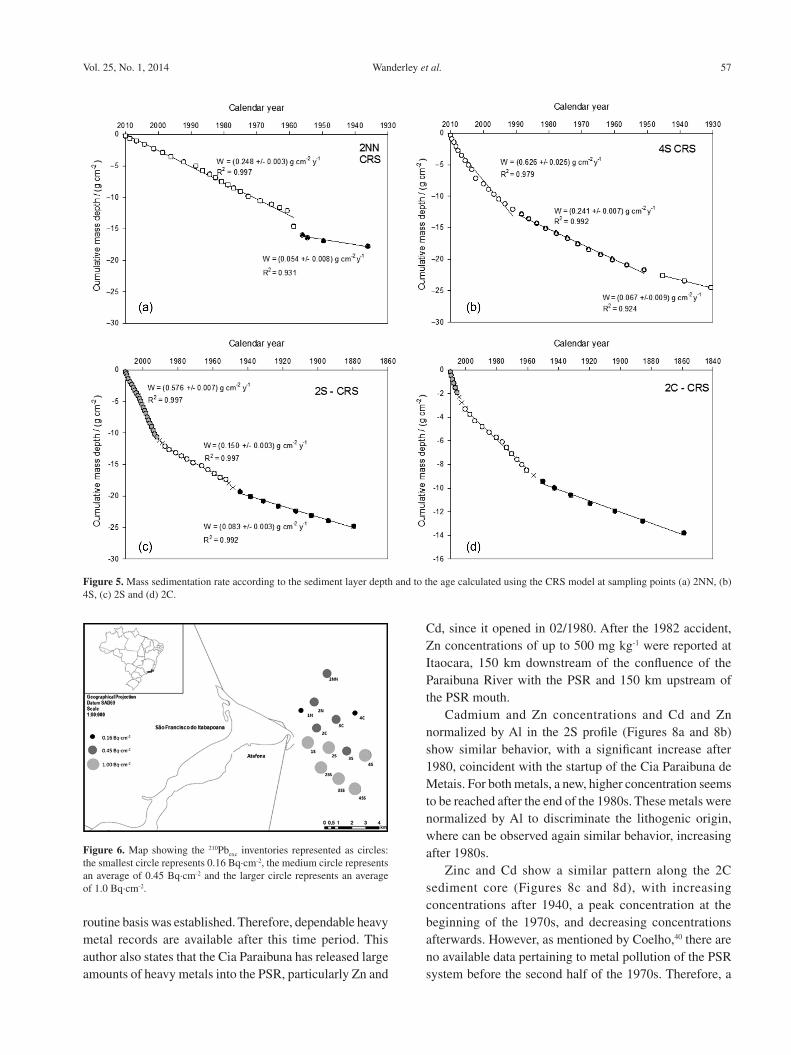
As noted by Carroll and Lerche,29 a way to expand the use of simple models to more complex profiles is to apply several models to different portions of a single sediment profile. The 2NN core exhibited exponential variation in 210Pb concentrations with depth only in the layers below 16 g cm-2, allowing for the use of the CF:CS model in the region below 16 g cm-2. The surface layers did not show this exponential variation, suggesting the existence of variable sedimentation rates. As a consequence, the CRS model was applied to these surface layers. Based on the CF:CS method, the mean mass accumulation rate was approximately 0.054 ± 0.008 g cm-2 year-1 prior to 1955. In contrast, the CRS model, applied to the surface layers, indicated that the actual sediment accumulation rate is 0.248 ± 0.003 g cm-2 year-1 in the 2NN core (Figure 5a).
Compared with the sampling points located nearby, the 210Pb concentration at 4S did not reach the supported value observed in the other cores, which was an average
Evaluating Sedimentation Rates in the Estuary and Shelf Region of the Paraíba do Sul River J. Braz. Chem. Soc.54
of 28 Bq kg-1. However, to calculate the 210Pbexc, this value (28 Bq kg-1) was assumed to be the supported 210Pb value in this core. The results showed three sediment accumulation rates over time: a lower rate of 0.067 ± 0.009 g cm-2 year-1 prior to the 1950s; an intermediate rate of 0.241 ± 0.007 g cm-2 year-1
for the period between 1950 and 1990; and a higher rate of 0.626 ± 0.025 g cm-2 year-1 from 1990 to the present (Figure 5b).
Based on the elemental analysis, the existence of a SML was not evident in the 2S and 2C sediment profiles, once some elements concentration, like Sr, were not constant. Therefore, the CRS model was applied to these profiles without the SML correction proposed by Appleby and Oldfield15 (Figures 5c-d). In the 2S sediment core, the existence of three sedimentation rates was verified: one from the present time to 1992, 0.579 ± 0.007 g cm-2 year-1, the second during the time period from 1987 to 1952, 0.150 ± 0.003 g cm-2 year-1, and a third at the bottom of the core, 0.083 ± 0.003 g cm-2 year-1, for ages older than 1945. Transition periods, corresponding to the cross symbols in Figure 5c, were also verified between these three zones. Similar findings were observed in the 2C sediment profile; however, lower sedimentation rates were found: one sedimentation rate was identified from the present to 2006, 0.400 ± 0.013 g cm-2 year-1, the second during the time period from 2000 to 1960, 0.131 ± 0.004 g cm-2 year-1, and a third at the bottom of the core, 0.047 ± 0.002 g cm-2 year-1, for ages older than 1950. For both sediment profiles, the mass sedimentation rates for the deeper layers were similar to those verified in six other cores, reinforcing the hypothesis that a baseline mass sedimentation rate in this region was approximately 0.05-0.06 g cm-2 year-1.
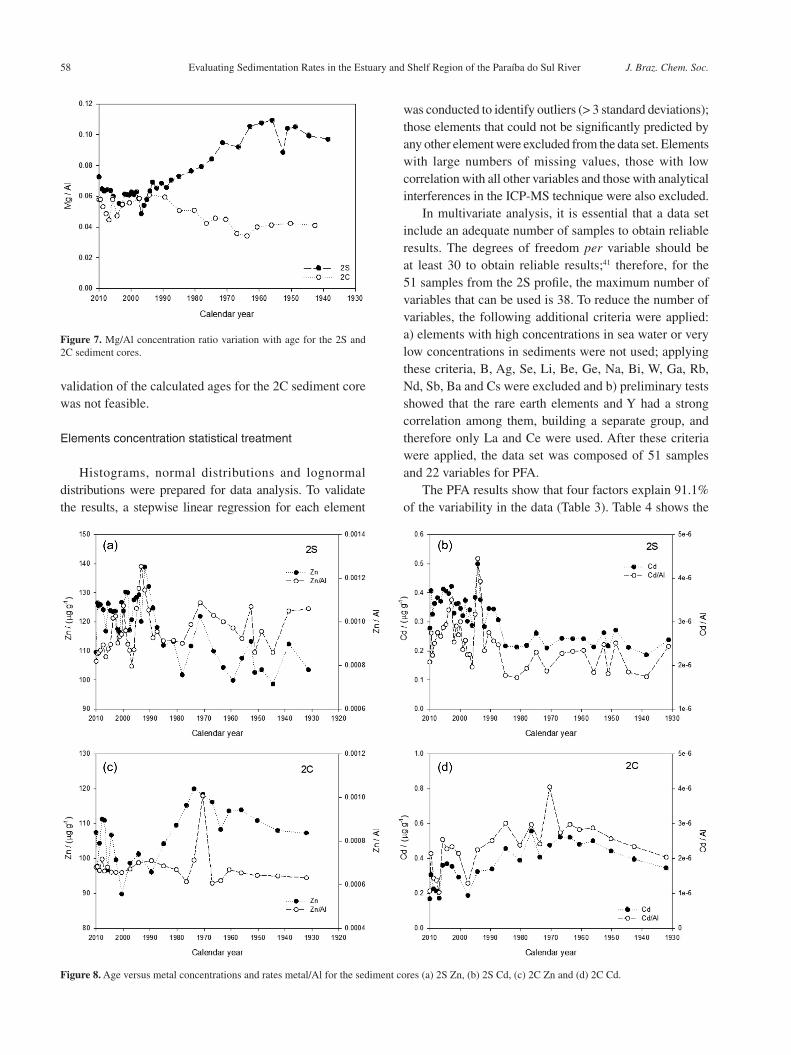
To identify the areas of deposition and erosion in the PSR mouth region, the total 210Pbexc inventory was calculated as proposed by Appleby and Oldfield (Table 2).15 The sampling sites located south of the PSR mouth had 210Pbexc inventories of 1.0 Bq cm-2, which were higher than those at sites located to the north and center of the river mouth (Figure 6). These findings suggest that sediment is transported southward by the alongshore current, as previously proposed by Kumar et al.33 and Hamilton and Ebersole.34 This southward transport of sediment also explains why an increase in sedimentation rate was observed at some sampling points, despite the damming of the Paraíba do Sul river. 210Pb fluxes were also calculated using the total 210Pbexcess (
210Pbexc) inventory, as proposed by Appleby and Oldfield (1992).15 The sampling sites located south of the PSR mouth had 210Pb fluxes of 31.0 mBq cm-2 year-1, which is higher than the sites located to the north and center according to the inventory results obtained.
210Pb chronology validation
Some of the many tools available for the validation of 210Pb sediment dating are the fluxes between cores from the same region without a large river discharge, 137Cs concentrations in marine sediments (because its fallout is strongly adsorbed onto fine sediment particles) and metal concentration analysis with historical reconstruction.15,35 Trace metal contamination in the marine coastal environment is related to pollution sources in estuaries and rivers. Metals are mainly transported to the ocean by rivers via estuaries, and the major sources of anthropogenic metals in coastal areas are terrestrial. These terrestrial sources of anthropogenic metals include mining, industry, urban development, harbors and other human activities near rivers and estuaries.36,37
The PSR is a major source of freshwater to the southeastern Brazilian coast. It also drains a significant industrial area and the second largest sugar cane production area, which may discharge various metallic pollutants into the river.38 The two major contaminant sources in the lower PSR basin during the early 1980s were agriculture and gold mining.39 Acute environmental problems involving heavy metals have also occurred in this area and can be applied as time markers: in 1982, a disruption of the Cia Paraibuna Metals tailings containment dam occurred, releasing heavy metals (especially Zn and Cd) and other toxic substances, contaminating the Paraíba do Sul River from the confluence with the Paraibuna River to its mouth; in 2003, 20 × 106 L of material from the paper industry, which was basically alkaline, organic and enriched in Pb,
Table 2. 210Pb supported and 210Pb inventories values for each core
Sampling point
SML / (g cm-2)
Inventory 210Pbexc /
(Bq cm-2)
210Pbsupported
1N 24.1 - -
2N - 0.40 30.0
2C - 0.53 27.5
3C 3.1 0.36 22.2
4C - 0.15 30.2
1S - 1.25 25.9
2S - 1.09 25.3
3S 18.4 - 27.8
4S - 1.66 28.3
2SS 10.2 0.85 22.7
3SS - 0.98 26.2
4SS 11.4 1.34 28.8
2NN - 0.48 21.7
3NN - - -
Wanderley et al. 55Vol. 25, No. 1, 2014
Hg and other metals, was released into the PSR, stopping the water supply for 8 days; and in 2006 and 2007, leakages of 4 × 10⁸ and 2 × 10⁹ L, respectively, of bauxite enriched in aluminum sulfate, also from a paper industry, was released
into the PSR. 210Pb dating validation was accomplished using elemental analyses and metal analyses on the 2S and 2C cores to validate the assumptions required for CRS application to the cores. These two cores were chosen
Figure 2. Total and excess 210Pb concentration profiles in the analyzed sediment cores.
Evaluating Sedimentation Rates in the Estuary and Shelf Region of the Paraíba do Sul River J. Braz. Chem. Soc.56
because their chronologies were calculated using the CRS model and because one is located south of the PSR mouth (2S) in a sediment deposition region, and the other is located at the center of the estuarine mouth (2C), in a region of comparatively higher energy and lower deposition than 2S.
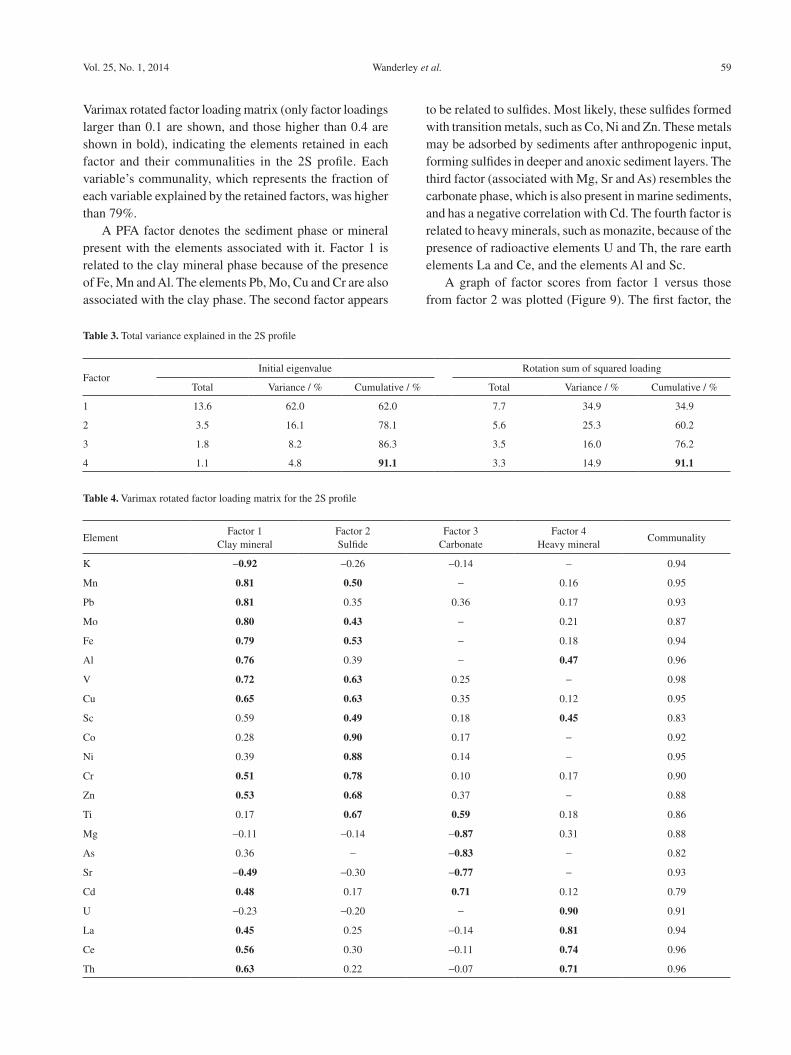
A consequence of changes in land use and the damming of the river is a change in the nature of the particulates reaching the PSR delta. The normalization of elemental concentrations to aluminum could help trace these changes, particularly for elements with a distinct origin, such as Ca and Mg. Figure 7 shows the Mg/Al ratio in the 2S and 2C sediment cores. A quite significant change in Mg/Al ratio from 1948 to 1966 is evident in the 2S core. This change in the nature of the sediment coincides with a period of major changes in the PSR system, with the construction of water power plants, the beginning of water transposition from the PSR to the Guandu River (to feed the Rio de Janeiro city water supply system) and the construction of several dams for flood control. The difference between the Mg/Al ratio patterns obtained in the 2S and 2C cores may be caused by higher mass deposition rates found at 2S compared with those at the 2C sampling point. The progressive reduction in
the Mg/Al ratio may be evidence of increasing terrigenous deposition in the 2S region, resulting from intense erosion of the shoreline in this region. In contrast, the Mg/Al ratio in the 2C region after 1960 indicates a higher marine character of the sediment.
According to Coelho,40 the monitoring of trace elements was implemented by the local environmental authorities during the 1970s, and at the end of this decade, an environmental monitoring program of the PSR on a
Figure 3. U concentration along 2S and 2C sediment cores.
Figure 4. Sedimentation rates obtained from CF:CS model for 3C, 2SS and 4SS cores.
Wanderley et al. 57Vol. 25, No. 1, 2014
routine basis was established. Therefore, dependable heavy metal records are available after this time period. This author also states that the Cia Paraibuna has released large amounts of heavy metals into the PSR, particularly Zn and
Cd, since it opened in 02/1980. After the 1982 accident, Zn concentrations of up to 500 mg kg-1 were reported at Itaocara, 150 km downstream of the confluence of the Paraibuna River with the PSR and 150 km upstream of the PSR mouth.
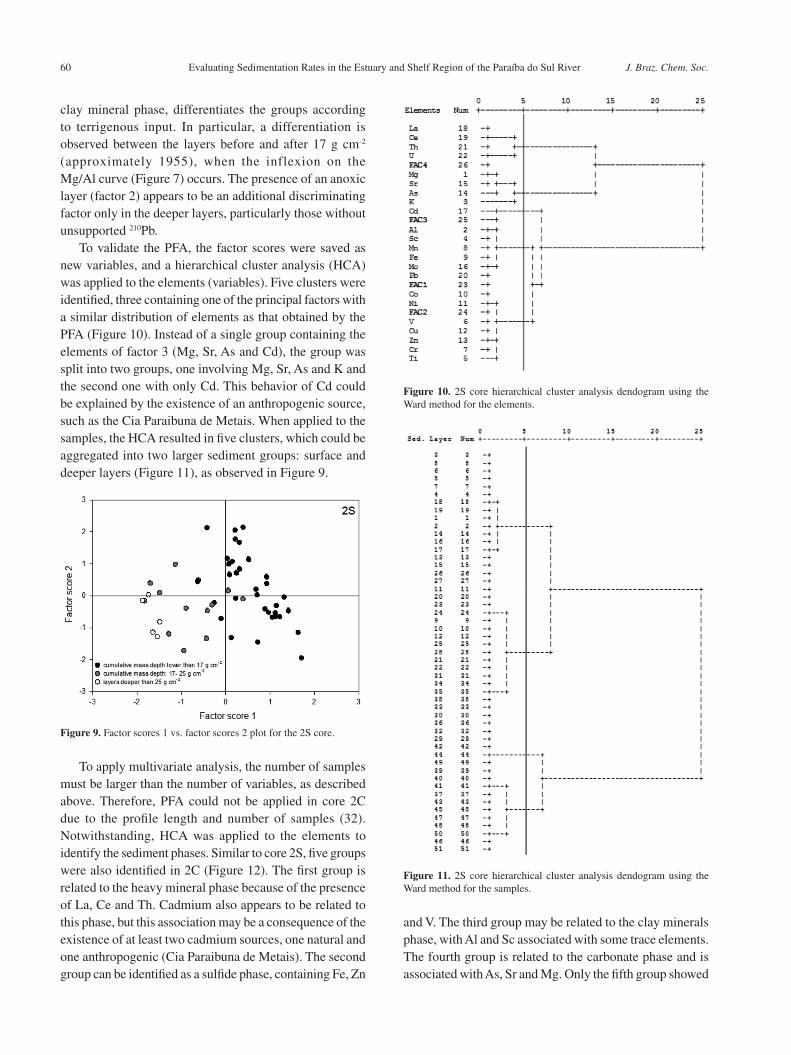
Cadmium and Zn concentrations and Cd and Zn normalized by Al in the 2S profile (Figures 8a and 8b) show similar behavior, with a significant increase after 1980, coincident with the startup of the Cia Paraibuna de Metais. For both metals, a new, higher concentration seems to be reached after the end of the 1980s. These metals were normalized by Al to discriminate the lithogenic origin, where can be observed again similar behavior, increasing after 1980s.
Zinc and Cd show a similar pattern along the 2C sediment core (Figures 8c and 8d), with increasing concentrations after 1940, a peak concentration at the beginning of the 1970s, and decreasing concentrations afterwards. However, as mentioned by Coelho,40 there are no available data pertaining to metal pollution of the PSR system before the second half of the 1970s. Therefore, a
Figure 5. Mass sedimentation rate according to the sediment layer depth and to the age calculated using the CRS model at sampling points (a) 2NN, (b) 4S, (c) 2S and (d) 2C.
Figure 6. Map showing the 210Pbexc inventories represented as circles: the smallest circle represents 0.16 Bq·cm-2, the medium circle represents an average of 0.45 Bq·cm-2 and the larger circle represents an average of 1.0 Bq·cm-2.
Evaluating Sedimentation Rates in the Estuary and Shelf Region of the Paraíba do Sul River J. Braz. Chem. Soc.58
validation of the calculated ages for the 2C sediment core was not feasible.
Elements concentration statistical treatment
Histograms, normal distributions and lognormal distributions were prepared for data analysis. To validate the results, a stepwise linear regression for each element
was conducted to identify outliers (> 3 standard deviations); those elements that could not be significantly predicted by any other element were excluded from the data set. Elements with large numbers of missing values, those with low correlation with all other variables and those with analytical interferences in the ICP-MS technique were also excluded.
In multivariate analysis, it is essential that a data set include an adequate number of samples to obtain reliable results. The degrees of freedom per variable should be at least 30 to obtain reliable results;41 therefore, for the 51 samples from the 2S profile, the maximum number of variables that can be used is 38. To reduce the number of variables, the following additional criteria were applied: a) elements with high concentrations in sea water or very low concentrations in sediments were not used; applying these criteria, B, Ag, Se, Li, Be, Ge, Na, Bi, W, Ga, Rb, Nd, Sb, Ba and Cs were excluded and b) preliminary tests showed that the rare earth elements and Y had a strong correlation among them, building a separate group, and therefore only La and Ce were used. After these criteria were applied, the data set was composed of 51 samples and 22 variables for PFA.
The PFA results show that four factors explain 91.1% of the variability in the data (Table 3). Table 4 shows the
Figure 7. Mg/Al concentration ratio variation with age for the 2S and 2C sediment cores.
Figure 8. Age versus metal concentrations and rates metal/Al for the sediment cores (a) 2S Zn, (b) 2S Cd, (c) 2C Zn and (d) 2C Cd.
Wanderley et al. 59Vol. 25, No. 1, 2014
Varimax rotated factor loading matrix (only factor loadings larger than 0.1 are shown, and those higher than 0.4 are shown in bold), indicating the elements retained in each factor and their communalities in the 2S profile. Each variable’s communality, which represents the fraction of each variable explained by the retained factors, was higher than 79%.
A PFA factor denotes the sediment phase or mineral present with the elements associated with it. Factor 1 is related to the clay mineral phase because of the presence of Fe, Mn and Al. The elements Pb, Mo, Cu and Cr are also associated with the clay phase. The second factor appears
to be related to sulfides. Most likely, these sulfides formed with transition metals, such as Co, Ni and Zn. These metals may be adsorbed by sediments after anthropogenic input, forming sulfides in deeper and anoxic sediment layers. The third factor (associated with Mg, Sr and As) resembles the carbonate phase, which is also present in marine sediments, and has a negative correlation with Cd. The fourth factor is related to heavy minerals, such as monazite, because of the presence of radioactive elements U and Th, the rare earth elements La and Ce, and the elements Al and Sc.
A graph of factor scores from factor 1 versus those from factor 2 was plotted (Figure 9). The first factor, the
Table 3. Total variance explained in the 2S profile
FactorInitial eigenvalue Rotation sum of squared loading
Total Variance / % Cumulative / % Total Variance / % Cumulative / %
1 13.6 62.0 62.0 7.7 34.9 34.9
2 3.5 16.1 78.1 5.6 25.3 60.2
3 1.8 8.2 86.3 3.5 16.0 76.2
4 1.1 4.8 91.1 3.3 14.9 91.1
Table 4. Varimax rotated factor loading matrix for the 2S profile
ElementFactor 1
Clay mineralFactor 2Sulfide
Factor 3Carbonate
Factor 4Heavy mineral
Communality
K -0.92 -0.26 -0.14 - 0.94
Mn 0.81 0.50 - 0.16 0.95
Pb 0.81 0.35 0.36 0.17 0.93
Mo 0.80 0.43 - 0.21 0.87
Fe 0.79 0.53 - 0.18 0.94
Al 0.76 0.39 - 0.47 0.96
V 0.72 0.63 0.25 - 0.98
Cu 0.65 0.63 0.35 0.12 0.95
Sc 0.59 0.49 0.18 0.45 0.83
Co 0.28 0.90 0.17 - 0.92
Ni 0.39 0.88 0.14 - 0.95
Cr 0.51 0.78 0.10 0.17 0.90
Zn 0.53 0.68 0.37 - 0.88
Ti 0.17 0.67 0.59 0.18 0.86
Mg -0.11 -0.14 -0.87 0.31 0.88
As 0.36 - -0.83 - 0.82
Sr -0.49 -0.30 -0.77 - 0.93
Cd 0.48 0.17 0.71 0.12 0.79
U -0.23 -0.20 - 0.90 0.91
La 0.45 0.25 -0.14 0.81 0.94
Ce 0.56 0.30 -0.11 0.74 0.96
Th 0.63 0.22 -0.07 0.71 0.96
Evaluating Sedimentation Rates in the Estuary and Shelf Region of the Paraíba do Sul River J. Braz. Chem. Soc.60
clay mineral phase, differentiates the groups according to terrigenous input. In particular, a differentiation is observed between the layers before and after 17 g cm-2 (approximately 1955), when the inflexion on the Mg/Al curve (Figure 7) occurs. The presence of an anoxic layer (factor 2) appears to be an additional discriminating factor only in the deeper layers, particularly those without unsupported 210Pb.
To validate the PFA, the factor scores were saved as new variables, and a hierarchical cluster analysis (HCA) was applied to the elements (variables). Five clusters were identified, three containing one of the principal factors with a similar distribution of elements as that obtained by the PFA (Figure 10). Instead of a single group containing the elements of factor 3 (Mg, Sr, As and Cd), the group was split into two groups, one involving Mg, Sr, As and K and the second one with only Cd. This behavior of Cd could be explained by the existence of an anthropogenic source, such as the Cia Paraibuna de Metais. When applied to the samples, the HCA resulted in five clusters, which could be aggregated into two larger sediment groups: surface and deeper layers (Figure 11), as observed in Figure 9.
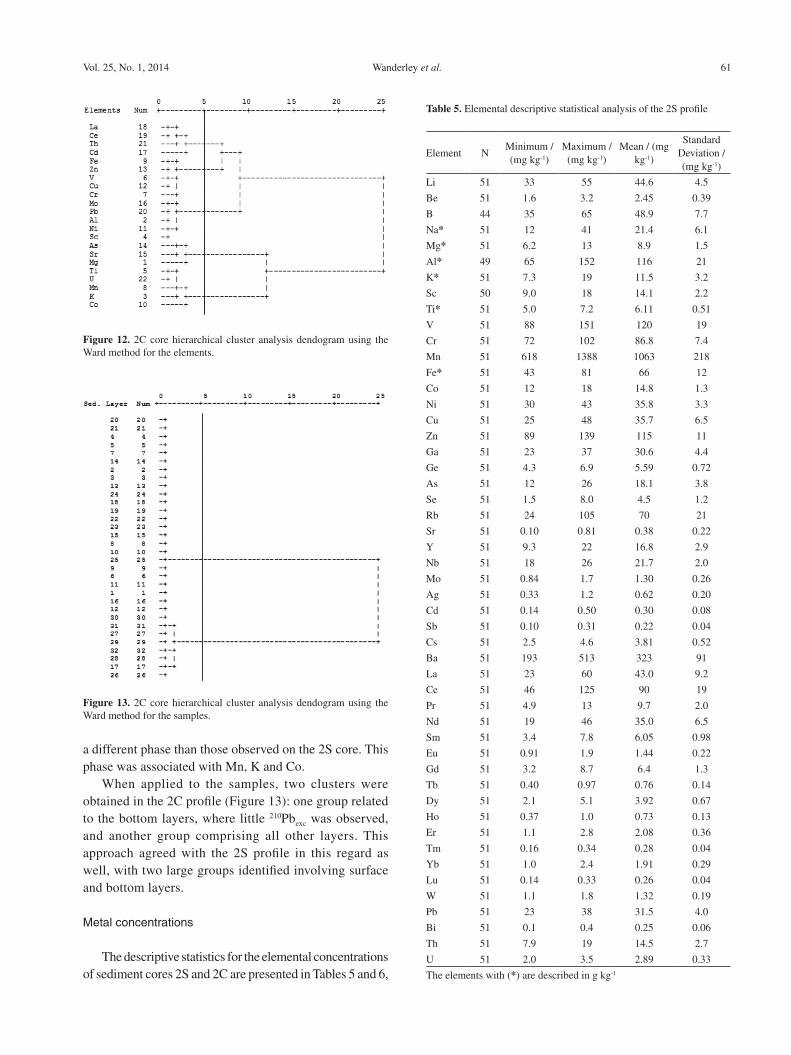
To apply multivariate analysis, the number of samples must be larger than the number of variables, as described above. Therefore, PFA could not be applied in core 2C due to the profile length and number of samples (32). Notwithstanding, HCA was applied to the elements to identify the sediment phases. Similar to core 2S, five groups were also identified in 2C (Figure 12). The first group is related to the heavy mineral phase because of the presence of La, Ce and Th. Cadmium also appears to be related to this phase, but this association may be a consequence of the existence of at least two cadmium sources, one natural and one anthropogenic (Cia Paraibuna de Metais). The second group can be identified as a sulfide phase, containing Fe, Zn
and V. The third group may be related to the clay minerals phase, with Al and Sc associated with some trace elements. The fourth group is related to the carbonate phase and is associated with As, Sr and Mg. Only the fifth group showed
Figure 9. Factor scores 1 vs. factor scores 2 plot for the 2S core.
Figure 10. 2S core hierarchical cluster analysis dendogram using the Ward method for the elements.
Figure 11. 2S core hierarchical cluster analysis dendogram using the Ward method for the samples.
Wanderley et al. 61Vol. 25, No. 1, 2014
a different phase than those observed on the 2S core. This phase was associated with Mn, K and Co.
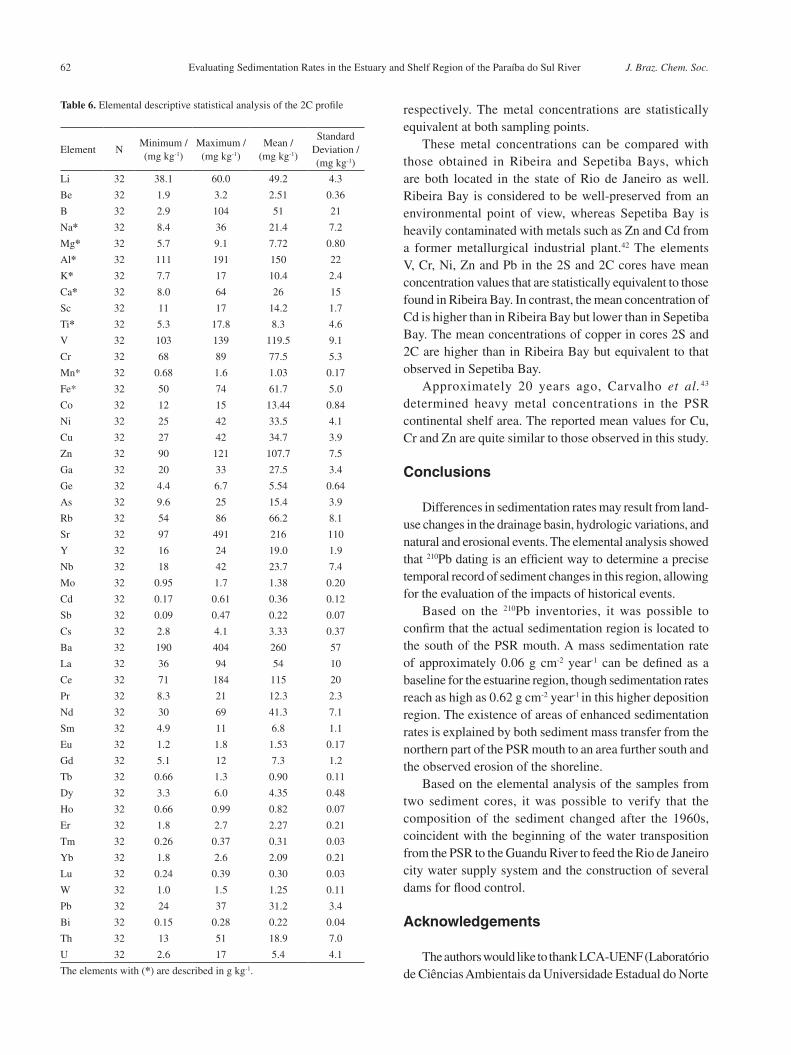
When applied to the samples, two clusters were obtained in the 2C profile (Figure 13): one group related to the bottom layers, where little 210Pbexc was observed, and another group comprising all other layers. This approach agreed with the 2S profile in this regard as well, with two large groups identified involving surface and bottom layers.
Metal concentrations
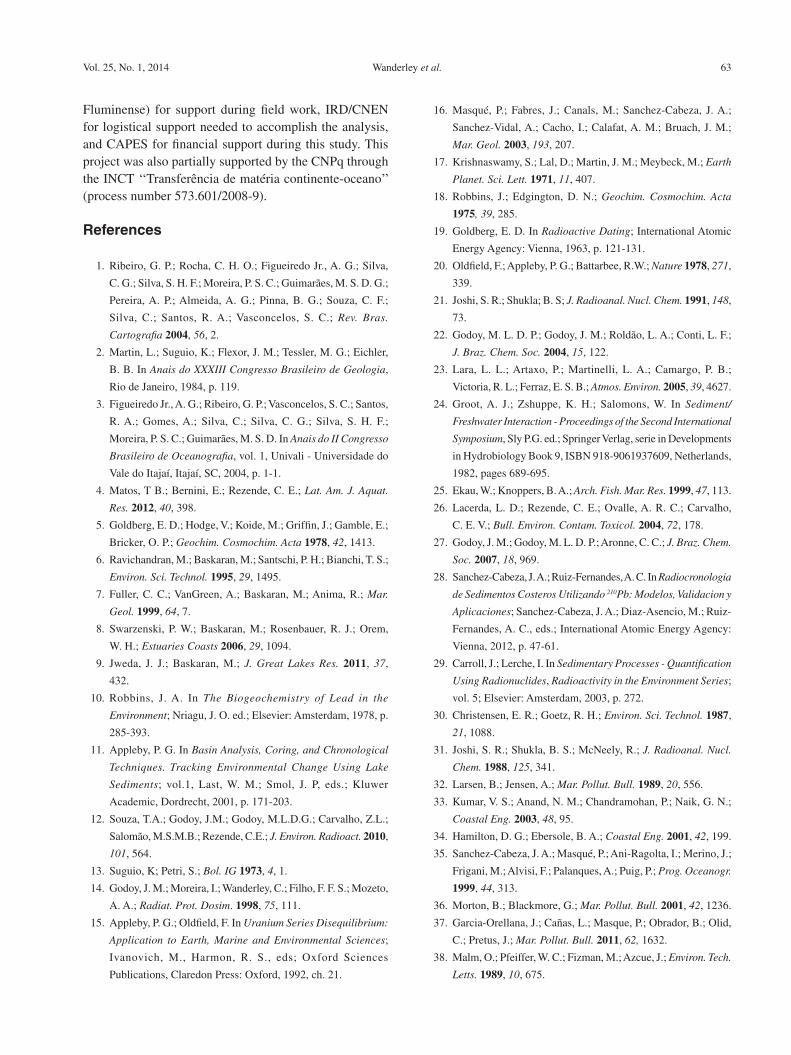
The descriptive statistics for the elemental concentrations of sediment cores 2S and 2C are presented in Tables 5 and 6,
Table 5. Elemental descriptive statistical analysis of the 2S profile
Element NMinimum / (mg kg-1)
Maximum / (mg kg-1)
Mean / (mg kg-1)
Standard Deviation / (mg kg-1)
Li 51 33 55 44.6 4.5
Be 51 1.6 3.2 2.45 0.39
B 44 35 65 48.9 7.7
Na* 51 12 41 21.4 6.1
Mg* 51 6.2 13 8.9 1.5
Al* 49 65 152 116 21
K* 51 7.3 19 11.5 3.2
Sc 50 9.0 18 14.1 2.2
Ti* 51 5.0 7.2 6.11 0.51
V 51 88 151 120 19
Cr 51 72 102 86.8 7.4
Mn 51 618 1388 1063 218
Fe* 51 43 81 66 12
Co 51 12 18 14.8 1.3
Ni 51 30 43 35.8 3.3
Cu 51 25 48 35.7 6.5
Zn 51 89 139 115 11
Ga 51 23 37 30.6 4.4
Ge 51 4.3 6.9 5.59 0.72
As 51 12 26 18.1 3.8
Se 51 1.5 8.0 4.5 1.2
Rb 51 24 105 70 21
Sr 51 0.10 0.81 0.38 0.22
Y 51 9.3 22 16.8 2.9
Nb 51 18 26 21.7 2.0
Mo 51 0.84 1.7 1.30 0.26
Ag 51 0.33 1.2 0.62 0.20
Cd 51 0.14 0.50 0.30 0.08
Sb 51 0.10 0.31 0.22 0.04
Cs 51 2.5 4.6 3.81 0.52
Ba 51 193 513 323 91
La 51 23 60 43.0 9.2
Ce 51 46 125 90 19
Pr 51 4.9 13 9.7 2.0
Nd 51 19 46 35.0 6.5
Sm 51 3.4 7.8 6.05 0.98
Eu 51 0.91 1.9 1.44 0.22
Gd 51 3.2 8.7 6.4 1.3
Tb 51 0.40 0.97 0.76 0.14
Dy 51 2.1 5.1 3.92 0.67
Ho 51 0.37 1.0 0.73 0.13
Er 51 1.1 2.8 2.08 0.36
Tm 51 0.16 0.34 0.28 0.04
Yb 51 1.0 2.4 1.91 0.29
Lu 51 0.14 0.33 0.26 0.04
W 51 1.1 1.8 1.32 0.19
Pb 51 23 38 31.5 4.0
Bi 51 0.1 0.4 0.25 0.06
Th 51 7.9 19 14.5 2.7
U 51 2.0 3.5 2.89 0.33
The elements with (*) are described in g kg-1
Figure 12. 2C core hierarchical cluster analysis dendogram using the Ward method for the elements.
Figure 13. 2C core hierarchical cluster analysis dendogram using the Ward method for the samples.
Evaluating Sedimentation Rates in the Estuary and Shelf Region of the Paraíba do Sul River J. Braz. Chem. Soc.62
respectively. The metal concentrations are statistically equivalent at both sampling points.
These metal concentrations can be compared with those obtained in Ribeira and Sepetiba Bays, which are both located in the state of Rio de Janeiro as well. Ribeira Bay is considered to be well-preserved from an environmental point of view, whereas Sepetiba Bay is heavily contaminated with metals such as Zn and Cd from a former metallurgical industrial plant.42 The elements V, Cr, Ni, Zn and Pb in the 2S and 2C cores have mean concentration values that are statistically equivalent to those found in Ribeira Bay. In contrast, the mean concentration of Cd is higher than in Ribeira Bay but lower than in Sepetiba Bay. The mean concentrations of copper in cores 2S and 2C are higher than in Ribeira Bay but equivalent to that observed in Sepetiba Bay.
Approximately 20 years ago, Carvalho et al.43 determined heavy metal concentrations in the PSR continental shelf area. The reported mean values for Cu, Cr and Zn are quite similar to those observed in this study.
Conclusions
Differences in sedimentation rates may result from land-use changes in the drainage basin, hydrologic variations, and natural and erosional events. The elemental analysis showed that 210Pb dating is an efficient way to determine a precise temporal record of sediment changes in this region, allowing for the evaluation of the impacts of historical events.
Based on the 210Pb inventories, it was possible to confirm that the actual sedimentation region is located to the south of the PSR mouth. A mass sedimentation rate of approximately 0.06 g cm-2 year-1 can be defined as a baseline for the estuarine region, though sedimentation rates reach as high as 0.62 g cm-2 year-1
in this higher deposition region. The existence of areas of enhanced sedimentation rates is explained by both sediment mass transfer from the northern part of the PSR mouth to an area further south and the observed erosion of the shoreline.
Based on the elemental analysis of the samples from two sediment cores, it was possible to verify that the composition of the sediment changed after the 1960s, coincident with the beginning of the water transposition from the PSR to the Guandu River to feed the Rio de Janeiro city water supply system and the construction of several dams for flood control.
Acknowledgements
The authors would like to thank LCA-UENF (Laboratório de Ciências Ambientais da Universidade Estadual do Norte
Table 6. Elemental descriptive statistical analysis of the 2C profile
Element NMinimum / (mg kg-1)
Maximum / (mg kg-1)
Mean / (mg kg-1)
Standard Deviation / (mg kg-1)
Li 32 38.1 60.0 49.2 4.3
Be 32 1.9 3.2 2.51 0.36
B 32 2.9 104 51 21
Na* 32 8.4 36 21.4 7.2
Mg* 32 5.7 9.1 7.72 0.80
Al* 32 111 191 150 22
K* 32 7.7 17 10.4 2.4
Ca* 32 8.0 64 26 15
Sc 32 11 17 14.2 1.7
Ti* 32 5.3 17.8 8.3 4.6
V 32 103 139 119.5 9.1
Cr 32 68 89 77.5 5.3
Mn* 32 0.68 1.6 1.03 0.17
Fe* 32 50 74 61.7 5.0
Co 32 12 15 13.44 0.84
Ni 32 25 42 33.5 4.1
Cu 32 27 42 34.7 3.9
Zn 32 90 121 107.7 7.5
Ga 32 20 33 27.5 3.4
Ge 32 4.4 6.7 5.54 0.64
As 32 9.6 25 15.4 3.9
Rb 32 54 86 66.2 8.1
Sr 32 97 491 216 110
Y 32 16 24 19.0 1.9
Nb 32 18 42 23.7 7.4
Mo 32 0.95 1.7 1.38 0.20
Cd 32 0.17 0.61 0.36 0.12
Sb 32 0.09 0.47 0.22 0.07
Cs 32 2.8 4.1 3.33 0.37
Ba 32 190 404 260 57
La 32 36 94 54 10
Ce 32 71 184 115 20
Pr 32 8.3 21 12.3 2.3
Nd 32 30 69 41.3 7.1
Sm 32 4.9 11 6.8 1.1
Eu 32 1.2 1.8 1.53 0.17
Gd 32 5.1 12 7.3 1.2
Tb 32 0.66 1.3 0.90 0.11
Dy 32 3.3 6.0 4.35 0.48
Ho 32 0.66 0.99 0.82 0.07
Er 32 1.8 2.7 2.27 0.21
Tm 32 0.26 0.37 0.31 0.03
Yb 32 1.8 2.6 2.09 0.21
Lu 32 0.24 0.39 0.30 0.03
W 32 1.0 1.5 1.25 0.11
Pb 32 24 37 31.2 3.4
Bi 32 0.15 0.28 0.22 0.04
Th 32 13 51 18.9 7.0
U 32 2.6 17 5.4 4.1
The elements with (*) are described in g kg-1.
Wanderley et al. 63Vol. 25, No. 1, 2014
Fluminense) for support during field work, IRD/CNEN for logistical support needed to accomplish the analysis, and CAPES for financial support during this study. This project was also partially supported by the CNPq through the INCT ‘‘Transferência de matéria continente-oceano’’ (process number 573.601/2008-9).
References
1. Ribeiro, G. P.; Rocha, C. H. O.; Figueiredo Jr., A. G.; Silva,
C. G.; Silva, S. H. F.; Moreira, P. S. C.; Guimarães, M. S. D. G.;
Pereira, A. P.; Almeida, A. G.; Pinna, B. G.; Souza, C. F.;
Silva, C.; Santos, R. A.; Vasconcelos, S. C.; Rev. Bras.
Cartografia 2004, 56, 2.
2. Martin, L.; Suguio, K.; Flexor, J. M.; Tessler, M. G.; Eichler,
B. B. In Anais do XXXIII Congresso Brasileiro de Geologia,
Rio de Janeiro, 1984, p. 119.
3. Figueiredo Jr., A. G.; Ribeiro, G. P.; Vasconcelos, S. C.; Santos,
R. A.; Gomes, A.; Silva, C.; Silva, C. G.; Silva, S. H. F.;
Moreira, P. S. C.; Guimarães, M. S. D. In Anais do II Congresso
Brasileiro de Oceanografia, vol. 1, Univali - Universidade do
Vale do Itajaí, Itajaí, SC, 2004, p. 1-1.
4. Matos, T B.; Bernini, E.; Rezende, C. E.; Lat. Am. J. Aquat.
Res. 2012, 40, 398.
5. Goldberg, E. D.; Hodge, V.; Koide, M.; Griffin, J.; Gamble, E.;
Bricker, O. P.; Geochim. Cosmochim. Acta 1978, 42, 1413.
6. Ravichandran, M.; Baskaran, M.; Santschi, P. H.; Bianchi, T. S.;
Environ. Sci. Technol. 1995, 29, 1495.
7. Fuller, C. C.; VanGreen, A.; Baskaran, M.; Anima, R.; Mar.
Geol. 1999, 64, 7.
8. Swarzenski, P. W.; Baskaran, M.; Rosenbauer, R. J.; Orem,
W. H.; Estuaries Coasts 2006, 29, 1094.
9. Jweda, J. J.; Baskaran, M.; J. Great Lakes Res. 2011, 37,
432.
10. Robbins, J. A. In The Biogeochemistry of Lead in the
Environment; Nriagu, J. O. ed.; Elsevier: Amsterdam, 1978, p.
285-393.
11. Appleby, P. G. In Basin Analysis, Coring, and Chronological
Techniques. Tracking Environmental Change Using Lake
Sediments; vol.1, Last, W. M.; Smol, J. P, eds.; Kluwer
Academic, Dordrecht, 2001, p. 171-203.
12. Souza, T.A.; Godoy, J.M.; Godoy, M.L.D.G.; Carvalho, Z.L.;
Salomão, M.S.M.B.; Rezende, C.E.; J. Environ. Radioact. 2010,
101, 564.
13. Suguio, K; Petri, S.; Bol. IG 1973, 4, 1.
14. Godoy, J. M.; Moreira, I.; Wanderley, C.; Filho, F. F. S.; Mozeto,
A. A.; Radiat. Prot. Dosim. 1998, 75, 111.
15. Appleby, P. G.; Oldfield, F. In Uranium Series Disequilibrium:
Application to Earth, Marine and Environmental Sciences;
Ivanovich, M., Harmon, R. S., eds; Oxford Sciences
Publications, Claredon Press: Oxford, 1992, ch. 21.
16. Masqué, P.; Fabres, J.; Canals, M.; Sanchez-Cabeza, J. A.;
Sanchez-Vidal, A.; Cacho, I.; Calafat, A. M.; Bruach, J. M.;
Mar. Geol. 2003, 193, 207.
17. Krishnaswamy, S.; Lal, D.; Martin, J. M.; Meybeck, M.; Earth
Planet. Sci. Lett. 1971, 11, 407.
18. Robbins, J.; Edgington, D. N.; Geochim. Cosmochim. Acta
1975, 39, 285.
19. Goldberg, E. D. In Radioactive Dating; International Atomic
Energy Agency: Vienna, 1963, p. 121-131.
20. Oldfield, F.; Appleby, P. G.; Battarbee, R.W.; Nature 1978, 271,
339.
21. Joshi, S. R.; Shukla; B. S; J. Radioanal. Nucl. Chem. 1991, 148,
73.
22. Godoy, M. L. D. P.; Godoy, J. M.; Roldão, L. A.; Conti, L. F.;
J. Braz. Chem. Soc. 2004, 15, 122.
23. Lara, L. L.; Artaxo, P.; Martinelli, L. A.; Camargo, P. B.;
Victoria, R. L.; Ferraz, E. S. B.; Atmos. Environ. 2005, 39, 4627.
24. Groot, A. J.; Zshuppe, K. H.; Salomons, W. In Sediment/
Freshwater Interaction - Proceedings of the Second International
Symposium, Sly P.G. ed.; Springer Verlag, serie in Developments
in Hydrobiology Book 9, ISBN 918-9061937609, Netherlands,
1982, pages 689-695.
25. Ekau, W.; Knoppers, B. A.; Arch. Fish. Mar. Res. 1999, 47, 113.
26. Lacerda, L. D.; Rezende, C. E.; Ovalle, A. R. C.; Carvalho,
C. E. V.; Bull. Environ. Contam. Toxicol. 2004, 72, 178.
27. Godoy, J. M.; Godoy, M. L. D. P.; Aronne, C. C.; J. Braz. Chem.
Soc. 2007, 18, 969.
28. Sanchez-Cabeza, J. A.; Ruiz-Fernandes, A. C. In Radiocronologia
de Sedimentos Costeros Utilizando 210Pb: Modelos, Validacion y
Aplicaciones; Sanchez-Cabeza, J. A.; Diaz-Asencio, M.; Ruiz-
Fernandes, A. C., eds.; International Atomic Energy Agency:
Vienna, 2012, p. 47-61.
29. Carroll, J.; Lerche, I. In Sedimentary Processes - Quantification
Using Radionuclides, Radioactivity in the Environment Series;
vol. 5; Elsevier: Amsterdam, 2003, p. 272.
30. Christensen, E. R.; Goetz, R. H.; Environ. Sci. Technol. 1987,
21, 1088.
31. Joshi, S. R.; Shukla, B. S.; McNeely, R.; J. Radioanal. Nucl.
Chem. 1988, 125, 341.
32. Larsen, B.; Jensen, A.; Mar. Pollut. Bull. 1989, 20, 556.
33. Kumar, V. S.; Anand, N. M.; Chandramohan, P.; Naik, G. N.;
Coastal Eng. 2003, 48, 95.
34. Hamilton, D. G.; Ebersole, B. A.; Coastal Eng. 2001, 42, 199.
35. Sanchez-Cabeza, J. A.; Masqué, P.; Ani-Ragolta, I.; Merino, J.;
Frigani, M.; Alvisi, F.; Palanques, A.; Puig, P.; Prog. Oceanogr.
1999, 44, 313.
36. Morton, B.; Blackmore, G.; Mar. Pollut. Bull. 2001, 42, 1236.
37. Garcia-Orellana, J.; Cañas, L.; Masque, P.; Obrador, B.; Olid,
C.; Pretus, J.; Mar. Pollut. Bull. 2011, 62, 1632.
38. Malm, O.; Pfeiffer, W. C.; Fizman, M.; Azcue, J.; Environ. Tech.
Letts. 1989, 10, 675.

Evaluating Sedimentation Rates in the Estuary and Shelf Region of the Paraíba do Sul River J. Braz. Chem. Soc.64
39. Lacerda, L. D.; Carvalho, C. E. V.; Rezende, C. E.; Pfeiffer,
W. C.; Mar. Pollut. Bull. 1993, 26, 220.
40. Coelho, V. In Paraíba do Sul, um Rio Estratégico, 1a ed.; Casa
da Palavra: Rio de Janeiro, 2012, p. 336.
41. Henry, R. C.; Lewis, C. W.; Hopke, P. K.; Williamson, H. J.;
Atmos. Environ. 1984, 18, 1507.
42. Gomes, F. C.; Godoy, J. M.; Godoy, M. L. D. P.; Carvalho,
Z. L.; Lopes, R. T.; Sanchez-Cabeza, J. A.; Lacerda, L. D.;
Wasserman, J. C.; Mar. Pollut. Bull. 2009, 59, 123.
43. Carvalho, C. E. V.; Salomão, M. S. M. B.; Molisani, M. M.;
Rezende, C. E.; Lacerda, L. D.; Sci. Total Environ. 2002, 284,
85.
Submitted: May 5, 2013
Published online: November 13, 2013