Embed Size (px)
Citation preview

1
結構防振液流阻尼器之研發及應用研討會 (95.2.11)實驗案例
Shaking Table Test of Full Scale Structure Controlled with Fluid Dampers
(EASEC-9, Bali, Indonesia, 2003.12.16-18, ppVID1-7)
Deh-Shiu Hsu, Yung-Feng Lee, Guan-Kai Wang and Chien-Yaun Hou
Department of Civil EngineeringNational Cheng Kung University
Tainan, Taiwan, R.O.C

2
Efforts for produce fluid dampers in Taiwan:
• Performance test for the devices: small scale, full scale
• Shaking table structural test : model structures, full scale structures

3
Prototype of the damper
Fig.1

4
Test installation for cyclic dynamic
performance test
data acquisition system
Pumping system
load cell damper actuator
Fig.2

5
Benchmark structure installed with fluid dampers —prepared for shaking table test
Height : 3.0m in each story
Span : 4.5m×3.0m
Column : H200×204×12×12
Beam : H200×150×6×9
length of damper : 1.077m
linked member : 2.85m steel tube
dampers are linked in diagonal
direction with pin joints at corner
of the 4.5m spans.
Fig.3
6
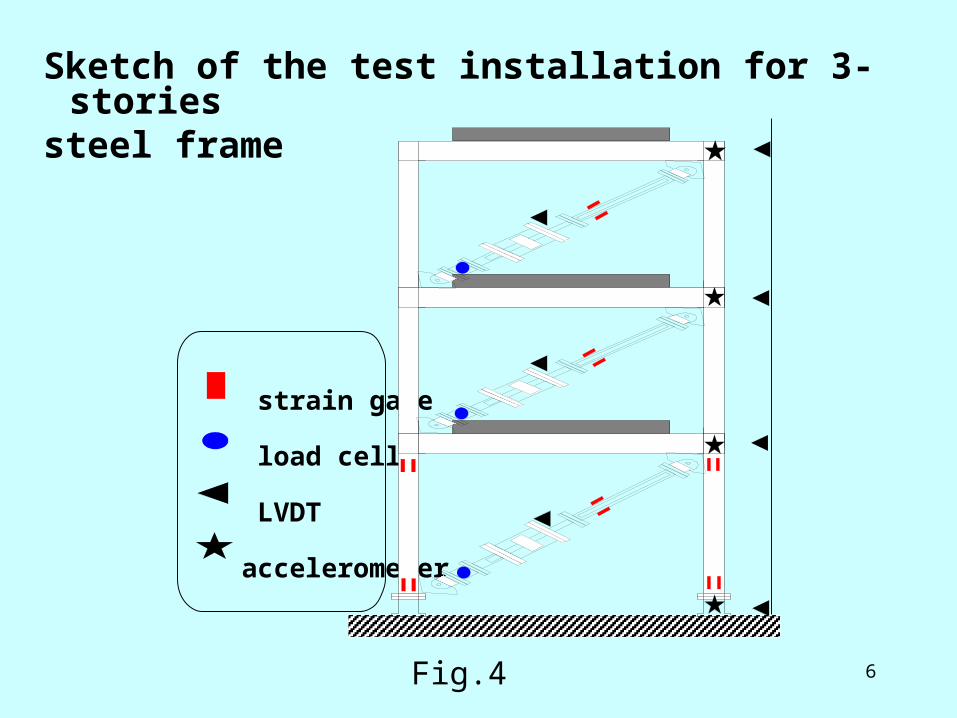
Sketch of the test installation for 3-stories steel frame
strain gage
load cell
LVDT
accelerometer
Fig.4

7
Physical properties of dampers are detected by cyclic dynamic test.
Damper number
C1 C2 C3 C4 C5 C6
C(kN*s/mm) 0.25 0.8 1.0 1.3 1.8 3
K(kN/mm) 0.4 0.9 2.0 2.5 4 10
Table 1

8
Hysteresis loop of C1 to C6 dampers

9
Earthquake damper various installation
installed
test cases:
1.PGA 300gal El Centro (May,1940)
2. PGA 800gal
JiJi (Sept,1999)
1. C1
2. C2
3. C3
4. C4
5. C5
6. C6
1. Dampers are installed at the lst floor only.
2. Dampers are installed at the lst and 2nd floors.
3. Dampers are installed at the lst and 3rd floors.
4. Damper are installed at all of the three floors.
Fig.6 totally 48 cases.

10
Earthquake excitations:
(a) 1940, EL Centro , 300gal (b) 1999, JiJi EQ, 800gal
Fig.7

11
Table 2
Test Results : responses of the benchmark structure (without damper installed)
EQ PGA(gal) 1st floor 2nd floor 3rd floor
floor displacement
(mm)
EL Centro 300 44.17 82.9 110.9
JiJi 800 49.3 77.1 104.8
floor acceleration
(g)
EL Centro 300 0.44 0.49 0.67
JiJi 800 0.93 0.66 0.96
column base shear (kN)
EL Centro 300 36.8
JiJi 800 43.4
axial force of S-column (kN)
EL Centro 300 89.1
JiJi 800 83.8
axial force of N-column (k
N)
EL Centro 300 89.1
JiJi 800 83.8

12
Table 3
Test Results : Displacement and its control efficiency when C1 damper is installed
floorfloor installed with damper
EL Centro 300 gal JiJi 800 gal
displacement(mm)
control efficiency (%)
displacement(mm)
control efficiency (%)
1
1F 23.4 47 35.5 28
1,3F 20.2 54 32.3 35
1,2F 14.7 66 28.6 42
1,2,3F 15.0 66 23.6 52
2
1F 47.4 43 67.6 12
1,3F 43.2 48 61.9 20
1,2F 29.6 64 52.4 32
1,2,3F 27.3 67 42.3 45
3
1F 68.3 38 84.1 20
1,3F 55.2 50 78.5 25
1,2F 42.8 61 63.4 39
1,2,3F 35.0 68 53.5 49
13
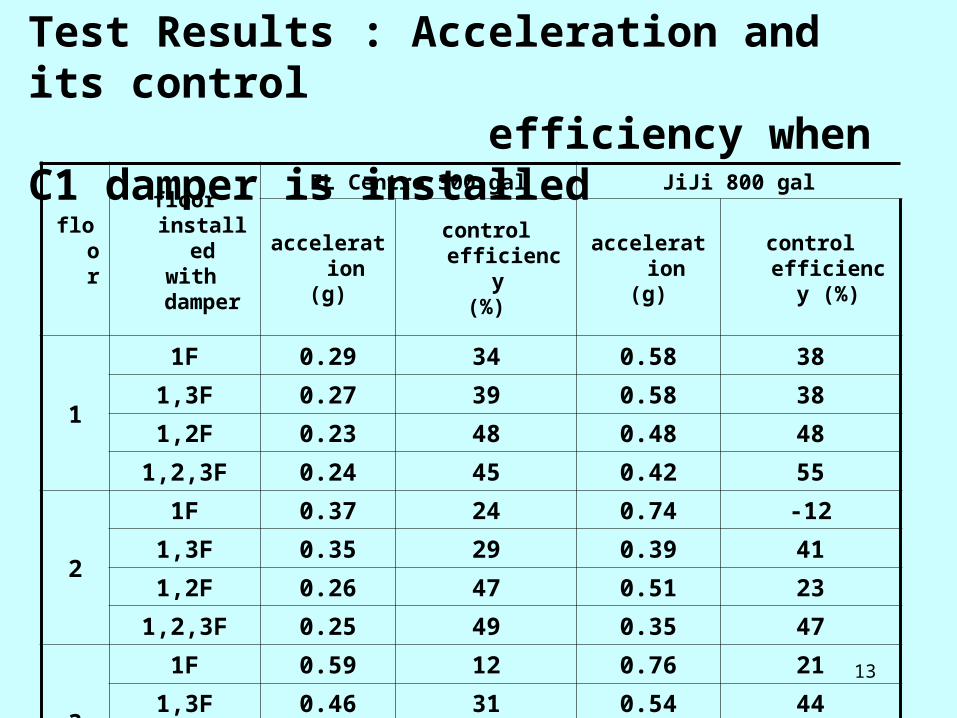
Table 4
Test Results : Acceleration and its control efficiency when C1 damper is installed
floorfloor installed with damper
EL Centro 300 gal JiJi 800 gal
acceleration(g)
control efficiency (%)
acceleration(g)
control efficiency (%)
1
1F 0.29 34 0.58 38
1,3F 0.27 39 0.58 38
1,2F 0.23 48 0.48 48
1,2,3F 0.24 45 0.42 55
2
1F 0.37 24 0.74 -12
1,3F 0.35 29 0.39 41
1,2F 0.26 47 0.51 23
1,2,3F 0.25 49 0.35 47
3
1F 0.59 12 0.76 21
1,3F 0.46 31 0.54 44
1,2F 0.40 40 0.72 25
1,2,3F 0.32 52 0.47 51

14
Table 5 Test Results : Shear force and max. axial force with its control efficiency of the column at 1st floor when C1 damper is installed
floor installed with damper
EL Centro 300 gal JiJi 800 gal
Maximum(k N)
control efficiency (%)
Maximum(kN)
control efficiency (%)
Column shear force
1F 21.17 43 31.24 28
1,3F 18.36 50 27.80 36
1,2F 12.90 65 25.30 42
1,2,3F 13.30 64 21.26 51
Axial force in S-column
1F 62.96 29 72.30 14
1,3F 57.70 35 69.50 17
1,2F 45.10 49 69.20 17
1,2,3F 42.20 53 64.40 23
Axial force in N-column
1F 70.80 21 87.80 -3
1,3F 60.00 33 83.60 2
1,2F 52.20 41 75.30 12
1,2,3F 51.03 43 71.80 16
15
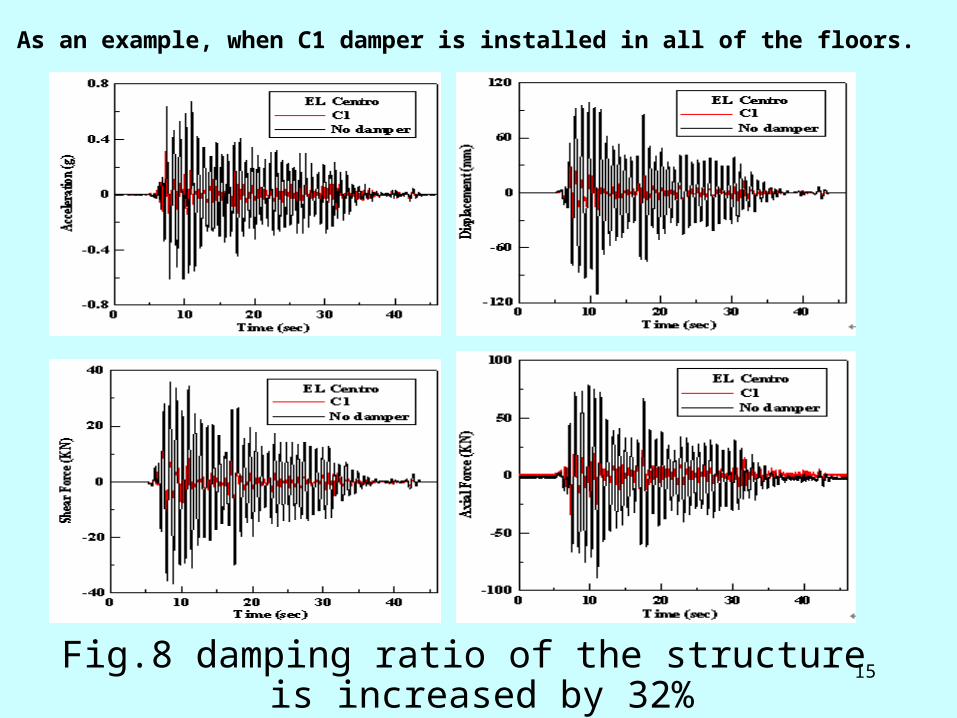
As an example, when C1 damper is installed in all of the floors.
Fig.8 damping ratio of the structure is increased by 32%
16
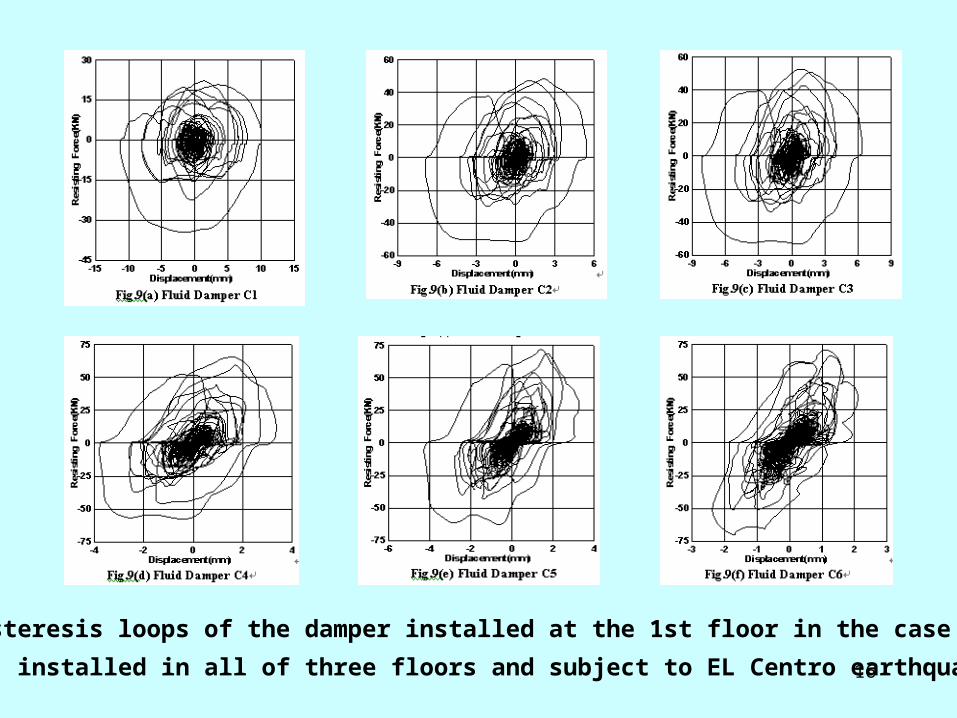
Fig.9 Hysteresis loops of the damper installed at the 1st floor in the case of damper
installed in all of three floors and subject to EL Centro earthquake.

17
Fig.10 Hysteresis loops of the damper installed at the 1st floor in the case of
damper installed in all of three floors and subject to JiJi earthquake.

18
Numerical analysis: (selected example)Numerical analysis by software package SAP2000N isalso performed and then compared to the test data.
Fig.11 Comparison of theoretical and experimental results.

19
Conclusions:
• In order to develop the potential of locally product dampers, research is needed and many of tests have to be taken to fulfill the needs of design requirements and to guarantee the quality of the products. What we have done in Taiwan do have enriching the confidence to introduce the technique to construction and designing engineers.

20
• Carefully seismic design is very much needed before the aseismatic engineering measures are executed. Static and dynamic properties of energy dissipation devices should be very well understood. In addition, the location, as well as the number of damper intended to be installed should be analysed and designed in detail before the control system is applied to the real project. Here is an example which negative control result is obtained.
21
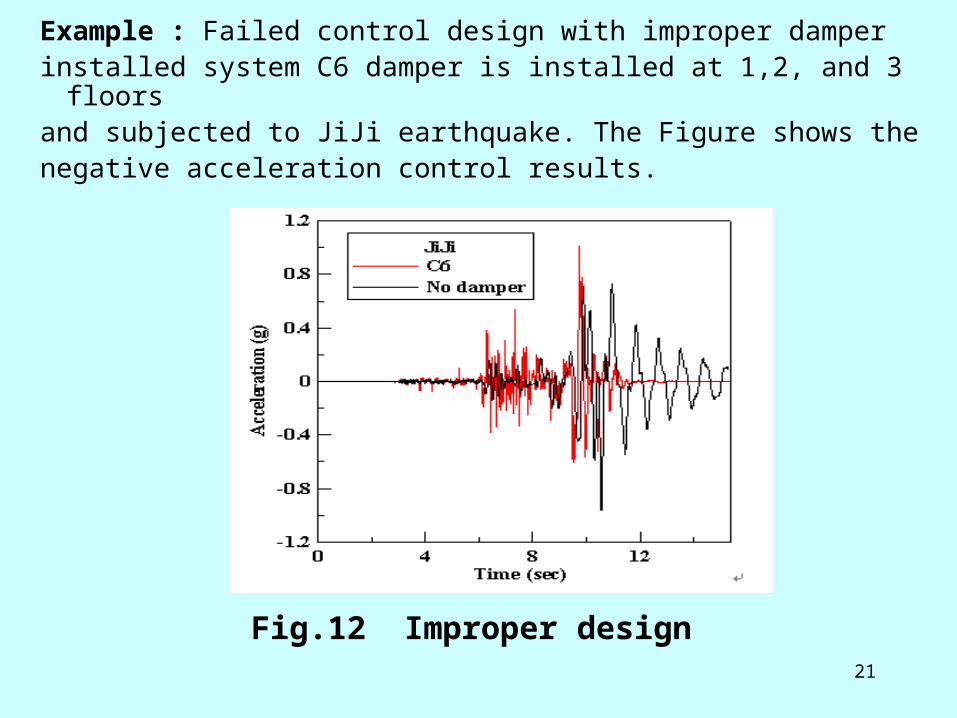
Example : Failed control design with improper damperinstalled system C6 damper is installed at 1,2, and 3 floors and subjected to JiJi earthquake. The Figure shows the negative acceleration control results.
Fig.12 Improper design

22
Thanks for attention!