Embed Size (px)
Citation preview

1
Energy Poverty and Household Wellbeing
Atlantic City Electric / Delmarva Power Agency SummitOctober 5, 2005
Donnell ButlerDavid Carroll
Carrie-Ann Ferraro

2
Organization of Presentation
• Introduction – 5 minutes
• State Analysis – 20 minutes
• Metropolitan Area Discussion – 5 minutes
• Local Area Analysis – 10 minutes
• Indicators of Wellbeing – 10 minutes
• Conclusion – 5 minutes
• Questions / Feedback – 5 minutes
3
Purpose of the Presentation
• Furnish information about the energy needs of low-income households in DE, NJ, MD, and VA to policymakers and program managers
• Explore the linkages among energy poverty and household wellbeing
• Demonstrate how existing data sources can be used to obtain useful information for policy formulation and program design

4
State Level Analysis
Methodology

5
State Information Needs
• Policymakers and program managers need:– State-level cross-sectional data to understand
current status for households in the state– State-level longitudinal data to understand trends
for households in the state– National-level data to understand how those
state-level energy needs compare to households nationwide

6
State-Level Data Sources • 2000 Census Public-Use Microdata (PUMS)
– Data available includes:• Household Demographics: income and poverty level,
presence of vulnerable members, race and ethnicity, languages spoken, household composition, employment, income program participation
• Housing Unit Characteristics: age of unit, unit type, home ownership
• Energy Data: Main heating fuel, energy expenditures
7
State-Level Data Sources• 2002-2004 Current Population Survey, Annual Social and
Economic Supplement (ASEC)
– Statistical variances are too large for a single ASEC annual file to allow for a useful analysis for a single state.
– Three-year average of 2002, 2003, and 2004 data used to estimate the FY 2003 LIHEAP eligible population
– Data available includes:• Household Demographics: income and poverty level, presence of
vulnerable members, race and ethnicity, household composition, employment, income program participation
8
Definitions
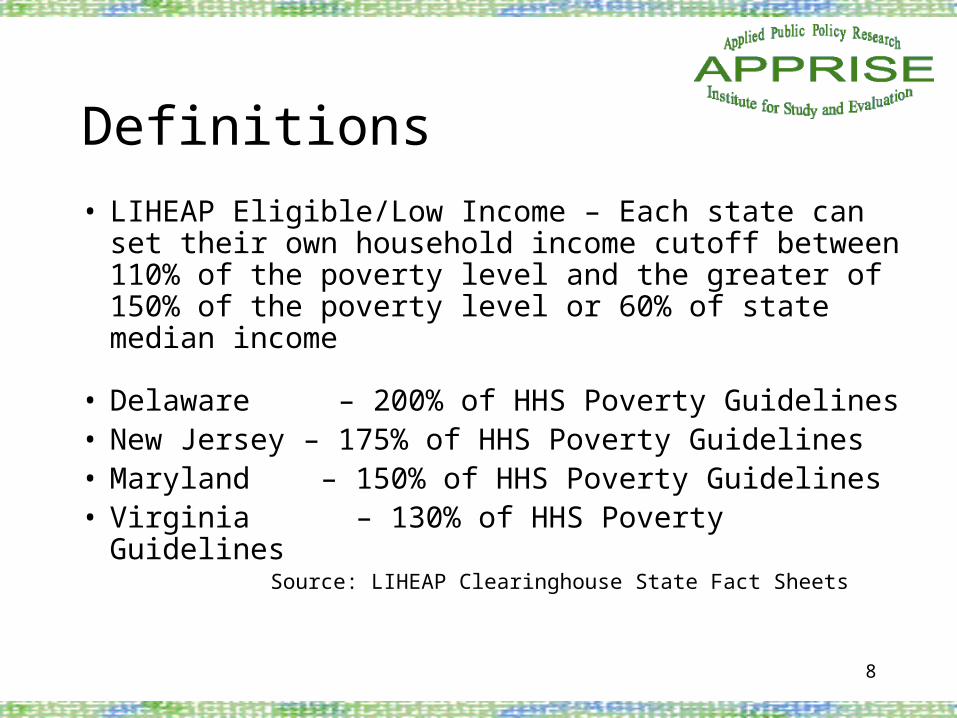
• LIHEAP Eligible/Low Income – Each state can set their own household income cutoff between 110% of the poverty level and the greater of 150% of the poverty level or 60% of state median income
• Delaware – 200% of HHS Poverty Guidelines• New Jersey – 175% of HHS Poverty Guidelines• Maryland – 150% of HHS Poverty Guidelines• Virginia – 130% of HHS Poverty Guidelines
Source: LIHEAP Clearinghouse State Fact Sheets
9
Definitions
• Energy Burden – Direct energy expenditures as a share of gross money income
• Energy Gap – Difference between client energy burden and any target burden
10
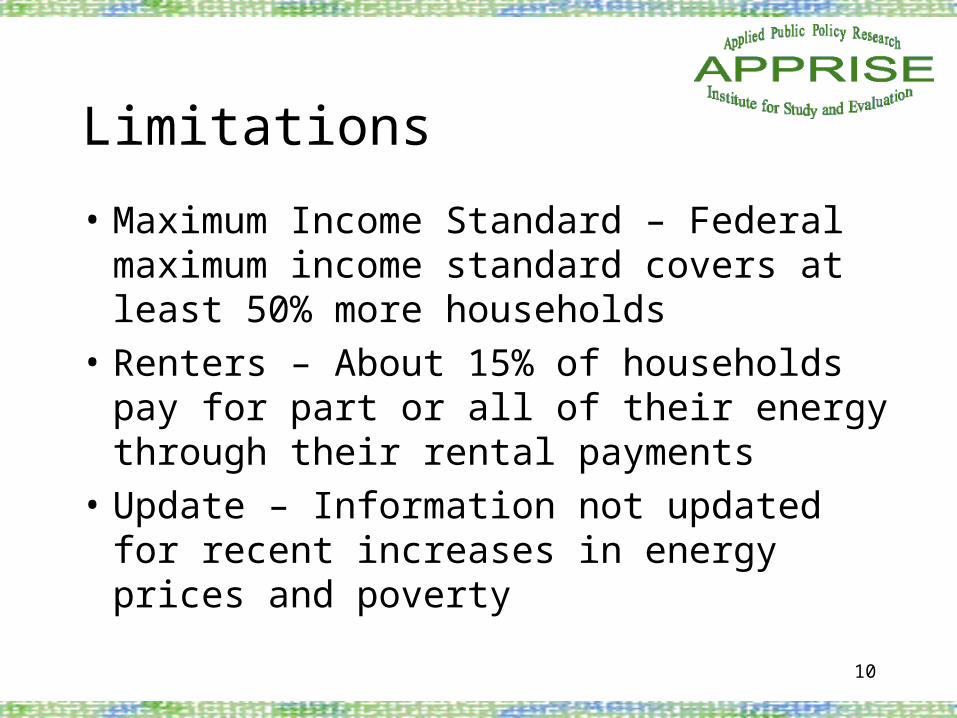
Limitations
• Maximum Income Standard – Federal maximum income standard covers at least 50% more households
• Renters – About 15% of households pay for part or all of their energy through their rental payments
• Update – Information not updated for recent increases in energy prices and poverty

11
State Level Analysis
Findings

12
Number of Households
Percent of All DE Households
LIHEAP Eligible Households, 2000 63,4581 21.3%
LIHEAP Eligible Households, 2003 68,7052 21.8%
Delaware LIHEAP Eligible Households (2000 and 2003)
1 Source: 2000 Decennial Census PUMS 5 Percent Sample.2 Source: Three-year Average of the CPS ASEC 2002-2004.
Delaware LIHEAP Eligible Population
13
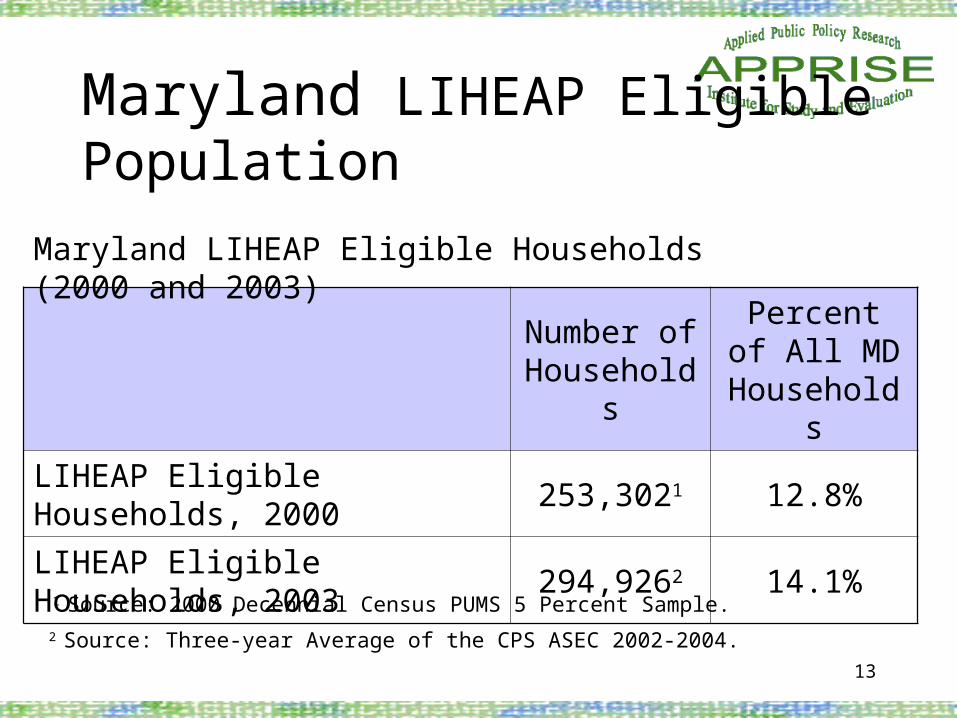
Number of Households
Percent of All MD
Households
LIHEAP Eligible Households, 2000 253,3021 12.8%
LIHEAP Eligible Households, 2003 294,9262 14.1%
Maryland LIHEAP Eligible Households (2000 and 2003)
1 Source: 2000 Decennial Census PUMS 5 Percent Sample. 2 Source: Three-year Average of the CPS ASEC 2002-2004.
Maryland LIHEAP Eligible Population
14
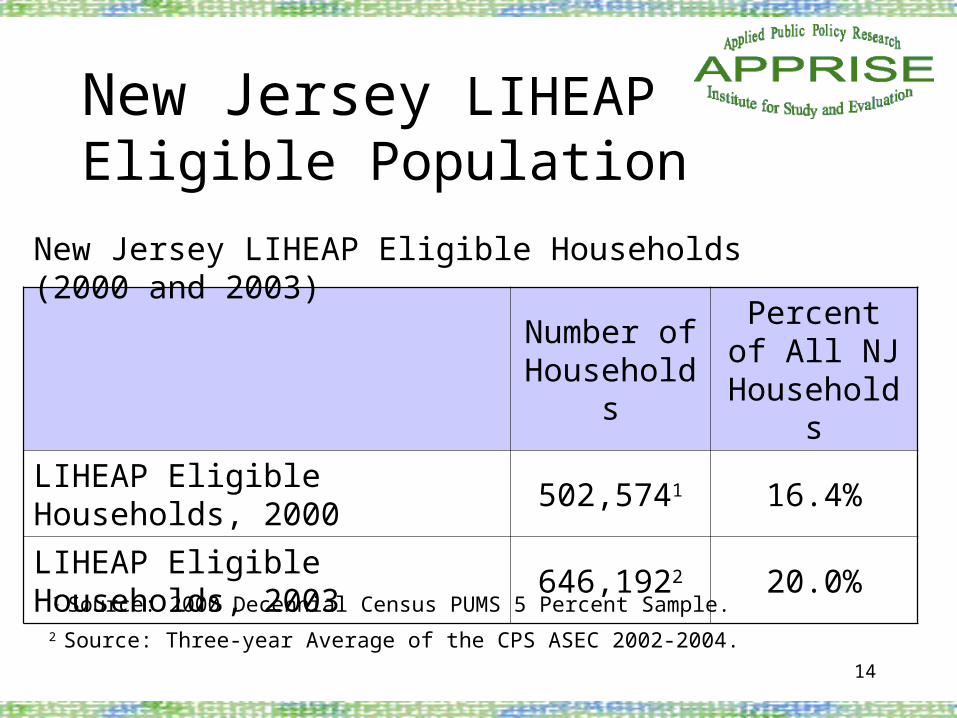
Number of Households
Percent of All NJ
Households
LIHEAP Eligible Households, 2000 502,5741 16.4%
LIHEAP Eligible Households, 2003 646,1922 20.0%
New Jersey LIHEAP Eligible Households (2000 and 2003)
1 Source: 2000 Decennial Census PUMS 5 Percent Sample. 2 Source: Three-year Average of the CPS ASEC 2002-2004.
New Jersey LIHEAP Eligible Population

15
Number of Households
Percent of All VA
Households
LIHEAP Eligible Households, 2000 343,1531 12.7%
LIHEAP Eligible Households, 2003 364,9852 13.0%
Virginia LIHEAP Eligible Households (2000 and 2003)
1 Source: 2000 Decennial Census PUMS 5 Percent Sample. 2 Source: Three-year Average of the CPS ASEC 2002-2004.
Virginia LIHEAP Eligible Population
16
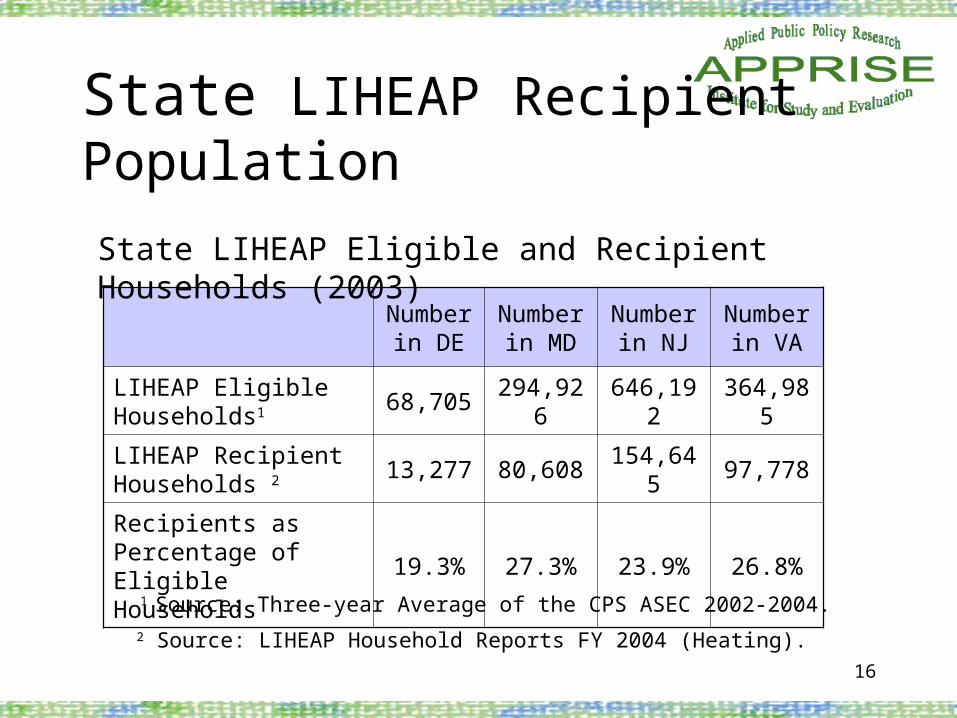
Number in DE
Number in MD
Number in NJ
Number in VA
LIHEAP Eligible Households1 68,705 294,926 646,192 364,985
LIHEAP Recipient Households 2 13,277 80,608 154,645 97,778
Recipients as Percentage of Eligible Households
19.3% 27.3% 23.9% 26.8%
State LIHEAP Eligible and Recipient Households (2003)
1 Source: Three-year Average of the CPS ASEC 2002-2004. 2 Source: LIHEAP Household Reports FY 2004 (Heating).
State LIHEAP Recipient Population

17
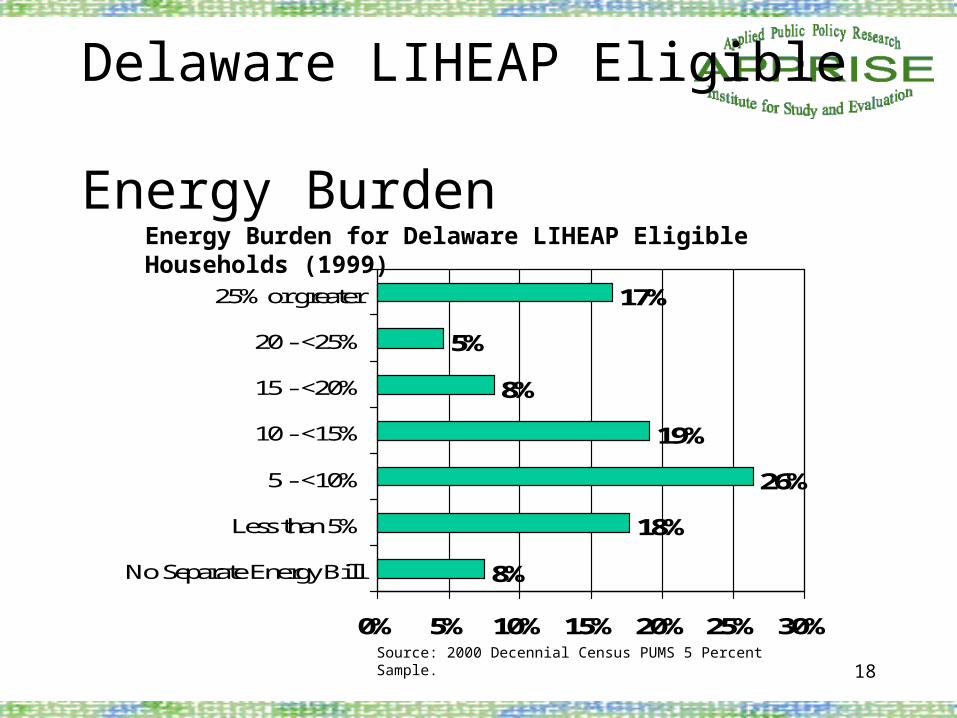
Energy Burden
• Percent of total household income spent on total residential energy.
• At the national level, the median residential energy burden was 3 percent for all households and 10 percent for all low-income households in 2003.
18
Delaware LIHEAP Eligible Energy Burden
8%
18%
26%
19%
8%
5%
17%
0% 5% 10% 15% 20% 25% 30%
No Separate Energy Bill
Less than 5%
5 - <10%
10 - <15%
15 - <20%
20 - <25%
25% or greater
Energy Burden for Delaware LIHEAP Eligible Households (1999)
Source: 2000 Decennial Census PUMS 5 Percent Sample.

19
Maryland LIHEAP Eligible Energy Burden
17%
13%
18%
15%
9%
5%
22%
0% 5% 10% 15% 20% 25%
No Separate Energy Bill
Less than 5%
5 - <10%
10 - <15%
15 - <20%
20 - <25%
25% or greater
Energy Burden for Maryland LIHEAP Eligible Households (1999)
Source: 2000 Decennial Census PUMS 5 Percent Sample.

20
New Jersey LIHEAP Eligible Energy Burden
14%
19%
20%
15%
8%
5%
20%
0% 5% 10% 15% 20% 25%
No Separate Energy Bill
Less than 5%
5 - <10%
10 - <15%
15 - <20%
20 - <25%
25% or greater
Energy Burden for New Jersey LIHEAP Eligible Households (1999)
Source: 2000 Decennial Census PUMS 5 Percent Sample.

21
Virginia LIHEAP Eligible Energy Burden
11%
10%
19%
17%
12%
7%
24%
0% 5% 10% 15% 20% 25% 30%
No Separate Energy Bill
Less than 5%
5 - <10%
10 - <15%
15 - <20%
20 - <25%
25% or greater
Energy Burden for Virginia LIHEAP Eligible Households (1999)
Source: 2000 Decennial Census PUMS 5 Percent Sample.

22
Energy Gap
• The dollar amount needed to reduce a customer’s energy burden to an amount equal to a specified energy burden percentage.
• At the national level, about $4.9 billion dollars in energy assistance would have been needed to ensure that no low-income household spent more than 15% of income on residential energy in 2003. The amount required to reduce residential energy bills to 25% of income was $2.7 billion.

23
Delaware LIHEAP Eligible Energy GapEnergy Gap for Delaware LIHEAP Eligible Households (1999)
Number of Households
Energy Gap(in Millions)
Households with Energy Burdens Greater than 5%
47,740 $ 52 M
Households with Energy Burdens Greater than 10%
31,103 $ 29 M
Households with Energy Burdens Greater than 25%
11,286 $ 10 M
Source: 2000 Decennial Census PUMS 5 Percent Sample.

24
Maryland LIHEAP Eligible Energy GapEnergy Gap for Maryland LIHEAP Eligible Households (1999)
Number of Households
Energy Gap(in Millions)
Households with Energy Burdens Greater than 5%
181,687 $ 199 M
Households with Energy Burdens Greater than 10%
136,109 $ 131 M
Households with Energy Burdens Greater than 25%
62,935 $ 60 M
Source: 2000 Decennial Census PUMS 5 Percent Sample.

25
New Jersey LIHEAP Eligible Energy GapEnergy Gap for New Jersey LIHEAP Eligible Households (1999)
Number of Households
Energy Gap(in Millions)
Households with Energy Burdens Greater than 5%
345,296 $ 406 M
Households with Energy Burdens Greater than 10%
247,843 $ 257 M
Households with Energy Burdens Greater than 25%
109,890 $ 110 M
Source: 2000 Decennial Census PUMS 5 Percent Sample.

26
Virginia LIHEAP Eligible Energy GapEnergy Gap for Virginia LIHEAP Eligible Households (1999)
Number of Households
Energy Gap(in Millions)
Households with Energy Burdens Greater than 5%
274,578 $ 278 M
Households with Energy Burdens Greater than 10%
208,273 $ 184 M
Households with Energy Burdens Greater than 25%
89,216 $ 81 M
Source: 2000 Decennial Census PUMS 5 Percent Sample.

27
DelawareEnergy Assistance
Energy Gap(in Millions) 1
FY ’04LIHEAPBenefits 2
FY ’04SupplementResources 3
Shortfall
Households with Energy Burdens Greater than 5%
$ 52 M $ 5 M $ 1 M $ 46 M
Households with Energy Burdens Greater than 10%
$ 29 M $ 5 M $ 1 M $ 23 M
Households with Energy Burdens Greater than 25%
$ 10 M $ 5 M $ 1 M $ 4 M
1 2000 Decennial Census PUMS 5 Percent Sample.2 FY 2004 LIHEAP Grantee Survey for FY 2004. 3 LIHEAP Clearinghouse: http://www.liheap.ncat.org/Supplements/2004/supplement04.htm

28
MarylandEnergy Assistance
Energy Gap(in Millions) 1
FY ’04LIHEAPBenefits 2
FY ’04SupplementResources 3
Shortfall
Households with Energy Burdens Greater than 5%
$ 199 M $ 30 M $ 48 M $ 121 M
Households with Energy Burdens Greater than 10%
$ 131 M $ 30 M $ 48 M $ 54 M
Households with Energy Burdens Greater than 25%
$ 60 M $ 30 M $ 48 M ($ 17) M
1 2000 Decennial Census PUMS 5 Percent Sample.2 FY 2004 LIHEAP Grantee Survey for FY 2004. 3 LIHEAP Clearinghouse: http://www.liheap.ncat.org/Supplements/2004/supplement04.htm

29
New JerseyEnergy Assistance
Energy Gap(in Millions) 1
FY ’04LIHEAPBenefits 2
FY ’04SupplementResources 3
Shortfall
Households with Energy Burdens Greater than 5%
$ 406 M $ 72 M $ 175 M $ 159 M
Households with Energy Burdens Greater than 10%
$ 257 M $ 72 M $ 175 M $ 9 M
Households with Energy Burdens Greater than 25%
$ 110 M $ 72 M $ 175 M ($ 137) M
1 2000 Decennial Census PUMS 5 Percent Sample.2 FY 2004 LIHEAP Grantee Survey for FY 2004. 3 LIHEAP Clearinghouse: http://www.liheap.ncat.org/Supplements/2004/supplement04.htm
30
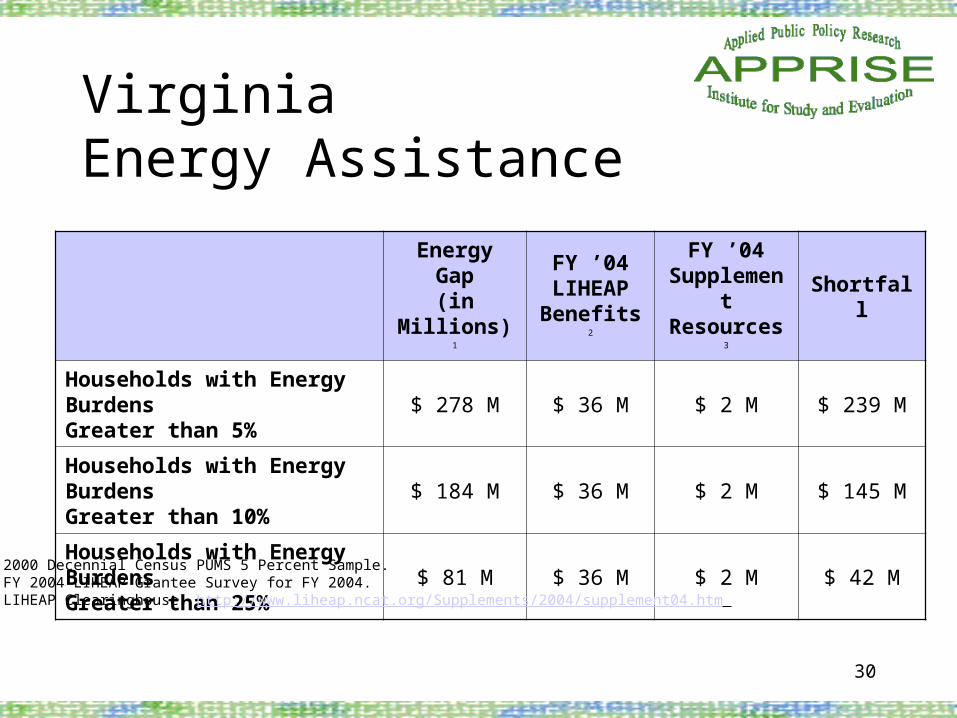
VirginiaEnergy Assistance
Energy Gap(in Millions) 1
FY ’04LIHEAPBenefits 2
FY ’04SupplementResources 3
Shortfall
Households with Energy Burdens Greater than 5%
$ 278 M $ 36 M $ 2 M $ 239 M
Households with Energy Burdens Greater than 10%
$ 184 M $ 36 M $ 2 M $ 145 M
Households with Energy Burdens Greater than 25%
$ 81 M $ 36 M $ 2 M $ 42 M
1 2000 Decennial Census PUMS 5 Percent Sample.2 FY 2004 LIHEAP Grantee Survey for FY 2004. 3 LIHEAP Clearinghouse: http://www.liheap.ncat.org/Supplements/2004/supplement04.htm

31
• Across all states– Increases in LIHEAP eligible population– LIHEAP participation rate below 28% of eligible
population– Approximately half of LIHEAP eligible have energy
burdens greater than 10 percent.– Combination of federal and state-level funds not
enough to ensure that no LIHEAP eligible household spends more than 10% of income on energy.
State LIHEAP EligibleSummary of Findings
32
Metropolitan Area Discussion
Methodology

33
Metropolitan Area Information Needs
• Metropolitan area policymakers & program managers need:
– Information related to demographic characteristics and energy needs of low-income households
– Information on the relationship between energy needs and other low-income needs, including housing, to promote the integration of programs aimed at assisting low-income households
34
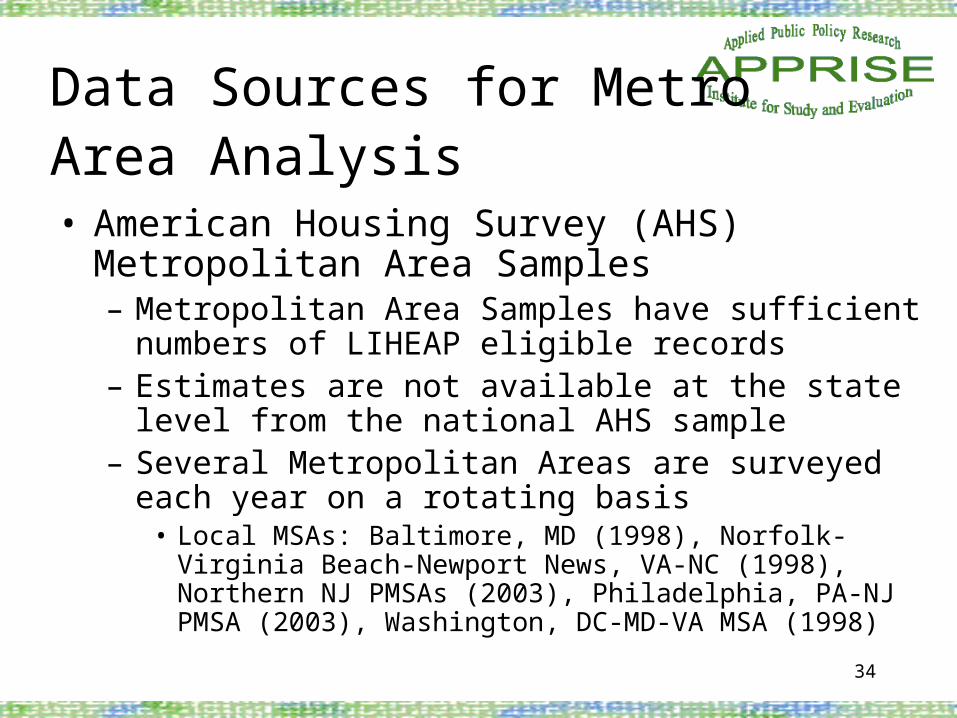
Data Sources for Metro Area Analysis • American Housing Survey (AHS) Metropolitan Area
Samples– Metropolitan Area Samples have sufficient numbers of
LIHEAP eligible records – Estimates are not available at the state level from the national
AHS sample– Several Metropolitan Areas are surveyed each year on a
rotating basis• Local MSAs: Baltimore, MD (1998), Norfolk-Virginia Beach-
Newport News, VA-NC (1998), Northern NJ PMSAs (2003), Philadelphia, PA-NJ PMSA (2003), Washington, DC-MD-VA MSA (1998)
35
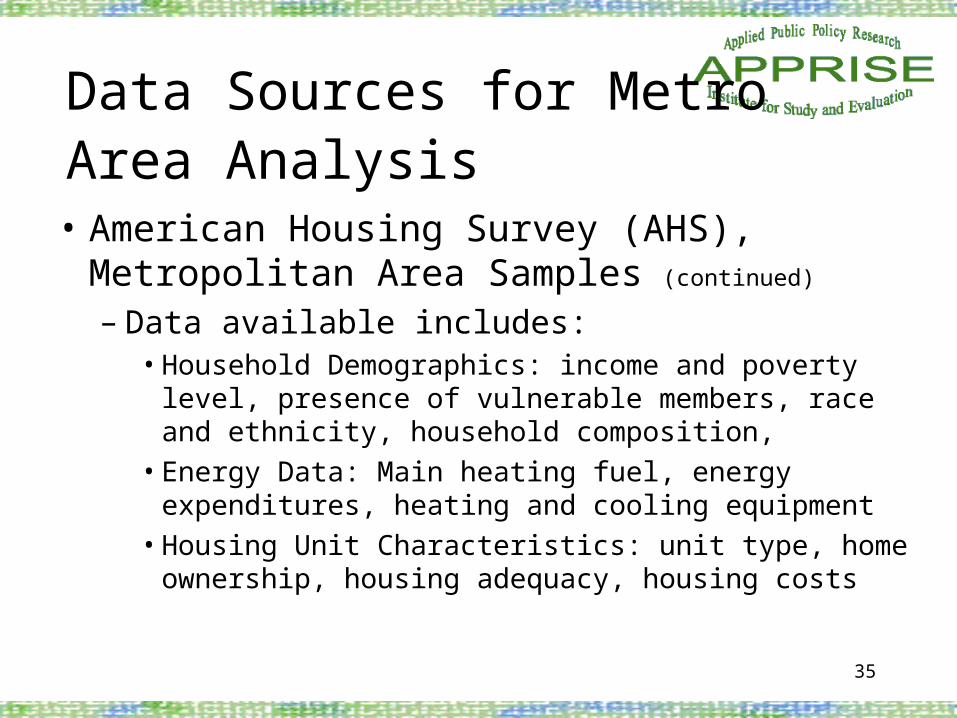
• American Housing Survey (AHS), Metropolitan Area Samples (continued)
– Data available includes:• Household Demographics: income and poverty level,
presence of vulnerable members, race and ethnicity, household composition,
• Energy Data: Main heating fuel, energy expenditures, heating and cooling equipment
• Housing Unit Characteristics: unit type, home ownership, housing adequacy, housing costs
Data Sources for Metro Area Analysis

36
Neighborhood Level Analysis
Methodology

37
Neighborhood Information Needs
• Local program managers need local-level information about the population in their communities in order to:– Effectively implement programs
– Target outreach initiatives
– Improve integration of energy assistance programs with other programs designed to assist low-income households
38
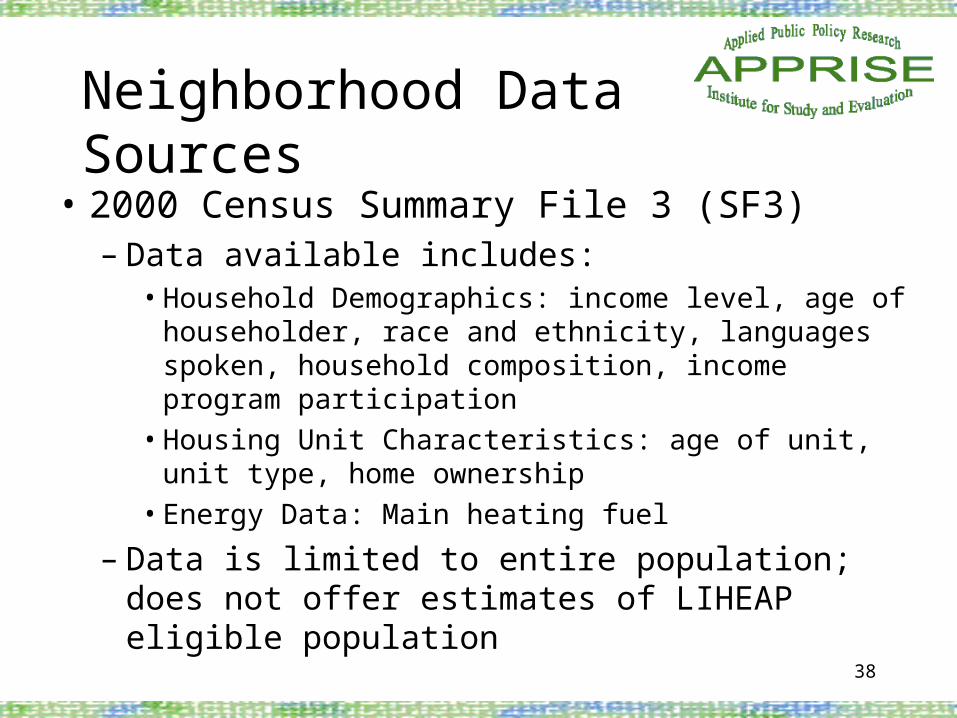
Neighborhood Data Sources
• 2000 Census Summary File 3 (SF3)– Data available includes:
• Household Demographics: income level, age of householder, race and ethnicity, languages spoken, household composition, income program participation
• Housing Unit Characteristics: age of unit, unit type, home ownership
• Energy Data: Main heating fuel
– Data is limited to entire population; does not offer estimates of LIHEAP eligible population

39
Neighborhood Data Sources
• 2000 Census Special Tabulations– Estimates of the LIHEAP eligible population can be obtained
from the Census Bureau for small areas, including Census Blocks, Block Groups, and Tracts
– Data available includes:• Household Demographics: income and poverty level,
presence of vulnerable members, race and ethnicity, languages spoken, household composition, employment, income program participation
• Housing Unit Characteristics: age of unit, unit type, home ownership
• Energy Data: Main heating fuel, energy expenditures

40
Neighborhood Level Analysis
Findings

41
Wilmington DE Map
42
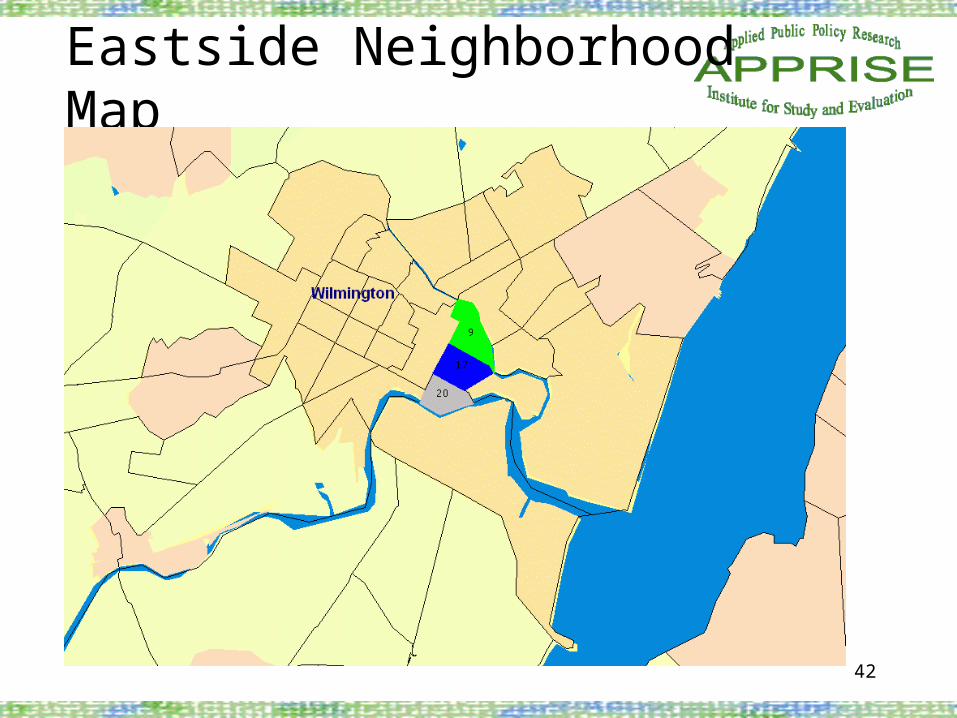
Eastside Neighborhood Map

43
EastsidePoverty Level
17%
45%
38%35%
22%
34%
0%
10%
20%
30%
40%
50%
Below 100% 100% - 199%
Tract 9
Tract 17
Tract 20
Poverty Level of Eastside in Wilmington, DE Households (1999)

44
EastsideHousing Tenure
41%
20%
6%
59%
80%
94%
0%
10%
20%
30%
40%
50%
60%
70%
80%
90%
100%
Owner Renter
Tract 9
Tract 17
Tract 20
Housing Tenure: Eastside in Wilmington, DE Households (2000)

45
EastsideNumber of Units in Structure
81%
44%
34%
12%
5%
13%
6%
51% 52%
0%
10%
20%
30%
40%
50%
60%
70%
80%
90%
Single Family Homes 2 - 4 Units 5-or-more Units
Tract 9
Tract 17
Tract 20
Number of Units in Structure: Eastside in Wilmington, DE Households (1999)
46
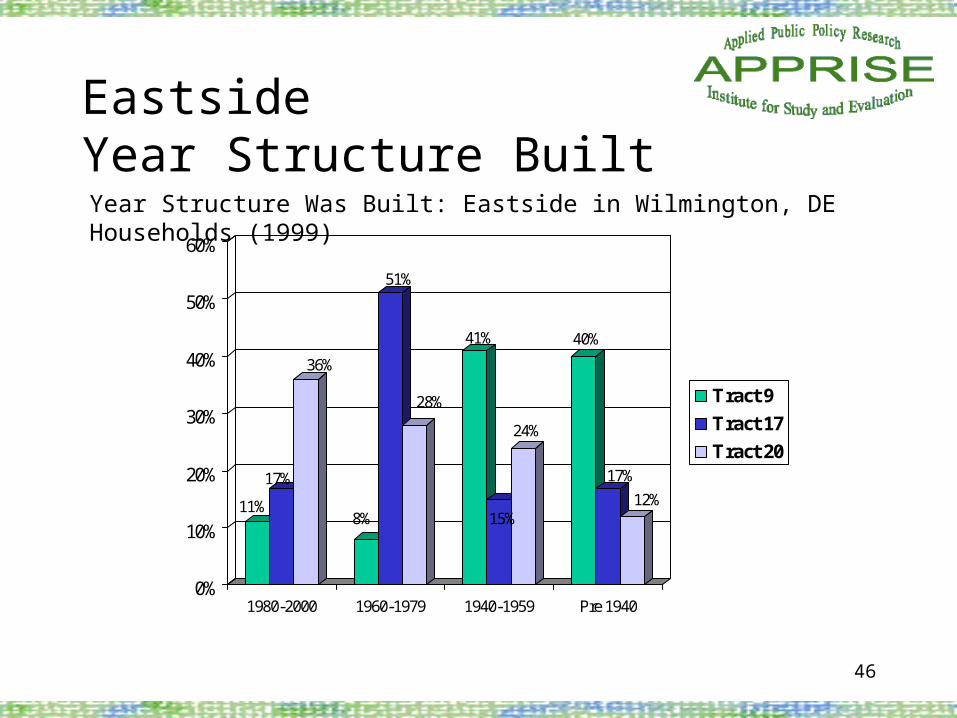
EastsideYear Structure Built
11%
17%
36%
8%
51%
28%
41%
15%
24%
40%
17%
12%
0%
10%
20%
30%
40%
50%
60%
1980-2000 1960-1979 1940-1959 Pre 1940
Tract 9
Tract 17
Tract 20
Year Structure Was Built: Eastside in Wilmington, DE Households (1999)
47
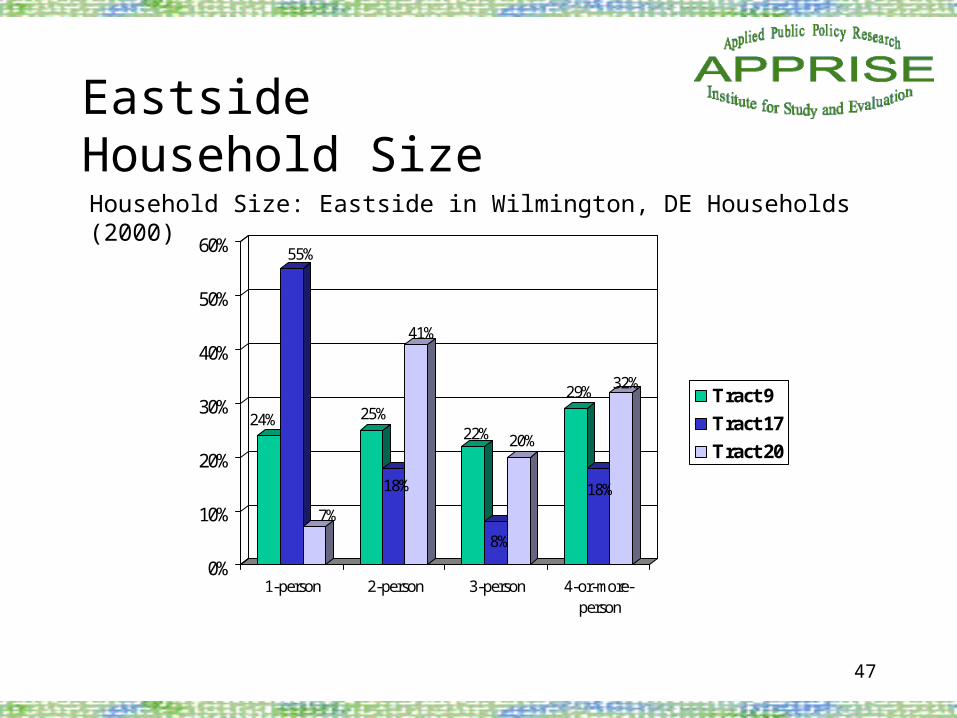
EastsideHousehold Size
24%
55%
7%
25%
18%
41%
22%
8%
20%
29%
18%
32%
0%
10%
20%
30%
40%
50%
60%
1-person 2-person 3-person 4-or-more-person
Tract 9
Tract 17
Tract 20
Household Size: Eastside in Wilmington, DE Households (2000)
48
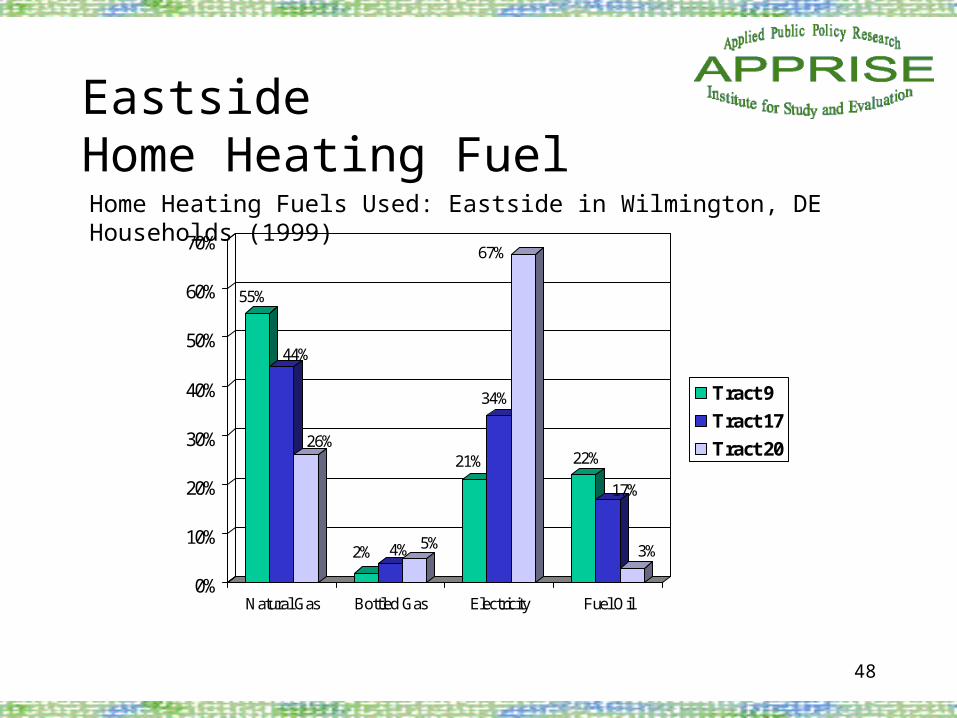
EastsideHome Heating Fuel
55%
44%
26%
2% 4% 5%
21%
34%
67%
22%
17%
3%
0%
10%
20%
30%
40%
50%
60%
70%
Natural Gas Bottled Gas Electricity Fuel Oil
Tract 9
Tract 17
Tract 20
Home Heating Fuels Used: Eastside in Wilmington, DE Households (1999)
49
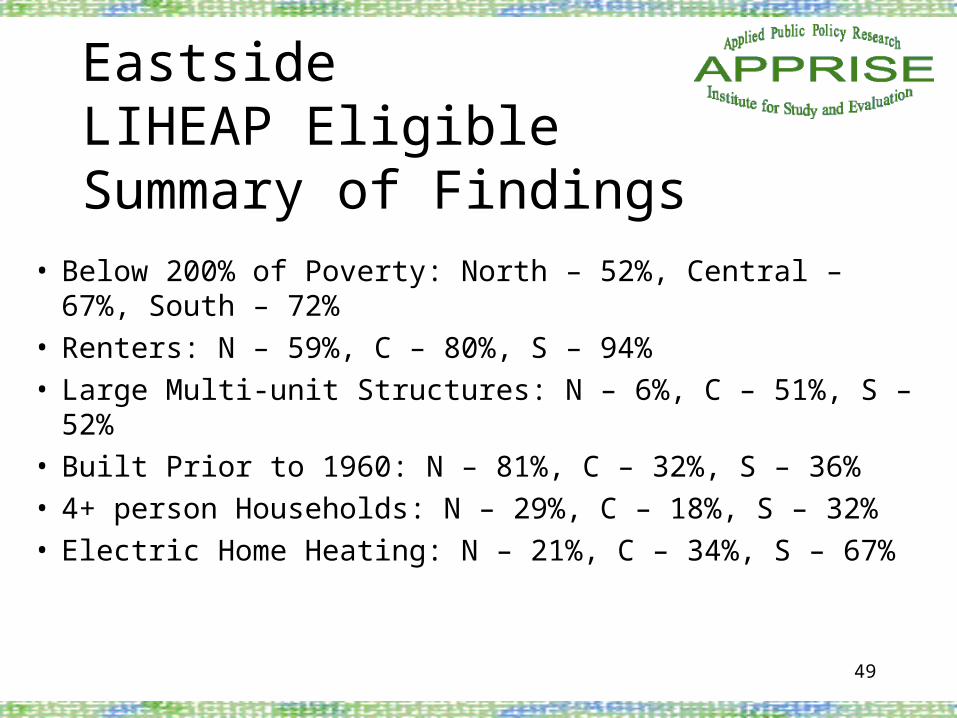
• Below 200% of Poverty: North – 52%, Central – 67%, South – 72%
• Renters: N – 59%, C – 80%, S – 94%• Large Multi-unit Structures: N – 6%, C – 51%, S – 52%• Built Prior to 1960: N – 81%, C – 32%, S – 36%• 4+ person Households: N – 29%, C – 18%, S – 32%• Electric Home Heating: N – 21%, C – 34%, S – 67%
EastsideLIHEAP Eligible Summary of Findings

50
Indicators of Wellbeing Analysis
Methodology
51
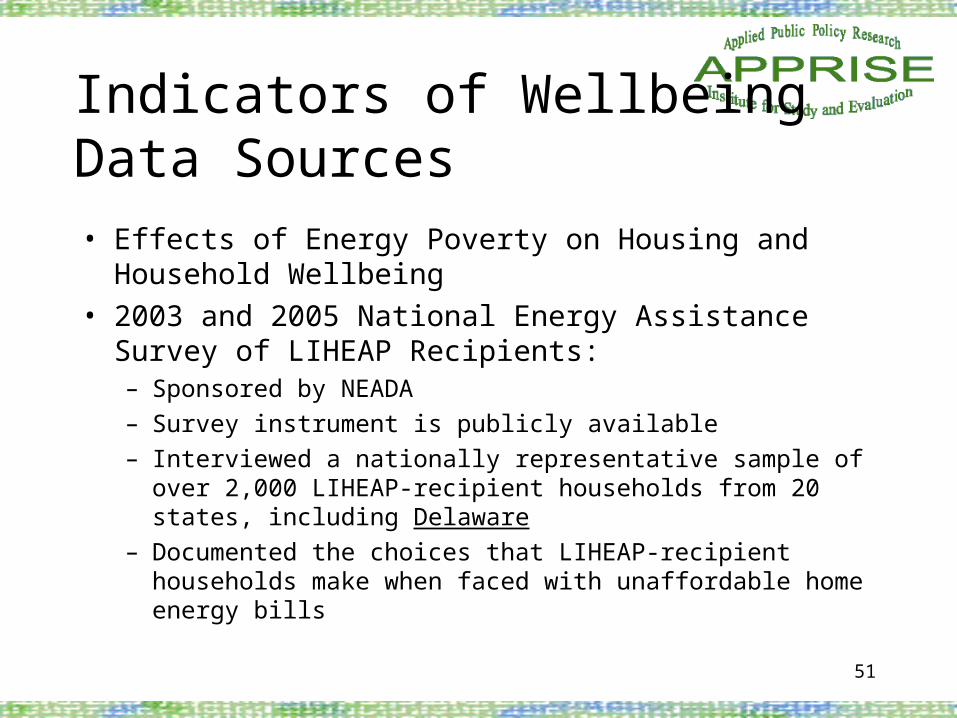
Indicators of Wellbeing Data Sources• Effects of Energy Poverty on Housing and Household
Wellbeing
• 2003 and 2005 National Energy Assistance Survey of LIHEAP Recipients:– Sponsored by NEADA
– Survey instrument is publicly available
– Interviewed a nationally representative sample of over 2,000 LIHEAP-recipient households from 20 states, including Delaware
– Documented the choices that LIHEAP-recipient households make when faced with unaffordable home energy bills

52
Limitations
• Survey Response Challenges:– Relying on Respondent Memory– Response bias (e.g., prideful responses) – Inability to control response situation
• Population– Having received benefits, LIHEAP recipients
might be better off than LIHEAP eligible

53
Indicators of Wellbeing Analysis
Findings

54
Indicators of Wellbeing Housing Problems
Source: 2003 National Energy Assistance Survey.
Housing Problems Experienced by DE LIHEAP Recipient Households (2003, 2005)
40% 49%
7%2%
11%
5% 3%2%
0%
10%
20%
30%
40%
50%
Didn't MakeFull Rent orMortgagePayment
Evicted fromHome or
Apartment
Moved in withFriends or
Family
Moved intoShelter or Been
Homeless
2003
2005

55
Indicators of Wellbeing Housing Wellbeing
Source: 2003 National Energy Assistance Survey.
26%27%
39%
50%
36%39%
18%
29%
0%
10%
20%
30%
40%
50%
60%
Went withoutfood for at least
one day
Went withoutmedical ordental care
Didn't fillprescription ortook less than a
full dose
Unable to payenergy bill due
to medicalexpenses
2003
2005
Sacrifices to Wellbeing Experienced by DE LIHEAP Recipient Households (2003, 2005)

56
Indicators of Wellbeing Effects on Health
Source: 2003 National Energy Assistance Survey.
20%
31%
14%
25%
9%
13%
7%
12%
0%
10%
20%
30%
40%
Became sickbecause homewas too cold
Needed to goto a doctor or
hospitalbecause homewas too cold
Became sickbecause homewas too hot
Needed to goto a doctor or
hospitalbecause homewas too hot
2003
2005
Health Problems Experienced by DE LIHEAP Recipient Households (2003, 2005)

57
Indicators of Wellbeing Summary of Findings
•In the last five years, due to their energy bills:
–40% of DE respondents in 2003 and 49% in 2005 reported that they missed a rent or mortgage payment
–27% of DE respondents in 2005 reported that they went without food for at least one day
– 39% of DE respondents in 2003 and 50% in 2005 reported that they went without medical or dental care
–20% of DE respondents in 2003 and 31% in 2005 reported that they became sick because their home was too cold
58
• Using existing data sources, one can develop a broad array of information about the energy needs of low-income households– All data used for this presentation are publicly
available
• Data is available to explore linkages among energy poverty, housing affordability, and household wellbeing
Conclusion
59
• Information can be used by:– Policymakers and program managers to make
effective decisions related to program design, operations and evaluation
– Agency managers to educate service providers and state officials on the diversity of the low-income population and how different strategies might be needed to achieve positive outcomes for different types of low-income households
Conclusion
60
• Atlantic City Electric / Delmarva Power– Michael Hoy– Enid Wallace-Simms
• Wilmington Urban League– Tyrone Jones
Thank You
61
Energy Poverty and Household Wellbeing
Atlantic City Electric / Delmarva PowerAgency SummitOctober 5, 2005
Donnell Butler ([email protected])David Carroll ([email protected])
Carrie-Ann Ferraro ([email protected])
http://www.appriseinc.org/Phone: 609-252-8008