Embed Size (px)
Citation preview

1Enviromatics 2008 - Geographical information systems GIS
Geographical information systems(GIS)
Вонр. проф. д-р Александар Маркоски
Технички факултет – Битола
2008 год.

2Enviromatics 2008 - Geographical information systems GIS
Introduction
“A computer based system, consisting of hardware, software, data and application. It provides scientific information considering spatial relation.
A GIS has to offer functions for– input,– storage,– checkup,– manipulation,– integration,– analyzing and– alphanumeric as well as graphic presentation of spatial
data.

3Enviromatics 2008 - Geographical information systems GIS
Introduction (2)
• The integration of thematic data and information about the spatial situation (which will be presented cartographical), distinguishes a GIS from a mere cartographic- or CAD-(Computer Aided Design) system.” (Weidenbach, 1999)
• GIS is not only a tool for making maps, it is a system for data analysis!

4Enviromatics 2008 - Geographical information systems GIS
Other definitions for GIS
• The common ground between information processing and the many fields using spatial analysis techniques (Tomlinson, 1972).
• A powerful set of tools for collecting, storing, retrieving, transforming, and displaying spatial data from the real world (Burroughs, 1986).
• A computerized database management system for the capture, storage, retrieval, analysis and display of spatial data (NCGIA, 1987).
• An information system that is designed to work with data referenced by spatialor geographic coordinates. In other words, a GIS is both a database system with specific capabilities for spatially referenced data, as well as a set of operations or working with the data (Star and Estes, 1990).

5Enviromatics 2008 - Geographical information systems GIS
Тerm GIS
The term GIS has different meanings.
Depending on the focal point it is:
– a collection of spatial data
– a collection of tools
– a package of hard- and software components
– a technology

6Enviromatics 2008 - Geographical information systems GIS
Contributions to GIS-development
• Informatics (graphic, visualization, data base, security, system administration),
• geography and related fields (cartography, geodesy, geomorphology, spatial statistics)
• user (public administration, engineering, location search, planning, geology, mining, forestry, marketing, criminology)

7Enviromatics 2008 - Geographical information systems GIS
Visualization of Data

8Enviromatics 2008 - Geographical information systems GIS
Elements of a GIS

9Enviromatics 2008 - Geographical information systems GIS
The four-components-model of a GIS

10Enviromatics 2008 - Geographical information systems GIS
Which Operations can be done with a GIS ?
• What is where?• Where is what?• What has changed since...?• How is the spatial spread?• What happens if...?
GIS uses the spatial allocation as a common key for different data records. Different issues are connected by their geographic position.

11Enviromatics 2008 - Geographical information systems GIS
Steps in a GIS project
1. Data acquisition (paper maps, digital files, remote sensing data, satellite data, field work),
2. Data preprocessing (preparation, integration, data conversion, digitising and/or scanning, edge matching, rectification),
3. Data management (variable selection, data definition, table design (performance, usability), CRUD policies/procedures (create: data entry; retrieve: view; update: change; delete: remove)),
4. Manipulation and analysis (address matching, network analysis, terrain modelling: slopes, different aspects),
5. Product generation (tabular reports, graphics: maps, charts).

12Enviromatics 2008 - Geographical information systems GIS
What should be possible with a GIS?
• Management, analysis, connecting, presentation of geographic data allows:
• automatic processing of geographic data, for example for making maps,
• calculation of areas or distances
• calculation of slopes, exposition direction or visibility analyses,
• route planning, traffic management or logistics
• integration of data of different origins and types
• linkage of data to maps, to make complex spatial relations visible
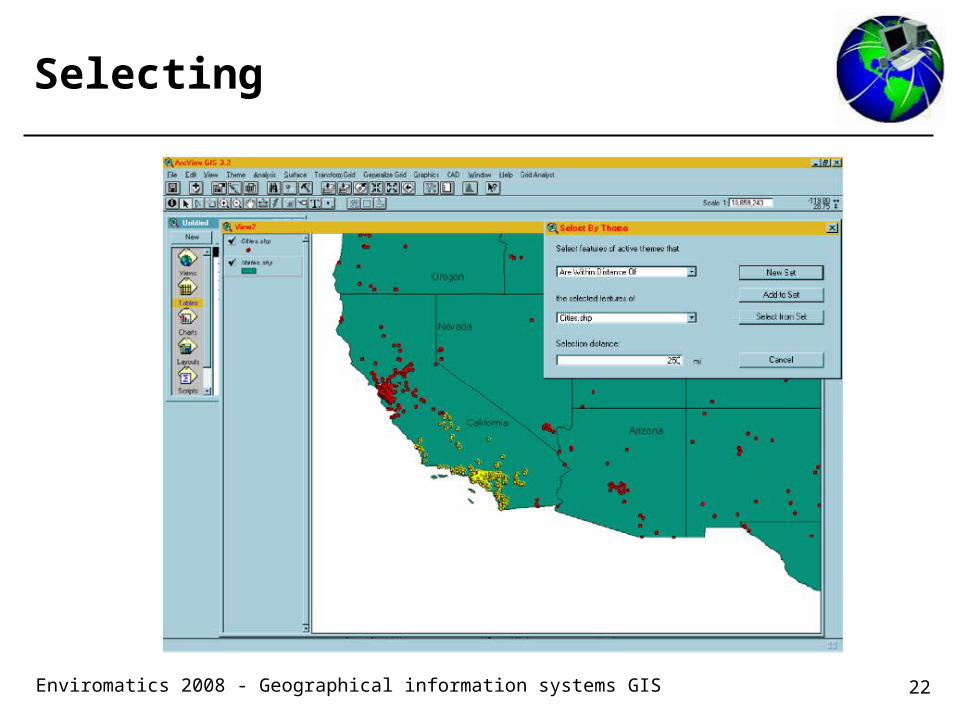
• to answer spatial questions (for example: How many objects are within a given distance to another object ?)
• the spatial modelling of complex scenarios (risk analysis, route planning, resource management)

13Enviromatics 2008 - Geographical information systems GIS
System architecture and components
14Enviromatics 2008 - Geographical information systems GIS
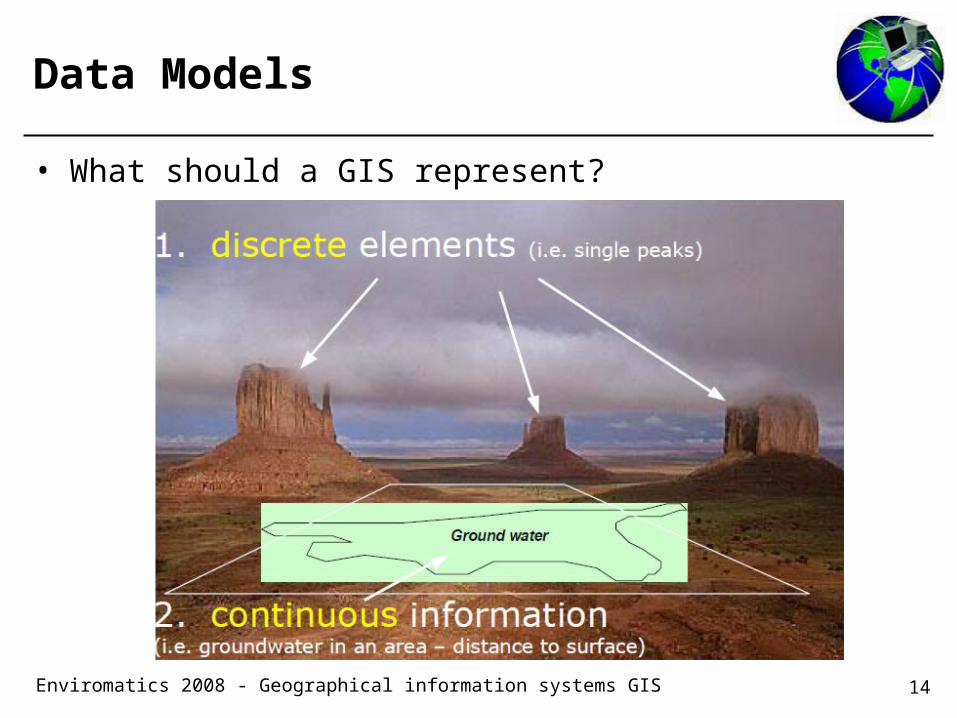
Data Models
• What should a GIS represent?

15Enviromatics 2008 - Geographical information systems GIS
Data Models (2)
Discrete Objects have attributes as
• length• volume• land use• type
Continuous Information for an area has gradients as :
• temperature• content of water• distribution of precipitation• content of contaminants
Depending on the data concept there are raster/Grid-GIS or Vector-GIS. Systems working with both types, are named hybrid systems.

16Enviromatics 2008 - Geographical information systems GIS
Data Models

17Enviromatics 2008 - Geographical information systems GIS
General Structure of a Grid

18Enviromatics 2008 - Geographical information systems GIS
Vector Data
• The vector-structure is necessary for a object-related data management in GIS. It is used for the realization of topologic structures and complex data models.
• Objects in Vector-GIS are points, lines, polygons.• Every GIS-object in a view has a representation in the data
base. The attributes describe the objects and allow selections and classifications.
• Classification by attribute (above) or selection by attribute (below) are typical Data Base Management Methods. Selection or classification by spatial relations are typical GIS-methods.

19Enviromatics 2008 - Geographical information systems GIS
Vector GIS Objects

20Enviromatics 2008 - Geographical information systems GIS
Atributes

21Enviromatics 2008 - Geographical information systems GIS
Selecting objects
22Enviromatics 2008 - Geographical information systems GIS
Selecting

23Enviromatics 2008 - Geographical information systems GIS
Vector vs. Raster

24Enviromatics 2008 - Geographical information systems GIS
Raster vs. Vector

25Enviromatics 2008 - Geographical information systems GIS
Representation of Vector Data as Raster Data

26Enviromatics 2008 - Geographical information systems GIS
Modelling topography special features
• Mass points and break lines from surveying,
• Triangulated irregular networks (TIN),
• 2,5-D Visualisation: Hillshading,
• Colour coded digital terrain model (DTM),
• 3-D Visualisation.

27Enviromatics 2008 - Geographical information systems GIS
Grid data model
• Digital Elevation Model (DEM) in the background, showing the elevation, using graduated colors and shadows for visualizing 3rd dimension. In the foreground houses and water body (river) are shown, using vector data model.

28Enviromatics 2008 - Geographical information systems GIS
Triangulated Irregular Network
• Base for developing the DEM (above) is a Triangulated Irregular Network (TIN), based on measured points

29Enviromatics 2008 - Geographical information systems GIS
1
3D-Presentation of a the same TIN, example for vector based representation of a surface
• irregular size of triangles,• areas with higher and lower
density of knots

30Enviromatics 2008 - Geographical information systems GIS
2
3D-Presentation of a grid, showing the same area (but different point of view)
• regular cell size

31Enviromatics 2008 - Geographical information systems GIS
3
Combination of grid model (surface) and vector model (houses)

32Enviromatics 2008 - Geographical information systems GIS
Example for high resolution grid
33Enviromatics 2008 - Geographical information systems GIS
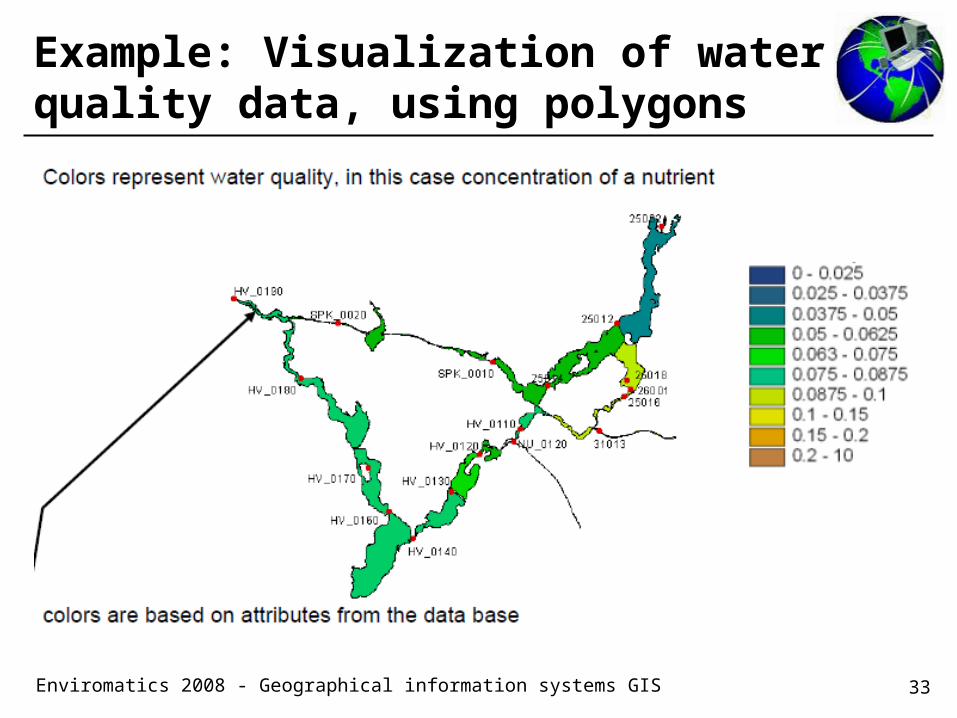
Example: Visualization of water quality data, using polygons

34Enviromatics 2008 - Geographical information systems GIS
Example: Visualization of water quality data, using polygons (cont.)

35Enviromatics 2008 - Geographical information systems GIS
Fields of applications of GIS
• Automation of activities involving geographic data like map production, calculation of areas, distances or route lengths, measurement of slopes, aspect, view shed, logistics, route planning, vehicle traffic, traffic management, land use management, environmental planning, flood control, resource management, and others.
• Integration of data hitherto confined to independent domains (e. g. Property maps, air photos).
• tying data to maps permits the succinct communication of complex spatial patterns (e. g. environmental sensitivity).
• providing answers to spatial queries.
• performing complex spatial modelling (e. g. scenarios for transportation planning, disaster planning, utility design, risk modelling).

36Enviromatics 2008 - Geographical information systems GIS
Use of GIS in practical and researchfields
• Environmental and resource management (Watershed management, soil conservation, air pollution control, agriculture, water harvesting, water supply),
• Urban planning, management and policy (Land acquisition, environmental impact assessment),
• Surveying,• Facility management (Infrastructure, telecommunication),• Transport, Traffic, Logistics,• Research and development (Environmental modelling,
simulation and optimisation of energy, soil, water, climate, etc. for risk assessment and decision support).

37Enviromatics 2008 - Geographical information systems GIS
Scientific and engineering contributors to GIS
• Geography (provides techniques for conducting spatial analysis),
• Cartography (maps have been a major source of information input for GIS, long tradition in map design which is an important output from GIS),
• Remote sensing (images from air and space are major sources of spatial data, low cost and consistent update of input data),
• Photogrammetry (source of most data on topography used in GIS, uses aerial photographs for making accurate spatial measurements, IR photographs),
• Surveying (provides high quality data on positions of land boundaries, buildings, etc.),

38Enviromatics 2008 - Geographical information systems GIS
Scientific and engineering contributors to GIS (2)
• Geodesy (high accuracy positional control for GIS, uses GPS technology),
• Statistics (statistical techniques used in GIS analysis, important to understand issues of error and uncertainty in GIS data),
• Operations research (optimising techniques used in GIS applications such as routing),
• Computer Science (GIS uses computer aided design (CAD) technologies, computer graphics and visualisation, DBMS).

39Enviromatics 2008 - Geographical information systems GIS
Software for GIS
• ArcInfo (Originated commercial GIS, clear market leader),
• Intergraph (Strong in design and facilities mapping, running hard to match ArcInfo, its main modular GIS environment evolved from its older CAD products, development of a new generation product of ist own code named Jupiter based on NT and object technology)
• Bentley Systems (Originally developed the PC-based Micro-Station product GeoGraphics in cooperation with Bentley Systems, but split in 1995, have very successfully continued to develop and sell MicroStation GeoGraphics)
• Autodesk’s AutoCAD Map (Dominant CAD supplier and software company, fully topological AutoCAD Map since 1996, illustrates convergence of CAD/GIS, many industrial applications of AutoCAD for mapping)

40Enviromatics 2008 - Geographical information systems GIS
Software for GIS (2)
• Graphic Data Systems (Originated as McDonnel-Douglas in-house system, industrial applications, visualisation of technical products, now mapping the environment)
• ERDAS/Imagine, ER MAPPER, PCI, Envi (Origins in remote sensing raster and vector data, new satellite data products, ER MAPPER originating in Australia, PCI originating in Canada)
• GRASS (Public domain software, raster oriented with some vector routines, but 1996 end of development and support announced),
• SICAD (Comparable with ArcInfo, powerful GIS with a lot of functionalities for raster and vector data, object oriented database)
• IDRISI (Comparable with ArcInfo, but not so powerful),
• MapInfo (Small GIS, useful for planning purposes, easy to handle)

41Enviromatics 2008 - Geographical information systems GIS
Problems in GIS practice
Up to now, there is no system that could solve all possible tasks a GIS normally is confronted with:
• there is no unique data model that serves well for all GIS applications,
• there are no fully compatible geodata,• there are no scale-independent geodata,• there are no fully compatible/applicable commercial systems
of data formatting,• there are still severe problems with data exchange,• there are some deficits in standardisation of GIS.

42Enviromatics 2008 - Geographical information systems GIS
GIS Application Example:Hydrological Modelling using ArcView
• 1. Creating a DEM from point data file
• 2. Creating river network• 3. Creating sub-catchments and
pour points
Example is based on ArcView 3.x, with Spatial Analyst, 3D-Analyst and Hydro-Modeling Extension

43Enviromatics 2008 - Geographical information systems GIS
Creating a DEM from point data file

44Enviromatics 2008 - Geographical information systems GIS
Hydro-Modeling

45Enviromatics 2008 - Geographical information systems GIS
Flow direction

46Enviromatics 2008 - Geographical information systems GIS
Flow accumulation

47Enviromatics 2008 - Geographical information systems GIS
sub-catchments

48Enviromatics 2008 - Geographical information systems GIS
Questions?