Embed Size (px)
Citation preview
1
FBD HOLDINGS PLC
2005 PRELIMINARY RESULTS
2
Forward Looking Statements
This presentation contains certain forward-looking statements. Actual results may differ materially from those projected or implied in such forward-looking statements. Such forward-looking information involves risks and uncertainties that could affect expected results
3
Introduction to FBD Holdings plc
• Core business …insurance underwriting. – leading position in target markets– strong brand identity
• Non – Core– property/leisure – financial services
• Excellent growth record.
4
Operational Highlights of 2005
Underwriting• Strong new business volumes more than offset reducing
premium rates.
• Policy count at 31st December 2005 up 12.5% on 2004 figure.
• Branch network enhanced.
• Dublin Market targeted
• New products introduced (Shops, Trades, Breakdown / Claims Assist 24 Hour service)
• Increased investment in infrastructure and human resources
5
Operational Highlights of 2005
Non-Underwriting
• 40 Residential units sold at La Cala Resort
• Third championship golf course (“The Europa”) opened for play at La Cala.
• Castlerosse Hotel, Killarney sold.
• Castleknock Hotel & Country Club opened.
6
Operational Highlights of 2005
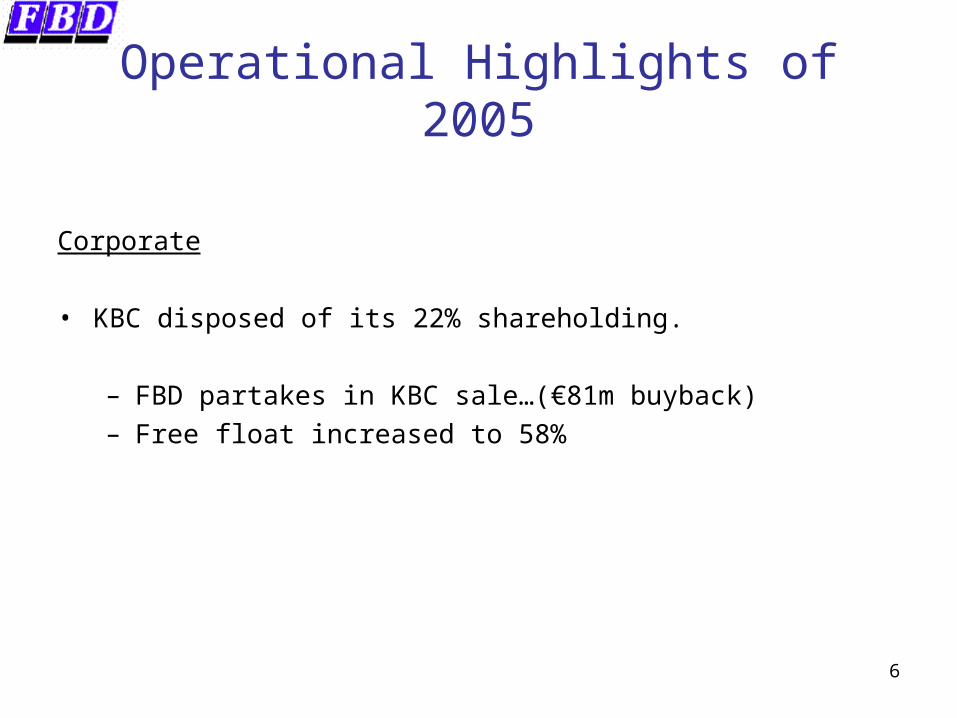
Corporate
• KBC disposed of its 22% shareholding.
– FBD partakes in KBC sale…(€81m buyback) – Free float increased to 58%
7
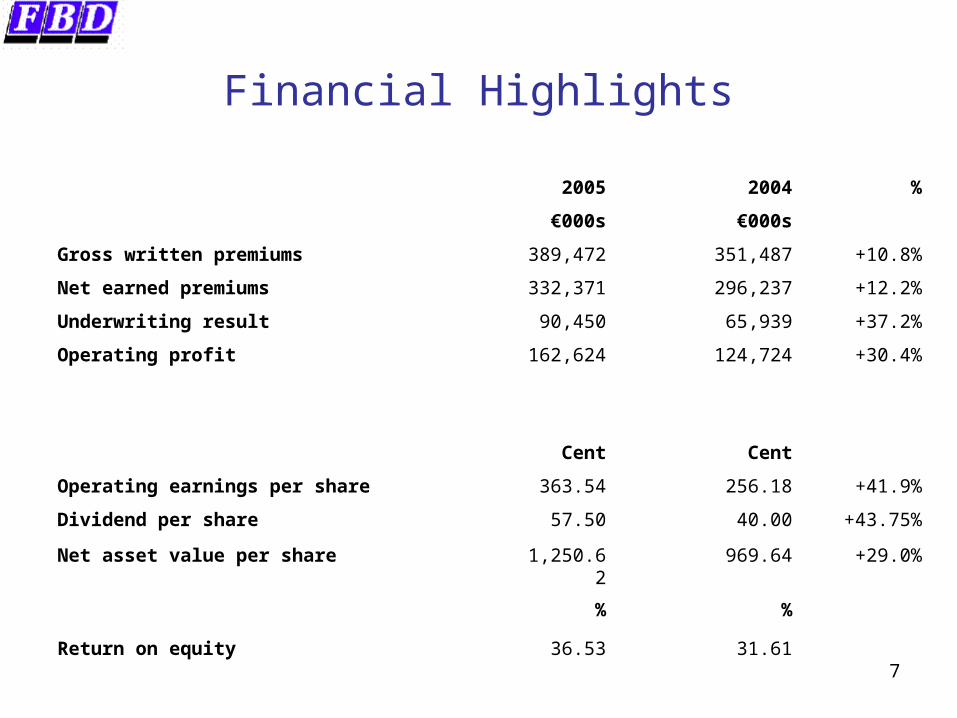
Financial Highlights
2005 2004 %
€000s €000s
Gross written premiums 389,472 351,487 +10.8%
Net earned premiums 332,371 296,237 +12.2%
Underwriting result 90,450 65,939 +37.2%
Operating profit 162,624 124,724 +30.4%
Cent Cent
Operating earnings per share 363.54 256.18 +41.9%
Dividend per share 57.50 40.00 +43.75%
Net asset value per share 1,250.62 969.64 +29.0%
% %
Return on equity 36.53 31.61
8
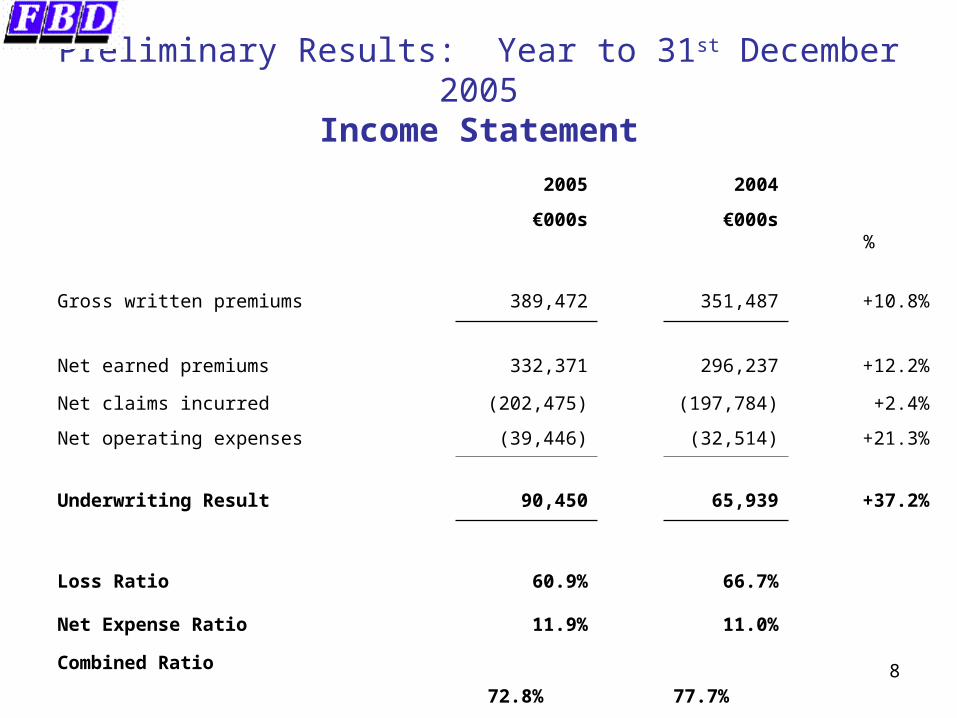
Preliminary Results: Year to 31st December 2005Income Statement
2005 2004
€000s €000s %
Gross written premiums 389,472 351,487 +10.8%
Net earned premiums 332,371 296,237 +12.2%
Net claims incurred (202,475) (197,784) +2.4%
Net operating expenses (39,446) (32,514) +21.3%
Underwriting Result 90,450 65,939 +37.2%
Loss Ratio 60.9% 66.7%
Net Expense Ratio
Combined Ratio
11.9%
72.8%
11.0%
77.7%
9
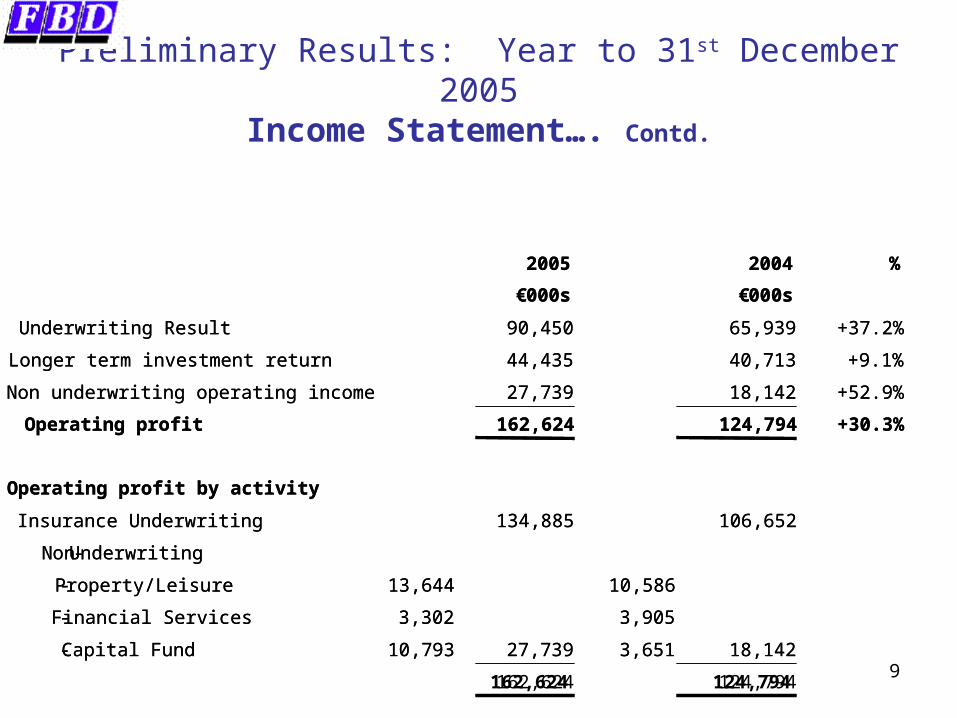
Preliminary Results: Year to 31st December 2005Income Statement…. Contd.
162,624
27,739
134,885
162,624
27,739
44,435
90,450
€000s
2005
10,793
3,302
13,644
124,794
18,142
106,652
124,794
18,142
40,713
65,939
€000s
2004
3,651- Capital Fund
3,905- Financial Services
10,586- Property/Leisure
Non-Underwriting
Insurance Underwriting
Operating profit by activity
+30.3%Operating profit
+52.9%Non underwriting operating income
+9.1%Longer term investment return
+37.2%Underwriting Result
%
162,624
27,739
134,885
162,624
27,739
44,435
90,450
€000s
2005
10,793
3,302
13,644
124,794
18,142
106,652
124,794
18,142
40,713
65,939
€000s
2004
3,651- Capital Fund
3,905- Financial Services
10,586- Property/Leisure
Non-Underwriting
Insurance Underwriting
Operating profit by activity
+30.3%Operating profit
+52.9%Non underwriting operating income
+9.1%Longer term investment return
+37.2%Underwriting Result
%
10
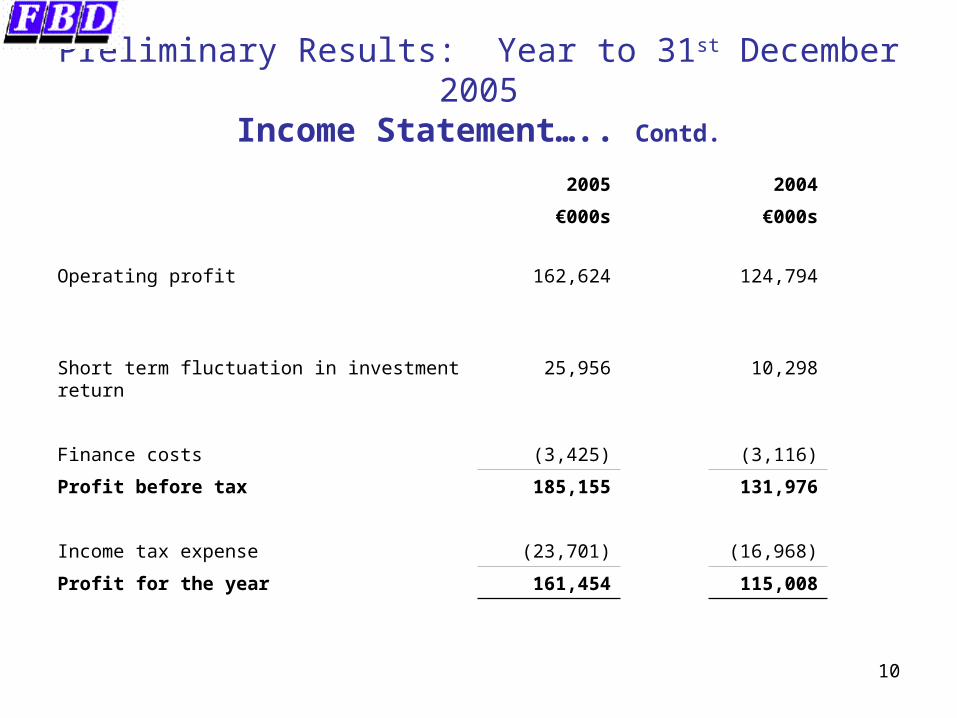
Preliminary Results: Year to 31st December 2005Income Statement….. Contd.
2005 2004
€000s €000s
Operating profit 162,624 124,794
Short term fluctuation in investment return 25,956 10,298
Finance costs (3,425) (3,116)
Profit before tax 185,155 131,976
Income tax expense (23,701) (16,968)
Profit for the year 161,454 115,008
11
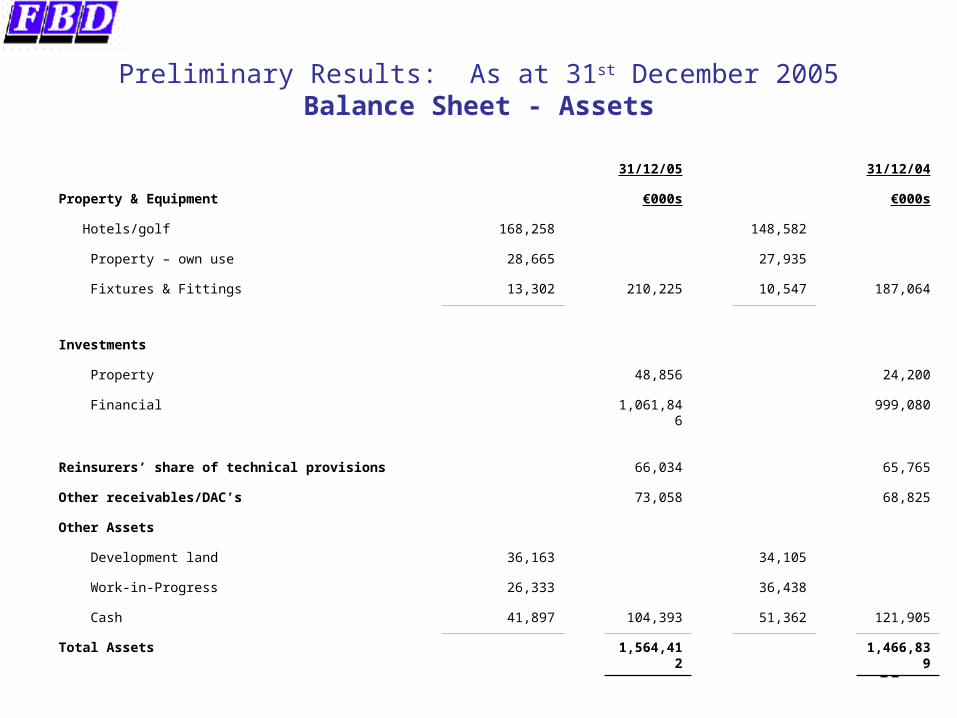
Preliminary Results: As at 31st December 2005Balance Sheet - Assets
31/12/05 31/12/04
Property & Equipment €000s €000s
Hotels/golf 168,258 148,582
Property – own use 28,665 27,935
Fixtures & Fittings 13,302 210,225 10,547 187,064
Investments
Property 48,856 24,200
Financial 1,061,846 999,080
Reinsurers’ share of technical provisions 66,034 65,765
Other receivables/DAC’s 73,058 68,825
Other Assets
Development land 36,163 34,105
Work-in-Progress 26,333 36,438
Cash 41,897 104,393 51,362 121,905
Total Assets 1,564,412 1,466,839
12
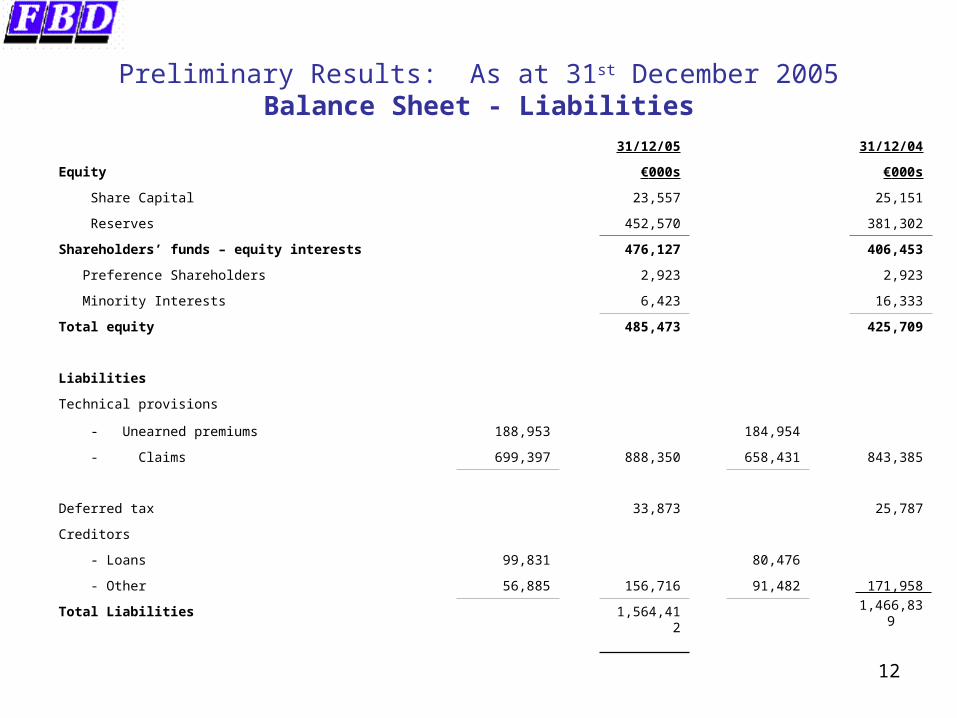
Preliminary Results: As at 31st December 2005Balance Sheet - Liabilities
31/12/05 31/12/04
Equity €000s €000s
Share Capital 23,557 25,151
Reserves 452,570 381,302
Shareholders’ funds – equity interests 476,127 406,453
Preference Shareholders 2,923 2,923
Minority Interests 6,423 16,333
Total equity 485,473 425,709
Liabilities
Technical provisions
- Unearned premiums 188,953 184,954
- Claims 699,397 888,350 658,431 843,385
Deferred tax 33,873 25,787
Creditors
- Loans 99,831 80,476
- Other 56,885 156,716 91,482 171,958
1,466,839Total Liabilities 1,564,412
13
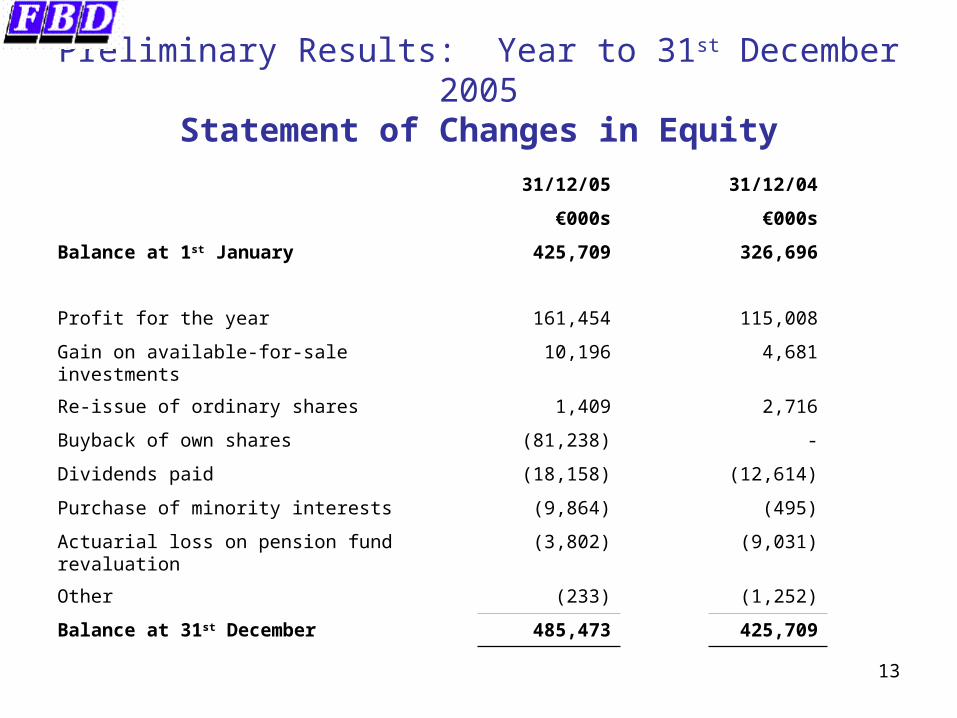
Preliminary Results: Year to 31st December 2005Statement of Changes in Equity
31/12/05 31/12/04
€000s €000s
Balance at 1st January 425,709 326,696
Profit for the year 161,454 115,008
Gain on available-for-sale investments 10,196 4,681
Re-issue of ordinary shares 1,409 2,716
Buyback of own shares (81,238) -
Dividends paid (18,158) (12,614)
Purchase of minority interests (9,864) (495)
Actuarial loss on pension fund revaluation (3,802) (9,031)
Other (233) (1,252)
Balance at 31st December 485,473 425,709
14
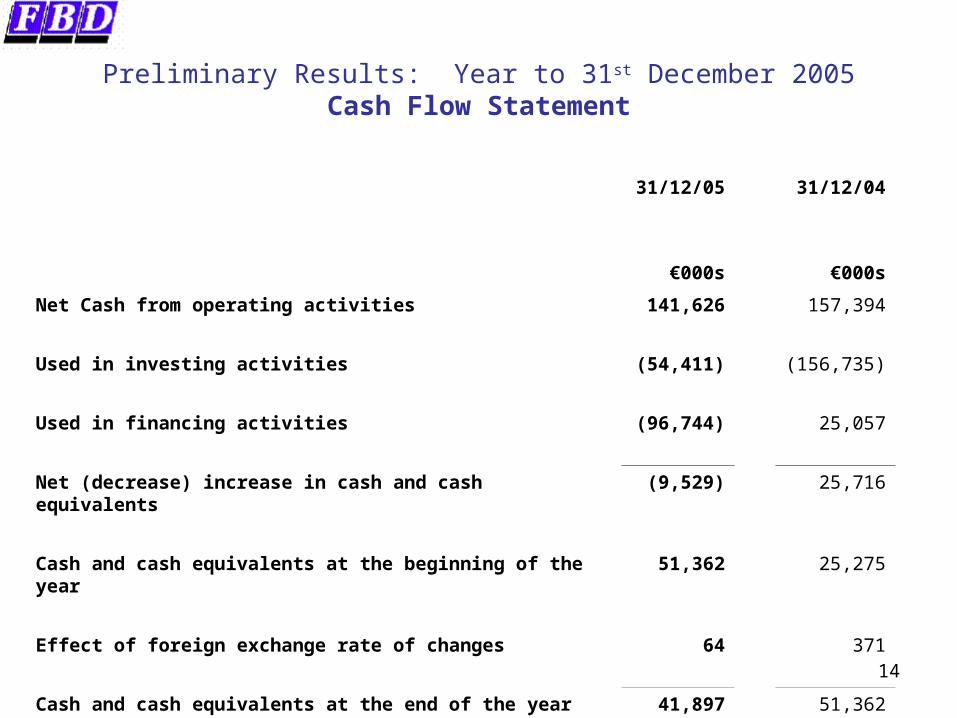
Preliminary Results: Year to 31st December 2005Cash Flow Statement
31/12/05 31/12/04
€000s €000s
Net Cash from operating activities 141,626 157,394
Used in investing activities (54,411) (156,735)
Used in financing activities (96,744) 25,057
Net (decrease) increase in cash and cash equivalents (9,529) 25,716
Cash and cash equivalents at the beginning of the year 51,362 25,275
Effect of foreign exchange rate of changes 64 371
Cash and cash equivalents at the end of the year 41,897 51,362
15
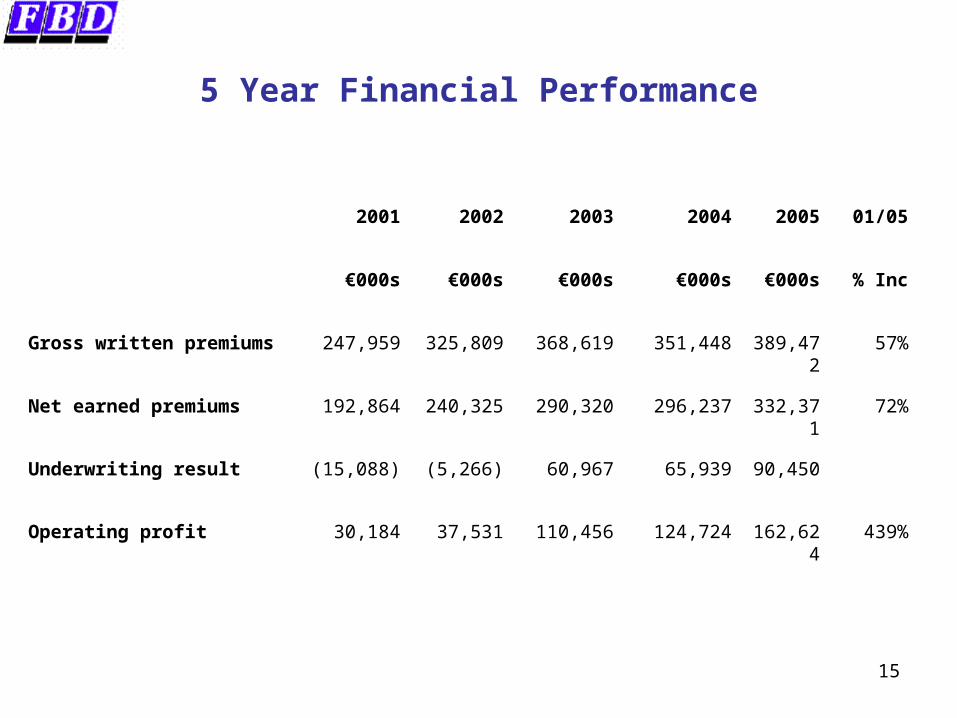
5 Year Financial Performance
2001 2002 2003 2004 2005 01/05
€000s €000s €000s €000s €000s % Inc
Gross written premiums 247,959 325,809 368,619 351,448 389,472 57%
Net earned premiums 192,864 240,325 290,320 296,237 332,371 72%
Underwriting result (15,088) (5,266) 60,967 65,939 90,450
Operating profit 30,184 37,531 110,456 124,724 162,624 439%
16
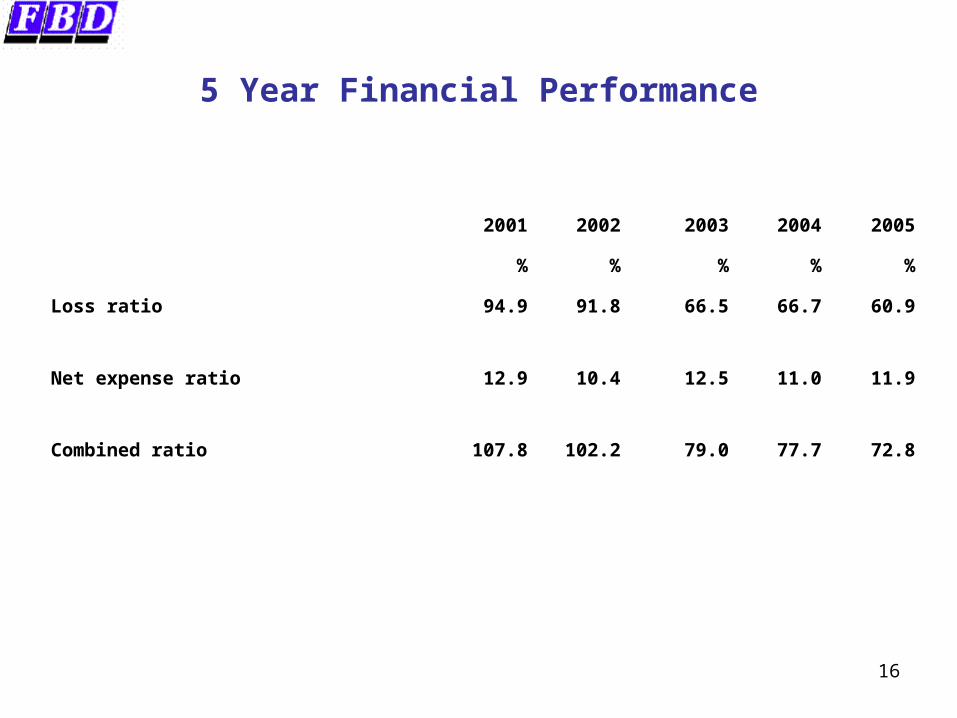
5 Year Financial Performance
2001 2002 2003 2004 2005
% % % % %
Loss ratio 94.9 91.8 66.5 66.7 60.9
Net expense ratio 12.9 10.4 12.5 11.0 11.9
Combined ratio 107.8 102.2 79.0 77.7 72.8
17
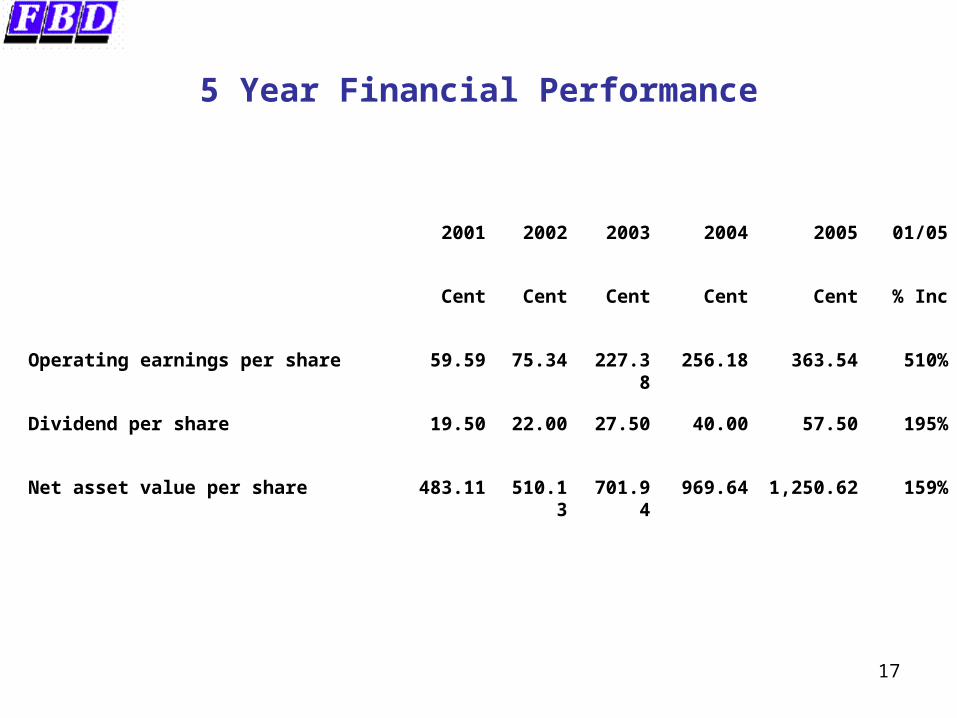
5 Year Financial Performance
2001 2002 2003 2004 2005 01/05
Cent Cent Cent Cent Cent % Inc
Operating earnings per share 59.59 75.34 227.38 256.18 363.54 510%
Dividend per share 19.50 22.00 27.50 40.00 57.50 195%
Net asset value per share 483.11 510.13 701.94 969.64 1,250.62 159%
18
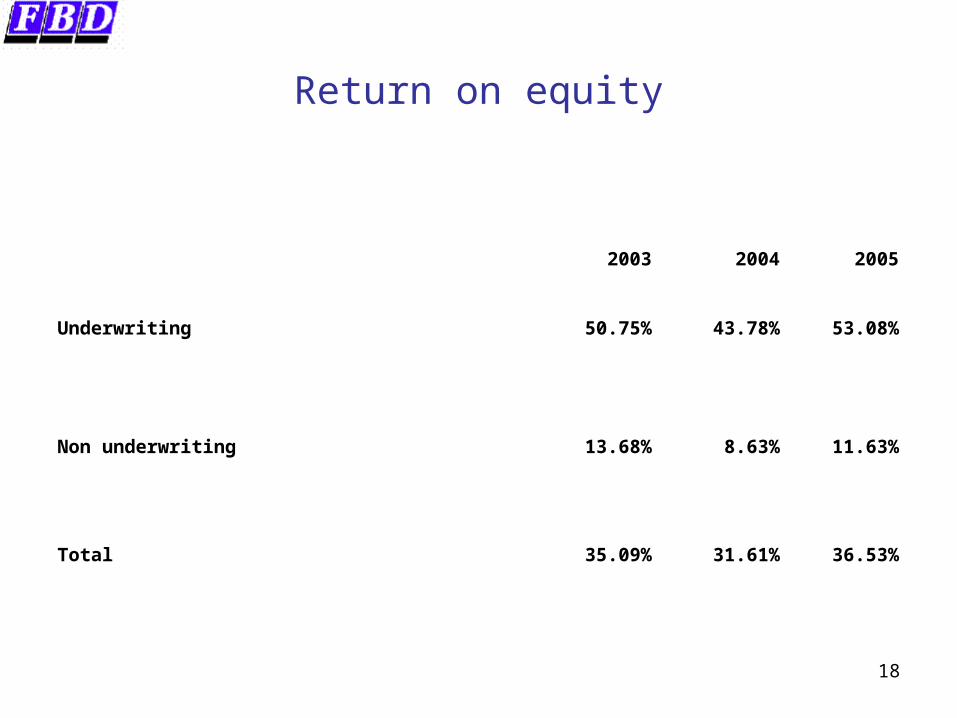
Return on equity
2003 2004 2005
Underwriting 50.75% 43.78% 53.08%
Non underwriting 13.68% 8.63% 11.63%
Total 35.09% 31.61% 36.53%
19
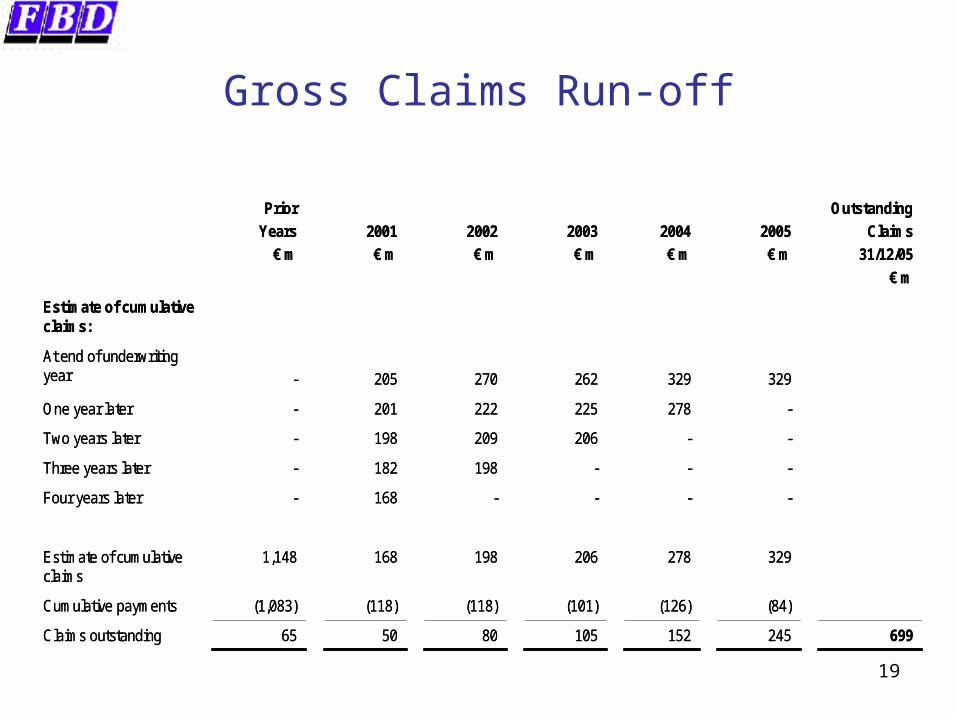
Gross Claims Run-off
699245152105805065Claims outstanding
(84)(126)(101)(118)(118)(1,083)Cumulative payments
3292782061981681,148Estimate of cumulative claims
----168-Four years later
---198182-Three years later
--206209198-Two years later
-278225222201-One year later
329329262270205-
At end of underwriting year
Estimate of cumulative claims:
Outstanding
Claims
31/12/05
€ m
2005
€ m
2004
€ m
2003
€ m
2002
€ m
2001
€ m
Prior
Years
€ m
20
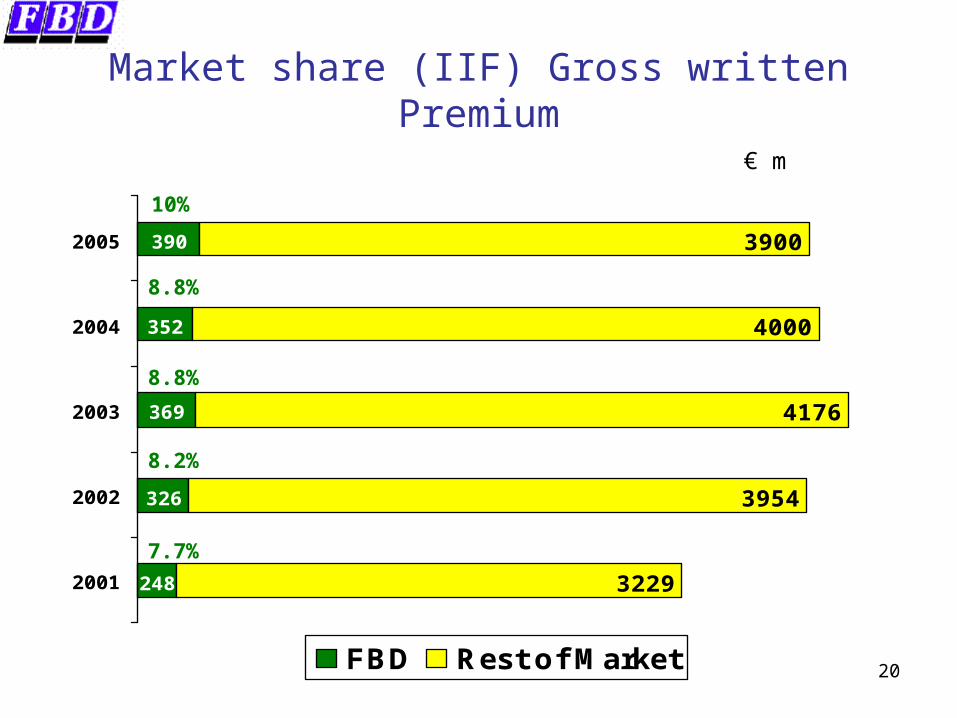
Market share (IIF) Gross written Premium
248
326
369
352
390
3229
3954
4176
4000
3900
2001
2002
2003
2004
2005
FBD Rest of Market
10%
8.8%
8.8%
8.2%
7.7%
€ m
21
Post Balance Sheet Events
• 23rd February 2006,
– Conditional agreement to sell 96 hectares of development land at La Cala
– Total consideration €201m. in cash, in phased payments.
– Estimated profit after tax… €90 m.
– Intention to distribute the net cash proceeds, estimated at €120m. in two special dividends.
22
OUTLOOK
Underwriting
• Year to date trading on target
• Price competition continues
• Ambitious new-business volumes targeted
• Further investment in people and infrastructure planned
• Road accident trends negative, pending Government action
• Increased claims incurred charge….higher exposures
• No significant changes in claims reserving approach envisaged, in the short term
• Combined ratio to move towards European norms
23
OUTLOOK…Contd.
Non -Underwriting
• Property / Leisure– Operating environment to remain challenging– New marketing strategies being implemented
• Financial Services– Falling premiums pressurising income– Increased sales activity planned
24
OUTLOOK…Contd.
Capital Retained
• Increasing dividend payout
• Opportunities to invest capital in core / related financial service businesses to be investigated
• All options to maximise returns to shareholders under ongoing review…….
• ………meanwhile , prudent investment.