Embed Size (px)
Citation preview
1
Introduction to Policy Introduction to Policy ProcessesProcesses
Dan Laitsch
2
OverviewOverview
Sign inBusiness
– Crashed blog– Grades and extensions
Review last class– Stats– Research– Policy
3
Class 2: Review Class 2: Review
Stats– Mean, median, mode– Variability– Correlations– Reliability and Validity
Research– Thanks tanks, advocacy, scholarship
Policy– Institutional rational choice– Multiple streams– Social construction
4
Class 3 AgendaClass 3 Agenda
Review Stats
– Hypotheses– Probability
PBL groups Small groups: Role play prep -Lunch- Role plays Policy readings PBL Groups
5
Part III: Part III: Taking Chances for Fun Taking Chances for Fun and Profitand Profit
Chapter 7 Hypotheticals and You: Testing Your Questions
6
What you learned in Chapter 7What you learned in Chapter 7
– The difference between samples and populations
– The importance of…The null hypothesisThe research hypotheses
– How to judge a good hypothesis
7
What is a hypothesis?What is a hypothesis?
An “educated guess”
Role is to reflect the general problem statement or question that is driving the research
Translates the problem or research question into a form that can be tested.
Not all good research requires a hypothesis
8
Samples and PopulationsSamples and Populations
Population– The large group to which you would like to
generalize your findings Sample
– The smaller, representative group of the population that is used to do the research
Sampling error – a measure of how well a sample represents the population
9
The Null HypothesisThe Null Hypothesis
Statements that contain two or more things that are equal (or unrelated) to one another
H0 : 1 = 2
– E.g. there is no difference between the two groups– Starting point and is accepted as true without knowing
more information– Benchmark to compare actual outcomes
0912:,H=0912:,H=
10
The Research HypothesisThe Research Hypothesis
Statement that there is a relationship between two variables
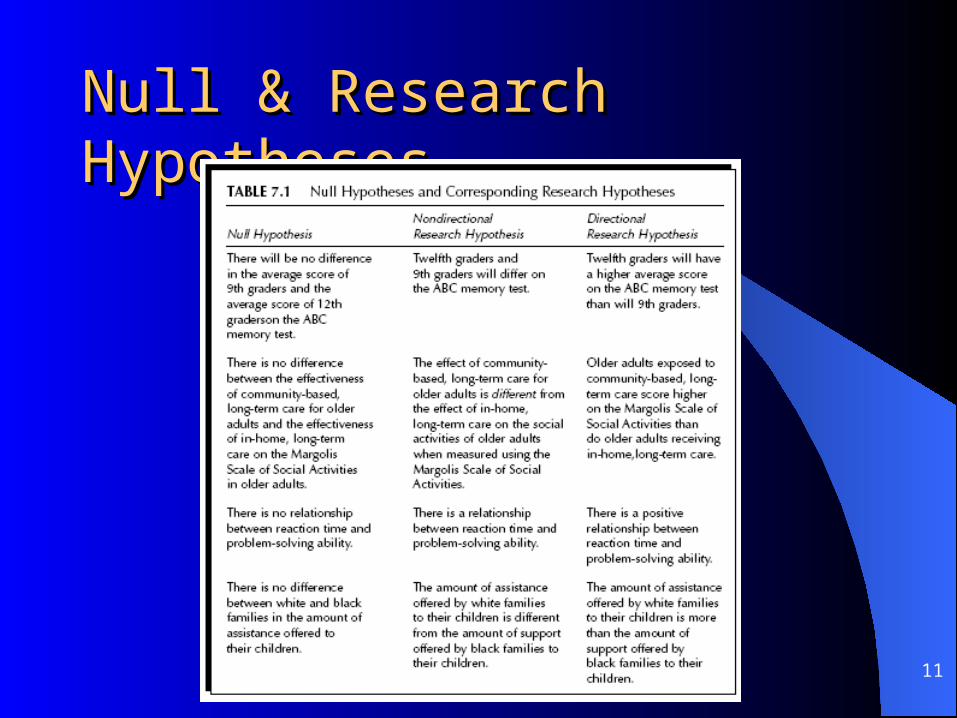
Two Types…– Nondirectional -- H1 : X1
≠ X2Reflects a difference; direction is not specifiedTwo-tailed test
– Directional -- H1 : X1 > X2Reflects a difference; direction is specifiedOne-Tailed test
11
Null & Research HypothesesNull & Research Hypotheses
12
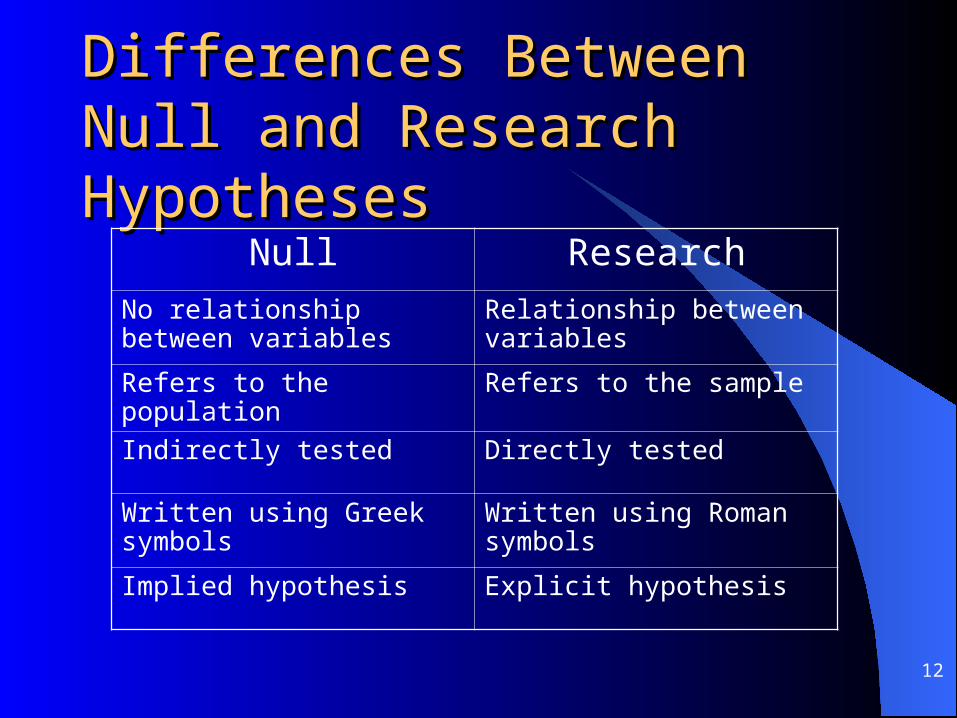
Differences Between Null and Differences Between Null and Research HypothesesResearch Hypotheses
Null Research
No relationship between variables
Relationship between variables
Refers to the population Refers to the sample
Indirectly tested Directly tested
Written using Greek symbols Written using Roman symbols
Implied hypothesis Explicit hypothesis
13
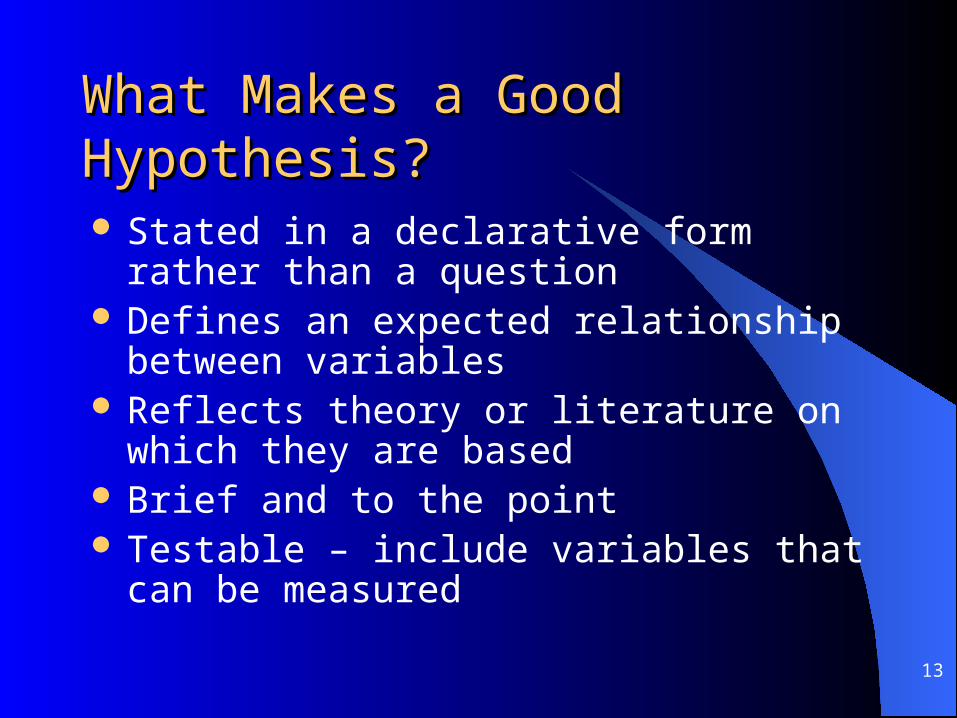
What Makes a Good Hypothesis?What Makes a Good Hypothesis?
Stated in a declarative form rather than a question
Defines an expected relationship between variables
Reflects theory or literature on which they are based
Brief and to the point Testable – include variables that can be measured
14
Glossary Terms to KnowGlossary Terms to Know
Hypothesis– Null Hypothesis
– Research Hypothesis Direction & Non-directional hypotheses One-tailed & Two-tailed test Population Sample
– Sampling error
15
Part III: Taking Chances for Fun and Part III: Taking Chances for Fun and ProfitProfit
Chapter 8 Are Your Curves Normal? Probability and Why it Counts
16
What you learned in Chapter 7What you learned in Chapter 7
Understanding probability is basic to understanding statistics
Characteristics of the “normal” curve– i.e. the bell-shaped curve
All about z scores– Computing them– Interpreting them
17
Why Probability?Why Probability?
Basis for the normal curve– Provides basis for understanding probability of
a possible outcomeBasis for determining the degree of
confidence that an outcome is “true”– Example:
Are changes in student scores due to a particular intervention that took place or by chance alone?
18
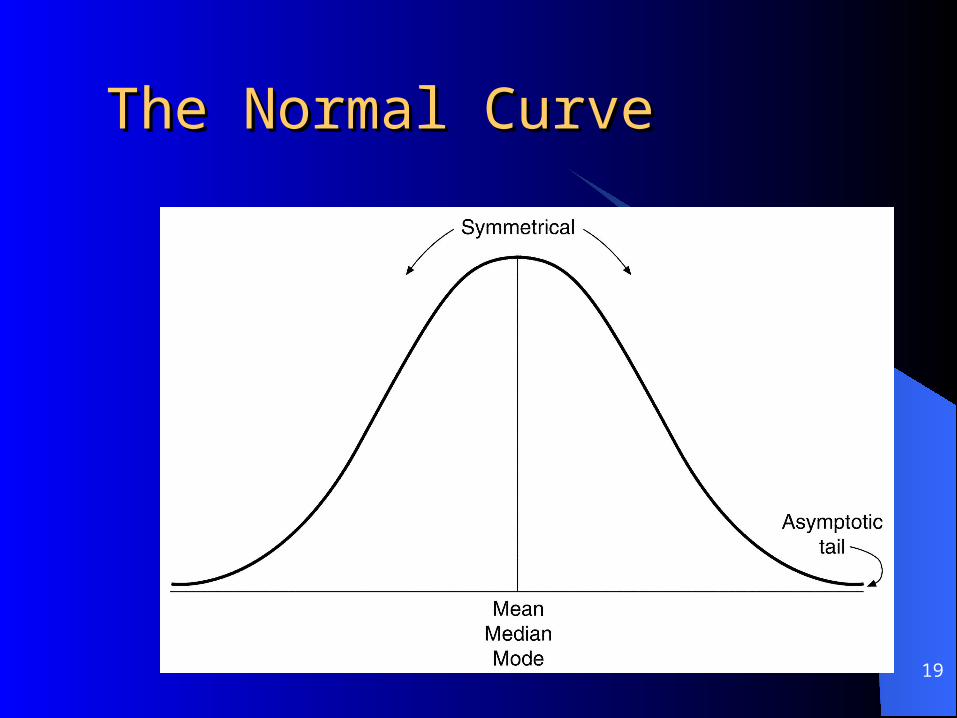
The Normal Curve The Normal Curve (a.k.a. the Bell-Shaped Curve)(a.k.a. the Bell-Shaped Curve)
Visual representation of a distribution of scores
Three characteristics…– Mean, median, and mode are equal to one
another– Perfectly symmetrical about the mean– Tails are asymptotic (get closer to horizontal
axis but never touch)
19
The Normal CurveThe Normal Curve
20
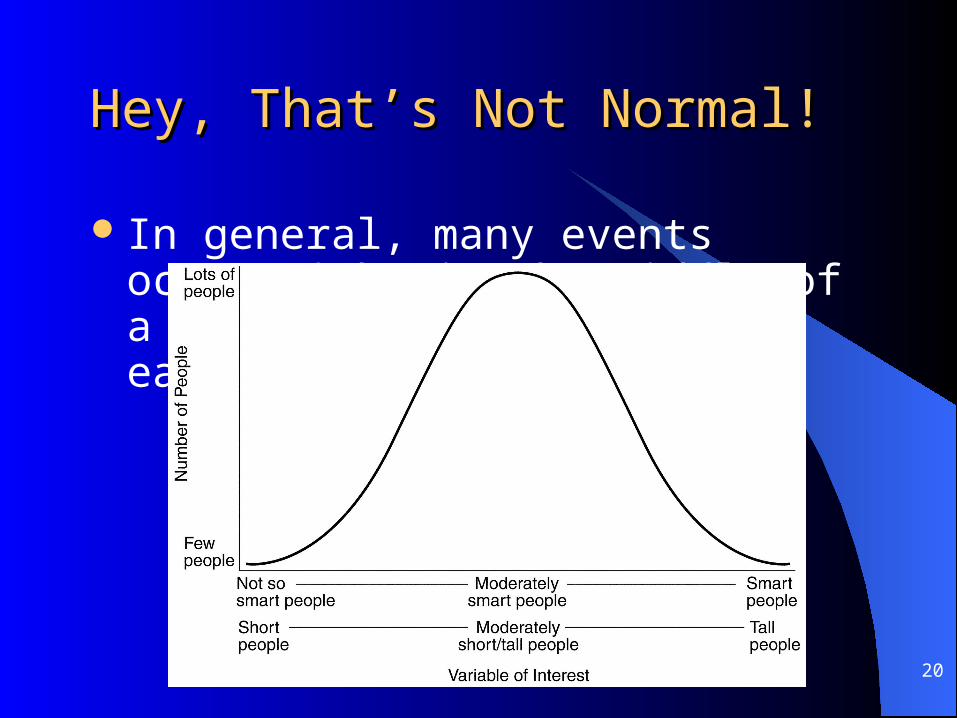
Hey, That’s Not Normal!Hey, That’s Not Normal!
In general, many events occur right in the middle of a distribution with few on each end.
21
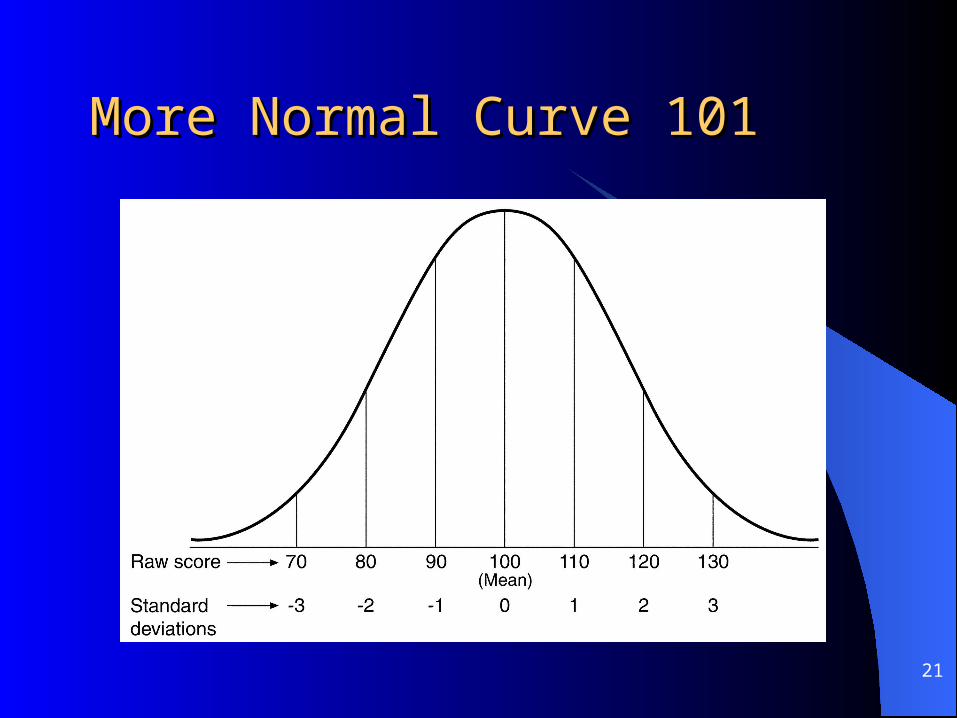
More Normal Curve 101More Normal Curve 101
22
More Normal Curve 101More Normal Curve 101
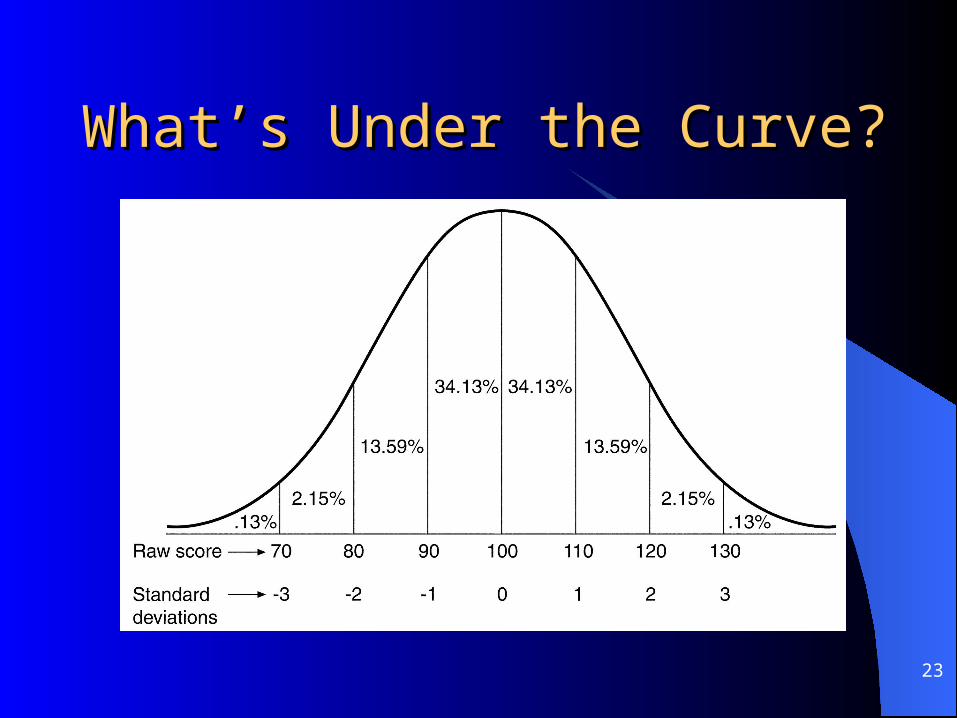
For all normal distributions…
– almost 100% of scores will fit between -3 and +3 standard deviations from the mean.
– So…distributions can be compared
– Between different points on the X-axis, a certain percentage of cases will occur.
23
What’s Under the Curve?What’s Under the Curve?
24
The The zz Score Score
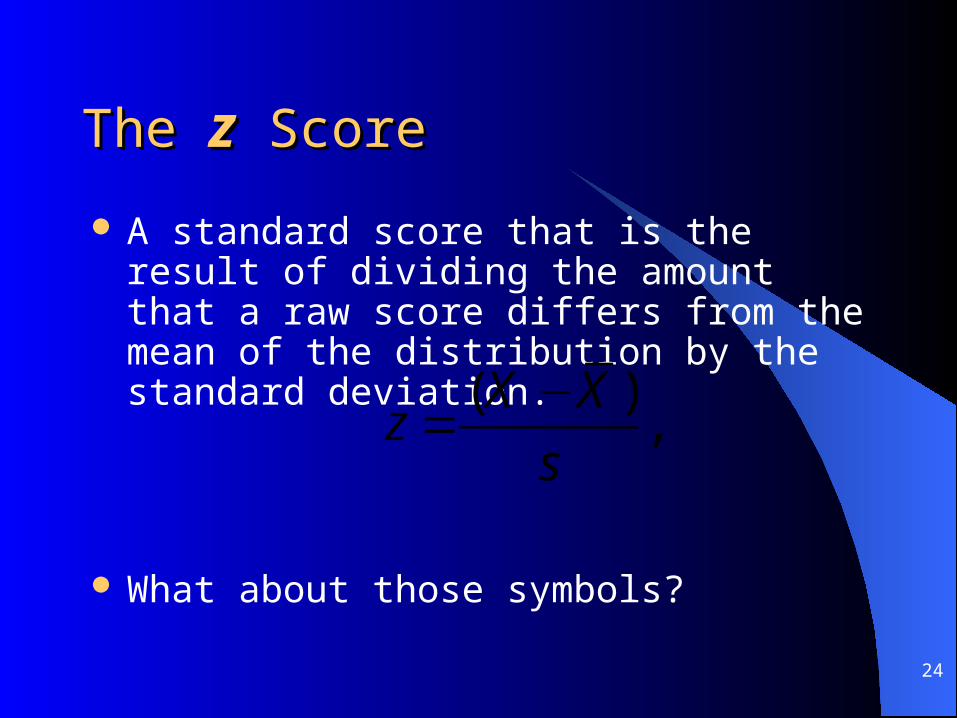
A standard score that is the result of dividing the amount that a raw score differs from the mean of the distribution by the standard deviation.
What about those symbols?
( ),
X Xz
s
−=
25
TheThe zz ScoreScore
Scores below the mean are negative (left of the mean) and those above are positive (right of the mean)
A z score is the number of standard deviations from the mean
z scores across different distributions are comparable
26
What What zz Scores Represent Scores Represent
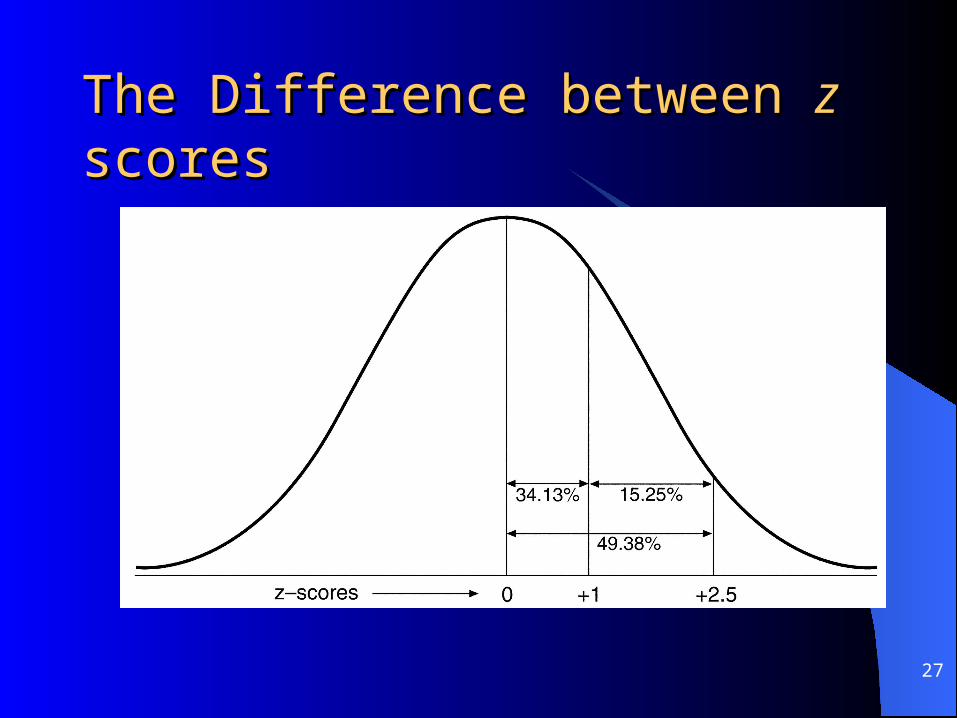
The areas of the curve that are covered by different z scores also represent the probability of a certain score occurring.
So try this one…– In a distribution with a mean of 50 and a
standard deviation of 10, what is the probability that one score will be 75 or above?
27
The Difference between The Difference between zz scores scores
28
What What zz Scores Really Scores Really RepresentRepresentKnowing the probability that a z score
will occur can help you determine how extreme a z score you can expect before determining that a factor other than chance produced the outcome
Keep in mind… z scores are typically reserved for populations.
29
Hypothesis Testing & Hypothesis Testing & zz ScoresScoresAny event can have a probability
associated with it.– Probability values help determine how
“unlikely” the even might be– The key --- less than 5% chance of occurring
and you have a significant result
30
Glossary Terms to KnowGlossary Terms to Know
ProbabilityNormal curve
– AsymptoticStandard Scores
– z scores
31
Small Group Roll PlaySmall Group Roll Play
Break into groups and plan role play
Lunch
Commence role play
32
Policy ReadingsPolicy Readings
Chapters 17-20– Political Parties– Business Associations– Labour Movement– Voluntary Sector
33
For Next ClassFor Next Class
Assignments for next class– Research Review. Small group work (as assigned by
the group). Readings:
– Studying Your Own School, Chapter 5– Statistics for People Who (think they) Hate Statistics,
Part 4 (Chapters 9-11)– Theories of the Policy Process: Part 3 & 4 (Chapters 5,
7, 8, 9)– Policy Analysis in Canada: Part 6 (Chapters 21-23)
End of day 2