Embed Size (px)
Citation preview
1
Machine Learning for BioinformaticsMachine Learning for Bioinformatics
2
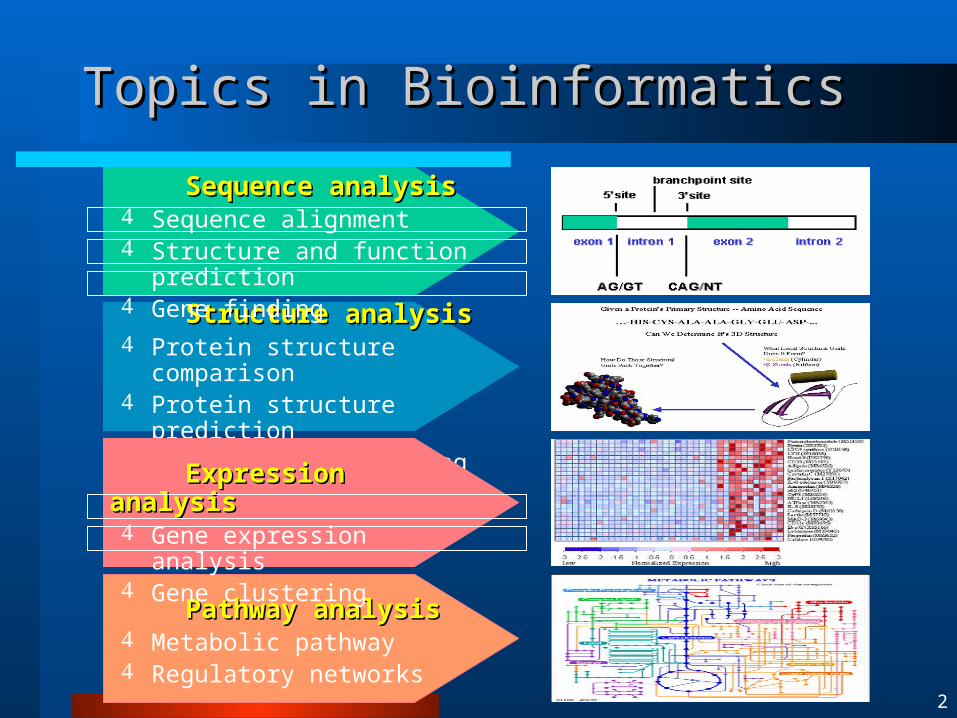
Topics in BioinformaticsTopics in Bioinformatics
Structure analysisStructure analysis Protein structure comparison Protein structure prediction RNA structure modeling
Pathway analysisPathway analysis Metabolic pathway Regulatory networks
Sequence analysisSequence analysis Sequence alignment Structure and function prediction Gene finding
Expression analysisExpression analysis Gene expression analysis Gene clustering
3
Sequence AlignmentSequence Alignment
Bio-sequence 의 유사성을 측정 Sequence alignment 는 bioinformatics 의 여러 분야에서 널리 사용되는 개념
4
Sequence AlignmentSequence Alignment 의 응용의 응용 Database 검색
Sequence 가 유사한 gene 은 기능도 유사할 확률이 높음 새로 밝혀낸 gene 이 어떤 기능을 하는지 알아내기 위해서
이미 기능이 밝혀진 gene 들이 저장되어 있는 database에서 유사한 sequence 를 갖는 gene 을 검색할 필요가 있음
Genome sequencing Overlap 이 있는 sequence 조각들로부터 긴 sequence 를
재조합 할 때 sequence alignment 를 이용함 Comparative genomics
실험이 용이한 하등 동물의 정보를 이용하여 고등 동물의 gene 을 밝혀냄
예 : 인간과 쥐의 gene 은 매우 유사함 실험을 통해 쥐의 gene 들의 기능을 밝힘 기능이 밝혀진 쥐의 gene의 서열과 유사한 인간의 서열을 찾으면 이 부분이 같은 기능을 하는 인간의 gene 일 가능성이 높음
5
Sequence AlignmentSequence Alignment 의 응용의 응용 Gene finding
인간과 쥐의 exon 부분의 유사도는 평균 85% 이지만 intron 부분의 평균 35% 정도임
인간과 쥐의 genome sequence 에서 유사도가 높은 부분을 찾으면 , 이 부분은 exon 일 확률이 크다 .
단백질의 기능 , 구조 예측 아미노산 sequence 가 유사하면 단백질의 기능 , 3 차원
구조도 유사할 가능성이 높음 단백질 아미노산 sequence 를 새로 밝혀냈을 때 , 유사한
아미노산 sequence 를 갖는 단백질을 찾아 단백질의 기능 , 3 차원 구조를 예측할 수 있음 .
6
Global AlignmentGlobal Alignment
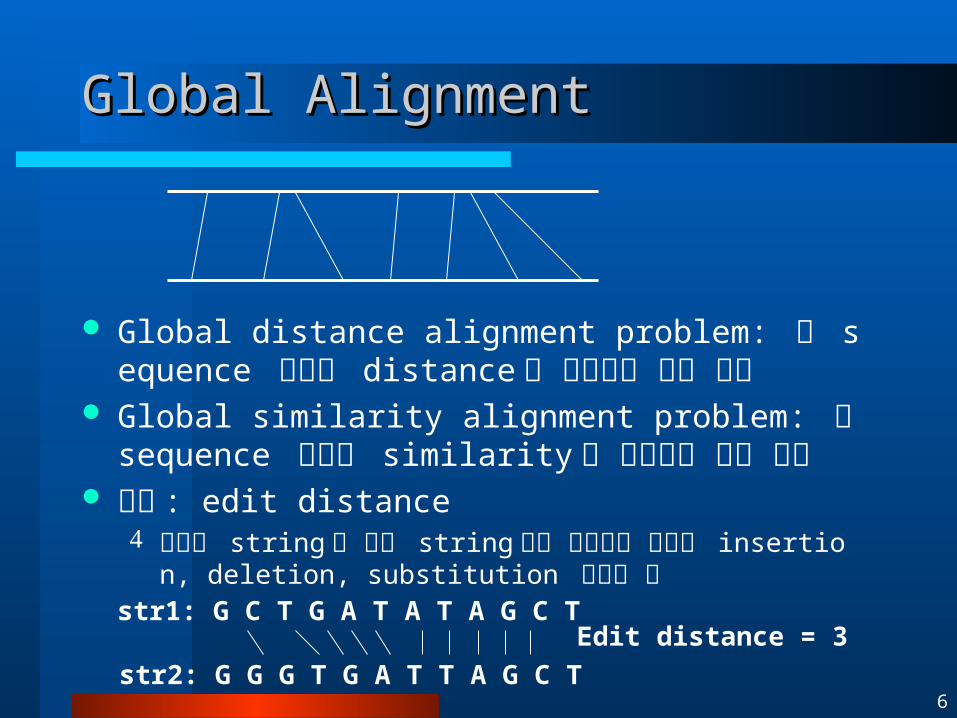
Global distance alignment problem: 두 sequence 사이의 distance 의 최소값을 찾는 문제
Global similarity alignment problem: 두 sequence 사이의 similarity 의 최대값을 찾는 문제
참고 : edit distance 하나의 string 을 다른 string 으로 바꾸는데 필요한 insertio
n, deletion, substitution 연산의 수str1: G C T G A T A T A G C T
str2: G G G T G A T T A G C TEdit distance = 3
7
Local AlignmentLocal Alignment
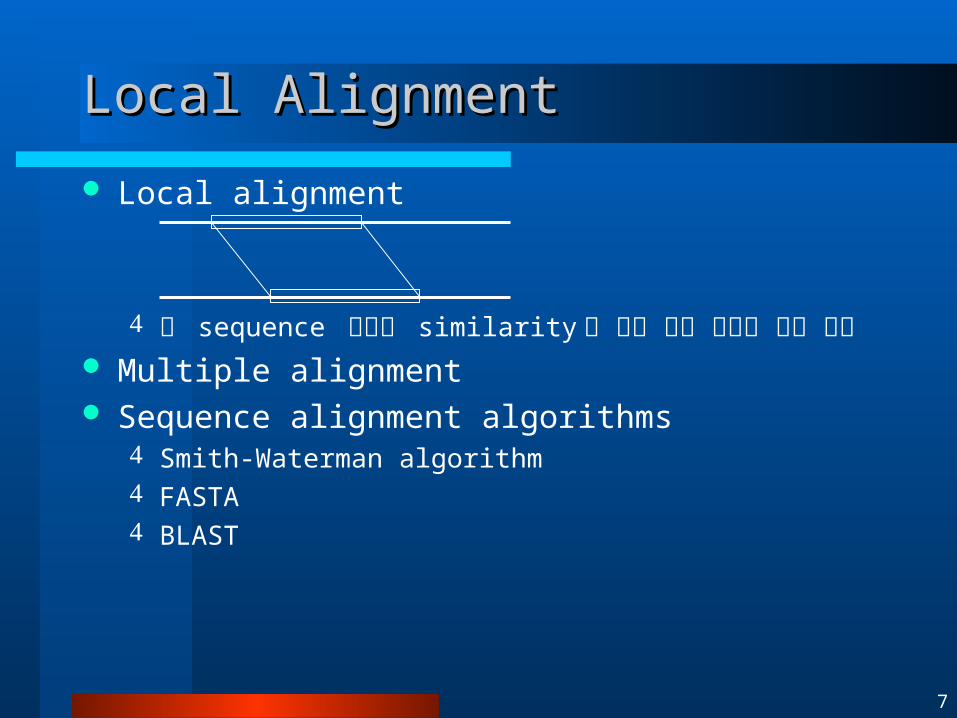
Local alignment
두 sequence 사이에 similarity 가 가장 높은 부분을 찾는 문제
Multiple alignment Sequence alignment algorithms
Smith-Waterman algorithm FASTA BLAST
8
Genetic Algorithms:Genetic Algorithms: RepresentationRepresentation
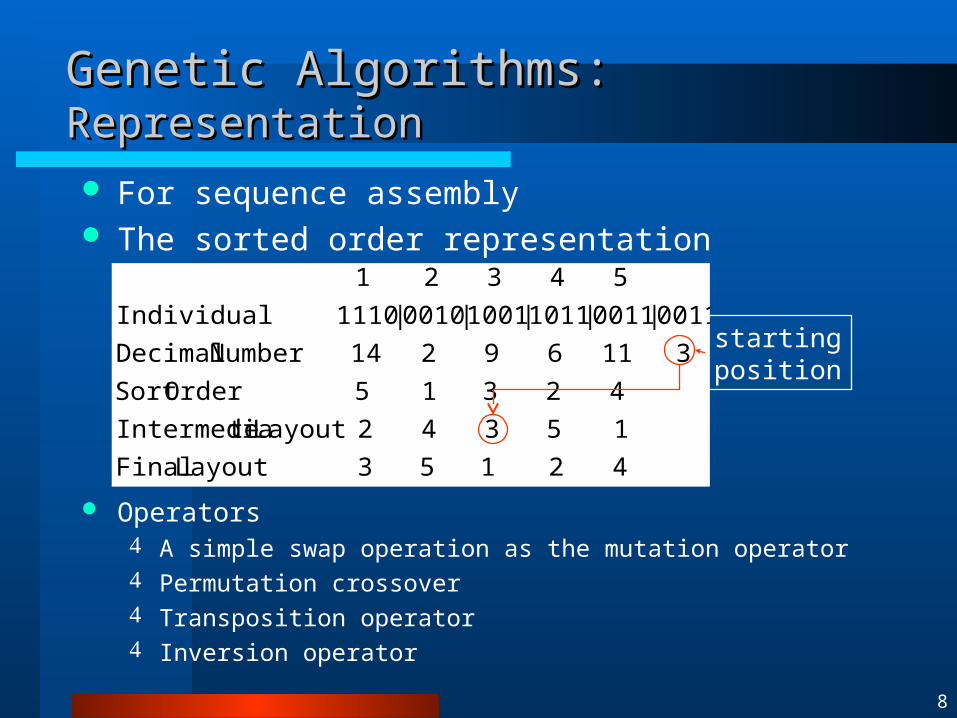
For sequence assembly The sorted order representation
Operators A simple swap operation as the mutation operator Permutation crossover Transposition operator Inversion operator
4 2 1 5 3 Layout Final
1 5 3 4 2 Layout teIntermedia
4 2 3 1 5 Order Sort
3 11 6 9 2 14 Number Decimal
0011|0011|1011|1001|0010|1110 Individual
5 4 3 2 1
startingposition
9
Structure and Function PredictionStructure and Function Prediction
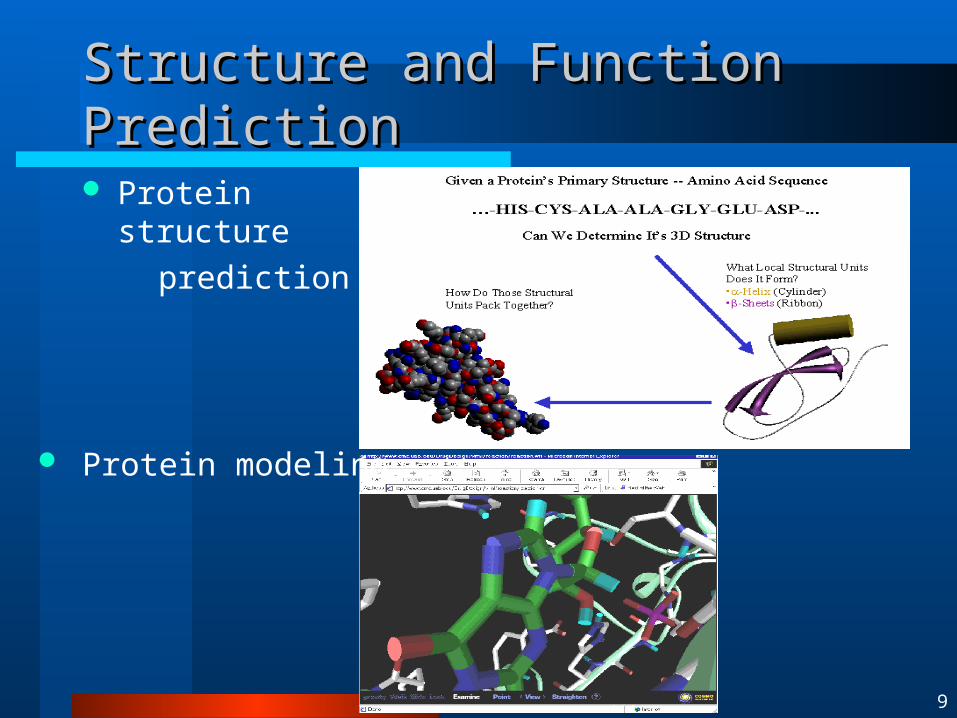
Protein structure
prediction
Protein modeling
10
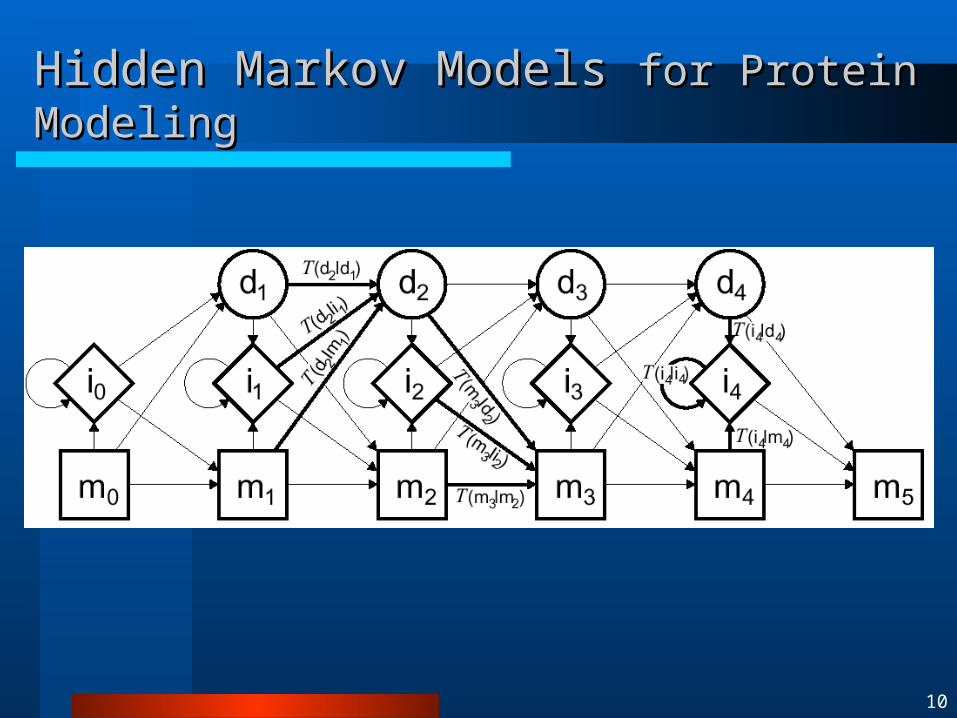
Hidden Markov Models Hidden Markov Models for Protein Modelingfor Protein Modeling
11
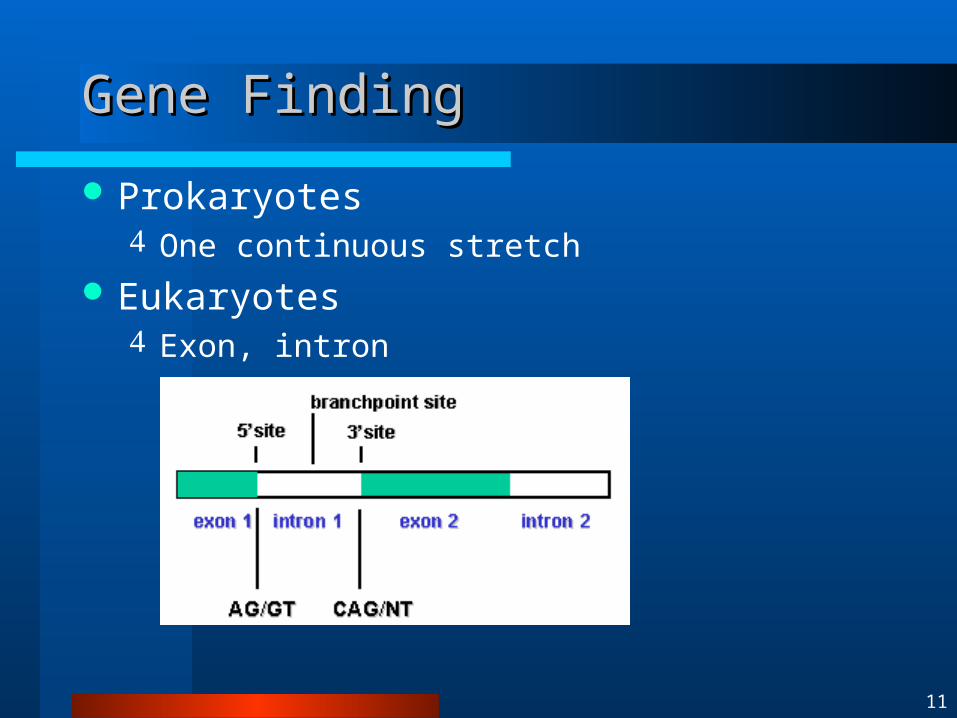
Gene FindingGene Finding
Prokaryotes One continuous stretch
Eukaryotes Exon, intron
12
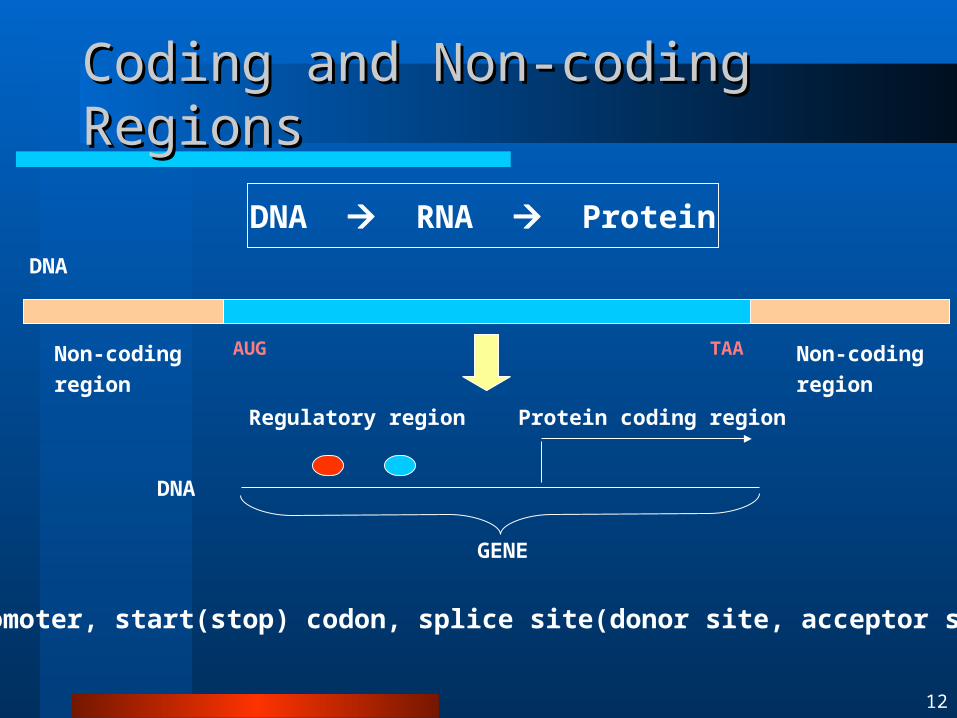
Coding and Non-coding RegionsCoding and Non-coding Regions
DNA
Regulatory region Protein coding region
DNA RNA Protein
GENE
DNA
Non-coding
region
Non-coding
region
AUG TAA
promoter, start(stop) codon, splice site(donor site, acceptor site)
13
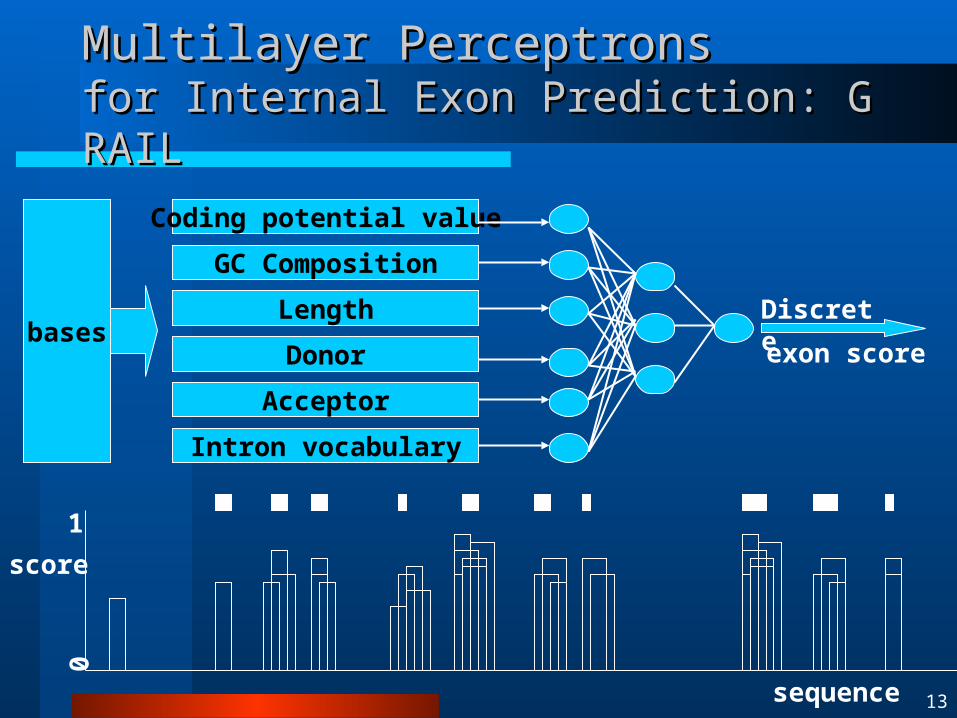
Multilayer PerceptronsMultilayer Perceptronsfor Internal Exon Prediction: GRAIL for Internal Exon Prediction: GRAIL
Coding potential value
GC Composition
Length
Donor
Acceptor
Intron vocabulary
basesDiscreteexon score
0
1
sequence
score
14
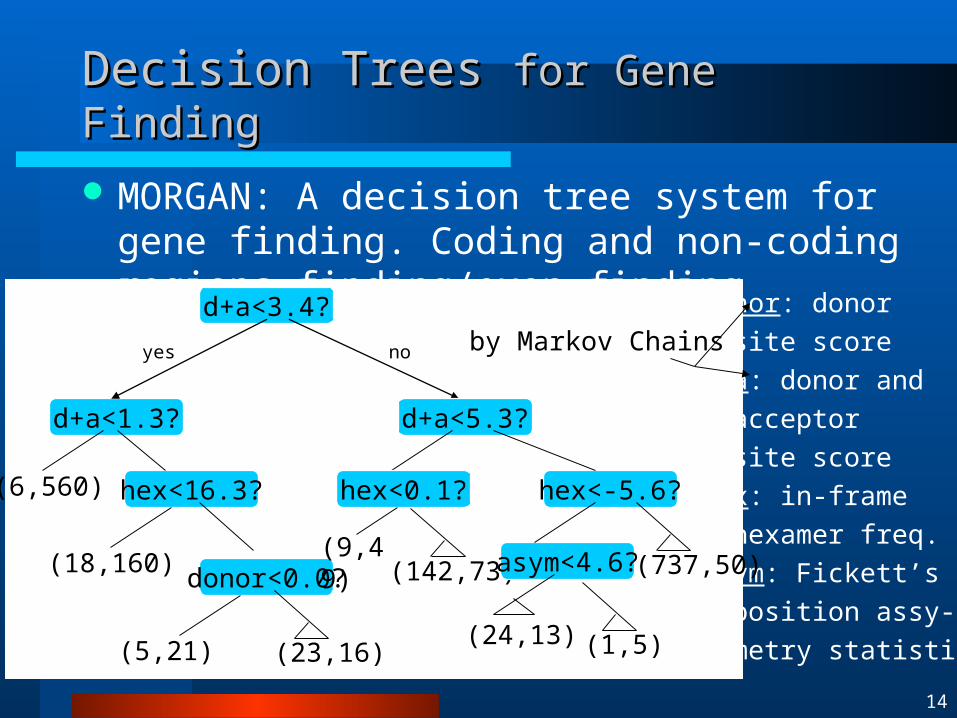
Decision Trees Decision Trees for Gene Findingfor Gene Finding
MORGAN: A decision tree system for gene finding. Coding and non-coding regions finding/exon finding
donor: donor
site score
d+a: donor and
acceptor
site score
hex: in-frame
hexamer freq.
asym: Fickett’s
position assy-
metry statistic
d+a<3.4?
d+a<1.3?
hex<16.3?
donor<0.0?
yes
(6,560)
(18,160)
(5,21) (23,16)
d+a<5.3?
hex<0.1?
(9,49)(142,73)
hex<-5.6?
asym<4.6?
(24,13) (1,5)
(737,50)
no by Markov Chains
15
Gene Expression AnalysisGene Expression Analysis(Section 1-2)(Section 1-2)
Gene expression Transcription 과 translation 과정을 통하여 gene 이 protein
으로 발현되는 것 Gene expression level 은 gene 의 기능에 대한 단서를 제공
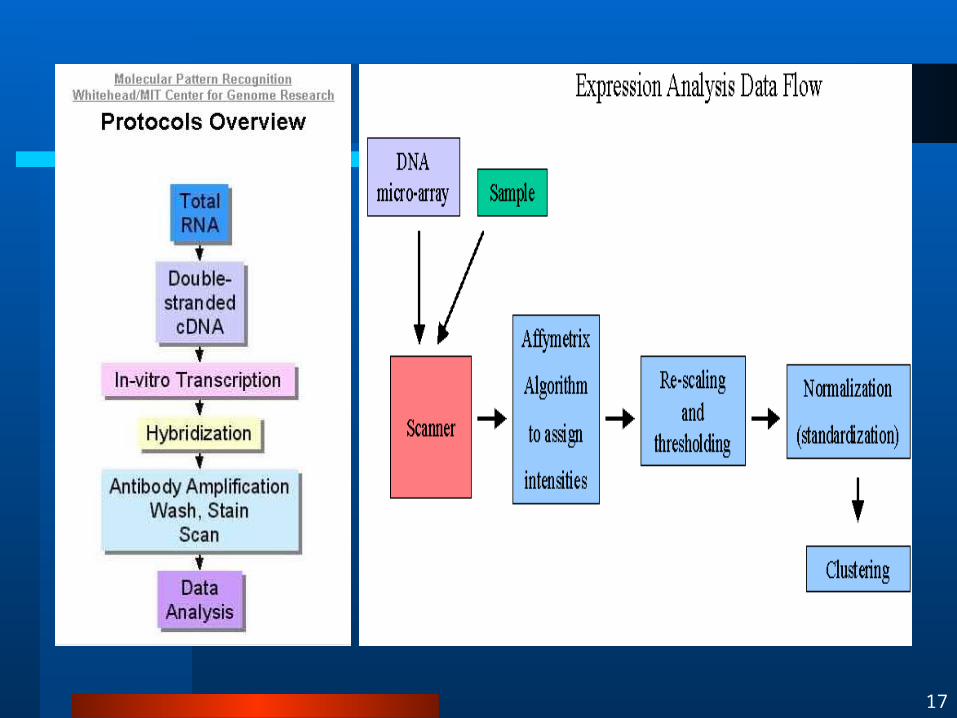
DNA chip 을 통해 세포의 gene expression level 을 효율적으로 알아낼 수 있음
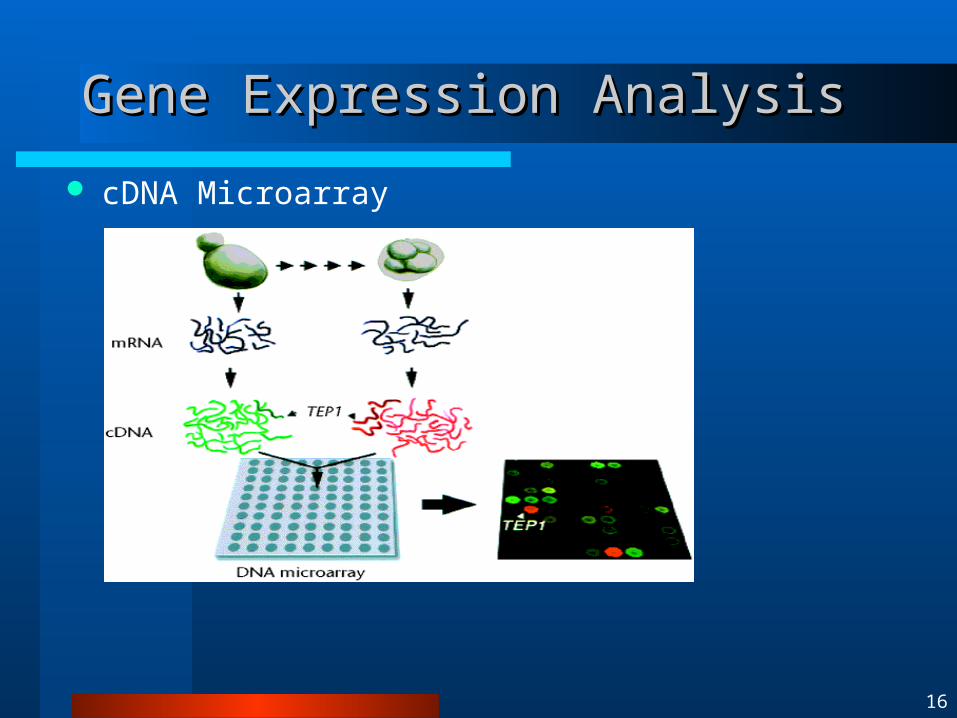
Gene expression analysis 과정 알려진 gene sequence 를 이용하여 DNA chip 을 제작 Target 세포에서 mRNA 를 추출하여 cDNA 를 만들고 DN
A chip 에 가하면 hybridization 이 일어남 Hybridization 이 일어난 정도를 분석하면 gene expression
정도를 알 수 있음
16
Gene Expression AnalysisGene Expression Analysis
cDNA Microarray
17
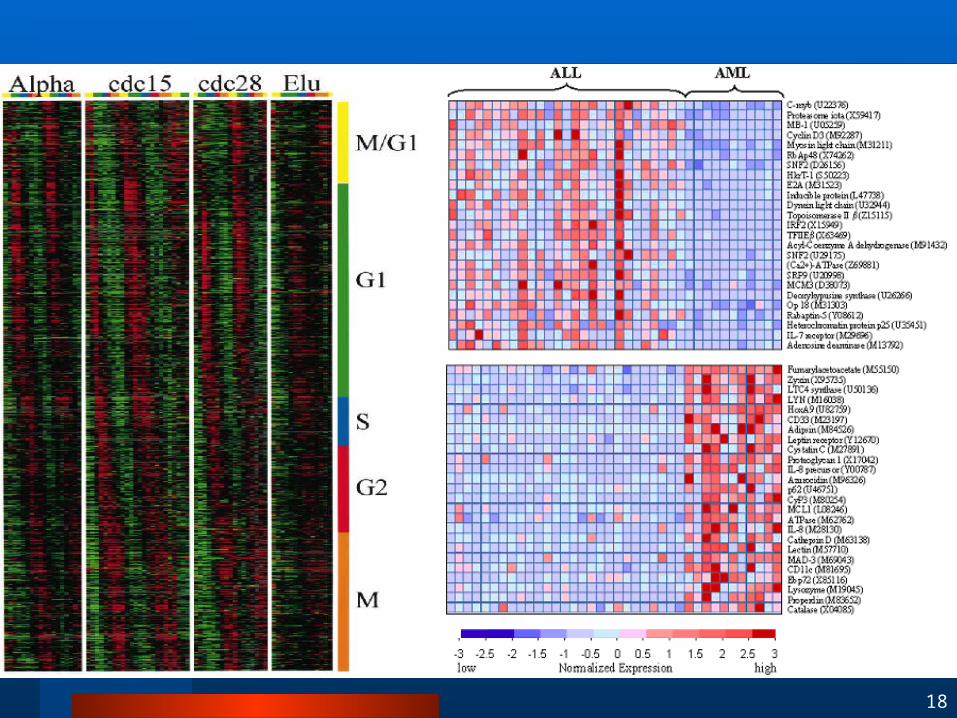
18
19
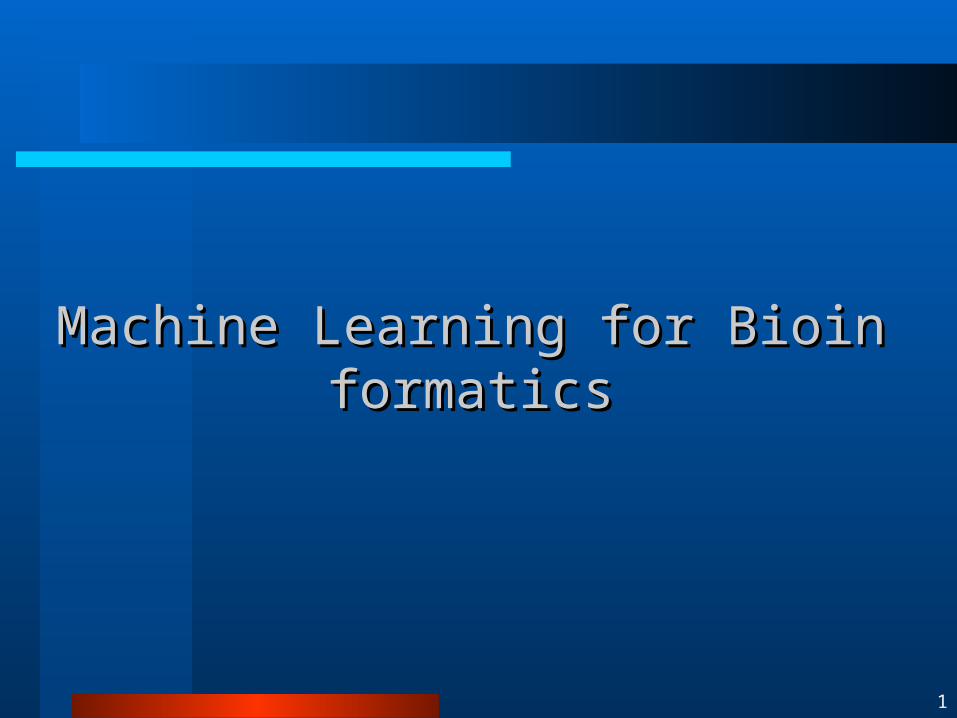
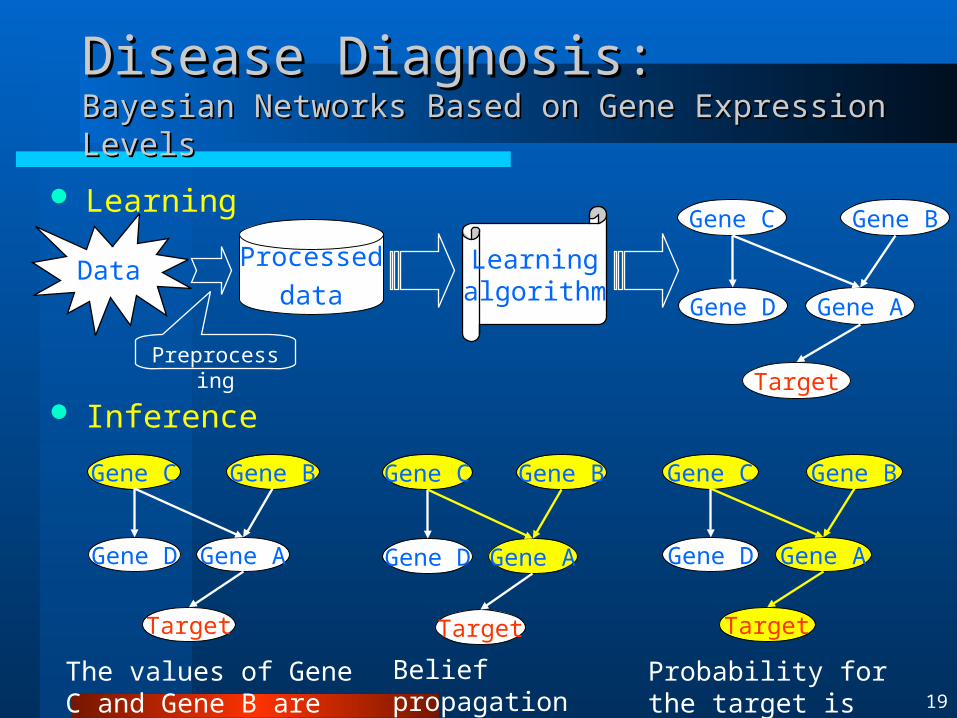
Disease Diagnosis:Disease Diagnosis:Bayesian Networks Based on Gene Expression LevelsBayesian Networks Based on Gene Expression Levels
Processed
dataData
Preprocessing
Learningalgorithm
Gene C Gene B
Gene A
Target
Gene D
Gene C Gene B
Gene A
Target
Gene D
Gene C Gene B
Gene A
Target
Gene D
Gene C Gene B
Gene A
Target
Gene D
The values of Gene C and Gene B are given.
Belief propagation Probability for the target is computed.
Learning
Inference
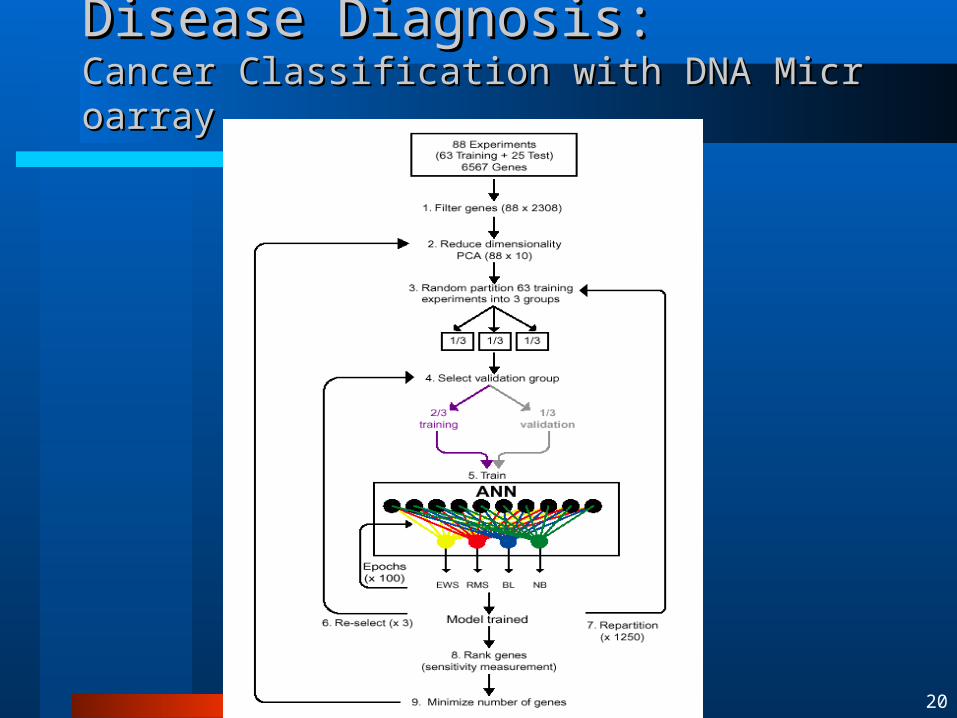
20
Disease Diagnosis:Disease Diagnosis:Cancer Classification with DNA MicroarrayCancer Classification with DNA Microarray