Embed Size (px)
Citation preview

Correlating cell wall properties in diverse h lk lgrasses to their response to alkaline
pretreatment and enzymatic hydrolysis
Feedstock II – Biomass Physicochemical Analysis
1 May, 2014
36th SIM SBFC36th SIM SBFC
Muyang Li, Daniel Williams, and David Hodge
www.glbrc.org

Scope of WorkScope of Work
• Introduction to alkaline pretreatment• Introduction to alkaline pretreatment
• Correlating cell wall properties to g p puntreated and pretreated hydrolysis yieldsyields
• Chemometric models for composition and hydrolysis yield prediction

Scope of WorkScope of Work
• Introduction to alkaline pretreatment• Introduction to alkaline pretreatment
• Correlating cell wall properties to g p puntreated and pretreated hydrolysis yieldsyields
• Chemometric models for composition and hydrolysis yield prediction

Soda Pulping of Non‐Wood Feedstocks
Tamil Nadu Newsprint and Papers Limited:p p4 million tonnes/yr sugar cane bagasse to bleached pulpWorld’s largest non‐wood pulp and paper mill O2 delignification
Sappi’s Stanger Mill, KwaZulu‐Natal, South Africa O2 delignification
Kimberly Clark’s Orizaba Mill,Veracruz, Mexico
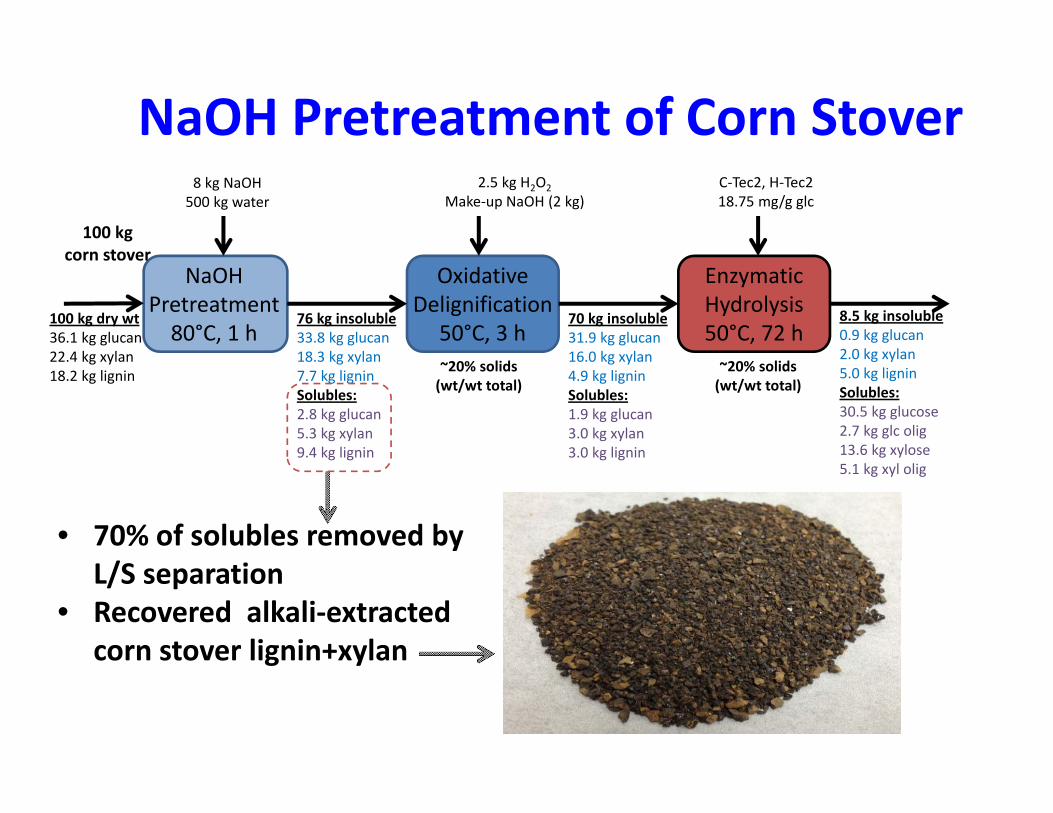
NaOH Pretreatment of Corn Stover
100 kg corn stover
8 kg NaOH500 kg water
2.5 kg H2O2
Make‐up NaOH (2 kg)C‐Tec2, H‐Tec218.75 mg/g glc
NaOHPretreatment 80°C, 1 h
Oxidative Delignification
50°C, 3 h
Enzymatic Hydrolysis50°C, 72 h
corn stover
100 kg dry wt36.1 kg glucan22 4 kg xylan
76 kg insoluble33.8 kg glucan18 3 kg xylan
70 kg insoluble31.9 kg glucan16 0 kg xylan
8.5 kg insoluble0.9 kg glucan2 0 kg xylan22.4 kg xylan
18.2 kg lignin18.3 kg xylan7.7 kg ligninSolubles: 2.8 kg glucan5.3 kg xylan9.4 kg lignin
16.0 kg xylan4.9 kg ligninSolubles: 1.9 kg glucan3.0 kg xylan3.0 kg lignin
2.0 kg xylan5.0 kg ligninSolubles: 30.5 kg glucose2.7 kg glc olig13.6 kg xylose
~20% solids (wt/wt total)
~20% solids (wt/wt total)
g g g g5.1 kg xyl olig
• 70% of solubles removed by /L/S separation
• Recovered alkali‐extracted corn stover lignin+xylang y

NaOH Pretreatment of Corn Stover
100 kg corn stover
8 kg NaOH500 kg water
2.5 kg H2O2
Make‐up NaOH (2 kg)C‐Tec2, H‐Tec218.75 mg/g glc
8.5 kg insoluble0.9 kg glucan2 0 kg xylan
NaOHPretreatment 80°C, 1 h
Oxidative Delignification
50°C, 3 h
Enzymatic Hydrolysis50°C, 72 h
corn stover
100 kg dry wt36.1 kg glucan22 4 kg xylan
76 kg insoluble33.8 kg glucan18 3 kg xylan
70 kg insoluble31.9 kg glucan16 0 kg xylan 2.0 kg xylan
5.0 kg ligninSolubles: 30.5 kg glucose2.7 kg glc olig13.6 kg xylose
22.4 kg xylan18.2 kg lignin
18.3 kg xylan7.7 kg ligninSolubles: 2.8 kg glucan5.3 kg xylan9.4 kg lignin
16.0 kg xylan4.9 kg ligninSolubles: 1.9 kg glucan3.0 kg xylan3.0 kg lignin
~20% solids (wt/wt total)
~20% solids (wt/wt total)
5.1 kg xyl olig
Techno‐economic model based 20 2 l
Recovery of alkali by recausticizationPretreatment and chemical recovery:
g g g g
on 2012 NREL Aspen Plus model for 2000 ton per day plant (Andrea Orjuela, Bruce Dale Group, MSU)
Pretreatment and chemical recovery:Capital costs $50MNet water use in pretreatment 2 m3/ton biomassNet thermal energy use ‐200 MJ/ton biomass p, )MESP $2.07 / gal EtOH
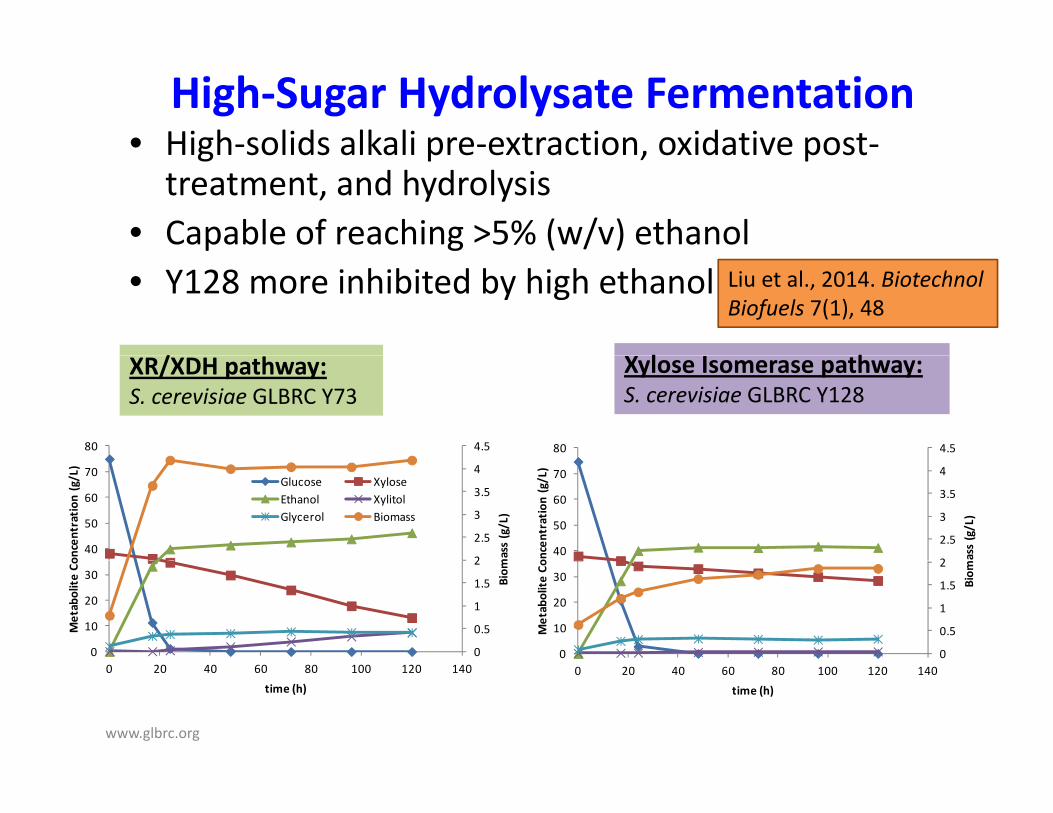
High‐Sugar Hydrolysate Fermentation• High‐solids alkali pre‐extraction oxidative post‐High solids alkali pre extraction, oxidative posttreatment, and hydrolysis
• Capable of reaching >5% (w/v) ethanol• Y128 more inhibited by high ethanol
/ l h
Liu et al., 2014. BiotechnolBiofuels 7(1), 48
4.580 4.580
XR/XDH pathway:S. cerevisiae GLBRC Y73
Xylose Isomerase pathway:S. cerevisiae GLBRC Y128
2
2.5
3
3.5
4
40
50
60
70
mass (g/L)
oncentration
(g/L)
Glucose XyloseEthanol XylitolGlycerol Biomass
2
2.5
3
3.5
4
40
50
60
70
ass (g/L)
oncentration
(g/L)
0
0.5
1
1.5
2
0
10
20
30 Biom
Metabolite Co
0
0.5
1
1.5
2
0
10
20
30 Biom
Metabolite C o
www.glbrc.org
0 20 40 60 80 100 120 140
time (h)0 20 40 60 80 100 120 140
time (h)

Scope of WorkScope of Work
• Introduction to alkaline pretreatment• Introduction to alkaline pretreatment
• Correlating cell wall properties to g p puntreated and pretreated hydrolysis yieldsyields
• Chemometric models for composition and hydrolysis yield prediction

Cell Wall Properties Impacting Pretreatability, Ruminant Digestibility, and Cellulolytic Enzyme Hydrolyzability
Structural DifferencesGenotype Phenotype
– Ratio of cell types? • Epidermis• SclerenchymaEnvironmental/agronomic Sclerenchyma• Vascular bundle zone cells• Pith parenchyma
– Cell wall thickness
Environmental/agronomic– Harvest time/maturity
– N, water, environment,… – Cell wall thickness, composition, accessibility,…
Composition80
90
100
Unassigned
Ash
– Lignin, structural polysaccharides
pCA and FA30
40
50
60
70
Compo
sition
(wt %)
Ash
Water+EtOH ExtractivesAcetate
Lignin
Uronic Acids
Galactan
Mannan
Arabinan
MaizeSwitchgrass
– pCA and FA
– Acetyl 0
10
20
Corn stover Switchgrass
Arabinan
Xylan
Glucan
(Pioneer hybrid 36H56) (cv. Cave-in-Rock)
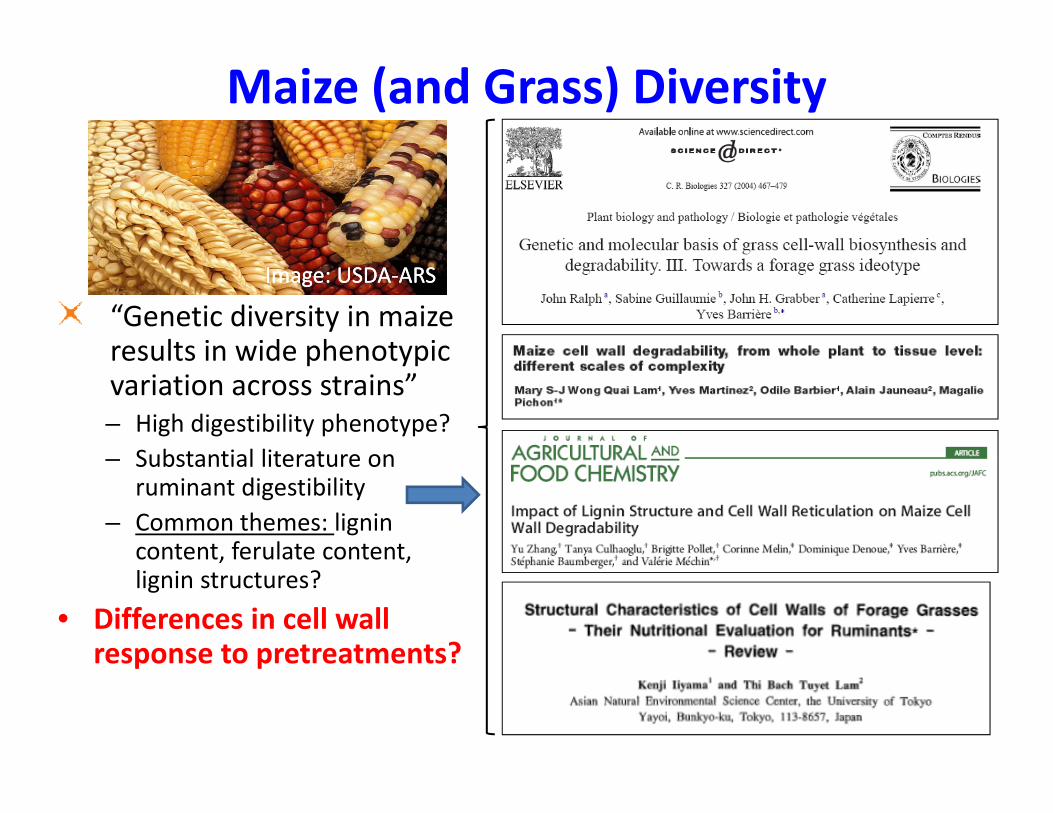
Maize (and Grass) Diversity
“Genetic diversity in maize results in wide phenotypic
Image: USDAImage: USDA‐‐ARSARS
results in wide phenotypic variation across strains”– High digestibility phenotype?
Substantial literature on– Substantial literature on ruminant digestibility
– Common themes: lignin content, ferulate content, , ,lignin structures?
• Differences in cell wall response to pretreatments?response to pretreatments?
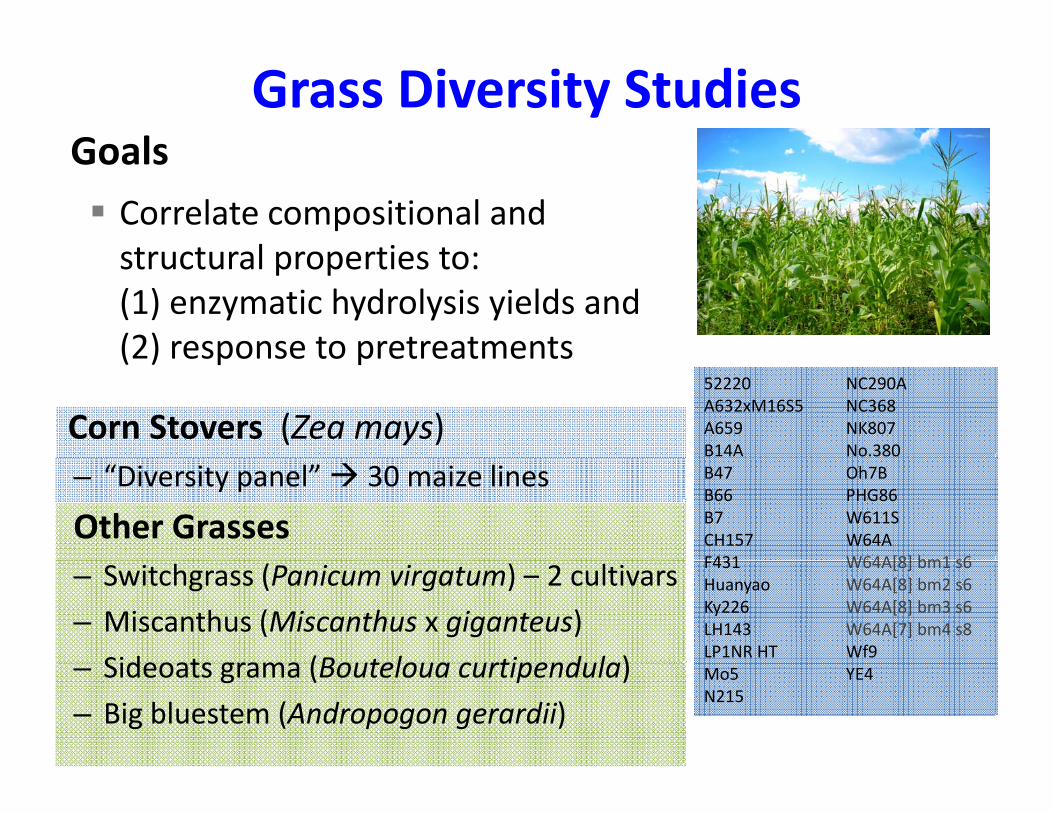
Grass Diversity Studies GoalsGoals
Correlate compositional and structural properties to:structural properties to: (1) enzymatic hydrolysis yields and (2) response to pretreatments
Corn Stovers (Zea mays)52220 A632xM16S5A659 B14A
NC290A NC368 NK807 No.380
(2) response to pretreatments
– “Diversity panel” 30 maize lines
Other Grasses
B47 B66 B7 CH157 F431
Oh7B PHG86 W611S W64A W64A[8] bm1 s6– Switchgrass (Panicum virgatum) – 2 cultivars
– Miscanthus (Miscanthus x giganteus)
Sideoats grama (Bouteloua curtipendula)
F431 HuanyaoKy226 LH143 LP1NR HT
W64A[8] bm1 s6 W64A[8] bm2 s6W64A[8] bm3 s6 W64A[7] bm4 s8 Wf9 – Sideoats grama (Bouteloua curtipendula)
– Big bluestem (Andropogon gerardii)Mo5 N215
YE4

Grass Diversity Studies GoalsGoals
Correlate compositional and structural properties to:structural properties to: (1) enzymatic hydrolysis yields and (2) response to pretreatments
Corn Stovers (Zea mays)
(2) response to pretreatments
– “Diversity panel” 30 maize lines
Other Grasses– Switchgrass (Panicum virgatum) – 2 cultivars
– Miscanthus (Miscanthus x giganteus)
Sideoats grama (Bouteloua curtipendula)– Sideoats grama (Bouteloua curtipendula)
– Big bluestem (Andropogon gerardii)

Maize Cell Wall Digestibility Screening, Property Correlation, and Yield PredicationProperty Correlation, and Yield Predication
Diverse Mild Alkaline Pretreatment
Enzymatic Hydrolysis (30 mg protein/gSolids
GrassesPretreatment
(0.08 g NaOH/g, 80˚C, 1hr )
(30 mg protein/g glucan C‐Tec2, pH 5.0, 50˚C, 6 or 72 h)
Solids
Liquor
Water Retention Value lignin
Solubilized pCAand FA
Solids Hydrolysis Yields
Water Retention Value, lignin,xylan, pCA, FA, acetate
Multiple Linear Regression Models
Py‐MBMSg
Chemometric Models

18
pCA
Ferulate (FA) and p‐coumarate (pCA)GLBRC
10
12
14
16
nten
t (mg/g)
FA
14
16
18
GLBRCSwitchgrass
GLBRCMiscanthus
GLBRC Corn Stover
4
6
8
Cinn
amate Co
n
6
8
10
12
pCA (m
g/g)
Switchgrass “Cave‐In‐Rock”
Big Bluestem
0
2
W64A
F431 B47
Ky226
8]bm
1 S6
B66
LP1N
R HT
Mo5
7] bm4 S8
PHG86
8]bm
2 S6
CH157
01LFY/LFY …
NC2
90A B7
Wf9
NC3
68Oh7
BNo.380
A659
NK8
07N215
8]bm
3 S7
52220
UAN YAO
LH143
B14A
W611S YE4
0
2
4
0 5 10 15 20
Maize Diversity Set
Other Grasses
Sideoats Grama
y = 0.2743x + 8.0551R² = 0.1425
12
14
16
al biomass)W
64A[8 L
W64A[7
W64A[8
INB 10
W64A[8 HU
FA (mg/g)
• Range of pCA and FA contentsW k l i b CA d
4
6
8
10
tent (m
g/g origin
No Treatment
NaOH Treatment
• Weak correlation between pCA and FA contents
• Both are removed with mild NaOHy = 0.4911x + 2.6247
R² = 0.41030
2
4
0 5 10 15 20
FA co
n
pCA content (mg/g original biomass)
Both are removed with mild NaOHtreatment

40
45
50(m
g/g)
0.05
Acetyl and Arabinosyl Content
20
25
30
35
cetate Con
tent
0.035
0.04
0.045
ntent (g/g)
0
5
10
15
B 7 9 5 0 7 T 8 1 A S 6 9 7 6 7 A 6 8 3 6 5 O 0 4 A
Cell Wall A
c
0.02
0.025
0.03
Acetate Co
Range of substitutions from
Diverse range of acetyl contents
Oh7
BCH
157
A659
Mo5
52220
B47
LP1N
R HT
W64A[7] b
m4 S8
F431
INB 101LFY/LFY
W64A
W611S
B66
Wf9 B7
PHG86
NK8
07NC2
90A
Ky226
NC3
68LH
143
W64A[8]bm2 S6
N215
HUAN YAO
No.380
YE4
B14A
N l ti b t t l
0.0150.1 0.15 0.2 0.25 0.3
Xylan Content (g/g)0.06
0.25 – 0.60 Ac:Xyl (mol:mol)
• No correlation between acetyl content and xylose content
COOHMeOC
HO
HO
0.04
0.05
tent (g/g)
Monocots (grasses)
o
OHHO
o o
o
CH2OH
OH
OH
o
o o
HO
o
o
CH2OH
OH
OH
o
-(1→4)-β-D-Xylp-(1→4)-β-D-Xylp-(1→4)-β-D-Xylp-(1→4)-β-D-Xylp-(1→4)-β-D-Xylp-(1→4)-β-D-Xylp-
y = 0.1004x + 0.0262R² = 0.2775
0.02
0.03
rabino
se Con
t
Range of substitutions from
0
0.01
0.1 0.15 0.2 0.25 0.3
Ar
Xylan Content (g/g)
Range of substitutions from 0.19 – 0.28 Ara:Xyl (mol:mol)

Interactions Between Water and Pretreated Biomass
80%
100%
sion R2=0.900
Water Retention Value (g/g) 40%
Bou
nd
AHP Corn Stover
Does not distinguish f ifi
Yield
40%
60%
Glu
can
Con
vers R² = 0.995
20%
30%
ion
Enz
ymes
B from non-specific binding
e Hydrolysis
0%
20%7 D
ay G AHP SG
LHW-AHP SG
AHP CS
LHW-AHP CSCS Corn StoverSG Switchgrass
Williams and Hodge (2014). Cellulose. 21(1):221‐235
10%
Frac
ti
Glucose
0%1.4 2.0 2.6 3.2 3.8 4.4
Water Swelling
• WRV is a very good predictor of hydrolysis yields
0%2.0 2.6 3.2 3.8
Water SwellingWRV
WRV is a very good predictor of hydrolysis yields and cellulase adsorption for some conditions
• Potential for WRV to incorporate many structural• Potential for WRV to incorporate many structural features of the cell wall into single parameter

Water Retention Value (WRV) for Untreated and Mild‐NaOH Pretreated Samples
3.1
3.3
3.5
NaOH Treatment
No Treatment
and Mild NaOH Pretreated Samples
4
2.5
2.7
2.9
WRV
(g/g)
y = 1.2424x + 0.1559R² = 0.4509
3
3.5
reatmen
t
1.9
2.1
2.3W
2
2.5
WRV
, NaO
H Tr
GLBRCSwitchgrass
1.5
1.7
[8]bm256
7]bm
4 S8
HUANYA
OLH
143
52220
WF9
NO. 380
NC2
90N215
B66
B14A B7
A659
CH157
YE 4
Oh7
BNK8
07Mo5
PHG86
F431
LP1N
RB4
701LFY/LFY
Ky226
NC3
68W64A
1.51.5 1.7 1.9 2.1 2.3 2.5
WRV, No Treatment
g
GLBRC Miscanthus
W64A[
W64A[7 H
INB1
0 Weak correlation between WRV in untreated and pretreated
• Substantial increase in magnitude and range for WRV g gfollowing pretreatment

0.9NaOH Treatment
Enzymatic Hydrolysis Yields (72 h)
0.7
0.8
eld (g/g)
No Treatment
0.9
1
0 5
0.6
matic Glucose Yie
y = 0.0174x + 0.547R² = 0.5116
0.5
0.6
0.7
0.8
0.9
Yield (g/g)
0.4
0.5
Enzym
0.1
0.2
0.3
0.4
0 5
Glucose Y
0.3
W61
15
Mo5
5222
0
PHG86
B14A
NC3
68
CH15
7
HUANYA
O
B47
W64
A
W64
A[7]bm4 S8
W64
A[8]bm25
6
A65
9
N21
5
Ky22
6
NC2
90
WF9
LP1N
R
B66
INB1
01LFY/LFY
B7
LH14
3
NK8
07
Oh7
B
NO. 380
00 5 10 15 20
Glucose Release (mM) ‐‐‐‐ iWALL
W W I
• Wide range of responses to mild NaOH pretreatment
• Measurement independently validated by μ‐scale, high‐throughput pretreatment‐hydrolysis (iWALL)

Correlation Coefficients between Cell Wall Properties
35
40
45
50
55
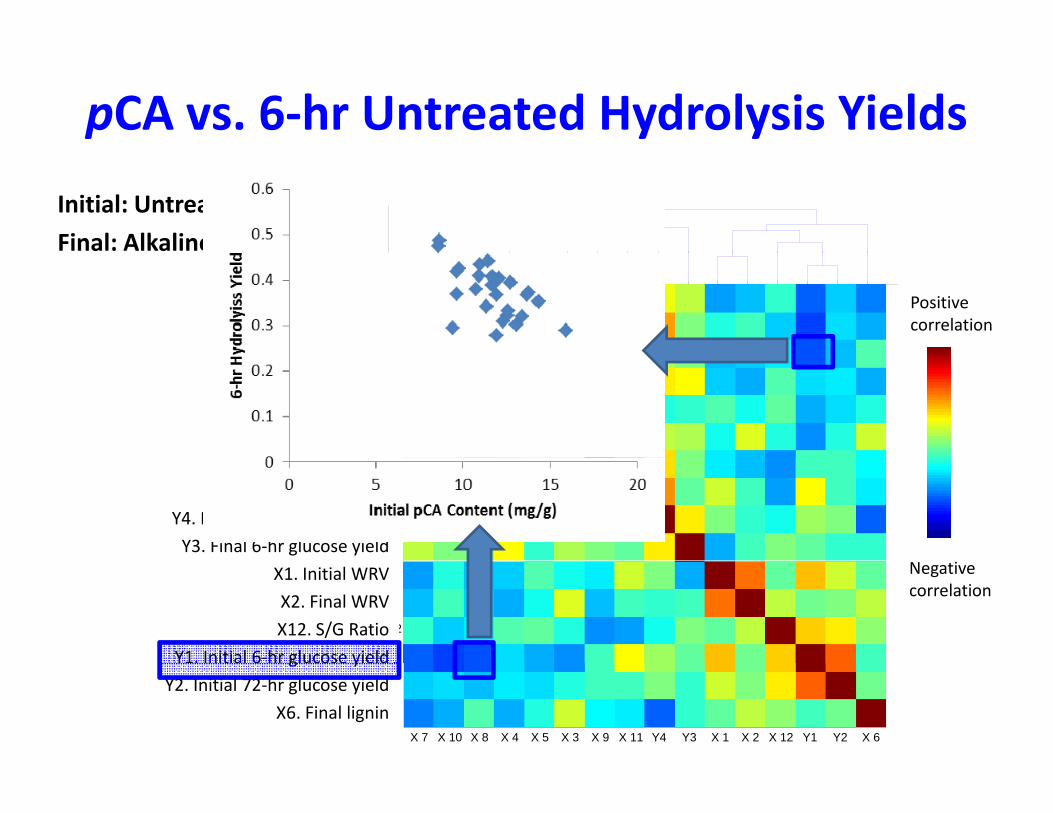
Cell Wall PropertiesInitial: Untreated
Final: Alkaline pretreated
7 10 8 4 5 3 9 11 16 15 1 2 12 13 14 6
25
30
35
X 8
X 10
X 7 Positive correlation
X7. Initial acetate
X10. Solubilized pCA
X8 Initial pCA
p
X 3
X 5
X 4
X 8X8. Initial pCA
X4. Final xylan
X5. Initial lignin
X3. Initial xylan
X9 I iti l FA
Y 3
Y 4
X 11
X 9X9. Initial FA
X11.Solubilized FA
Y4. Final 72‐hr glucose yield
Y3. Final 6‐hr glucose yield
Y 1
X 12
X 2
X 1 Negative correlation
X1. Initial WRV
X2. Final WRV
X12. S/G Ratio
Y1. Initial 6‐hr glucose yield
X 7 X 10 X 8 X 4 X 5 X 3 X 9 X 11 Y4 Y3 X 1 X 2 X 12 Y1 Y2 X 6
X 6
Y 2
Y . Initial 6 hr glucose yield
Y2. Initial 72‐hr glucose yield
X6. Final lignin

Correlation Coefficients between Cell Wall Properties
35
40
45
50
55
Cell Wall PropertiesInitial: Untreated
Final: Alkaline pretreated
7 10 8 4 5 3 9 11 16 15 1 2 12 13 14 6
25
30
35
X 8
X 10
X 7 Positive correlation
X7. Initial acetate
X10. Solubilized pCA
X8 Initial pCA
p
X 3
X 5
X 4
X 8X8. Initial pCA
X4. Final xylan
X5. Initial lignin
X3. Initial xylan
X9 I iti l FA
Y 3
Y 4
X 11
X 9X9. Initial FA
X11.Solubilized FA
Y4. Final 72‐hr glucose yield
Y3. Final 6‐hr glucose yield
Y 1
X 12
X 2
X 1 Negative correlation
X1. Initial WRV
X2. Final WRV
X12. S/G Ratio
Y1. Initial 6‐hr glucose yield
X 7 X 10 X 8 X 4 X 5 X 3 X 9 X 11 Y4 Y3 X 1 X 2 X 12 Y1 Y2 X 6
X 6
Y 2
Y . Initial 6 hr glucose yield
Y2. Initial 72‐hr glucose yield
X6. Final lignin

WRV vs. 6‐hr Untreated Hydrolysis Yields
35
40
45
50
55Initial: Untreated
Final: Alkaline pretreated
7 10 8 4 5 3 9 11 16 15 1 2 12 13 14 6
25
30
35
X 8
X 10
X 7 Positive correlation
X7. Initial acetate
X10. Solubilized pCA
X8 Initial pCA
p
X 3
X 5
X 4
X 8X8. Initial pCA
X4. Final xylan
X5. Initial lignin
X3. Initial xylan
X9 I iti l FA
Y 3
Y 4
X 11
X 9X9. Initial FA
X11.Solubilized FA
Y4. Final 72‐hr glucose yield
Y3. Final 6‐hr glucose yield
Y 1
X 12
X 2
X 1 Negative correlation
X1. Initial WRV
X2. Final WRV
X12. S/G Ratio
Y1. Initial 6‐hr glucose yield
X 7 X 10 X 8 X 4 X 5 X 3 X 9 X 11 Y4 Y3 X 1 X 2 X 12 Y1 Y2 X 6
X 6
Y 2
Y . Initial 6 hr glucose yield
Y2. Initial 72‐hr glucose yield
X6. Final lignin

Acetyl vs. 6‐hr Untreated Hydrolysis Yields
35
40
45
50
55Initial: Untreated
Final: Alkaline pretreated
7 10 8 4 5 3 9 11 16 15 1 2 12 13 14 6
25
30
35
X 8
X 10
X 7 Positive correlation
X7. Initial acetate
X10. Solubilized pCA
X8 Initial pCA
p
X 3
X 5
X 4
X 8X8. Initial pCA
X4. Final xylan
X5. Initial lignin
X3. Initial xylan
X9 I iti l FA
Y 3
Y 4
X 11
X 9X9. Initial FA
X11.Solubilized FA
Y4. Final 72‐hr glucose yield
Y3. Final 6‐hr glucose yield
Y 1
X 12
X 2
X 1 Negative correlation
X1. Initial WRV
X2. Final WRV
X12. S/G Ratio
Y1. Initial 6‐hr glucose yield
X 7 X 10 X 8 X 4 X 5 X 3 X 9 X 11 Y4 Y3 X 1 X 2 X 12 Y1 Y2 X 6
X 6
Y 2
Y . Initial 6 hr glucose yield
Y2. Initial 72‐hr glucose yield
X6. Final lignin
pCA vs. 6‐hr Untreated Hydrolysis Yields
35
40
45
50
55Initial: Untreated
Final: Alkaline pretreated
7 10 8 4 5 3 9 11 16 15 1 2 12 13 14 6
25
30
35
X 8
X 10
X 7 Positive correlation
X7. Initial acetate
X10. Solubilized pCA
X8 Initial pCA
p
X 3
X 5
X 4
X 8X8. Initial pCA
X4. Final xylan
X5. Initial lignin
X3. Initial xylan
X9 I iti l FA
Y 3
Y 4
X 11
X 9X9. Initial FA
X11.Solubilized FA
Y4. Final 72‐hr glucose yield
Y3. Final 6‐hr glucose yield
Y 1
X 12
X 2
X 1 Negative correlation
X1. Initial WRV
X2. Final WRV
X12. S/G Ratio
Y1. Initial 6‐hr glucose yield
X 7 X 10 X 8 X 4 X 5 X 3 X 9 X 11 Y4 Y3 X 1 X 2 X 12 Y1 Y2 X 6
X 6
Y 2
Y . Initial 6 hr glucose yield
Y2. Initial 72‐hr glucose yield
X6. Final lignin

Lignin vs. 6‐hr Untreated Hydrolysis Yields
35
40
45
50
55Initial: Untreated
Final: Alkaline pretreated
7 10 8 4 5 3 9 11 16 15 1 2 12 13 14 6
25
30
35
X 8
X 10
X 7 Positive correlation
X7. Initial acetate
X10. Solubilized pCA
X8 Initial pCA
p
X 3
X 5
X 4
X 8X8. Initial pCA
X4. Final xylan
X5. Initial lignin
X3. Initial xylan
X9 I iti l FA
Y 3
Y 4
X 11
X 9X9. Initial FA
X11.Solubilized FA
Y4. Final 72‐hr glucose yield
Y3. Final 6‐hr glucose yield
Y 1
X 12
X 2
X 1 Negative correlation
X1. Initial WRV
X2. Final WRV
X12. S/G Ratio
Y1. Initial 6‐hr glucose yield
X 7 X 10 X 8 X 4 X 5 X 3 X 9 X 11 Y4 Y3 X 1 X 2 X 12 Y1 Y2 X 6
X 6
Y 2
Y . Initial 6 hr glucose yield
Y2. Initial 72‐hr glucose yield
X6. Final lignin

Xylan vs. 6‐hr Untreated Hydrolysis Yields
35
40
45
50
55Initial: Untreated
Final: Alkaline pretreated
7 10 8 4 5 3 9 11 16 15 1 2 12 13 14 6
25
30
35
X 8
X 10
X 7 Positive correlation
X7. Initial acetate
X10. Solubilized pCA
X8 Initial pCA
p
X 3
X 5
X 4
X 8X8. Initial pCA
X4. Final xylan
X5. Initial lignin
X3. Initial xylan
X9 I iti l FA
Y 3
Y 4
X 11
X 9X9. Initial FA
X11.Solubilized FA
Y4. Final 72‐hr glucose yield
Y3. Final 6‐hr glucose yield
Y 1
X 12
X 2
X 1 Negative correlation
X1. Initial WRV
X2. Final WRV
X12. S/G Ratio
Y1. Initial 6‐hr glucose yield
X 7 X 10 X 8 X 4 X 5 X 3 X 9 X 11 Y4 Y3 X 1 X 2 X 12 Y1 Y2 X 6
X 6
Y 2
Y . Initial 6 hr glucose yield
Y2. Initial 72‐hr glucose yield
X6. Final lignin

S/G Ratio vs. 6‐hr Untreated Hydrolysis Yields
35
40
45
50
55
Hydrolysis YieldsInitial: Untreated
Final: Alkaline pretreated
7 10 8 4 5 3 9 11 16 15 1 2 12 13 14 6
25
30
35
X 8
X 10
X 7 Positive correlation
X7. Initial acetate
X10. Solubilized pCA
X8 Initial pCA
p
X 3
X 5
X 4
X 8X8. Initial pCA
X4. Final xylan
X5. Initial lignin
X3. Initial xylan
X9 I iti l FA
Y 3
Y 4
X 11
X 9X9. Initial FA
X11.Solubilized FA
Y4. Final 72‐hr glucose yield
Y3. Final 6‐hr glucose yield
Y 1
X 12
X 2
X 1 Negative correlation
X1. Initial WRV
X2. Final WRV
X12. S/G Ratio
Y1. Initial 6‐hr glucose yield
X 7 X 10 X 8 X 4 X 5 X 3 X 9 X 11 Y4 Y3 X 1 X 2 X 12 Y1 Y2 X 6
X 6
Y 2
Y . Initial 6 hr glucose yield
Y2. Initial 72‐hr glucose yield
X6. Final lignin

S/G ratio vs. 72‐hr Pretreated Hydrolysis Yields
35
40
45
50
55
Hydrolysis YieldsInitial: Untreated
Final: Alkaline pretreated
7 10 8 4 5 3 9 11 16 15 1 2 12 13 14 6
25
30
35
X 8
X 10
X 7 Positive correlation
X7. Initial acetate
X10. Solubilized pCA
X8 Initial pCA
p
X 3
X 5
X 4
X 8X8. Initial pCA
X4. Final xylan
X5. Initial lignin
X3. Initial xylan
X9 I iti l FA
Y 3
Y 4
X 11
X 9X9. Initial FA
X11.Solubilized FA
Y4. Final 72‐hr glucose yield
Y3. Final 6‐hr glucose yield
Y 1
X 12
X 2
X 1 Negative correlation
X1. Initial WRV
X2. Final WRV
X12. S/G Ratio
Y1. Initial 6‐hr glucose yield
X 7 X 10 X 8 X 4 X 5 X 3 X 9 X 11 Y4 Y3 X 1 X 2 X 12 Y1 Y2 X 6
X 6
Y 2
Y . Initial 6 hr glucose yield
Y2. Initial 72‐hr glucose yield
X6. Final lignin

Final Lignin vs. 72‐hr Pretreated Hydrolysis Yields
35
40
45
50
55
Hydrolysis YieldsInitial: Untreated
Final: Alkaline pretreated
7 10 8 4 5 3 9 11 16 15 1 2 12 13 14 6
25
30
35
X 8
X 10
X 7 Positive correlation
X7. Initial acetate
X10. Solubilized pCA
X8 Initial pCA
p
X 3
X 5
X 4
X 8X8. Initial pCA
X4. Final xylan
X5. Initial lignin
X3. Initial xylan
X9 I iti l FA
Y 3
Y 4
X 11
X 9X9. Initial FA
X11.Solubilized FA
Y4. Final 72‐hr glucose yield
Y3. Final 6‐hr glucose yield
Y 1
X 12
X 2
X 1 Negative correlation
X1. Initial WRV
X2. Final WRV
X12. S/G Ratio
Y1. Initial 6‐hr glucose yield
X 7 X 10 X 8 X 4 X 5 X 3 X 9 X 11 Y4 Y3 X 1 X 2 X 12 Y1 Y2 X 6
X 6
Y 2
Y . Initial 6 hr glucose yield
Y2. Initial 72‐hr glucose yield
X6. Final lignin

Solubilized FA vs. 72‐hr Pretreated Hydrolysis Yields
35
40
45
50
55
Hydrolysis YieldsInitial: Untreated
Final: Alkaline pretreated
7 10 8 4 5 3 9 11 16 15 1 2 12 13 14 6
25
30
35
X 8
X 10
X 7 Positive correlation
X7. Initial acetate
X10. Solubilized pCA
X8 Initial pCA
p
X 3
X 5
X 4
X 8X8. Initial pCA
X4. Final xylan
X5. Initial lignin
X3. Initial xylan
X9 I iti l FA
Y 3
Y 4
X 11
X 9X9. Initial FA
X11.Solubilized FA
Y4. Final 72‐hr glucose yield
Y3. Final 6‐hr glucose yield
Y 1
X 12
X 2
X 1 Negative correlation
X1. Initial WRV
X2. Final WRV
X12. Predicted S/G
Y1. Initial 6‐hr glucose yield
X 7 X 10 X 8 X 4 X 5 X 3 X 9 X 11 Y4 Y3 X 1 X 2 X 12 Y1 Y2 X 6
X 6
Y 2
Y . Initial 6 hr glucose yield
Y2. Initial 72‐hr glucose yield
X6. Final lignin

Solubilized pCA vs. 72‐hr Pretreated Hydrolysis Yields
35
40
45
50
55
Hydrolysis YieldsInitial: Untreated
Final: Alkaline pretreated
7 10 8 4 5 3 9 11 16 15 1 2 12 13 14 6
25
30
35
X 8
X 10
X 7 Positive correlation
X7. Initial acetate
X10. Solubilized pCA
X8 Initial pCA
p
X 3
X 5
X 4
X 8X8. Initial pCA
X4. Final xylan
X5. Initial lignin
X3. Initial xylan
X9 I iti l FA
Y 3
Y 4
X 11
X 9X9. Initial FA
X11.Solubilized FA
Y4. Final 72‐hr glucose yield
Y3. Final 6‐hr glucose yield
Y 1
X 12
X 2
X 1 Negative correlation
X1. Initial WRV
X2. Final WRV
X12. S/G Ratio
Y1. Initial 6‐hr glucose yield
X 7 X 10 X 8 X 4 X 5 X 3 X 9 X 11 Y4 Y3 X 1 X 2 X 12 Y1 Y2 X 6
X 6
Y 2
Y . Initial 6 hr glucose yield
Y2. Initial 72‐hr glucose yield
X6. Final lignin

Correlation between Individual Cell Wall Properties and Hydrolysis YieldsProperties and Hydrolysis Yields
p‐values of individual linear regressions between single cell wall properties and hydrolysis yieldinitialWRV
FinalWRV
InitialXylan
FinalXylan
InitialLignin
FinalLignin
InitialAcet.
InitialpCA
InitialFA
Solub. pCA
Solub.FA
S/G Ratio
X1 X2 X3 X4 X5 X6 X7 X8 X9 X10 X11 X12X1 X2 X3 X4 X5 X6 X7 X8 X9 X10 X11 X12
Raw
Biom
ass 6‐hr
yieldY1 0.039 0.729 0.028 0.116 0.037 0.596 0.004 0.002 0.594 0.001 0.206 0.005
72‐hryield
Y2 0.376 0.937 0.358 0.192 0.130 0.886 0.084 0.078 0.551 0.128 0.579 0.087
NoCorrelation
B yield
Pretreated
Biom
ass 6‐hr
yieldY3 0.052 0.550 0.646 0.198 0.478 0.548 0.540 0.994 0.943 0.924 0.876 0.966
72‐hr yield
Y4 0.934 0.637 0.496 0.158 0.373 0.004 0.260 0.635 0.114 0.022 0.013 0.469 95% CL Correlation
Untreated maize:• 6‐hr yield (hydrolysis rate): highly correlated with the initial composition• 72‐hr yield (hydrolysis extent): less correlated with the initial composition72 hr yield (hydrolysis extent): less correlated with the initial composition
NaOH pretreated maize:6 h i ld (h d l i ) l d i h ll ll i• 6‐hr yield (hydrolysis rate): not correlated with any cell wall properties
• 72‐hr yield (hydrolysis extent, pretreatment efficiency): correlated with the removal of lignin, pCA and FA.

Multiple Linear Regression ModelsModels based on Cp and BIC criteria and the modified models.Models based on Cp and BIC criteria and the modified models.
Untreated Biomass Pretreated Biomass6‐hr yield 72‐hr yield 6‐hr yield 72‐hr yield
Top 3 models b d
X3+X6+X7+X9+X11+X12 X5+X12 X1 X5+X6+X10+X11+X12based on Cpand BIC criteria
X3+X5+X6+X7+X9+X11+X12 X8 X4 X1+X5+X6+X10+X11+X12X3+X5+X10 X3+X5+X12 X1+X5 X1+X5+X10+X11+X12
Example model X1+X3+X5+X10 X5+X12 N/A X6+X10+X11+X12
S l bili d CA
0.8
1
Yields
No Treatment, 6‐hr
No Treatment, 72‐hr
NaOH Treatment, 72‐hr
Solubilized pCA
Solubilized FA
0 4
0.6
d Glucose Y
Linear model:
Y = Xβ + ε0.2
0.4
Pred
icted
WRV
S/G RatioY Xβ ε
00 0.2 0.4 0.6 0.8 1
Measured Glucose Yields Initial XylanInitial Lignin
Final Lignin

Summary: Correlation Models• Diverse range of properties for maize lines• Many correlations between properties and y p pbetween properties and yields
• No treatment: WRV Initial Initial
hWRVXylan Lignin
Initial Acetate
Initial pCA
S/G Ratio
6‐hr yield
• NaOH Pretreatment: Solub. pCA
Final Lignin
Solub. S/G
72‐hr yield
• Capable of developing linear models to correlate
Solub.FA
S/G Ratio
yield
p p gproperties to hydrolysis yields
Scope of WorkScope of Work
• Introduction to alkaline pretreatment• Introduction to alkaline pretreatment
• Correlating cell wall properties to g p puntreated and pretreated hydrolysis yieldsyields
• Chemometric models for composition and hydrolysis yield prediction

Pyrolysis Molecular Beam Mass Spectrometry (py‐MBMS)Spectrometry (py MBMS)
• Collaboration with Robert Sykes at NREL
• All pyrolysis products directly to MS (no GC separation)All pyrolysis products directly to MS (no GC separation)
• Chemometric models to extract information from datasets
Principle component analysis partial least squares– Principle component analysis, partial least squares,…
– Used in the past for S/G ratio, composition
15
20
25
Aspen
Hybrid poplar
Switchgrass
Corn StoverSyringyl‐
Example data
bund
ance
5
10
15 Corn StoverFerulatep‐coumarate derived monomers
malized
ab
025 50 75 100 125 150 175 200 225 250
m/z
Nor
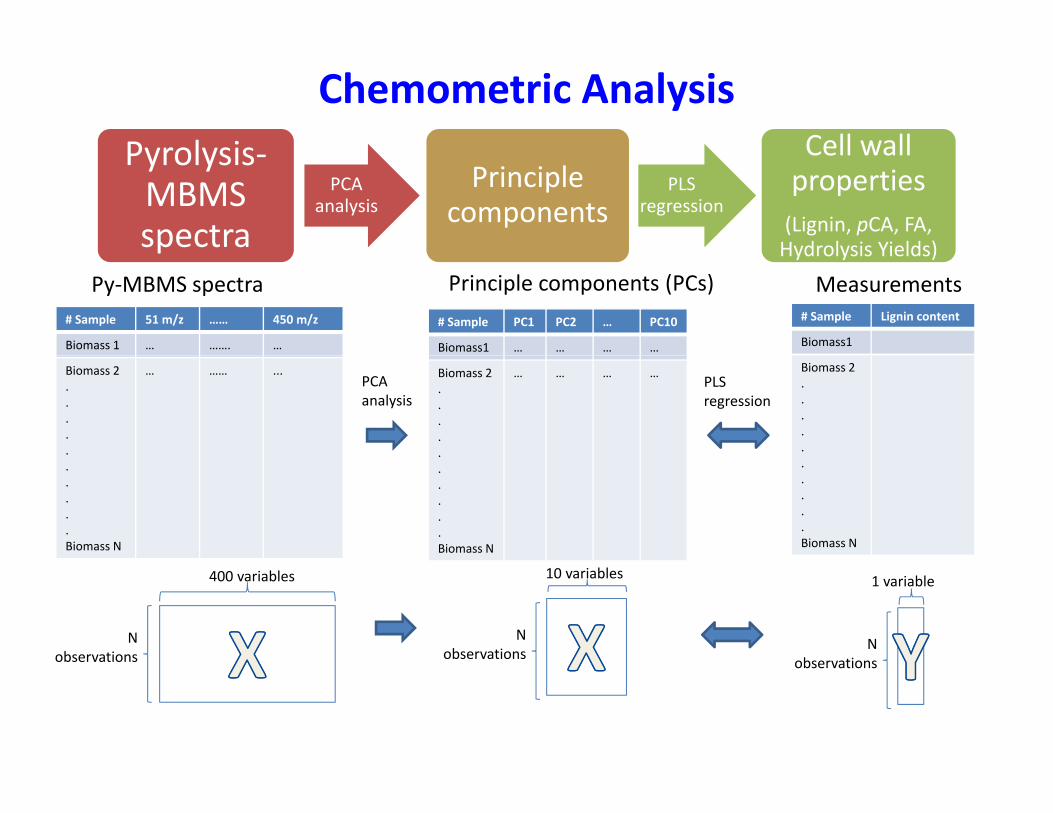
Chemometric AnalysisPyrolysis Cell wallPyrolysis‐MBMS spectra
PCA analysis
Principle components
PLS regression
Cell wall properties(Lignin, pCA, FA, Hydrolysis Yields)
# Sample 51 m/z …… 450 m/z
Biomass 1 … ……. …
# Sample PC1 PC2 … PC10
Biomass1 … … … …
# Sample Lignin content
Biomass1
Py‐MBMS spectra Principle components (PCs) Measurements
p Hydrolysis Yields)
Biomass 2.....
… …… ... Biomass 2.....
… … … …PCA analysis
Biomass 2.....
PLS regression
.
.
.
.
.Biomass N
.
.
.
.
.Biomass N
.
.
.
.
.Biomass N
Nobservations
400 variables
Nobservations
10 variables
Nobservations
1 variable
observations

Prediction of Lignin Content across Diverse Species and Maize LinesDiverse Species and Maize Lines
0.25
nt
MiscanthusSide oats grama Big bluestem
Aspen
0 20
0.25
ent
R2 = 0.97
0.15
0.20
Lignin Con
ten
biom
ass)hybrid stover
Switchgrass
bm1 stover
bm2 stoverbm3 stoverbm4 stover
g
0.15
0.20
d Lignin Con
teg biom
ass)
R2 = 0.56
0.10
Pred
icted
(g/g
Maize diversity set
0.10
Pred
icted
(g/g
Diverse Grasses (and Aspen)
0.050.05 0.10 0.15 0.20 0.25
Measured Lignin Content (g/g biomass)
0.050.05 0.10 0.15 0.20 0.25
Measured Lignin Content (g/g biomass)
• Good prediction of lignin content across species
• Less effective prediction for maize diversity setLess effective prediction for maize diversity set– Measured lignin: Klason lignin corrected by ash
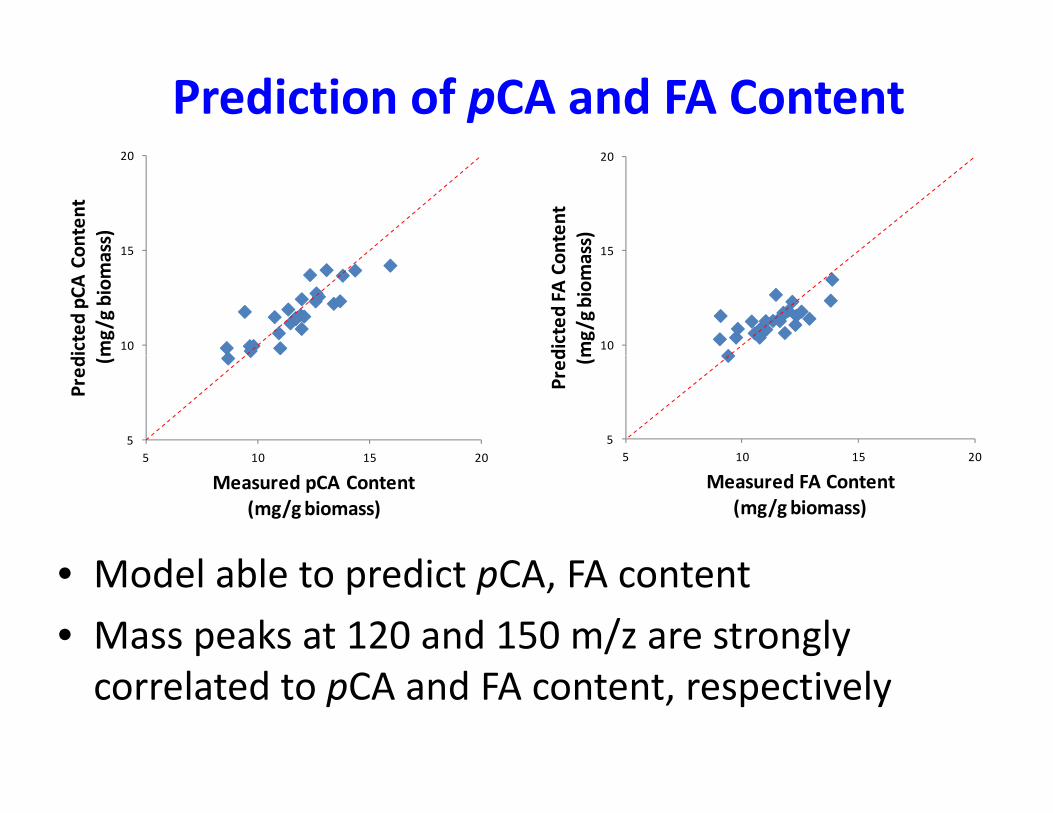
Prediction of pCA and FA Content
15
20
ontent
ss)
15
20
nten
t ss)
10
15
icted pC
ACo
mg/g biom
a
10
15
dicted
FA Co
mg/g biom
as
55 10 15 20
Pred( m
55 10 15 20
Pred (m
M d l bl di CA FA
5 10 15 20
Measured pCA Content (mg/g biomass)
5 10 15 20
Measured FA Content (mg/g biomass)
• Model able to predict pCA, FA content
• Mass peaks at 120 and 150 m/z are strongly correlated to pCA and FA content, respectively

Prediction of Hydrolysis YieldsUntreated Maize NaOH‐Pretreated Maize
6‐hr hydrolysis yield 72‐hr hydrolysis yield 72‐hr hydrolysis yield
NaOH Pretreated Maize
R² = 0.7513 R² = 0.4239 R² = 0 37450.6
can)
0 9
1
an)
0.6
eld R 0.4239 R = 0.3745
0.5
2‐hr Yield (g/g gluc
0.7
0.8
0.9
‐hr Yield (g/g gluca
0.3
0.4
0.5
ed 6‐hr Glucose Yie
0.3
0.4Pred
icted 72
0.4
0.5
0.6
Pred
icted 72
‐
0
0.1
0.2
0 0 2 0 4 0 6
Pred
icte
• Accurate prediction on 6‐hr yield and less accurate
0.3 0.4 0.5 0.6
Measured 72‐hr Glucose Yield0.4 0.5 0.6 0.7 0.8 0.9 1
Measured 72‐hr Glucose Yield
0 0.2 0.4 0.6
Measured 6‐hr Glucose Yield
prediction on 72‐hr yield for untreated maize:– Composition sets the initial recalcitrance for hydrolysis
• Poor prediction on pretreated maize– Removal of pCA and FA

Summary: py‐MBMS models• Model prediction of cell wall composition:
– Lignin content
–pCA, FA content
• Model prediction of hydrolysis yields with or without alkaline pretreatments:
–Accurate prediction for 6‐hr yield
– Less accurate prediction for 72‐hr yield forLess accurate prediction for 72 hr yield for untreated and pretreated maize
AcknowledgementsResearch Group: Collaborators:Research Group:
Dr. Tongjun Liu Ryan StoklosaMuyang Li Zhenglun LiD Willi Ch l Ch
Collaborators:Natalia de Leon, U. WisconsinShawn Kaeppler, U. Wisconsin
Dan Williams Charles ChenJacob Crowe John Groetsch
Robert Sykes, NREL
Funding:Funding:• DOE, BER DE‐FC02‐07ER64494• NSF CBET‐1336622