Embed Size (px)
Citation preview
1
Measuring the Economy Measuring the Economy and the Circular Flowand the Circular Flow
Chapter 22Chapter 22
© 2006 Thomson/South-Western
2
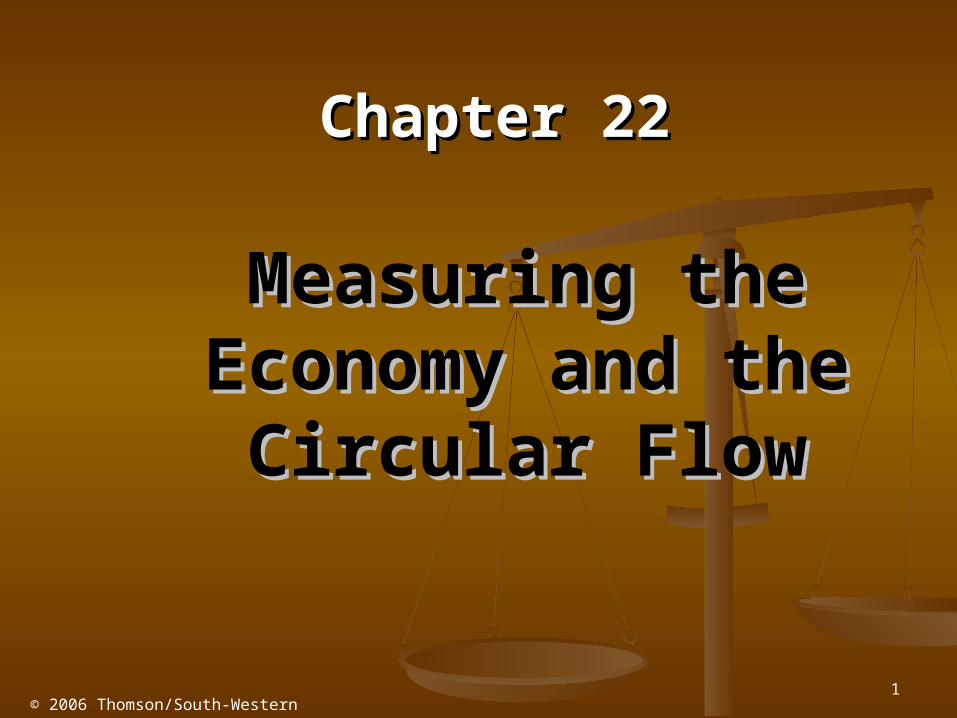
National Income AccountsNational Income Accounts
Gross domestic product -- GDPGross domestic product -- GDP Measures the market value of all final goods and services Measures the market value of all final goods and services
produced during a year by resources located in the produced during a year by resources located in the United States, regardless of who owns those resourcesUnited States, regardless of who owns those resources
Gross national product -- GNPGross national product -- GNP Measures the market value of all goods and services Measures the market value of all goods and services
produced by resources supplied by U.S. residents and produced by resources supplied by U.S. residents and firms, regardless of the location of the resourcesfirms, regardless of the location of the resources
National income accountsNational income accounts One person’s spending is another person’s incomeOne person’s spending is another person’s income Aggregate output is recorded on one side of the ledger Aggregate output is recorded on one side of the ledger
and income created by that spending on the other sideand income created by that spending on the other side
3
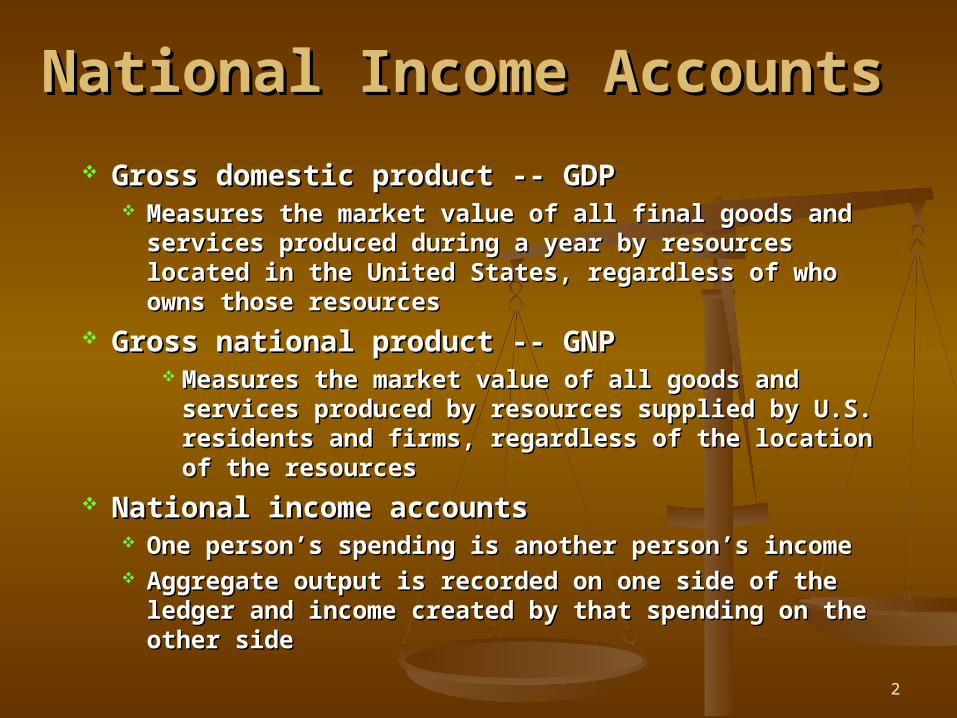
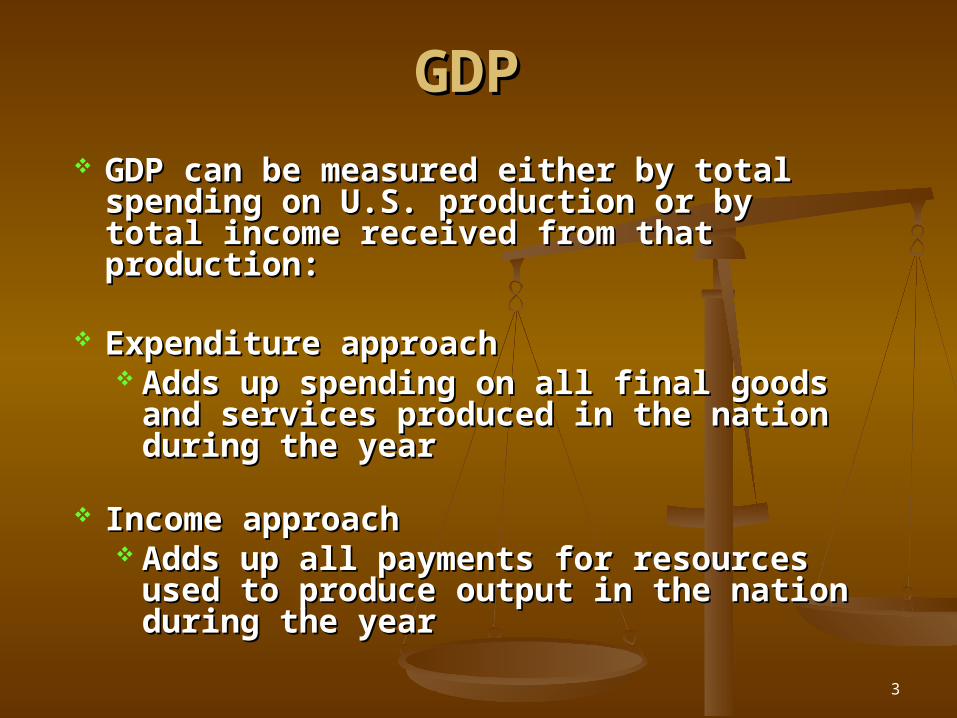
GDPGDP
GDP can be measured either by total spending GDP can be measured either by total spending on U.S. production or by total income received on U.S. production or by total income received from that production:from that production:
Expenditure approachExpenditure approach Adds up spending on all final goods and Adds up spending on all final goods and
services produced in the nation during the services produced in the nation during the yearyear
Income approach Income approach Adds up all payments for resources used to Adds up all payments for resources used to
produce output in the nation during the yearproduce output in the nation during the year

4
GDPGDP
Includes only final goods and servicesIncludes only final goods and services Goods that are sold to the final, or ultimate, userGoods that are sold to the final, or ultimate, user Ignores most of the secondhand value of used goods Ignores most of the secondhand value of used goods
because these goods were counted in GDP the year because these goods were counted in GDP the year they were producedthey were produced
Intermediate goods and services are those Intermediate goods and services are those purchased for additional processing and resalepurchased for additional processing and resale Excluded to avoid the problem of double counting Excluded to avoid the problem of double counting
which is counting an item’s value more than oncewhich is counting an item’s value more than once
5
GDP – Expenditure Approach: GDP – Expenditure Approach: ConsumptionConsumption
Personal consumption expenditures: consist of Personal consumption expenditures: consist of purchases of final goods and services by purchases of final goods and services by households during the yearhouseholds during the year Largest spending category and accounts for about Largest spending category and accounts for about
two-thirds of U.S. GDPtwo-thirds of U.S. GDP Three components:Three components:
ServicesServices Durable Goods: Goods expected to last at least three yearsDurable Goods: Goods expected to last at least three years Nondurable GoodsNondurable Goods
6
GDP – Expenditure Approach: GDP – Expenditure Approach: InvestmentInvestment
Gross private domestic investment: consists of Gross private domestic investment: consists of spending on new capital goods and additions to spending on new capital goods and additions to inventoriesinventories Spending on current production that is not used for Spending on current production that is not used for
current consumptioncurrent consumption Accounts for about one-sixth of U.S. GDPAccounts for about one-sixth of U.S. GDP CategoriesCategories
Physical capital: new buildings and machinery purchased Physical capital: new buildings and machinery purchased by firms to produce goods and servicesby firms to produce goods and services
Purchases of new residential constructionPurchases of new residential construction InventoriesInventories
7
GDP – Expenditure Approach: GDP – Expenditure Approach: InventoriesInventories
Inventories: stocks of goods in process Inventories: stocks of goods in process and stocks of finished goodsand stocks of finished goods
Help firms deal with unexpected changes Help firms deal with unexpected changes in the supply of their resources or in in the supply of their resources or in demand for their productsdemand for their products
Net changes in inventoriesNet changes in inventories
8
GDP – Expenditure Approach: GDP – Expenditure Approach: Government PurchasesGovernment Purchases
Government consumption and gross Government consumption and gross investment: spending by all levels of investment: spending by all levels of government for goods and servicesgovernment for goods and services
Averaged a little less than one-fifth of Averaged a little less than one-fifth of U.S. GDP during last decadeU.S. GDP during last decade
Excludes transfer payments because they Excludes transfer payments because they are an outright grant from the are an outright grant from the government to the recipientgovernment to the recipient
9
GDP – Expenditure GDP – Expenditure Approach: Net ExportsApproach: Net Exports
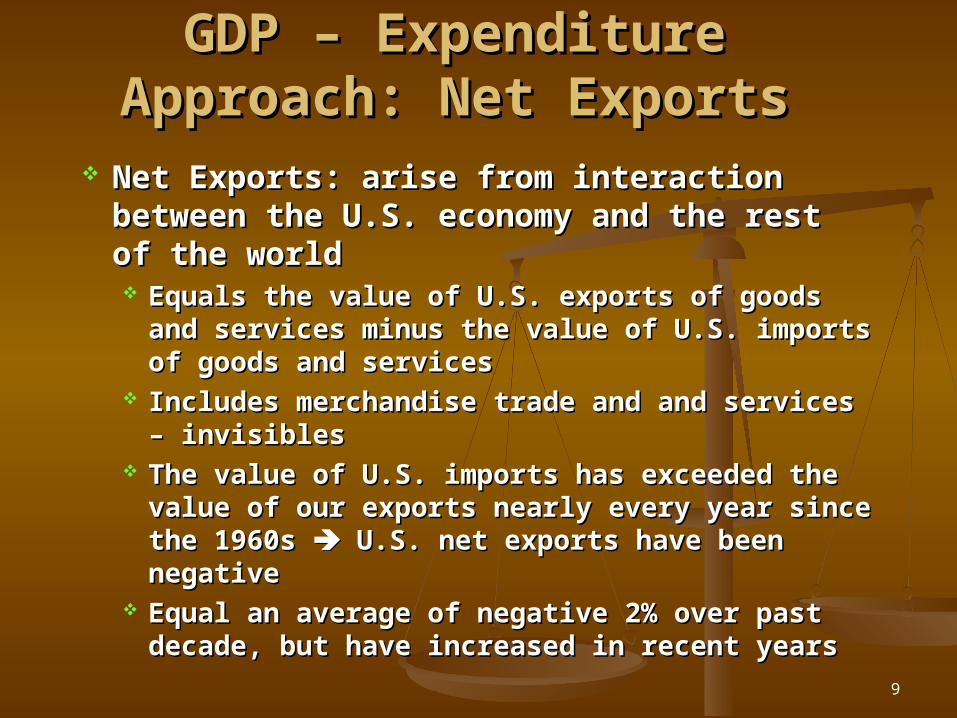
Net Exports: arise from interaction between the Net Exports: arise from interaction between the U.S. economy and the rest of the worldU.S. economy and the rest of the world Equals the value of U.S. exports of goods and Equals the value of U.S. exports of goods and
services minus the value of U.S. imports of goods services minus the value of U.S. imports of goods and servicesand services
Includes merchandise trade and and services – Includes merchandise trade and and services – invisiblesinvisibles
The value of U.S. imports has exceeded the value of The value of U.S. imports has exceeded the value of our exports nearly every year since the 1960s our exports nearly every year since the 1960s U.S. net exports have been negativeU.S. net exports have been negative
Equal an average of negative 2% over past decade, Equal an average of negative 2% over past decade, but have increased in recent yearsbut have increased in recent years
10
GDP: Expenditure ApproachGDP: Expenditure Approach
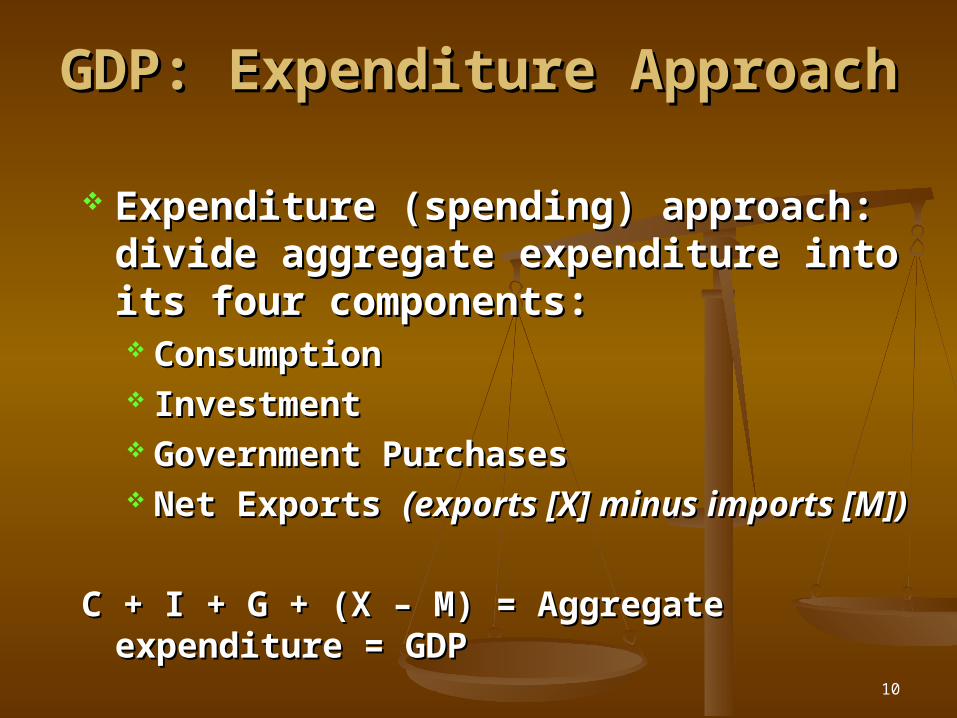
Expenditure (spending) approach: divide Expenditure (spending) approach: divide aggregate expenditure into its four aggregate expenditure into its four components:components: ConsumptionConsumption InvestmentInvestment Government PurchasesGovernment Purchases Net Exports Net Exports (exports [X] minus imports [M])(exports [X] minus imports [M])
C + I + G + (X – M) = Aggregate expenditure = GDPC + I + G + (X – M) = Aggregate expenditure = GDP
11
GDP: Income ApproachGDP: Income Approach
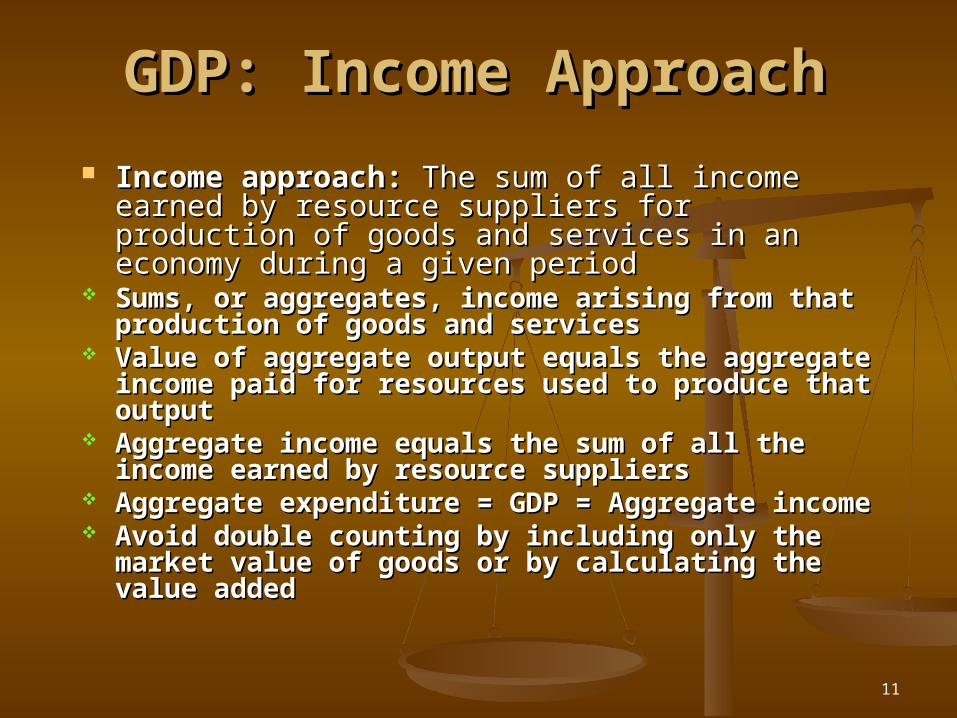
Income approach: Income approach: The sum of all income earned by The sum of all income earned by resource suppliers for production of goods and services in resource suppliers for production of goods and services in an economy during a given periodan economy during a given period
Sums, or aggregates, income arising from that production of Sums, or aggregates, income arising from that production of goods and servicesgoods and services
Value of aggregate output equals the aggregate income paid Value of aggregate output equals the aggregate income paid for resources used to produce that outputfor resources used to produce that output
Aggregate income equals the sum of all the income earned Aggregate income equals the sum of all the income earned by resource suppliersby resource suppliers
Aggregate expenditure = GDP = Aggregate incomeAggregate expenditure = GDP = Aggregate income Avoid double counting by including only the market value of Avoid double counting by including only the market value of
goods or by calculating the value addedgoods or by calculating the value added
12
Exhibit 1: Computation of Value Added for a Exhibit 1: Computation of Value Added for a
New DeskNew Desk
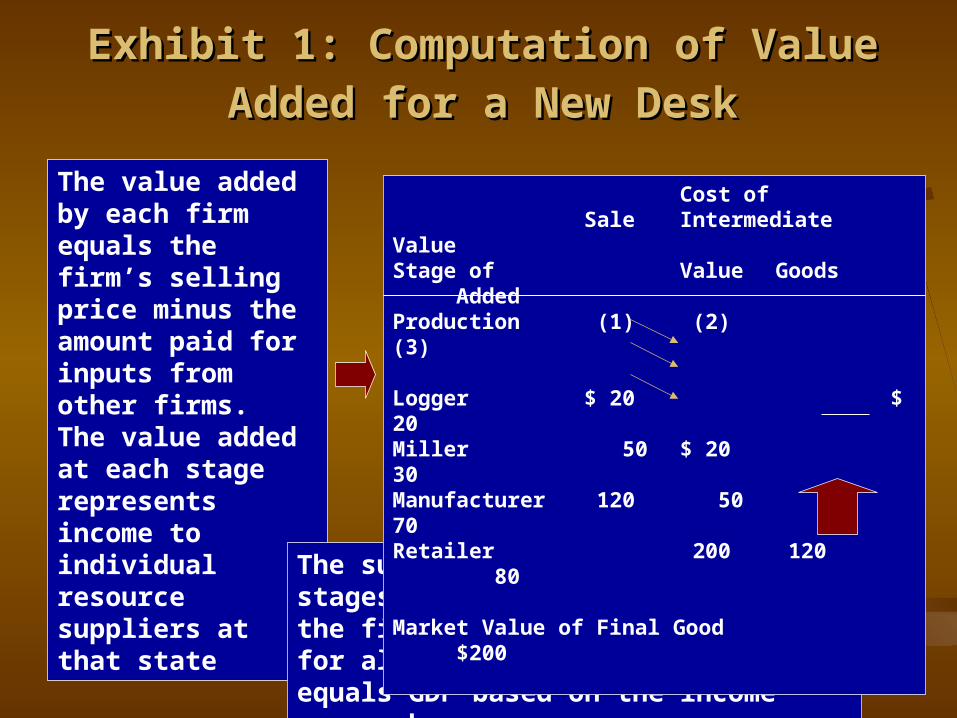
The value added by each firm equals the firm’s selling price minus the amount paid for inputs from other firms. The value added at each stage represents income toindividual resource suppliers at that state
The sum of the value added at all stages equals the market value of the final good and the value added for all final goods and services equals GDP based on the income approach
Cost ofSale Intermediate Value
Stage of Value Goods AddedProduction (1) (2) (3)
Logger $ 20 $ 20Miller 50 $ 20 30Manufacturer 120 50 70Retailer 200 120 80
Market Value of Final Good $200
13
Exhibit 2: The Circular FlowExhibit 2: The Circular Flow
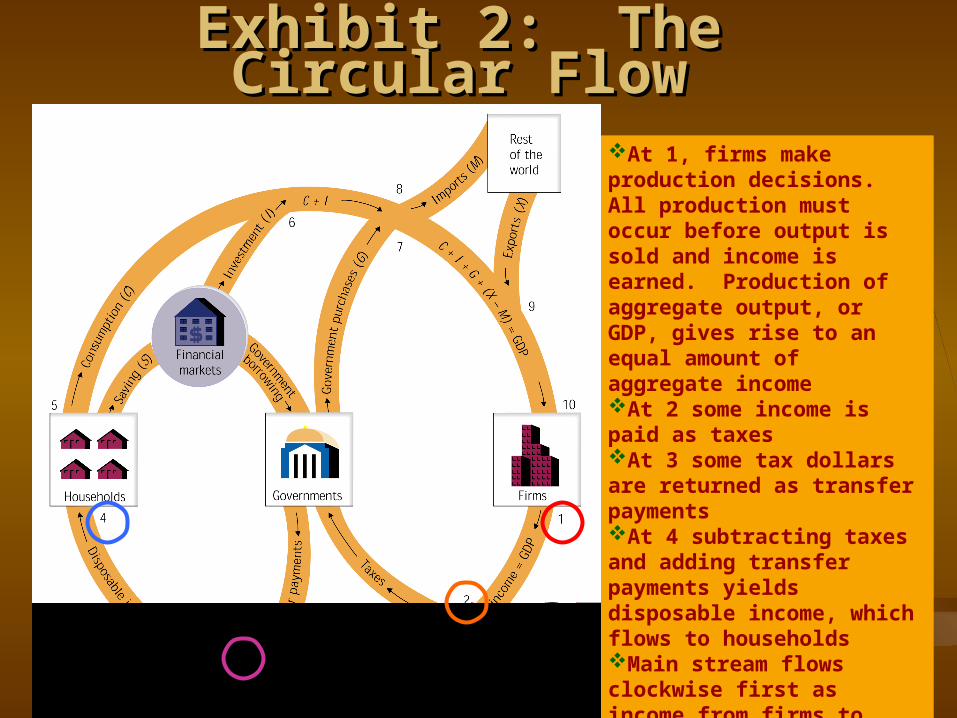
At 1, firms make production decisions. All production must occur before output is sold and income is earned. Production of aggregate output, or GDP, gives rise to an equal amount of aggregate incomeAt 2 some income is paid as taxesAt 3 some tax dollars are returned as transfer paymentsAt 4 subtracting taxes and adding transfer payments yields disposable income, which flows to householdsMain stream flows clockwise first as income from firms to households – the lower half of the circle, then as spending from households to firms – upper half
14
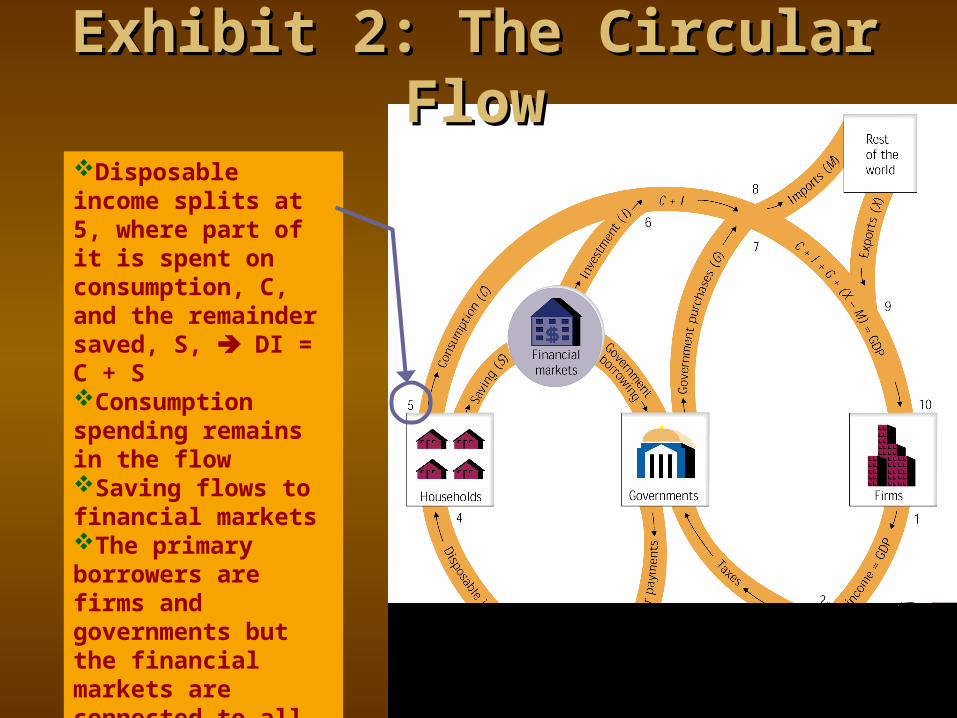
Disposable income splits at 5, where part of it is spent on consumption, C, and the remainder saved, S, DI = C + SConsumption spending remains in the flowSaving flows to financial marketsThe primary borrowers are firms and governments but the financial markets are connected to all four decision makers
Exhibit 2: The Circular FlowExhibit 2: The Circular Flow
15
Exhibit 2: The Circular FlowExhibit 2: The Circular Flow
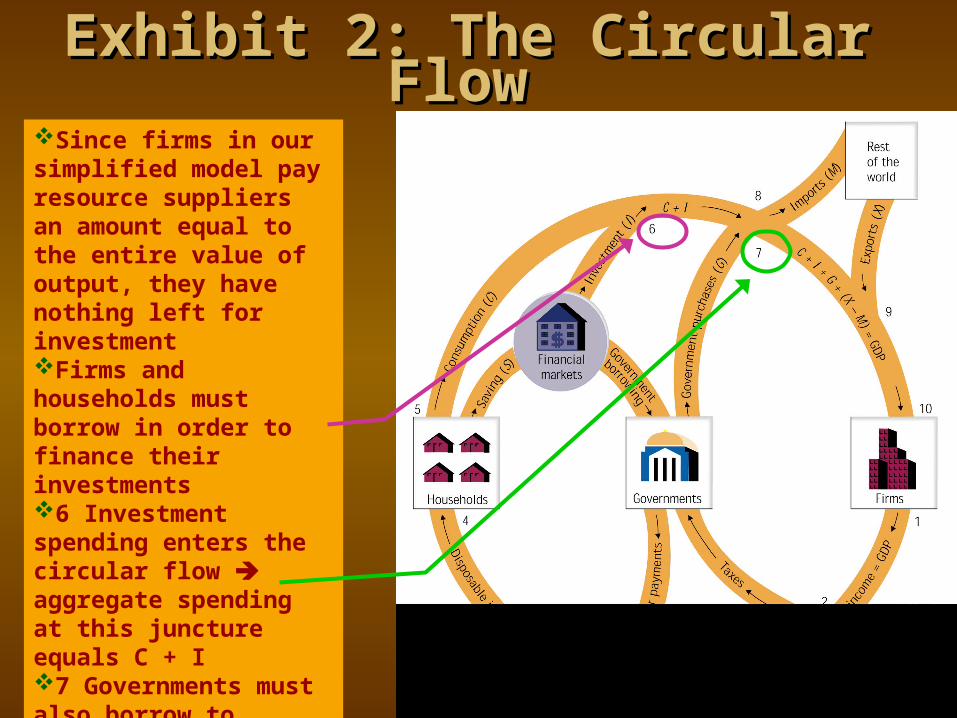
Since firms in our simplified model pay resource suppliers an amount equal to the entire value of output, they have nothing left for investmentFirms and households must borrow in order to finance their investments6 Investment spending enters the circular flow aggregate spending at this juncture equals C + I7 Governments must also borrow to finance deficits and these purchases, G, enter the spending stream
16
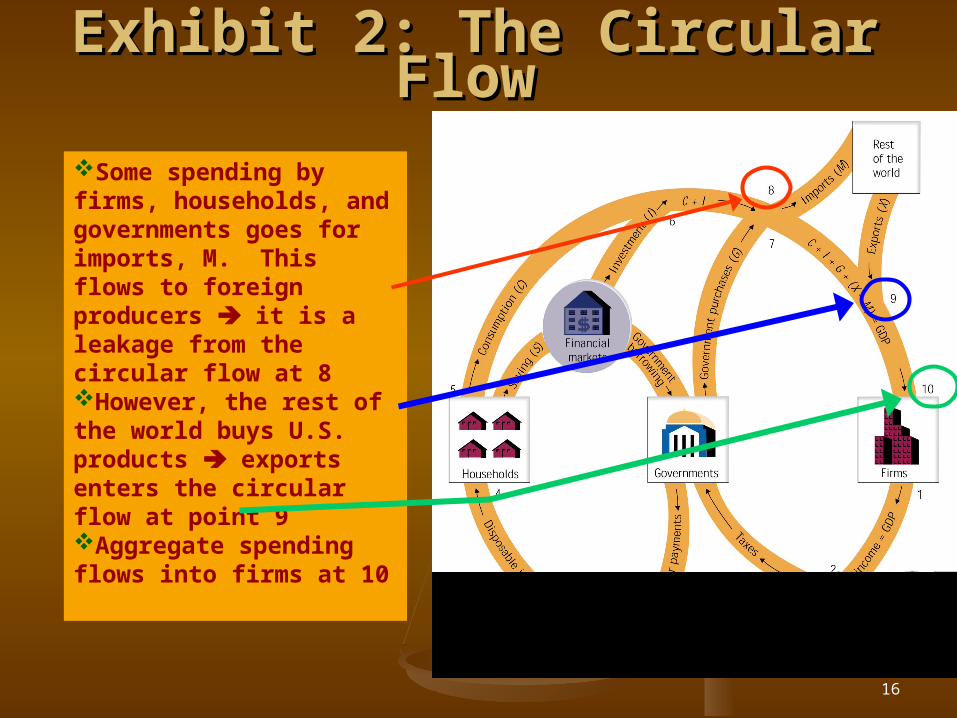
Some spending by firms, households, and governments goes for imports, M. This flows to foreign producers it is a leakage from the circular flow at 8However, the rest of the world buys U.S. products exports enters the circular flow at point 9Aggregate spending flows into firms at 10
Exhibit 2: The Circular FlowExhibit 2: The Circular Flow
17
Leakages Equal InjectionsLeakages Equal Injections
This first accounting identity leads toThis first accounting identity leads to DI + NT = C + I + G + (X – M)DI + NT = C + I + G + (X – M) Since disposable income equals consumption plus Since disposable income equals consumption plus
saving, we can substitute C + S for DI in this equationsaving, we can substitute C + S for DI in this equation C + S + NT = C + I + G + (X – M)C + S + NT = C + I + G + (X – M) After subtracting C from both sides and adding M to After subtracting C from both sides and adding M to
both sides, the equation reduces toboth sides, the equation reduces to S + NT + M = I + G + XS + NT + M = I + G + X Thus, the leakages (S, NT, and M) must equal the Thus, the leakages (S, NT, and M) must equal the
injections (I, G, and X) into the circular flowinjections (I, G, and X) into the circular flow
18
Planned versus Actual InvestmentPlanned versus Actual Investment
Planned InvestmentPlanned Investment The amount firms plan to invest before they know The amount firms plan to invest before they know
how much output they sellhow much output they sell Actual InvestmentActual Investment
Includes both planned investment and any Includes both planned investment and any unplanned changes in inventoriesunplanned changes in inventories
Unplanned increases in inventories cause firms to Unplanned increases in inventories cause firms to decrease their production next time arounddecrease their production next time around
Only when there are no unplanned changes in Only when there are no unplanned changes in inventories will GDP be at an equilibrium level inventories will GDP be at an equilibrium level planned investment equals actual investment planned investment equals actual investment
19
Limitations of National Income AccountingLimitations of National Income Accounting
Some production is not included in GDPSome production is not included in GDP With some minor exceptions, GDP includes With some minor exceptions, GDP includes
only those products that are sold in marketsonly those products that are sold in markets Ignores “do-it-yourself” household Ignores “do-it-yourself” household
production production an economy in which an economy in which householders are largely self-sufficient will householders are largely self-sufficient will understate GDPunderstate GDP
Ignores the underground economyIgnores the underground economy All market activity that goes unreported because All market activity that goes unreported because
it’s illegal or those involved want to evade taxesit’s illegal or those involved want to evade taxes Federal study suggests the equivalent of 7.5% of Federal study suggests the equivalent of 7.5% of
GDP or about $800 billion in 2004GDP or about $800 billion in 2004
20
LimitationsLimitations
For some economic activity, income must be For some economic activity, income must be imputed, or estimated, because market exchange imputed, or estimated, because market exchange does not occurdoes not occur Imputed rental income that homeowners receive from Imputed rental income that homeowners receive from
home ownershiphome ownership Imputed dollar amount for wages paid in kind, such as Imputed dollar amount for wages paid in kind, such as
employers’ payments for employees’ medical insuranceemployers’ payments for employees’ medical insurance Imputed dollar amount for food produced by farm Imputed dollar amount for food produced by farm
families for their own consumptionfamilies for their own consumption Increase in leisure time is not reflected in GDP because Increase in leisure time is not reflected in GDP because
it is not explicitly bought and sold in a marketit is not explicitly bought and sold in a market People also retire at a much earlier age and they live People also retire at a much earlier age and they live
longer after retirement longer after retirement quality of life has increased quality of life has increased Increase in variety of products not includedIncrease in variety of products not included
21
GDP Ignores DepreciationGDP Ignores Depreciation
In the process of producing GDP, some capital In the process of producing GDP, some capital wears out or becomes obsoletewears out or becomes obsolete
A truer picture of the net production that A truer picture of the net production that actually occurs during a year is found by actually occurs during a year is found by subtracting this depreciation from GDPsubtracting this depreciation from GDP
Depreciation measures the value of the capital Depreciation measures the value of the capital stock that is used up or becomes obsolete in the stock that is used up or becomes obsolete in the production processproduction process
22
Net Domestic ProductNet Domestic Product Net domestic product equals gross domestic Net domestic product equals gross domestic
product minus depreciationproduct minus depreciation Gross investment measures the value of all Gross investment measures the value of all
investment during a yearinvestment during a year Used in computing GDPUsed in computing GDP
Net investment equals gross investment less Net investment equals gross investment less depreciationdepreciation When net investment is negative When net investment is negative depreciation depreciation
exceeds gross investment exceeds gross investment the capital stock the capital stock declinesdeclines
If it is zero If it is zero capital stock remains constant capital stock remains constant If positive, the capital stock growsIf positive, the capital stock grows Used in computing net domestic productUsed in computing net domestic product
23
GDP Does Not Reflect All CostsGDP Does Not Reflect All Costs
Some production and consumption Some production and consumption degrades the quality of our environmentdegrades the quality of our environment
Negative externalities such as pollution Negative externalities such as pollution are largely ignored in GDP accountingare largely ignored in GDP accounting
GDP also ignores the depletion of natural GDP also ignores the depletion of natural resources resources ignores the natural capital ignores the natural capital stockstock
24
Accounting for Price ChangesAccounting for Price Changes
Gross domestic product measures the value of Gross domestic product measures the value of output in current dollars, e.g., in the dollar output in current dollars, e.g., in the dollar values at the time the output is producedvalues at the time the output is produced
This technique of basing GDP on current This technique of basing GDP on current dollars dollars the national income accounts the national income accounts measure nominal GDPmeasure nominal GDP
This system allows for comparisons among This system allows for comparisons among income or expenditure components in a income or expenditure components in a particular yearparticular year
25
Accounting for Price ChangesAccounting for Price Changes
Since the economy’s average price level Since the economy’s average price level changes over time, current-dollar comparisons changes over time, current-dollar comparisons across years can be misleadingacross years can be misleading
Specifically, nominal GDP can increase over Specifically, nominal GDP can increase over time becausetime because Output increasesOutput increases Prices increasePrices increase Both of these occurBoth of these occur
Real GDP refers to GDP adjusted for changes Real GDP refers to GDP adjusted for changes in prices in prices measures the changes which measures the changes which occurred in output or production occurred in output or production deflating deflating GDPGDP
26
Price IndexesPrice Indexes
An index number compares the value of some An index number compares the value of some variable in a particular year to its value in a variable in a particular year to its value in a base or reference yearbase or reference year
The base year is a point of reference to which The base year is a point of reference to which prices in other years can be compared prices in other years can be compared prices prices in other years are expressed relative to the in other years are expressed relative to the base-year pricebase-year price
Price index constructed by dividing each year’s Price index constructed by dividing each year’s price by the price in the base year and price by the price in the base year and multiplying by 100multiplying by 100
27
Exhibit 3: A Price Index (base year = Exhibit 3: A Price Index (base year = 2003)2003)
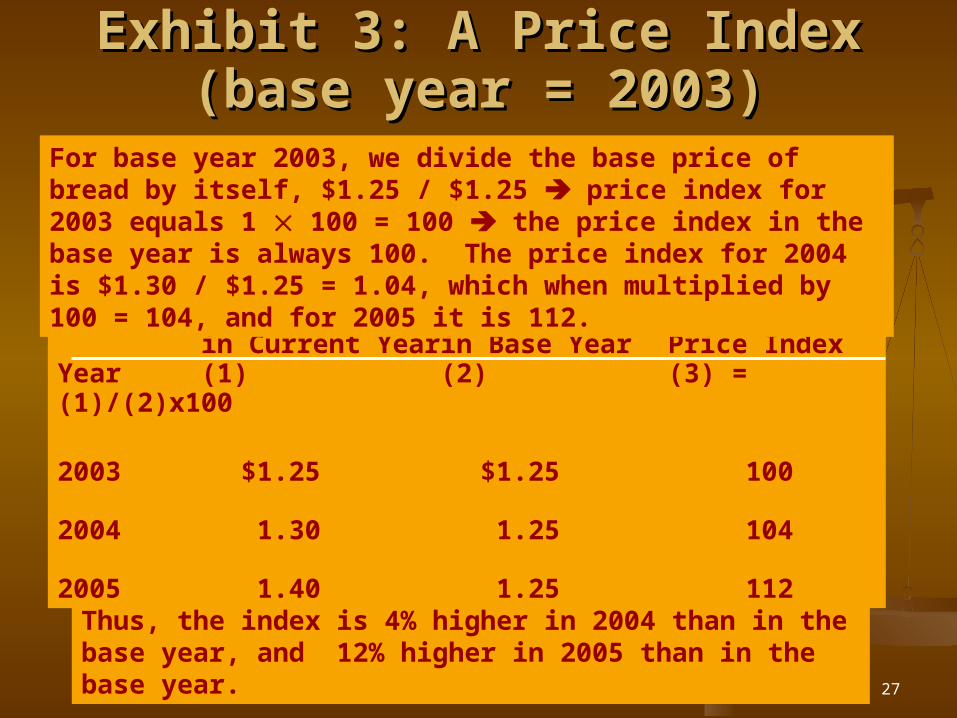
Price of Bread Price of Breadin Current Year in Base Year Price Index
Year (1) (2) (3) = (1)/(2)x100
2003 $1.25 $1.25 100
2004 1.30 1.25 104
2005 1.40 1.25 112
For base year 2003, we divide the base price of bread by itself, $1.25 / $1.25 price index for 2003 equals 1 100 = 100 the price index in the base year is always 100. The price index for 2004 is $1.30 / $1.25 = 1.04, which when multiplied by 100 = 104, and for 2005 it is 112.
Thus, the index is 4% higher in 2004 than in the base year, and 12% higher in 2005 than in the base year.
28
Price IndexesPrice Indexes
The price index permits comparisons between The price index permits comparisons between any two yearsany two years
For example, if we use the information For example, if we use the information provided in Exhibit 3 and asked what provided in Exhibit 3 and asked what happened to the price level between 2001 and happened to the price level between 2001 and 2002?2002?
By dividing the 2002 price index by the 2001 By dividing the 2002 price index by the 2001 price index, 112 / 104, you would find that the price index, 112 / 104, you would find that the price level rose by 7.7%price level rose by 7.7%
29
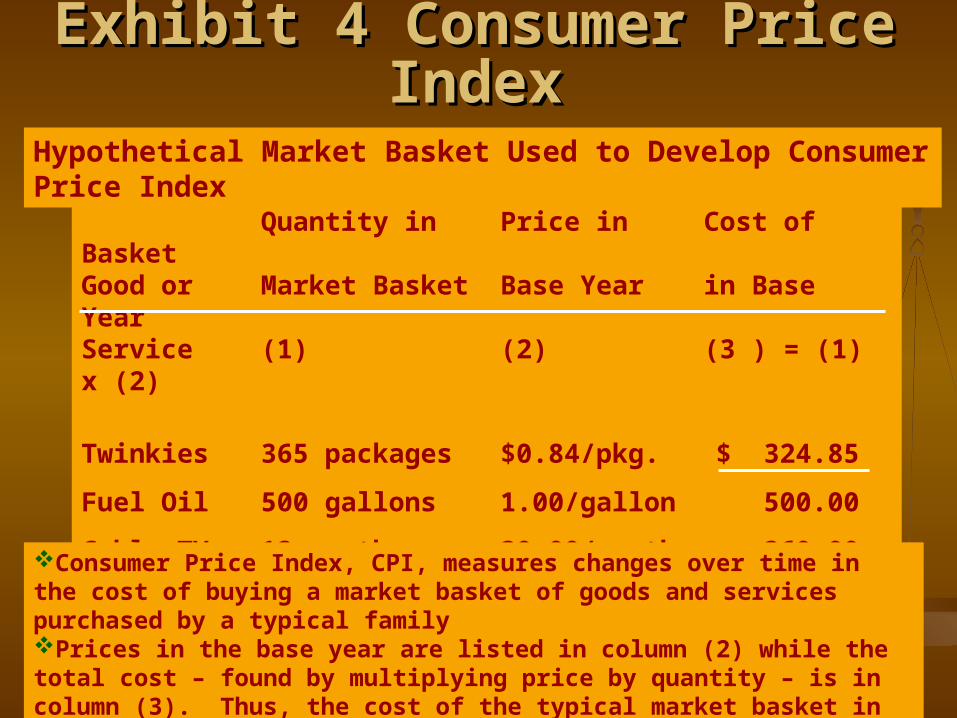
Exhibit 4 Consumer Price IndexExhibit 4 Consumer Price Index
Quantity in Price in Cost of BasketGood or Market Basket Base Year in Base YearService (1) (2) (3 ) = (1) x (2)
Twinkies 365 packages $0.84/pkg. $ 324.85
Fuel Oil 500 gallons 1.00/gallon 500.00
Cable TV 12 months 30.00/month 360.00
$1,184.85
Hypothetical Market Basket Used to Develop Consumer Price Index
Consumer Price Index, CPI, measures changes over time in the cost of buying a market basket of goods and services purchased by a typical familyPrices in the base year are listed in column (2) while the total cost – found by multiplying price by quantity – is in column (3). Thus, the cost of the typical market basket in the base year is $1,184.85.
30
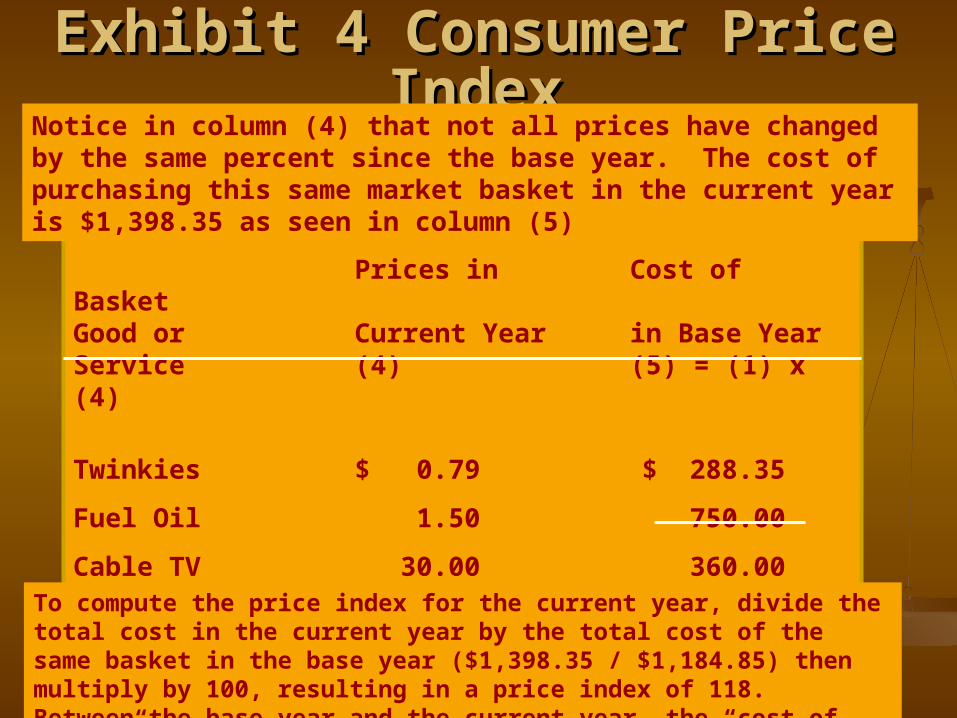
Exhibit 4 Consumer Price IndexExhibit 4 Consumer Price Index
Prices in Cost of BasketGood or Current Year in Base YearService (4) (5) = (1) x (4)
Twinkies $ 0.79 $ 288.35
Fuel Oil 1.50 750.00
Cable TV 30.00 360.00
$1,398.35
Notice in column (4) that not all prices have changed by the same percent since the base year. The cost of purchasing this same market basket in the current year is $1,398.35 as seen in column (5)
To compute the price index for the current year, divide the total cost in the current year by the total cost of the same basket in the base year ($1,398.35 / $1,184.85) then multiply by 100, resulting in a price index of 118. Between the base year and the current year, the “cost of living” increased by 18%
31
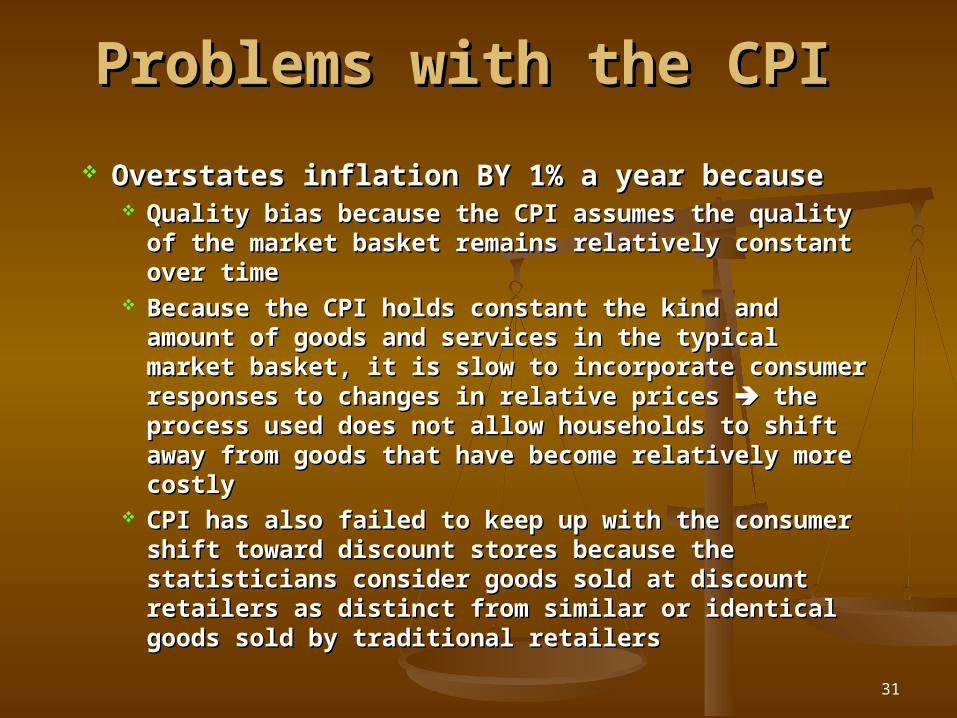
Problems with the CPIProblems with the CPI
Overstates inflation BY 1% a year becauseOverstates inflation BY 1% a year because Quality bias because the CPI assumes the quality of the Quality bias because the CPI assumes the quality of the
market basket remains relatively constant over timemarket basket remains relatively constant over time Because the CPI holds constant the kind and amount of Because the CPI holds constant the kind and amount of
goods and services in the typical market basket, it is slow goods and services in the typical market basket, it is slow to incorporate consumer responses to changes in relative to incorporate consumer responses to changes in relative prices prices the process used does not allow households to the process used does not allow households to shift away from goods that have become relatively more shift away from goods that have become relatively more costlycostly
CPI has also failed to keep up with the consumer shift CPI has also failed to keep up with the consumer shift toward discount stores because the statisticians consider toward discount stores because the statisticians consider goods sold at discount retailers as distinct from similar goods sold at discount retailers as distinct from similar or identical goods sold by traditional retailersor identical goods sold by traditional retailers
32
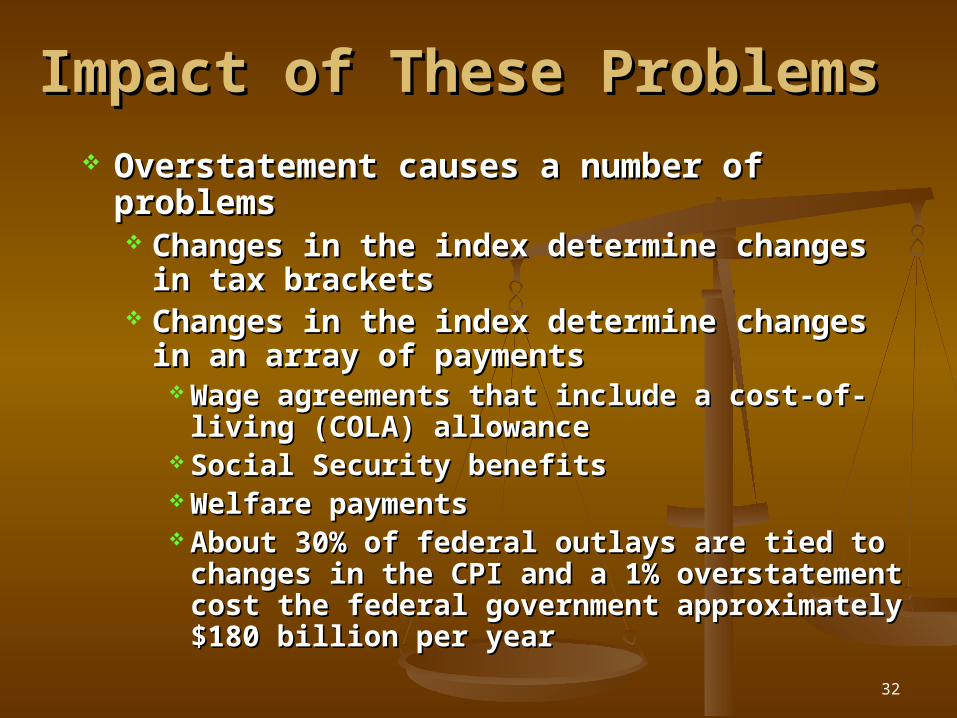
Impact of These ProblemsImpact of These Problems Overstatement causes a number of problemsOverstatement causes a number of problems
Changes in the index determine changes in tax Changes in the index determine changes in tax bracketsbrackets
Changes in the index determine changes in an Changes in the index determine changes in an array of paymentsarray of payments
Wage agreements that include a cost-of-living Wage agreements that include a cost-of-living (COLA) allowance(COLA) allowance
Social Security benefitsSocial Security benefits Welfare paymentsWelfare payments About 30% of federal outlays are tied to changes in About 30% of federal outlays are tied to changes in
the CPI and a 1% overstatement cost the federal the CPI and a 1% overstatement cost the federal government approximately $180 billion per yeargovernment approximately $180 billion per year
33
GDP Price IndexGDP Price Index
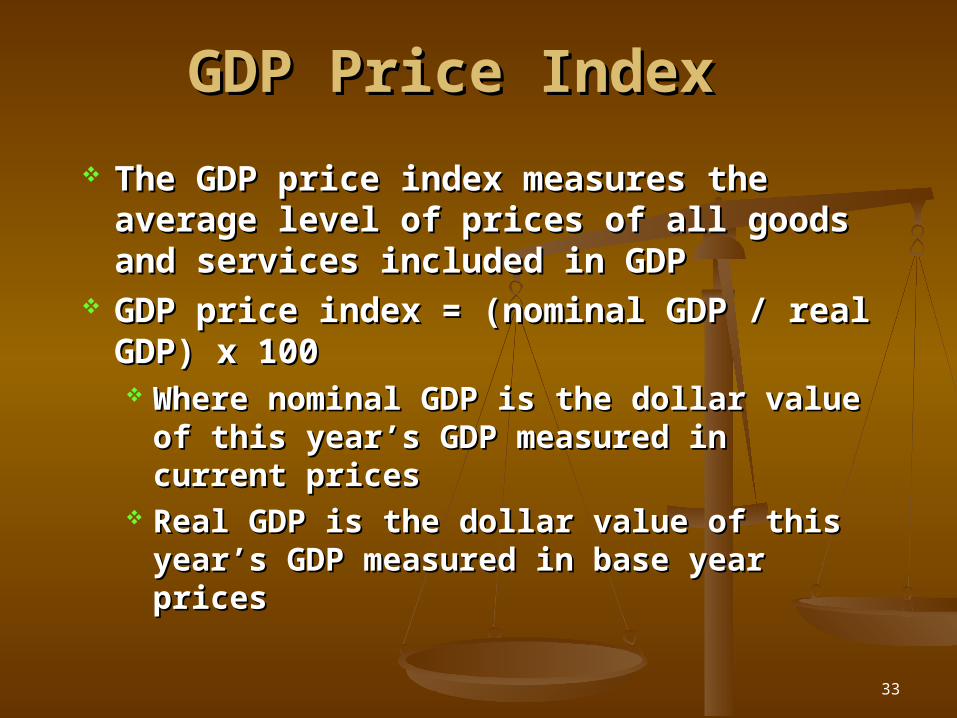
The GDP price index measures the average The GDP price index measures the average level of prices of all goods and services included level of prices of all goods and services included in GDPin GDP
GDP price index = (nominal GDP / real GDP) x GDP price index = (nominal GDP / real GDP) x 100100 Where nominal GDP is the dollar value of this Where nominal GDP is the dollar value of this
year’s GDP measured in current pricesyear’s GDP measured in current prices Real GDP is the dollar value of this year’s GDP Real GDP is the dollar value of this year’s GDP
measured in base year pricesmeasured in base year prices
34
GDP Price IndexGDP Price Index
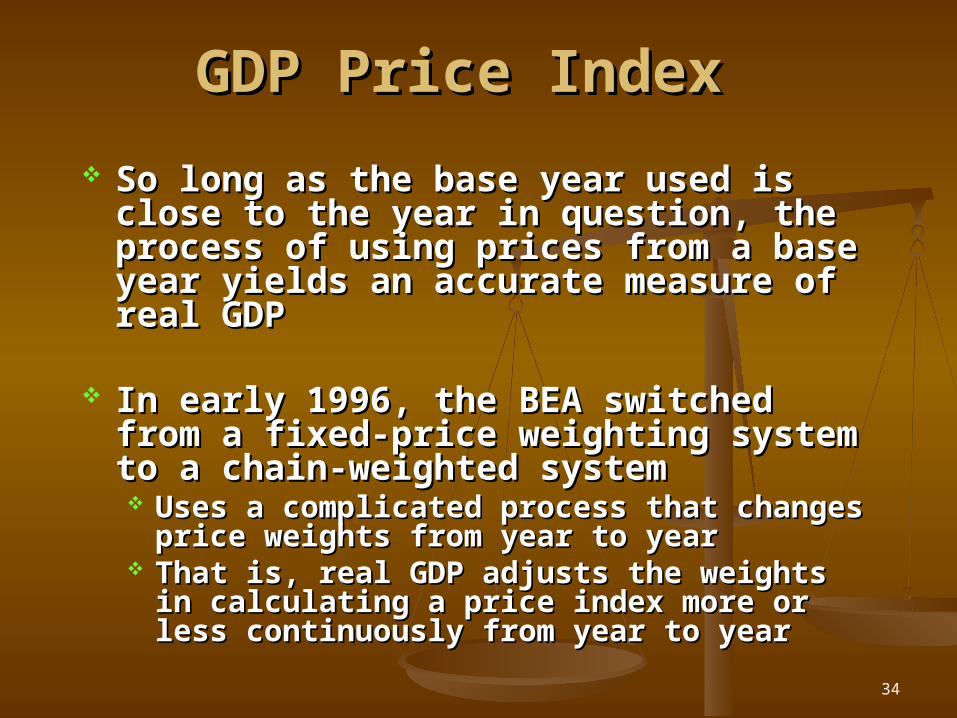
So long as the base year used is close to the year So long as the base year used is close to the year in question, the process of using prices from a in question, the process of using prices from a base year yields an accurate measure of real base year yields an accurate measure of real GDPGDP
In early 1996, the BEA switched from a fixed-In early 1996, the BEA switched from a fixed-price weighting system to a chain-weighted price weighting system to a chain-weighted systemsystem Uses a complicated process that changes price Uses a complicated process that changes price
weights from year to yearweights from year to year That is, real GDP adjusts the weights in calculating That is, real GDP adjusts the weights in calculating
a price index more or less continuously from year to a price index more or less continuously from year to yearyear
35
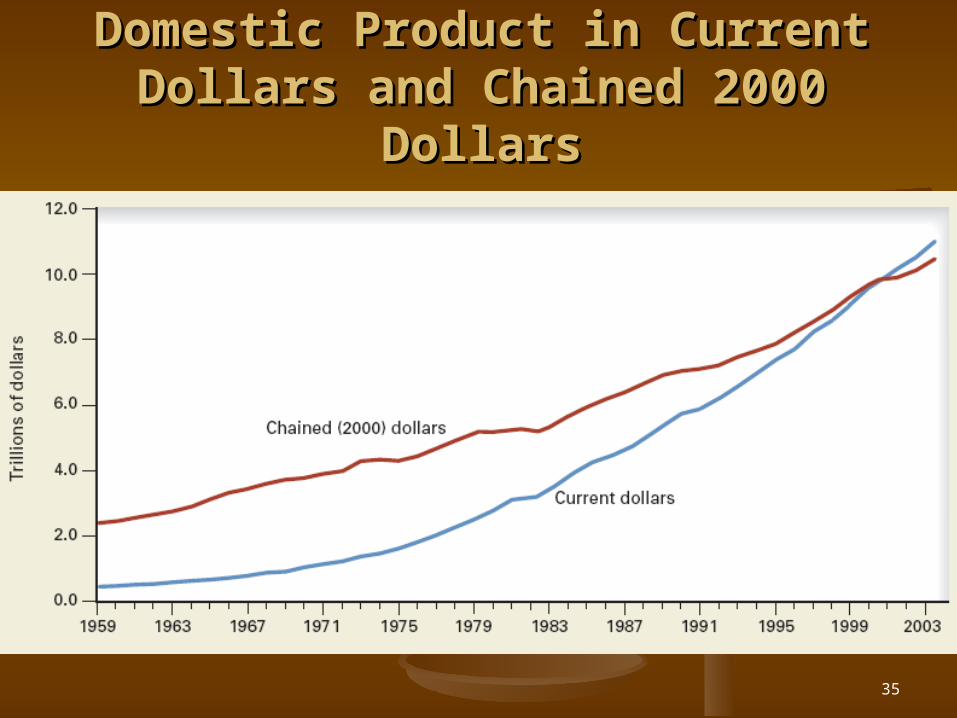
Exhibit 5: U.S. Gross Domestic Product in Exhibit 5: U.S. Gross Domestic Product in Current Dollars and Chained 2000 DollarsCurrent Dollars and Chained 2000 Dollars