Embed Size (px)
Citation preview
1
Page 1
Public Interest Energy Research (PIER)California Institute for Energy & Environment (CIEE)
Lawrence Berkeley National LaboratoryBill TschudiDale Sartor
http://hightech.lbl.gov
High-Performance High-Tech Buildings Project Laboratories, Cleanrooms, and Data Centers
August 4, 2005
22
California energy research related to data centers
Energy research roadmap Case studies and energy benchmarking Best practice identification Self benchmarking protocol Investigate efficiency of IT power supplies Investigate efficiency of UPS systems Metrics for computing performance vs.
energy Technology transfer Demonstration projects
33
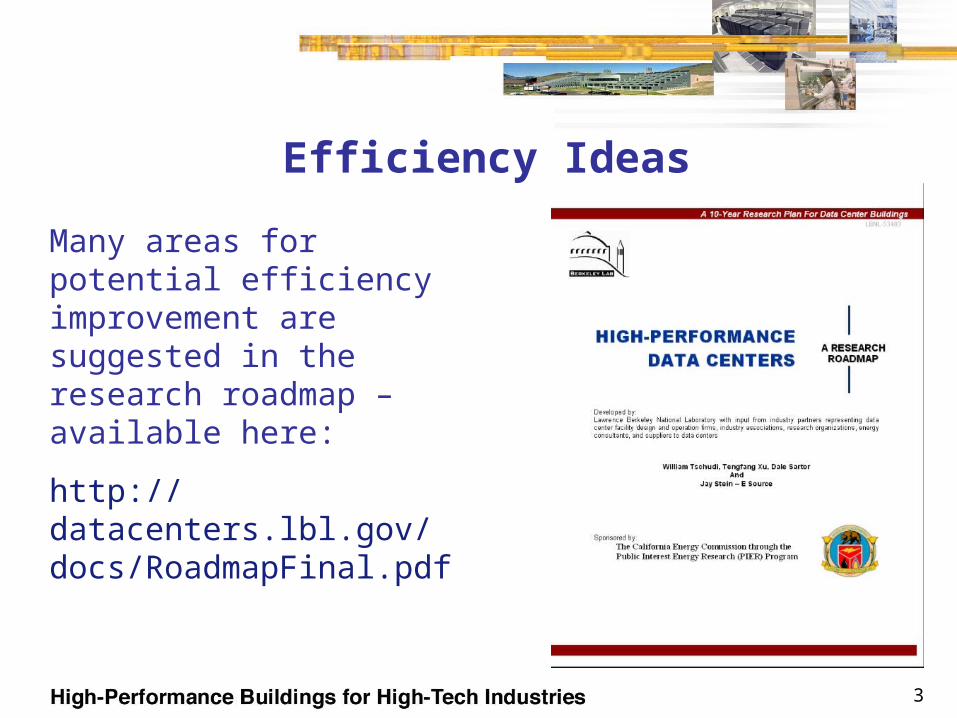
Efficiency Ideas
Many areas for potential efficiency improvement are suggested in the research roadmap – available here:
http://datacenters.lbl.gov/docs/RoadmapFinal.pdf
4
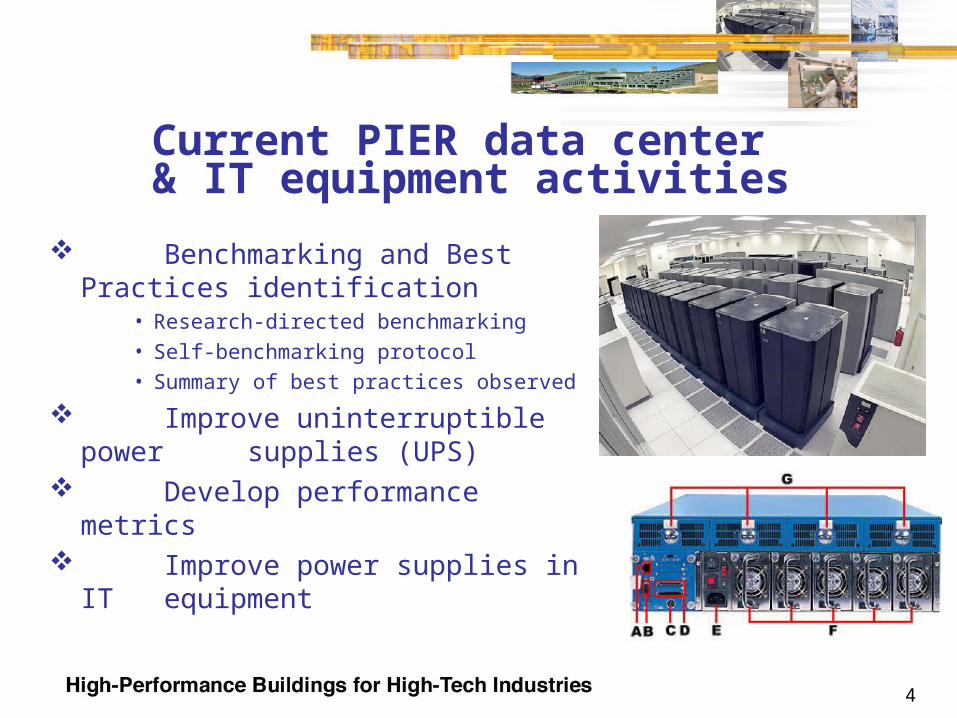
Benchmarking and Best Practices identification
• Research-directed benchmarking• Self-benchmarking protocol• Summary of best practices observed
Improve uninterruptible power supplies (UPS)
Develop performance metrics
Improve power supplies in IT equipment
4
Current PIER data center & IT equipment activities
55
Preliminary findings: Infrastructure is typically oversized by
factors of 4 or more for today’s loads Heat intensity is rising however computing
capability is rising faster There is wide variation in intensity and
efficiency Well studied efficiency measures (chilled
water optimization, lighting controls, etc.) are not implemented
Controversy over use of some technologies Industry is concerned – but more for ability
to cool rising heat intensity – not efficiency
6
LBNL scoped 15 potential demonstrations
5 demonstrations were selected including DC powering rack of computers
6
High-tech demonstration projects
7
DC Power Demonstration Project Team
7
LBNL• Bill Tschudi (PI)• Dale Sartor• Evan Mills• Steve
Greenberg
Subcontractors• Ecos Consulting/EPRI
Solutions (Power Supply and UPS evaluations)
Industry partners • EYP Mission Critical Facilities (Data center
benchmarking data collection)• TBD - Cost sharing required
8
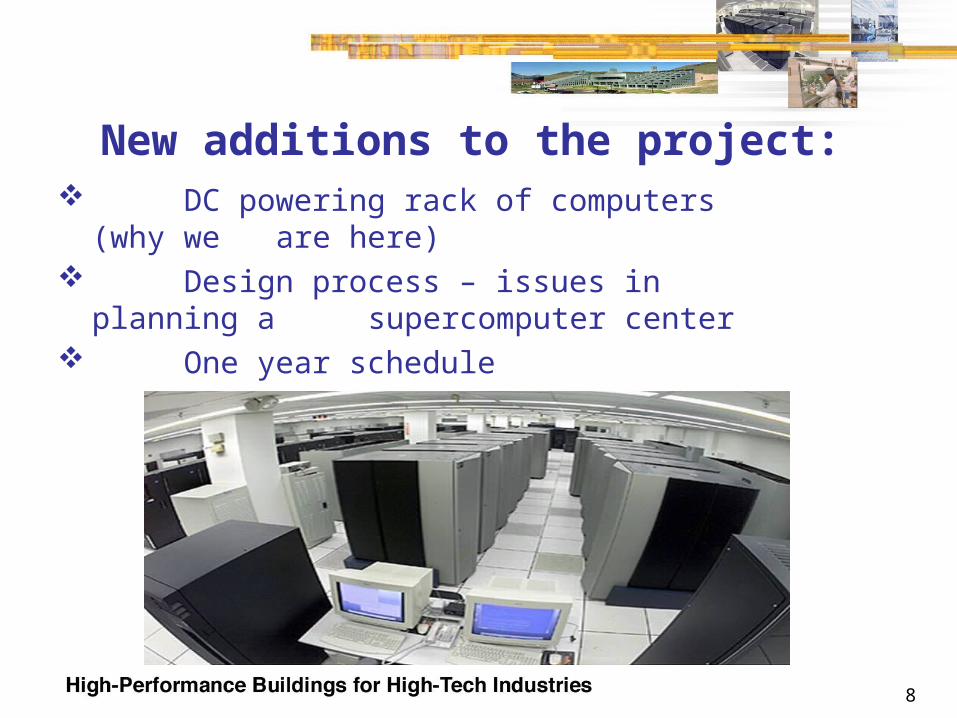
DC powering rack of computers (why we are here)
Design process – issues in planning a supercomputer center
One year schedule
8
New additions to the project:
9
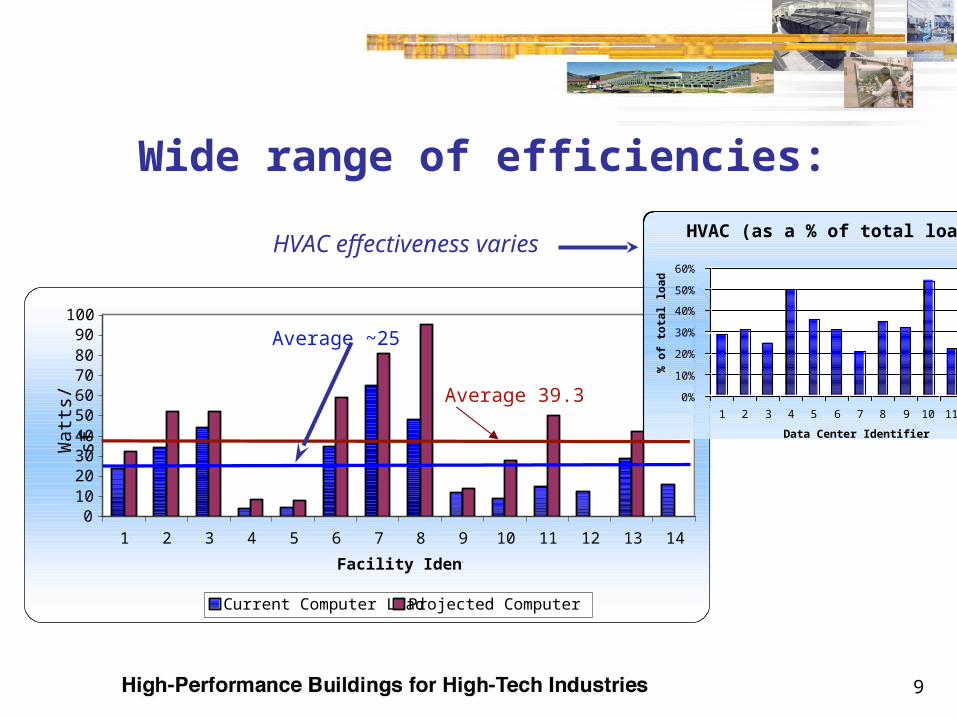
Wide range of efficiencies:
0102030405060708090
100
1 2 3 4 5 6 7 8 9 10 11 12 13 14
Facility Identifier
W/S
q.F
t.
Current Computer Load Projected Computer Load
Average 39.3
Average ~25
HVAC (as a % of total load)
0%
10%
20%
30%
40%
50%
60%
1 2 3 4 5 6 7 8 9 10 11 12
Data Center Identifier
% o
f to
tal l
oad
9
HVAC effectiveness varies
Watt
s/sf
10
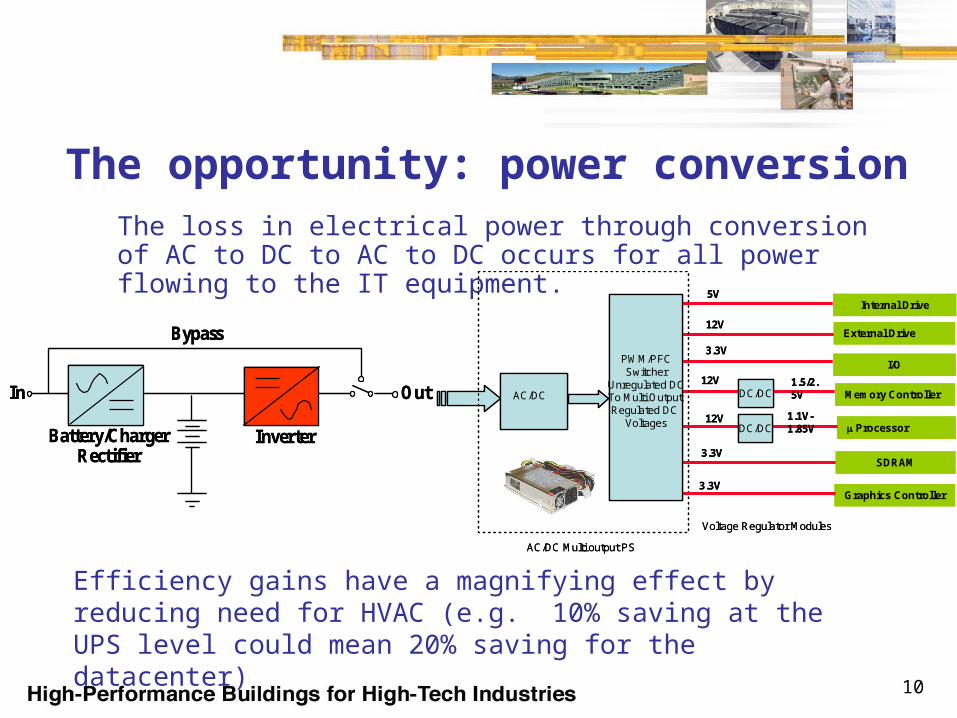
The opportunity: power conversionThe loss in electrical power through conversion of AC to DC to AC to DC occurs for all power flowing to the IT equipment.
10
Internal Drive
External Drive
I/O
Memory Controller
Processor
SDRAM
Graphics Controller
DC/DCAC/DC
DC/DC
AC/DC Multi output PS
Voltage Regulator Modules
5V
12V
3.3V
12V 1.5/2.5V
1.1V-1.85V
3.3V
3.3V
12V
PWM/PFCSwitcher
Unregulated DCTo Multi Output Regulated DC
Voltages
Internal Drive
External Drive
I/O
Memory Controller
Processor
SDRAM
Graphics Controller
DC/DCAC/DC
DC/DC
AC/DC Multi output PS
Voltage Regulator Modules
5V
12V
3.3V
12V 1.5/2.5V
1.1V-1.85V
3.3V
3.3V
12V
PWM/PFCSwitcher
Unregulated DCTo Multi Output Regulated DC
Voltages
Inverter
In Out
Bypass
Battery/ChargerRectifier
Inverter
In Out
Bypass
Battery/ChargerRectifier
Efficiency gains have a magnifying effect by reducing need for HVAC (e.g. 10% saving at the UPS level could mean 20% saving for the datacenter)
1111
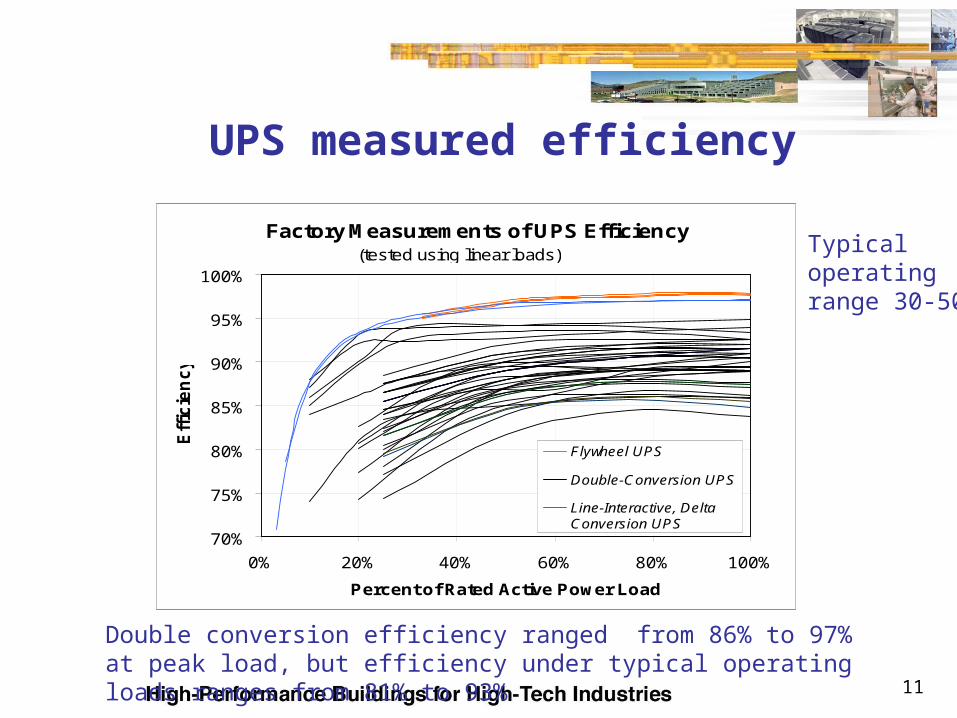
Double conversion efficiency ranged from 86% to 97% at peak load, but efficiency under typical operating loads ranges from 81% to 93%
UPS measured efficiency
Typical operating range 30-50%
Factory Measurements of UPS Efficiency
70%
75%
80%
85%
90%
95%
100%
0% 20% 40% 60% 80% 100%
Percent of Rated Active Power Load
Eff
icie
nc
y
Flywheel UPS
Double-Conversion UPS
Line-Interactive, DeltaConversion UPS
(tested using linear loads)
12
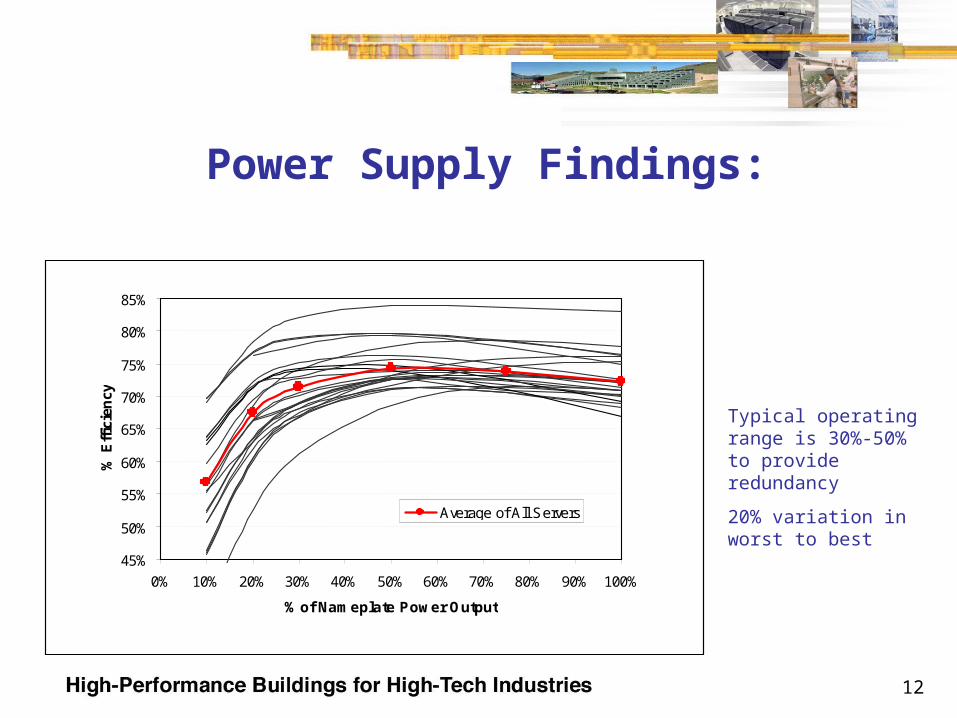
Power Supply Findings:
12
Typical operating range is 30%-50% to provide redundancy
20% variation in worst to best
45%
50%
55%
60%
65%
70%
75%
80%
85%
0% 10% 20% 30% 40% 50% 60% 70% 80% 90% 100%
% of Nameplate Power Output
% E
ffic
ien
cy
Average of All Servers
1313
Today’s goal:
Help us define demonstration project
Identify Industry partner roles and resources
Identify barriers and plans to overcome them
Clear action plan