Embed Size (px)
Citation preview
1
Pertemuan 01Pendahuluan
Matakuliah : I0272 – Statistik Probabilitas
Tahun : 2005
Versi : Revisi
2
Learning Outcomes
Pada akhir pertemuan ini, diharapkan mahasiswa
akan mampu :
• Mahasiswa akan dapat menjelaskan cara menentukan data pencilan dengan diagram kotak-garis.
3
Outline Materi
• Peranan dan jangkauan statistika
• Sebaran frekuensi
• Diagram dahan dan daun
4
Data and Statistics
• Applications in Business and Economics
• Data
• Data Sources
• Descriptive Statistics
• Statistical Inference
5
Applications in Business and Economics
• Accounting
Public accounting firms use statistical sampling procedures when conducting audits for their clients.
• Finance
Financial analysts use a variety of statistical information, including price-earnings ratios and dividend yields, to guide their investment recommendations.
• Marketing
Electronic point-of-sale scanners at retail checkout counters are being used to collect data for a variety of marketing research applications.
6
• Production
A variety of statistical quality control charts are used to monitor the output of a production process.
• Economics
Economists use statistical information in making forecasts about the future of the economy or some aspect of it.
Applications in Business and Economics
7
Data
• Elements, Variables, and Observations
• Scales of Measurement
• Qualitative and Quantitative Data
• Cross-Sectional and Time Series Data
8
Data and Data Sets
• Data are the facts and figures that are collected, summarized, analyzed, and interpreted.
• The data collected in a particular study are referred to as the data set.
9
Elements, Variables, and Observations
• The elements are the entities on which data are collected.
• A variable is a characteristic of interest for the elements.
• The set of measurements collected for a particular element is called an observation.
• The total number of data values in a data set is the number of elements multiplied by the number of variables.
10
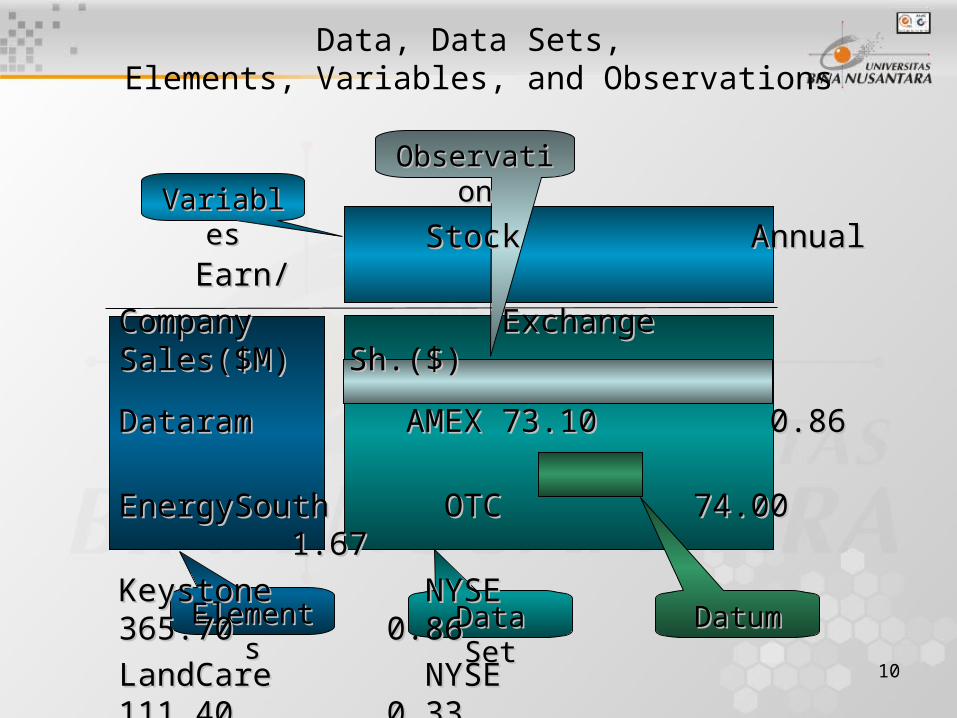
Data, Data Sets, Elements, Variables, and Observations
ElementElementss
VariableVariabless
Data SetData Set DatumDatum
ObservatioObservationn
StockStock Annual Annual Earn/Earn/
CompanyCompany Exchange Sales($M) Sh. Exchange Sales($M) Sh.($)($)
DataramDataram AMEXAMEX 73.1073.10 0.86 0.86
EnergySouthEnergySouth OTC OTC 74.0074.00 1.67 1.67
KeystoneKeystone NYSE NYSE 365.70 365.70 0.86 0.86
LandCareLandCare NYSE NYSE 111.40 111.40 0.330.33
PsychemedicsPsychemedics AMEXAMEX 17.6017.60 0.13 0.13
11
Scales of Measurement
• Scales of measurement include:– Nominal– Ordinal– Interval– Ratio
• The scale determines the amount of information contained in the data.
• The scale indicates the data summarization and statistical analyses that are most appropriate.
12
Scales of Measurement
• Nominal– Data are labels or names used to identify
an attribute of the element.– A nonnumeric label or a numeric code may
be used.
13
Scales of Measurement
• Nominal– Example:
Students of a university are classified by the school in which they are enrolled using a nonnumeric label such as Business, Humanities, Education, and so on.
Alternatively, a numeric code could be used for the school variable (e.g. 1 denotes Business, 2 denotes Humanities, 3 denotes Education, and so on).
14
Scales of Measurement
• Ordinal– The data have the properties of nominal
data and the order or rank of the data is meaningful.
– A nonnumeric label or a numeric code may be used.
15
Scales of Measurement
• Ordinal– Example:
Students of a university are classified by their class standing using a nonnumeric label such as Freshman, Sophomore, Junior, or Senior.
Alternatively, a numeric code could be used for the class standing variable (e.g. 1 denotes Freshman, 2 denotes Sophomore, and so on).
16
Scales of Measurement
• Interval– The data have the properties of ordinal data
and the interval between observations is expressed in terms of a fixed unit of measure.
– Interval data are always numeric.
17
Scales of Measurement
• Interval– Example:
Melissa has an SAT score of 1205, while Kevin has an SAT score of 1090. Melissa scored 115 points more than Kevin.
18
Scales of Measurement
• Ratio– The data have all the properties of interval
data and the ratio of two values is meaningful.
– Variables such as distance, height, weight, and time use the ratio scale.
– This scale must contain a zero value that indicates that nothing exists for the variable at the zero point.
19
Qualitative Data
• Qualitative data are labels or names used to identify an attribute of each element.
• Qualitative data use either the nominal or ordinal scale of measurement.
• Qualitative data can be either numeric or nonnumeric.
• The statistical analysis for qualitative data are rather limited.
20
Quantitative Data
• Quantitative data indicate either how many or how much.– Quantitative data that measure how many are
discrete.– Quantitative data that measure how much are
continuous because there is no separation between the possible values for the data..
• Quantitative data are always numeric.• Ordinary arithmetic operations are
meaningful only with quantitative data.
21
Cross-Sectional and Time Series Data
• Cross-sectional data are collected at the same or approximately the same point in time.– Example: data detailing the number of building
permits issued in June 2000 in each of the counties of Texas
• Time series data are collected over several time periods.– Example: data detailing the number of building
permits issued in Travis County, Texas in each of the last 36 months
22
Data Sources
• Internet– The Internet has become an important source of
data.– Most government agencies, like the Bureau of
the Census (www.census.gov), make their data available through a web site.
– More and more companies are creating web sites and providing public access to them.
– A number of companies now specialize in making information available over the Internet.

23
• Selamat Belajar Semoga Sukses.