Embed Size (px)
Citation preview
04/19/23 1
Risk and ReturnRisk and Return
邦保罗邦保罗
04/19/23 2
Return definition
• The return R on any The return R on any investment in shares per investment in shares per period t is:period t is:
• The dividend DThe dividend Dtt in that in that
period plus the gain/loss in period plus the gain/loss in value of the share (Pvalue of the share (Ptt-P-Pt-1t-1 )
• R=(DR=(Dtt+(P+(Ptt-P-Pt-1t-1))P))Pt-1t-1
04/19/23 3
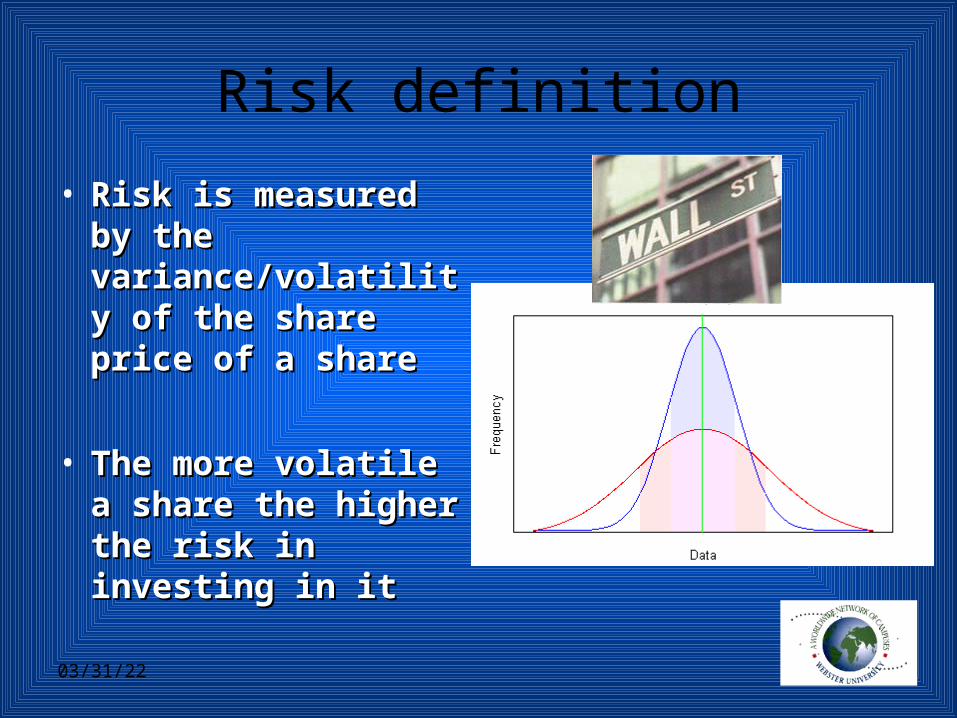
Risk definition
• Risk is measured by Risk is measured by the the variance/volatility of variance/volatility of the share price of a the share price of a shareshare
• The more volatile a The more volatile a share the higher the share the higher the risk in investing in itrisk in investing in it
04/19/23 4
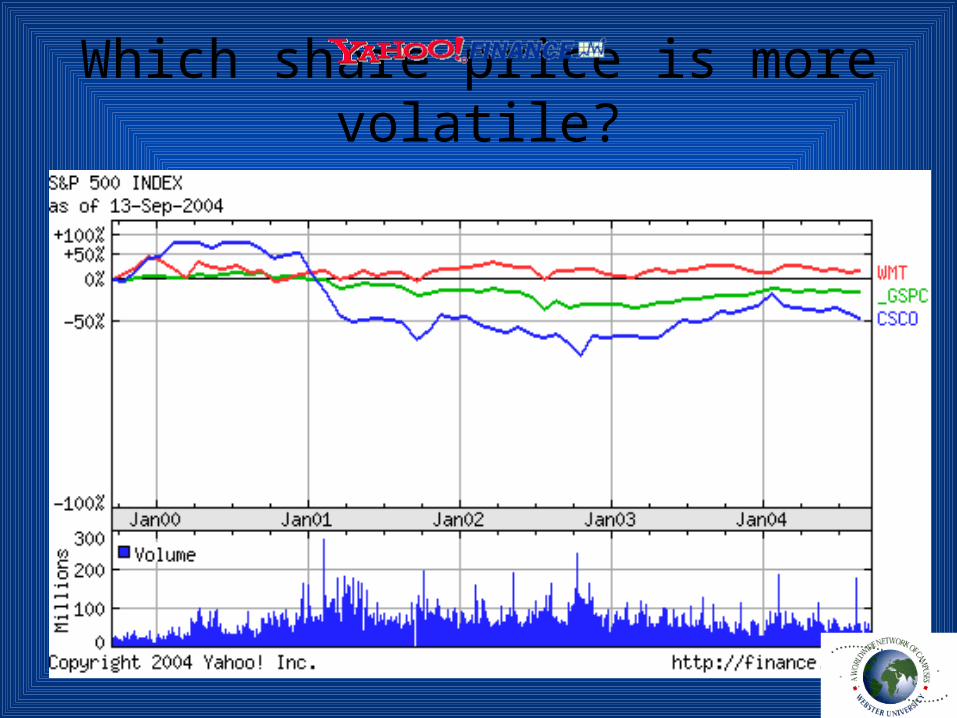
Which share price is more volatile?
04/19/23 5
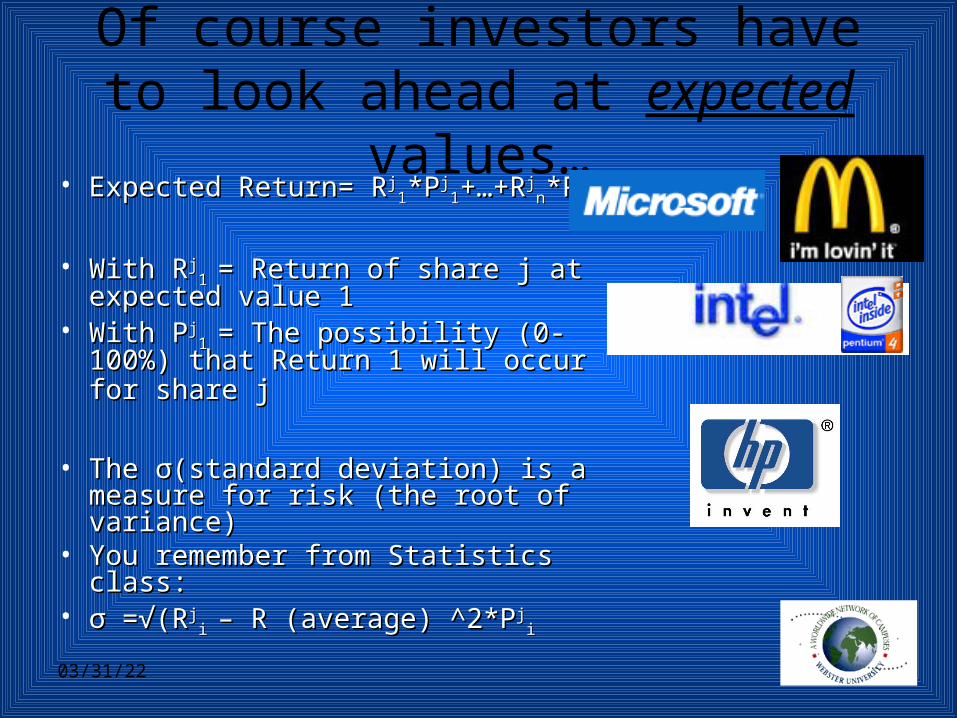
Of course investors have to look ahead at expected values…
• Expected Return= RExpected Return= Rjj11*P*Pjj
11+…+R+…+Rjjnn*P*Pjj
nn
• With RWith Rjj1 1 = Return of share j at = Return of share j at
expected value 1expected value 1• With PWith Pjj
1 1 = The possibility (0-100%) = The possibility (0-100%) that Return 1 will occur for share jthat Return 1 will occur for share j
• The The σσ(standard deviation) is a (standard deviation) is a measure for risk (the root of measure for risk (the root of variance)variance)
• You remember from Statistics class:You remember from Statistics class:• σσ =√( =√(RRjj
i i – R (average) ^2*P– R (average) ^2*Pjji i
04/19/23 6
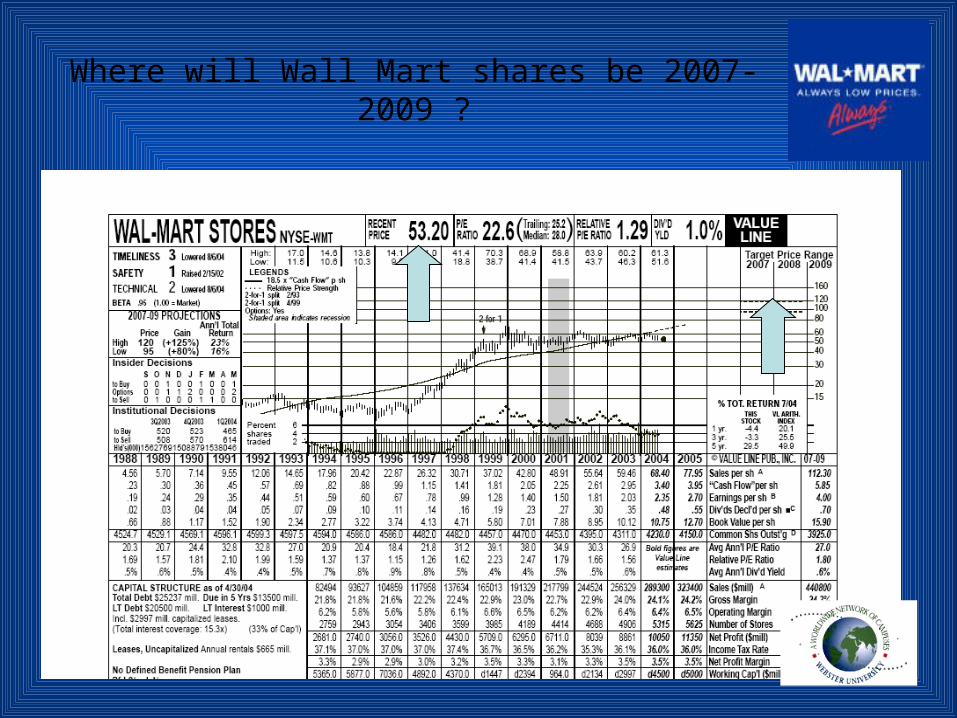
Where will Wall Mart shares be 2007-2009 ?
04/19/23 7
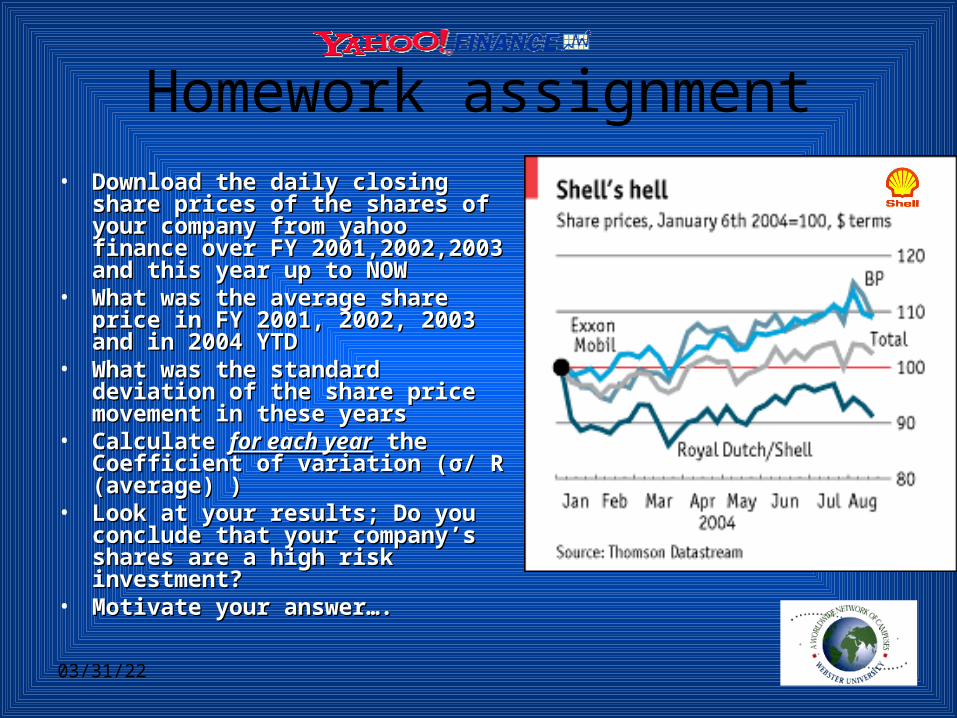
Homework assignment• Download the daily closing share Download the daily closing share
prices of the shares of your prices of the shares of your company from yahoo finance over company from yahoo finance over FY 2001,2002,2003 and this year up FY 2001,2002,2003 and this year up to NOWto NOW
• What was the average share price in What was the average share price in FY 2001, 2002, 2003 and in 2004 FY 2001, 2002, 2003 and in 2004 YTDYTD
• What was the standard deviation of What was the standard deviation of the share price movement in these the share price movement in these yearsyears
• Calculate Calculate for each yearfor each year the the Coefficient of variation (Coefficient of variation (σσ/ / R R (average) )(average) )
• Look at your results; Do you Look at your results; Do you conclude that your companyconclude that your company’’s s shares are a high risk investment?shares are a high risk investment?
• Motivate your answer….Motivate your answer….
04/19/23 8
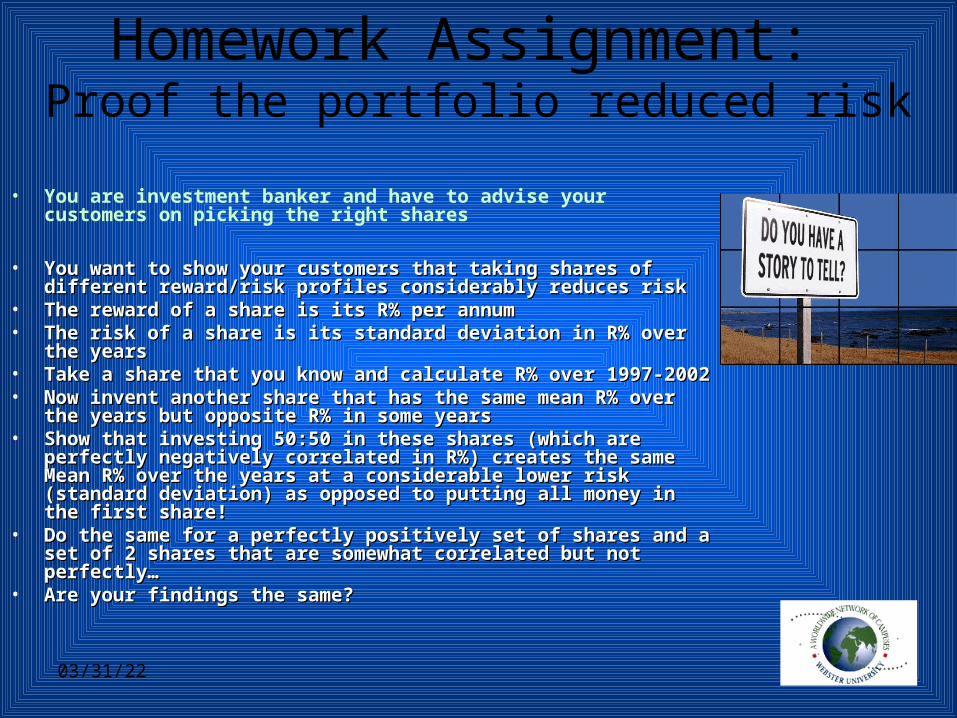
Homework Assignment: Proof the portfolio reduced risk
• You are investment banker and have to advise your customers on picking the right shares
• You want to show your customers that taking shares of different You want to show your customers that taking shares of different reward/risk profiles considerably reduces riskreward/risk profiles considerably reduces risk
• The reward of a share is its R% per annumThe reward of a share is its R% per annum• The risk of a share is its standard deviation in R% over the yearsThe risk of a share is its standard deviation in R% over the years• Take a share that you know and calculate R% over 1997-2002Take a share that you know and calculate R% over 1997-2002• Now invent another share that has the same mean R% over the years Now invent another share that has the same mean R% over the years
but opposite R% in some yearsbut opposite R% in some years• Show that investing 50:50 in these shares (which are perfectly Show that investing 50:50 in these shares (which are perfectly
negatively correlated in R%) creates the same Mean R% over the negatively correlated in R%) creates the same Mean R% over the years at a considerable lower risk (standard deviation) as opposed to years at a considerable lower risk (standard deviation) as opposed to putting all money in the first share!putting all money in the first share!
• Do the same for a perfectly positively set of shares and a set of 2 Do the same for a perfectly positively set of shares and a set of 2 shares that are somewhat correlated but not perfectly…shares that are somewhat correlated but not perfectly…
• Are your findings the same? Are your findings the same?
04/19/23 9
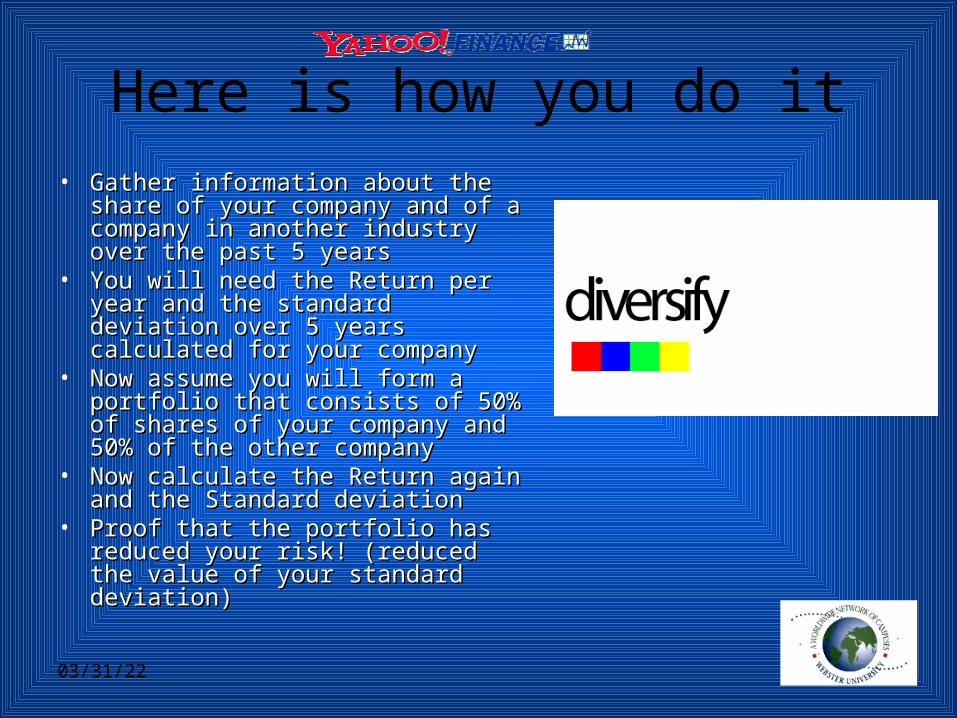
Here is how you do it• Gather information about the share Gather information about the share
of your company and of a company of your company and of a company in another industry over the past 5 in another industry over the past 5 yearsyears
• You will need the Return per year You will need the Return per year and the standard deviation over 5 and the standard deviation over 5 years calculated for your companyyears calculated for your company
• Now assume you will form a Now assume you will form a portfolio that consists of 50% of portfolio that consists of 50% of shares of your company and 50% of shares of your company and 50% of the other companythe other company
• Now calculate the Return again and Now calculate the Return again and the Standard deviationthe Standard deviation
• Proof that the portfolio has reduced Proof that the portfolio has reduced your risk! (reduced the value of your your risk! (reduced the value of your standard deviation) standard deviation)
04/19/23 10
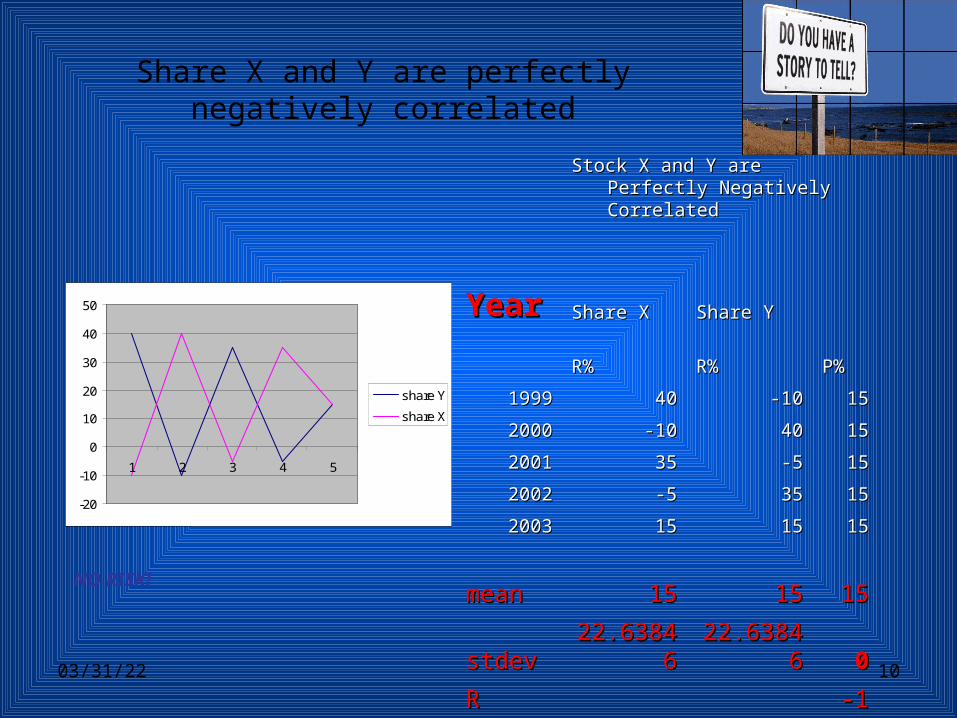
Share X and Y are perfectly negatively correlated
-20
-10
0
10
20
30
40
50
1 2 3 4 5
share Y
share X
Stock X and Y are Perfectly Stock X and Y are Perfectly Negatively CorrelatedNegatively Correlated
YearYear Share XShare X Share YShare Y
R%R% R%R% P%P%
19991999 4040 -10-10 1515
20002000 -10-10 4040 1515
20012001 3535 -5-5 1515
20022002 -5-5 3535 1515
20032003 1515 1515 1515
meanmean 1515 1515 1515
stdevstdev 22.6384622.63846 22.6384622.63846 00
RR -1-1
NO RISK!
04/19/23 11
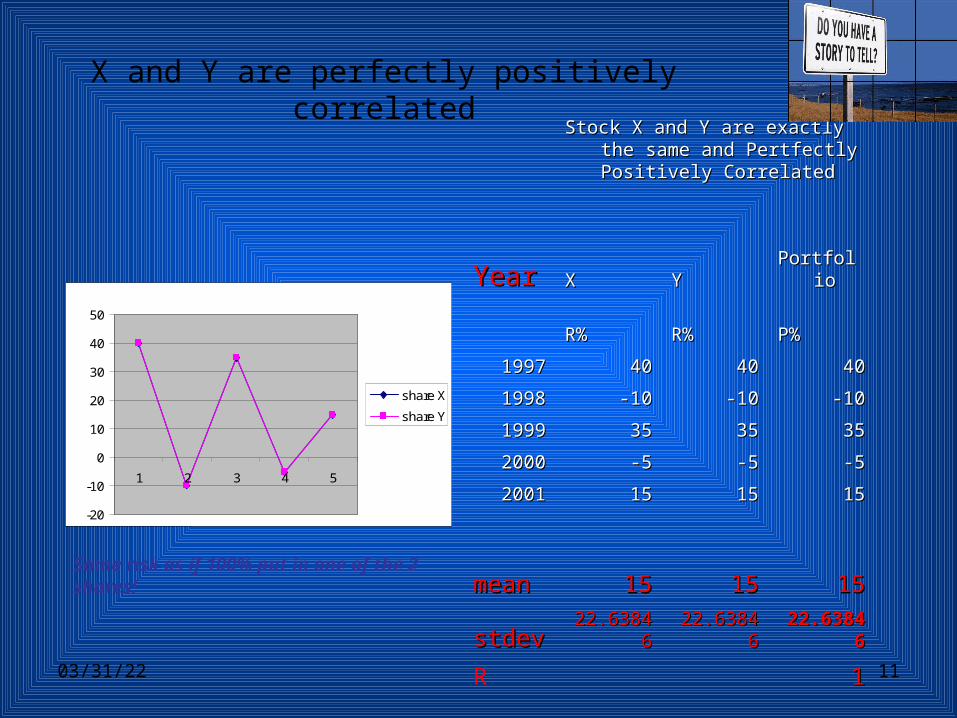
X and Y are perfectly positively correlated
-20
-10
0
10
20
30
40
50
1 2 3 4 5
share X
share Y
Stock X and Y are exactly the same Stock X and Y are exactly the same and Pertfectly Positively and Pertfectly Positively CorrelatedCorrelated
YearYear XX YY PortfolioPortfolio
R%R% R%R% P%P%
19971997 4040 4040 4040
19981998 -10-10 -10-10 -10-10
19991999 3535 3535 3535
20002000 -5-5 -5-5 -5-5
20012001 1515 1515 1515
meanmean 1515 1515 1515
stdevstdev 22.6384622.63846 22.6384622.63846 22.6384622.63846
R 11
Same risk as if 100% put in one of the 2 shares!
04/19/23 12
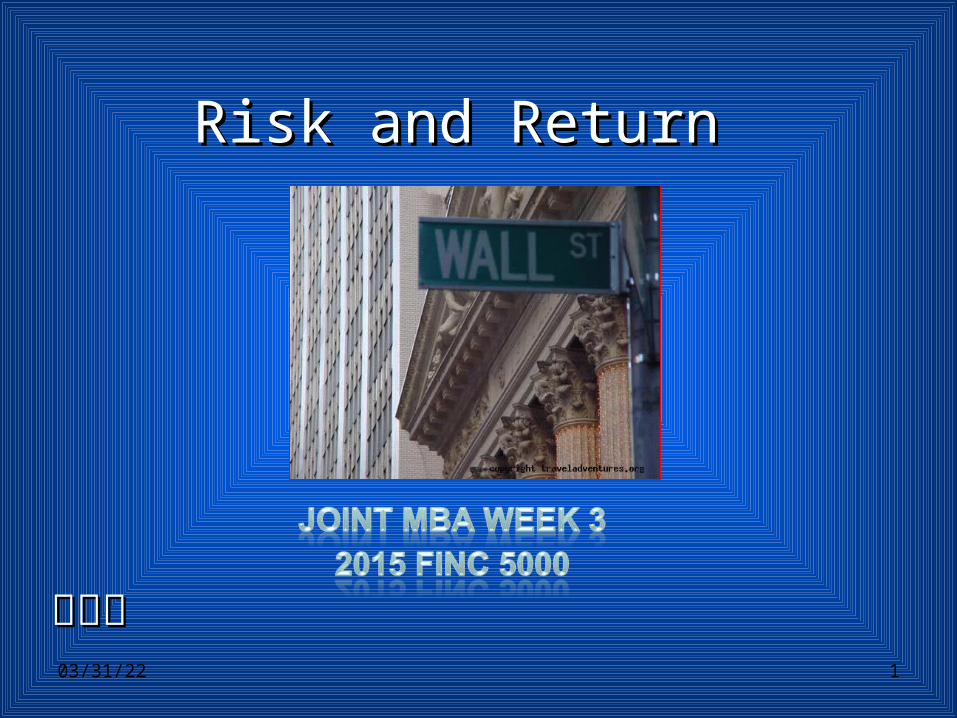
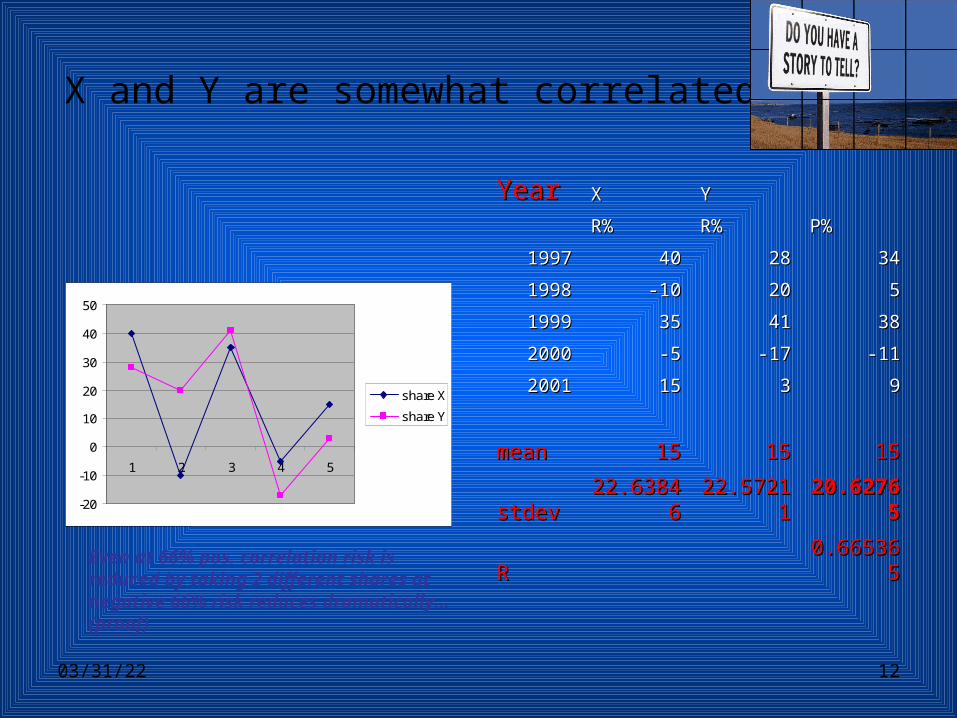
X and Y are somewhat correlated
-20
-10
0
10
20
30
40
50
1 2 3 4 5
share X
share Y
YearYear XX YY
R%R% R%R% P%P%
19971997 4040 2828 3434
19981998 -10-10 2020 55
19991999 3535 4141 3838
20002000 -5-5 -17-17 -11-11
20012001 1515 33 99
meanmean 1515 1515 1515
stdevstdev 22.6384622.63846 22.5721122.57211 20.6276520.62765
RR 0.6653650.665365
Even at 66% pos. correlation risk is reduced by taking 2 different shares at negative 66% risk reduces dramatically… (proof)
04/19/23 13
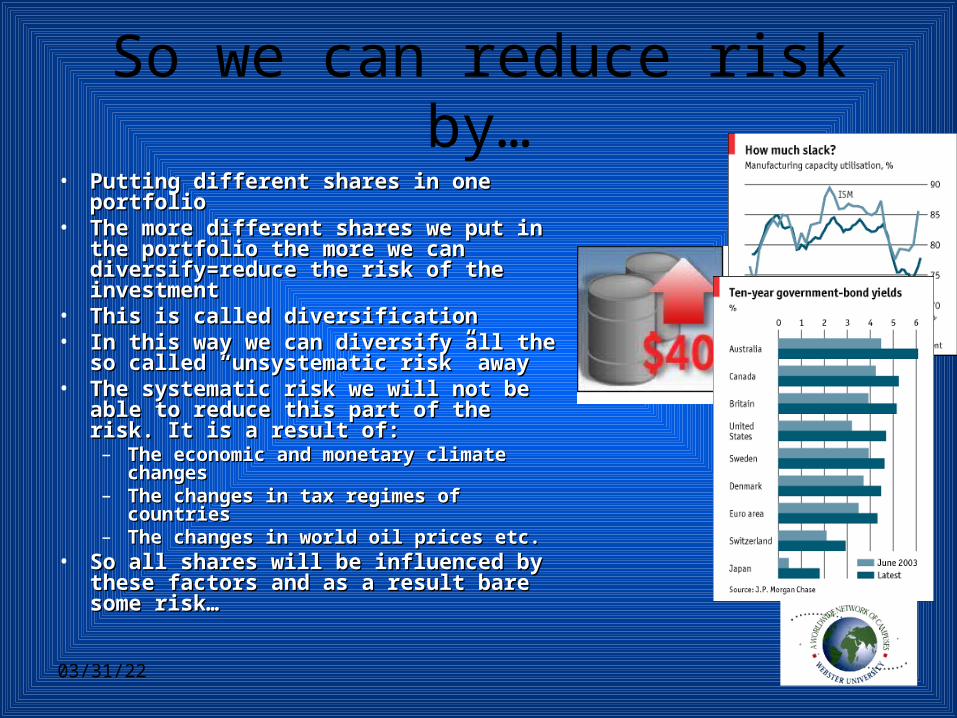
So we can reduce risk by…• Putting different shares in one portfolioPutting different shares in one portfolio• The more different shares we put in the The more different shares we put in the
portfolio the more we can portfolio the more we can diversify=reduce the risk of the diversify=reduce the risk of the investmentinvestment
• This is called diversificationThis is called diversification• In this way we can diversify all the so In this way we can diversify all the so
called called ““unsystematic riskunsystematic risk”” away away• The systematic risk we will not be able The systematic risk we will not be able
to reduce this part of the risk. It is a to reduce this part of the risk. It is a result of:result of:– The economic and monetary climate The economic and monetary climate
changeschanges– The changes in tax regimes of countriesThe changes in tax regimes of countries– The changes in world oil prices etc.The changes in world oil prices etc.
• So all shares will be influenced by these So all shares will be influenced by these factors and as a result bare some risk…factors and as a result bare some risk…
04/19/23 14
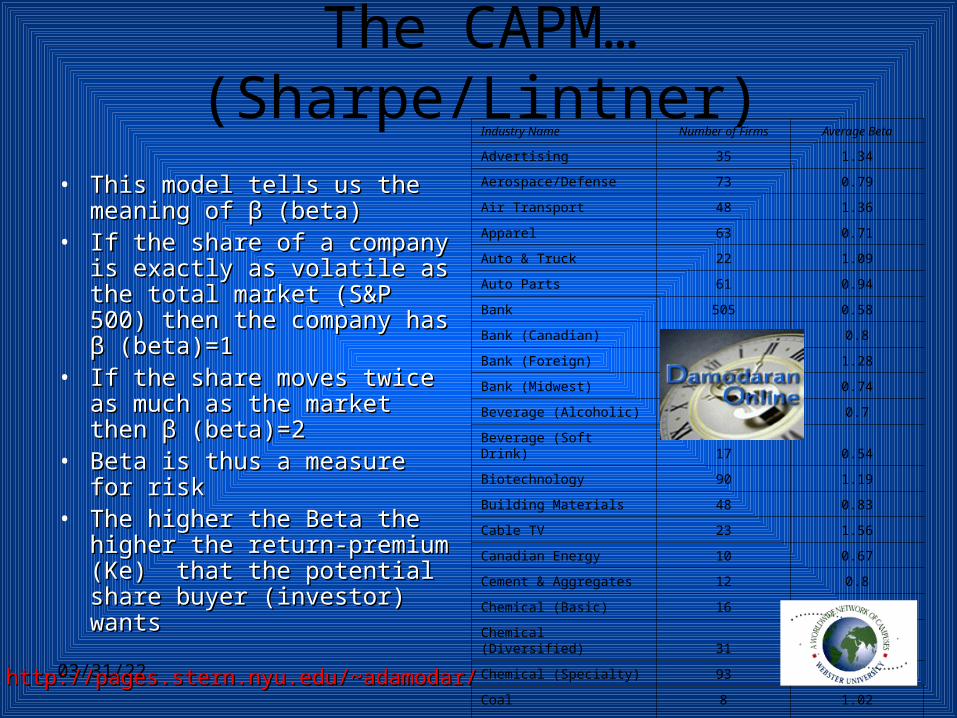
The CAPM… (Sharpe/Lintner)
• This model tells us the This model tells us the meaning of meaning of ββ (beta) (beta)
• If the share of a company is If the share of a company is exactly as volatile as the total exactly as volatile as the total market (S&P 500) then the market (S&P 500) then the company has company has ββ (beta)=1 (beta)=1
• If the share moves twice as If the share moves twice as much as the market then much as the market then ββ (beta)=2(beta)=2
• Beta is thus a measure for riskBeta is thus a measure for risk• The higher the Beta the higher The higher the Beta the higher
the return-premium (Ke) that the return-premium (Ke) that the potential share buyer the potential share buyer (investor) wants(investor) wants
Industry Name Number of Firms Average Beta
Advertising 35 1.34
Aerospace/Defense 73 0.79
Air Transport 48 1.36
Apparel 63 0.71
Auto & Truck 22 1.09
Auto Parts 61 0.94
Bank 505 0.58
Bank (Canadian) 8 0.8
Bank (Foreign) 4 1.28
Bank (Midwest) 38 0.74
Beverage (Alcoholic) 22 0.7
Beverage (Soft Drink) 17 0.54
Biotechnology 90 1.19
Building Materials 48 0.83
Cable TV 23 1.56
Canadian Energy 10 0.67
Cement & Aggregates 12 0.8
Chemical (Basic) 16 0.99
Chemical (Diversified) 31 0.84
Chemical (Specialty) 93 0.81
Coal 8 1.02
Computer Software/Svcs 400 1.83http://pages.stern.nyu.edu/~adamodar/http://pages.stern.nyu.edu/~adamodar/
04/19/23 15
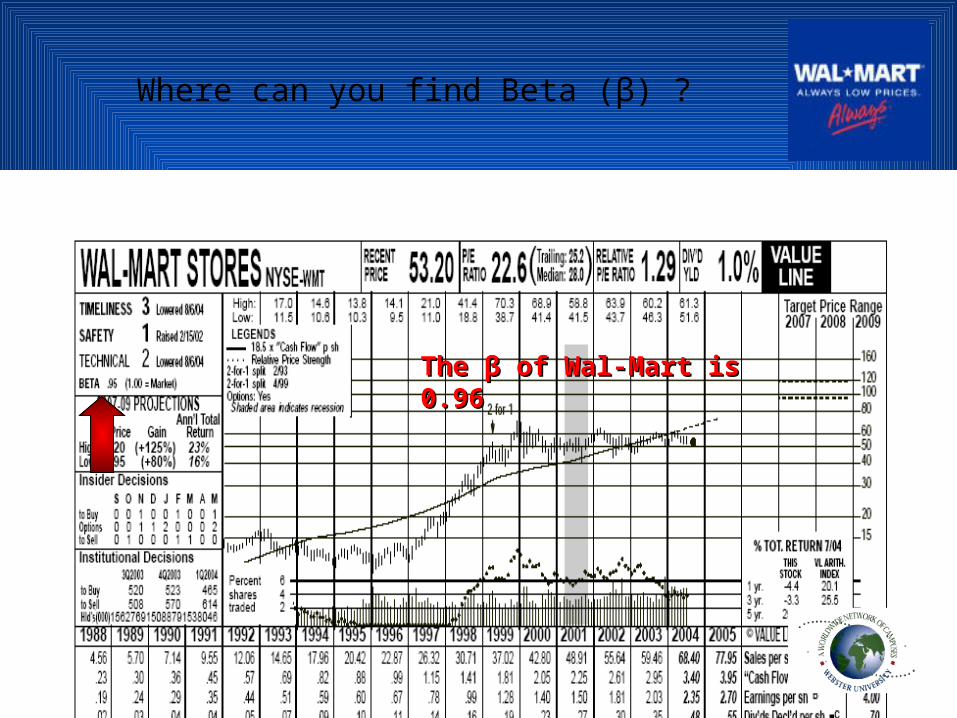
Where can you find Beta (β) ?
The The ββ of Wal-Mart is 0.96 of Wal-Mart is 0.96
04/19/23 16
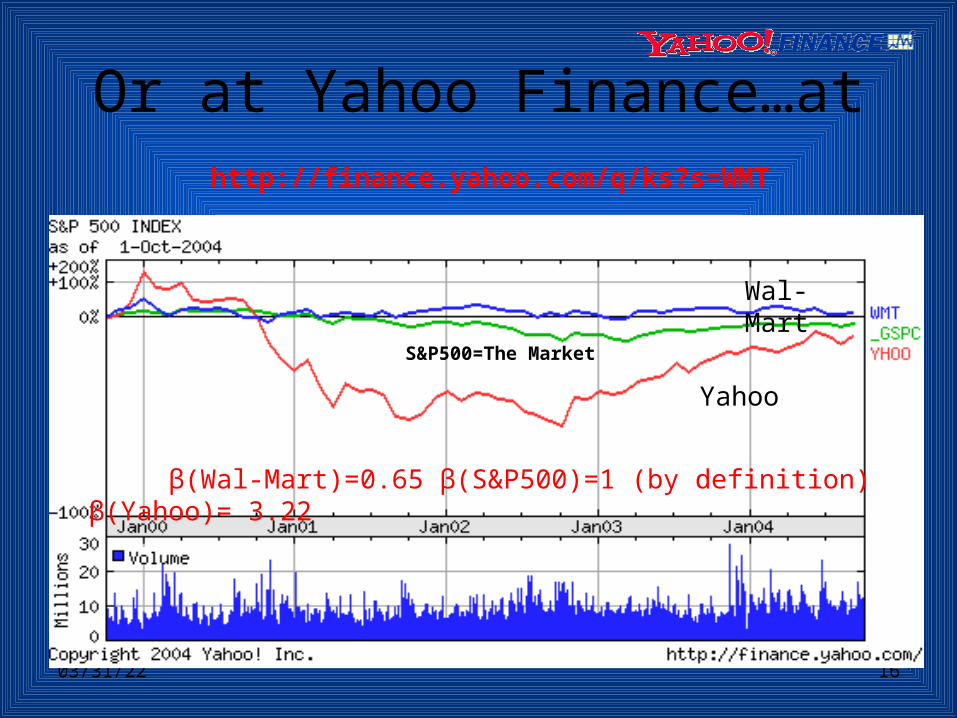
Or at Yahoo Finance…athttp://finance.yahoo.com/q/ks?s=WMT
Yahoo
Wal-Mart
S&P500=The Market
β(Wal-Mart)=0.65 β(S&P500)=1 (by definition) β(Yahoo)= 3.22
04/19/23 17
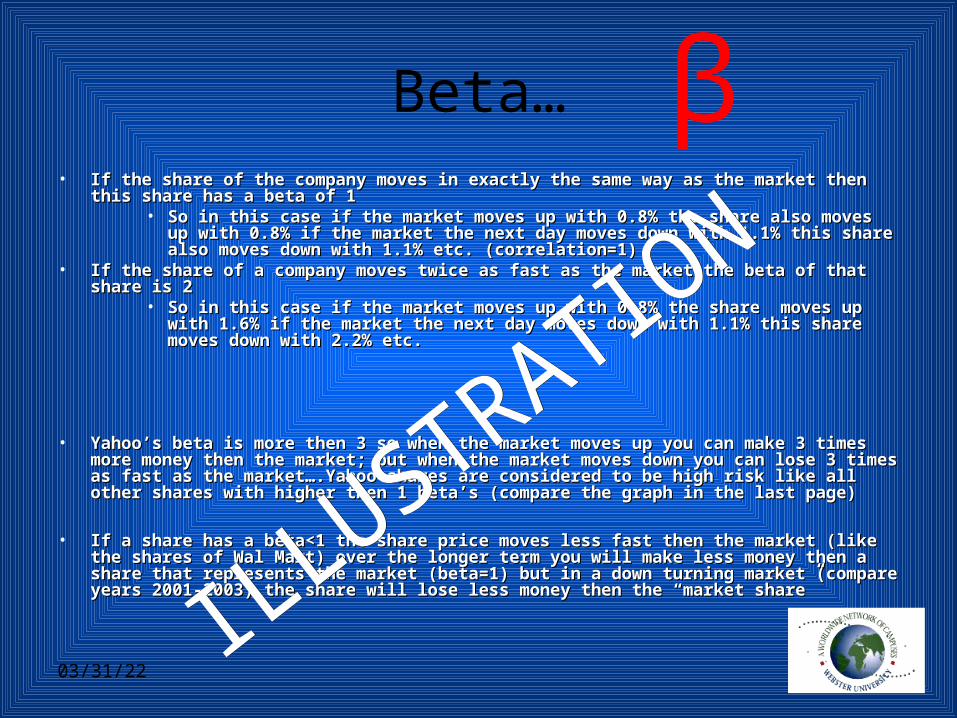
Beta…• If the share of the company moves in exactly the same way as the market then this share If the share of the company moves in exactly the same way as the market then this share
has a beta of 1has a beta of 1• So in this case if the market moves up with 0.8% the share also moves up with So in this case if the market moves up with 0.8% the share also moves up with
0.8% if the market the next day moves down with 1.1% this share also moves 0.8% if the market the next day moves down with 1.1% this share also moves down with 1.1% etc. (correlation=1)down with 1.1% etc. (correlation=1)
• If the share of a company moves twice as fast as the market the beta of that share is 2If the share of a company moves twice as fast as the market the beta of that share is 2• So in this case if the market moves up with 0.8% the share moves up with 1.6% So in this case if the market moves up with 0.8% the share moves up with 1.6%
if the market the next day moves down with 1.1% this share moves down with if the market the next day moves down with 1.1% this share moves down with 2.2% etc. 2.2% etc.
• YahooYahoo’’s beta is more then 3 so when the market moves up you can make 3 times more s beta is more then 3 so when the market moves up you can make 3 times more money then the market; but when the market moves down you can lose 3 times as fast as money then the market; but when the market moves down you can lose 3 times as fast as the market….Yahoo shares are considered to be high risk like all other shares with higher the market….Yahoo shares are considered to be high risk like all other shares with higher then 1 betathen 1 beta’’s (compare the graph in the last page)s (compare the graph in the last page)
• If a share has a beta<1 the share price moves less fast then the market (like the shares of If a share has a beta<1 the share price moves less fast then the market (like the shares of Wal Mart) over the longer term you will make less money then a share that represents the Wal Mart) over the longer term you will make less money then a share that represents the market (beta=1) but in a down turning market (compare years 2001-2003) the share will market (beta=1) but in a down turning market (compare years 2001-2003) the share will lose less money then the lose less money then the ““market sharemarket share””
β
ILLUSTRATION
ILLUSTRATION
04/19/23 18
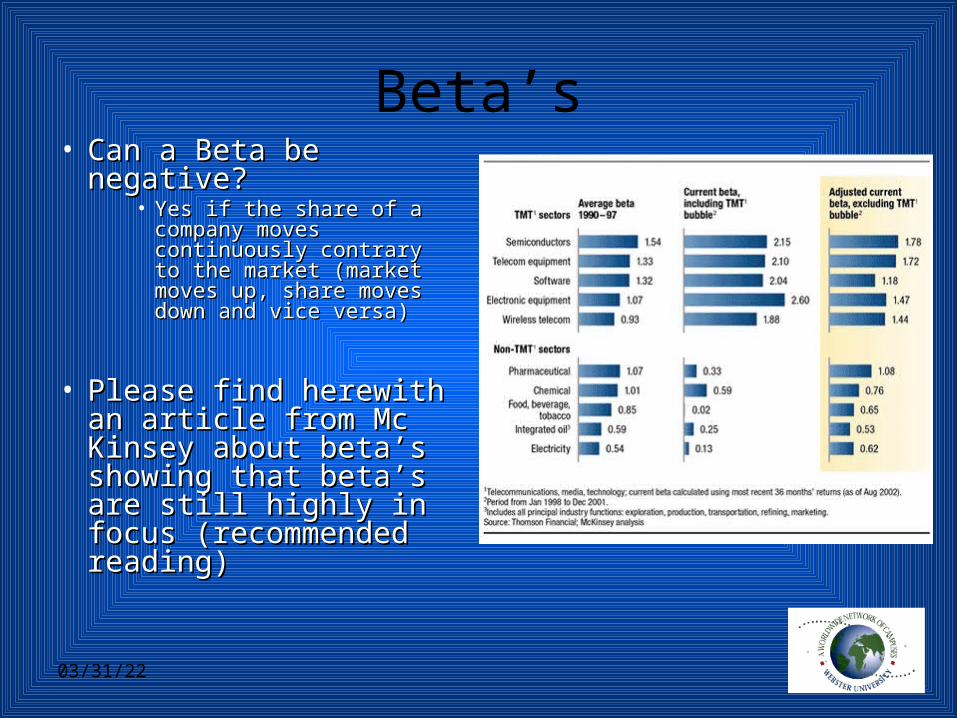
Beta’s• Can a Beta be Can a Beta be
negative?negative?• Yes if the share of a Yes if the share of a
company moves company moves continuously contrary to continuously contrary to the market (market moves the market (market moves up, share moves down up, share moves down and vice versa)and vice versa)
• Please find herewith an Please find herewith an article from Mc Kinsey article from Mc Kinsey about betaabout beta’’s showing s showing that betathat beta’’s are still s are still highly in focus highly in focus (recommended reading)(recommended reading)
04/19/23 19
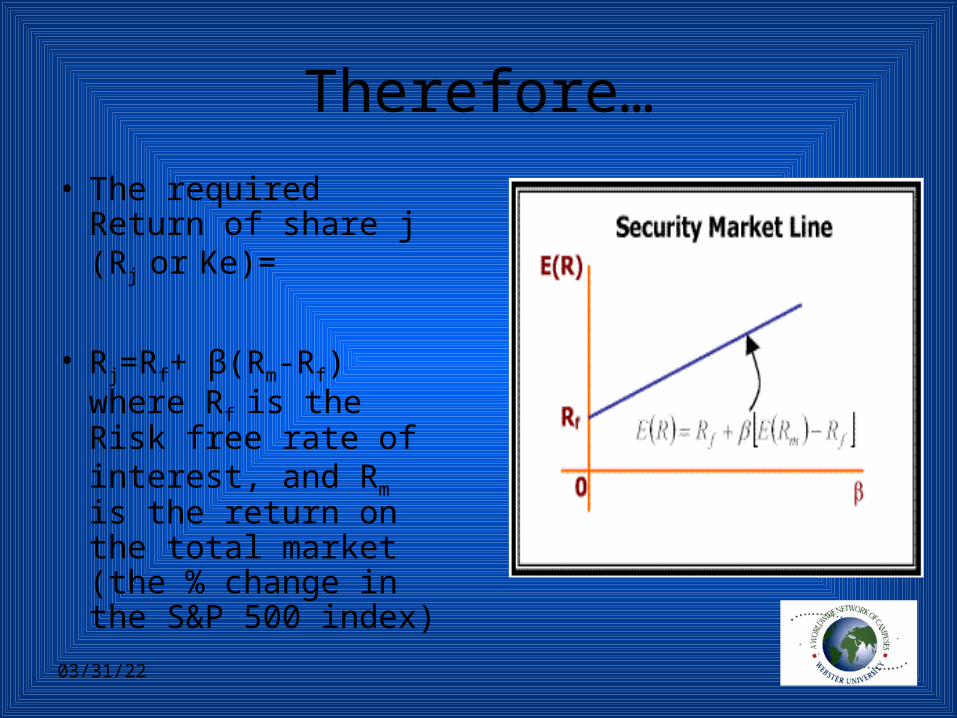
Therefore…
• The required Return of share j (Rj or Ke)=
• Rj=Rf+ β(Rm-Rf) where Rf is the Risk free rate of interest, and Rm is the return on the total market (the % change in the S&P 500 index)
04/19/23 20
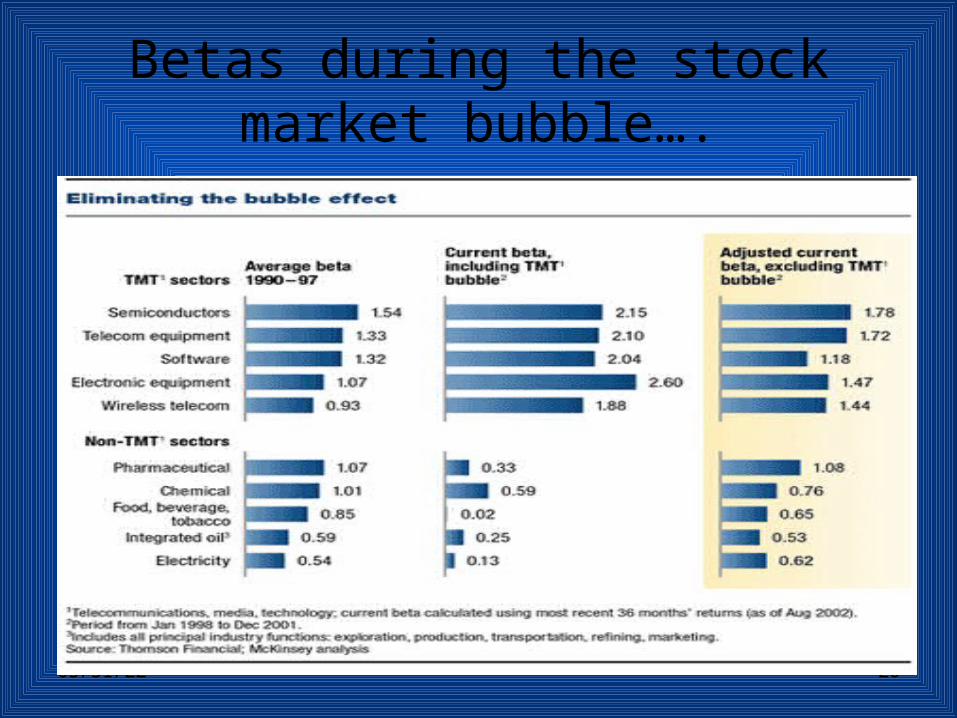
Betas during the stock market bubble….
04/19/23 21
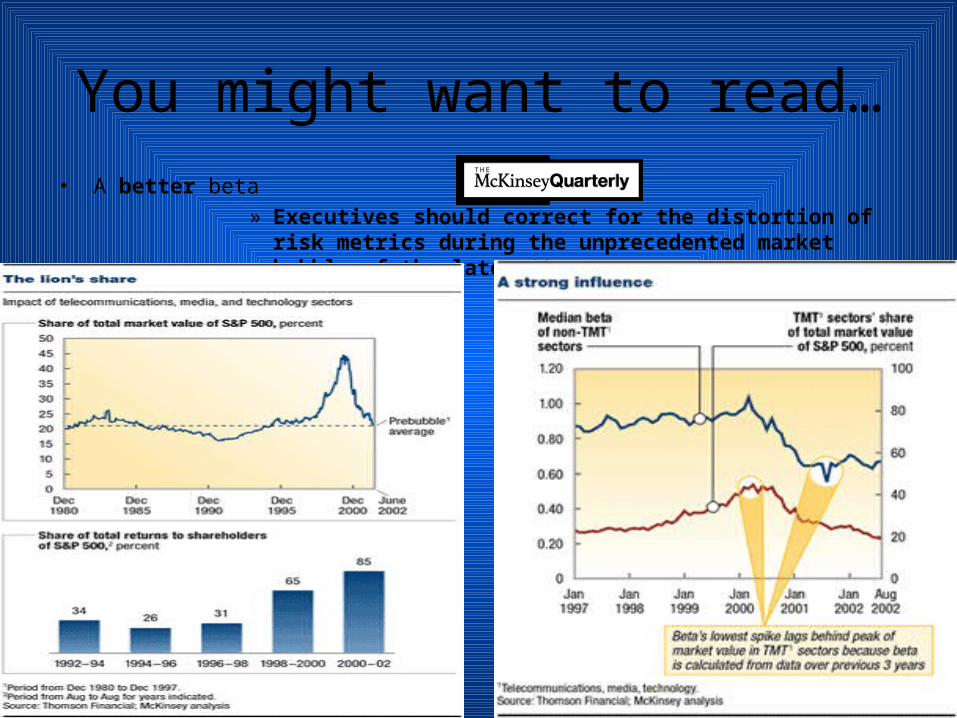
You might want to read…• A better beta
» Executives should correct for the distortion of risk metrics during the unprecedented market bubble of the late ’90s.
04/19/23 22
Homework assignment: Beta and Value
• Go to Yahoo Finance and find the Go to Yahoo Finance and find the Beta value of your company under Beta value of your company under Profiles; is your teams company a Profiles; is your teams company a high beta company?high beta company?
• Now calculate the Ke if Rf=4,3% and Now calculate the Ke if Rf=4,3% and Rm=7,6%Rm=7,6%
• The Ke you calculate now is the The Ke you calculate now is the Cost of Equity of your company Cost of Equity of your company (one ingredient of the cost of (one ingredient of the cost of capital; the so called WACC% capital; the so called WACC% Weighted Average Cost of Capital)Weighted Average Cost of Capital)
• Since higher BetaSince higher Beta’’s generate higher s generate higher cost of equity the WACC% of high cost of equity the WACC% of high Beta companies is higher resulting Beta companies is higher resulting in lower Company Values since in lower Company Values since Value=Free Cash Flow/WACC%Value=Free Cash Flow/WACC%
04/19/23 23
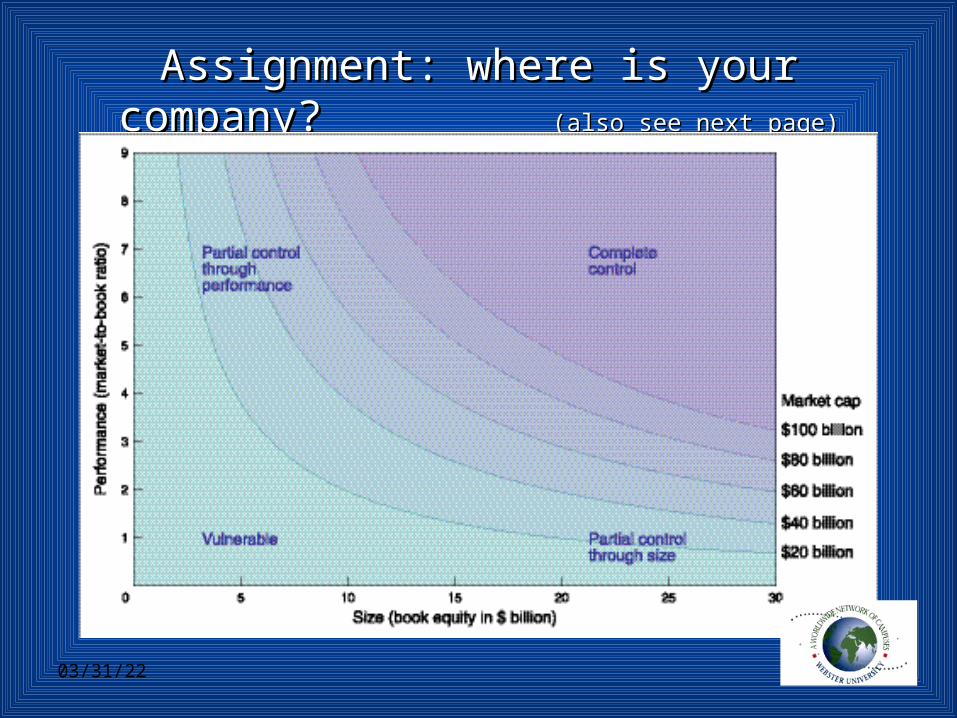
Assignment: where is your company? Assignment: where is your company? (also see next page)(also see next page)
04/19/23 24
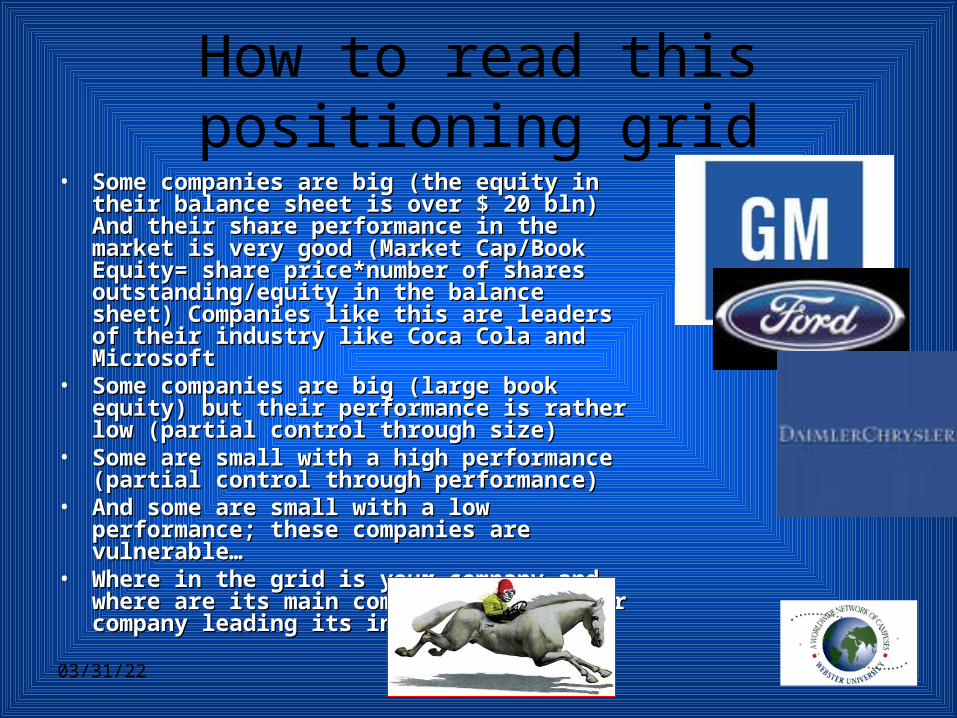
How to read this positioning grid• Some companies are big (the equity in their Some companies are big (the equity in their
balance sheet is over $ 20 bln) And their share balance sheet is over $ 20 bln) And their share performance in the market is very good (Market performance in the market is very good (Market Cap/Book Equity= share price*number of Cap/Book Equity= share price*number of shares outstanding/equity in the balance sheet) shares outstanding/equity in the balance sheet) Companies like this are leaders of their Companies like this are leaders of their industry like Coca Cola and Microsoftindustry like Coca Cola and Microsoft
• Some companies are big (large book equity) Some companies are big (large book equity) but their performance is rather low (partial but their performance is rather low (partial control through size)control through size)
• Some are small with a high performance Some are small with a high performance (partial control through performance)(partial control through performance)
• And some are small with a low performance; And some are small with a low performance; these companies are vulnerable… these companies are vulnerable…
• Where in the grid is your company and where Where in the grid is your company and where are its main competitors? Is your company are its main competitors? Is your company leading its industry?leading its industry?
04/19/23 25
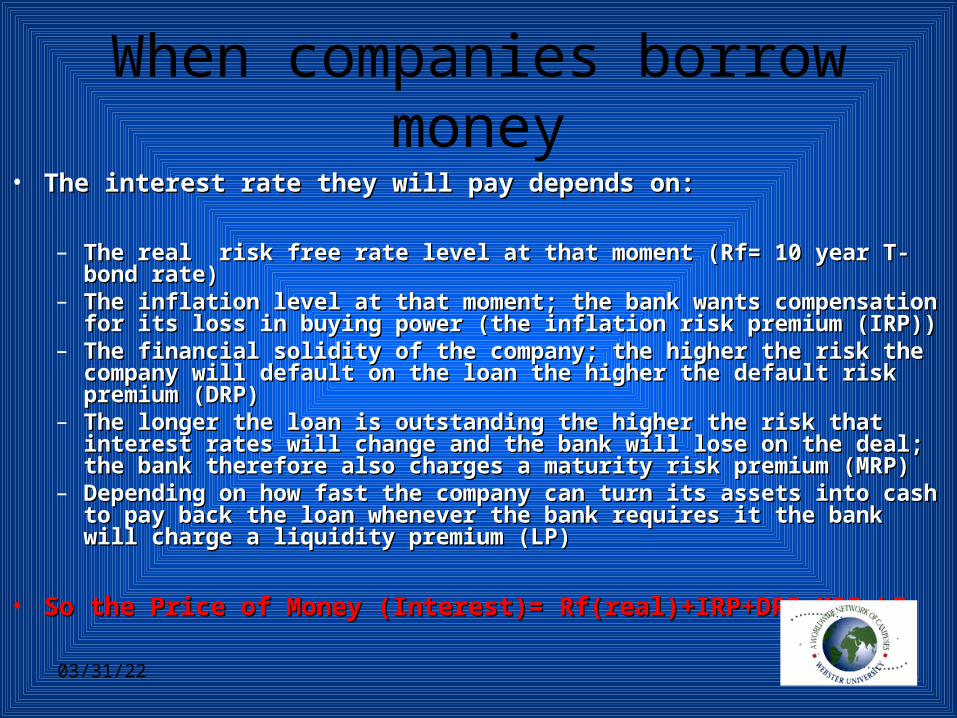
When companies borrow money• The interest rate they will pay depends on:The interest rate they will pay depends on:
– The real risk free rate level at that moment (Rf= 10 year T-bond rate)The real risk free rate level at that moment (Rf= 10 year T-bond rate)– The inflation level at that moment; the bank wants compensation for its The inflation level at that moment; the bank wants compensation for its
loss in buying power (the inflation risk premium (IRP))loss in buying power (the inflation risk premium (IRP))– The financial solidity of the company; the higher the risk the company will The financial solidity of the company; the higher the risk the company will
default on the loan the higher the default risk premium (DRP)default on the loan the higher the default risk premium (DRP)– The longer the loan is outstanding the higher the risk that interest rates will The longer the loan is outstanding the higher the risk that interest rates will
change and the bank will lose on the deal; the bank therefore also charges change and the bank will lose on the deal; the bank therefore also charges a maturity risk premium (MRP)a maturity risk premium (MRP)
– Depending on how fast the company can turn its assets into cash to pay Depending on how fast the company can turn its assets into cash to pay back the loan whenever the bank requires it the bank will charge a liquidity back the loan whenever the bank requires it the bank will charge a liquidity premium (LP)premium (LP)
• So the Price of Money (Interest)= Rf(real)+IRP+DRP+MRP+LPSo the Price of Money (Interest)= Rf(real)+IRP+DRP+MRP+LP
04/19/23 26
How to find default premiums?• We found the yield on a 10 year T-bond is We found the yield on a 10 year T-bond is
4.18% (risk free)4.18% (risk free)• Now consider the yield of a 10 year Now consider the yield of a 10 year
corporate bond with AAA rating in Yahoo corporate bond with AAA rating in Yahoo Finance (button bonds) for instance Finance (button bonds) for instance General Electric (AAA) the 1General Electric (AAA) the 1stst october 2004 october 2004 yield for that bond is 4.67%yield for that bond is 4.67%
• So the DRP on AAA rated bonds is 4.67%-So the DRP on AAA rated bonds is 4.67%-4.18%= 0.49% on 14.18%= 0.49% on 1stst october 2004 october 2004
• You can check if the DRP has stayed at You can check if the DRP has stayed at that level…that level…
• We can also find the DRP on AA rated We can also find the DRP on AA rated bonds about 0.1% above AAA rated bonds bonds about 0.1% above AAA rated bonds at 4.78% and A rated bonds at 4.87% (the at 4.78% and A rated bonds at 4.87% (the lower the rating the higher the risk and the lower the rating the higher the risk and the higher the DRP) higher the DRP)
Up rated…Up rated…
04/19/23 27
Let’s take a closer look at the premiums…
• I am sure you know what inflation is and where I am sure you know what inflation is and where you can find the rateyou can find the rate
• Note that we use the real rate of Rf (Rf excluding Note that we use the real rate of Rf (Rf excluding inflation= (1+Rf(yield))/(1+inflation %)-1; so if inflation= (1+Rf(yield))/(1+inflation %)-1; so if Rf=4.18% and the inflation in the US is 2% then Rf=4.18% and the inflation in the US is 2% then Rf(real)=(1.0418)/(1.02)-1= 2.14%Rf(real)=(1.0418)/(1.02)-1= 2.14%
• How to asses the financial solidity of a How to asses the financial solidity of a company? (default risk)company? (default risk)
04/19/23 28
Don’t worry…
• There is at least 3 famous companies There is at least 3 famous companies that follow the financial solidity of that follow the financial solidity of companies and give these companies companies and give these companies ratings from AAA (triple A is the best ratings from AAA (triple A is the best rating) to D (worst rate; i.e. no bank will rating) to D (worst rate; i.e. no bank will borrow you a penny if you are rated D)borrow you a penny if you are rated D)
• These companies are:These companies are:• Standard and PoorsStandard and Poors• MoodyMoody’’ss• FitchFitch
04/19/23 29
Visit their web sites
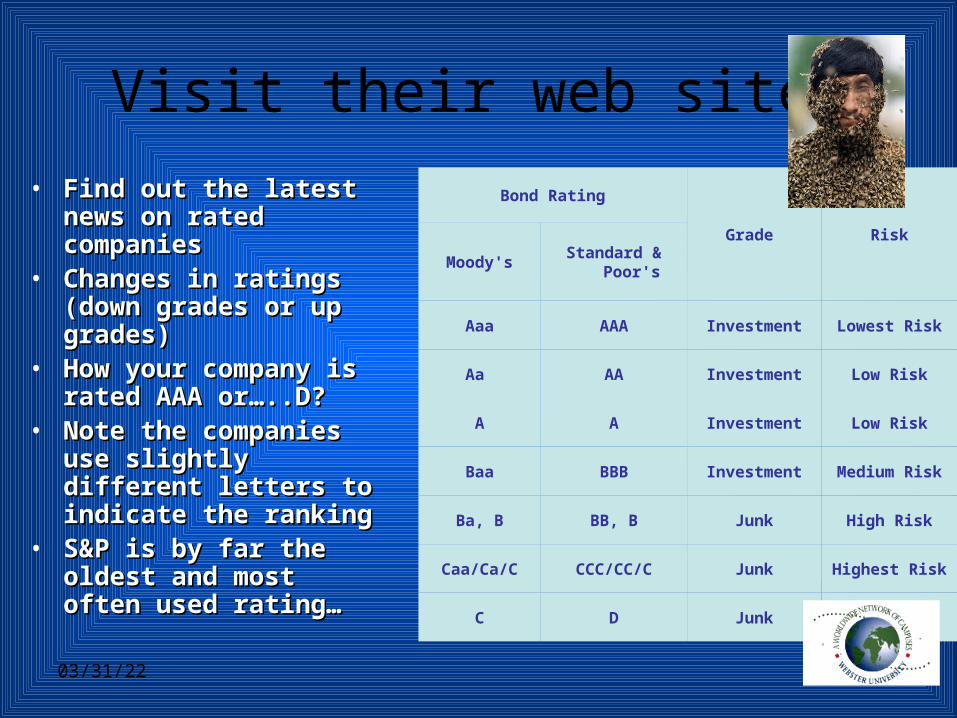
• Find out the latest news Find out the latest news on rated companieson rated companies
• Changes in ratings Changes in ratings (down grades or up (down grades or up grades)grades)
• How your company is How your company is rated AAA or…..D?rated AAA or…..D?
• Note the companies use Note the companies use slightly different letters slightly different letters to indicate the rankingto indicate the ranking
• S&P is by far the oldest S&P is by far the oldest and most often used and most often used rating…rating…
Bond Rating
Grade Risk
Moody'sStandard &
Poor's
Aaa AAA Investment Lowest Risk
Aa AA Investment Low Risk
A A Investment Low Risk
Baa BBB Investment Medium Risk
Ba, B BB, B Junk High Risk
Caa/Ca/C CCC/CC/C Junk Highest Risk
C D Junk In Default

04/19/23 30
End of session