Embed Size (px)
Citation preview

30. MAJ 201230 MAY 2012 št./No 6
15 KMETIJSTVO IN RIBIŠTVO AGRICULTURE AND FISHING št./No 2
EKONOMSKI RAČUNI ZA KMETIJSTVO, SLOVENIJA, 2010 ECONOMIC ACCOUNTS FOR AGRICULTURE, SLOVENIA, 2010
Delež bruto dodane vrednosti kmetijstva 2010 v bruto domačem proizvodu (BDP) se je v primerjavi s predhodnim letom povečal za 0,1 odstotne točke in je znašal 1,2 %.
Compared with the previous year, in 2010 the share of gross value added of agriculture in gross domestic product (GDP) increased by 0.1 of a percentage point, i.e. to 1.2%.
Za leto 2010 sta bili značilni rast cen kmetijskih proizvodov in še višja rast cen postavk vmesne potrošnje.
In 2010 the prices of agricultural products increased as well as the prices of the intermediate consumption items. The latter increased even more.
Zaposlenost v kmetijstvu se zmanjšuje. V letu 2010 je bilo v kmetijstvu zaposlenih 8 % vseh zaposlenih oseb v Sloveniji. Med temi so bili najštevilnejši samozaposleni.
Employment in agriculture is decreasing. In 2010 the share of agriculture in total Slovenian employment was 8%. The major share was represented by the self-employed.
Faktorski dohodek na zaposlenega (ta vključuje vse subvencije v zvezi s kmetijsko proizvodnjo) je v letu 2010 znašal 5.316 EUR. Nižji faktorski dohodek v kmetijstvu od Slovenije so v EU imele Poljska, Latvija, Litva, Bolgarija in Romunija.
Factor income that incorporates all subsidies related to the agricultural production amounted to EUR 5,316 per employee in 2010. Within the EU, lower factor incomes than in Slovenia were observed in Poland, Latvia, Lithuania, Bulgaria and Romania.
Vrednost deleža rastlinske pridelave se je v letu 2010 zvišala za 2 odstotni točki, na 54 %. Delež živinoreje se je znižal za 2 odstotni točki, na 44 %. Delež kmetijskih storitev je znašal, tako kot prejšnje leto, 2 %.
The share of crop production increased by 2 percentage points in 2010 and amounted to 54%. The share of animal production decreased by 2 percentage points and amounted to 44%. The share of agricultural services remained at the 2 percentage level of the previous year.
Vrednost deleža živinoreje v širšem smislu, ta obsega prirejo živine, živalske proizvode ter rastlinsko pridelavo, povezano z živinorejo (krmne rastline, žita, krompir), je v letu 2010 znašala 66 % vrednosti kmetijske proizvodnje, to je za 1 odstotno točko manj kot prejšnje leto.
The share of animal production in the wider sense that includes animals, animal products and crop production connected with animal rearing (forage plants, cereals, potato) amounted in 2010 to 66% of agricultural output value. This was a 1 percentage point decrease over the previous year.
V strukturi potrošnje 2010 je prodaja znašala 53 % vrednosti, potrošnja znotraj kmetijskih gospodarstev 22 %, lastna končna potrošnja 23 %, lastna proizvodnja osnovnih sredstev 3 %, zaloge so bile nižje za 1 %.
In the consumption structure in 2010 the sale amounted to 53%, intra unit consumption to 22%, own final consumption to 23%, and own production of fixed assets to 3% of value; stocks decreased by 1%.
Grafikon 1: Bruto dodana vrednost kmetijstva v bruto domačem proizvodu, Slovenija Chart 1: Gross value added of agriculture in gross domestic product, Slovenia
0,0
0,5
1,0
1,5
2,0
2,5
2002 2003 2004 2005 2006 2007 2008 2009 2010
%
© SURS
Vir: SURS Source: SORS

Statistične informacije, št. 6/2012 2 Rapid Reports No 6/2012
Tabela 1: Ekonomski računi za kmetijstvo, Slovenija Table 1: Economic accounts for agriculture, Slovenia
2002 2003 2004 2005 2006 2007 2008 2009 2010 Tekoče cene (mio. EUR)/Current prices (mio. EUR)
Proizvodnja v osnovnih cenah 1.012 937 1.091 1.065 1.066 1.127 1.178 1.061 1.111 Production in basic prices Vmesna potrošnja 538 559 604 585 599 697 774 667 693 Intermediate consumption Bruto dodana vrednost 474 378 487 480 467 430 403 394 419 Gross value added Faktorski dohodek 365 274 412 420 412 457 418 395 413 Factor income Delež BDV kmetijstva v BDP (%) 2,1 1,5 1,8 1,7 1,5 1,2 1,1 1,1 1,2 Share of GVA of agriculture in GDP
Stalne cene preteklega leta (mio. EUR)/Constant prices of the preceding year prices (mio. EUR)
Proizvodnja v osnovnih cenah 1.012 881 1.115 1.077 987 1.107 1.105 1.178 1.058 Production in basic prices Vmesna potrošnja 544 534 559 608 581 625 713 721 649 Intermediate consumption Bruto dodana vrednost (BDV) 468 346 556 469 405 482 392 457 410 Gross value added Faktorski dohodek 363 244 484 420 352 507 406 458 408 Factor income Stopnje rasti BDV (%) 29,7 -27,0 47,1 -3,7 -15,5 3,3 -8,7 13,2 3,8 Growth rates of GVA (%) Stopnje rasti faktorskega dohodka (%) 39,8 -33,2 76,6 2,0 -16,3 23,2 -11,2 9,5 3,2 Growth rates of factor income (%)
Na polnovredno delovno moč/Per annual work unit
Bruto dodana vrednost 4.476 3.952 5.406 5.328 5.264 5.117 4.847 4.919 5.384 Gross value added Faktorski dohodek 3.448 2.869 4.572 4.669 4.642 5.440 5.029 4.932 5.316 Factor income
Zaposlenost v polnovrednih delovnih močeh/Employment in annual work units
Zaposlenost (1000) 105.988 95.605 90.159 90.043 88.672 83.953 83.185 80.188 77.776 Employment (1000) od tega: zaposleni (1000) 6.524 7.864 7.821 8.505 7.634 6.553 6.260 7.017 8.106 of that: employees (1000) Vir: SURS Source: SORS Delež bruto dodane vrednosti kmetijstva v bruto domačem proizvoduSlovenije se je v letu 2010 v primerjavi z letom 2009 povečal za 0,1odstotne točke in je znašal 1,2 %.
Compared to 2009, in 2010 the share of gross value added of agriculturein gross domestic product of Slovenia increased by 0.1 of a percentagepoint; it amounted to 1.2%.
Bruto dodana vrednost na polnovredno delovno moč je tedaj znašala5.384 EUR ali za 9 % več kot v letu 2009; to zvišanje je bilo posledica za 6 % višje dodane vrednosti in za 3 % manjše zaposlenosti v kmetijstvu.
Gross value added per annual work unit amounted to EUR 5,384 or 9%more than in 2009 due to the 6% higher value added and a 3% decreasein agricultural employment.
FAKTORSKI DOHODEK FACTOR INCOME
Faktorski dohodek je za kmetijstvo zelo pomemben, ker predstavljarealnejšo dohodkovno kategorijo kot je dodana vrednost. Faktorskidohodek namreč vključuje vse subvencije, ki se nanašajo na kmetijskoproizvodnjo, in tudi druge subvencije na proizvodnjo, medtem ko dodana vrednost vključuje le subvencije na proizvode. V letu 2010 je faktorskidohodek znašal 413 mio. EUR, v primerjavi s predhodnim letom se jenominalno povečal za 5 %.
Factor income is of specific importance for agriculture and it presents amore real income category than gross value added. Factor incomeincorporates all subsidies concerning agricultural production as well asother subsidies on production, while gross value added includes onlysubsidies on products. In 2010 factor income amounted to EUR 413million; in comparison with the previous year it increased by 5% innominal terms.

Statistične informacije, št. 6/2012 Rapid Reports No 6/2012 3
Grafikon 2: Struktura vrednosti subvencij v kmetijstvu, Slovenija Chart 2: Structure of subsidies value in agriculture, Slovenia
© SURS0
20
40
60
80
100
%
2002 2003 2004 2005 2006 2007 2008 2009 2010
dohodek iz dejavnostiincome from the activity
subvencije na proizvodesubsidies on products
ostale subvencije na proizvodnjoother subsidies on production
Vir: SURS Source: SORS Dohodek slovenskega kmetijstva je zelo odvisen od državnih subvencij. V letu 2010 so subvencije v kmetijstvu predstavljale 60 % dohodka; druge subvencije na proizvodnjo so obsegale 57 % dohodka, subvencije na proizvode pa 3 % dohodka. Dohodek iz dejavnosti je znašal 40 % ali 5 odstotnih točk več kot v letu 2009.
Income of the Slovenian agriculture depends very much on statesubsidies. In 2010 the value of subsidies represented 60% of income;other subsidies on production represented 57% of income and subsidieson products 3% of income. Income from agricultural activity represented40% or 5 percentage points more than in 2009.
V letu 2010 sta bila deleža subvencij na proizvode in druge subvencije na proizvodnjo enaka kot leto pred tem. Subvencije na proizvode (teneposredno vplivajo na višino dodane vrednosti), so znašale 11 mio. EUR; večinski delež so predstavljale subvencije na živino, v glavnem na govedo.
In 2010 the shares of subsidies on products and of other subsidies onproduction remained the same. Subsidies on production amounted toEUR 11 million; the main part was subsidies on animals, mainly on cattle.
Druge subvencije na proizvodnjo so znašale 237 mio. EUR; v primerjavi s predhodnim letom so se znižale za 4 %. Druge subvencije na proizvodnjo ne podpirajo neposredno količinske pridelave, ampak se nanašajo na kmetijsko-okoljske ukrepe ali so podpora zaradi slabših pridelovalnih pogojev in ob naravnih nesrečah. Med druge subvencije je vključeno tudi preplačilo davka na dodano vrednost.
Other subsidies on production amounted to EUR 237 million; incomparison with the previous year they decreased by 4%. They do notdirectly support the quantity production, but refer to agro-environmentalmeasures, subsidies for agricultural production in less favoured ormountain areas and compensation for current loses. Other subsidiesinclude also the overcompensation of VAT.
ZAPOSLENOST V KMETIJSTVU EMPLOYMENT IN AGRICULTURE
Zaposlenost v kmetijstvu, merjena v polnovrednih delovnih močeh (PDM), se je v celotnem obdobju (2002–2010) zniževala. V letu 2010 je bilo v kmetijsko proizvodnjo vključenih 77.776 zaposlenih ali za 3 % manj kot v letu 2009. V kmetijski proizvodnji je bilo zaposlenih 8.106 plačanih delavcev, v primerjavi s predhodnim letom se je njihovo število povečalo za 16 %. Delež neplačane delovne sile – v to skupino spadajo samozaposleni (to so kmetje) in pomagajoči družinski člani (ti niso zaposleni na kmetijskem gospodarstvu) – se je v letu 2010 v primerjavi s predhodnim letom znižal za skoraj 5 %, na 69.670 PDM.
Employment in agriculture, measured in annual work units (AWU), hasbeen decreasing in the whole 2002-2010 period. In 2010 in agriculture77,776 employees were involved, this was a 3% decrease in comparisonwith 2009. There were 8,106 paid employees; in comparison with theprevious year their number increased by 16%. The share of unpaidemployment, i.e. self-employed and helping family members notemployed on agricultural holdings, decreased in 2010 by almost 5% incomparison with the previous year and it amounted to 69,670 AWU.

Statistične informacije, št. 6/2012 4 Rapid Reports No 6/2012
Tabela 2: Vrednost kmetijske proizvodnje, tekoče proizvajalčeve cene, Slovenija Table 2: Agricultural output at current producer prices, Slovenia
Pos-tavka Item
Šifra New Cro-nos code
Opis 2002 2003 2004 2005 2006 2007 2008 2009 2010 Description
mio. EUR
16 16000 Kmetijska proizvodnja 970 873 1.016 983 966 1.116 1.166 1.050 1.101 Agricultural output 14 14000 Proizvodnja kmetijskih proizvodov 955 858 999 964 946 1.097 1.146 1.030 1.080 Agricultural goods output 10 10000 Rastlinska pridelava 480 390 538 496 478 599 600 546 596 Crop production 01 01000 Žita 65 48 64 54 52 95 80 55 80 Cereals 02 02000 Industrijske rastline 23 19 23 26 27 30 41 25 26 Industrial crops 03 03000 Krmne rastline 152 113 183 172 140 176 174 168 186 Forage plants 04 04000 Zelenjadnice, sadike in okrasne
rastline 56 56 59 69 69 64 76 83 65 Vegetables and
horticultural products 05 05000 Krompir 20 19 20 14 23 28 24 19 22 Potato 06 06000 Sadje 75 67 77 71 79 95 102 90 100 Fruits 07 07000 Vino 88 69 111 90 88 111 104 106 116 Wine 08 08000 Oljčno olje … … … … … … … … … Olive oil 09 09000 Drugi rastlinski pridelki 0,2 0,2 0,3 0,1 0,1 0,2 0,2 0,2 0,2 Other crop products 13 13000 Živinoreja 475 467 462 468 468 499 546 484 484 Animal production 11 11000 Živina 278 281 281 286 287 300 316 294 290 Animals 11.1 11100 Govedo 112 111 109 119 118 126 127 129 127 Cattle 11.2 11200 Prašiči 96 92 93 90 97 84 86 64 62 Pigs 11.3 11300 Konji 3 3 2 2 3 3 2 3 2 Equines 11.4 11400 Ovce in koze 7 6 7 8 8 8 7 7 8 Sheep and goats 11.5 11500 Perutnina 59 68 69 65 59 77 92 89 90 Poultry 11.6 11900 Druge živali 2 2 2 2 2 1 1 1 2 Other animals 12 12000 Živalski proizvodi 197 186 181 182 181 199 230 191 194 Animal products 12.1 12100 Mleko 163 158 152 154 152 164 190 148 151 Milk 12.2 12200 Jajca 22 18 17 17 18 25 29 29 30 Eggs 12.3 12900 Drugi živalski proizvodi 11 10 12 11 12 10 10 13 13 Other animal products 15 15000 Kmetijske storitve 15 16 17 19 19 19 21 20 21 Agricultural services
Struktura (%)/Structure (%)
16 16000 Kmetijska proizvodnja 100,0 100,0 100,0 100,0 100,0 100,0 100,0 100,0 100,0 Agricultural output 14 14000 Proizvodnja kmetijskih proizvodov 98,4 98,2 98,4 98,1 98,0 98,3 98,2 98,1 98,1 Agricultural goods output 10 10000 Rastlinska pridelava 49,5 44,7 52,9 50,5 49,5 53,6 51,4 51,9 54,1 Crop production 01 01000 Žita 6,7 5,5 6,3 5,5 5,4 8,5 6,8 5,2 7,2 Cereals 02 02000 Industrijske rastline 2,3 2,1 2,3 2,6 2,8 2,7 3,5 2,4 2,4 Industrial crops 03 03000 Krmne rastline 15,6 12,9 18,0 17,5 14,5 15,8 14,9 16,0 16,9 Forage plants 04 04000 Zelenjadnice, sadike in
okrasne rastline 5,8 6,4 5,8 7,0 7,2 5,7 6,5 7,9 5,9 Vegetables and
horticultural products 05 05000 Krompir 2,1 2,2 1,9 1,4 2,4 2,5 2,0 1,8 2,0 Potato 06 06000 Sadje 7,8 7,7 7,6 7,3 8,2 8,5 8,7 8,5 9,1 Fruits 07 07000 Vino 9,1 7,9 10,9 9,1 9,1 9,9 8,9 10,1 10,5 Wine 08 08000 Oljčno olje … … … … … … … … … Olive oil 09 09000 Drugi rastlinski pridelki 0,0 0,0 0,0 0,0 0,0 0,0 0,0 0,0 0,0 Other crop products 13 13000 Živinoreja 49,0 53,5 45,4 47,6 48,5 44,7 46,8 46,1 44,0 Animal production 11 11000 Živina 28,7 32,2 27,6 29,1 29,7 26,8 27,1 28,0 26,4 Animals 11.1 11100 Govedo 11,5 12,7 10,7 12,1 12,2 11,3 10,9 12,3 11,6 Cattle 11.2 11200 Prašiči 9,9 10,5 9,1 9,2 10,1 7,5 7,4 6,1 5,6 Pigs 11.3 11300 Konji 0,3 0,4 0,2 0,2 0,3 0,2 0,2 0,3 0,2 Equines 11.4 11400 Ovce in koze 0,7 0,7 0,7 0,8 0,8 0,7 0,6 0,7 0,7 Sheep and goats 11.5 11500 Perutnina 6,1 7,8 6,8 6,7 6,1 6,9 7,9 8,4 8,2 Poultry 11.6 11900 Druge živali 0,2 0,2 0,2 0,2 0,2 0,1 0,1 0,1 0,1 Other animals 12 12000 Živalski proizvodi 20,3 21,3 17,8 18,5 18,8 17,8 19,7 18,1 17,6 Animal products 12.1 12100 Mleko 16,8 18,1 15,0 15,6 15,7 14,7 16,3 14,1 13,7 Milk 12.2 12200 Jajca 2,3 2,0 1,7 1,7 1,8 2,2 2,5 2,8 2,7 Eggs 12.3 12900 Drugi živalski proizvodi 1,2 1,2 1,2 1,1 1,3 0,9 0,9 1,3 1,2 Other animal products 15 15000 Kmetijske storitve 1,6 1,8 1,6 1,9 2,0 1,7 1,8 1,9 1,9 Agricultural services
... ni podatka not available
Vir: SURS Source: SORS

Statistične informacije, št. 6/2012 Rapid Reports No 6/2012 5
Tabela 3: Vrednost kmetijske proizvodnje, stalne proizvajalčeve cene preteklega leta, Slovenija Table 3: Agricultural output at constant producer prices of the preceding year, Slovenia
Pos-tavka Item
Šifra New Cro-nos code
Opis 2002 2003 2004 2005 2006 2007 2008 2009 2010 Description
mio. EUR
16 16000 Kmetijska proizvodnja 974 845 1.040 1.001 911 1.002 1.095 1.166 1.047 Agricultural output 14 14000 Proizvodnja kmetijskih proizvodov 960 830 1.024 983 892 985 1.075 1.146 1.027 Agricultural goods output 10 10000 Rastlinska pridelava 481 358 573 524 434 497 588 617 546 Crop production 01 01000 Žita 65 43 68 64 47 57 102 74 59 Cereals 02 02000 Industrijske rastline 19 19 22 27 26 19 28 47 27 Industrial crops 03 03000 Krmne rastline 159 107 169 204 136 157 182 174 173 Forage plants 04 04000 Zelenjadnice, sadike in
okrasne rastline 57 45 89 60 60 58 72 84 60 Vegetables and horticultural
products 05 05000 Krompir 18 13 29 16 11 30 22 22 20 Potato 06 06000 Sadje 74 59 91 64 72 80 84 101 100 Fruits 07 07000 Vino 88 72 104 89 81 95 98 115 107 Wine 08 08000 Oljčno olje ... ... ... ... ... ... ... ... ... Olive oil 09 09000 Drugi rastlinski pridelki 0 0 0 0 0 0 0 0 0 Other crop products 13 13000 Živinoreja 479 472 452 459 458 488 487 530 481 Animal production 11 11000 Živina 289 286 271 276 279 296 289 303 291 Animals 11.1 11100 Govedo 109 114 107 106 113 123 121 128 128 Cattle 11.2 11200 Prašiči 111 98 89 86 95 91 78 69 62 Pigs 11.3 11300 Konji 2 4 2 2 2 2 3 2 2 Equines 11.4 11400 Ovce in koze 7 6 8 7 7 8 7 7 8 Sheep and goats 11.5 11500 Perutnina 58 63 63 71 59 71 78 94 89 Poultry 11.6 11900 Druge živali 1 2 2 2 2 1 1 2 2 Other animals 12 12000 Živalski proizvodi 190 186 181 183 180 192 199 227 190 Animal products 12.1 12100 Mleko 161 157 154 155 150 157 161 187 148 Milk 12.2 12200 Jajca 19 18 16 16 18 22 28 29 29 Eggs 12.3 12900 Drugi živalski proizvodi 11 11 12 12 12 12 10 11 13 Other animal products 15 15000 Kmetijske storitve 14 15 16 18 19 17 20 20 20 Agricultural services
Sprememba obsega (%)/Volume changes (%)
16 16000 Kmetijska proizvodnja 13,4 -12,9 19,2 -1,5 -7,3 3,7 -1,9 0,0 -0,3 Agricultural output 14 14000 Proizvodnja kmetijskih proizvodov 13,6 -13,1 19,5 -1,6 -7,5 4,1 -2,0 0,1 -0,3 Agricultural goods output 10 10000 Rastlinska pridelava 29,6 -25,4 46,7 -2,5 -12,6 3,9 -1,8 2,8 0,1 Crop production 01 01000 Žita 21,1 -33,9 42,7 -0,6 -13,7 8,8 8,0 -6,6 7,3 Cereals 02 02000 Industrijske rastline 28,4 -18,0 17,3 16,0 -1,4 -29,1 -7,0 13,2 8,6 Industrial crops 03 03000 Krmne rastline 26,1 -29,3 49,8 11,2 -21,0 12,6 3,0 0,2 3,0 Forage plants 04 04000 Zelenjadnice, sadike in
okrasne rastline 18,9 -20,4 59,6 2,6 -12,2 -15,5 12,3 9,9 -27,5 Vegetables and horticultural
products 05 05000 Krompir 14,1 -34,6 50,6 -16,1 -20,1 27,8 -20,2 -6,2 5,1 Potato 06 06000 Sadje 32,0 -21,4 35,8 -16,8 1,5 1,2 -10,8 -0,8 11,9 Fruits 07 07000 Vino 57,5 -19,0 51,1 -20,1 -9,4 8,9 -11,9 10,9 0,8 Wine 08 08000 Oljčno olje ... ... ... ... ... ... ... ... ... Olive oil 09 09000 Drugi rastlinski pridelki -46,2 -2,3 78,5 -50,0 6,3 2,4 -7,8 1,3 -0,5 Other crop products 13 13000 Živinoreja 1,0 -0,7 -3,3 -0,6 -2,0 4,3 -2,3 -3,0 -0,7 Animal production 11 11000 Živina -2,1 2,8 -3,9 -1,7 -2,6 3,4 -3,7 -4,3 -1,0 Animals 11.1 11100 Govedo -2,5 1,8 -3,3 -2,3 -4,7 4,2 -4,1 0,8 -0,6 Cattle 11.2 11200 Prašiči 1,6 1,9 -2,9 -6,8 4,9 -6,4 -6,6 -20,0 -4,2 Pigs 11.3 11300 Konji -31,7 44,0 -36,6 30,7 6,1 -10,2 3,0 1,0 -34,3 Equines 11.4 11400 Ovce in koze 36,1 -14,0 20,7 7,6 -2,4 -1,1 -8,5 0,0 7,5 Sheep and goats 11.5 11500 Perutnina -9,0 6,3 -6,9 4,1 -9,4 19,6 0,4 2,5 0,9 Poultry 11.6 11900 Druge živali 0,0 2,4 0,0 0,0 -10,0 -12,0 -3,3 9,7 18,8 Other animals 12 12000 Živalski proizvodi 6,2 -5,6 -2,4 1,1 -1,1 5,6 -0,3 -1,1 -0,4 Animal products 12.1 12100 Mleko 7,7 -3,7 -2,9 1,8 -2,5 3,8 -1,9 -1,7 0,1 Milk 12.2 12200 Jajca -5,9 -18,6 -9,3 -2,7 5,9 23,7 12,3 -0,4 -0,9 Eggs 12.3 12900 Drugi živalski proizvodi 8,3 -8,2 16,5 -3,3 8,4 1,8 -3,7 8,4 -5,1 Other animal products 15 15000 Kmetijske storitve 0,1 0,0 3,4 8,8 0,0 -13,9 4,8 -4,1 -0,1 Agricultural services
... ni podatka not available Vir: SURS Source: SORS

Statistične informacije, št. 6/2012 6 Rapid Reports No 6/2012
PROIZVODNJA KMETIJSKE DEJAVNOSTI OUTPUT OF AGRICULTURAL INDUSTRY Proizvodnja kmetijske dejavnosti sestoji iz proizvodnje kmetijskihproizvodov, iz proizvodnje kmetijskih storitev in iz nekmetijskih dopolnilnihdejavnosti kmetijstva; nazadnje omenjene dejavnosti še niso ocenjene vokviru ekonomskih računov za kmetijstvo.
Output of agricultural industry consists of production of agriculturalproducts, production of agricultural services and non-agriculturalsecondary activities (inseparable) which have in the framework ofeconomic accounts for agriculture not yet been estimated.
Grafikon 3: Struktura vrednosti kmetijske proizvodnje, osnovne cene, Slovenija Chart 3: Structure of the agricultural output value at basic prices, Slovenia
© SURS0
20
40
60
80
100
storitveservices
živinorejaanimal output
rastlinska pridelavacrop production
%
2002 2003 2004 2005 2006 2007 2008 2009 2010
Vir: SURS Source: SORS
V letu 2010 je delež proizvodnje kmetijskih proizvodov znašal okrog 98 % vrednosti kmetijske dejavnosti, delež kmetijskih storitev pa okrog 2 % vrednosti te dejavnosti. Delež vrednosti rastlinske pridelave v strukturivrednosti kmetijske proizvodnje se je v letu 2010 povečal, delež živalskeprireje pa se je zmanjšal.
Production of agricultural products in 2010 represented about 98% ofagricultural output value, while about 2% was represented by agriculturalservices. In 2010 the share of crop production increased, while the shareof animal production decreased in production value.
Delež vrednosti rastlinske pridelave je znašal 54 % kmetijskeproizvodnje, to je za 2 odstotni točki več kot v predhodnem letu. Vstrukturi vrednosti kmetijske proizvodnje so se zvišale vrednosti deleževžit, krmnih rastlin, krompirja in vina, znižala pa se je vrednost deležazelenjadnic. Vrednost deleža živinoreje je v letu 2010 znašala 44 %kmetijske proizvodnje ali za 2 odstotni točki manj kot v predhodnem letu.Znižala sta se delež vrednosti prireje živine in tudi delež vrednostiživalskih proizvodov.
The share of crop production amounted to 54% of agricultural production;in comparison with the previous year it increased by 2 percentage points.The share of cereals, forage plants, potato and wine increased, while theshare of vegetables decreased. The share of animal productionamounted to 44% of agricultural production in 2010. This was a 2percentage points decrease in comparison with the previous year. Thedecrease concerned both the share of animal rearing as well as the shareof animal products.
RASTLINSKA PRIDELAVA CROP OUTPUT
V vrednosti rastlinske pridelave obsega največji delež vrednost krmnihrastlin. Ta je bila v letu 2010 enaka kot v predhodnem letu; znašala je 31%. Enaka kot v predhodnem letu je bila tudi vrednost deleža vina; ta je znašal 19 %. Za 3 odstotne točke višja je bila vrednost deleža žit, znašalaje 13 %. Za eno odstotno točko višji sta bili vrednost deleža krompirja(znašala je 4 %) in vrednost deleža sadja (znašala je 17 %). Za 1 odstotno točko nižja je bila vrednost deleža industrijskih rastlin; znašala je 4 %. Najbolj, za 4 odstotne točke, se je znižala vrednost deleža zelenjadnic; znašala je 11 %.
In the framework of crop production, forage plants represent in the wholeperiod the highest share. In 2010 the share remained the same as in theprevious year and amounted to 31%. The share of wine was 19%; it alsoremained at the previous year level. The share of cereals increased by 3percentage points and amounted to 13%. The share of potato increasedby one percentage point and amounted to 4%. The share of fruit alsoincreased by one percentage point and amounted to 17%. The share ofindustrial crops decreased by 1 percentage point and amounted to 4%.The share of vegetables decreased the most, by 4 percentage points, andit amounted to 11%.

Statistične informacije, št. 6/2012 Rapid Reports No 6/2012 7
ŽIVINOREJA ANIMAL OUTPUT
Vrednost prireje živine je v letu 2010 predstavljala 60-odstotni delež živinoreje. V primerjavi s predhodnim letom se je ta delež zmanjšal za 1odstotno točko. Največji delež v vrednosti prireje živine je prispevala govedoreja, in sicer 44 %. Vrednost prireje perutnine je predstavljala 31 % vrednosti prireje živine (ali za eno odstotno točko več kot v letu 2009). Vrednost deleža konj v vrednosti prireje živine je znašala 1 %, vrednost deleža drobnice pa 3 %. Zniževanje vednosti deleža prireje prašičev se je še nadaljevalo; v primerjavi s predhodnim letom se je tokrat znižala za 1 odstotno točko, znašala je 21 % vrednosti živinoreje.
In 2010 animal rearing represented 60% of animal output. In comparisonwith the previous year the share decreased by one percentage point. Themost important share (44%) belonged to cattle. Poultry represented 31%in animal rearing due to the increase by 1 percentage point comparedwith 2009. The share of horses amounted to 1% and the share of sheepand goats to 3%. The share of pigs was decreasing. In comparison withthe previous year it decreased by 1 percentage point and amounted to21% of the animal’s value.
Vrednost deleža živalskih proizvodov v vrednosti živinoreje se je v letu 2010 v primerjavi s predhodnim letom zvišala za 1 odstotno točko (znašala je 40 %). Vrednost deleža mleka (znašala je 78 %), vrednost deleža jajc (znašala je 15 %) ter vrednost deleža drugih živalskih proizvodov (znašala je 7 %) so bile enake kot prejšnje leto.
In 2010 the share of animal products increased by 1 percentage point incomparison with the previous year and amounted to 40%. The share ofmilk amounted to 78%, the share of eggs amounted to 15% and the shareof other animal products amounted to 7% of animal products value.
Živinoreja v širšem smislu (prireja mesa različnih vrst živine in tudi živalskih proizvodov skupaj s pridelavo krme, ki se pridela in porabi v kmetijstvu) predstavlja večinski delež kmetijske proizvodnje. V letu 2010 se je vrednost tega deleža, v primerjavi s predhodnim letom, znižala za 1 odstotno točko, znašala je 66 % vrednosti kmetijske proizvodnje.
Animal output in the wider sense, i.e. the rearing of different kinds ofanimals as well as animal products and production of fodder producedand consumed within the agriculture presented the main part of theagricultural production. In 2010 the share decreased by 1 percentagepoint; it was estimated at 66% of agricultural output.
KMETIJSKE STORITVE AGRICULTURAL SERVICES
Kmetijske storitve so s kmetijsko proizvodnjo tesno povezan del proizvodnje kmetijske dejavnosti in se obračunavajo kot del kmetijske proizvodnje in vmesne potrošnje. Pogoj, da se dejavnost opredeli kot kmetijska storitev, je opravljanje storitve z mehanizacijo skupaj z delovno silo. V letu 2010 je bil delež storitev v kmetijski proizvodnji enak kot prejšnje leto; znašal je 2 %.
Agricultural services are a part of agricultural activity closely connected withthe agricultural production. The condition for the defining of agriculturalservice is the performing of the service with the mechanisation together withthe labour force. In 2010 the value of agricultural services remained at theprevious year level and amounted to 2%.
GIBANJE OBSEGA KMETIJSKE PROIZVODNJE VOLUME CHANGES OF AGRICULTURAL OUTPUT
Zaradi izločitve vpliva subvencij so spremembe v obsegu kmetijstva predstavljene v proizvajalčevih cenah.
Volume changes of agriculture are measured in producer prices due tothe exclusion of the subsidies influence.

Statistične informacije, št. 6/2012 8 Rapid Reports No 6/2012
Grafikon 4: Spremembe v obsegu kmetijske proizvodnje, stalne proizvajalčeve cene predhodnega leta, Slovenija Chart 4: Volume changes of agricultural output at constant producer preceding year prices, Slovenia
-30
-20
-10
0
10
20
30
40
50
60
2002 2003 2004 2005 2006 2007 2008 2009 2010
kmetijska proizvodnjaagricultural output
rastlinska pridelavacrop output
živinorejaanimal production
kmetijske storitveagricultural services
%
© SURS
Vir: SURS Source: SORS V letu 2010 se je obseg kmetijske proizvodnje v primerjavi s predhodnimletom le malenkostno znižal (za 0,3 odstotne točke). Obseg rastlinske pridelave je ostal na ravni predhodnega leta. Precej, za 28 %, se je zmanjšal obseg pridelave vrtnin. Na vseh drugih področjih rastlinskepridelave se je obseg v primerjavi s predhodnim letom povečal.
In 2010 the volume of agricultural output decreased just a little bit (by 0.3of a percentage point) in comparison with the previous year. Cropproduction volume remained at the previous year level. A substantial,28% volume decrease was recorded in the field of vegetables productionwhile the volume of the production in all other fields increased.
Obseg živinoreje se je znižal skoraj za 1 %, predvsem zaradi manjšeprireje prašičev.
Volume of animal production decreased by 1%, mainly due to thedecrease in pig rearing.
CENE KMETIJSKIH PROIZVODOV PRICES OF AGRICULTURAL PRODUCTS
Grafikon 5: Letne spremembe proizvajalčevih cen, Slovenija Chart 5: Annual change of producer prices, Slovenia
kmetijska proizvodnjaagricultural output
rastlinska pridelavacrop output
živinorejaanimal production
kmetijske storitveagricultural services
© SURS-15
-10
-5
0
5
10
15
20
25
2002 2003 2004 2005 2006 2007 2008 2009 2010
%
Vir: SURS Source: SORS

Statistične informacije, št. 6/2012 Rapid Reports No 6/2012 9
Glavni razlog za nominalno višjo dodano vrednost in faktorski dohodek v letu 2010 v primerjavi s predhodnim letom je bilo zvišanje cen kmetijskih proizvodov. Cene pridelkov na področju rastlinske pridelave so se zvišale za 9 %.
The main reason for the nominal increase in value added and factorincome in 2010 in comparison with the previous year was the priceincrease. In the field of crop production the prices increased by 9%,differently for specific crops.
Cene proizvodov na področju živinoreje so se zvišale za 1 %. Glavni razlog za zvišanje je bila rast cen živalskih proizvodov (za 2 %). Na vseh področjih prireje živali so se cene malenkostno znižale, nekoliko se je zvišala le cena perutnine.
In animal production there was a price increase by 1% due to the 2%price decrease in animal products. The prices of different kinds of animalsslightly decreased, the price increased only for poultry.
STRUKTURA POTROŠNJE V KMETIJSTVU CONSUMPTION STRUCTURE IN AGRICULTURE
Izhodišče za ekonomske račune in tudi za prehranske bilance je uporabna proizvodnja. Podatki kmetijskih statistik s področja rastlinske pridelave prikazujejo proizvodnjo, izračunano na osnovi posejanih površin; to je skladno z izrazom bruto proizvodnja; ta izraz namrečpomeni, da so vključene tudi izgube, ki nastanejo ob spravilu oz. žetvi. Z izključitvijo izgub se opravi metodološka prilagoditev oz. se dobiuporabna proizvodnja; ta pa je osnova za obračun proizvodnje in za potrošno strukturo v ekonomskih računih za kmetijstvo.
The starting point for the economic accounts as well as for the supplybalance sheets is the usable production. Agricultural statistics data oncrop production are based mainly on the sown area, which correspondsto the category of gross production. It means that the harvest loses arenot excluded. With the exclusion of this type of loses a methodologicaladjustment is performed and the category of usable production isreceived, which is the basis for the calculation of agricultural productionand consumption structure in economic accounts for agriculture.
Grafikon 6: Shematični prikaz virov in porabe kmetijskih proizvodov Chart 6: Shematic presentatiton of resources and uses of agricultural output
Bruto proizvodnja Gross output
Izgube Losses
Uporabna proizvodnja Usable output
Začetne zaloge (ZZ)
Initial stocks (IS)
Skupaj razpoložljivi viri Total available resources
Potrošnja v enoti
Intra-unit consumption
Predelava proizvajalcev Processing
by producers
Lastna končnapotrošnja Own final
consumption
Skupaj prodaje Total sales
S1)
Končne zaloge (KS)Final stocks (FS)
KZ – ZZ2) FS – IS2)
1) Lastna proizvodnja osnovnih sredstev. Own-account produced fixed capital goods
2) Sprememba v zalogah. V prikazanem diagramu se predpostavlja, da so končne zaloge večje od začetnih. Change in stocks. In the above diagram, the final stocks are assumed to be larger than the initial stocks.
Vir: Eurostat Source: Eurostat
Statistične informacije, št. 6/2012 10 Rapid Reports No 6/2012
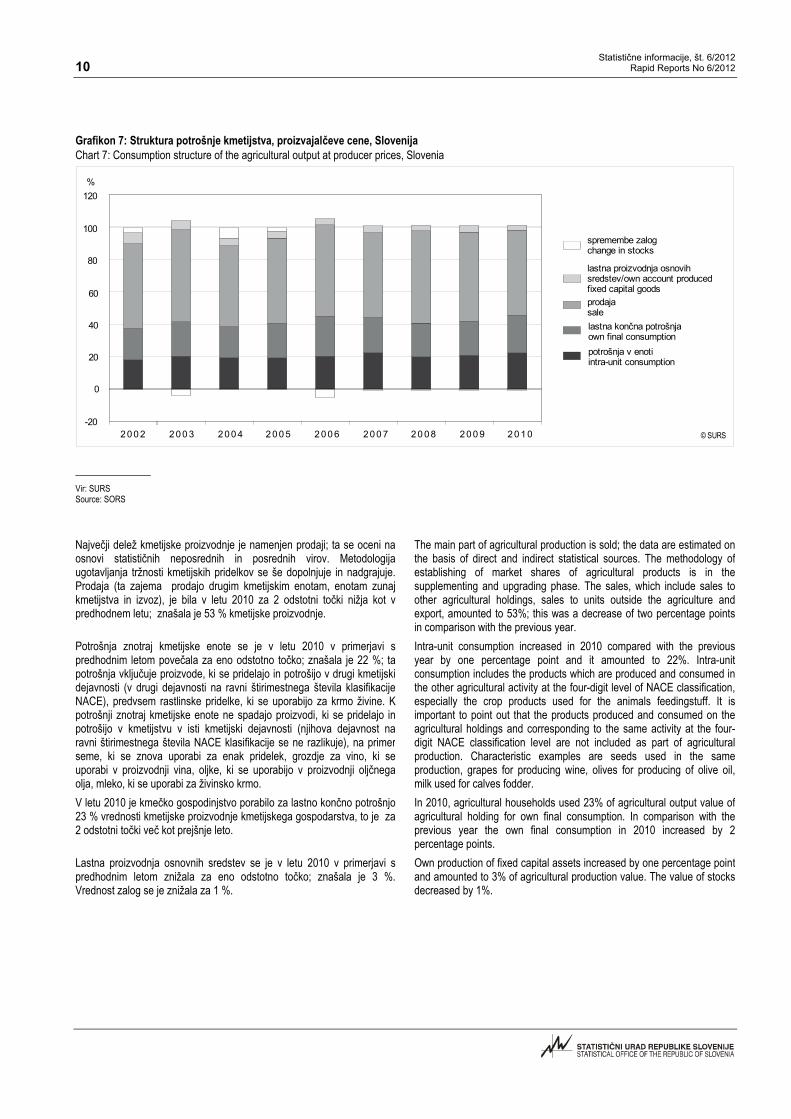
Grafikon 7: Struktura potrošnje kmetijstva, proizvajalčeve cene, Slovenija Chart 7: Consumption structure of the agricultural output at producer prices, Slovenia
© SURS-20
0
20
40
60
80
100
120%
2 0 0 2 2 0 0 3 2 0 0 4 2 0 0 5 2 0 0 6 2 0 0 7 2 0 0 8 2 0 0 9 2 0 1 0
spremembe zalogchange in stocks
lastna proizvodnja osnovih sredstev/own account produced fixed capital goodsprodajasalelastna končna potrošnjaown final consumptionpotrošnja v enotiintra-unit consumption
Vir: SURS Source: SORS Največji delež kmetijske proizvodnje je namenjen prodaji; ta se oceni na osnovi statističnih neposrednih in posrednih virov. Metodologija ugotavljanja tržnosti kmetijskih pridelkov se še dopolnjuje in nadgrajuje. Prodaja (ta zajema prodajo drugim kmetijskim enotam, enotam zunajkmetijstva in izvoz), je bila v letu 2010 za 2 odstotni točki nižja kot vpredhodnem letu; znašala je 53 % kmetijske proizvodnje.
The main part of agricultural production is sold; the data are estimated onthe basis of direct and indirect statistical sources. The methodology ofestablishing of market shares of agricultural products is in thesupplementing and upgrading phase. The sales, which include sales toother agricultural holdings, sales to units outside the agriculture andexport, amounted to 53%; this was a decrease of two percentage pointsin comparison with the previous year.
Potrošnja znotraj kmetijske enote se je v letu 2010 v primerjavi spredhodnim letom povečala za eno odstotno točko; znašala je 22 %; ta potrošnja vključuje proizvode, ki se pridelajo in potrošijo v drugi kmetijskidejavnosti (v drugi dejavnosti na ravni štirimestnega števila klasifikacije NACE), predvsem rastlinske pridelke, ki se uporabijo za krmo živine. Kpotrošnji znotraj kmetijske enote ne spadajo proizvodi, ki se pridelajo inpotrošijo v kmetijstvu v isti kmetijski dejavnosti (njihova dejavnost na ravni štirimestnega števila NACE klasifikacije se ne razlikuje), na primerseme, ki se znova uporabi za enak pridelek, grozdje za vino, ki seuporabi v proizvodnji vina, oljke, ki se uporabijo v proizvodnji oljčnegaolja, mleko, ki se uporabi za živinsko krmo.
Intra-unit consumption increased in 2010 compared with the previousyear by one percentage point and it amounted to 22%. Intra-unitconsumption includes the products which are produced and consumed inthe other agricultural activity at the four-digit level of NACE classification,especially the crop products used for the animals feedingstuff. It isimportant to point out that the products produced and consumed on theagricultural holdings and corresponding to the same activity at the four-digit NACE classification level are not included as part of agriculturalproduction. Characteristic examples are seeds used in the sameproduction, grapes for producing wine, olives for producing of olive oil,milk used for calves fodder.
V letu 2010 je kmečko gospodinjstvo porabilo za lastno končno potrošnjo23 % vrednosti kmetijske proizvodnje kmetijskega gospodarstva, to je za 2 odstotni točki več kot prejšnje leto.
In 2010, agricultural households used 23% of agricultural output value ofagricultural holding for own final consumption. In comparison with theprevious year the own final consumption in 2010 increased by 2percentage points.
Lastna proizvodnja osnovnih sredstev se je v letu 2010 v primerjavi spredhodnim letom znižala za eno odstotno točko; znašala je 3 %.Vrednost zalog se je znižala za 1 %.
Own production of fixed capital assets increased by one percentage pointand amounted to 3% of agricultural production value. The value of stocksdecreased by 1%.

Statistične informacije, št. 6/2012 Rapid Reports No 6/2012 11
VMESNA POTROŠNJA INTERMEDIATE CONSUMPTION Tabela 4: Vrednost vmesne potrošnje v kmetijstvu, tekoče cene, Slovenija Table 4: Intermediate consumption of agriculture at current prices, Slovenia
Pos-tavka Item
Šifra New Cro-nos code
Opis 2002 2003 2004 2005 2006 2007 2008 2009 2010 Description
mio. EUR
19 19000 Vmesna potrošnja 538 559 604 585 599 697 774 667 693 Intermediate consumption 19.01 19010 Seme in sadike 23 26 28 29 28 30 31 31 29 Seeds and planting stock 19.02 19011 Energija; maziva 59 62 66 80 83 87 101 89 102 Energy; lubricants 19.03 19012 Gnojila in sredstva za izboljšavo tal 35 36 35 33 34 35 69 44 49 Fertilisers and soil improvers 19.04 19020 Zaščitna sredstva in pesticidi 18 20 19 20 21 21 23 23 22 Plant protection products and
pesticides 19.05 19021 Veterinarski stroški 23 24 26 24 27 27 28 28 29 Veterinary expences 19.06 19022 Krma 299 310 343 307 315 400 420 344 360 Fedingstuffs 19.07 19023 Vzdrževanje strojev in opreme 22 23 24 25 26 31 32 34 34 Maintenance of materials 19.08 19029 Vzdrževanje zgradb 9 9 10 11 11 12 13 13 11 Maintenance of buildings 19.09 19030 Kmetijske storitve 15 16 17 19 19 19 21 20 21 Agricultural services 19.10 19031 Posredno merjene storitve finan.
posred. 2 2 2 2 2 1 1 3 3 FISIM
19.11 19032 Drugi proizvodi in storitve 33 31 34 37 33 36 36 37 34 Other goods and services
Struktura (%)/Structure (%)
19 19000 Vmesna potrošnja 100,0 100,0 100,0 100,0 100,0 100,0 100,0 100,0 100,0 Intermediate consumption 19.01 19010 Seme in sadike 4,3 4,7 4,6 5,0 4,7 4,3 4,0 4,7 4,1 Seeds and planting stock 19.02 19011 Energija; maziva 11,0 11,1 10,9 13,7 13,9 12,4 13,1 13,3 14,7 Energy; lubricants 19.03 19012 Gnojila in sredstva za izboljšavo tal 6,5 6,5 5,8 5,6 5,7 5,0 8,9 6,6 7,1 Fertilisers and soil improvers 19.04 19020 Zaščitna sredstva in pesticidi 3,3 3,5 3,2 3,4 3,4 3,0 2,9 3,5 3,2 Plant protection products and
pesticides 19.05 19021 Veterinarski stroški 4,2 4,2 4,3 4,2 4,4 3,8 3,6 4,3 4,2 Veterinary expences 19.06 19022 Krma 55,6 55,5 56,8 52,4 52,6 57,3 54,3 51,6 52,0 Fedingstuffs 19.07 19023 Vzdrževanje strojev in opreme 4,1 4,2 4,0 4,2 4,4 4,4 4,2 5,1 4,9 Maintenance of materials 19.08 19029 Vzdrževanje zgradb 1,6 1,6 1,7 1,8 1,8 1,7 1,6 2,0 1,5 Maintenance of buildings 19.09 19030 Kmetijske storitve 2,8 2,8 2,8 3,2 3,2 2,7 2,7 3,1 3,0 Agricultural services 19.10 19031 Posredno merjene storitve finan.
posred. 0,5 0,4 0,3 0,3 0,3 0,2 0,2 0,4 0,4 FISIM
19.11 19032 Drugi proizvodi in storitve 6,2 5,5 5,6 6,3 5,6 5,1 4,6 5,6 5,0 Other goods and services Vir: SURS Source: SORS

Statistične informacije, št. 6/2012 12 Rapid Reports No 6/2012
Tabela 5: Vrednost vmesne potrošnje kmetijstva, stalne cene preteklega leta, Slovenija Table 5: Intermediate consumption of agriculture at constant prices of the preceding year, Slovenia
Pos-tavka Item
Šifra New Cro-nos code
Opis 2002 2003 2004 2005 2006 2007 2008 2009 2010 Description
mio. EUR
19 19000 Vmesna potrošnja 544 534 559 608 581 625 713 721 649 Intermediate consumption 19.01 19010 Seme in sadike 21 24 27 28 29 26 30 30 29 Seeds and planting stock 19.02 19011 Energija; maziva 59 58 60 68 79 85 87 99 90 Energy; lubricants 19.03 19012 Gnojila in sredstva za izboljšavo tal 35 35 33 32 33 35 35 56 50 Fertilisers and soil improvers 19.04 19020 Zaščitna sredstva in pesticidi 17 18 19 19 20 20 21 22 22 Plant protection products and
pesticides 19.05 19021 Veterinarski stroški 22 23 25 24 24 26 26 28 28 Veterinary expences 19.06 19022 Krma 314 299 312 348 308 340 416 383 329 Fedingstuffs 19.07 19023 Vzdrževanje strojev in opreme 21 23 23 24 25 28 29 31 33 Maintenance of materials 19.08 19029 Vzdrževanje zgradb 8 9 10 10 10 12 12 13 11 Maintenance of buildings 19.09 19030 Kmetijske storitve 14 14 16 18 19 17 20 20 20 Agricultural services 19.10 19031 Posredno merjene storitve finančnega
posredništva 2 2 2 2 2 1 1 3 3 FISIM
19.11 19032 Drugi proizvodi in storitve 31 29 33 36 33 35 35 37 34 Other goods and services
Sprememba obsega (%)/Volume changes (%)
19 19000 Vmesna potrošnja 2,2 -0,6 0,0 0,8 -0,7 4,3 2,3 -6,9 -2,7 Intermediate consumption 19.01 19010 Seme in sadike -3,4 4,6 0,7 1,8 0,2 -6,9 -1,1 -3,5 -6,3 Seeds and planting stock 19.02 19011 Energija; maziva 3,9 -1,7 -3,8 2,7 -1,9 2,4 0,6 -2,2 1,2 Energy; lubricants 19.03 19012 Gnojila in sredstva za izboljšavo tal -1,9 0,1 -8,5 -8,7 -0,3 1,2 0,0 -18,7 14,1 Fertilisers and soil improvers 19.04 19020 Zaščitna sredstva in pesticidi -0,6 2,7 -0,4 0,5 0,7 -0,8 2,6 -2,3 -3,1 Plant protection products and
pesticides 19.05 19021 Veterinarski stroški 3,1 1,5 4,1 -8,6 0,0 -2,3 -1,2 -1,2 -0,4 Veterinary expences 19.06 19022 Krma 2,9 0,0 0,4 1,5 0,3 8,0 4,1 -8,8 -4,5 Fedingstuffs 19.07 19023 Vzdrževanje strojev in opreme 0,5 2,8 -1,6 -1,7 1,3 7,4 -5,1 -2,8 -4,3 Maintenance of materials 19.08 19029 Vzdrževanje zgradb -3,1 0,7 10,8 -3,0 -3,8 9,0 -0,3 0,5 -19,7 Maintenance of buildings 19.09 19030 Kmetijske storitve 0,1 -4,9 3,4 8,8 0,0 -13,9 4,8 -4,1 -0,1 Agricultural services 19.10 19031 Posredno merjene storitve finančnega
posredništva -10,9 -14,6 -11,7 -18,2 18,2 -46,0 15,6 83,2 4,6 FISIM
19.11 19032 Drugi proizvodi in storitve 5,9 -12,3 6,3 6,0 -10,6 4,8 -1,4 3,6 -8,3 Other goods and services Vir: SURS Source: SORS
Vmesna potrošnja vključuje vrednost vseh proizvodov in storitev, ki jihkmetijska gospodarstva potrošijo v proizvodnem procesu. Zajema stroškeproizvodov in storitev, ki jih kmetijska gospodarstva kupijo zunajkmetijstva, in tudi proizvode in storitve, ki so proizvedeni na kmetijskemgospodarstvu. Kot strošek kmetijskega gospodarstva se šteje tudi krma,ki se pridela in porabi na kmetijskem gospodarstvu (upoštevanještirimestne ravni klasifikacije NACE).
Intermediate consumption includes the value of all products and servicesthat agricultural holdings consume in the agricultural production process.Included are the costs of products and services that agricultural holdingsbuy outside the agricultural activity as well as the products and servicesproduced on the agricultural holdings. As a cost of agricultural holding istreated also the feedingstuff produced and consumed on the agriculturalholding (taking into account the four-digit NACE classification level).
V letu 2010 je bila vrednost vmesne potrošnje ocenjena na 693 mio.EUR, to je nominalno za 4 % več kot prejšnje leto. Zvišanje stroškovkmetijstva je bilo posledica 3-odstotnega zmanjšanja obsega in 7-odstotnega zvišanja cen.
The value of intermediate consumption in 2010 was estimated at EUR693 million, which is an increase by 4% in comparison with the previousyear. The costs increased due to the 3% volume and the 7% priceincrease.

Statistične informacije, št. 6/2012 Rapid Reports No 6/2012 13
Grafikon 8: Struktura vmesne potrošnje v kmetijstvu, Slovenija, 2010 Chart 8: Structure of intermediate consumption, Slovenia, 2010
krmafeedingstuffs
energijaenergy
drugi proizvodi in storitveother products and services
gnojilafertilisers
vzdrževanjemaintenance
veterinarske storitveveterinary services
seme in sadikeseeds and plants
zaščitna sredstva plant protection products
52,0 %
14,7 %
8, 3 %
7,1 %
6,4 %
4,2 %4,1 % 3,2 %
© SURS Vir: SURS Source: SORS Pri vmesni potrošnji ni bilo večjih strukturnih premikov, večji delež kot v letu 2009 so predstavljali le stroški energije, in sicer so se povečali za 2odstotni točki. Največji strošek je za kmetijska gospodarstva krma. Stroški krme so bili v letu 2010 v primerjavi s predhodnim letom višji za 5 %, v strukturi vmesne potrošnje so znašali 52 %. Razlog za zvišanje vrednosti je bila predvsem višja cena krme. Drugi največji strošek vstroškovni strukturi je poraba energije; v letu 2010 je ta delež znašal 15 %. Strošek za gnojila je bil v letu 2010 enak kot v predhodnem letu (7 %). Delež stroškov za seme in sadike je znašal 4 % (ali za eno odstotno točko manj kot v letu 2009). Strukturni deleži drugih stroškov (znašali so med 2 % in 5 %) se v primerjavi s predhodnim letom niso bistveno spremenili.
There were no substantial structural changes in intermediateconsumption compared with 2009. A higer share than in 2009 waspresented only by energy costs, which increased by 2 percentage points.The main part of agricultural holdings’ costs presented the costs offeedingstuff. In comparison with 2009 the feedingstuffs costs increasedby 5%, in the structure of the intermediate consumption they amounted to52%, due to the price increase. In the cost structure, the costs of theenergy are also important. In 2010 the share of the energy was 15%.Costs of the fertilisers remained at the previous year level and amountedto 7%. The share of costs for seeds was 4% due to the 1 percentagepoint decrease in comparison with 2009. Structural shares of other inputitems (they ranged from 2% to 5 %) did not change substantially.

Statistične informacije, št. 6/2012 14 Rapid Reports No 6/2012
BRUTO INVESTICIJE GROSS FIXED CAPITAL FORMATION Tabela 6: Vrednost bruto investicij v osnovna sredstva, tekoče cene, Slovenija Table 6: Gross fixed capital formation at current prices, Slovenia
Pos-tavka Item
Šifra New Cro-nos code
Opis 2002 2003 2004 2005 2006 2007 2008 2009 2010 Description
mio. EUR
32 32000 BI V OSNOVNA SREDSTVA PROIZVEDENA V KMETIJSTVU
48 35 32 28 24 31 26 31 25 GFCF IN AGRICULTURAL PRODUCTS
32.1 32100 BI v trajne nasade 17 10 13 16 14 13 13 17 10 GFCF in plantations 32.2 32200 BI v osnovno čredo 31 25 20 12 10 18 13 14 14 GFCF in animals 33 33000 BI V OSNOVNA SREDSTVA,
PROIZVEDENA IZVEN KMETIJSTVA 145 156 160 189 216 246 287 223 191 GFCF IN NON-AGRICULTURAL
PRODUCTS 33.1 33100 BI v stroje, opremo in transportno
opremo 99 107 107 131 160 182 219 159 136 GFCF in materials
33.2 33200 BI v zgradbe 45 48 52 57 56 64 67 63 55 GFCF in buildings 33.3 33900 BI druge 1 1 1 2 1 1 1 1 1 GFCF other 34 34000 BI V OSNOVNA SREDSTVA (BREZ
ODBITNEGA DDV) (32+33) 192 192 192 217 241 278 313 254 216 GFCF (EXCLUDING DEDUCTIBLE
VAT) (32+33)
Struktura (%)/Structure (%)
32 32000 BI V OSNOVNA SREDSTVA PROIZVEDENA V KMETIJSTVU
24,8 18,3 16,7 12,9 10,0 11,2 8,4 12,2 11,4 GFCF IN AGRICULTURAL PRODUCTS
32.1 32100 BI v trajne nasade 8,6 5,3 6,5 7,4 5,7 4,6 4,2 6,9 4,7 GFCF in plantations 32.2 32200 BI v osnovno credo 16,2 13,1 10,2 5,5 4,3 6,6 4,2 5,3 6,7 GFCF in animals 33 33000 BI V OSNOVNA SREDSTVA,
PROIZVEDENA IZVEN KMETIJSTVA 75,2 81,7 83,3 87,1 90,0 88,8 91,6 87,8 88,6 GFCF IN NON-AGRICULTURAL
PRODUCTS 33.1 33100 BI v stroje, opremo in transportno
opremo 51,3 56,0 55,4 60,4 66,3 65,4 70,1 62,6 62,8 GFCF in materials
33.2 33200 BI v zgradbe 23,5 24,9 27,2 26,0 23,2 23,1 21,3 24,8 25,5 GFCF in buildings 33.3 33900 BI druge 0,4 0,7 0,7 0,7 0,5 0,2 0,2 0,3 0,3 GFCF other 34 34000 BI V OSNOVNA SREDSTVA (BREZ
ODBITNEGA DDV) (32+33) 100,0 100,0 100,0 100,0 100,0 100,0 100,0 100,0 100,0 GFCF (EXCLUDING DEDUCTIBLE
VAT) (32+33)
Vir: SURS Source: SORS Tabela 7: Vrednost bruto investicij v osnovna sredstva, stalne cene preteklega leta, Slovenija Table 7: Gross fixed capital formation at constant prices of the preceding year, Slovenia
Pos-tavka Item
Šifra New Cro-nos code
Opis 2002 2003 2004 2005 2006 2007 2008 2009 2010 Description
mio. EUR
32 32000 BI V OSNOVNA SREDSTVA PROIZVEDENA V KMETIJSTVU
45 33 32 30 27 29 26 30 25 GFCF IN AGRICULTURAL PRODUCTS
32.1 32100 BI v trajne nasade 16 10 12 15 13 12 12 17 10 GFCF in plantations 32.2 32200 BI v osnovno čredo 30 23 20 16 13 17 14 13 15 GFCF in animals 33 33000 BI V OSNOVNA SREDSTVA,
PROIZVEDENA IZVEN KMETIJSTVA 137 149 151 180 212 237 276 217 190 GFCF IN NON-AGRICULTURAL
PRODUCTS 33.1 33100 BI v stroje, opremo in transportno
opremo 93 104 101 124 156 175 212 154 135 GFCF in materials
33.2 33200 BI v zgradbe 43 44 48 54 55 62 64 62 55 GFCF in buildings 33.3 33900 BI druge 1 1 1 2 1 1 1 1 1 GFCF other 34 34000 BI V OSNOVNA SREDSTVA (BREZ
ODBITNEGA DDV) (32+33) 182 182 183 210 239 266 302 247 215 GFCF (EXCLUDING DEDUCTIBLE
VAT) (32+33)
Statistične informacije, št. 6/2012 Rapid Reports No 6/2012 15
Tabela 7: Vrednost bruto investicij v osnovna sredstva, stalne cene preteklega leta, Slovenija (nadaljevanje) Table 7: Gross fixed capital formation at constant prices of the preceding year, Slovenia (continued)
Pos-tavka Item
Šifra New
Cronos
code
Opis 2002 2003 2004 2005 2006 2007 2008 2009 2010 Description
Sprememba obsega (%)/Volume changes (%)
32 32000 BI V OSNOVNA SREDSTVA PROIZVEDENA V KMETIJSTVU
30,1 -31,4 -8,3 -5,1 -5,2 19,8 -16,6 15,8 -20,5 GFCF IN AGRICULTURAL PRODUCTS
32.1 32100 BI v trajne nasade 33,1 -41,3 21,7 16,6 -17,4 -10,3 -3,7 31,3 -42,3 GFCF in plantations 32.2 32200 BI v osnovno čredo 28,5 -26,1 -20,4 -19,0 11,1 59,5 -25,6 0,6 7,5 GFCF in animals 33 33000 BI V OSNOVNA SREDSTVA,
PROIZVEDENA IZVEN KMETIJSTVA 6,2 2,8 -3,6 12,3 12,1 9,6 12,0 -24,4 -14,7 GFCF IN NON-AGRICULTURAL
PRODUCTS 33.1 33100 BI v stroje, opremo in transportno
opremo 9,0 5,3 -5,6 16,6 18,8 9,4 16,7 -29,6 -15,2 GFCF in materials
33.2 33200 BI v zgradbe 0,5 -3,7 1,0 3,6 -2,6 11,3 -1,0 -7,9 -13,4 GFCF in buildings 33.3 33900 BI druge 12,5 58,9 -2,2 11,1 -21,8 -47,4 5,2 7,0 0,0 GFCF other 34 34000 BI V OSNOVNA SREDSTVA (BREZ
ODBITNEGA DDV) (32+33) 11,3 -5,7 -4,4 9,4 9,9 10,6 8,8 -21,1 -15,4 GFCF (EXCLUDING DEDUCTIBLE
VAT) (32+33)
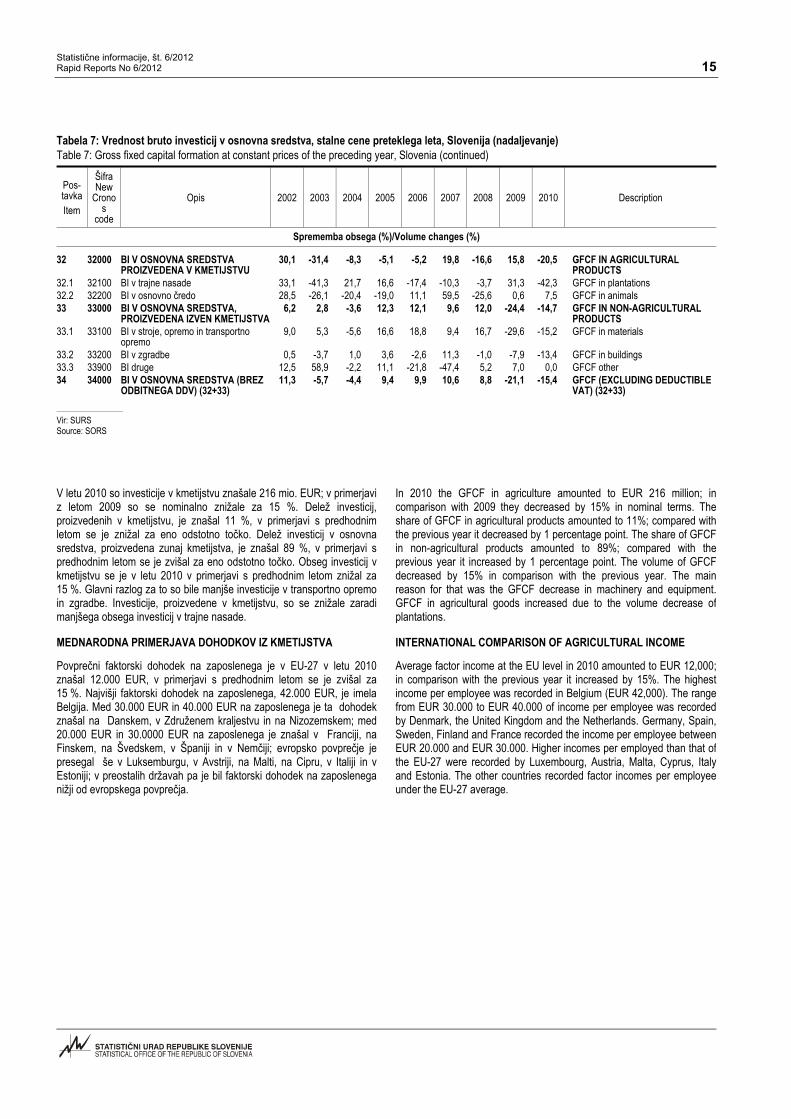
Vir: SURS Source: SORS V letu 2010 so investicije v kmetijstvu znašale 216 mio. EUR; v primerjavi z letom 2009 so se nominalno znižale za 15 %. Delež investicij,proizvedenih v kmetijstvu, je znašal 11 %, v primerjavi s predhodnim letom se je znižal za eno odstotno točko. Delež investicij v osnovna sredstva, proizvedena zunaj kmetijstva, je znašal 89 %, v primerjavi s predhodnim letom se je zvišal za eno odstotno točko. Obseg investicij v kmetijstvu se je v letu 2010 v primerjavi s predhodnim letom znižal za 15 %. Glavni razlog za to so bile manjše investicije v transportno opremo in zgradbe. Investicije, proizvedene v kmetijstvu, so se znižale zaradimanjšega obsega investicij v trajne nasade.
In 2010 the GFCF in agriculture amounted to EUR 216 million; incomparison with 2009 they decreased by 15% in nominal terms. Theshare of GFCF in agricultural products amounted to 11%; compared withthe previous year it decreased by 1 percentage point. The share of GFCFin non-agricultural products amounted to 89%; compared with theprevious year it increased by 1 percentage point. The volume of GFCFdecreased by 15% in comparison with the previous year. The mainreason for that was the GFCF decrease in machinery and equipment.GFCF in agricultural goods increased due to the volume decrease ofplantations.
MEDNARODNA PRIMERJAVA DOHODKOV IZ KMETIJSTVA INTERNATIONAL COMPARISON OF AGRICULTURAL INCOME
Povprečni faktorski dohodek na zaposlenega je v EU-27 v letu 2010 znašal 12.000 EUR, v primerjavi s predhodnim letom se je zvišal za 15 %. Najvišji faktorski dohodek na zaposlenega, 42.000 EUR, je imela Belgija. Med 30.000 EUR in 40.000 EUR na zaposlenega je ta dohodek znašal na Danskem, v Združenem kraljestvu in na Nizozemskem; med 20.000 EUR in 30.0000 EUR na zaposlenega je znašal v Franciji, na Finskem, na Švedskem, v Španiji in v Nemčiji; evropsko povprečje je presegal še v Luksemburgu, v Avstriji, na Malti, na Cipru, v Italiji in v Estoniji; v preostalih državah pa je bil faktorski dohodek na zaposlenega nižji od evropskega povprečja.
Average factor income at the EU level in 2010 amounted to EUR 12,000;in comparison with the previous year it increased by 15%. The highestincome per employee was recorded in Belgium (EUR 42,000). The rangefrom EUR 30.000 to EUR 40.000 of income per employee was recordedby Denmark, the United Kingdom and the Netherlands. Germany, Spain,Sweden, Finland and France recorded the income per employee betweenEUR 20.000 and EUR 30.000. Higher incomes per employed than that ofthe EU-27 were recorded by Luxembourg, Austria, Malta, Cyprus, Italyand Estonia. The other countries recorded factor incomes per employeeunder the EU-27 average.

Statistične informacije, št. 6/2012 16 Rapid Reports No 6/2012
Grafikon 9: Faktorski dohodek na polnovredno delovno moč, države članice EU-27, 2010 Chart 9: Factor income per annual work unit, EU-27 Member States, 2010
0 5.000 10.000 15.000 20.000 25.000 30.000 35.000 40.000 45.000EUR
BEDKUKNLFRFISEESDELUATIE
MTCZCYIT
EEEU-27
GRSKPTHUSIPLLVLT
BGRO
© SURS
Vir: Eurostat Source: Eurostat METODOLOŠKA POJASNILA METHODOLOGICAL EXPLANATIONS
Viri in metode zbiranja podatkov Sources and methods of data collection
Ekonomski računi za kmetijstvo so kompleksen informacijski sistem,izdelan za koledarsko leto. Podatki kmetijskih računov – proizvodnja, dodana vrednost, faktorski dohodek, bruto investicije, zaposlenost – so osnova za izračun dohodkovnih kazalnikov kmetijstva in podatkovni virza modeliranje. Kmetijski računi omogočajo mednarodno primerjavo terprimerjavo z drugimi dejavnostmi v nacionalnem gospodarstvu. Vekonomskih računih za kmetijstvo so zajete vse kmetijske dejavnosti vskladu s konceptom proizvodnje po metodologiji ekonomskih računov zakmetijstvo iz leta 1997 (ERK 97 Rev.1.1), ki temelji na Evropskemsistemu računov iz leta 1995 (ESR 95).
Economic accounts for agriculture are a complex information system,prepared for the calendar year. Data on economic accounts - production,value added, factor income, gross fixed capital formation, employment -are the basis for the calculation of income indicators for agriculture andare the data source for modelling. Agricultural accounts enableinternational comparability as well as comparability with other activitiesinside of national economy. Economic accounts for agriculture cover allagricultural activities following the 1997 methodology on the economicaccounts for agriculture (EAA 97 Rev.1.1) based on the 1995 EuropeanSystem of Accounts (ESA 1995).
Glavni viri podatkov za ekonomske račune za kmetijstvo so statističnaraziskovanja kmetijskih statistik, statistika industrije, zunanjetrgovinske
The main data sources for economic accounts for agriculture are statistical surveys of agricultural statistics, industry statistics, external

Statistične informacije, št. 6/2012 Rapid Reports No 6/2012 17
statistike, zaključni računi družb in organizacij, davčne evidence, podatki Ministrstva za finance, Kmetijskega inštituta Slovenije, Ministrstva za kmetijstvo, gozdarstvo in prehrano ter drugi viri.
trade statistics, final accouts of companies and organisations, tax records, data from the Ministry of Finance, the Agricultural Institure of Slovenia, the Ministry of Agriculture, Forestry and Food, and other sources.
Definicije in pojasnila Definitions and explanations
Kmetijska proizvodnja je enaka vrednosti rastlinske pridelave, prireje živali in živalskih proizvodov, kmetijskih storitev in vrednosti neločljivih dopolnilnih dejavnosti kmetijstva. Obračunava se za posamezno koledarsko leto, vrednotena je v osnovnih cenah. V osnovnih cenah so iz vrednosti proizvodnje odšteti vsi davki na proizvode in storitve ter prištete vse subvencije na proizvode in storitve. Kmetijsko proizvodnjo sestavljajo proizvodnja za trg (odkup, tržnica), za lastno končno porabo, intrabranžna poraba ter lastna proizvodnja osnovnih sredstev.
Agricultural production equals the value of crop output, animal outputand the output of animal products, agricultural services output and thevalue of inseparable secondary agricultural activities. It is calculated foran individual calendar year and is valued at basic prices, which meansthat all taxes on products and services are excluded and all subsidies onproducts and services are included. Agricultural production is composedof market production (purchase, market place), own final consumption,inter-branch consumption and own production of fixed assets.
Vmesna potrošnja je vrednotena v kupčevih cenah. Predstavlja vrednost vseh proizvodov in storitev, ki jih kmetje nabavijo in porabijo v procesu kmetijske pridelave. V vmesno porabo so vključeni vsi proizvodi z življenjsko dobo do enega leta ter proizvodi, katerih vrednost ne presega 500 EUR.
Intermediate consumption is valued at purchase prices. It presents thevalue of all products and services that farmers purchase and use in theprocess of agricultural production. Intermediate consumption covers allproducts with the life span of one year and products the value of whichdoes not exceed EUR 500.
Bruto dodana vrednost v osnovnih cenah je enaka kmetijski proizvodnji v osnovnih cenah, zmanjšani za vmesno potrošnjo v kupčevih cenah. Bruto dodana vrednost je tudi enaka vsoti potrošnje stalnega kapitala, sredstev za zaposlene, drugih davkov na proizvodnjo, bruto poslovnegapresežka oz. bruto raznovrstnega dohodka; druge subvencije na proizvodnjo so odštete.
Gross value added at basic prices equals agricultural production at basicprices less intermediate consumption at purchase prices. Gross valueadded also equals the sum of fixed capital consumption, compensation ofemployees, other taxes on production and gross operating surplus/grossmixed income, while other subsidies on production are subtracted.
Neto dodana vrednost je enaka kmetijski proizvodnji v osnovnih cenah, zmanjšani za vmesno porabo v kupčevih cenah in porabo stalnega kapitala. Neto dodana vrednost je tudi enaka vsoti sredstev za zaposlene, drugih davkov na proizvodnjo, neto poslovnega presežka oz. neto raznovrstnega dohodka; ostale subvencije na proizvodnjo so odštete.
Net value added at basic prices equals agricultural production at basicprices less intermediate consumption at purchase prices less fixed capitalconsumption. Net value added also equals the sum of compensation ofemployees, other taxes on production and net operating surplus/netmixed income, while other subsidies on production are subtracted.
Faktorski dohodek je enak neto dodani vrednosti, ki so ji odšteti drugi davki na proizvodnjo in prištete druge subvencije na proizvodnjo. Faktorski dohodek je tudi enak vsoti neto poslovnega presežka ter drugihsubvencij na proizvodnjo.
Factor income equals net value added less other taxes on productionplus other subsidies on production. Factor income also equals the sum ofnet operating surplus and other subsidies on production.
Neto poslovni presežek je rezidualna kategorija, ki obsega faktorski dohodek gospodarskih družb, zmanjšan za sredstva za zaposlene.
Net operating surplus is the residual category that equals factor incomeof companies less compensation of employees.
Neto raznovrstni dohodek je rezidualna kategorija nekorporativnih podjetij in samozaposlenih oseb.
Net mixed income is the residual category on unincorporated enterprisesand self-employed persons.
Neto podjetniški dohodek je enak neto poslovnemu presežku oz. neto raznovrstnemu dohodku (zmanjšanemu za plačane rente in obresti), povečanemu za dobljene obresti, ki se nanašajo izključno na kmetijskodejavnost.
Net entrepreneurial income equals net operating surplus/net mixedincome less paid rents and interest plus received interest that refersexclusively to agricultural production.
Zaposlenost v kmetijstvu je zaradi upoštevanja občasnega (part-time) in sezonskega dela merjena v polnovrednih delovnih močeh – PDM. Ena PDM je ekvivalent za eno osebo, ki je polno zaposlena v enoti kmetijske dejavnosti eno leto (1.800 ur). Celotna delovna sila v kmetijstvu zajema plačano in neplačano delovno silo.
Agricultural labour input is, in order to take into account part-time andseasonal work, measured in annual work units (AWU). One AWU equalsone person in full-time employment in agriculture in one year (1,800hours). Total labour force in agriculture covers salaried and non-salariedlabour force.

Statistične informacije, št. 6/2012 18 Rapid Reports No 6/2012
OBJAVLJANJE REZULTATOV PUBLISHING
Letno: Annually:
Ekonomski računi za kmetijstvo. Prva objava. Economic accounts for agriculture. First Release.
Ekonomski računi za kmetijstvo. Statistične informacije. Economic accounts for agriculture. Rapid Reports.
SI-STAT podatkovni portal – http://www.stat.si SI-STAT data portal – http://www.stat.si/eng/
Statistični letopis Republike Slovenije. Statistical Yearbook of the Republic of Slovenia.
Slovenija v številkah. Slovenia in Figures. STATISTIČNI ZNAMENJI STATISTICAL SIGNS … ni podatka
… not available
, decimalna vejica , decimal point KRATICE IN MERSKA ENOTA ABBREVIATIONS AND MEASUREMENT UNIT BI bruto investicije GFCF gross fixed capital formation BDP bruto domači proizvod GDP gross domestic product BDV bruto dodana vrednost GVA gross value added DDV davek na dodano vrednost VAT value added tax EUR evro EUR Euro KZ končne zaloge FS final stocks MKGP Ministrstvo za kmetijstvo, gozdarstvo in prehrano MAFF Ministry of Agriculture, Forestry and Food PDM polnovredne delovne moči AWU annual work units FISIM financial intermediation services indirectly measured ZZ začetne zaloge IS initial stocks mio. milijon mio. million SEZNAM DRŽAV: IMENA IN KRATICE LIST OF COUNTRIES: NAMES AND ABBREVIATIONS
Ime države Kratica Country Abbreviation EU-27 27 držav članic EU EU-27 27 EU Member States AT Avstrija AT Austria BE Belgija BE Belgium BG Bolgarija BG Bulgaria CZ Češka republika CZ Czech Republic CY Ciper CY Cyprus DE Nemčija DE Germany DK Danska DK Denmark EE Estonija EE Estonia ES Španija ES Spain FI Finska FI Finland FR Francija FR France GR Grčija GR Greece HU Madžarska HU Hungary IE Irska IE Ireland IT Italija IT Italy LT Litva LT Lithuania

Statistične informacije, št. 6/2012 Rapid Reports No 6/2012 19
SEZNAM DRŽAV: IMENA IN KRATICE (nadaljevanje) LIST OF COUNTRIES: NAMES AND ABBREVIATIONS (continued)
Ime države Kratica Country Abbreviation LU Luksemburg LU Luxembourg LV Latvija LV Latvia MT Malta MT Malta NL Nizozemska NL Netherlands PL Poljska PL Poland PT Portugalska PT Portugal RO Romunija RO Romania SE Švedska SE Sweden SI Slovenija SI Slovenia SK Slovaška SK Slovakia UK Združeno kraljestvo UK United Kingdom Avtorica: Irena Žaucer Author Irena Žaucer Publikacija je na voljo na spletnem naslovu www.stat.si/publikacije/pub_statinf1.asp?področje=15 Datum objave na spletu: 30. 05. 2012 Informacije daje Informacijsko središče tel.: (01) 241 64 04 elektronska pošta [email protected]
Access to the publication at www.stat.si/eng/pub.asp Web release date: 30. 05. 2012 Information: Information Centre phone + 386 1 241 64 04 e-mail: [email protected]
Izdal in založil Statistični urad Republike Slovenije, Ljubljana, Litostrojska cesta 54 – © SURS – Uporaba in objava podatkov dovoljeni le z navedbo vira
Edited and published by the Statistical Office of the Republic of Slovenia, Ljubljana, Litostrojska cesta 54 – © SURS – Use and publication of data is allowed provided the source is acknowledged

Statistične informacije, št. 6/2012 20 Rapid Reports No 6/2012
KAKO DO STATISTIČNIH PODATKOV IN INFORMACIJ? HOW TO OBTAIN STATISTICAL DATA
AND INFORMATION?
na spletnih straneh Statističnega urada on Statistical Office's web pages www.stat.si www.stat.si
po pošti, telefonu, telefaksu ali elektronsko via mail, phone, fax and e-mail naslov: Statistični urad Republike Slovenije address: Statistical Office of the Republic of Slovenia Litostrojska cesta 54, 1000 Ljubljana, Slovenija Litostrojska cesta 54, 1000 Ljubljana, Slovenia telefon: (01) 241 64 04 phone: +386 1 241 64 04 faks: (01) 241 53 44 fax: +386 1 241 53 44 telefonski odzivnik: (01) 475 65 55 answering machine: +386 1 475 65 55 e-naslov: [email protected] e-mail: [email protected]
z naročilom statističnih publikacij by ordering statistical publications naslov: Statistični urad Republike Slovenije address: Statistical Office of the Republic of Slovenia Litostrojska cesta 54, 1000 Ljubljana, Slovenija Litostrojska cesta 54, 1000 Ljubljana, Slovenia telefon: (01) 241 52 85 phone: +386 1 241 52 85 faks: (01) 241 53 44 fax: +386 1 241 53 44 e-naslov: [email protected] e-mail: [email protected]
z obiskom v Informacijskem središču by visiting the Information Centre poslovni čas: od ponedeljka do četrtka od 9.00 do 15.30 office hours: Monday to Thursday from 9.00 to 15.30 petek od 9.00 do 14.30 Friday from 9.00 to 14.30