Embed Size (px)
Citation preview
92 CHAPTER 1 ■ Fundamentals
1.9 THE COORDINATE PLANE; GRAPHS OF EQUATIONS; CIRCLES■ The Coordinate Plane ■ The Distance and Midpoint Formulas ■ Graphs of Equations in Two Variables ■ Intercepts ■ Circles ■ Symmetry
The coordinate plane is the link between algebra and geometry. In the coordinate plane we can draw graphs of algebraic equations. The graphs, in turn, allow us to “see” the relationship between the variables in the equation. In this section we study the coordinate plane.
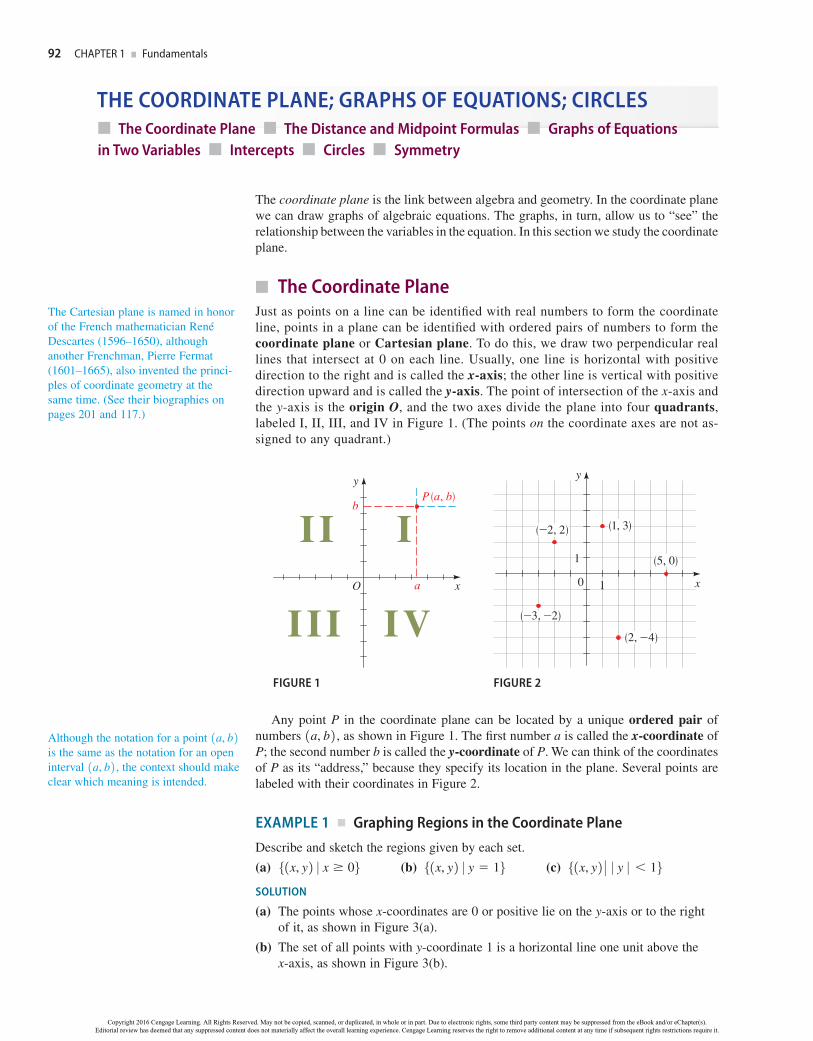
■ The Coordinate PlaneJust as points on a line can be identified with real numbers to form the coordinate line, points in a plane can be identified with ordered pairs of numbers to form the coordinate plane or Cartesian plane. To do this, we draw two perpendicular real lines that intersect at 0 on each line. Usually, one line is horizontal with positive direction to the right and is called the x-axis; the other line is vertical with positive direction upward and is called the y-axis. The point of intersection of the x-axis and the y-axis is the origin O, and the two axes divide the plane into four quadrants, labeled I, II, III, and IV in Figure 1. (The points on the coordinate axes are not as-signed to any quadrant.)
y
x
P (a, b)
O
b
a
II
III
I
IVFIGURE 1
1
1
y
x0)
)(_2, 2)
(5, 0)
(1, 3)
(2, _4)(_3, _2)
FIGURE 2
Any point P in the coordinate plane can be located by a unique ordered pair of numbers 1a, b 2 , as shown in Figure 1. The first number a is called the x-coordinate of P; the second number b is called the y-coordinate of P. We can think of the coordinates of P as its “address,” because they specify its location in the plane. Several points are labeled with their coordinates in Figure 2.
EXAMPLE 1 ■ Graphing Regions in the Coordinate PlaneDescribe and sketch the regions given by each set.
(a) 5 1x, y 2 0 x 06 (b) 5 1x, y 2 0 y 16 (c) 5 1x, y 2 @ 0 y 0 16SOLUTION
(a) The points whose x-coordinates are 0 or positive lie on the y-axis or to the right of it, as shown in Figure 3(a).
(b) The set of all points with y-coordinate 1 is a horizontal line one unit above the x-axis, as shown in Figure 3(b).
The Cartesian plane is named in honor of the French mathematician René Descartes (1596–1650), although another Frenchman, Pierre Fermat (1601–1665), also invented the princi-ples of coordinate geometry at the same time. (See their biographies on pages 201 and 117.)
Although the notation for a point 1a, b 2is the same as the notation for an open interval 1a, b 2 , the context should make clear which meaning is intended.
Copyright 2016 Cengage Learning. All Rights Reserved. May not be copied, scanned, or duplicated, in whole or in part. Due to electronic rights, some third party content may be suppressed from the eBook and/or eChapter(s).Editorial review has deemed that any suppressed content does not materially affect the overall learning experience. Cengage Learning reserves the right to remove additional content at any time if subsequent rights restrictions require it.
SECTION 1.9 ■ The Coordinate Plane; Graphs of Equations; Circles 93
(c) Recall from Section 1.8 that0 y 0 1 if and only if 1 y 1
So the given region consists of those points in the plane whose y-coordinates lie between 1 and 1. Thus the region consists of all points that lie between (but not on) the horizontal lines y 1 and y 1. These lines are shown as broken lines in Figure 3(c) to indicate that the points on these lines are not in the set.
y
x0
(a) x!0
y
x0
(b) y=1
y
x0
y=1
y=_1
(c) | y |<1FIGURE 3
Now Try Exercises 15 and 17 ■
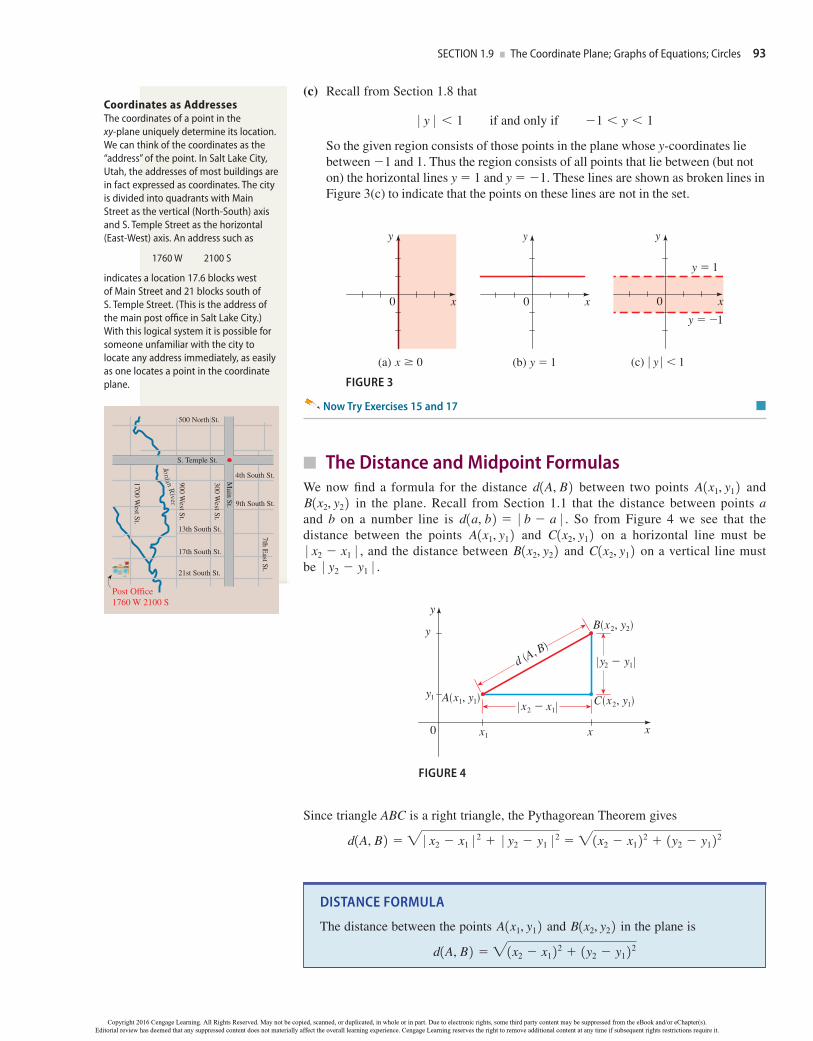
■ The Distance and Midpoint FormulasWe now find a formula for the distance d1A, B 2 between two points A1x1, y1 2 and B1x2, y2 2 in the plane. Recall from Section 1.1 that the distance between points a and b on a number line is d1a, b 2 0 b a 0 . So from Figure 4 we see that the distance between the points A1x1, y1 2 and C1x2, y1 2 on a horizontal line must be 0 x2 x1 0 , and the distance between B1x2, y2 2 and C1x2, y1 2 on a vertical line must be 0 y2 y1 0 .
| y¤-y⁄ |
| x¤-x⁄ |A(x⁄, y⁄)
B(x¤, y¤)
d (A, B)
C(x¤, y⁄)
y
x0 x⁄ x
y⁄
y
FIGURE 4
Since triangle ABC is a right triangle, the Pythagorean Theorem gives
d1A, B 2 " 0 x2 x1 0 2 0 y2 y1 0 2 "1x2 x1 2 2 1y2 y1 2 2DISTANCE FORMULA
The distance between the points A1x1, y1 2 and B1x2, y2 2 in the plane is
d1A, B 2 "1x2 x1 2 2 1y2 y1 2 2
Coordinates as AddressesThe coordinates of a point in the xy-plane uniquely determine its location. We can think of the coordinates as the “address” of the point. In Salt Lake City, Utah, the addresses of most buildings are in fact expressed as coordinates. The city is divided into quadrants with Main Street as the vertical (North-South) axis and S. Temple Street as the horizontal (East-West) axis. An address such as
1760 W 2100 S
indicates a location 17.6 blocks west of Main Street and 21 blocks south of S. Temple Street. (This is the address of the main post office in Salt Lake City.) With this logical system it is possible for someone unfamiliar with the city to locate any address immediately, as easily as one locates a point in the coordinate plane.
S. Temple St.
9th South St.
13th South St.
17th South St.
21st South St.
Post Office1760 W 2100 S
500 North St.
7th East St.
Main St.
300 West St.
900 West St.
1700 West St.
4th South St.
Copyright 2016 Cengage Learning. All Rights Reserved. May not be copied, scanned, or duplicated, in whole or in part. Due to electronic rights, some third party content may be suppressed from the eBook and/or eChapter(s).Editorial review has deemed that any suppressed content does not materially affect the overall learning experience. Cengage Learning reserves the right to remove additional content at any time if subsequent rights restrictions require it.
94 CHAPTER 1 ■ Fundamentals
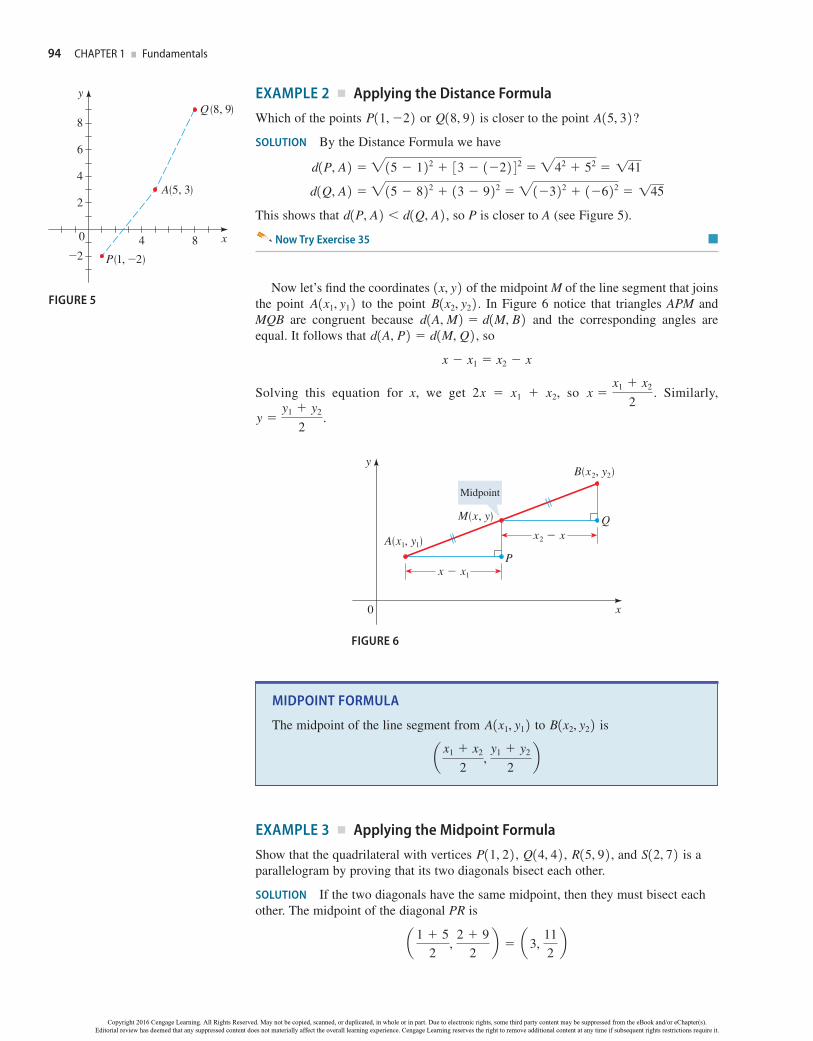
EXAMPLE 2 ■ Applying the Distance FormulaWhich of the points P11, 2 2 or Q18, 9 2 is closer to the point A15, 3 2 ?SOLUTION By the Distance Formula we have
d1P, A 2 "15 1 2 2 33 12 2 4 2 "42 52 !41
d1Q, A 2 "15 8 2 2 13 9 2 2 "13 2 2 16 2 2 !45
This shows that d1P, A 2 d1Q, A 2 , so P is closer to A (see Figure 5).
Now Try Exercise 35 ■
Now let’s find the coordinates 1x, y 2 of the midpoint M of the line segment that joins the point A1x1, y1 2 to the point B1x2, y2 2 . In Figure 6 notice that triangles APM and MQB are congruent because d1A, M 2 d1M, B 2 and the corresponding angles are equal. It follows that d1A, P 2 d1M, Q 2 , so
x x1 x2 x
Solving this equation for x, we get 2x x1 x2, so x x1 x2
2. Similarly,
y y1 y2
2.
y
x0
x-x⁄
x¤-xA(x⁄, y⁄)
M(x, y)
B(x¤, y¤)
P
Q
Midpoint
FIGURE 6
MIDPOINT FORMULA
The midpoint of the line segment from A1x1, y1 2 to B1x2, y2 2 isa x1 x2
2,
y1 y2
2b
EXAMPLE 3 ■ Applying the Midpoint FormulaShow that the quadrilateral with vertices P11, 2 2 , Q14, 4 2 , R15, 9 2 , and S12, 7 2 is a parallelogram by proving that its two diagonals bisect each other.
SOLUTION If the two diagonals have the same midpoint, then they must bisect each other. The midpoint of the diagonal PR isa 1 5
2,
2 92b a 3,
112b
y
x0
2
4 8
4
6
8
_2
Q(8, 9)
P(1, _2)
A(5, 3)
FIGURE 5
71759_ch01_001-146.indd 94 9/17/14 9:57 AM
Copyright 2016 Cengage Learning. All Rights Reserved. May not be copied, scanned, or duplicated, in whole or in part. Due to electronic rights, some third party content may be suppressed from the eBook and/or eChapter(s).Editorial review has deemed that any suppressed content does not materially affect the overall learning experience. Cengage Learning reserves the right to remove additional content at any time if subsequent rights restrictions require it.
SECTION 1.9 ■ The Coordinate Plane; Graphs of Equations; Circles 95
and the midpoint of the diagonal QS isa 4 22
, 4 7
2b a 3,
112b
so each diagonal bisects the other, as shown in Figure 7. (A theorem from elementary geometry states that the quadrilateral is therefore a parallelogram.)
Now Try Exercise 49 ■
■ Graphs of Equations in Two VariablesAn equation in two variables, such as y x 2 1, expresses a relationship between two quantities. A point 1x, y 2 satisfies the equation if it makes the equation true when the values for x and y are substituted into the equation. For example, the point 13, 10 2 satisfies the equation y x 2 1 because 10 32 1, but the point 11, 3 2 does not, because 3 ? 12 1.
THE GRAPH OF AN EQUATION
The graph of an equation in x and y is the set of all points 1x, y 2 in the coordi-nate plane that satisfy the equation.
The graph of an equation is a curve, so to graph an equation, we plot as many points as we can, then connect them by a smooth curve.
EXAMPLE 4 ■ Sketching a Graph by Plotting PointsSketch the graph of the equation 2x y 3.
SOLUTION We !rst solve the given equation for y to get
y 2x 3
This helps us calculate the y-coordinates in the following table.
x y 2x 3 xx, yc
1 5 11, 5 2 0 3 10, 3 2 1 1 11, 1 2 2 1 12, 1 2 3 3 13, 3 2 4 5 14, 5 2
Of course, there are in!nitely many points on the graph, and it is impossible to plot all of them. But the more points we plot, the better we can imagine what the graph represented by the equation looks like. We plot the points we found in Figure 8; they appear to lie on a line. So we complete the graph by joining the points by a line. (In Section 1.10 we verify that the graph of an equation of this type is indeed a line.)
Now Try Exercise 55 ■
Fundamental Principle of Analytic GeometryA point 1x, y 2 lies on the graph of an equation if and only if its coordinates satisfy the equation.
P
Q
R
S
y
x0 4
4
8
FIGURE 7
y
x0 4
y=2x-3
4
FIGURE 8
71759_ch01_001-146.indd 95 9/17/14 9:57 AM
Copyright 2016 Cengage Learning. All Rights Reserved. May not be copied, scanned, or duplicated, in whole or in part. Due to electronic rights, some third party content may be suppressed from the eBook and/or eChapter(s).Editorial review has deemed that any suppressed content does not materially affect the overall learning experience. Cengage Learning reserves the right to remove additional content at any time if subsequent rights restrictions require it.
96 CHAPTER 1 ■ Fundamentals
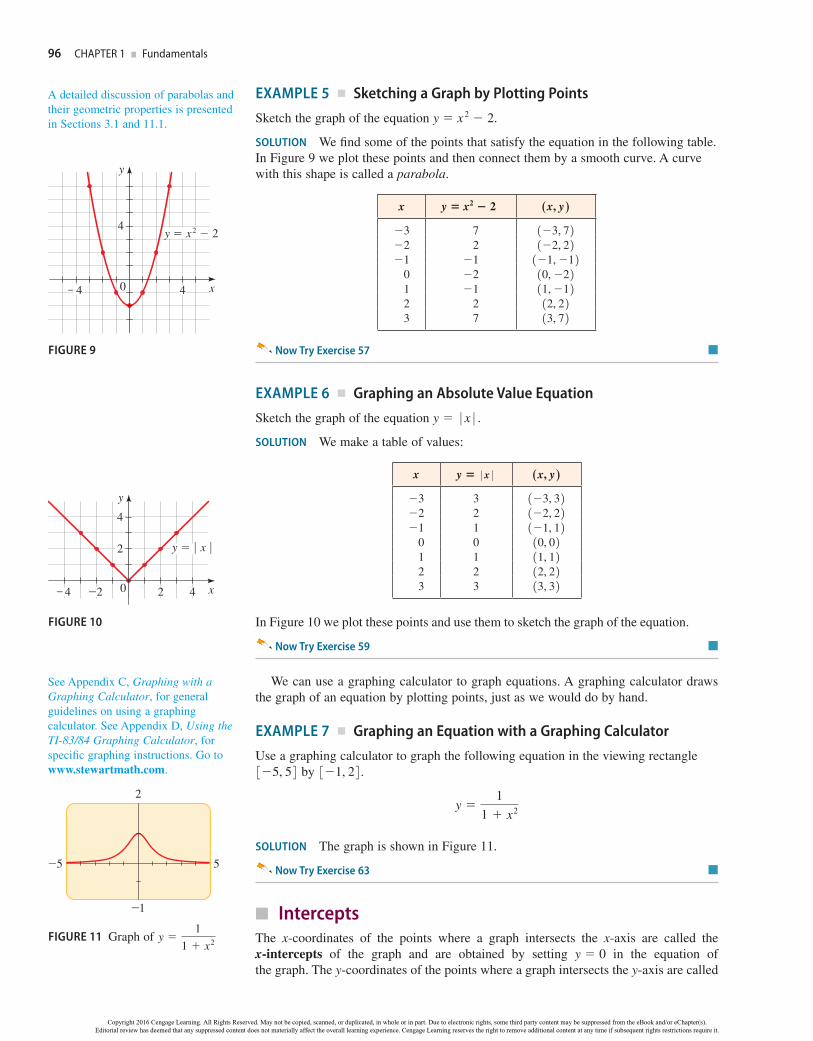
EXAMPLE 5 ■ Sketching a Graph by Plotting PointsSketch the graph of the equation y x 2 2.
SOLUTION We !nd some of the points that satisfy the equation in the following table. In Figure 9 we plot these points and then connect them by a smooth curve. A curve with this shape is called a parabola.
x y x2 2 xx, yc
3 7 13, 7 22 2 12, 2 21 1 11, 1 2
0 2 10, 2 21 1 11, 1 22 2 12, 2 23 7 13, 7 2
Now Try Exercise 57 ■
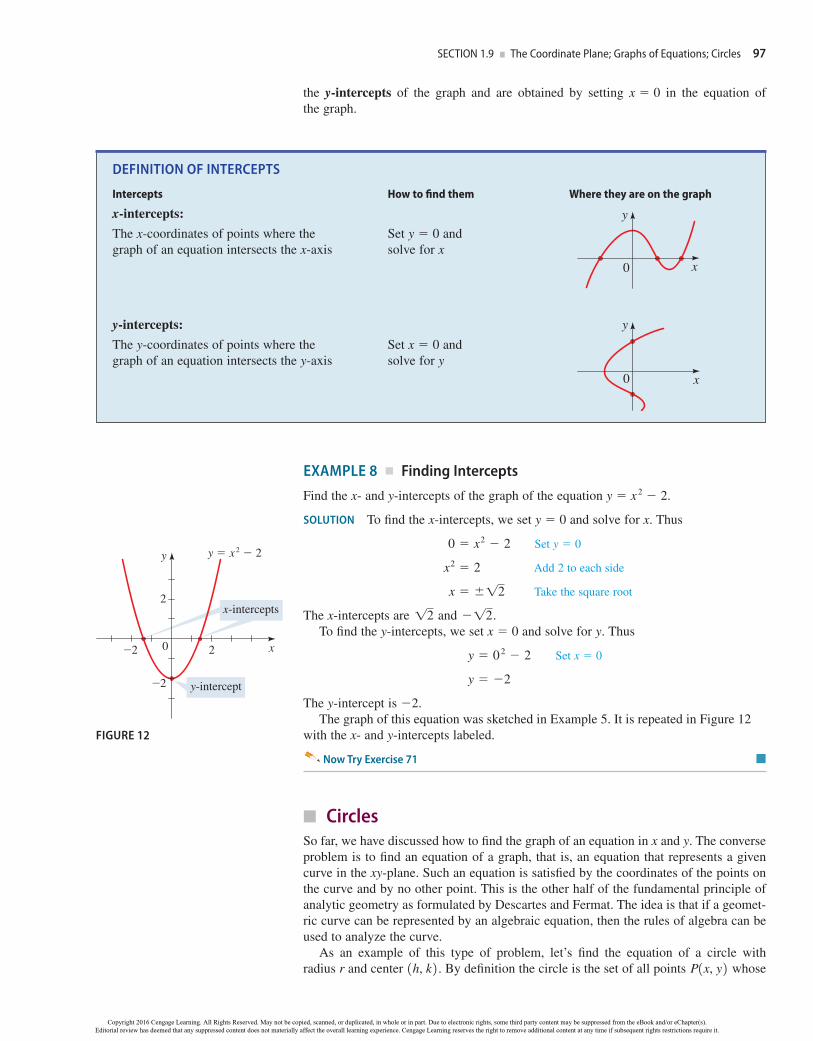
EXAMPLE 6 ■ Graphing an Absolute Value EquationSketch the graph of the equation y 0 x 0 .SOLUTION We make a table of values:
x y 0 x 0 xx, yc
3 3 13, 3 22 2 12, 2 21 1 11, 1 2
0 0 10, 0 21 1 11, 1 22 2 12, 2 23 3 13, 3 2
In Figure 10 we plot these points and use them to sketch the graph of the equation.
Now Try Exercise 59 ■
We can use a graphing calculator to graph equations. A graphing calculator draws the graph of an equation by plotting points, just as we would do by hand.
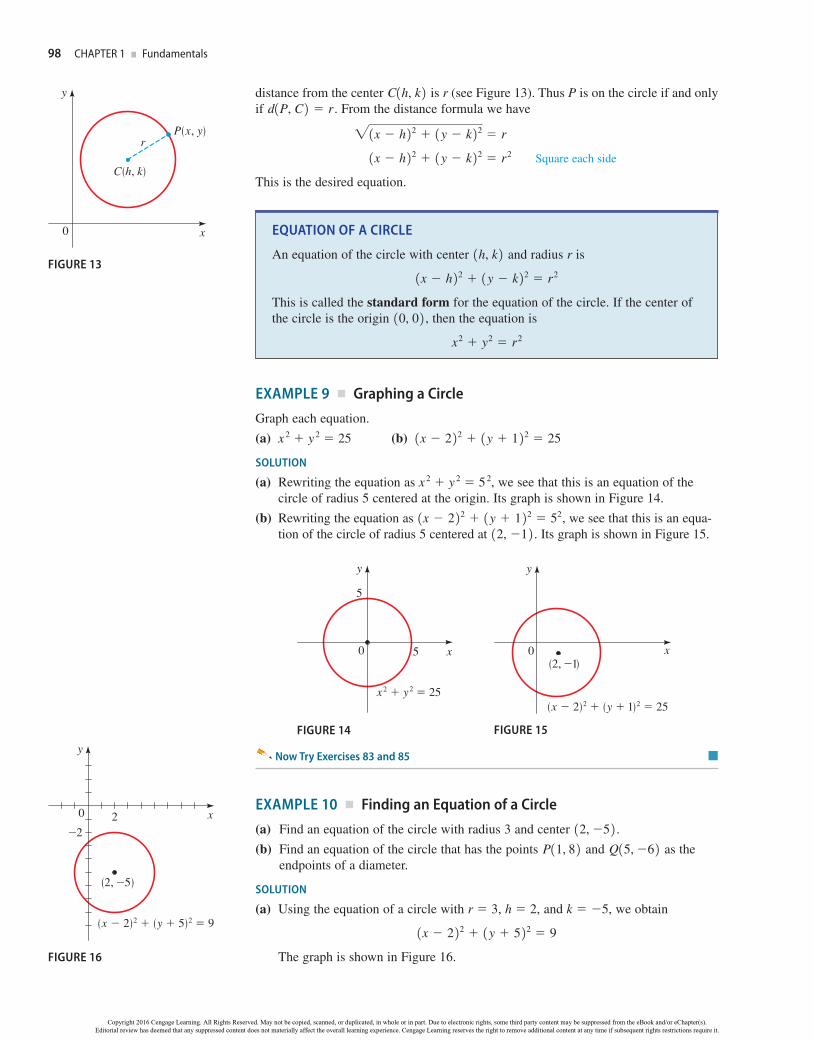
EXAMPLE 7 ■ Graphing an Equation with a Graphing CalculatorUse a graphing calculator to graph the following equation in the viewing rectangle 35, 5 4 by 31, 2 4 .
y 1
1 x2
SOLUTION The graph is shown in Figure 11.
Now Try Exercise 63 ■
■ InterceptsThe x-coordinates of the points where a graph intersects the x-axis are called the x-intercepts of the graph and are obtained by setting y 0 in the equation of the graph. The y-coordinates of the points where a graph intersects the y-axis are called
A detailed discussion of parabolas and their geometric properties is presented in Sections 3.1 and 11.1.
See Appendix C, Graphing with a Graphing Calculator, for general guidelines on using a graphing calculator. See Appendix D, Using the TI-83/84 Graphing Calculator, for speci!c graphing instructions. Go to www.stewartmath.com.
y
x_ 0
y=!-2
4
4
4
FIGURE 9
y
x_ 0
y=| x |2
4
4 42_2
FIGURE 10
FIGURE 11 Graph of y 1
1 x2
2
_1
_5 5
71759_ch01_001-146.indd 96 9/17/14 9:58 AM
Copyright 2016 Cengage Learning. All Rights Reserved. May not be copied, scanned, or duplicated, in whole or in part. Due to electronic rights, some third party content may be suppressed from the eBook and/or eChapter(s).Editorial review has deemed that any suppressed content does not materially affect the overall learning experience. Cengage Learning reserves the right to remove additional content at any time if subsequent rights restrictions require it.
SECTION 1.9 ■ The Coordinate Plane; Graphs of Equations; Circles 97
the y-intercepts of the graph and are obtained by setting x 0 in the equation of the graph.
DEFINITION OF INTERCEPTS
Intercepts How to !nd them Where they are on the graph
x-intercepts:
y
x0
y
x0
The x-coordinates of points where the Set y 0 and graph of an equation intersects the x-axis solve for x
y-intercepts:The y-coordinates of points where the Set x 0 and graph of an equation intersects the y-axis solve for y
EXAMPLE 8 ■ Finding InterceptsFind the x- and y-intercepts of the graph of the equation y x 2 2.
SOLUTION To !nd the x-intercepts, we set y 0 and solve for x. Thus
0 x2 2 Set y 0
x2 2 Add 2 to each side
x !2 Take the square root
The x-intercepts are !2 and !2.To !nd the y-intercepts, we set x 0 and solve for y. Thus
y 02 2 Set x 0
y 2
The y-intercept is 2.The graph of this equation was sketched in Example 5. It is repeated in Figure 12
with the x- and y-intercepts labeled.
Now Try Exercise 71 ■
■ CirclesSo far, we have discussed how to !nd the graph of an equation in x and y. The converse problem is to !nd an equation of a graph, that is, an equation that represents a given curve in the xy-plane. Such an equation is satis!ed by the coordinates of the points on the curve and by no other point. This is the other half of the fundamental principle of analytic geometry as formulated by Descartes and Fermat. The idea is that if a geomet-ric curve can be represented by an algebraic equation, then the rules of algebra can be used to analyze the curve.
As an example of this type of problem, let’s !nd the equation of a circle with radius r and center 1h, k 2 . By de!nition the circle is the set of all points P1x, y 2 whose
y
x2_2 0
_2
2
y=!-2
y-intercept
x-intercepts
FIGURE 12
71759_ch01_001-146.indd 97 9/17/14 9:58 AM
Copyright 2016 Cengage Learning. All Rights Reserved. May not be copied, scanned, or duplicated, in whole or in part. Due to electronic rights, some third party content may be suppressed from the eBook and/or eChapter(s).Editorial review has deemed that any suppressed content does not materially affect the overall learning experience. Cengage Learning reserves the right to remove additional content at any time if subsequent rights restrictions require it.
98 CHAPTER 1 ■ Fundamentals
distance from the center C1h, k 2 is r (see Figure 13). Thus P is on the circle if and only if d1P, C 2 r. From the distance formula we have
"1x h 2 2 1 y k 2 2 r
1x h 2 2 1 y k 2 2 r2 Square each side
This is the desired equation.
EQUATION OF A CIRCLE
An equation of the circle with center 1h, k 2 and radius r is1x h 2 2 1 y k 2 2 r2
This is called the standard form for the equation of the circle. If the center of the circle is the origin 10, 0 2 , then the equation is
x2 y2 r2
EXAMPLE 9 ■ Graphing a CircleGraph each equation.
(a) x 2 y 2 25 (b) 1x 2 2 2 1 y 1 2 2 25
SOLUTION
(a) Rewriting the equation as x 2 y 2 52, we see that this is an equation of the circle of radius 5 centered at the origin. Its graph is shown in Figure 14.
(b) Rewriting the equation as 1x 2 2 2 1 y 1 2 2 52, we see that this is an equa-tion of the circle of radius 5 centered at 12, 1 2 . Its graph is shown in Figure 15.
5
5
y
x
!+¥=25
0(2, _1)
y
x
(x-2)™+(y+1)™=25
0
FIGURE 14 FIGURE 15
Now Try Exercises 83 and 85 ■
EXAMPLE 10 ■ Finding an Equation of a Circle(a) Find an equation of the circle with radius 3 and center 12, 5 2 .(b) Find an equation of the circle that has the points P11, 8 2 and Q15, 6 2 as the
endpoints of a diameter.
SOLUTION
(a) Using the equation of a circle with r 3, h 2, and k 5, we obtain1x 2 2 2 1 y 5 2 2 9
The graph is shown in Figure 16.
r
y
x0
C(h, k)
P(x, y)
FIGURE 13
FIGURE 16
(x-2)™+(y+5)™=9
y
x20
(2, _5)
_2
71759_ch01_001-146.indd 98 9/17/14 9:58 AM
Copyright 2016 Cengage Learning. All Rights Reserved. May not be copied, scanned, or duplicated, in whole or in part. Due to electronic rights, some third party content may be suppressed from the eBook and/or eChapter(s).Editorial review has deemed that any suppressed content does not materially affect the overall learning experience. Cengage Learning reserves the right to remove additional content at any time if subsequent rights restrictions require it.
SECTION 1.9 ■ The Coordinate Plane; Graphs of Equations; Circles 99
(b) We !rst observe that the center is the midpoint of the diameter PQ, so by the Midpoint Formula the center isa 1 5
2,
8 62b 13, 1 2
The radius r is the distance from P to the center, so by the Distance Formula
r2 13 1 2 2 11 8 2 2 22 17 2 2 53
Therefore the equation of the circle is1x 3 2 2 1 y 1 2 2 53
The graph is shown in Figure 17.
Now Try Exercises 89 and 93 ■
Let’s expand the equation of the circle in the preceding example.
1x 3 2 2 1 y 1 2 2 53 Standard form
x2 6x 9 y2 2y 1 53 Expand the squares
x2 6x y2 2y 43 Subtract 10 to get expanded form
Suppose we are given the equation of a circle in expanded form. Then to !nd its center and radius, we must put the equation back in standard form. That means that we must reverse the steps in the preceding calculation, and to do that, we need to know what to add to an expression like x 2 6x to make it a perfect square—that is, we need to com-plete the square, as in the next example.
EXAMPLE 11 ■ Identifying an Equation of a CircleShow that the equation x2 y2 2x 6y 7 0 represents a circle, and !nd the center and radius of the circle.
SOLUTION We !rst group the x-terms and y-terms. Then we complete the square within each grouping. That is, we complete the square for x2 2x by adding A12 # 2B2 1, and we complete the square for y2 6y by adding C12 # 16 2 D 2 9.
1x2 2x 2 1 y2 6y 2 7 Group terms1x2 2x 1 2 1 y2 6y 9 2 7 1 9 Complete the square by adding 1 and 9 to each side
1x 1 2 2 1 y 3 2 2 3 Factor and simplify
Comparing this equation with the standard equation of a circle, we see that h 1, k 3, and r !3, so the given equation represents a circle with center 11, 3 2 and radius !3.
Now Try Exercise 99 ■
■ SymmetryFigure 18 shows the graph of y x2. Notice that the part of the graph to the left of the y-axis is the mirror image of the part to the right of the y-axis. The reason is that if the point 1x, y 2 is on the graph, then so is 1x, y 2 , and these points are re"ections of each other about the y-axis. In this situation we say that the graph is symmetric with respect to the y-axis. Similarly, we say that a graph is symmetric with respect to the x-axis if whenever the point 1x, y 2 is on the graph, then so is 1x, y 2 . A graph is symmetric with respect to the origin if whenever 1x, y 2 is on the graph, so is 1x, y 2 . (We often say symmetric “about” instead of “with respect to.”)
Completing the square is used in many contexts in algebra. In Section 1.5 we used completing the square to solve quadratic equations.
We must add the same numbers to each side to maintain equality.
(x-3)™+(y-1)™=53
P(1, 8)
Q(5, _6)
(3, 1)
y
x0
FIGURE 17
(x, y)(_x, y)
y
x10
1
y=!
FIGURE 18
71759_ch01_001-146.indd 99 9/17/14 9:58 AM
Copyright 2016 Cengage Learning. All Rights Reserved. May not be copied, scanned, or duplicated, in whole or in part. Due to electronic rights, some third party content may be suppressed from the eBook and/or eChapter(s).Editorial review has deemed that any suppressed content does not materially affect the overall learning experience. Cengage Learning reserves the right to remove additional content at any time if subsequent rights restrictions require it.
100 CHAPTER 1 ■ Fundamentals
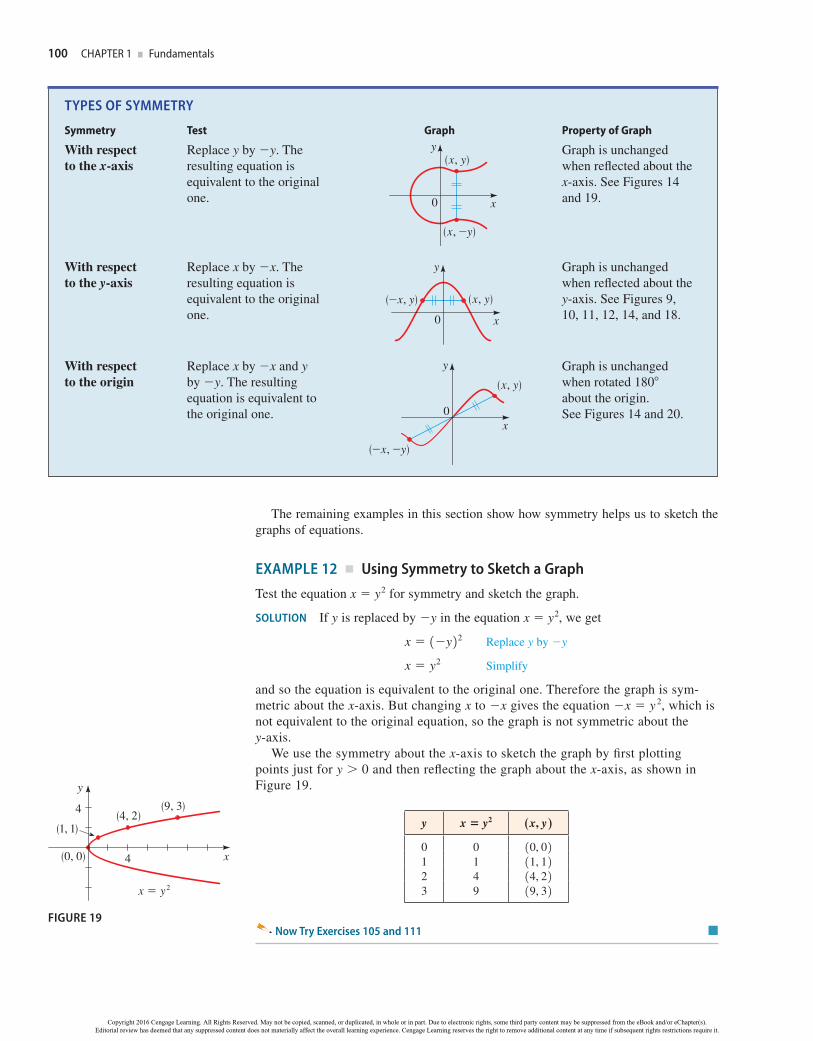
TYPES OF SYMMETRY
Symmetry Test Graph Property of Graph
With respect Replace y by y. The Graph is unchanged to the x-axis resulting equation is when reflected about the equivalent to the original x-axis. See Figures 14 one. and 19.
With respect Replace x by x. The Graph is unchanged to the y-axis resulting equation is when reflected about the equivalent to the original y-axis. See Figures 9, one. 10, 11, 12, 14, and 18.
With respect Replace x by x and y Graph is unchanged to the origin by y. The resulting when rotated 180 equation is equivalent to about the origin. the original one. See Figures 14 and 20.
The remaining examples in this section show how symmetry helps us to sketch the graphs of equations.
EXAMPLE 12 ■ Using Symmetry to Sketch a GraphTest the equation x y2 for symmetry and sketch the graph.
SOLUTION If y is replaced by y in the equation x y2, we get
x 1y 2 2 Replace y by y
x y2 Simplify
and so the equation is equivalent to the original one. Therefore the graph is sym-metric about the x-axis. But changing x to x gives the equation x y 2, which is not equivalent to the original equation, so the graph is not symmetric about the y-axis.
We use the symmetry about the x-axis to sketch the graph by first plotting points just for y 0 and then reflecting the graph about the x-axis, as shown in Figure 19.
y x y2 xx, yc
0 0 10, 0 21 1 11, 1 22 4 14, 2 23 9 19, 3 2
Now Try Exercises 105 and 111 ■
(x, y)
(x, _y)
y
x0
(x, y)(_x, y)
y
x0
(x, y)
(_x, _y)
y
x0
y
x4
x=¥
(9, 3)
(0, 0)
4 (4, 2)(1, 1)
FIGURE 19
71759_ch01_001-146.indd 100 9/17/14 9:58 AM
Copyright 2016 Cengage Learning. All Rights Reserved. May not be copied, scanned, or duplicated, in whole or in part. Due to electronic rights, some third party content may be suppressed from the eBook and/or eChapter(s).Editorial review has deemed that any suppressed content does not materially affect the overall learning experience. Cengage Learning reserves the right to remove additional content at any time if subsequent rights restrictions require it.
SECTION 1.9 ■ The Coordinate Plane; Graphs of Equations; Circles 101
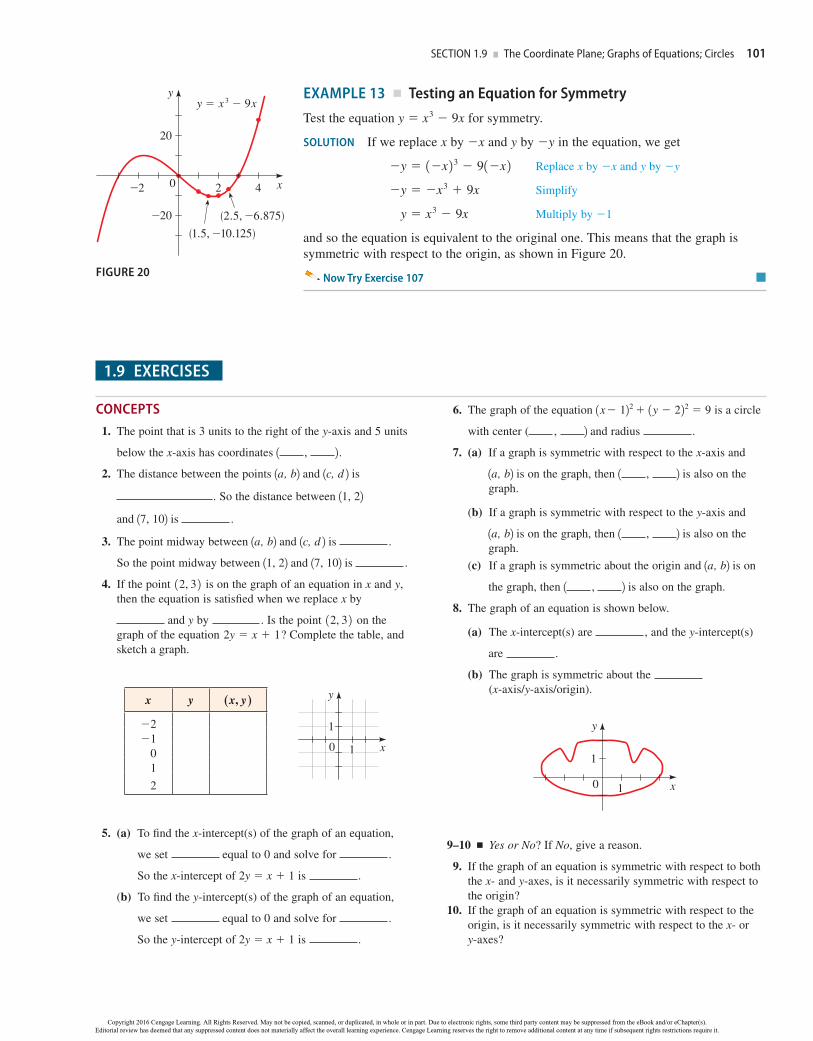
EXAMPLE 13 ■ Testing an Equation for SymmetryTest the equation y x3 9x for symmetry.
SOLUTION If we replace x by x and y by y in the equation, we get
y 1x 2 3 91x 2 Replace x by x and y by y
y x3 9x Simplify
y x3 9x Multiply by 1
and so the equation is equivalent to the original one. This means that the graph is symmetric with respect to the origin, as shown in Figure 20.
Now Try Exercise 107 ■
CONCEPTS 1. The point that is 3 units to the right of the y-axis and 5 units
below the x-axis has coordinates 1 , 2 . 2. The distance between the points 1a, b2 and 1c, d 2 is
. So the distance between 11, 22 and 17, 102 is .
3. The point midway between 1a, b2 and 1c, d 2 is .
So the point midway between 11, 22 and 17, 102 is .
4. If the point 12, 3 2 is on the graph of an equation in x and y, then the equation is satis!ed when we replace x by
and y by . Is the point 12, 3 2 on the graph of the equation 2y x 1? Complete the table, and sketch a graph.
x y xx, yc
21
012
y
x0 11
5. (a) To !nd the x-intercept(s) of the graph of an equation,
we set equal to 0 and solve for .
So the x-intercept of 2y x 1 is .
(b) To !nd the y-intercept(s) of the graph of an equation,
we set equal to 0 and solve for .
So the y-intercept of 2y x 1 is .
6. The graph of the equation 1x 122 1y 222 9 is a circle
with center ( , 2 and radius .
7. (a) If a graph is symmetric with respect to the x-axis and
1a, b2 is on the graph, then 1 , 2 is also on the graph.
(b) If a graph is symmetric with respect to the y-axis and
1a, b2 is on the graph, then 1 , 2 is also on the graph.
(c) If a graph is symmetric about the origin and 1a, b2 is on
the graph, then 1 , 2 is also on the graph.
8. The graph of an equation is shown below.
(a) The x-intercept(s) are , and the y-intercept(s)
are .
(b) The graph is symmetric about the (x-axis/y-axis/origin).
y
x0
1
1
9–10 ■ Yes or No? If No, give a reason.
9. If the graph of an equation is symmetric with respect to both the x- and y-axes, is it necessarily symmetric with respect to the origin?
10. If the graph of an equation is symmetric with respect to the origin, is it necessarily symmetric with respect to the x- or y-axes?
1.9 EXERCISES
y
x2
y=x£-9x
0
20
(1.5, _10.125)
4_2
_20 (2.5, _6.875)
FIGURE 20
71759_ch01_001-146.indd 101 9/25/14 11:23 AM
Copyright 2016 Cengage Learning. All Rights Reserved. May not be copied, scanned, or duplicated, in whole or in part. Due to electronic rights, some third party content may be suppressed from the eBook and/or eChapter(s).Editorial review has deemed that any suppressed content does not materially affect the overall learning experience. Cengage Learning reserves the right to remove additional content at any time if subsequent rights restrictions require it.
102 CHAPTER 1 ■ Fundamentals
SKILLS11–12 ■ Points in a Coordinate Plane Refer to the !gure below.
11. Find the coordinates of the points shown.
12. List the points that lie in Quadrants I and III.
y
x0
BA
C
D
E
G
F
H
11
13–14 ■ Points in a Coordinate Plane Plot the given points in a coordinate plane.
13. 10, 5 2 , 11, 0 2 , 11, 2 2 , A12, 23 B 14. 15, 0 2 , 12, 0 2 , 12.6, 1.3 2 , 12.5, 3.5 215–20 ■ Sketching Regions Sketch the region given by the set.
15. (a) 5 1x, y 2 0 x 26 (b) 5 1x, y 2 0 y 26 16. (a) 5 1x, y 2 0 y 36 (b) 5 1x, y 2 0 x 46 17. (a) 5 1x, y 2 0 3 x 36 (b) 5 1x, y 2 @ 0 x 0 26 18. (a) 5 1x, y 2 0 0 y 26 (b) 5 1x, y 2 @ 0 y 0 26 19. (a) 5 1x, y 2 0 2 x 2 and y 16
(b) 5 1x, y 2 0 xy 06 20. (a) 5 1x, y 2 @ 0 x 0 1 and 0 y 0 36
(b) 5 1x, y 2 0 xy 0621–24 ■ Distance and Midpoint A pair of points is graphed. (a) Find the distance between them. (b) Find the midpoint of the segment that joins them.
21.
0
y
x11
22.
0
y
x11
23.
0
y
x1
2
24.
0
y
x1
1
25–30 ■ Distance and Midpoint A pair of points is given. (a) Plot the points in a coordinate plane. (b) Find the distance between them. (c) Find the midpoint of the segment that joins them.
25. 10, 8 2 , 16, 16 2 26. 12, 5 2 , 110, 0 2 27. 13, 2 2 , 14, 5 2 28. 11, 1 2 , 16, 3 229. 16, 2 2 , 16, 2 2 30. 10, 6 2 , 15, 0 231–34 ■ Area In these exercises we !nd the areas of plane !gures.
31. Draw the rectangle with vertices A11, 3 2 , B15, 3 2 , C11, 3 2 , and D15, 3 2 on a coordinate plane. Find the area of the rectangle.
32. Draw the parallelogram with vertices A11, 2 2 , B15, 2 2 , C13, 6 2 , and D17, 6 2 on a coordinate plane. Find the area of the parallelogram.
33. Plot the points A11, 0 2 , B15, 0 2 , C14, 3 2 , and D12, 3 2 on a coordinate plane. Draw the segments AB, BC, CD, and DA. What kind of quadrilateral is ABCD, and what is its area?
34. Plot the points P15, 1 2 , Q10, 6 2 , and R15, 1 2 on a coordi-nate plane. Where must the point S be located so that the quadrilateral PQRS is a square? Find the area of this square.
35–39 ■ Distance Formula In these exercises we use the Distance Formula.
35. Which of the points A16, 7 2 or B15, 8 2 is closer to the origin?
36. Which of the points C16, 3 2 or D13, 0 2 is closer to the point E12, 1 2 ?
37. Which of the points P13, 1 2 or Q11, 3 2 is closer to the point R11, 1 2 ?
38. (a) Show that the points 17, 3 2 and 13, 7 2 are the same distance from the origin.
(b) Show that the points 1a, b 2 and 1b, a 2 are the same distance from the origin.
39. Show that the triangle with vertices A10, 2 2 , B13, 1 2 , and C14, 3 2 is isosceles.
40. Area of Triangle Find the area of the triangle shown in the figure.
y
x0 2
2
4 6 8
4
_2_2
C
BA
41–42 ■ Pythagorean Theorem In these exercises we use the converse of the Pythagorean Theorem (Appendix A) to show that the given triangle is a right triangle.
41. Refer to triangle ABC in the figure below.(a) Show that triangle ABC is a right triangle by using the
converse of the Pythagorean Theorem.
71759_ch01_001-146.indd 102 9/17/14 9:58 AM
Copyright 2016 Cengage Learning. All Rights Reserved. May not be copied, scanned, or duplicated, in whole or in part. Due to electronic rights, some third party content may be suppressed from the eBook and/or eChapter(s).Editorial review has deemed that any suppressed content does not materially affect the overall learning experience. Cengage Learning reserves the right to remove additional content at any time if subsequent rights restrictions require it.
SECTION 1.9 ■ The Coordinate Plane; Graphs of Equations; Circles 103
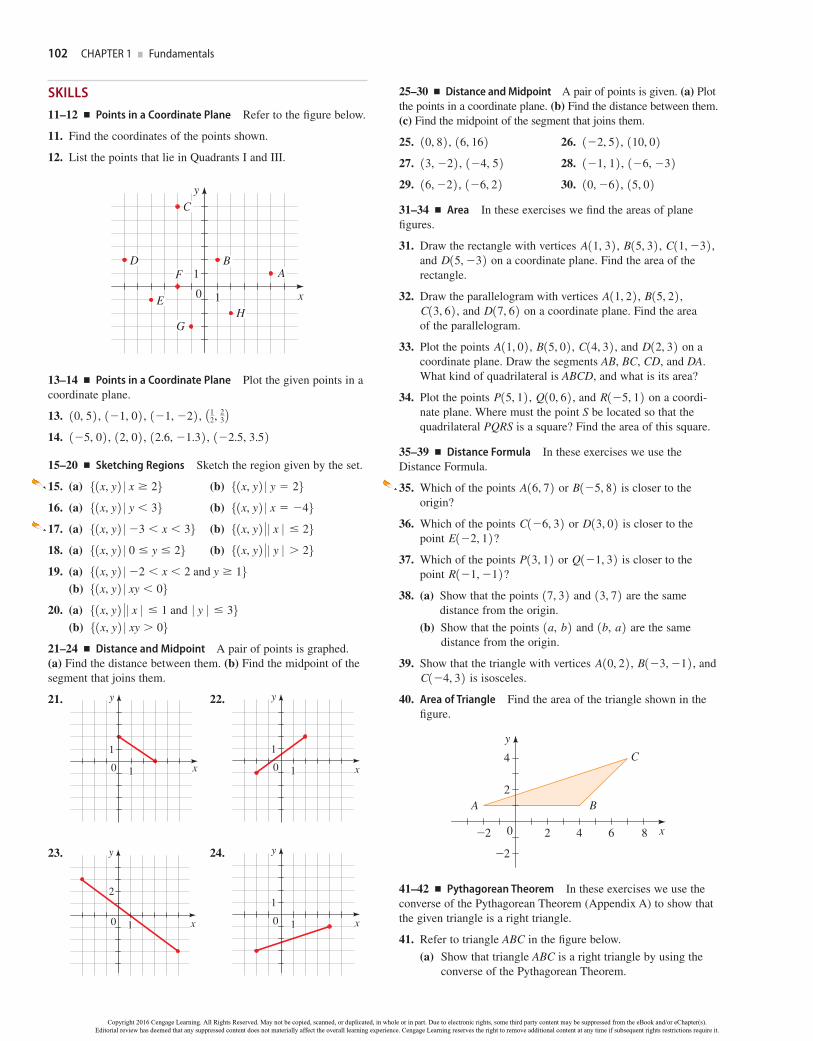
(b) Find the area of triangle ABC.
y
x0 2
2
4 6_2_4_2
B
A
C
42. Show that the triangle with vertices A16, 7 2 , B111, 3 2 , and C12, 2 2 is a right triangle by using the converse of the Pythagorean Theorem. Find the area of the triangle.
43–45 ■ Distance Formula In these exercises we use the Dis-tance Formula.
43. Show that the points A12, 9 2 , B14, 6 2 , C11, 0 2 , and D15, 3 2 are the vertices of a square.
44. Show that the points A11, 3 2 , B13, 11 2 , and C15, 15 2 are collinear by showing that d1A, B 2 d1B, C 2 d1A, C 2 .
45. Find a point on the y-axis that is equidistant from the points 15, 5 2 and 11, 1 2 .46–50 ■ Distance and Midpoint Formulas In these exercises we use the Distance Formula and the Midpoint Formula.
46. Find the lengths of the medians of the triangle with vertices A11, 0 2 , B13, 6 2 , and C18, 2 2 . (A median is a line segment from a vertex to the midpoint of the opposite side.)
47. Plot the points P11, 4 2 , Q11, 1 2 , and R14, 2 2 on a coordinate plane. Where should the point S be located so that the figure PQRS is a parallelogram?
48. If M16, 8 2 is the midpoint of the line segment AB and if A has coordinates 12, 3 2 , find the coordinates of B.
49. (a) Sketch the parallelogram with vertices A12, 1 2 , B14, 2 2 , C17, 7 2 , and D11, 4 2 .
(b) Find the midpoints of the diagonals of this parallelogram.
(c) From part (b) show that the diagonals bisect each other.
50. The point M in the figure is the midpoint of the line segment AB. Show that M is equidistant from the vertices of triangle ABC.
y
xC(0, 0) A(a, 0)
M
B(0, b)
51–54 ■ Points on a Graph? Determine whether the given points are on the graph of the equation.
51. x 2y 1 0; 10, 0 2 , 11, 0 2 , 11, 1 252. y1x2 1 2 1; 11, 1 2 , A1,
12 B, A1, 12 B
53. x2 xy y2 4; 10, 2 2 , 11, 2 2 , 12, 2 254. x2 y2 1; 10, 1 2 , a 1
!2,
1!2b , a !3
2,
12b
55–60 ■ Graphing Equations Make a table of values, and sketch the graph of the equation.
55. 4x 5y 40 56. 3x 5y 30
57. y x2 4 58. y 3 x2
59. y 0 x 0 1 60. y 0 x 1 061–64 ■ Graphing Equations Use a graphing calculator to graph the equation in the given viewing rectangle.
61. y 0.01x3 x2 5; 3100, 150 4 by 32000, 2000 4 62. y !12x 17; 30, 10 4 by 30, 20 4 63. y
xx2 25
; 350, 50 4 by 30.2, 0.2 4 64. y x4 4x3; 34, 6 4 by 350, 100 465–70 ■ Graphing Equations Make a table of values, and sketch the graph of the equation. Find the x- and y-intercepts, and test for symmetry.
65. (a) 2x y 6 (b) y 1x 1 2 2 66. (a) x 4y 8 (b) y x2 3
67. (a) y !x 1 (b) y 0 x 0 68. (a) y 3 !x (b) x 0 y 0 69. (a) y "4 x2 (b) x y3 2y
70. (a) y "4 x2 (b) x y3
71–74 ■ Intercepts Find the x- and y-intercepts of the graph of the equation.
71. (a) y x 6 (b) y x2 5
72. (a) 4x2 25y2 100 (b) x2 xy 3y 1
73. (a) 9x2 4y2 36 (b) y 2xy 4x 1
74. (a) y "x2 16 (b) y "64 x3
75–78 ■ Intercepts An equation and its graph are given. Find the x- and y-intercepts.
75. y 4x x2 76. x2
9
y2
4 1
y
x01
1
y
x01
1
71759_ch01_001-146.indd 103 9/17/14 9:58 AM
Copyright 2016 Cengage Learning. All Rights Reserved. May not be copied, scanned, or duplicated, in whole or in part. Due to electronic rights, some third party content may be suppressed from the eBook and/or eChapter(s).Editorial review has deemed that any suppressed content does not materially affect the overall learning experience. Cengage Learning reserves the right to remove additional content at any time if subsequent rights restrictions require it.
104 CHAPTER 1 ■ Fundamentals
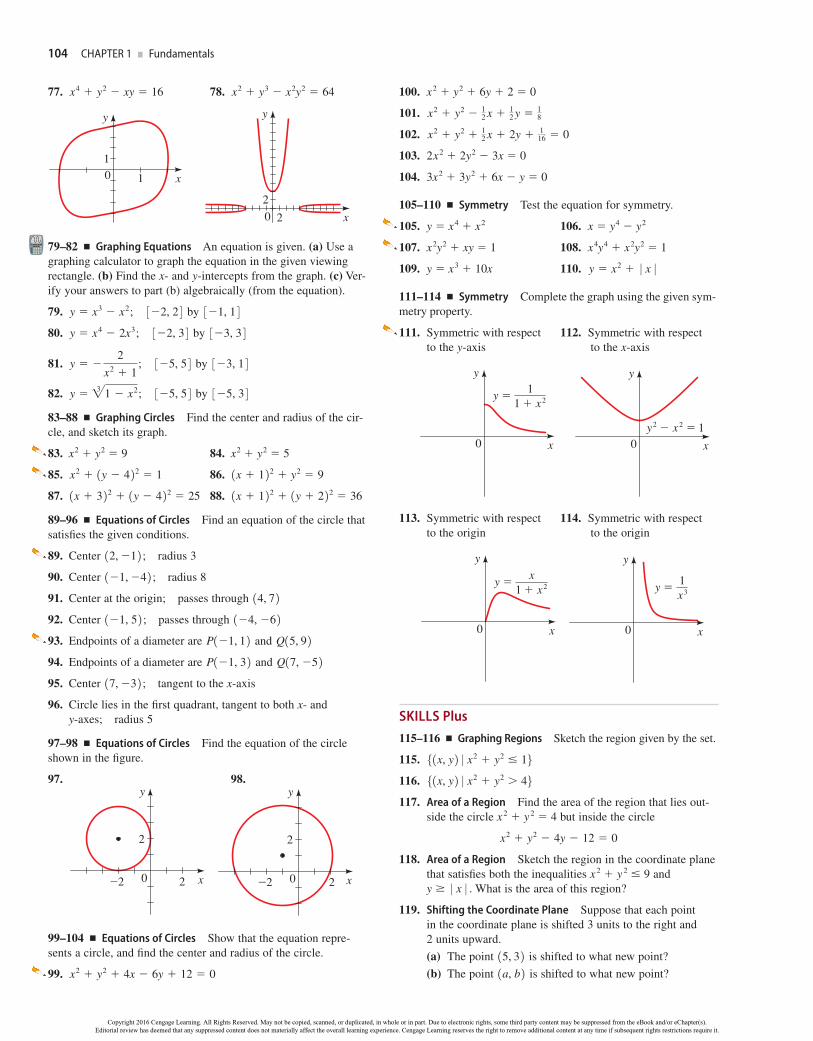
77. x4 y2 xy 16 78. x2 y3 x2y2 64
y
x01
1
y
x02
2
79–82 ■ Graphing Equations An equation is given. (a) Use a graphing calculator to graph the equation in the given viewing rectangle. (b) Find the x- and y-intercepts from the graph. (c) Ver-ify your answers to part (b) algebraically (from the equation).
79. y x3 x2; 32, 2 4 by 31, 1 4 80. y x4 2x3; 32, 3 4 by 33, 3 4 81. y
2x2 1
; 35, 5 4 by 33, 1 4 82. y "3 1 x2; 35, 5 4 by 35, 3 483–88 ■ Graphing Circles Find the center and radius of the cir-cle, and sketch its graph.
83. x2 y2 9 84. x2 y2 5
85. x2 1y 4 2 2 1 86. 1x 1 2 2 y2 9
87. 1x 3 2 2 1y 4 2 2 25 88. 1x 1 2 2 1y 2 2 2 36
89–96 ■ Equations of Circles Find an equation of the circle that satis!es the given conditions.
89. Center 12, 1 2 ; radius 3
90. Center 11, 4 2 ; radius 8
91. Center at the origin; passes through 14, 7 2 92. Center 11, 5 2 ; passes through 14, 6 2 93. Endpoints of a diameter are P11, 1 2 and Q15, 9 2 94. Endpoints of a diameter are P11, 3 2 and Q17, 5 2 95. Center 17, 3 2 ; tangent to the x-axis
96. Circle lies in the !rst quadrant, tangent to both x- and y-axes; radius 5
97–98 ■ Equations of Circles Find the equation of the circle shown in the !gure.
97. 98.
y
x0
2
2_2
y
x0
2
2_2
99–104 ■ Equations of Circles Show that the equation repre-sents a circle, and !nd the center and radius of the circle.
99. x2 y2 4x 6y 12 0
100. x2 y2 6y 2 0
101. x2 y2 12 x 1
2 y 18
102. x2 y2 12 x 2y 1
16 0
103. 2x2 2y2 3x 0
104. 3x2 3y2 6x y 0
105–110 ■ Symmetry Test the equation for symmetry.
105. y x4 x2 106. x y4 y2
107. x2y2 xy 1 108. x4y4 x2y2 1
109. y x3 10x 110. y x2 0 x 0111–114 ■ Symmetry Complete the graph using the given sym-metry property.
111. Symmetric with respect 112. Symmetric with respect to the y-axis to the x-axis
y= 11+!
y
x0
¥-!=1
y
x0
113. Symmetric with respect 114. Symmetric with respect to the origin to the origin
y= x1+!
y
x0
y= 1x£
y
x0
SKILLS Plus115–116 ■ Graphing Regions Sketch the region given by the set.
115. 5 1x, y 2 0 x2 y2 16116. 5 1x, y 2 0 x2 y2 46117. Area of a Region Find the area of the region that lies out-
side the circle x 2 y 2 4 but inside the circle
x2 y2 4y 12 0
118. Area of a Region Sketch the region in the coordinate plane that satis!es both the inequalities x 2 y 2 9 and y 0 x 0 . What is the area of this region?
119. Shifting the Coordinate Plane Suppose that each point in the coordinate plane is shifted 3 units to the right and 2 units upward.(a) The point 15, 3 2 is shifted to what new point?(b) The point 1a, b 2 is shifted to what new point?
71759_ch01_001-146.indd 104 9/17/14 9:58 AM
Copyright 2016 Cengage Learning. All Rights Reserved. May not be copied, scanned, or duplicated, in whole or in part. Due to electronic rights, some third party content may be suppressed from the eBook and/or eChapter(s).Editorial review has deemed that any suppressed content does not materially affect the overall learning experience. Cengage Learning reserves the right to remove additional content at any time if subsequent rights restrictions require it.
SECTION 1.9 ■ The Coordinate Plane; Graphs of Equations; Circles 105
(c) What point is shifted to 13, 4 2 ?(d) Triangle ABC in the figure has been shifted to triangle
ABC. Find the coordinates of the points A, B, and C.
A'
B'C '
0
y
xA(_5, _1)
C(2, 1)B(_3, 2)
120. Reflecting in the Coordinate Plane Suppose that the y-axis acts as a mirror that reflects each point to the right of it into a point to the left of it.(a) The point 13, 7 2 is reflected to what point?(b) The point 1a, b 2 is reflected to what point?(c) What point is reflected to 14, 1 2 ?(d) Triangle ABC in the figure is reflected to triangle ABC.
Find the coordinates of the points A, B, and C.
A'
B'
C '
0
y
x
A(3, 3)
C(1, _4)
B(6, 1)
121. Making a Graph Symmetric The graph shown in the figure is not symmetric about the x-axis, the y-axis, or the origin. Add more line segments to the graph so that it exhibits the indicated symmetry. In each case, add as little as possible.(a) Symmetry about the x-axis(b) Symmetry about the y-axis(c) Symmetry about the origin
y
x0
1
1
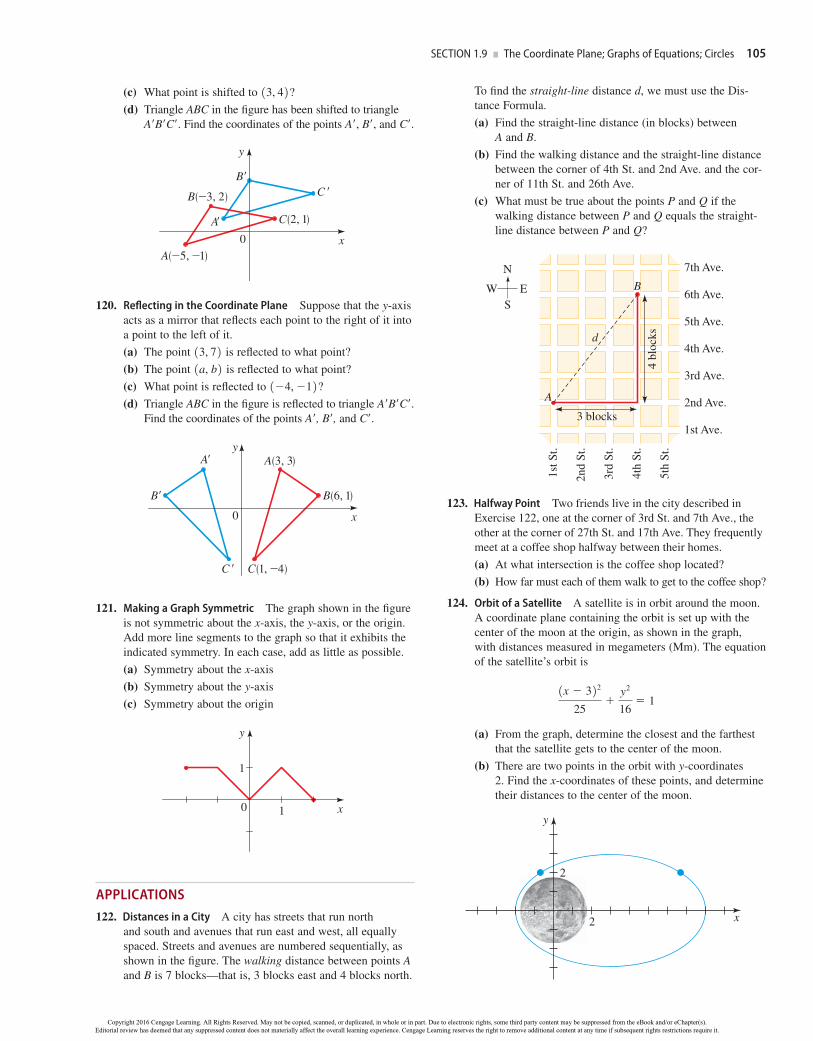
APPLICATIONS122. Distances in a City A city has streets that run north
and south and avenues that run east and west, all equally spaced. Streets and avenues are numbered sequentially, as shown in the figure. The walking distance between points A and B is 7 blocks—that is, 3 blocks east and 4 blocks north.
To find the straight-line distance d, we must use the Dis-tance Formula.(a) Find the straight-line distance (in blocks) between
A and B.(b) Find the walking distance and the straight-line distance
between the corner of 4th St. and 2nd Ave. and the cor-ner of 11th St. and 26th Ave.
(c) What must be true about the points P and Q if the walking distance between P and Q equals the straight-line distance between P and Q?
B
A
d
3 blocks
7th Ave.
6th Ave.
5th Ave.
4th Ave.
3rd Ave.
2nd Ave.
1st Ave.
1st S
t.
2nd
St.
3rd
St.
4th
St.
5th
St.
4 bl
ocks
N
SEW
123. Halfway Point Two friends live in the city described in Exercise 122, one at the corner of 3rd St. and 7th Ave., the other at the corner of 27th St. and 17th Ave. They frequently meet at a coffee shop halfway between their homes.(a) At what intersection is the coffee shop located?(b) How far must each of them walk to get to the coffee shop?
124. Orbit of a Satellite A satellite is in orbit around the moon. A coordinate plane containing the orbit is set up with the center of the moon at the origin, as shown in the graph, with distances measured in megameters (Mm). The equation of the satellite’s orbit is1x 3 2 2
25
y2
16 1
(a) From the graph, determine the closest and the farthest that the satellite gets to the center of the moon.
(b) There are two points in the orbit with y-coordinates 2. Find the x-coordinates of these points, and determine their distances to the center of the moon.
2
y
x2
71759_ch01_001-146.indd 105 9/17/14 9:58 AM
Copyright 2016 Cengage Learning. All Rights Reserved. May not be copied, scanned, or duplicated, in whole or in part. Due to electronic rights, some third party content may be suppressed from the eBook and/or eChapter(s).Editorial review has deemed that any suppressed content does not materially affect the overall learning experience. Cengage Learning reserves the right to remove additional content at any time if subsequent rights restrictions require it.


![calificaciones [Moodle 1.9]](https://img.pdfslide.tips/doc/110x75/5571f40549795947648ee5ea/calificaciones-moodle-19.jpg)