Embed Size (px)
Citation preview

China Natural Gas Market StatusChina Natural Gas Market Status and Outlook
Duan ZhaofangCNPC ETRI
2017.11.08·Beijing
CNPC ETRI
中国石油集团经济技术研究院| Page 1
IEEJ:November 2017 © IEEJ 2017

Outline
I China Natural Gas Market Status
II China Natural Gas Market Outlook
中国石油集团经济技术研究院| Page 2
IEEJ:November 2017 © IEEJ 2017
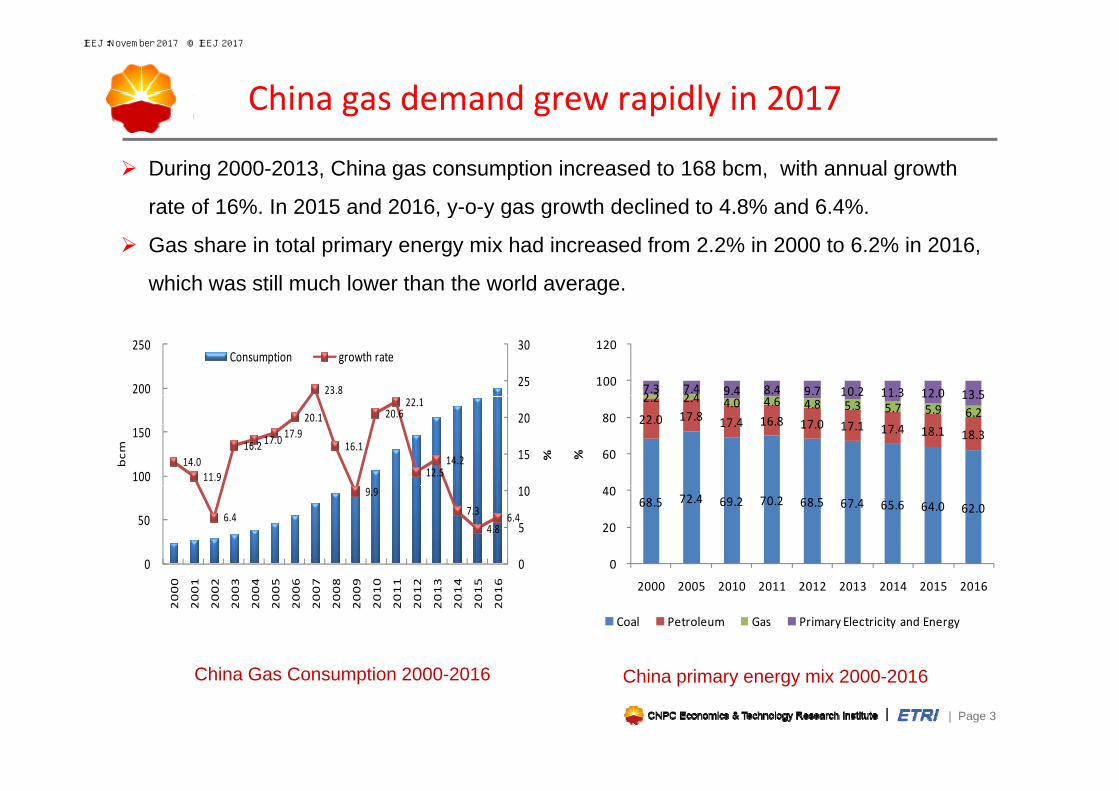
China gas demand grew rapidly in 2017
During 2000-2013, China gas consumption increased to 168 bcm, with annual growth
rate of 16%. In 2015 and 2016, y-o-y gas growth declined to 4.8% and 6.4%. , y y g g
Gas share in total primary energy mix had increased from 2.2% in 2000 to 6.2% in 2016,
which was still much lower than the world average.
23.8 25
30
200
250 Consumption growth rate
2 2 2 47.3 7.4 9.4 8.4 9.7 10.2 11.3 12 0 13 5
100
120
14.0 11.9
16.2 17.0 17.9
20.1
16.1
20.6 22.1
12.5 14.2 15
20
100
150
%bcm
22.0 17.8 17.4 16.8 17.0 17.1 17.4 18.1 18.3
2.2 2.4 4.0 4.6 4.8 5.3 5.7 5.9 6.2
10.2 11.3 12.0 13.5
60
80
%
6.4
9.9 7.3
4.8 6.4
0
5
10
0
50 68.5 72.4 69.2 70.2 68.5 67.4 65.6 64.0 62.0
0
20
40
2000
2001
2002
2003
2004
2005
2006
2007
2008
2009
2010
2011
2012
2013
2014
2015
2016 2000 2005 2010 2011 2012 2013 2014 2015 2016
Coal Petroleum Gas Primary Electricity and Energy
中国石油集团经济技术研究院| Page 3
China Gas Consumption 2000-2016 China primary energy mix 2000-2016
IEEJ:November 2017 © IEEJ 2017

China gas demand grew rapidly in 2017
China gas consumption has increased by 17% y-o-y for the first 9 months of 2017.
• Economic development:GDP grew by 6.9% y-o-y for Q1&Q2,6.8% for Q3
Gas consuming industries’(Steel, glass, chemical) markets
improved.
• Policy:Coal-to-gas projects surged driven by environmental policies
• Price:Alternative fuels prices increased
• Transmission line maintenance in Yangtze River Delta; less hydropower generation
25
30
60
70
10
15
20
25
30
40
50
60
%bcm
5
0
5
10
0
10
20
30
‐5 0
Q1Q2Q3Q4Q1Q2Q3Q4Q1Q2Q3Q4Q1Q2Q3Q4Q1Q2Q3Q4Q1Q2Q3Q4Q1Q2Q3Q4Q1Q2Q3
2010 2011 2012 2013 2014 2015 2016 2017
中国石油集团经济技术研究院| Page 4
Consumption Growth rate
IEEJ:November 2017 © IEEJ 2017

Domestic gas supply capacity kept growing
During 2000-2015, domestic gas production increased from 27 bcm to 132 bcm, with
average annual growth rate of 11%.g g
In 2016, domestic gas production grew by 1.6% y-o-y. • Total shale gas output raised to 7.9 bcm.
• CBM production was 4.5 bcm.
• Coal-based synthetic gas production was 1.6 bcm.
18.4 19.0 18.7 18 3 20160
7 9
11.5
18.4 18.3
16.0
11.2 9.4
8 1 101214161820
80
100
120
140
160
%m
Domestic gas production and total
gas supply (including coal-based
synthetic gas) grew by 10 9% and 7.9 7.7 7.2 6.2 6.6 6.5
8.1
4.7
1.6
0246810
0
20
40
60
80 %bc
synthetic gas) grew by 10.9% and
10.8% y-o-y for the first 9 months of
2017.00
2000
2001
2002
2003
2004
2005
2006
2007
2008
2009
2010
2011
2012
2013
2014
2015
2016
production growth rate
中国石油集团经济技术研究院| Page 5
China gas production 2000~2016
IEEJ:November 2017 © IEEJ 2017

Gas import growth rebounded greatly
Driven by lower import prices and delivery of new contracts, gas imports increased by19.1% y-o-y in 2016, with foreign dependence rate reaching 37%.
PNG imports: 38.4 bcm, grew by 13.3% y-o-y
LNG imports: 26.06 MT(27.3 bcm), grew by 32.6% y-o-y
China gas imports reached 57 6 bcm for the first 9 months of 2017 increased by 21% y-o-yChina gas imports reached 57.6 bcm for the first 9 months of 2017, increased by 21% y o y
PNG 31.5 bcm, grew by 7.7% y-o-y
LNG 33.3 bcm, grew by 35% y-o-y
321.7
250
300
350
60
70
80
Papua New Guinea8.2%
others4.4%
Nigeria1.0%
USA0.8%
126.9
84 7100
150
200
250
20
30
40
50
%bcm
Australia45.9%
Indonesia10 7%
Malaysia9.9%
8 %
14.8
65.6 84.7
35.0 25.0 12.3 3.5 19.1
0
50
0
10
20
2006 2007 2008 2009 2010 2011 2012 2013 2014 2015 2016
Qatar19.1%
10.7%
中国石油集团经济技术研究院| Page 6China gas import growth rate 2006~2016China LNG import sources in 2016Total Import Volume Growth Rate
IEEJ:November 2017 © IEEJ 2017

Infrastructure construction is moving forward steadily
Pipeline: natural gas trunk pipelines totaled over 70000 km
LNG terminals: 12 in operation, current import capacity 52.8 MTA by 2016.p , p p y y
3 new terminals under construction, + 1 for extension, total capacity will exceed 68 MTA
Tangshan(in 2013,6.5MT/a)Dalian phaseI (in 2011,3MT/a)PhaseII(under contruction,3MT/a)
Nanjiang(in 2013,2.2MT/a)
Nanggang(under construction,3MT/a)
Rudong Phase I(in 2011,3.5MT/a)Phase II(under construction,3MT/a)
Yangshan(in 2009 3MT/a)
Qingdao(in 2014,3MT/a)
Zhoushan(Under construction,3MT/a)
Qidong(in 2017,0.60MT/a)
Putian(in 2008,6.3MT/a)
Yangshan(in 2009,3MT/a)Ningbo phase I(in 2012,3MT/a)Phase II(under construction,3MT/a)
中国石油集团经济技术研究院| Page 7Beihai(in 2016,3MT/a)
Zhuhai(in 2013,3.5MT/a)
Dapeng(in 2006,6.80MT/a);Diefyu(under construction,4MT/a)
Jieyang(in 2017,2MT/a)
Yangpu (in 2014,3MT/a)
IEEJ:November 2017 © IEEJ 2017

Gas market reform accelerated—gas price liberalization
A
Average city-gate prices 2.09(lower
by 16 7%)
gas price liberalizationNegotiable city gate price with fertilizer producers; city-gate
prices liberalization trial in Fujian2016 11Non-residential city-gate prices decreasedby 0.7 RMB/CM; Negotiable non-
2015.11
Average city-gate
prices2.51
by 16.7%) 2016.11
Average city-gateresidential city gate price within price caps since 2016.11 (20% higher than the base prices)
2015.4
2014Average city-gate
g y gprices
Existing:2.47Incremental:2.96
Incremental gas city-gate prices decreased by 0.44 RMB/CM;
Existing gas city-gate ri in r d b
2014g y gprices
Existing:2.09Incremental:2.96 2017.8
The notification of lowering non-residential city gate prices
Existing gas city-gate prices increased by 0 4 RMB/CM
prices increased by 0.04 RMB/CM.
Two prices got in linewith each other.
2013Non-residential city gate prices were lowered by 0.1 RMB/CM since September 1st 2017
non residential city gate prices
2017 9Regulation from wellhead to city gate; 0.4 RMB/CMprice cap for existing gas,
0.4 RMB/CM 2017.9Market-oriented gas pricing
through trading hubs
中国石油集团经济技术研究院| Page 8
g g ,incremental gas prices linked to alternative fuels
IEEJ:November 2017 © IEEJ 2017
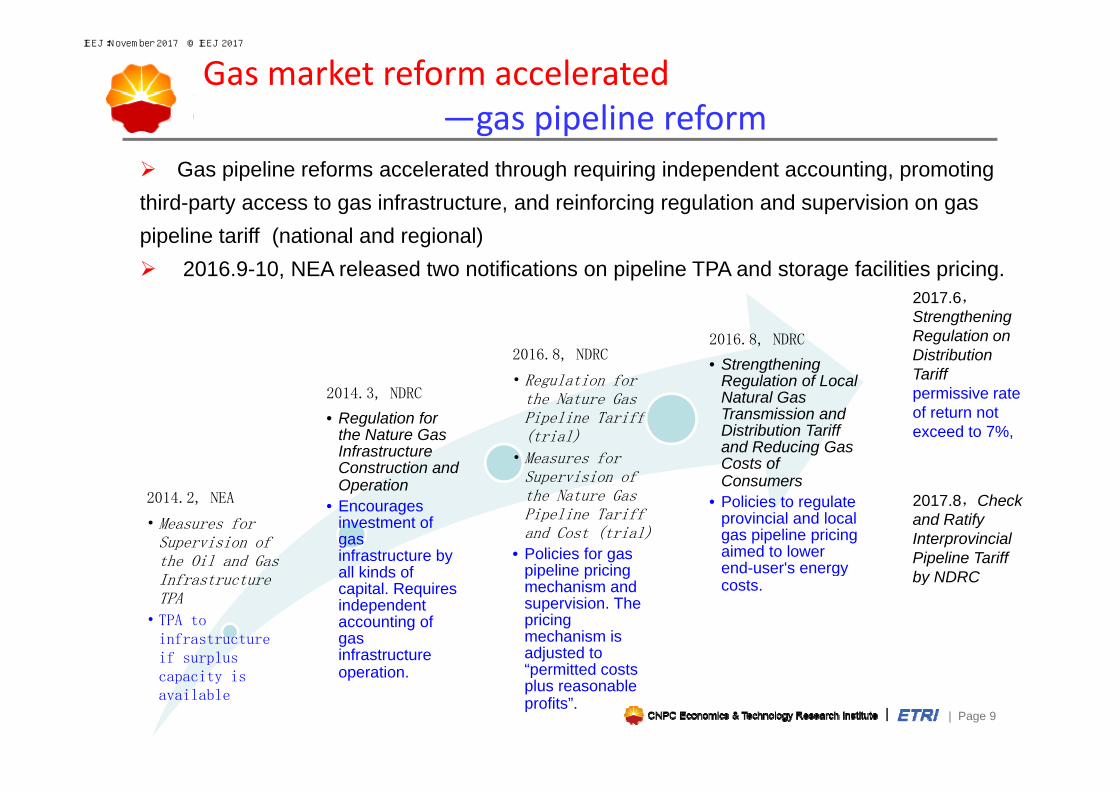
Gas market reform accelerated—gas pipeline reform
Gas pipeline reforms accelerated through requiring independent accounting, promoting third-party access to gas infrastructure, and reinforcing regulation and supervision on gas
gas pipeline reform
pipeline tariff (national and regional) 2016.9-10, NEA released two notifications on pipeline TPA and storage facilities pricing.
2017.6,
2014 3 NDRC
2016.8, NDRC
• Regulation for th N t G
2016.8, NDRC
• Strengthening Regulation of Local Natural Gas
StrengtheningRegulation onDistributionTariffpermissive rate2014.3, NDRC
• Regulation for the Nature Gas Infrastructure Construction and Operation
the Nature Gas Pipeline Tariff (trial)
• Measures for Supervision of
Natural Gas Transmission and Distribution Tariff and Reducing Gas Costs of Consumers
permissive rate of return not exceed to 7%,
2014.2, NEA
• Measures for Supervision of the Oil and Gas I f
Operation• Encourages
investment of gas infrastructure by all kinds of
the Nature Gas Pipeline Tariff and Cost (trial)
• Policies for gas pipeline pricing
Consumers• Policies to regulate
provincial and local gas pipeline pricing aimed to lower end-user's energy
2017.8,Check and Ratify Interprovincial Pipeline Tariff by NDRCInfrastructure
TPA
• TPA to infrastructure if surplus
all kinds of capital. Requires independent accounting of gas infrastructure
pipeline pricing mechanism and supervision. The pricing mechanism is adjusted to “ itt d t
gycosts. by NDRC
中国石油集团经济技术研究院| Page 9
capacity is available
operation. “permitted costs plus reasonable profits”.
IEEJ:November 2017 © IEEJ 2017

Gas market reform accelerated—establishment of gas trading exchange
Shanghai Petroleum and Gas Exchange formally started operation in November 2016
Trading volumes in 2016 reached 30 5 bcm (bilateral) PNG 27 9 bcm LNG 1 75 MT
establishment of gas trading exchange
Trading volumes in 2016 reached 30.5 bcm (bilateral), PNG 27.9 bcm, LNG 1.75 MT
LNG and PNG bidding started in July and September of 2017
More gas trading hubs are emerging in Chongqing, Xinjiang etc.
中国石油集团经济技术研究院| Page 10
IEEJ:November 2017 © IEEJ 2017

Gas market reform accelerated— increasing number of new players
Private companies including Guanghui, ENN etc are participating into LNG business.
Huadian, ENN, Beijing Gas, Guanghui have signed LNG importing contracts; ENN
increasing number of new players
showed interests to take 11.7% stakes of Santos, making it the largest shareholder of
the Australian company; Beijing Gas purchased 20% stakes of Rosneft in VChNG.
LNG importing contracts signed by Chinese buyers 2008-2016
中国石油集团经济技术研究院| Page 11
LNG importing contracts signed by Chinese buyers 2008 2016
IEEJ:November 2017 © IEEJ 2017

Challenges met by China gas market
Responsibility and emergency system for gas peak shaving are called for. As
l h d k ll d bcoal to gas switching drives gas consumption peak-valley difference bigger ,
inadequate gas peak shaving capacity is becoming a prominent problem. China
has 18 underground gas storages by 2016, with working gas 6.1 Bcm, accounting
for 3% of gas consumption.
Price regulation confines gas supply capacity.Foreign countries underground gas storage facilities
6
Country
Numberof
storagesWorkinggas Bcm
Maximumwithdrawal
volumes Bcm/d
Gasconsumptio
n Bcm
% of gas consumptio
n
S 400 133 3 34 759 4 1 63
4
5
6
ubic m
eter
US 400 133.7 3.34 759.4 17.6 Russia 24 69.6 0.74 409.2 17.0
Ukraine 13 32.2 0.29 38.4 83.9 Germany 53 24.6 0.64 70.9 34.7 Canada 61 23.2 0.36 104.2 22.3 0
1
2
g i g i
Yuan/cu
Italy 12 17 0.33 56.8 29.9 France 13 12.2 0.27 35.9 34.0
Netherlands 5 10.2 0.22 32.1 31.8 Austria 9 8.2 0.09 7.8 105.1
Australia 7 6.4 0.02 29.2 21.9Beijing
Shanghai
Nanjing
Xining
Urumch
i
Guangzh
ou
residential industrial fuel CNG for vehicle
中国石油集团经济技术研究院| Page 12
Australia 6.4 21.9
End user gas prices by major city
IEEJ:November 2017 © IEEJ 2017

Outline
I China Natural Gas Market Status
II China Natural Gas Market Outlook
中国石油集团经济技术研究院| Page 13
IEEJ:November 2017 © IEEJ 2017

Policies to promote China’s gas industry
Central government
Plan:Natural Gas 13th Five Year plan Energy 13th Five Year Plan Long TermPlan:Natural Gas 13 Five Year plan, Energy 13 Five Year Plan, Long Term
Oil and Gas Pipeline Network Planning
Price:Notifications on Strengthening Regulation on Distribution Tariff,
Lowering Non-residential City Gate Prices, etc
Environment:Air Pollution Control Action Plan for Beijing-Tianjin-Hebei
Area 2017-2018 etc.
Utilization:Suggestion of Promoting Gas Utilization, etc.
Others: Some Suggestions on Deepening Oil and Gas Industry Reform etcOthers: Some Suggestions on Deepening Oil and Gas Industry Reform, etc.
Local government
Actively carried out planning, policies on prices and utilizations.
中国石油集团经济技术研究院| Page 14
IEEJ:November 2017 © IEEJ 2017

Huge potential market
Strategic Action Plan for Energy Development, Natural Gas 13th Five Year
Plan Energy 13th Five Year Plan Suggestion of Promoting Gas UtilizationPlan, Energy 13 Five Year Plan ,Suggestion of Promoting Gas Utilization
targeted 10% by 2020 and 15% by 2030 for gas share in primary energy
consumption.
It is estimated that gas consumption will be 400 bcm by 2020 and 600 bcm by
2030.15.0 16
10.0 10
12
14
2.2 2.4 4.0
5.9
4
6
8%
2.2
0
2
2000 2005 2010 2015 2020 2030
中国石油集团经济技术研究院| Page 15
Share of gas in primary energy mix – planned goals by 2020 and 2030
IEEJ:November 2017 © IEEJ 2017

Key orientation of China gas demand
The major gas consuming sectors in China are city gas (40%), industrial (30%) , power
generation (15%) and chemical (15%)g ( ) ( )
Suggestion of Promoting Gas Utilization distributed by 13 national departments pointed
out four key utilization areas for gas: cities and towns, power generation, industrial fuels and
transportation.
• Distributive ti
• Residentialt i t generation
• Peak generation• Cogeneration
customers in town and rural areas
• Clean heating innorthern areas.
City and Power generatiC ty a d
towns generation
• Gas-fueled• Coal-to-gas in
Transportation
Industrial fuels
中国石油集团经济技术研究院| Page 1616
Gas-fueledvehicles
• Gas-fueled ships
Coal-to-gas inindustrial sector
IEEJ:November 2017 © IEEJ 2017

Gas supply capacity will increases steadily
It is expected that the supply capacity will be 340 bcm in 2020, with 220 bcm domestic
gas, and 120 bcm imported gas.
Supply capacity will be as much as 590 bcm in 2030, with domestic production of 390 bcm
and 200 bcm imported gas.
600
700 LNG import Pipeline import SNG
Shale gas CBM Conventional gas
20
130
70
400
500
m
16
50
30
80
4
34
65
27
60
200
300 bcm
95 124 170
240 4 4 1 4
34 13
0
100
2010 2015 2020 2030
中国石油集团经济技术研究院| Page 17
2010 2015 2020 2030
IEEJ:November 2017 © IEEJ 2017

Gas supply capacity will increases steadily
Shale gas technically recoverable resources totaled at 21.8 Tcm by 2015,
according to Ministry of Land and Resourcesaccording to Ministry of Land and Resources.
Major exploration and production companies include Sinopec, CNPC, Yanchang
Petroleum Group.
NEA’s Shale Gas Planning (2016-2020) targets shale gas production to reach
30 Bcm by 2020 and 80-100 Bcm by 2030.
Resource base:richresource and industrial
basePolicy:supportive national
Fiscal subsidies:0.4 RMB/CM 2012-2015,0.3 RMB/CM 2016 2018 0 2Policy:supportive national
development strategy and policy, independent mine
type
RMB/CM 2016-2018;0.2 RMB/CM 2019-2020
Lack of developmenttechnology for deep shale gas:exploration depth of
Investment intensive:Shale gas exploration andproduction requires huge
it l i t d l l d
中国石油集团经济技术研究院| Page 18
current technology < 3500meters
capital input and long lead time, thus makes investment risky
IEEJ:November 2017 © IEEJ 2017

Gas supply capacity will increases steadily
CBM has been developed steadily with surface production reaching 4.5 Bcm in 2016;
Surface production will lead future CBM growth as a result of increasing coal Surface production will lead future CBM growth as a result of increasing coal
mines closing down.
CBM production is expected to mount 24 Bcm by 2020, with surface production
reaching 10 Bcm (utilization rate > 90%) and coal mine methane production
reaching 140 Bcm (utilization rate > 50%).
F bl di i20
Favorable condition:
Supportive policy: subsidy standard
raises from 0.2 RMB/CM to 0.3 RMB/CM
d i 13th Fi Pl i d
15 S urface developm ent D ow nhole extraction
during 13th Five-year Plan period.
Restraining factors:
Mine rights, geological conditions, 7.2 7.6
9.2 9.9 12.6
13.3 13.6 12.8
5
10
bcm
technology and equipments, reform
process.
0.0 0.1 0.4 0.8 1.0 1.6 2.3 2.6 3.0 3.7 4.4 4.5 2.3 2.5
4.7 5.8
7.2
0 2005 2006 2007 2008 2009 2010 2011 2012 2013 2014 2015 2016
中国石油集团经济技术研究院| Page 19China CBM production 2005-2016
IEEJ:November 2017 © IEEJ 2017

Thank You
CNPC Economics & Technology Research Institute, ETRI
中国石油集团经济技术研究院| Page 20
IEEJ:November 2017 © IEEJ 2017
Contact: [email protected]