Embed Size (px)
Citation preview
Infrared Spectroscopy
x-rays ultraviolet(UV) visible Infrared
(IR) microwaves radiowaves
near IR far IRmiddle IR
λ (cm)µ
ν (cm-1)
8 x 10⁻⁵
0.813,000
2.5 x 10⁻⁴
2.54,000
2.5 x 10⁻³
25400
2.5 x 10⁻²
25040
E = 1-10 kcal/mol
bond vibrations
stretching&
bending
- changes in bond lengths
- changes in bond angles
ν (cm-1) = 1λ (cm)
µ = micron (older unit)
ν (cm-1) = 1λ (µm) x 10,000
C H HO
C
stretching bending
Infrared Spectroscopy
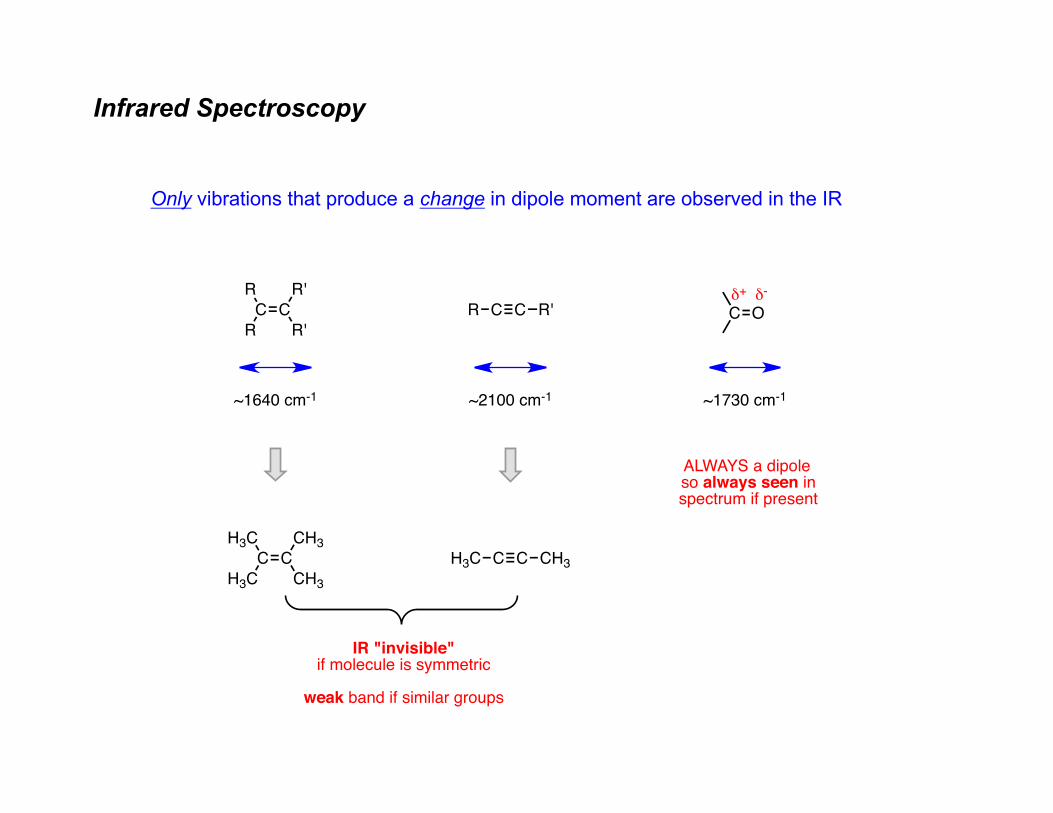
Only vibrations that produce a change in dipole moment are observed in the IR
C C C C C OR'
R'R
RR'R
δ+ δ-
C CCH3
CH3H3C
H3CC C CH3H3C
~1640 cm-1 ~2100 cm-1 ~1730 cm-1
IR "invisible"if molecule is symmetric
weak band if similar groups
ALWAYS a dipoleso always seen in spectrum if present
Infrared Spectroscopy
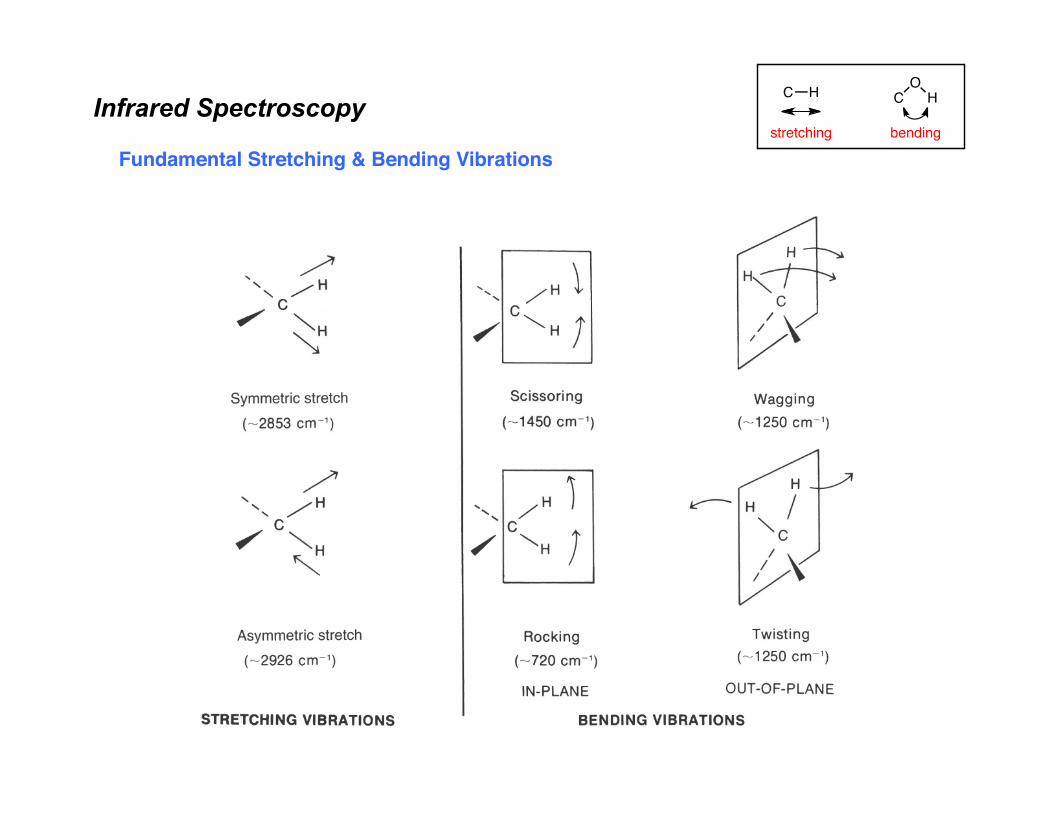
Fundamental Stretching & Bending Vibrations
C H HO
C
stretching bending
Infrared Spectroscopy
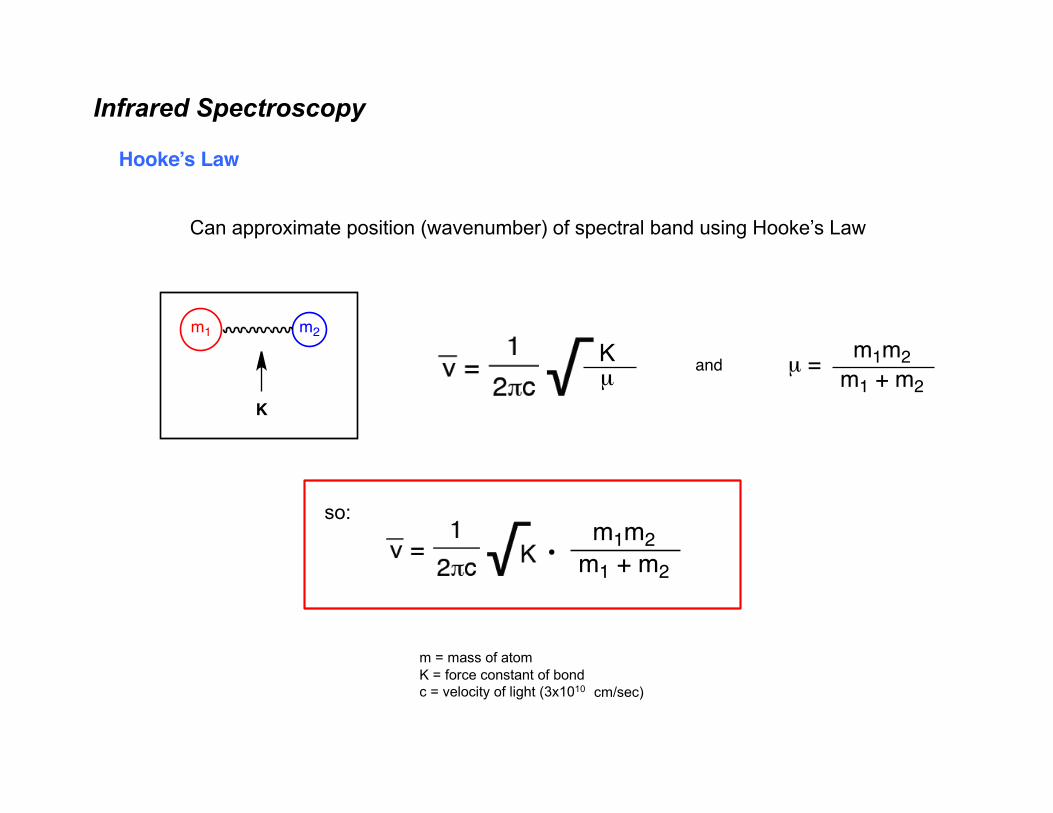
Hooke’s Law
Kµ
m1 m2
K
m1m2m1 + m2
µ =and
so:
m = mass of atomK = force constant of bondc = velocity of light (3x1010 cm/sec)
Can approximate position (wavenumber) of spectral band using Hooke’s Law
m1m2m1 + m2
•
Infrared Spectroscopy
Hooke’s Law
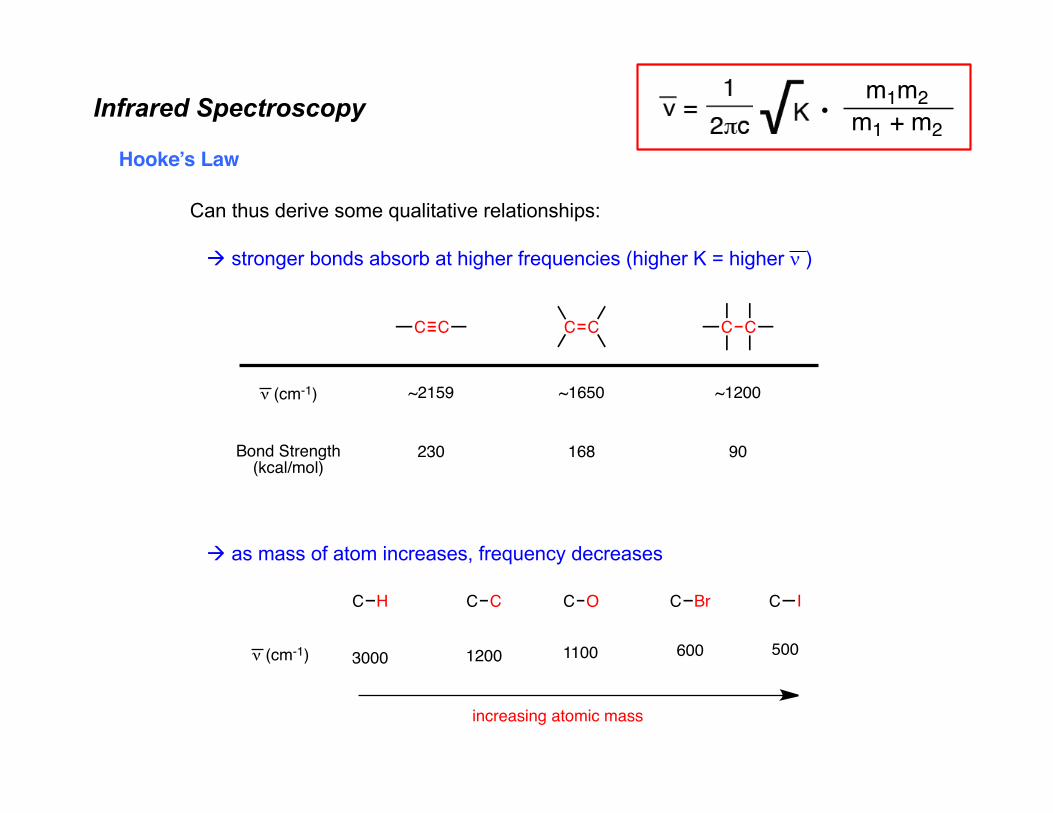
Can thus derive some qualitative relationships:
à stronger bonds absorb at higher frequencies (higher K = higher n )
à as mass of atom increases, frequency decreases
C CC C C C
Bond Strength(kcal/mol)
ν (cm-1)
230 168 90
~2159 ~1650 ~1200
C H C C C O C Br C I
3000 1200 1100 600 500ν (cm-1)
increasing atomic mass
m1m2m1 + m2
•
Infrared Spectroscopy
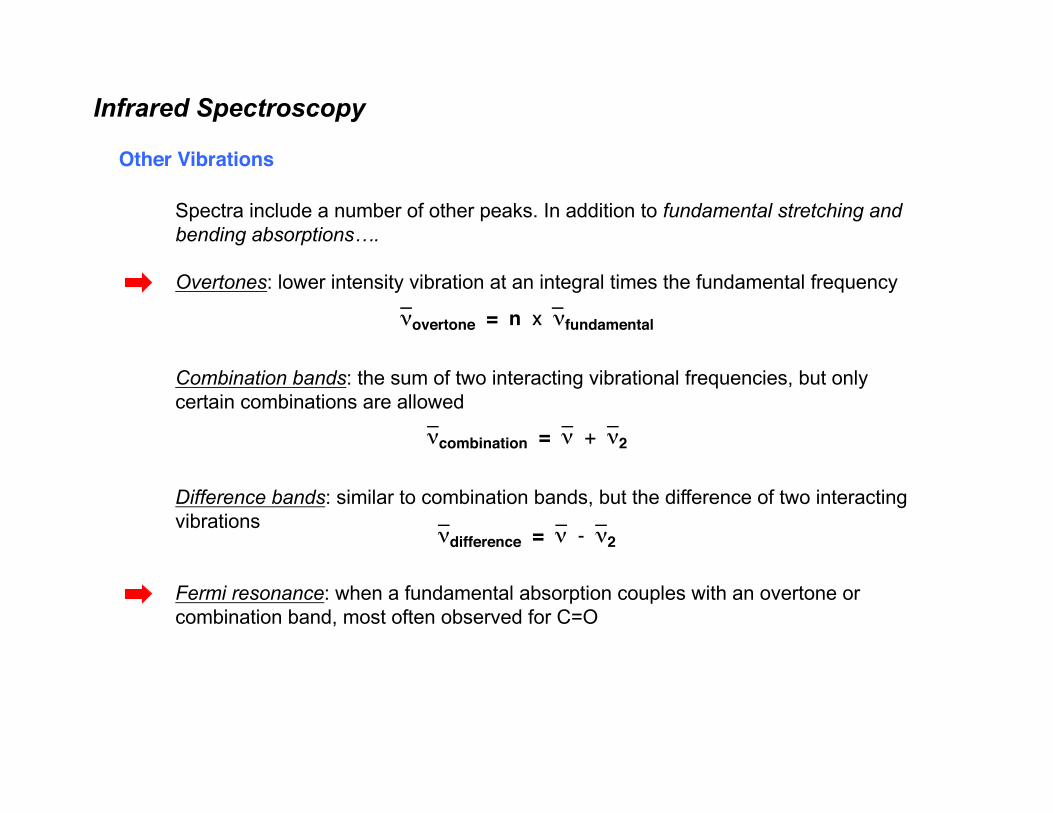
Other Vibrations
Spectra include a number of other peaks. In addition to fundamental stretching and bending absorptions….
Overtones: lower intensity vibration at an integral times the fundamental frequency
Combination bands: the sum of two interacting vibrational frequencies, but only certain combinations are allowed
Difference bands: similar to combination bands, but the difference of two interacting vibrations
Fermi resonance: when a fundamental absorption couples with an overtone or combination band, most often observed for C=O
νovertone = n x νfundamental
νcombination = ν + ν2
νdifference = ν - ν2
Infrared Spectroscopy
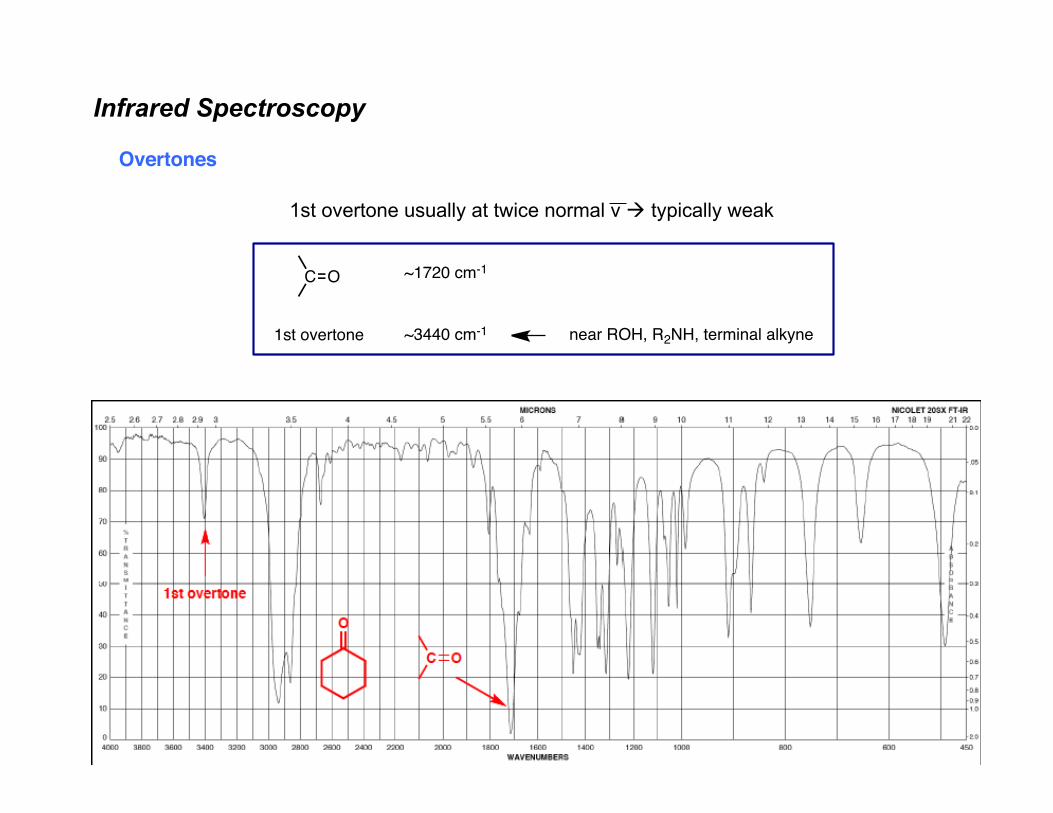
Overtones
1st overtone usually at twice normal ν à typically weak
C O ~1720 cm-1
~3440 cm-1 near ROH, R2NH, terminal alkyne1st overtone
Infrared Spectroscopy
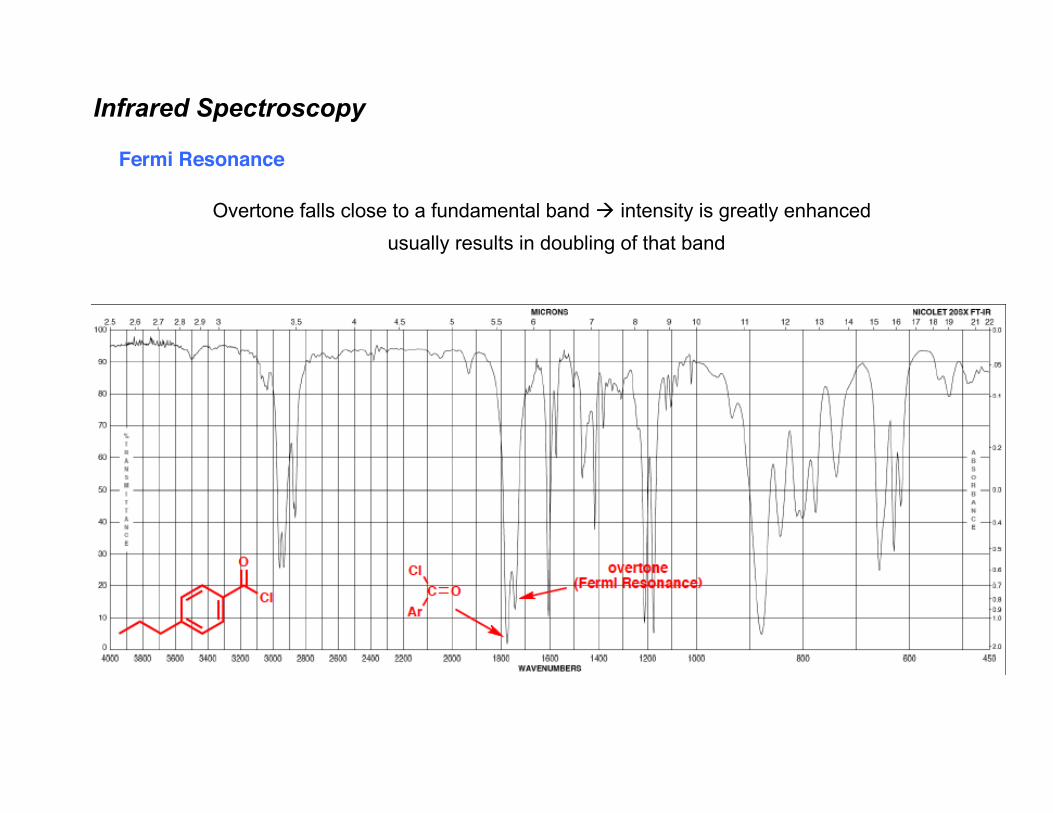
Fermi Resonance
Overtone falls close to a fundamental band à intensity is greatly enhancedusually results in doubling of that band
Infrared Spectroscopy
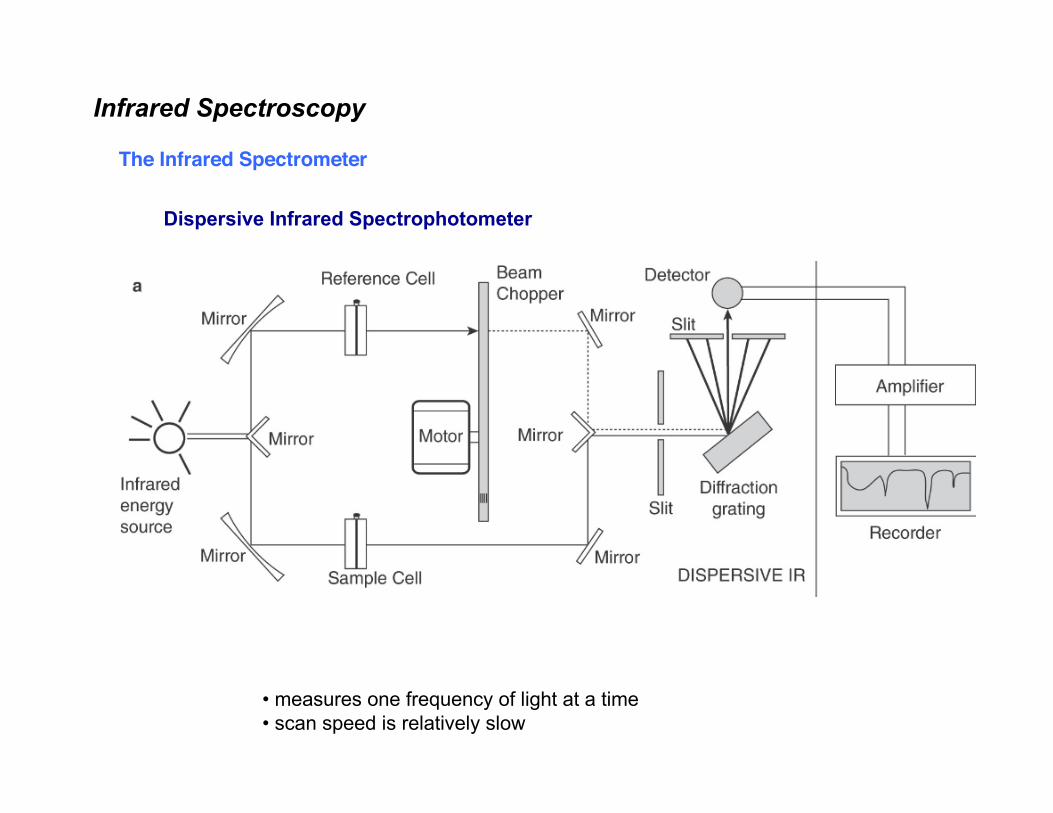
The Infrared Spectrometer
Dispersive Infrared Spectrophotometer
• measures one frequency of light at a time• scan speed is relatively slow
Infrared Spectroscopy
The Infrared Spectrometer
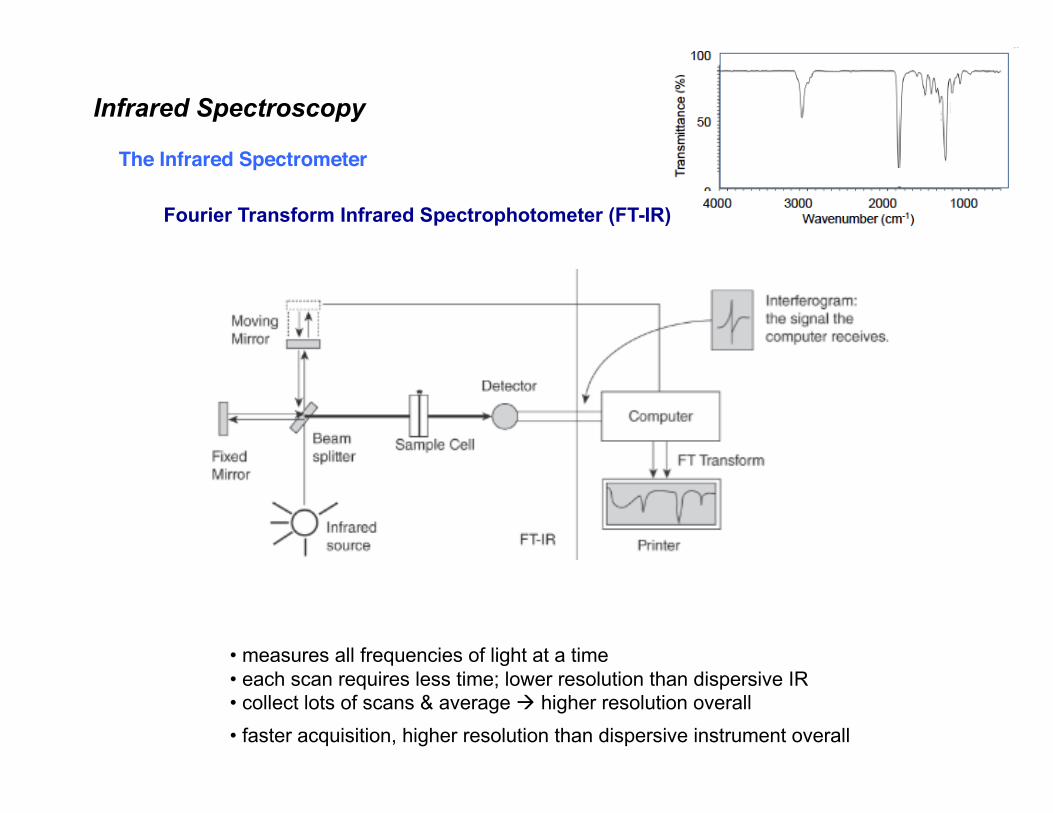
Fourier Transform Infrared Spectrophotometer (FT-IR)
• measures all frequencies of light at a time• each scan requires less time; lower resolution than dispersive IR• collect lots of scans & average à higher resolution overall• faster acquisition, higher resolution than dispersive instrument overall
Infrared Spectroscopy
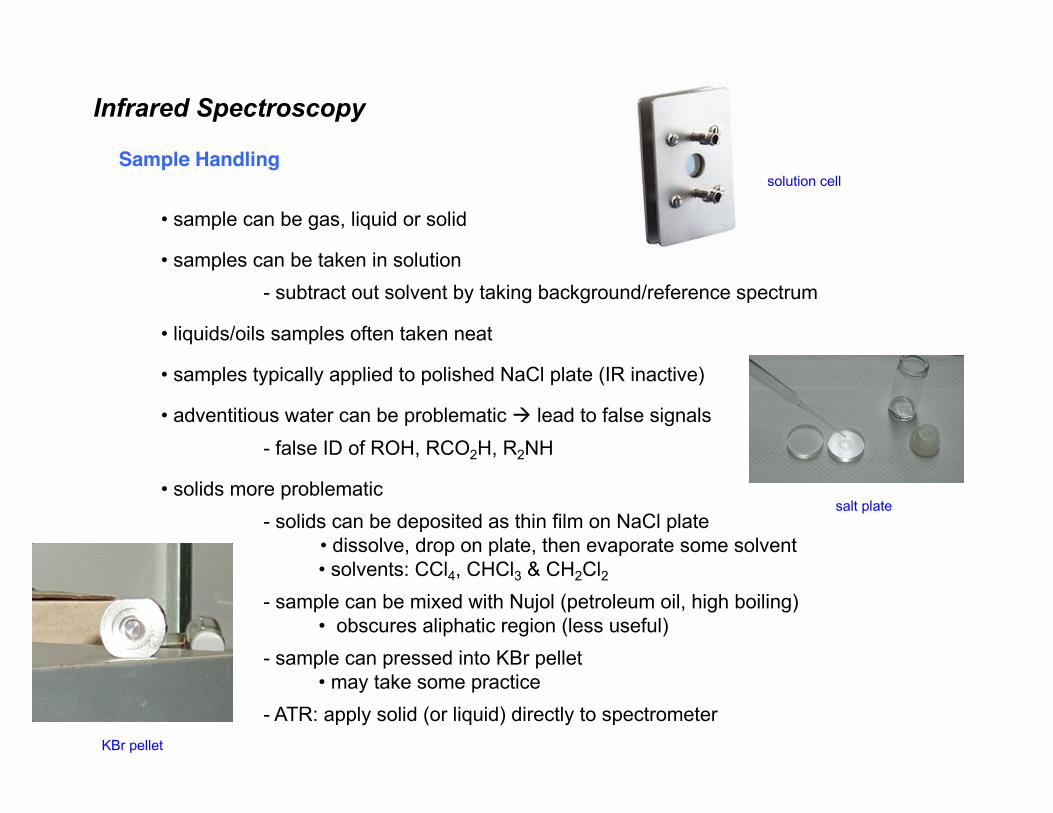
Sample Handling
• sample can be gas, liquid or solid
• samples can be taken in solution- subtract out solvent by taking background/reference spectrum
• liquids/oils samples often taken neat
• samples typically applied to polished NaCl plate (IR inactive)
• adventitious water can be problematic à lead to false signals- false ID of ROH, RCO2H, R2NH
• solids more problematic- solids can be deposited as thin film on NaCl plate
• dissolve, drop on plate, then evaporate some solvent• solvents: CCl4, CHCl3 & CH2Cl2
- sample can be mixed with Nujol (petroleum oil, high boiling)• obscures aliphatic region (less useful)
- sample can pressed into KBr pellet• may take some practice
- ATR: apply solid (or liquid) directly to spectrometer
solution cell
salt plate
KBr pellet
Infrared Spectroscopy
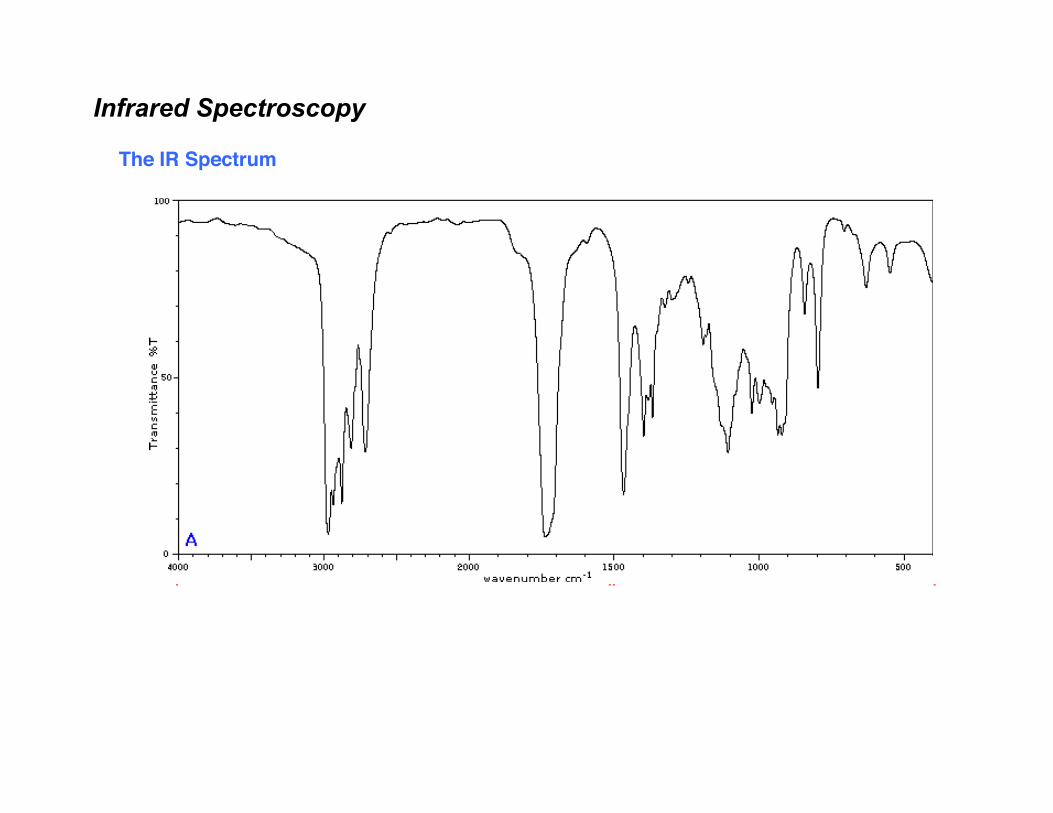
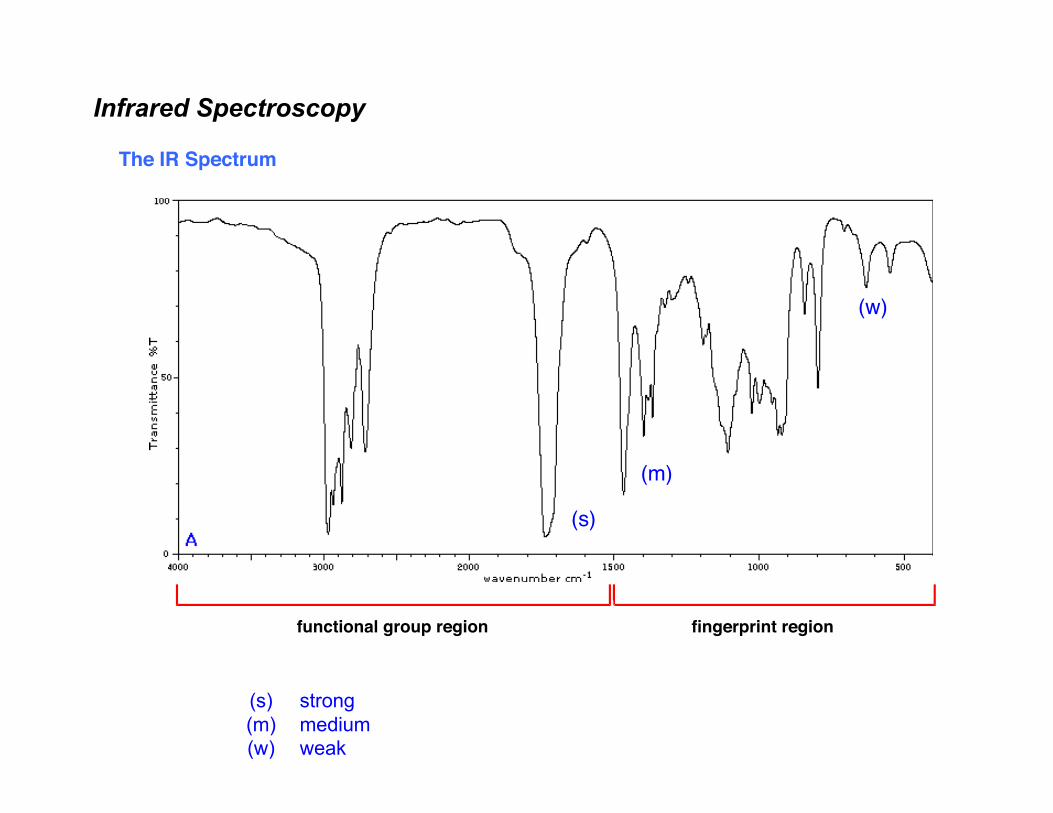
The IR Spectrum
(s)
(m)
(w)
fingerprint regionfunctional group region
Infrared Spectroscopy
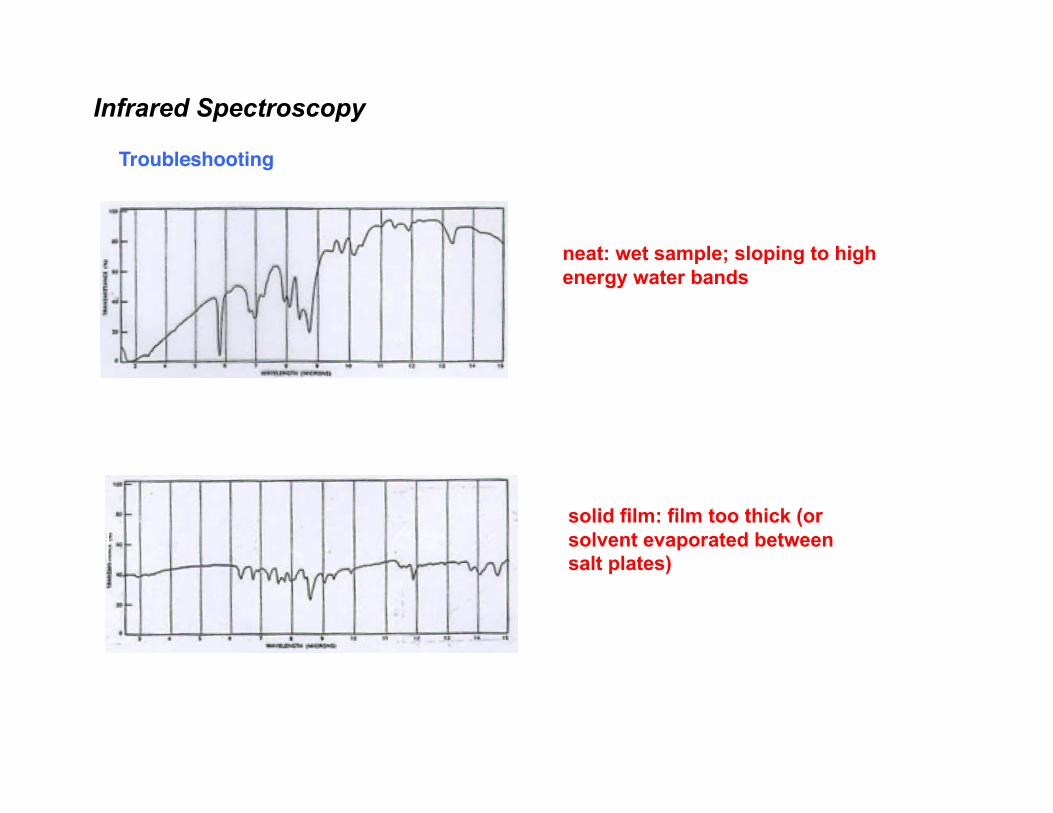
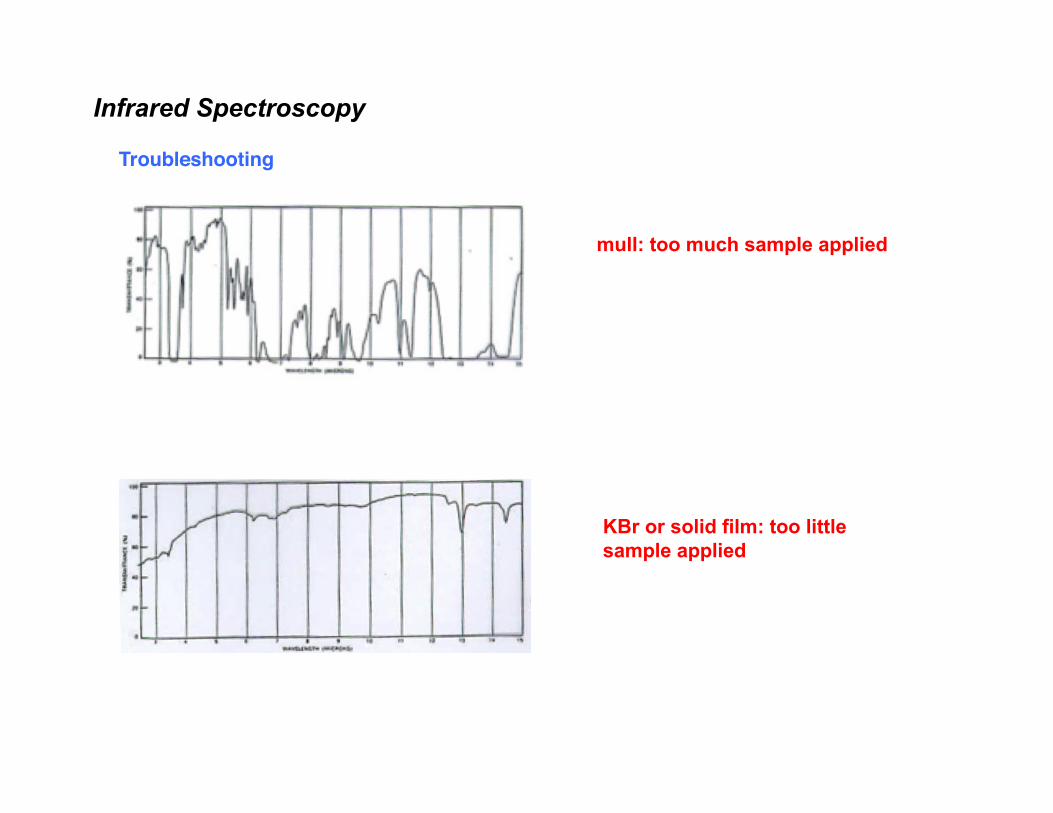
Troubleshooting
neat: wet sample; sloping to highenergy water bands
solid film: film too thick (or solvent evaporated betweensalt plates)
Infrared Spectroscopy
Troubleshooting
mull: too much sample applied
KBr or solid film: too little sample applied
Infrared Spectroscopy
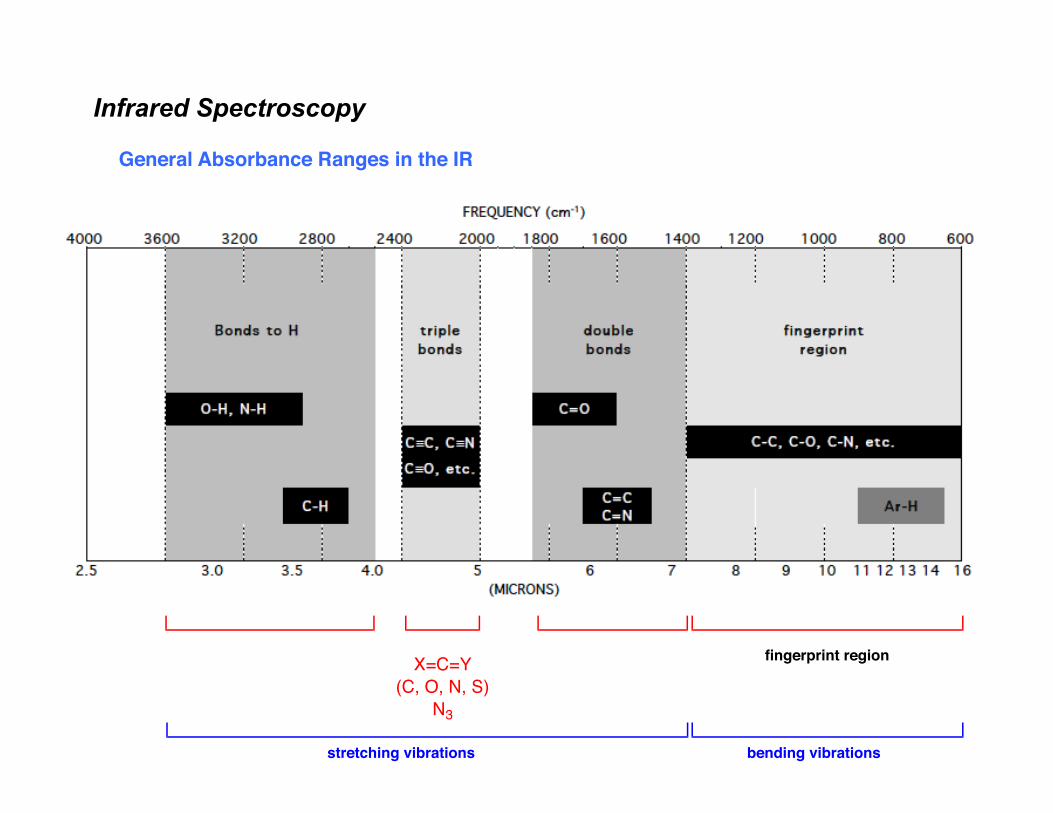
General Absorbance Ranges in the IR
X=C=Y(C, O, N, S)
N3
stretching vibrations bending vibrations
fingerprint region
Infrared Spectroscopy
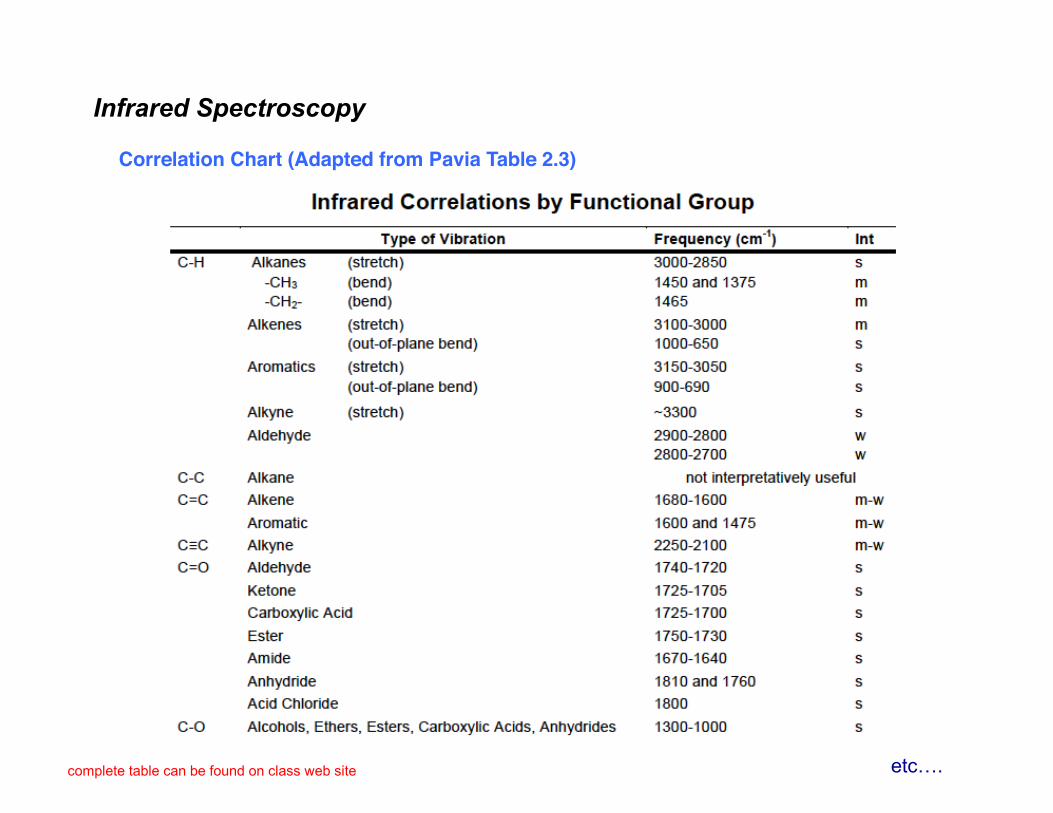
Correlation Chart (Adapted from Pavia Table 2.3)
etc….complete table can be found on class web site
Infrared Spectroscopy
The IR Spectrum
(s)(m)(w)
strongmediumweak
(s)
(m)
(w)
fingerprint regionfunctional group region
Infrared Spectroscopy
Alkanes
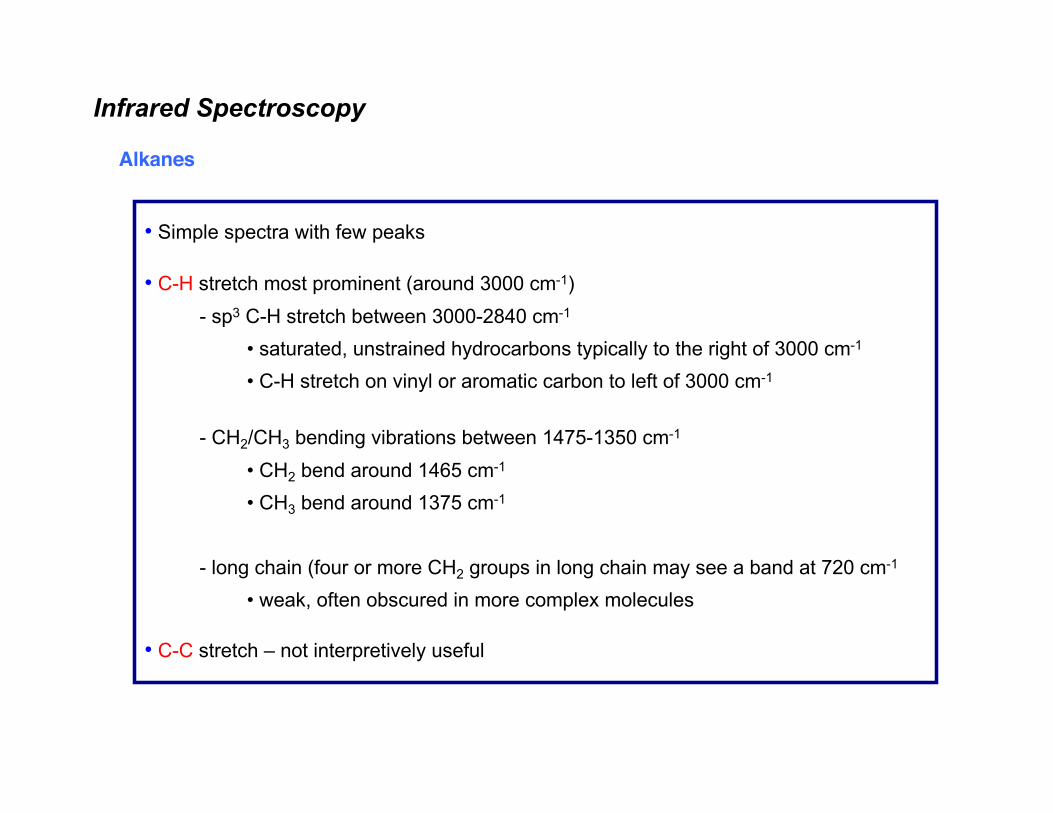
• Simple spectra with few peaks
• C-H stretch most prominent (around 3000 cm-1)- sp3 C-H stretch between 3000-2840 cm-1
• saturated, unstrained hydrocarbons typically to the right of 3000 cm-1
• C-H stretch on vinyl or aromatic carbon to left of 3000 cm-1
- CH2/CH3 bending vibrations between 1475-1350 cm-1
• CH2 bend around 1465 cm-1
• CH3 bend around 1375 cm-1
- long chain (four or more CH2 groups in long chain may see a band at 720 cm-1
• weak, often obscured in more complex molecules
• C-C stretch – not interpretively useful
Infrared Spectroscopy
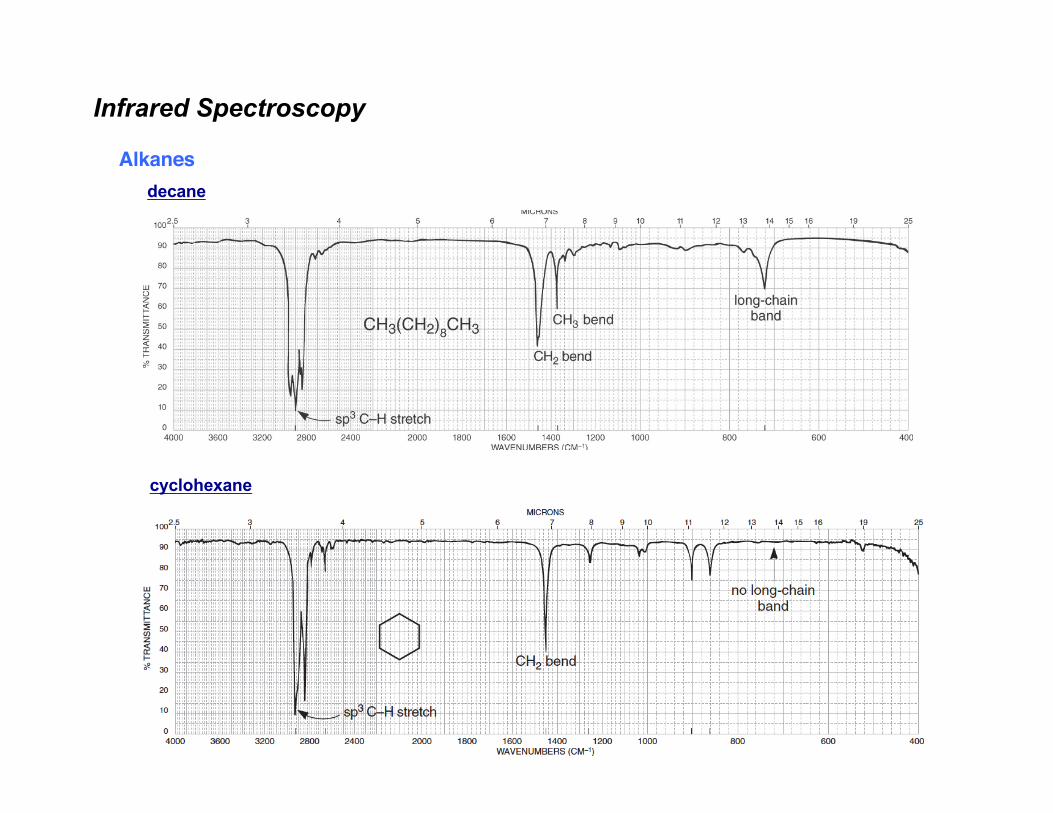
Alkanesdecane
cyclohexane
Infrared Spectroscopy
Alkanes
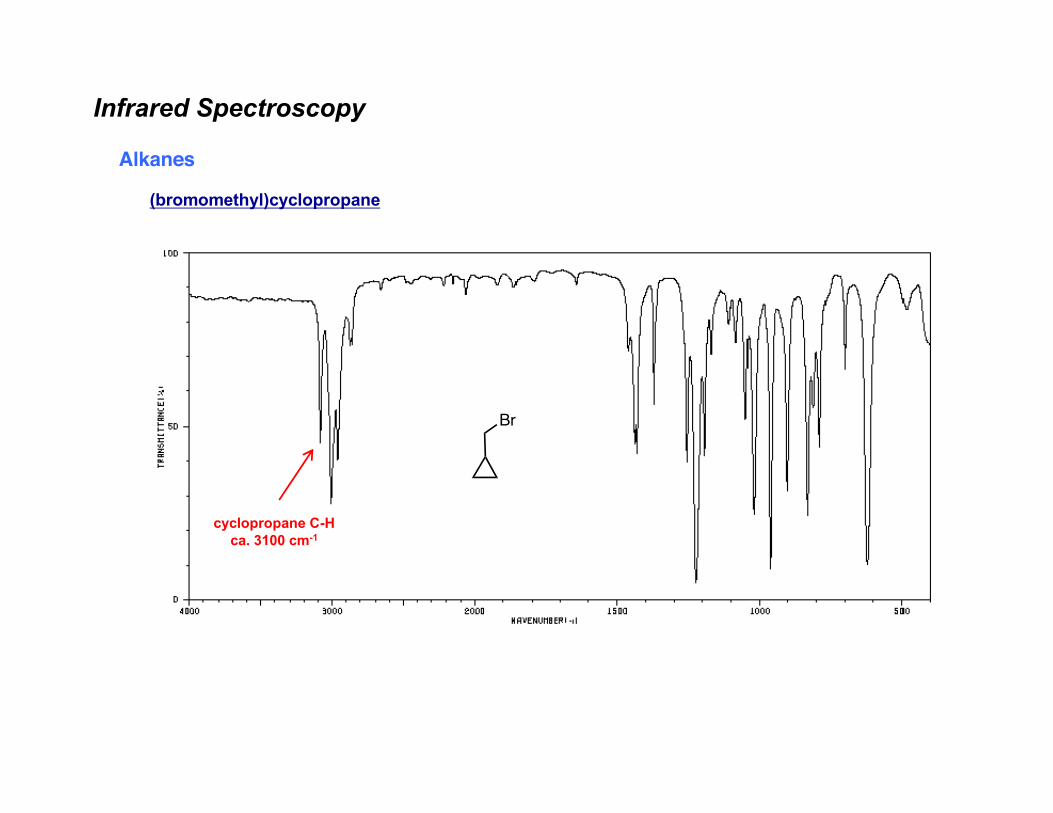
(bromomethyl)cyclopropane
Br
cyclopropane C-Hca. 3100 cm-1
Infrared Spectroscopy
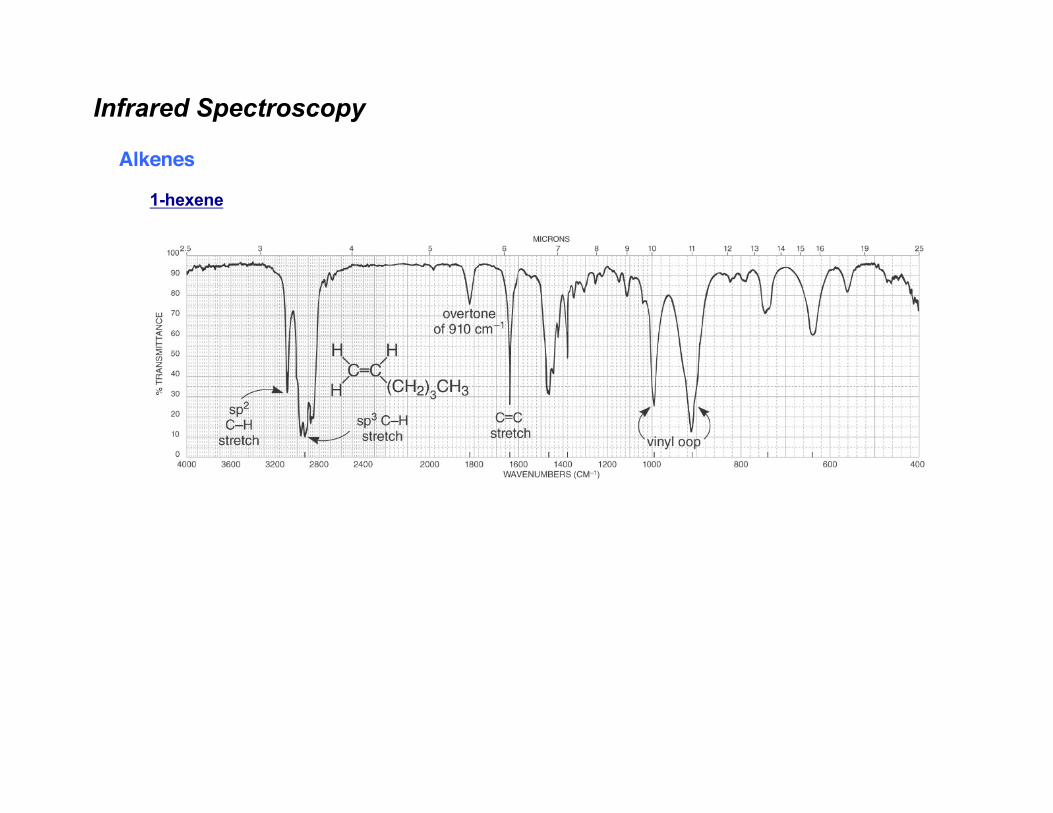
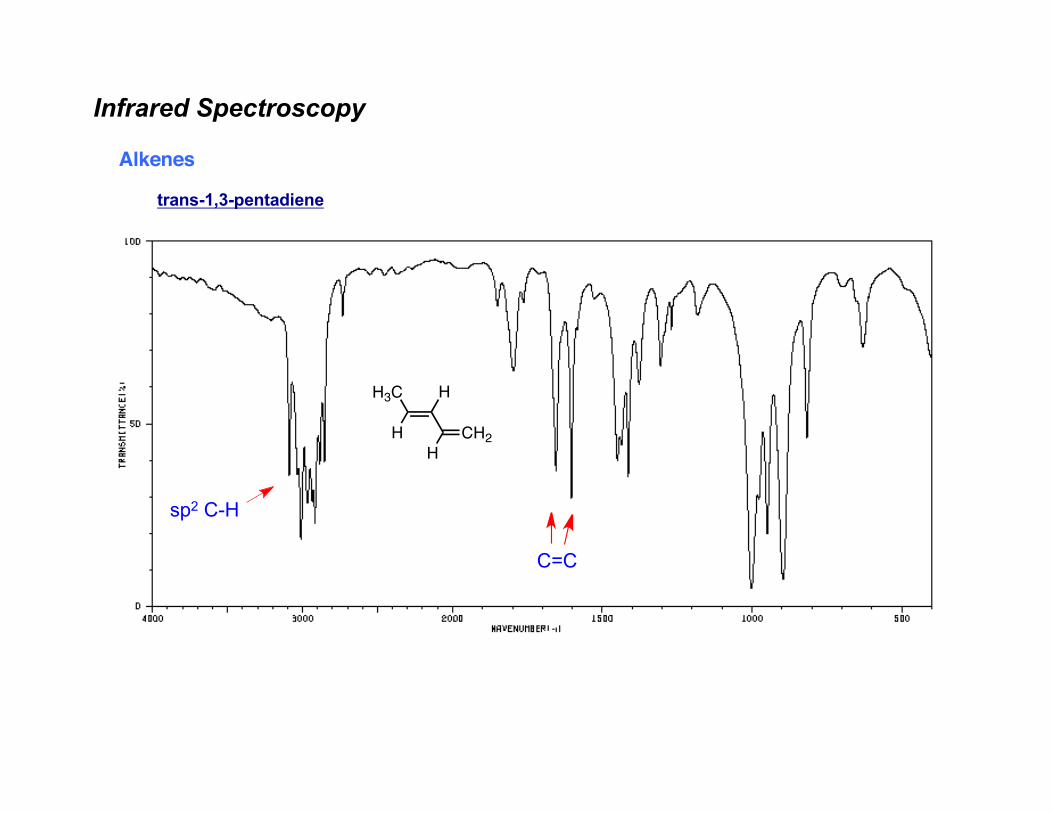
Alkenes
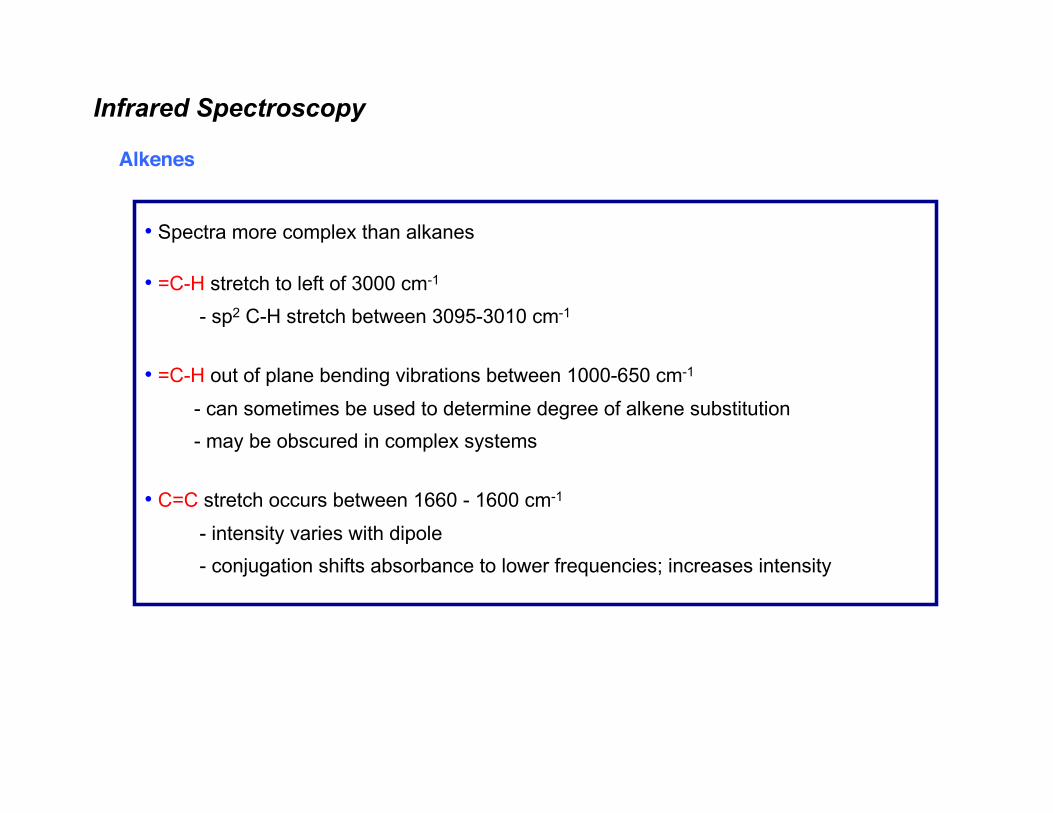
• Spectra more complex than alkanes
• =C-H stretch to left of 3000 cm-1
- sp2 C-H stretch between 3095-3010 cm-1
• =C-H out of plane bending vibrations between 1000-650 cm-1
- can sometimes be used to determine degree of alkene substitution- may be obscured in complex systems
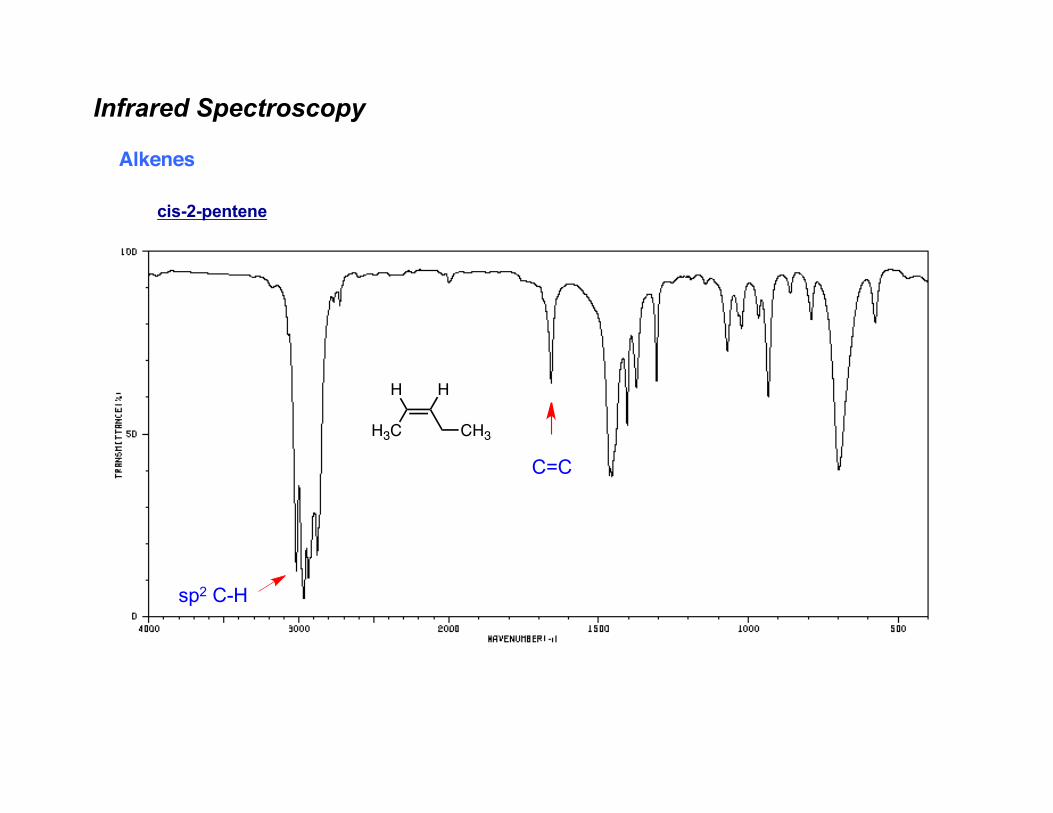
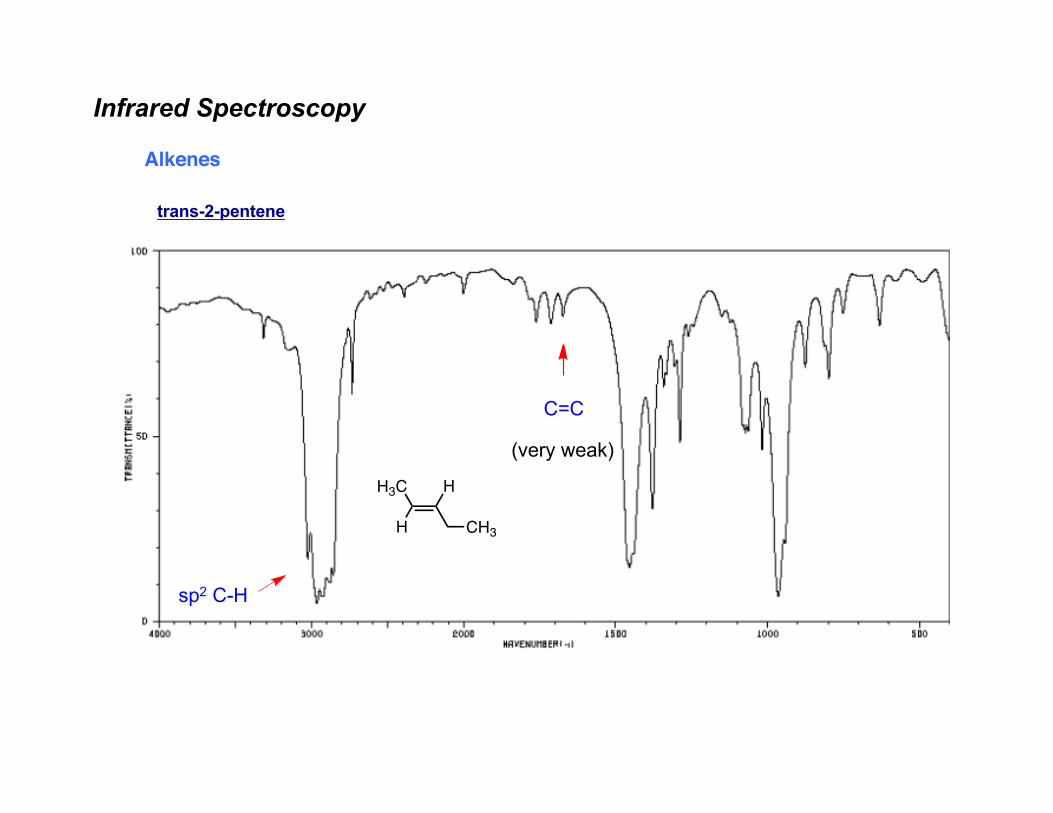
• C=C stretch occurs between 1660 - 1600 cm-1
- intensity varies with dipole - conjugation shifts absorbance to lower frequencies; increases intensity
Infrared Spectroscopy
Alkenes
1-hexene
Infrared Spectroscopy
Alkenes
cis-2-pentene
C=C
sp2 C-H
CH3H3C
H H
Infrared Spectroscopy
Alkenes
trans-2-pentene
C=C
sp2 C-H
(very weak)
CH3
H3C
H
H
Infrared Spectroscopy
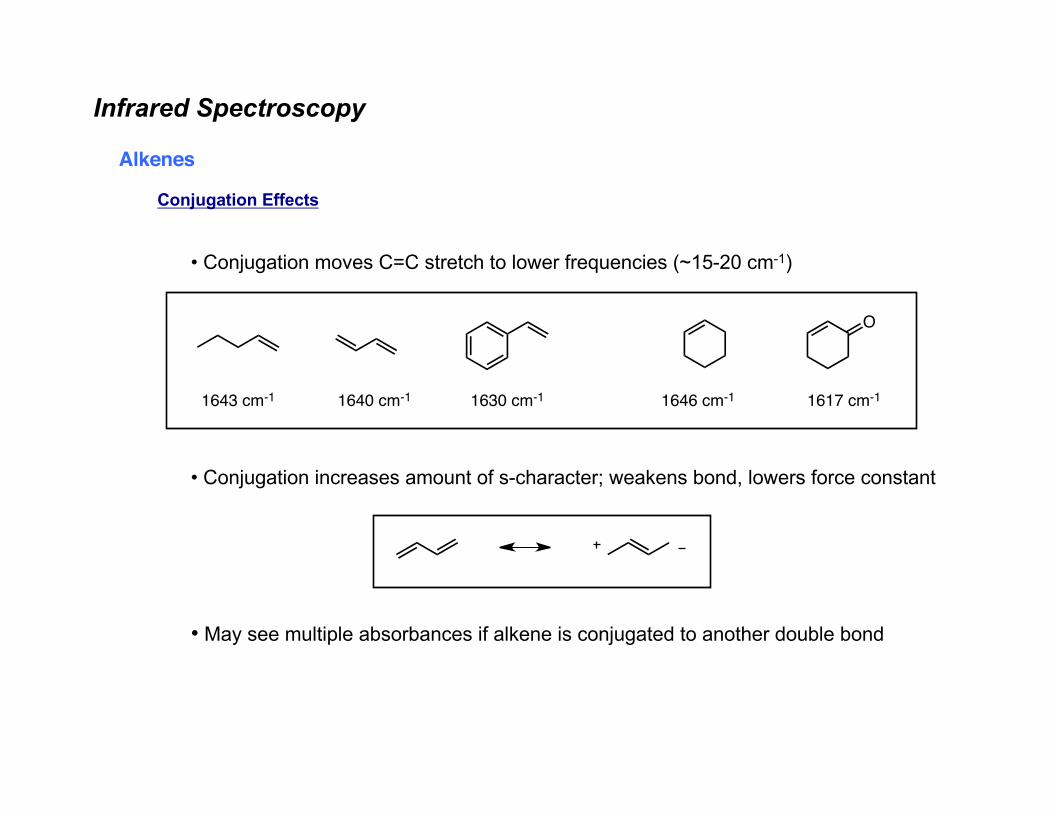
Alkenes
Conjugation Effects
• Conjugation moves C=C stretch to lower frequencies (~15-20 cm-1)
• Conjugation increases amount of s-character; weakens bond, lowers force constant
• May see multiple absorbances if alkene is conjugated to another double bond
1630 cm-11640 cm-11643 cm-1
O
1617 cm-11646 cm-1
Infrared Spectroscopy
Alkenes
trans-1,3-pentadiene
CH2
H3C
H
H
H
C=C
sp2 C-H
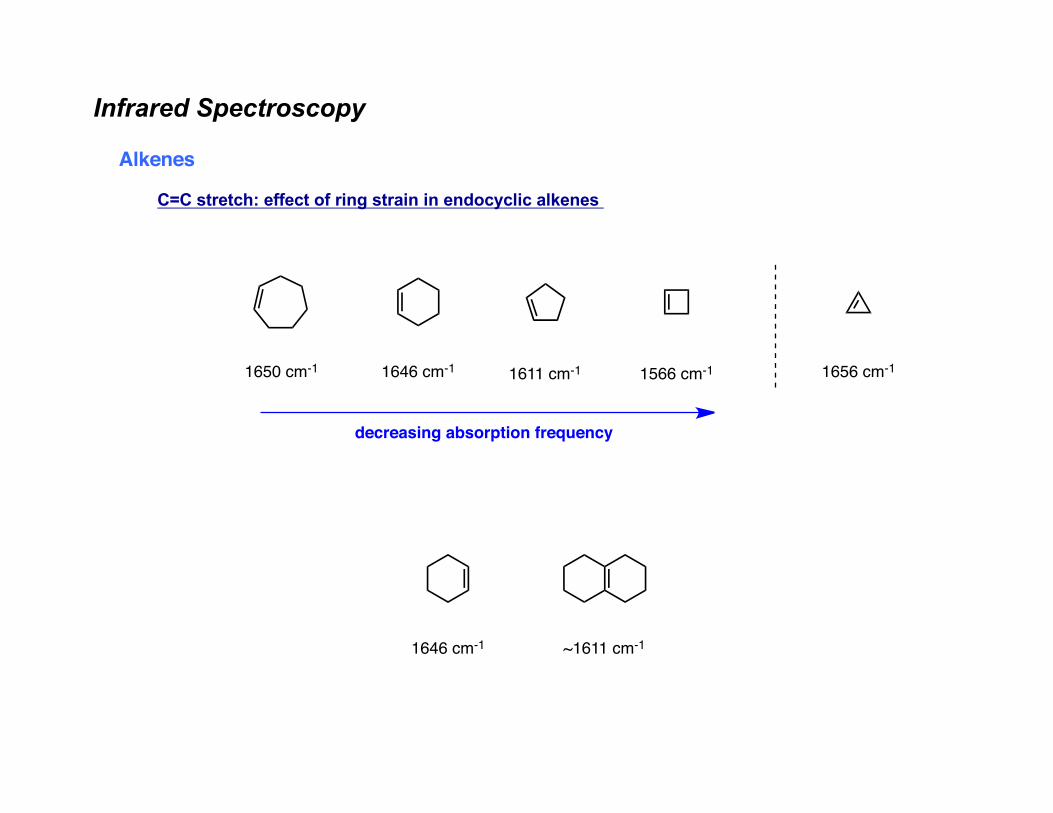
Infrared Spectroscopy
Alkenes
C=C stretch: effect of ring strain in endocyclic alkenes
1646 cm-11650 cm-1 1656 cm-11566 cm-11611 cm-1
decreasing absorption frequency
1646 cm-1 ~1611 cm-1
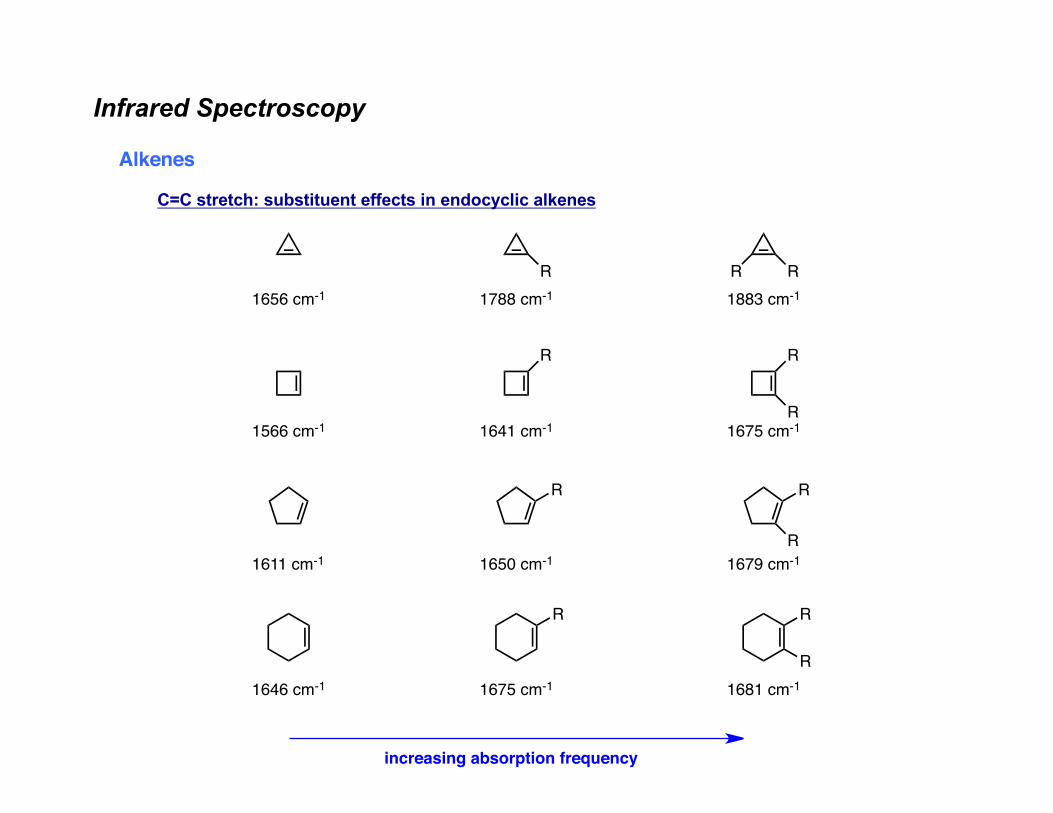
Infrared Spectroscopy
Alkenes
C=C stretch: substituent effects in endocyclic alkenes
1646 cm-1
1656 cm-1
1566 cm-1
1611 cm-1
1675 cm-1
1788 cm-1
1641 cm-1
1650 cm-1
1681 cm-1
1883 cm-1
1675 cm-1
1679 cm-1
R RR
R R
R
R
R
R
R
R
R
increasing absorption frequency
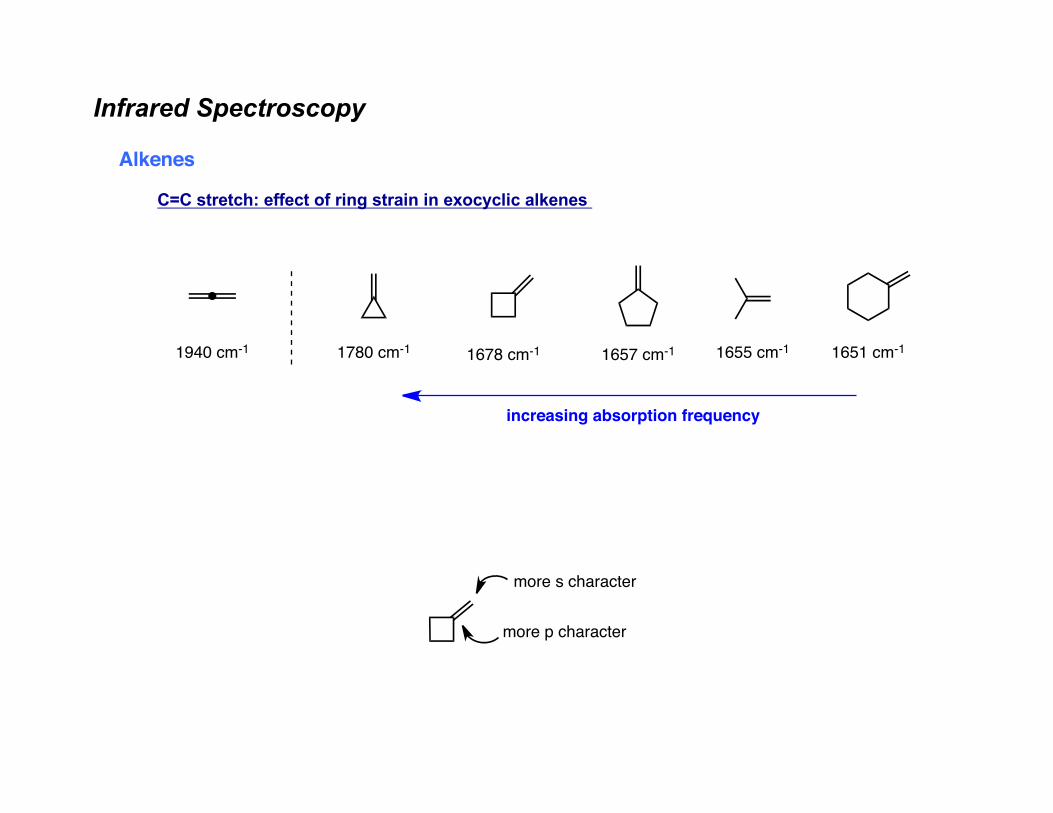
Infrared Spectroscopy
Alkenes
C=C stretch: effect of ring strain in exocyclic alkenes
1651 cm-11940 cm-1 1780 cm-1 1678 cm-1 1657 cm-1
increasing absorption frequency
1655 cm-1
more s character
more p character
Infrared Spectroscopy
Alkenes
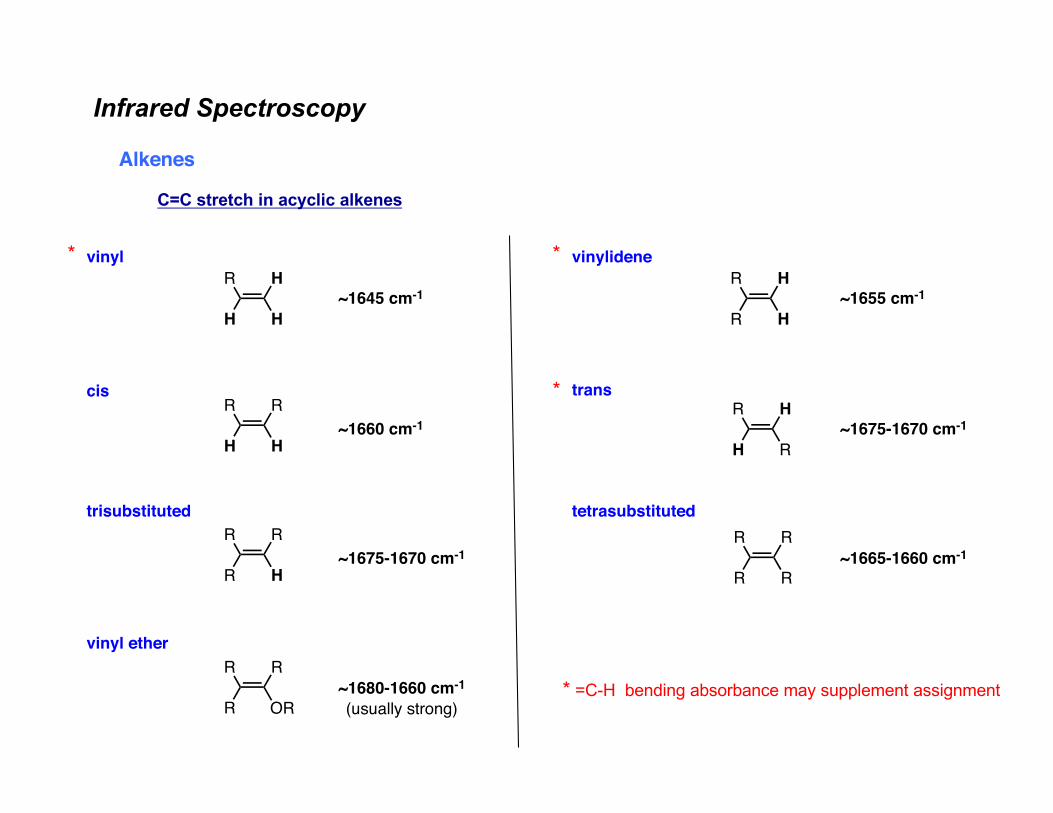
C=C stretch in acyclic alkenes
H
HR
H
H
RR
H
H
RR
R
H
HR
R
R
HR
H
R
RR
R
~1645 cm-1
~1660 cm-1
~1675-1670 cm-1
~1655 cm-1
~1675-1670 cm-1
~1665-1660 cm-1
OR
RR
R~1680-1660 cm-1
(usually strong)
vinyl
cis
trisubstituted
vinylidene
trans
tetrasubstituted
vinyl ether
* *
*
* =C-H bending absorbance may supplement assignment
Infrared Spectroscopy
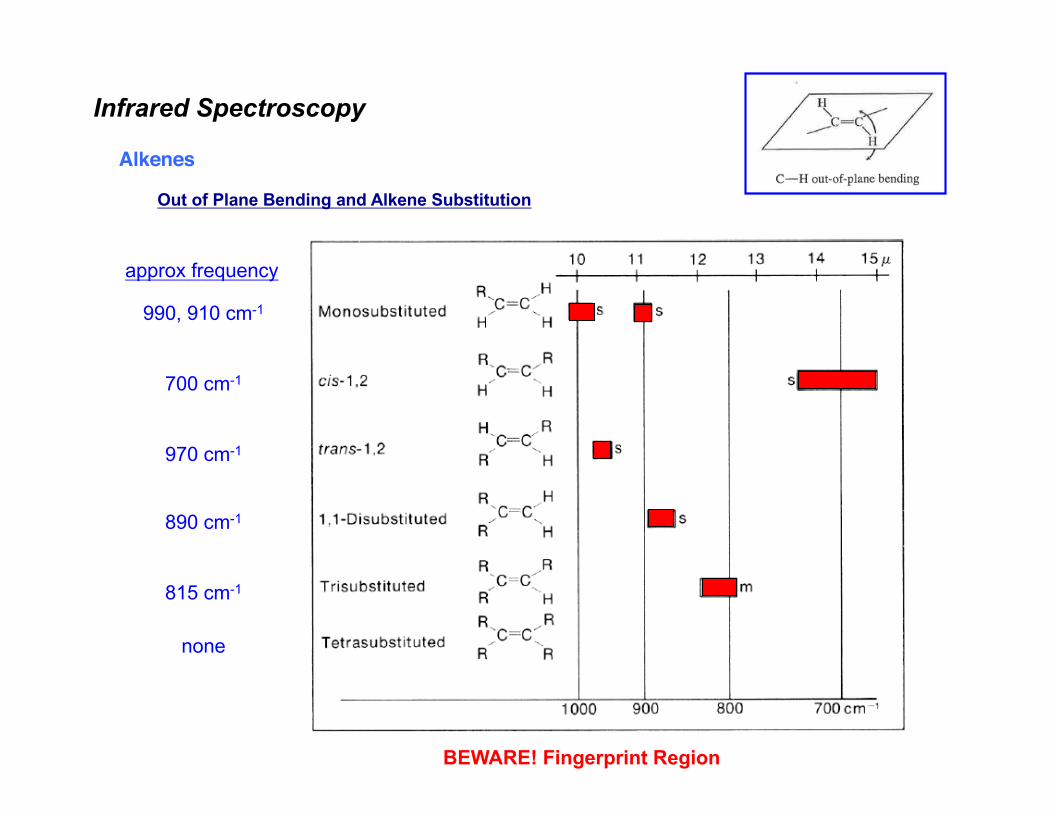
Alkenes
Out of Plane Bending and Alkene Substitution!
990, 910 cm-1
700 cm-1
970 cm-1
890 cm-1
815 cm-1
none
approx frequency
BEWARE! Fingerprint Region
Infrared Spectroscopy
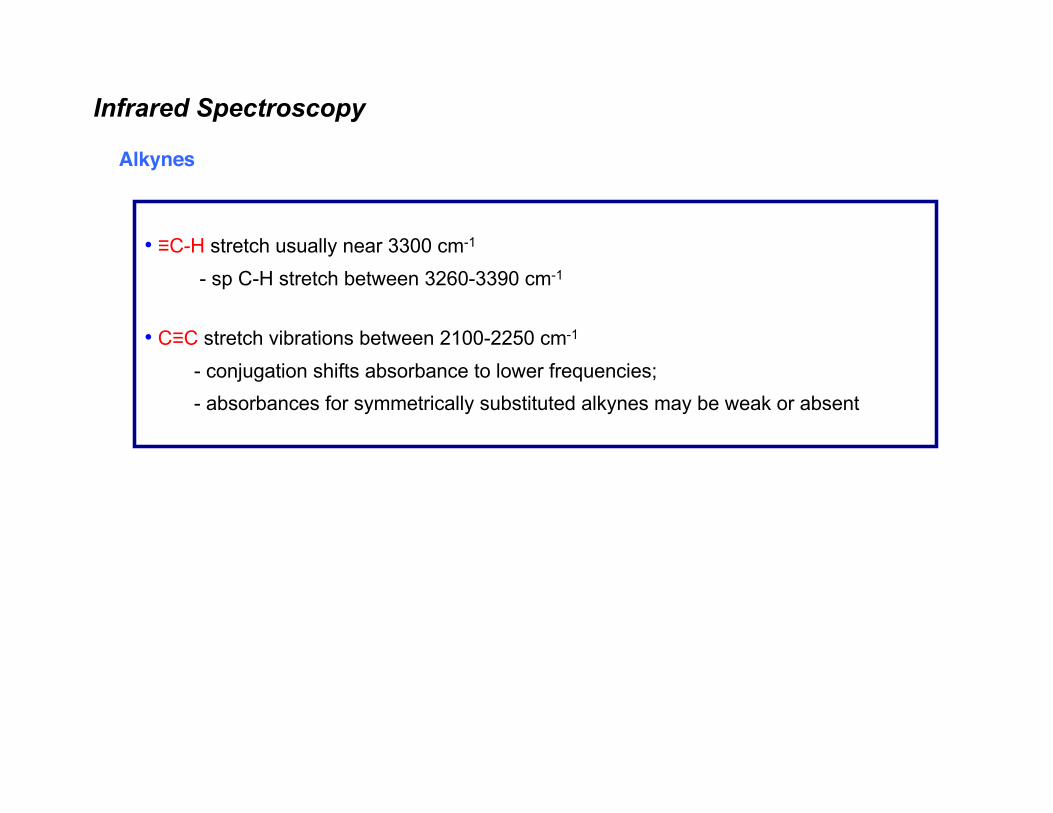
Alkynes
• ≡C-H stretch usually near 3300 cm-1
- sp C-H stretch between 3260-3390 cm-1
• C≡C stretch vibrations between 2100-2250 cm-1
- conjugation shifts absorbance to lower frequencies; - absorbances for symmetrically substituted alkynes may be weak or absent
Infrared Spectroscopy
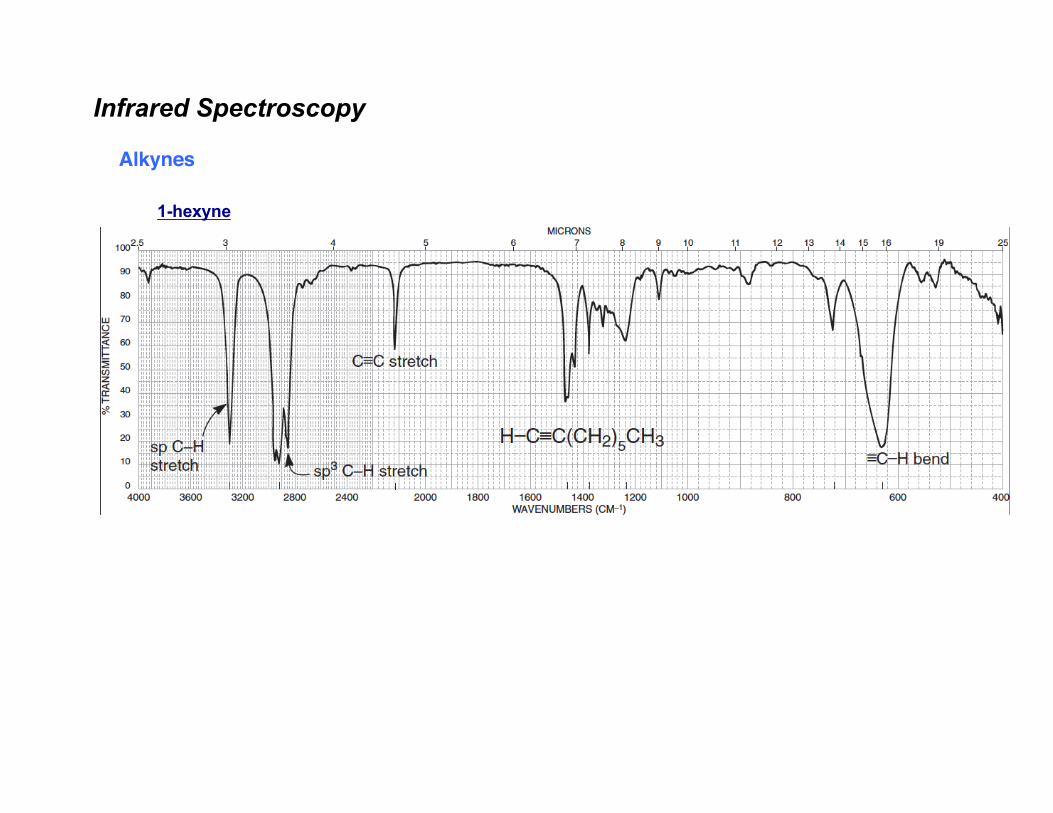
Alkynes
1-hexyne
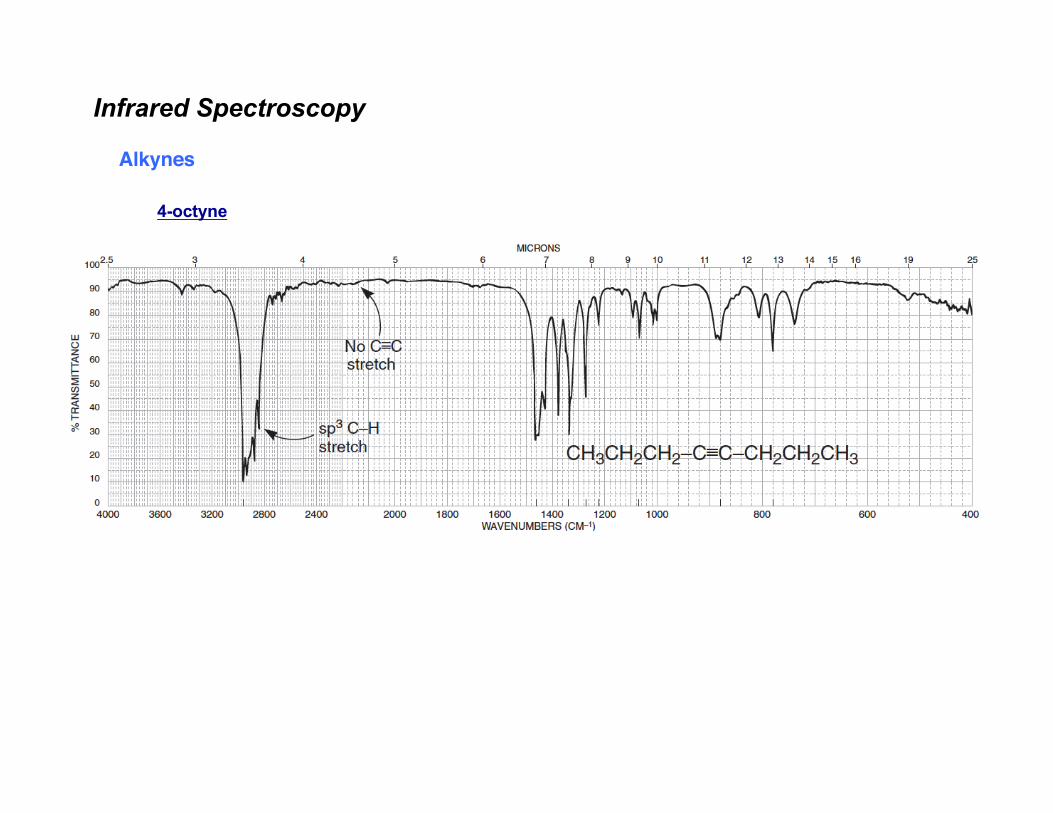
4-octyne
Infrared Spectroscopy
Alkynes
Infrared Spectroscopy
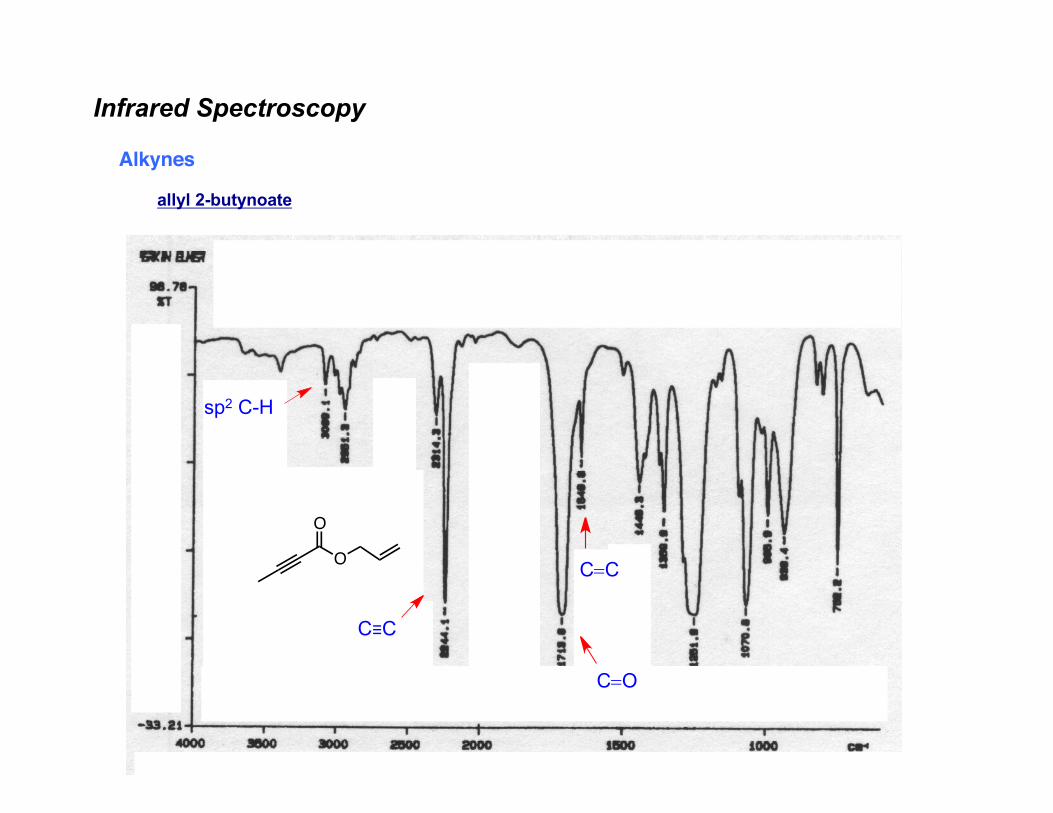
Alkynes
allyl 2-butynoate
sp2 C-H
O
O
C≡C
C=C
C=O
Infrared Spectroscopy
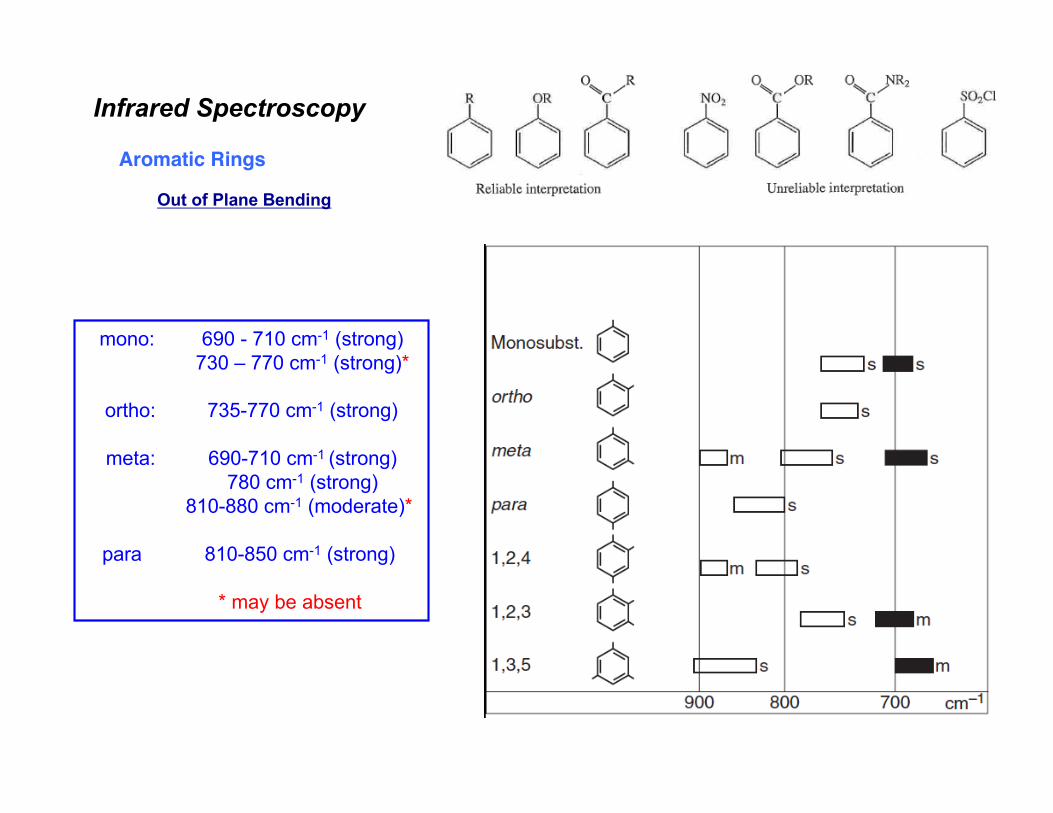
Aromatic RIngs
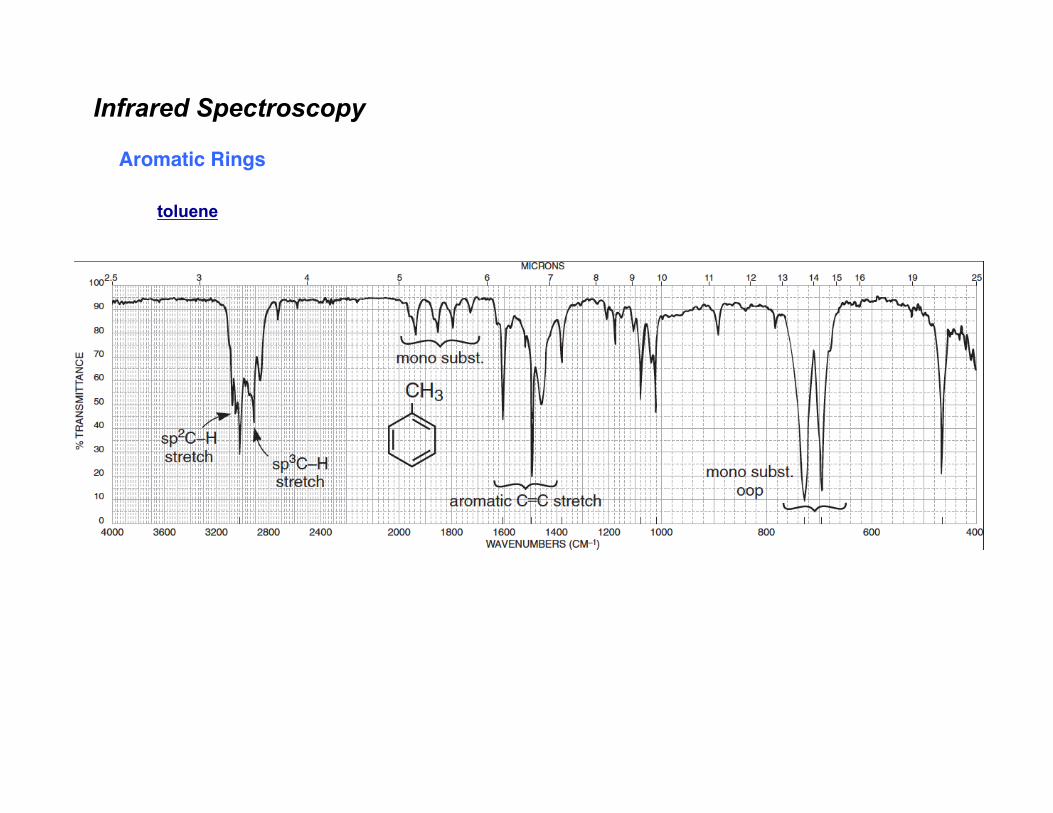
• =C-H stretch to left of 3000 cm-1
- sp2 C-H stretch between 3050-3010 cm-1
• =C-H out of plane bending vibrations between 900-690 cm-1
- can often be used to determine ring substitution pattern
• C=C stretch between 1500-1600 cm-1
- two to three peaks; often occur in pairs at 1660 and 1475 cm-1
• Overtone/Combination bands appear between 2000-1667 cm-1
- can sometimes be used to assign ring substitution pattern
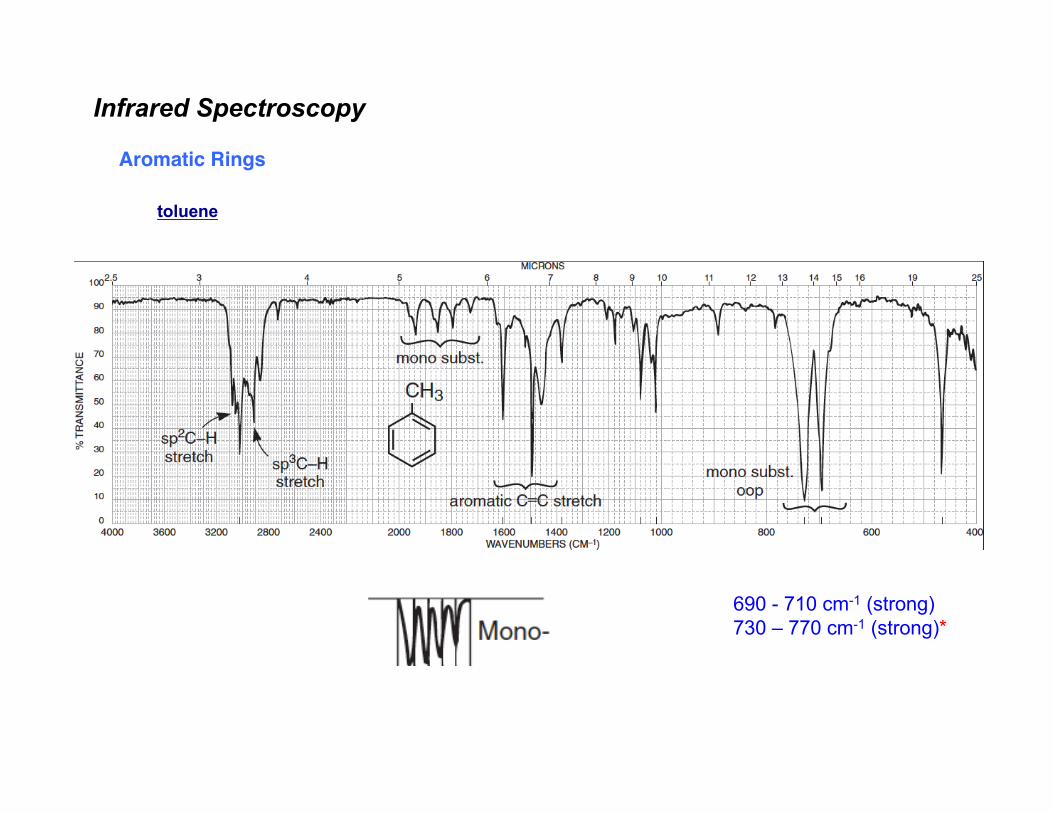
Infrared Spectroscopy
Aromatic Rings
toluene
Infrared Spectroscopy
Aromatic Rings
Out of Plane Bending
mono: 690 - 710 cm-1 (strong)730 – 770 cm-1 (strong)*
ortho: 735-770 cm-1 (strong)
meta: 690-710 cm-1 (strong)780 cm-1 (strong)
810-880 cm-1 (moderate)*
para 810-850 cm-1 (strong)
* may be absent
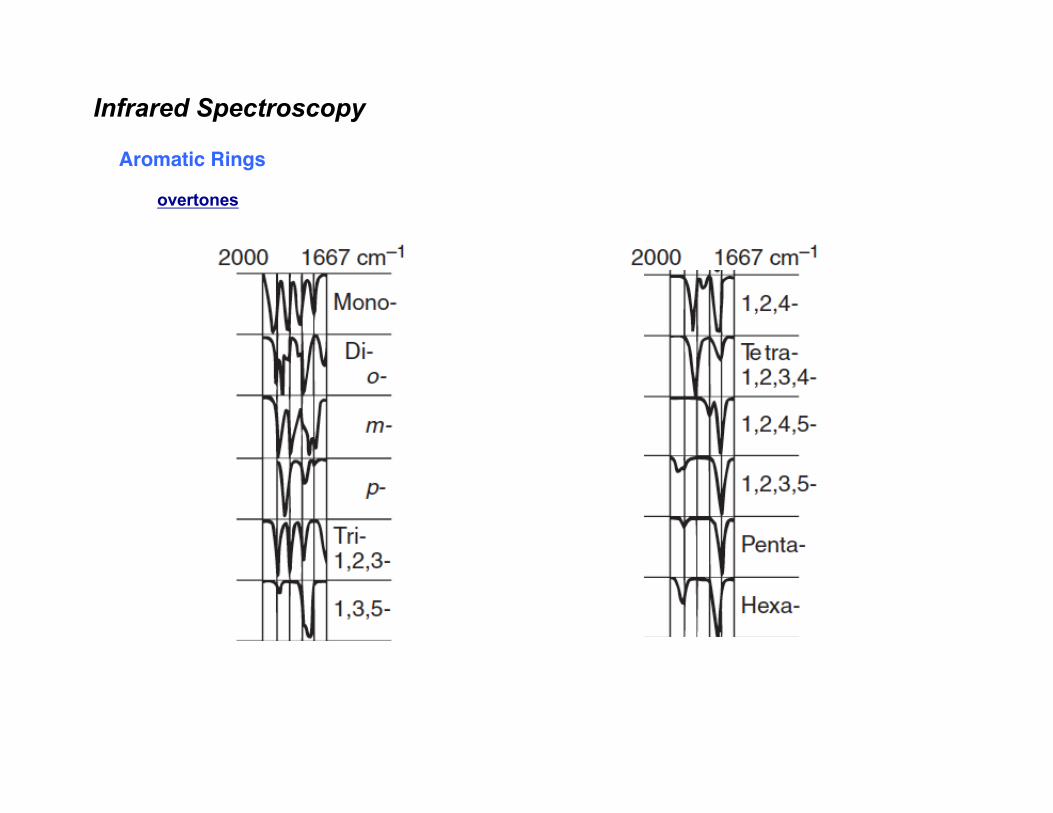
Infrared Spectroscopy
Aromatic Rings
overtones
Infrared Spectroscopy
Aromatic Rings
toluene
690 - 710 cm-1 (strong)730 – 770 cm-1 (strong)*
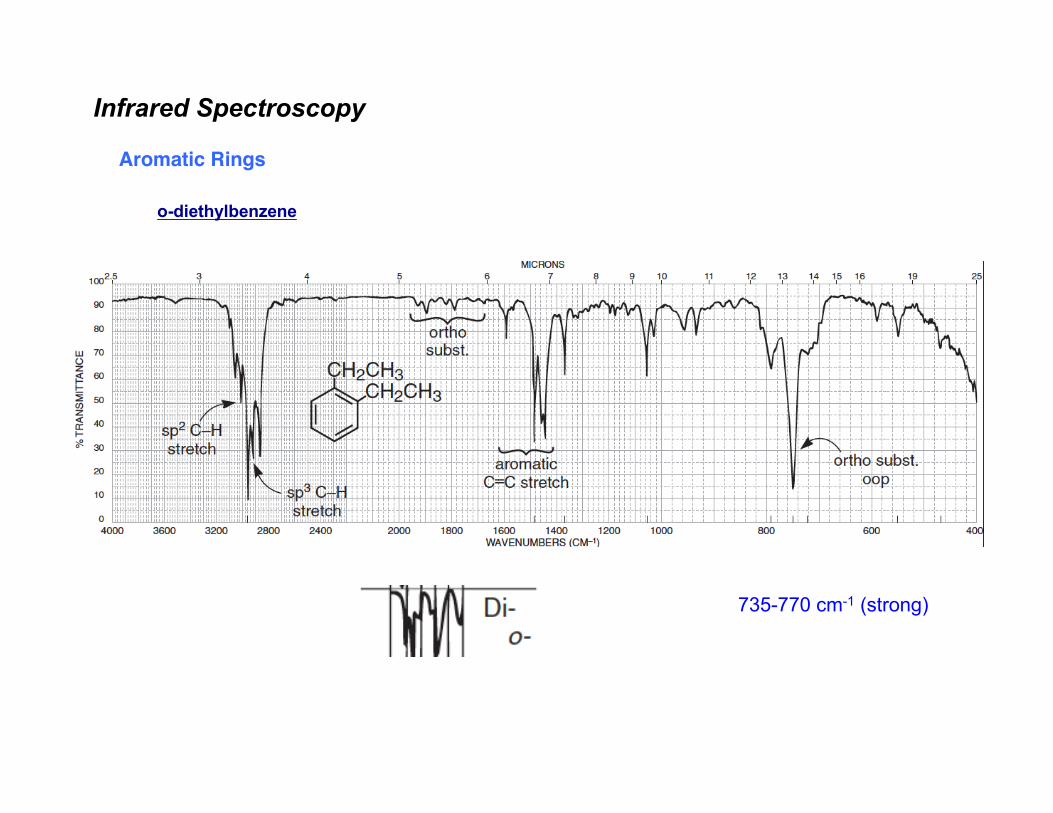
Infrared Spectroscopy
Aromatic Rings
o-diethylbenzene
735-770 cm-1 (strong)
Infrared Spectroscopy
Aromatic Rings
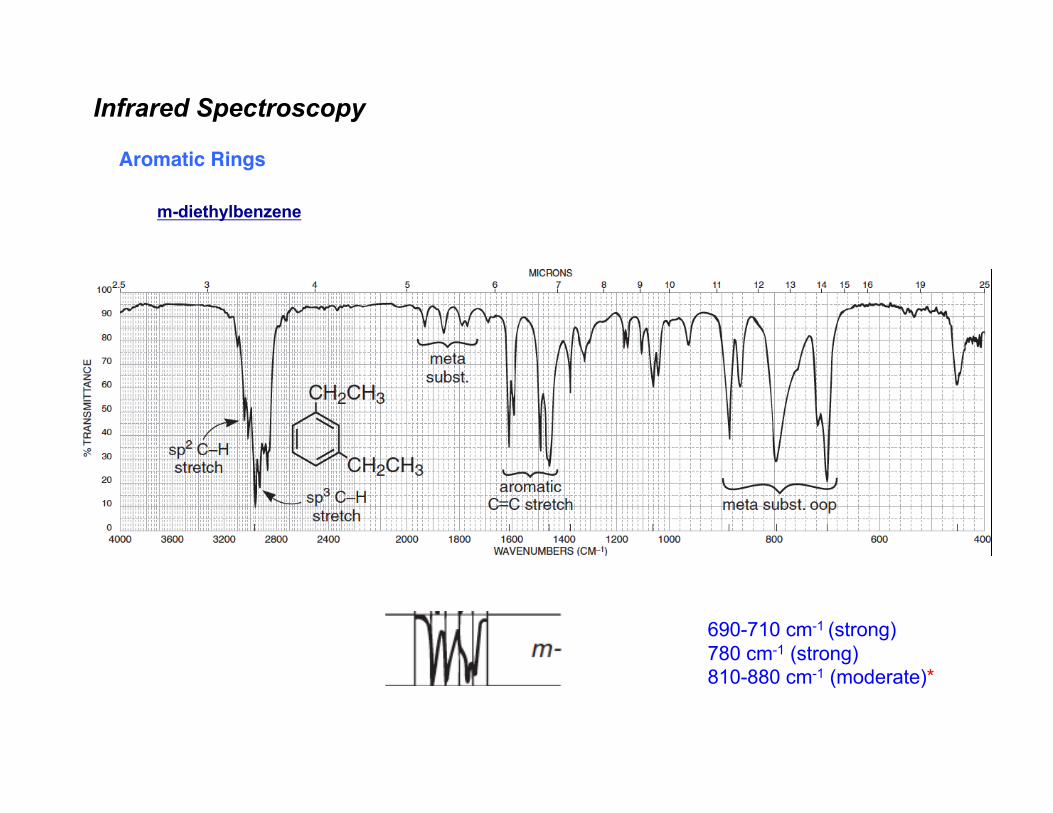
m-diethylbenzene
690-710 cm-1 (strong)780 cm-1 (strong)810-880 cm-1 (moderate)*
Infrared Spectroscopy
Aromatic Rings
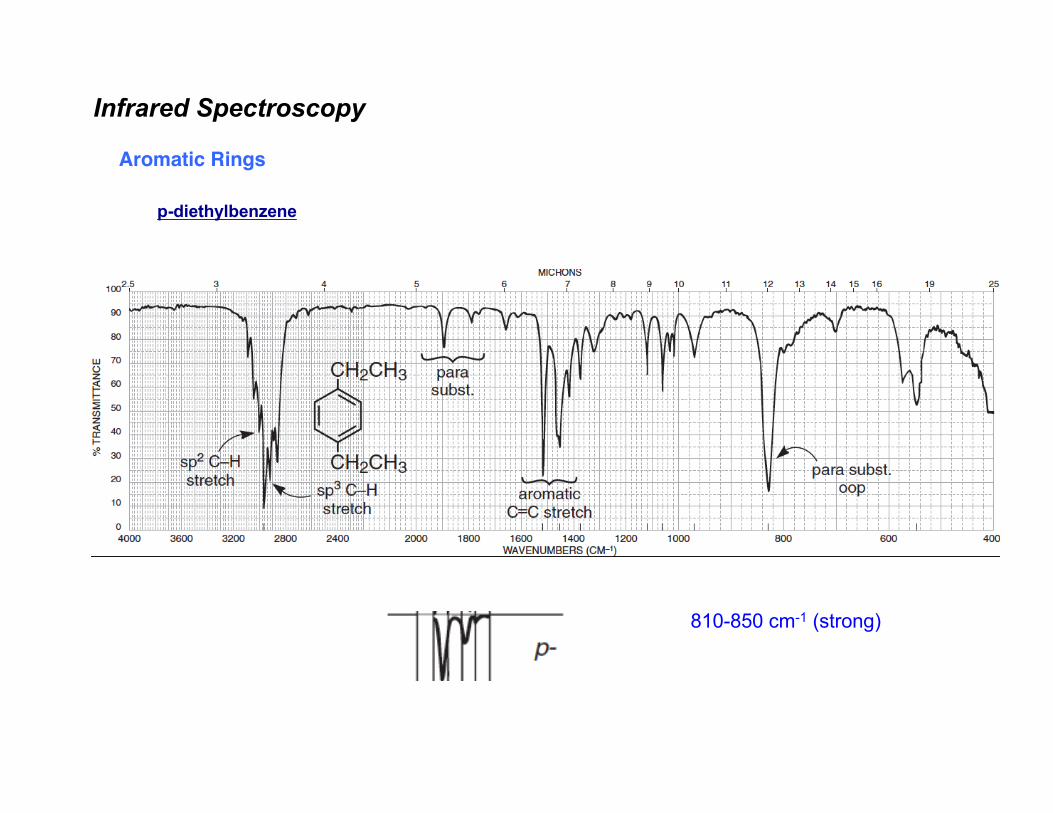
p-diethylbenzene
810-850 cm-1 (strong)
Infrared Spectroscopy
Alcohols & Phenols
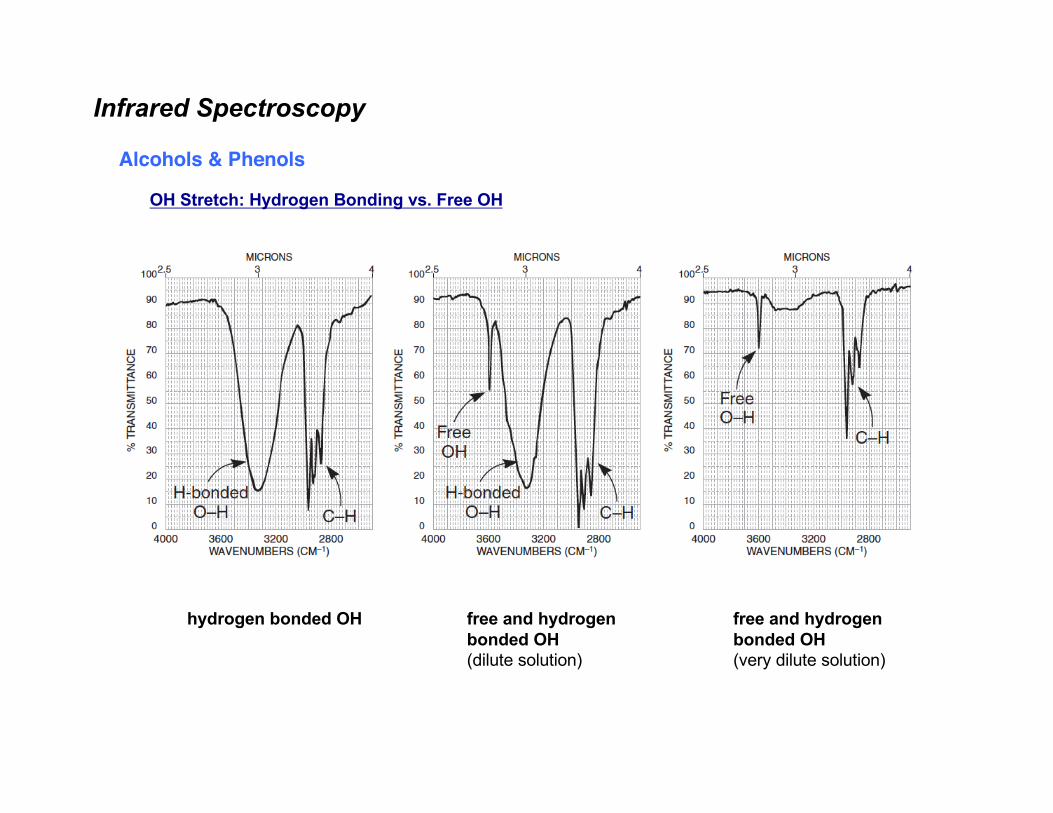
• O-H stretch occurs between 3650-3300 cm-1
- position and shape vary depending on amount of hydrogen bonding• free O-H: sharp peak between 3650-3600 cm-1
• H-bonded O-H: broad peak between 3500-3300 cm-1
• C-O-H bending vibrations between 1440-1220 cm-1
- not diagnostic
• C-O stretch between 1260-1000 cm-1
- can sometimes provide information about alcohol structure
Infrared Spectroscopy
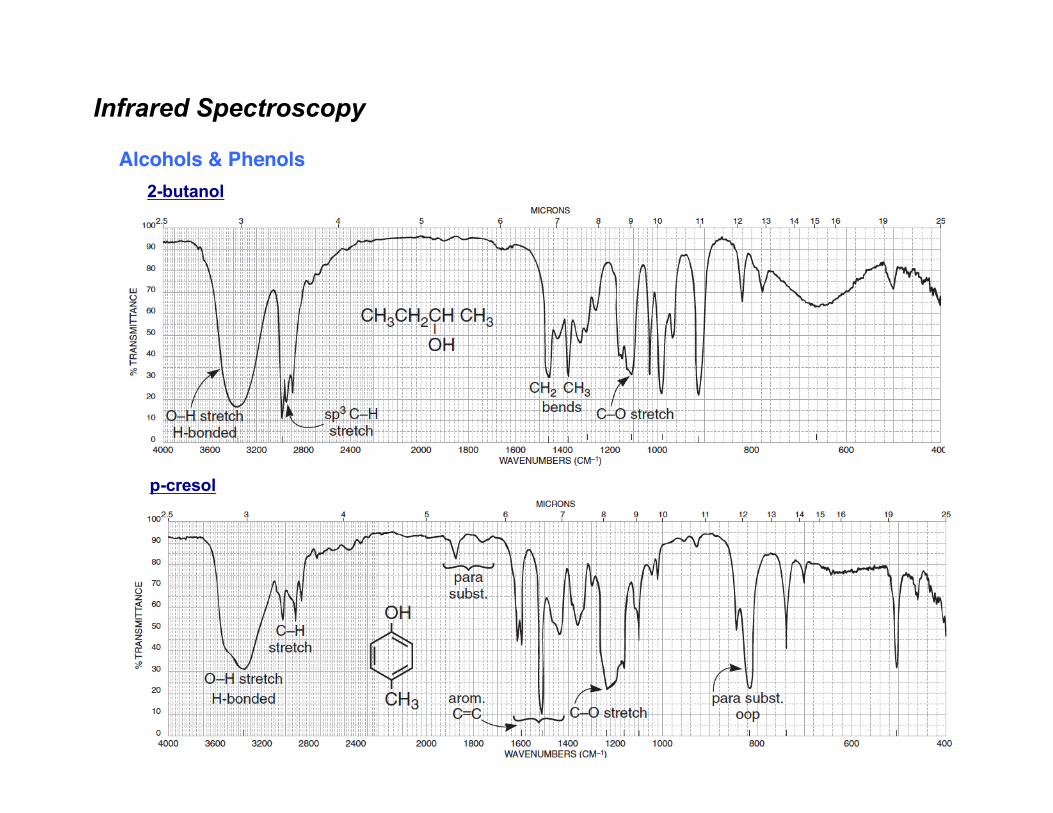
Alcohols & Phenols2-butanol
p-cresol
Infrared Spectroscopy
Alcohols & Phenols
OH Stretch: Hydrogen Bonding vs. Free OH
hydrogen bonded OH free and hydrogenbonded OH(dilute solution)
free and hydrogenbonded OH(very dilute solution)
Infrared Spectroscopy
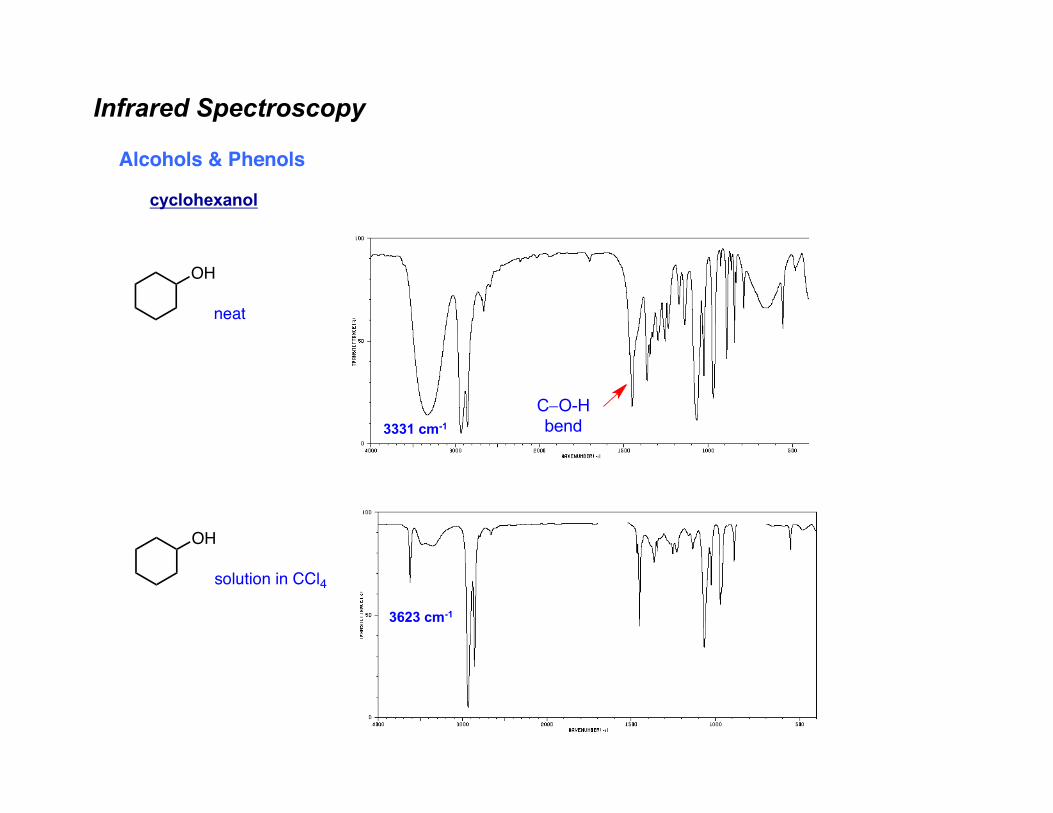
Alcohols & Phenols
cyclohexanol
OH
neat
OH
solution in CCl4
3331 cm-1
3623 cm-1
C-O-Hbend
Infrared Spectroscopy
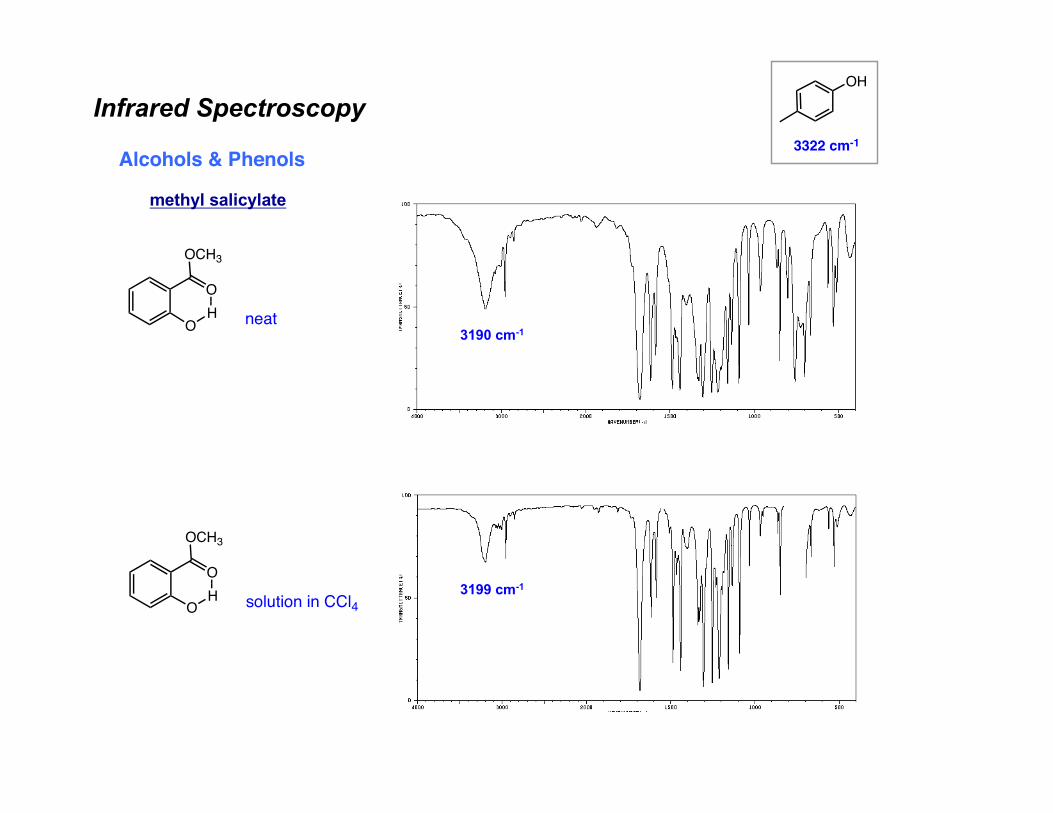
Alcohols & Phenols
methyl salicylate
3190 cm-1
3199 cm-1
neatOHO
OCH3
solution in CCl4OHO
OCH3
OH
3322 cm-1
Infrared Spectroscopy
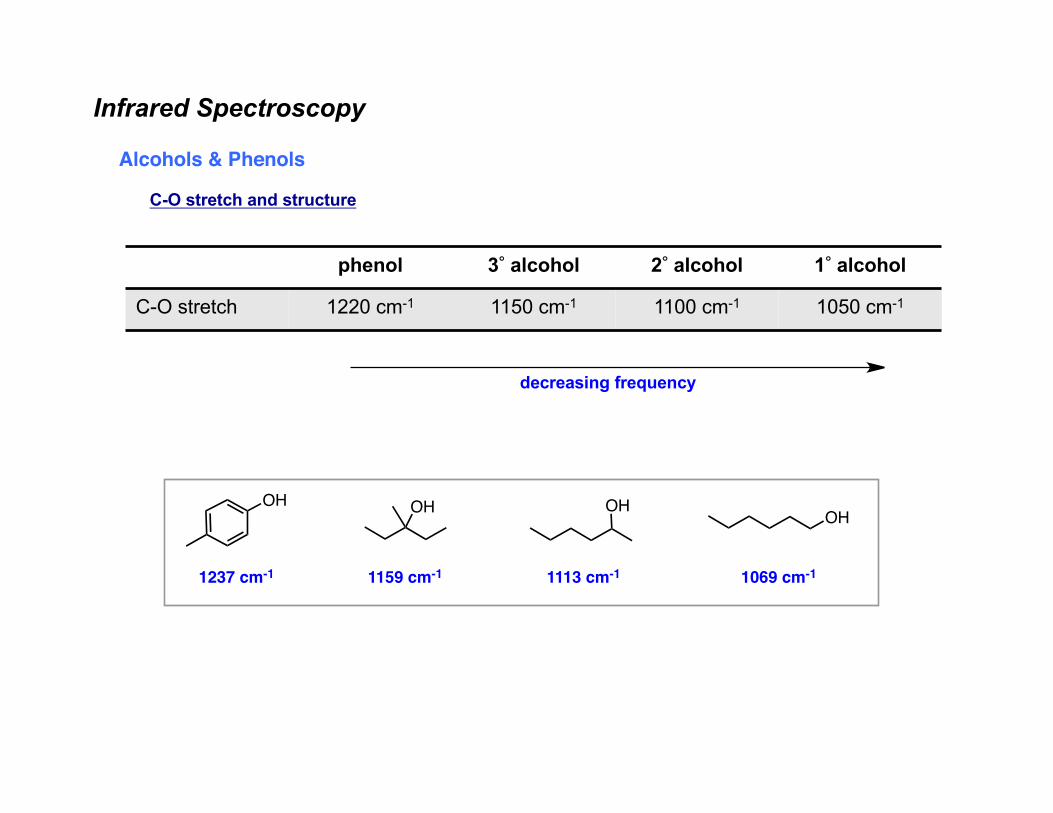
Alcohols & Phenols
C-O stretch and structure
phenol 3° alcohol 2° alcohol 1° alcohol
C-O stretch 1220 cm-1 1150 cm-1 1100 cm-1 1050 cm-1
decreasing frequency
OHOH OH OH
1237 cm-1 1159 cm-1 1113 cm-1 1069 cm-1
Infrared Spectroscopy
Alcohols & Phenols
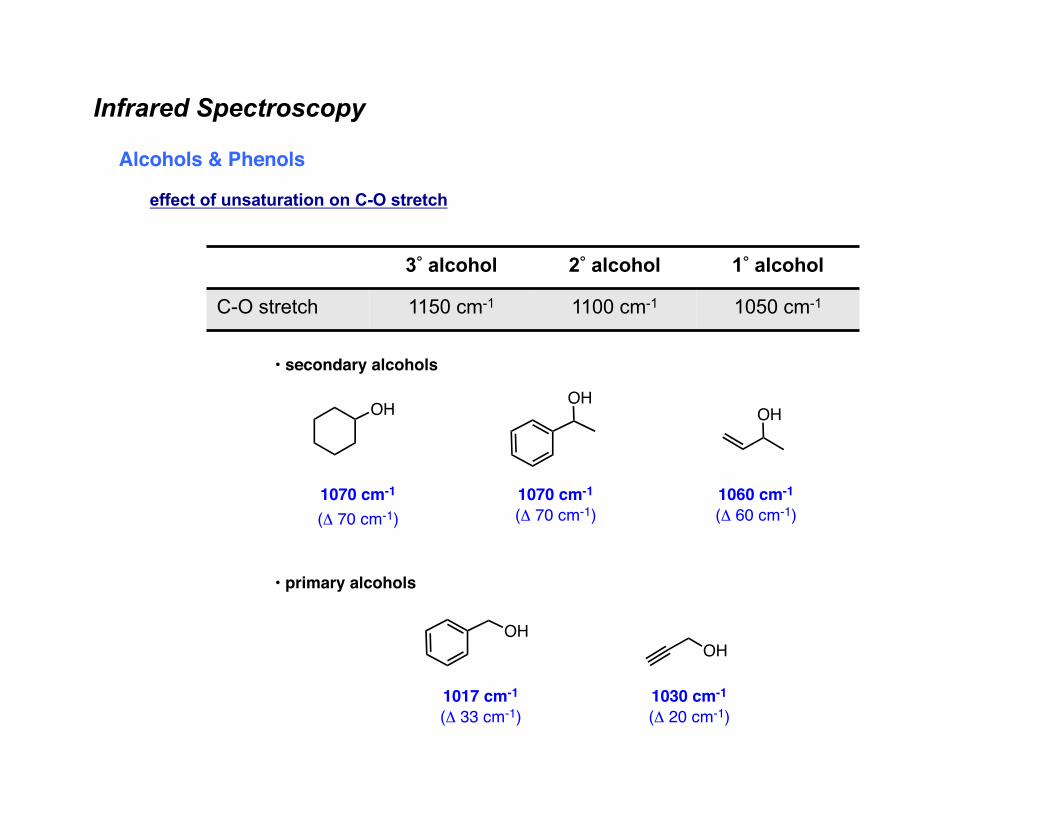
effect of unsaturation on C-O stretch
3° alcohol 2° alcohol 1° alcohol
C-O stretch 1150 cm-1 1100 cm-1 1050 cm-1
OHOH
OHOH
OH
1070 cm-1
(Δ 70 cm-1)1070 cm-1
(Δ 70 cm-1)1060 cm-1
(Δ 60 cm-1)
1017 cm-1
(Δ 33 cm-1)1030 cm-1
(Δ 20 cm-1)
• secondary alcohols
• primary alcohols
Infrared Spectroscopy
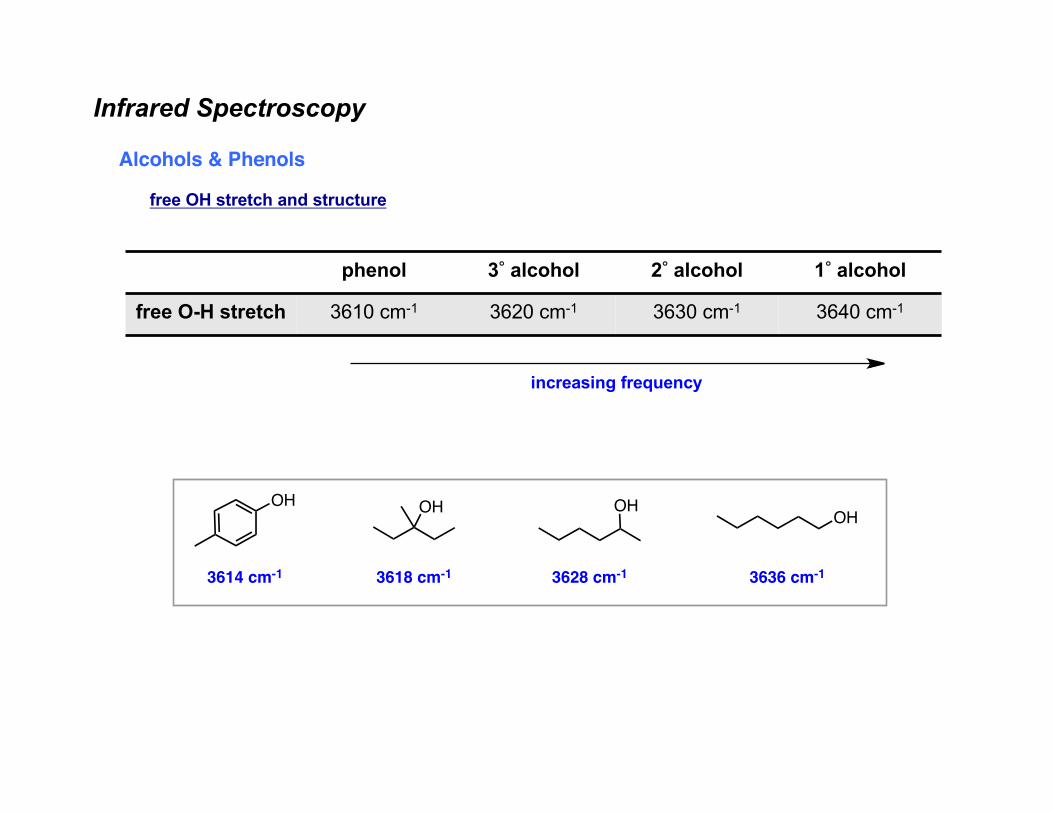
Alcohols & Phenols
free OH stretch and structure
phenol 3° alcohol 2° alcohol 1° alcohol
free O-H stretch 3610 cm-1 3620 cm-1 3630 cm-1 3640 cm-1
increasing frequency
OHOH OH OH
3614 cm-1 3618 cm-1 3628 cm-1 3636 cm-1
Infrared Spectroscopy
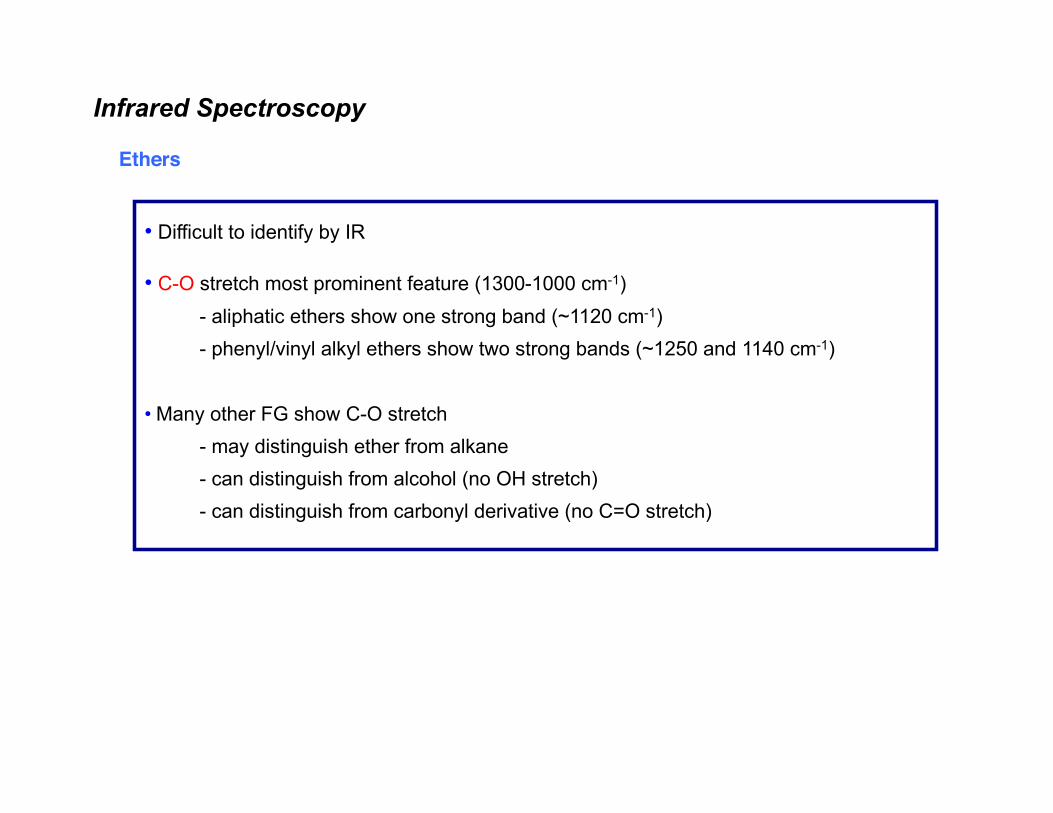
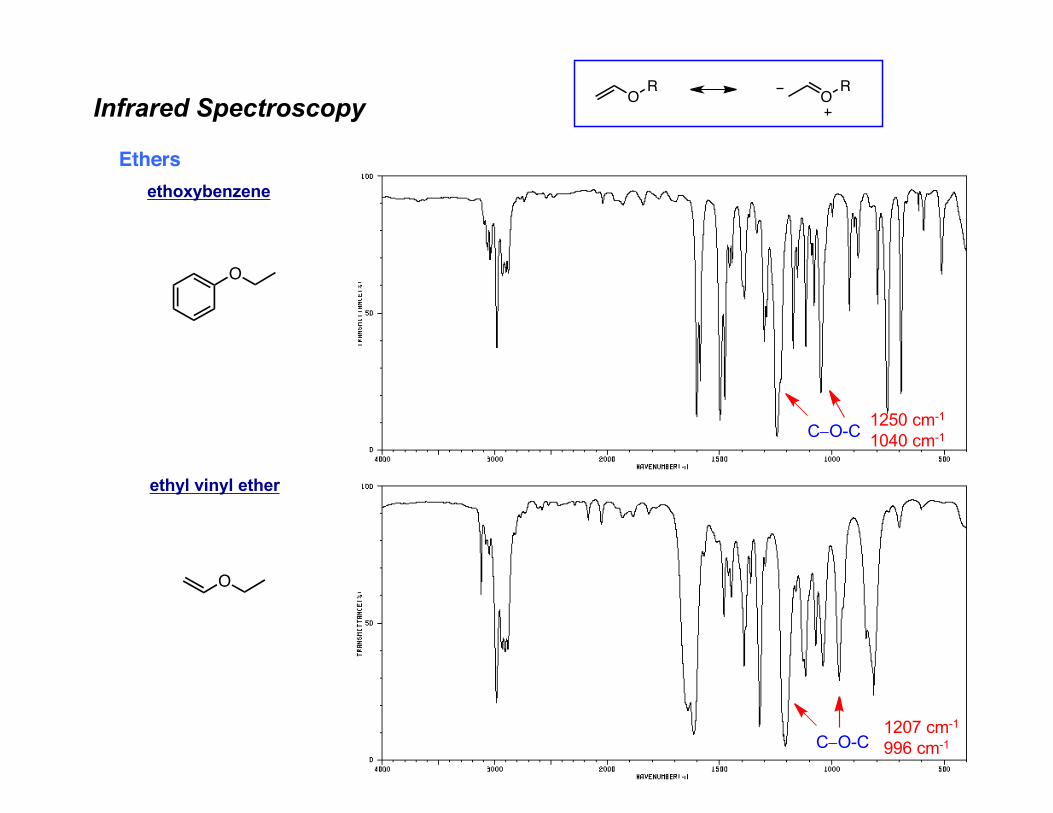
Ethers
• Difficult to identify by IR
• C-O stretch most prominent feature (1300-1000 cm-1)- aliphatic ethers show one strong band (~1120 cm-1)- phenyl/vinyl alkyl ethers show two strong bands (~1250 and 1140 cm-1)
• Many other FG show C-O stretch- may distinguish ether from alkane- can distinguish from alcohol (no OH stretch)- can distinguish from carbonyl derivative (no C=O stretch)
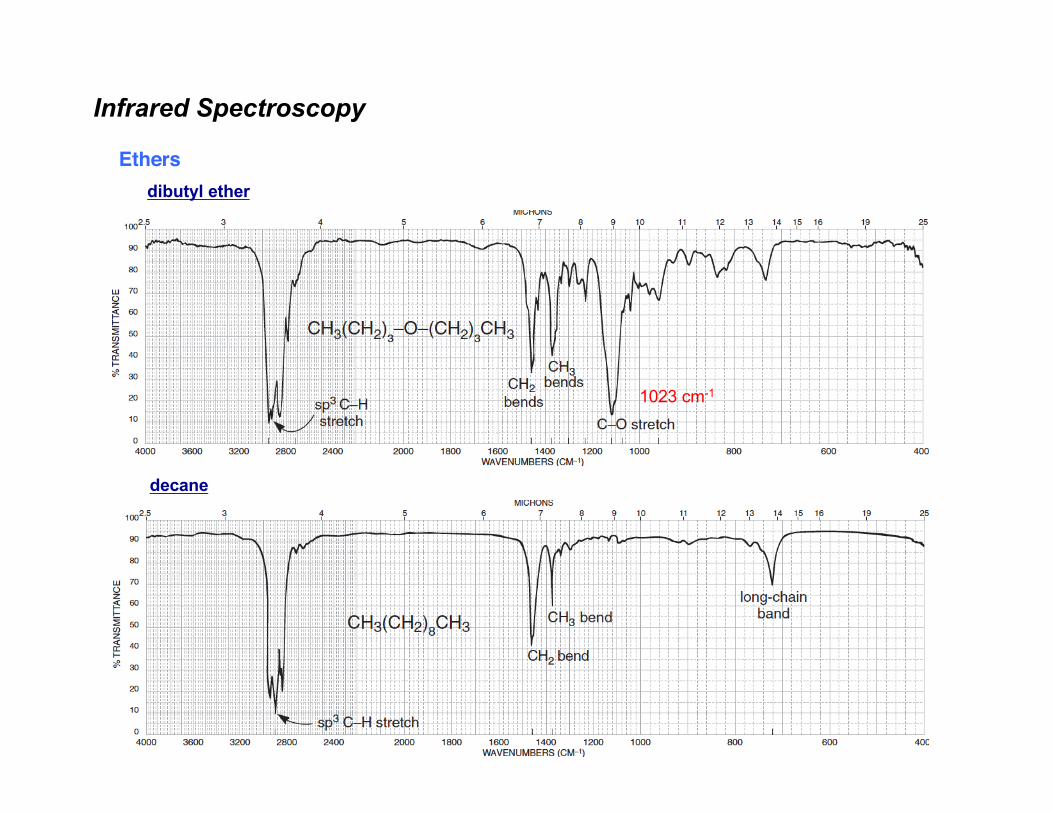
Infrared Spectroscopy
Ethersdibutyl ether
decane
1023 cm-1
Infrared Spectroscopy
Ethersethoxybenzene
ethyl vinyl ether
O
O
C-O-C
C-O-C
O OR R
1207 cm-1
996 cm-1
1250 cm-1
1040 cm-1
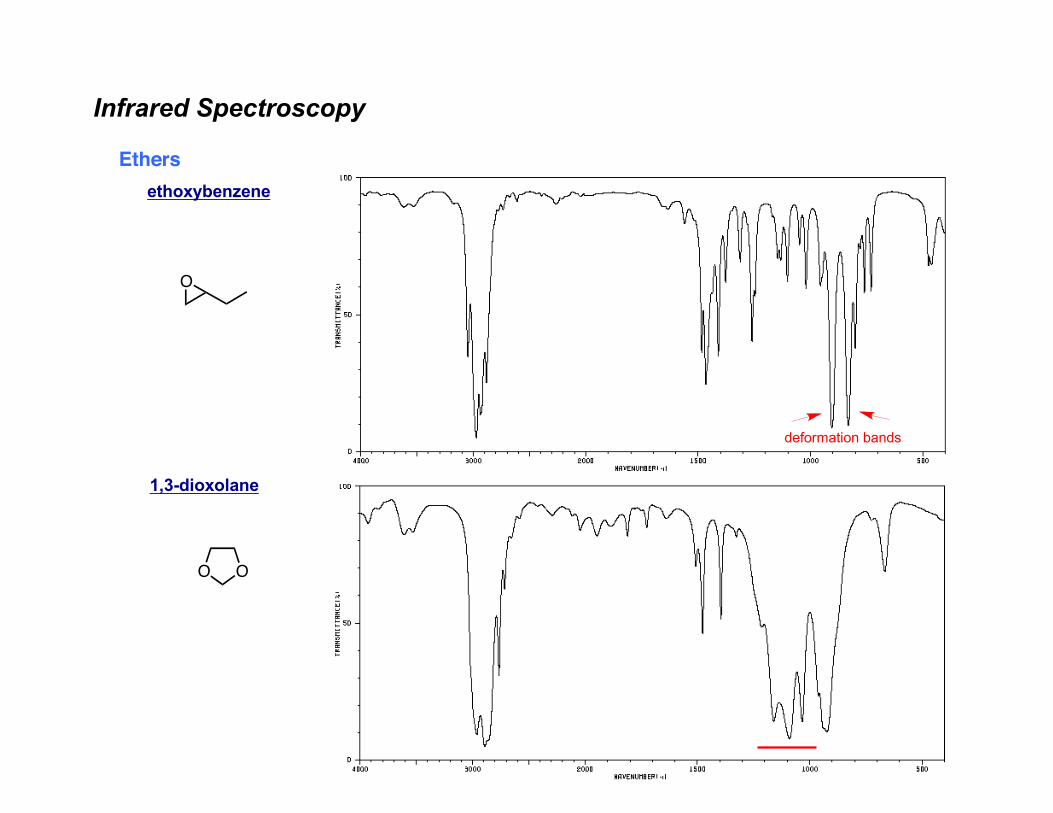
Infrared Spectroscopy
Ethersethoxybenzene
1,3-dioxolane
O O
O
deformation bands
Infrared Spectroscopy
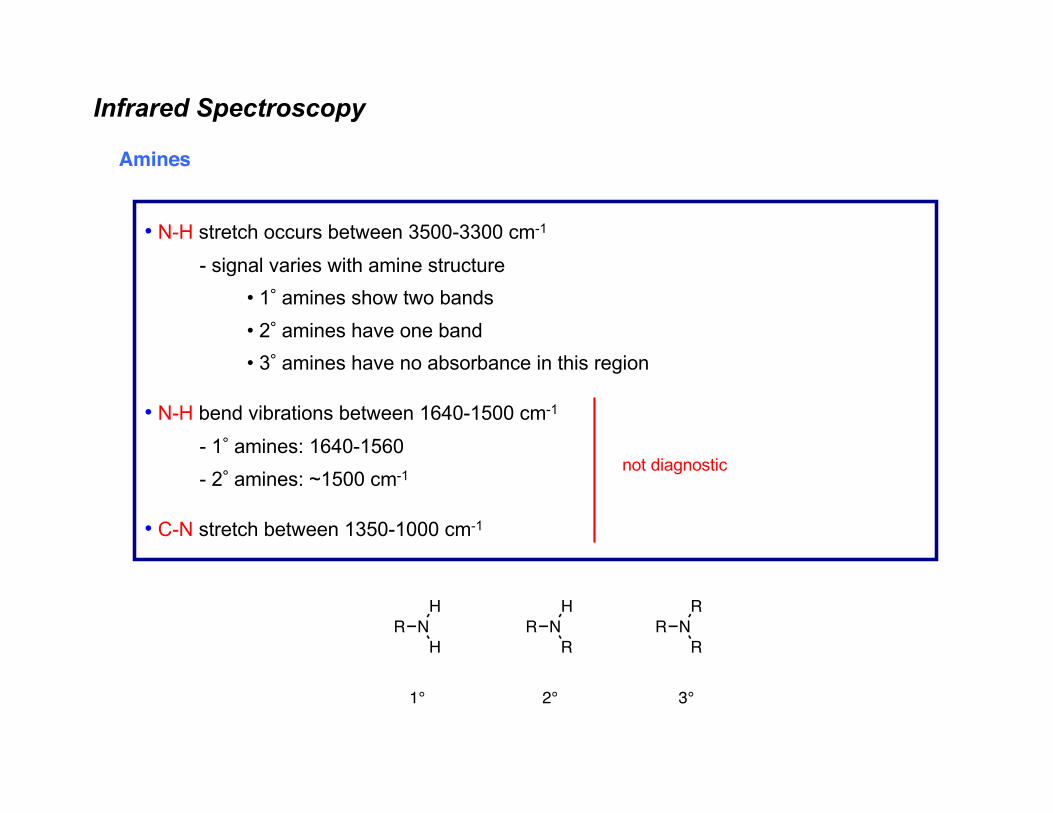
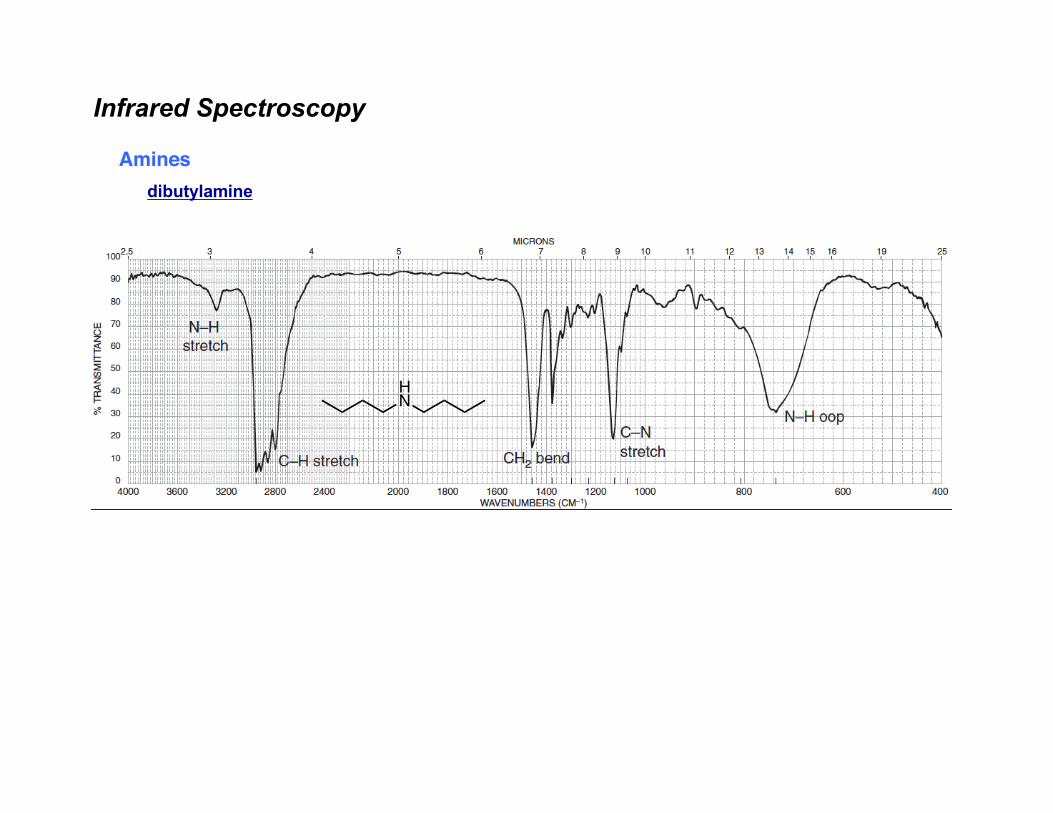
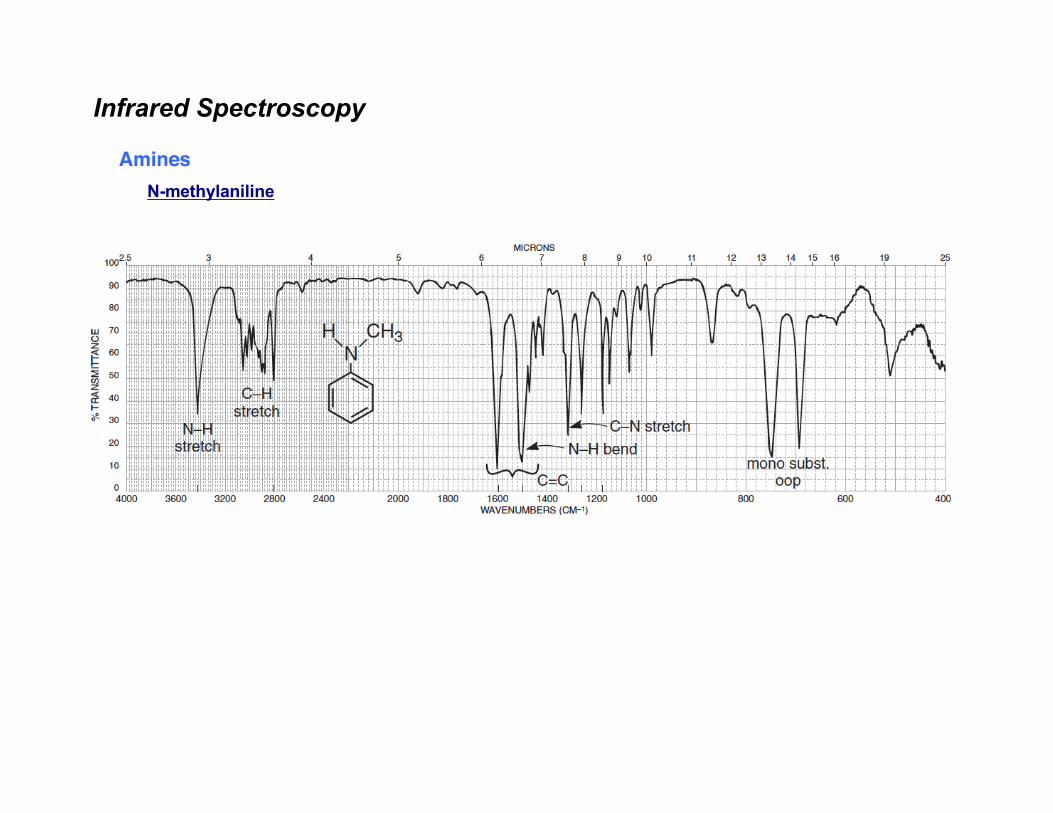
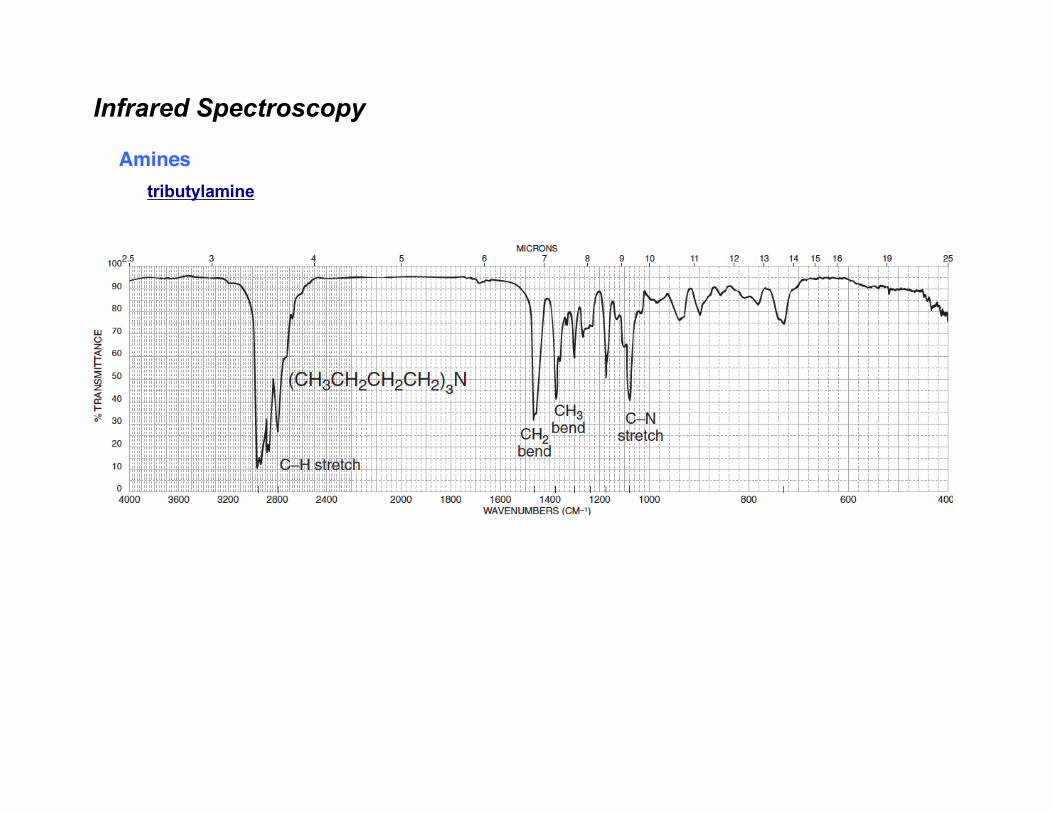
Amines
• N-H stretch occurs between 3500-3300 cm-1
- signal varies with amine structure• 1° amines show two bands• 2° amines have one band• 3° amines have no absorbance in this region
• N-H bend vibrations between 1640-1500 cm-1
- 1° amines: 1640-1560- 2° amines: ~1500 cm-1
• C-N stretch between 1350-1000 cm-1
R NH
HR N
H
RR N
R
R
1° 2° 3°
not diagnostic
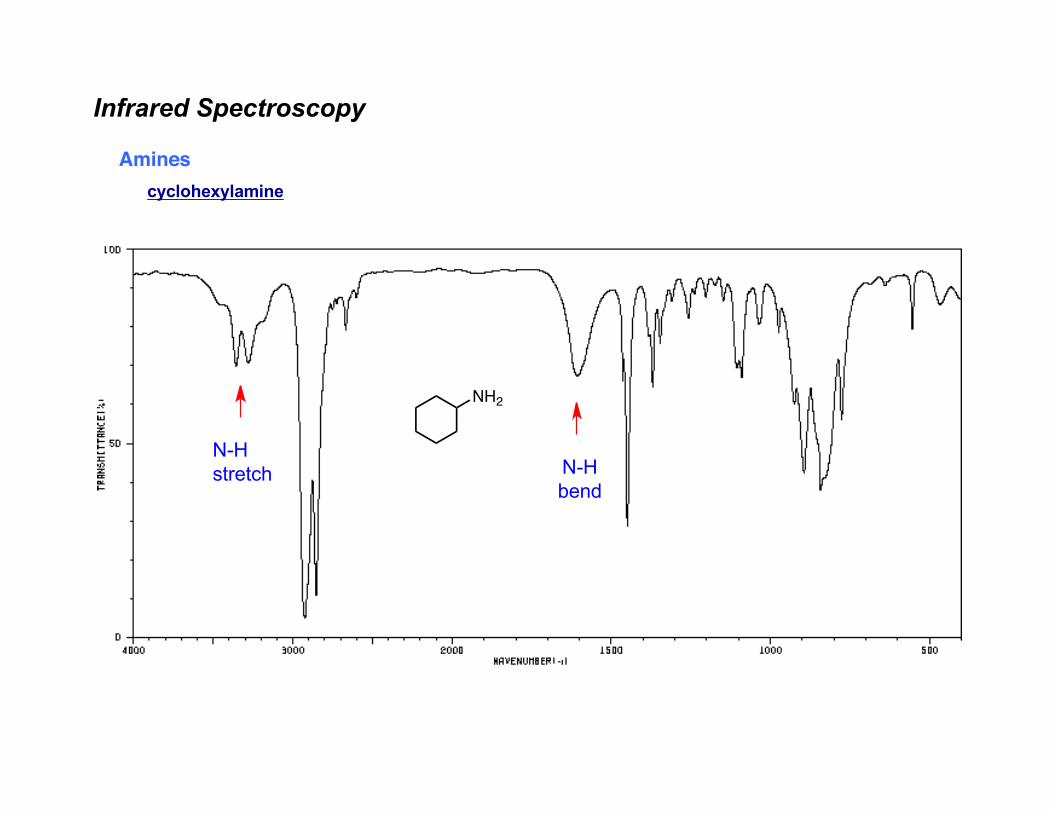
Infrared Spectroscopy
Aminescyclohexylamine
NH2
N-Hstretch N-H
bend
Infrared Spectroscopy
Aminesdibutylamine
HN
Infrared Spectroscopy
AminesN-methylaniline
Infrared Spectroscopy
Aminestributylamine