Embed Size (px)
Citation preview

FURTHER MATHEMATICSWritten examination 2
Monday 3 November 2014 Reading time: 9.00 am to 9.15 am (15 minutes) Writing time: 9.15 am to 10.45 am (1 hour 30 minutes)
QUESTION AND ANSWER BOOK
Structure of bookCore
Number ofquestions
Number of questionsto be answered
Number ofmarks
4 4 15Module
Number ofmodules
Number of modulesto be answered
Number ofmarks
6 3 45 Total 60
• Students are permitted to bring into the examination room: pens, pencils, highlighters, erasers, sharpeners, rulers, one bound reference, one approved graphics calculator or approved CAS calculator or CAS software and, if desired, one scientifi c calculator. Calculator memory DOES NOT need to be cleared.
• Students are NOT permitted to bring into the examination room: blank sheets of paper and/or white out liquid/tape.
Materials supplied• Question and answer book of 38 pages, with a detachable sheet of miscellaneous formulas in the
centrefold.• Working space is provided throughout the book.
Instructions• Detach the formula sheet from the centre of this book during reading time.• Write your student number in the space provided above on this page.
• All written responses must be in English.
Students are NOT permitted to bring mobile phones and/or any other unauthorised electronic devices into the examination room.
© VICTORIAN CURRICULUM AND ASSESSMENT AUTHORITY 2014
SUPERVISOR TO ATTACH PROCESSING LABEL HEREVictorian Certifi cate of Education2014
STUDENT NUMBER
Letter

2014 FURMATH EXAM 2 2
PageCore ................................................................................................................................................... 3
Module
Module 1: Number patterns ...................................................................................................................... 10
Module 2: Geometry and trigonometry .................................................................................................... 14
Module 3: Graphs and relations ................................................................................................................ 20
Module 4: Business-related mathematics ................................................................................................. 24
Module 5: Networks and decision mathematics ....................................................................................... 29
Module 6: Matrices ................................................................................................................................... 34
InstructionsThis examination consists of a core and six modules. Students should answer all questions in the core and then select three modules and answer all questions within the modules selected.You need not give numerical answers as decimals unless instructed to do so. Alternative forms may involve, for example, , surds or fractions.Diagrams are not to scale unless specifi ed otherwise.
3 2014 FURMATH EXAM 2
Core – continuedTURN OVER
Core
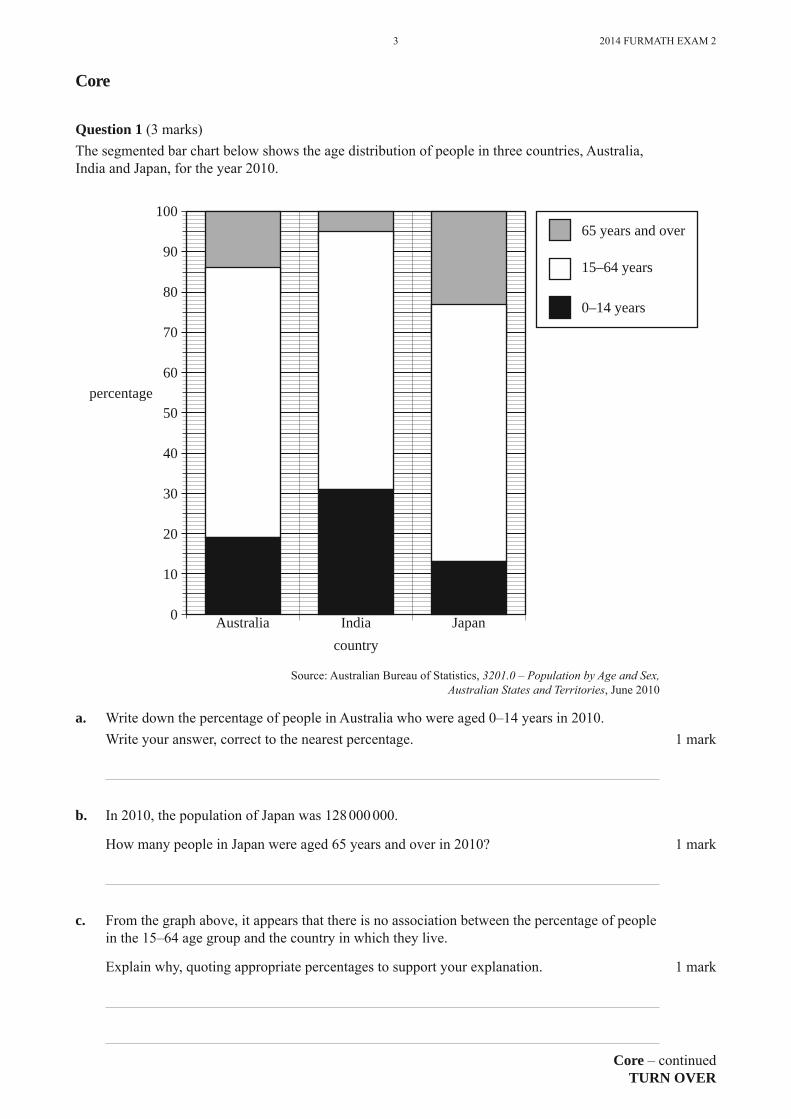
Question 1 (3 marks)The segmented bar chart below shows the age distribution of people in three countries, Australia, India and Japan, for the year 2010.
65 years and over
15–64 years
0–14 years
100
90
80
70
60
50
40
30
20
10
0
percentage
Australia Indiacountry
Japan
Source: Australian Bureau of Statistics, 3201.0 – Population by Age and Sex,Australian States and Territories, June 2010
a. Write down the percentage of people in Australia who were aged 0–14 years in 2010. Write your answer, correct to the nearest percentage. 1 mark
b. In 2010, the population of Japan was 128 000 000.
How many people in Japan were aged 65 years and over in 2010? 1 mark
c. From the graph above, it appears that there is no association between the percentage of people in the 15–64 age group and the country in which they live.
Explain why, quoting appropriate percentages to support your explanation. 1 mark
2014 FURMATH EXAM 2 4
Core – Question 2 – continued
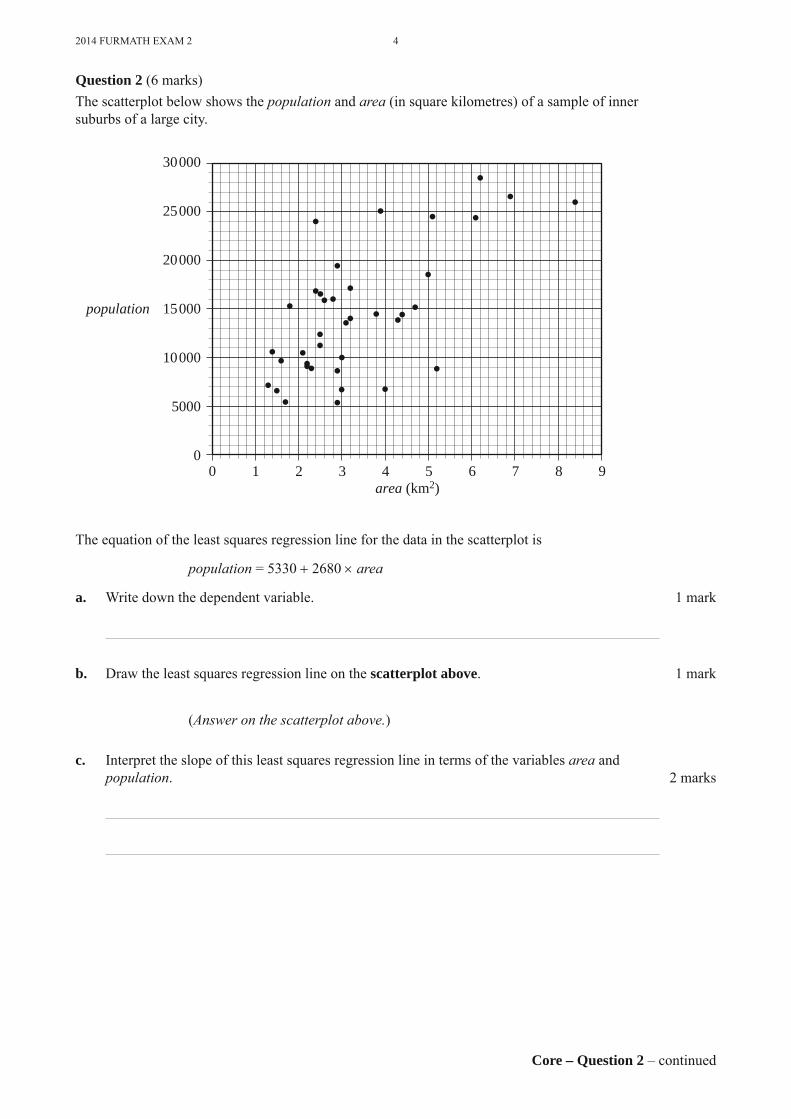
Question 2 (6 marks)The scatterplot below shows the population and area (in square kilometres) of a sample of inner suburbs of a large city.
30000
25000
20000
15000population
10000
5000
00 1 2 3 4
area (km2)5 6 7 8 9
The equation of the least squares regression line for the data in the scatterplot is
population = 5330 2680 area
a. Write down the dependent variable. 1 mark
b. Draw the least squares regression line on the scatterplot above. 1 mark
(Answer on the scatterplot above.)
c. Interpret the slope of this least squares regression line in terms of the variables area and population. 2 marks

5 2014 FURMATH EXAM 2
Core – continuedTURN OVER
d. Wiston is an inner suburb. It has an area of 4 km2 and a population of 6690. The correlation coeffi cient, r, is equal to 0.668 i. Calculate the residual when the least squares regression line is used to predict the
population of Wiston from its area. 1 mark
ii. What percentage of the variation in the population of the suburbs is explained by the variation in area?
Write your answer, correct to one decimal place. 1 mark

2014 FURMATH EXAM 2 6
Core – continued
Question 3 (2 marks)The scatterplot and table below show the population, in thousands, and the area, in square kilometres, for a sample of 21 outer suburbs of the same city.
35
30
25
20population(thousands)
15
10
5
00 20 40 60 80
area (km2)100 120 140
Area (km2) Population(thousands)
1.6 5.24.4 14.34.6 7.55.6 11.06.3 17.17.0 19.47.3 15.58.0 11.38.8 17.1
11.1 19.713.0 17.918.5 18.721.3 24.624.2 15.227.0 13.662.1 26.166.5 16.4
101.4 26.2119.2 16.5130.7 18.9135.4 31.3
In the outer suburbs, the relationship between population and area is non-linear.A log transformation can be applied to the variable area to linearise the scatterplot.
a. Apply the log transformation to the data and determine the equation of the least squares regression line that allows the population of an outer suburb to be predicted from the logarithm of its area.
Write the slope and intercept of this regression line in the boxes provided below. Write your answers, correct to one decimal place. 1 mark
population = + log10 (area)
b. Use this regression equation to predict the population of an outer suburb with an area of 90 km2.
Write your answer, correct to the nearest one thousand people. 1 mark

7 2014 FURMATH EXAM 2
Core – continuedTURN OVER
CONTINUES OVER PAGE
2014 FURMATH EXAM 2 8
Core – Question 4 – continued
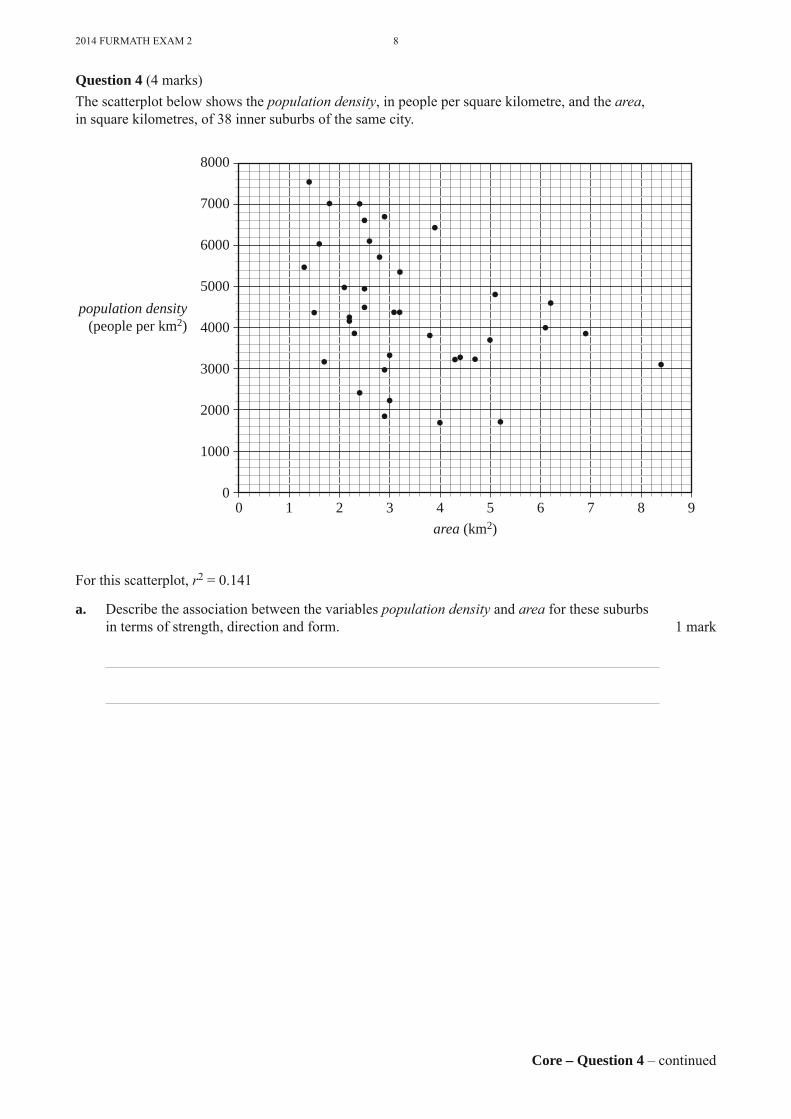
Question 4 (4 marks)The scatterplot below shows the population density, in people per square kilometre, and the area, in square kilometres, of 38 inner suburbs of the same city.
0 1 2 3 4area (km2)
5 6 7 8 9
8000
7000
6000
5000
4000
3000
2000
1000
0
population density(people per km2)
For this scatterplot, r2 = 0.141
a. Describe the association between the variables population density and area for these suburbs in terms of strength, direction and form. 1 mark

9 2014 FURMATH EXAM 2
END OF CORETURN OVER
b. The mean and standard deviation of the variables population density and area for these 38 inner suburbs are shown in the table below.
Population density(people per km2)
Area(km2)
Mean 4370 3.4
Standard deviation 1560 1.6
i. One of these suburbs has a population density of 3082 people per square kilometre.
Determine the standard z-score of this suburb’s population density. Write your answer, correct to one decimal place. 1 mark
Assume the areas of these inner suburbs are approximately normally distributed. ii. How many of these 38 suburbs are expected to have an area that is two standard
deviations or more above the mean? Write your answer, correct to the nearest whole number. 1 mark
iii. How many of these 38 inner suburbs actually have an area that is two standard deviations or more above the mean? 1 mark
2014 FURMATH EXAM 2 10
Module 1 – continued
Module 1: Number patterns
Question 1 (4 marks)Land in a wildlife reserve contains both grassland and desert.Each year, some grassland becomes desert.Let Ln be the expected area of grassland in the wildlife reserve, in square kilometres, at the end of year n.The change in the area of grassland in the wildlife reserve, from year to year, is modelled by the difference equation
Ln + 1 = 0.99Ln L2014 = 20 000
a. How many square kilometres of grassland are expected to be in the wildlife reserve at the end of 2014? 1 mark
b. What percentage of grassland is expected to become desert each year? 1 mark
c. Show that 19 800 km2 of grassland are expected to be in the wildlife reserve at the end of 2015. 1 mark
d. What area of grassland, in square kilometres, is expected to become desert between the end of 2015 and the end of 2016? 1 mark

11 2014 FURMATH EXAM 2
Module 1 – continuedTURN OVER
Question 2 (4 marks)A conservation group plans to convert some of the desert to grassland each year.The table below shows the area of desert, in square kilometres, that will be converted to grassland in each of the years 2014, 2015 and 2016.
2014 2015 2016
Area of desert that will be converted to grassland (km2) 0.8 0.68 0.578
The area of desert that will be converted to grassland each year forms a geometric sequence.
a. Write down a calculation to show that the common ratio for this geometric sequence is 0.85 1 mark
b. What area of desert, in square kilometres, will be converted to grassland in 2019? Write your answer, correct to two decimal places. 1 mark
c. By the end of 2018, what total area of desert, in square kilometres, will have been converted to grassland?
Write your answer, correct to two decimal places. 1 mark
d. In what year will the total area of desert converted to grassland fi rst exceed 4 km2 ? 1 mark

2014 FURMATH EXAM 2 12
Module 1 – Question 3 – continued
Question 3 (7 marks)Some of the land in the wildlife reserve is an elephant habitat.Let Hn be the area of the elephant habitat, in square kilometres, at the end of year n.The change in the area of the elephant habitat, from year to year, can be modelled by the difference equation
Hn + 1 = 0.85Hn + 500 H2014 = 14 000
a. Write down a calculation to show that the expected area of the elephant habitat at the end of 2015 is 12 400 km2. 1 mark
The elephant habitat contains a population of elephants.Let En be the number of elephants in the elephant habitat at the end of year n.The change in the number of elephants, from year to year, can be modelled by the difference equation
En + 1 = 1.06En E2014 = 5000
The elephant habitat will be overpopulated if there are less than 2 km2 for each elephant.
b. Show that the elephant habitat is expected to be overpopulated in 2016. 2 marks
13 2014 FURMATH EXAM 2
END OF MODULE 1TURN OVER
To prevent the elephant habitat from becoming overpopulated, a number of elephants will be moved to other reserves at the end of each year.Let Pn be the number of elephants in the elephant habitat at the end of year n.Let k be the number of elephants that are moved to other reserves at the end of each year.The change in the number of elephants, from year to year, can be modelled by another difference equation
Pn + 1 = 1.06Pn – k P2014 = 5000
c. How many elephants must be moved to other reserves at the end of each year if the number of elephants in the elephant habitat is to remain constant? 1 mark
d. How many elephants must be moved to other reserves at the end of each year if the number of elephants in the elephant habitat at the end of 2015 is to be 100 elephants fewer than at the end of 2014? 1 mark
e. What is the minimum number of elephants that should be moved to other reserves at the end of each year to ensure that the elephant habitat is not overpopulated in 2016? 2 marks
2014 FURMATH EXAM 2 14
Module 2 – continued
Module 2: Geometry and trigonometry
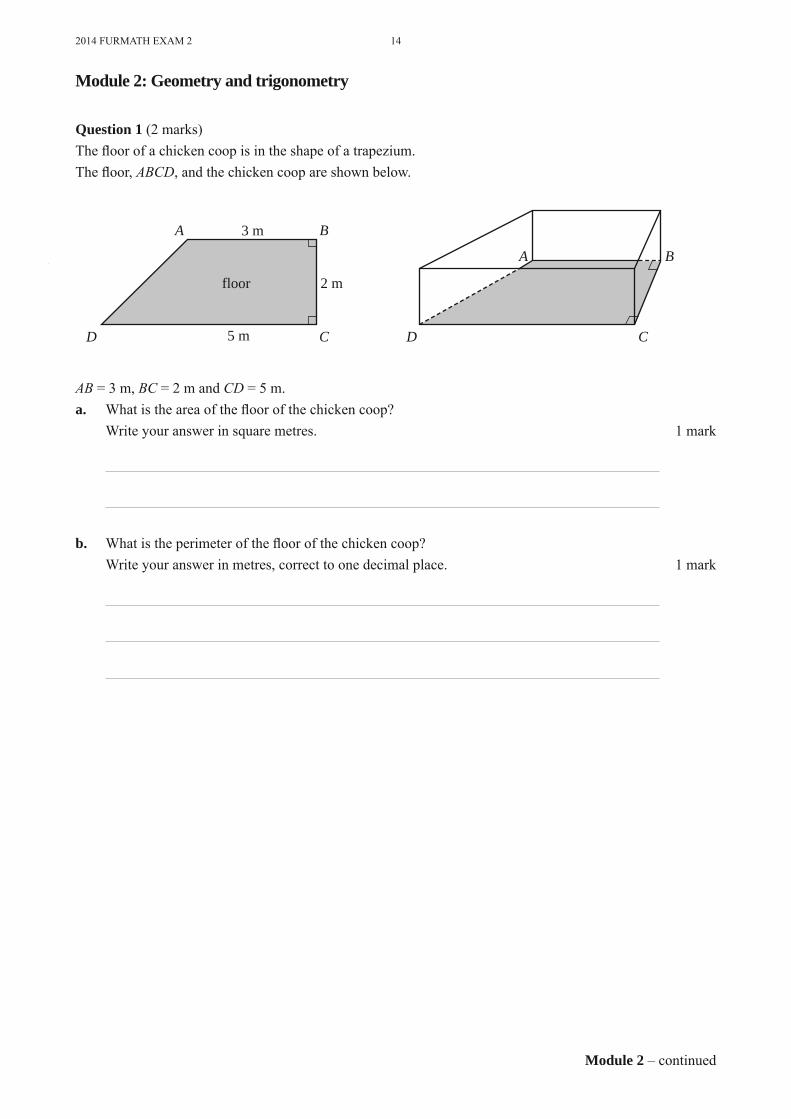
Question 1 (2 marks)The fl oor of a chicken coop is in the shape of a trapezium.The fl oor, ABCD, and the chicken coop are shown below.
BA
CD
A
D C
B3 m
5 m
2 mfloor
AB = 3 m, BC = 2 m and CD = 5 m.a. What is the area of the fl oor of the chicken coop? Write your answer in square metres. 1 mark
b. What is the perimeter of the fl oor of the chicken coop? Write your answer in metres, correct to one decimal place. 1 mark

15 2014 FURMATH EXAM 2
Module 2 – continuedTURN OVER
CONTINUES OVER PAGE

2014 FURMATH EXAM 2 16
Module 2 – Question 2 – continued
Question 2 (6 marks)The chicken coop has two spaces, one for nesting and one for eating. The nesting and eating spaces are separated by a wall along the line AX, as shown in the diagrams below.
nestingeating 2 m
3.16 m
5 m
3 mA B
CX XD D
BA
C45° 60°
DX = 3.16 m, ADX = 45° and AXD = 60°.
a. Write down a calculation to show that the value of θ is 75°. 1 mark
b. The sine rule can be used to calculate the length of the wall AX. Fill in the missing numbers below. 1 mark
AX
sin ° sin °=
c. What is the length of A X ? Write your answer in metres, correct to two decimal places. 1 mark
d. Calculate the area of the fl oor of the nesting space, ADX. Write your answer in square metres, correct to one decimal place. 1 mark

17 2014 FURMATH EXAM 2
Module 2 – continuedTURN OVER
The height of the chicken coop is 1.8 m.Wire mesh will cover the roof of the eating space.The area of the walls along the lines AB, BC and CX will also be covered with wire mesh.
e. What total area, in square metres, will be covered by wire mesh? Write your answer, correct to the nearest square metre. 2 marks
2014 FURMATH EXAM 2 18
Module 2 – continued
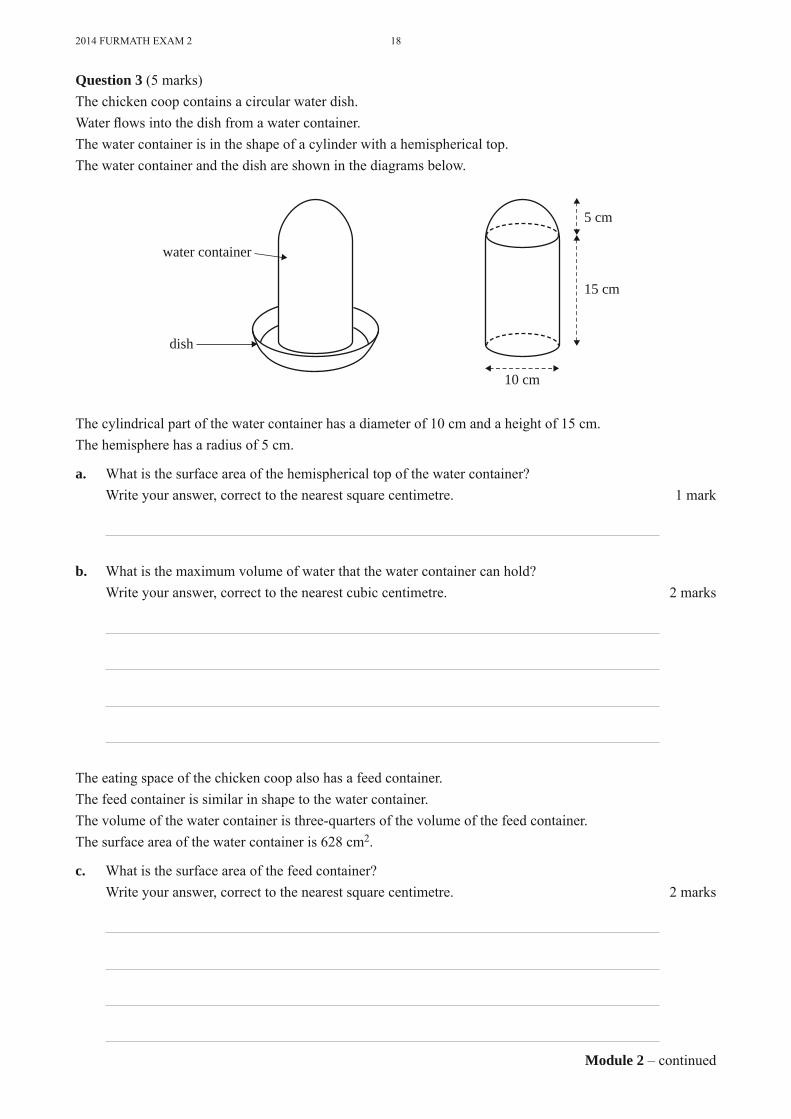
Question 3 (5 marks)The chicken coop contains a circular water dish.Water fl ows into the dish from a water container.The water container is in the shape of a cylinder with a hemispherical top.The water container and the dish are shown in the diagrams below.
5 cm
15 cm
10 cm
water container
dish
The cylindrical part of the water container has a diameter of 10 cm and a height of 15 cm.The hemisphere has a radius of 5 cm.
a. What is the surface area of the hemispherical top of the water container? Write your answer, correct to the nearest square centimetre. 1 mark
b. What is the maximum volume of water that the water container can hold? Write your answer, correct to the nearest cubic centimetre. 2 marks
The eating space of the chicken coop also has a feed container.The feed container is similar in shape to the water container.The volume of the water container is three-quarters of the volume of the feed container.The surface area of the water container is 628 cm2.
c. What is the surface area of the feed container? Write your answer, correct to the nearest square centimetre. 2 marks

19 2014 FURMATH EXAM 2
END OF MODULE 2TURN OVER
Question 4 (2 marks)One of the chickens escapes into a neighbouring fi eld through an open gate.The chicken’s owner is 50 m due north of the gate, searching for the chicken.The chicken is 40 m from the gate on a bearing of 295°.
What is the bearing of the chicken from its owner?Write your answer, correct to the nearest degree.

2014 FURMATH EXAM 2 20
Module 3 – Question 1 – continued
Module 3: Graphs and relations
Question 1 (8 marks)Fastgrow and Booster are two tomato fertilisers that contain the nutrients nitrogen and phosphorus.The amount of nitrogen and phosphorus in each kilogram of Fastgrow and Booster is shown in the table below.
1 kg of Booster 1 kg of Fastgrow
Nitrogen 0.05 kg 0.05 kg
Phosphorus 0.02 kg 0.06 kg
a. How many kilograms of phosphorus are in 2 kg of Booster? 1 mark
b. If 100 kg of Booster and 400 kg of Fastgrow are mixed, how many kilograms of nitrogen would be in the mixture? 1 mark
Arthur is a farmer who grows tomatoes.He mixes quantities of Booster and Fastgrow to make his own fertiliser.Let x be the number of kilograms of Booster in Arthur’s fertiliser.Let y be the number of kilograms of Fastgrow in Arthur’s fertiliser.Inequalities 1 to 4 represent the nitrogen and phosphorus requirements of Arthur’s tomato fi eld.
Inequality 1 x ≥ 0
Inequality 2 y ≥ 0
Inequality 3 (nitrogen) 0.05x + 0.05y ≥ 200
Inequality 4 (phosphorus) 0.02x + 0.06y ≥ 120
Arthur’s tomato fi eld also requires at least 180 kg of the nutrient potassium.Each kilogram of Booster contains 0.06 kg of potassium.Each kilogram of Fastgrow contains 0.04 kg of potassium.
c. Inequality 5 represents the potassium requirements of Arthur’s tomato fi eld.
Write down Inequality 5 in terms of x and y. 1 mark
Inequality 5 (potassium)

21 2014 FURMATH EXAM 2
Module 3 – continuedTURN OVER
The lines that represent the boundaries of Inequalities 3, 4 and 5 are shown in the graph below.
1000O 2000 3000 4000 5000 6000
1000
2000
3000
4000
5000
6000
y
x
A
d. i. Using the graph above, write down the equation of line A. 1 mark
ii. On the graph above, shade the region that satisfi es Inequalities 1 to 5. 1 mark
(Answer on the graph above.)
Arthur would like to use the least amount of his own fertiliser to meet the nutrient requirements of his tomato fi eld and still satisfy Inequalities 1 to 5.
e. i. What weight of his own fertiliser will Arthur need to make? 1 mark
ii. On the graph above, show the point(s) where this solution occurs. 2 marks
(Answer on the graph above.)

2014 FURMATH EXAM 2 22
Module 3 – continued
Question 2 (3 marks)The cost, C, in dollars, of producing n kilograms of tomatoes is given by
C = 1.25n + 36 000 0 ≤ n ≤ 40 000
The revenue, R, in dollars, from selling n kilograms of tomatoes is given by
R = 3.5n 0 ≤ n ≤ 40 000
The cost, C, for the production of n kilograms of tomatoes is graphed below.
140000
120000
100000
80000
60000
40000
20000
O 10000 20000n (kg)
30000 40000
C ($)
a. On the graph above, draw the revenue equation line, R = 3.5n. 1 mark
(Answer on the graph above.)
b. What profi t will Arthur make if he sells a total of 20 000 kg of tomatoes? 2 marks

23 2014 FURMATH EXAM 2
END OF MODULE 3TURN OVER
Question 3 (4 marks)A shop owner bought 100 kg of Arthur’s tomatoes to sell in her shop.She bought the tomatoes for $3.50 per kilogram.The shop owner will offer a discount to her customers based on the number of kilograms of tomatoes they buy in one bag.The revenue, in dollars, that the shop owner receives from selling the tomatoes is given by
revenue
5 4 0 210 8 4 2 2 10
2 10 10 100
.. ( )
( )
n nn n
a n n
where n is the number of kilograms of tomatoes that a customer buys in one bag.
a. What is the revenue that the shop owner receives from selling 8 kg of tomatoes in one bag? 1 mark
b. Show that a has the value 42.8 in the revenue equation above. 1 mark
c. Find the maximum number of kilograms of tomatoes that a customer can buy in one bag, so that the shop owner never makes a loss. 2 marks
2014 FURMATH EXAM 2 24
Module 4 – Question 1 – continued
Module 4: Business-related mathematics
Question 1 (5 marks)The adult membership fee for a cricket club is $150.Junior members are offered a discount of $30 off the adult membership fee.
a. Write down the discount for junior members as a percentage of the adult membership fee. 1 mark
Adult members of the cricket club pay $15 per match in addition to the membership fee of $150.
b. If an adult member played 12 matches, what is the total this member would pay to the cricket club? 1 mark
If a member does not pay the membership fee by the due date, the club will charge simple interest at the rate of 5% per month until the fee is paid.Michael paid the $150 membership fee exactly two months after the due date.
c. Calculate, in dollars, the interest that Michael will be charged. 1 mark

25 2014 FURMATH EXAM 2
Module 4 – continuedTURN OVER
The cricket club received a statement of the transactions in its savings account for the month of January 2014.The statement is shown below.
Date Details Deposit Withdrawal Balance
01 Jan. 2014 Brought Forward $58 950.00
08 Jan. 2014 Match Fees $750.00 $59 700.00
17 Jan. 2014 Withdrawal $ $42 700.00
23 Jan. 2014 Membership Fees $4500.00 $47 200.00
31 Jan. 2014 Interest $125.12 $47 325.12
d. i. Calculate the amount of the withdrawal on 17 January 2014. 1 mark
ii. Interest for this account is calculated on the minimum balance for the month and added to the account on the last day of the month.
What is the annual rate of interest for this account? Write your answer, correct to one decimal place. 1 mark

2014 FURMATH EXAM 2 26
Module 4 – continued
Question 2 (4 marks)A sponsor of the cricket club has invested $20 000 in a perpetuity.The annual interest from this perpetuity is $750. The interest from the perpetuity is given to the best player in the club every year, for a period of 10 years.
a. What is the annual rate of interest for this perpetuity investment? 1 mark
b. After 10 years, how much money is still invested in the perpetuity? 1 mark
c. The average rate of infl ation over the next 10 years is expected to be 3% per annum. i. Michael was the best player in 2014 and he considered purchasing cricket equipment that
was valued at $750.
What is the expected price of this cricket equipment in 2015? 1 mark
ii. What is the 2014 value of cricket equipment that could be bought for $750 in 2024? Write your answer, correct to the nearest dollar. 1 mark
27 2014 FURMATH EXAM 2
Module 4 – continuedTURN OVER
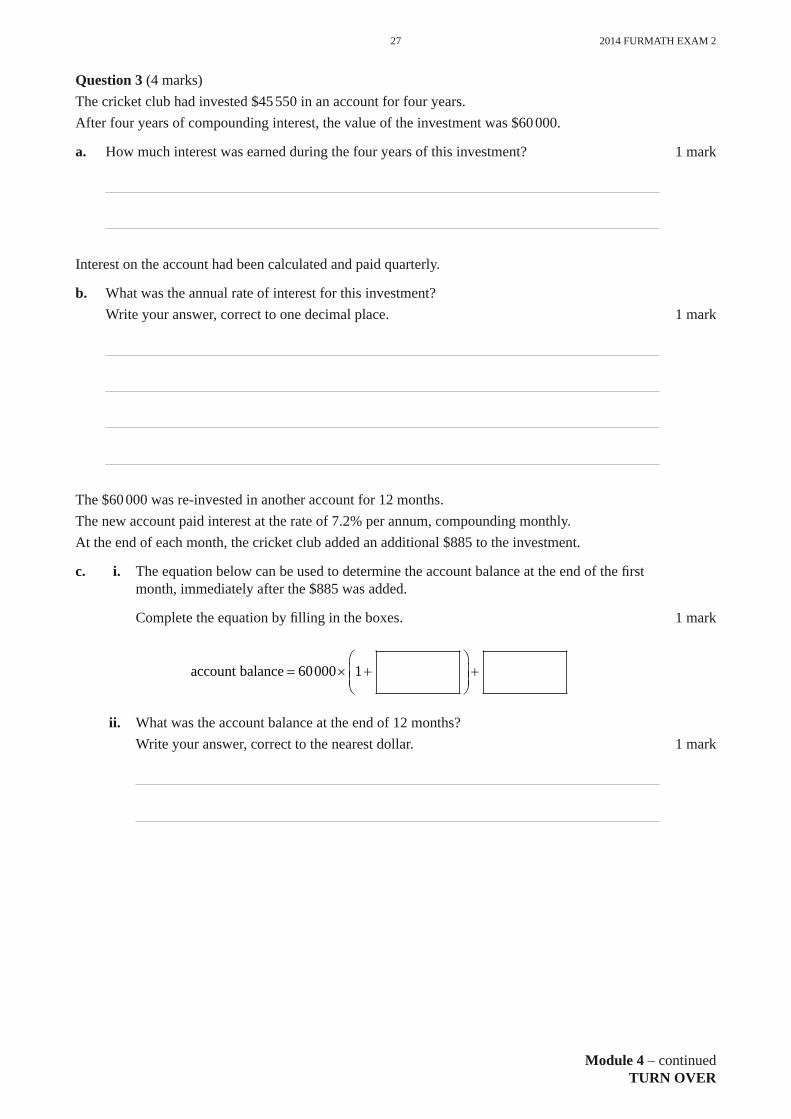
Question 3 (4 marks)The cricket club had invested $45 550 in an account for four years.After four years of compounding interest, the value of the investment was $60 000.
a. How much interest was earned during the four years of this investment? 1 mark
Interest on the account had been calculated and paid quarterly.
b. What was the annual rate of interest for this investment? Write your answer, correct to one decimal place. 1 mark
The $60 000 was re-invested in another account for 12 months.The new account paid interest at the rate of 7.2% per annum, compounding monthly.At the end of each month, the cricket club added an additional $885 to the investment.
c. i. The equation below can be used to determine the account balance at the end of the fi rst month, immediately after the $885 was added.
Complete the equation by fi lling in the boxes. 1 mark
account balance
60000 1
ii. What was the account balance at the end of 12 months? Write your answer, correct to the nearest dollar. 1 mark

2014 FURMATH EXAM 2 28
END OF MODULE 4
Question 4 (2 marks)The cricket club borrowed $400 000 to build a clubhouse.Interest is calculated at the rate of 4.5% per annum, compounding monthly.The cricket club will make monthly repayments of $2500.After a number of monthly repayments, the balance of the loan will be reduced to $143 585.33
What percentage of the next monthly repayment will reduce the balance of the loan?Write your answer, correct to the nearest percentage.

29 2014 FURMATH EXAM 2
Module 5 – continuedTURN OVER
Module 5: Networks and decision mathematics
Question 1 (2 marks)Four members of a train club, Andrew, Brianna, Charlie and Devi, have joined one or more interest groups for electric, steam, diesel or miniature trains.The edges of the bipartite graph below show the interest groups that these four train club members have joined.
Andrew
Brianna
Charlie
Devi
electric trains
steam trains
diesel trains
miniature trains
a. How many of these four members have joined the steam trains interest group? 1 mark
b. Which interest group have both Brianna and Charlie joined? 1 mark

2014 FURMATH EXAM 2 30
Module 5 – Question 2 – continued
Question 2 (4 marks)Planning a train club open day involves four tasks.Table 1 shows the number of hours that each club member would take to complete these tasks.
Table 1
Task Andrew Brianna Charlie Devi
publicity 13 12 10 10
fi nances 9 10 11 11
equipment 8 12 11 10
catering 9 10 11 8
The Hungarian algorithm will be used to allocate the tasks to club members so that the total time taken to complete the tasks is minimised.The fi rst step of the Hungarian algorithm is to subtract the smallest element in each row of Table 1 from each of the elements in that row.The result of this step is shown in Table 2 below.
a. Complete Table 2 by fi lling in the missing numbers for Andrew. 1 mark
Table 2
Task Andrew Brianna Charlie Devi
publicity 3 2 0 0
fi nances 1 2 2
equipment 4 3 2
catering 2 3 0
After completing Table 2, Andrew decided that an allocation of tasks to minimise the total time taken was not yet possible using the Hungarian algorithm.
b. Explain why Andrew made this decision. 1 mark

31 2014 FURMATH EXAM 2
Module 5 – continuedTURN OVER
Table 3 shows the fi nal result of all steps of the Hungarian algorithm.
Table 3
Task Andrew Brianna Charlie Devi
publicity 4 2 0 1
fi nances 0 0 1 2
equipment 0 3 2 2
catering 1 1 2 0
c. i. Which task should be allocated to Andrew? 1 mark
ii. How many hours in total are used to plan for the open day? 1 mark

2014 FURMATH EXAM 2 32
Module 5 – continued
Question 3 (4 marks)The diagram below shows a network of train lines between fi ve towns: Attard, Bower, Clement, Derrin and Eden.The numbers indicate the distances, in kilometres, that are travelled by train between connected towns.
Derrin
Eden
Attard
Bower
16060
Clement
40
120
70 150
80
100
130
Charlie followed an Eulerian path through this network of train lines.
a. i. Write down the names of the towns at the start and at the end of Charlie’s path. 1 mark
ii. What distance did he travel? 1 mark
Brianna will follow a Hamiltonian path from Bower to Attard.
b. What is the shortest distance that she can travel? 1 mark
The train line between Derrin and Eden will be removed. If one other train line is removed from the network, Andrew would be able to follow an Eulerian circuit through the network of train lines.
c. Which other train line should be removed? In the boxes below, write down the pair of towns that this train line connects. 1 mark
between and

33 2014 FURMATH EXAM 2
END OF MODULE 5TURN OVER
Question 4 (5 marks)To restore a vintage train, 13 activities need to be completed.The network below shows these 13 activities and their completion times in hours.
start
A, 5
B, 5
C, 6 G, 3
D, 2
E, 2
H, 4 K, 7
L, 3
M, 6I, 3
J, 2F, 4
finish
a. Determine the earliest starting time of activity F. 1 mark
The minimum time in which all 13 activities can be completed is 21 hours.
b. What is the latest starting time of activity L? 1 mark
c. What is the fl oat time of activity J ? 1 mark
Just before they started restoring the train, the members of the club needed to add another activity, X, to the project.Activity X will take seven hours to complete.Activity X has no predecessors, but must be completed before activity G starts.
d. What is the latest starting time of activity X if it is not to increase the minimum completion time of the project? 1 mark
Activity A can be crashed by up to four hours at an additional cost of $90 per hour. This may reduce the minimum completion time for the project, including activity X.
e. Determine the least cost of crashing activity A to give the greatest reduction in the minimum completion time of the project. 1 mark

2014 FURMATH EXAM 2 34
Module 6 – Question 1 – continued
Module 6: Matrices
Question 1 (6 marks)A small city is divided into four regions: Northern (N), Eastern (E), Southern (S) and Western (W).The number of adult males (M) and the number of adult females (F) living in each of the regions in 2013 is shown in matrix V below.
M F
V
NESW
1360 14601680 1920900 1060
1850 1770
a. Write down the order of matrix V. 1 mark
b. How many adult males lived in the Western region in 2013? 1 mark
c. In terms of the population of the city, what does the sum of the elements in the second column of matrix V represent? 1 mark
An election is to be held in the city.All of the adults in each of the regions of the city will vote in the election.One of the election candidates, Ms Aboud, estimates that she will receive 45% of the male votes and 55% of the female votes in the election.This information is shown in matrix P below.
PMF
0 450 55..
d. Explain, in terms of rows and columns, why the matrix product V × P is defi ned. 1 mark
35 2014FURMATHEXAM2
Module 6–continuedTURN OVER
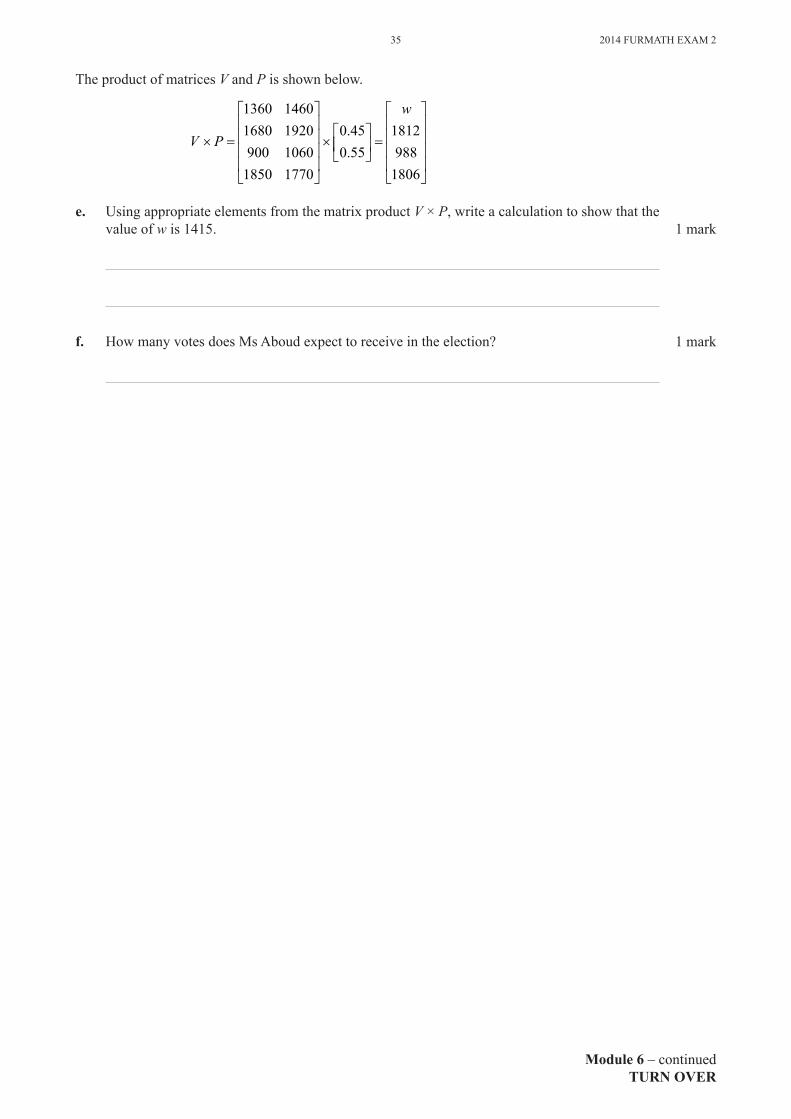
TheproductofmatricesVandPisshownbelow.
V P× =
×
1360 14601680 1920900 1060
1850 1770
0 450 55..
=
w1812988
1806
e. UsingappropriateelementsfromthematrixproductV × P,writeacalculationtoshowthatthevalueofwis1415. 1mark
f. HowmanyvotesdoesMsAboudexpecttoreceiveintheelection? 1mark

2014FURMATHEXAM2 36
Module 6 – Question 2–continued
Question 2 (6marks)Therearethreecandidatesintheelection:MsAboud(A),MrBroad(B)andMrChoi(C).Theelectioncampaignwillrunforsixmonths,fromthestartofJanuaryuntiltheelectionattheendofJune.Asurveyofvotersfoundthatvotingpreferencecanchangefrommonthtomonthleadinguptotheelection.Thetransitiondiagrambelowshowsthepercentageofvoterswhoareexpectedtochangetheirpreferredcandidatefrommonthtomonth.
80%
10%10%
40%5%
20%
20%40%
75%
A
B
C
a. i. OfthevoterswhopreferMrChoithismonth,whatpercentageareexpectedtopreferMsAboudnextmonth? 1mark
ii. OfthevoterswhopreferMsAboudthismonth,whatpercentageareexpectedtochangetheirpreferredcandidatenextmonth? 1mark
InJanuary,12000votersareexpectedinthecity.ThenumberofvotersinthecityisexpectedtoremainconstantuntiltheelectionisheldinJune.ThestatematrixthatindicatesthenumberofvoterswhoareexpectedtohaveapreferenceforeachcandidateinJanuary,S1,isgivenbelow.
SABC
1
600038402160
=
b. HowmanyvotersareexpectedtochangetheirpreferencetoMrBroadinFebruary? 1mark

37 2014FURMATHEXAM2
Module 6–continuedTURN OVER
Theinformationinthetransitiondiagramhasbeenusedtowritethetransitionmatrix,T,shownbelow.
this monthA B C
T =0 75 0 10 0 200 05 0 80 0 400 20 0
. . .
. . .
. .. .10 0 40
ABC
next month
c. i. EvaluatethematrixS3 = T 2S1andwriteitdowninthespacebelow. Writetheelements,correcttothenearestwholenumber. 1mark
S3 =
ii. WhatinformationdoesmatrixS3contain? 1mark
d. UsingmatrixT,howmanyvoteswouldthewinneroftheelectioninJunebeexpectedtoreceive?
Writeyouranswer,correcttothenearestwholenumber. 1mark

2014FURMATHEXAM2 38
END OF QUESTION AND ANSWER BOOK
Question 3 (3marks)MrChoimayneedtowithdrawfromtheelectionattheendofMay.MatrixT,shownbelow,showsthepercentageofvoterswhochangetheirpreferredcandidate,frommonthtomonth,beforeMrChoiwouldwithdrawfromtheelection.
this monthA B C
T =0 75 0 10 0 200 05 0 80 0 400 20 0
. . .
. . .
. .. .10 0 40
ABC
next month
MatrixT1,shownbelow,showsthepercentageofvoterswhochangetheirpreferredcandidate,fromMaytoJune,afterMrChoiwouldwithdrawfromtheelection.
May
June
A B C
TABC
1
0 75 0 15 0 60 25 0 85 0 4
0 0 0=
. . .
. . .
ConsiderthevoterswhopreferredMrBroadinMayandwhowereexpectedtopreferMrChoiinJune.
a. WhatpercentageofthesevotersarenowexpectedtopreferMrBroadinJune? 1mark
ThestatematrixthatindicatesthenumberofvoterswhoareexpectedtohaveapreferenceforeachcandidateinJanuary,S1,isgivenbelow.
SABC
1
600038402160
=
b. IfMrChoiwithdraws,howmanyvotesisMrBroadexpectedtoreceiveintheelectioninJune?
Writeyouranswer,correcttothenearestvote. 2marks

FURTHER MATHEMATICS
Written examinations 1 and 2
FORMULA SHEET
Directions to students
Detach this formula sheet during reading time.
This formula sheet is provided for your reference.
© VICTORIAN CURRICULUM AND ASSESSMENT AUTHORITY 2014

FURMATH EXAM 1 & 2 2
Further Mathematics formulas
Core: Data analysis
standardised score: z x xsx
=−
least squares regression line: y = a + bx, where b rssy
x= and a y bx= −
residual value: residual value = actual value – predicted value
seasonal index: seasonal index = actual figuredeseasonalised figure
Module 1: Number patterns
arithmetic series: a + (a + d ) + … + (a + (n – 1)d ) = n a n d n a l2
2 12
+ −[ ] = +( ) ( )
geometric series: a + ar + ar2 + … + arn – 1 = a r
r
n( )11−−
, r ≠ 1
infinite geometric series: a + ar + ar2 + ar3 + … = arr
11
−<,
Module 2: Geometry and trigonometry
area of a triangle: 12bc Asin
Heron’s formula: A = s s a s b s c( )( )( )− − − , where s a b c= + +12
( )
circumference of a circle: 2π r
area of a circle: π r 2
volume of a sphere: 43π r 3
surface area of a sphere: 4π r 2
volume of a cone: 13π r 2h
volume of a cylinder: π r 2h
volume of a prism: area of base × height
volume of a pyramid: 13
area of base × height

3 FURMATH EXAM 1 & 2
END OF FORMULA SHEET
Pythagoras’ theorem: c2 = a2 + b2
sine rule: aA
bB
cCsin sin sin
= =
cosine rule: c2 = a2 + b2 – 2ab cos C
Module 3: Graphs and relations
Straight-line graphs
gradient (slope): m y yx x
=−−
2 1
2 1
equation: y = mx + c
Module 4: Business-related mathematics
simple interest: I T=Pr100
compound interest: A = PRn, where R r= +1
100
hire-purchase: effective rate of interest ≈+
×2
1n
nflat rate
Module 5: Networks and decision mathematics
Euler’s formula: v + f = e + 2
Module 6: Matrices
determinant of a 2 × 2 matrix: A a bc d=
; det A
acbd ad bc= = −
inverse of a 2 × 2 matrix: AAd bc a
− =−
−
1 1det
where det A ≠ 0