Embed Size (px)
Citation preview
1. 주주 여러분께 드리는 말씀 04
- 영업 개황 보고
2. 영업보고서
1. 회사의 개황 07
2. 영업의 경과 및 성과 09
3. 모회사, 자회사 및 기업결합 사항 등 10
4. 최근 3년간 영업실적 및 재무상태 1 1
5. 회사가 대처할 과제 15
6. 이사와 감사의 현황 16
7. 대주주 현황 16
8. 회사·회사 및 자회사 또는 회사의 자회사의 타회사에 대한 출자현황 17
9. 주요 채권자 등 17
10. 결산기 후에 생긴 중요한 사실 17
11. 그밖에 영업에 관한 사항으로서 중요하다고 인정하는 사항 17
3. 감사보고서
1. 감사위원회의 감사보고서 19
2. 감사위원회의 내부회계관리제도 평가보고서 20
3. 외부감사인의 감사보고서 21
4. 외부감사인의 연결감사보고서 22
4. 결산보고서
1. 재무상태표 24
2. 손익계산서 26
3. 포괄손익계산서 28
4. 자본변동표 28
5. 이익잉여금처분계산서(안) 29
6. 현금흐름표 30
7. 재무제표에 대한 주석(별지 참조)
8. 연결재무상태표 32
9. 연결손익계산서 35
10. 연결포괄손익계산서 37
11. 연결자본변동표 38
12. 연결현금흐름표 39
13. 연결재무제표에 대한 주석(별지 참조)
Business Report (English) 41
2 0 1 4 G I I R A n n u a l R e p o r t
G2R 2014AR_(내지)_*G2R 2009AR_(내지) 15. 3. 3. 오전 11:17 페이지 3
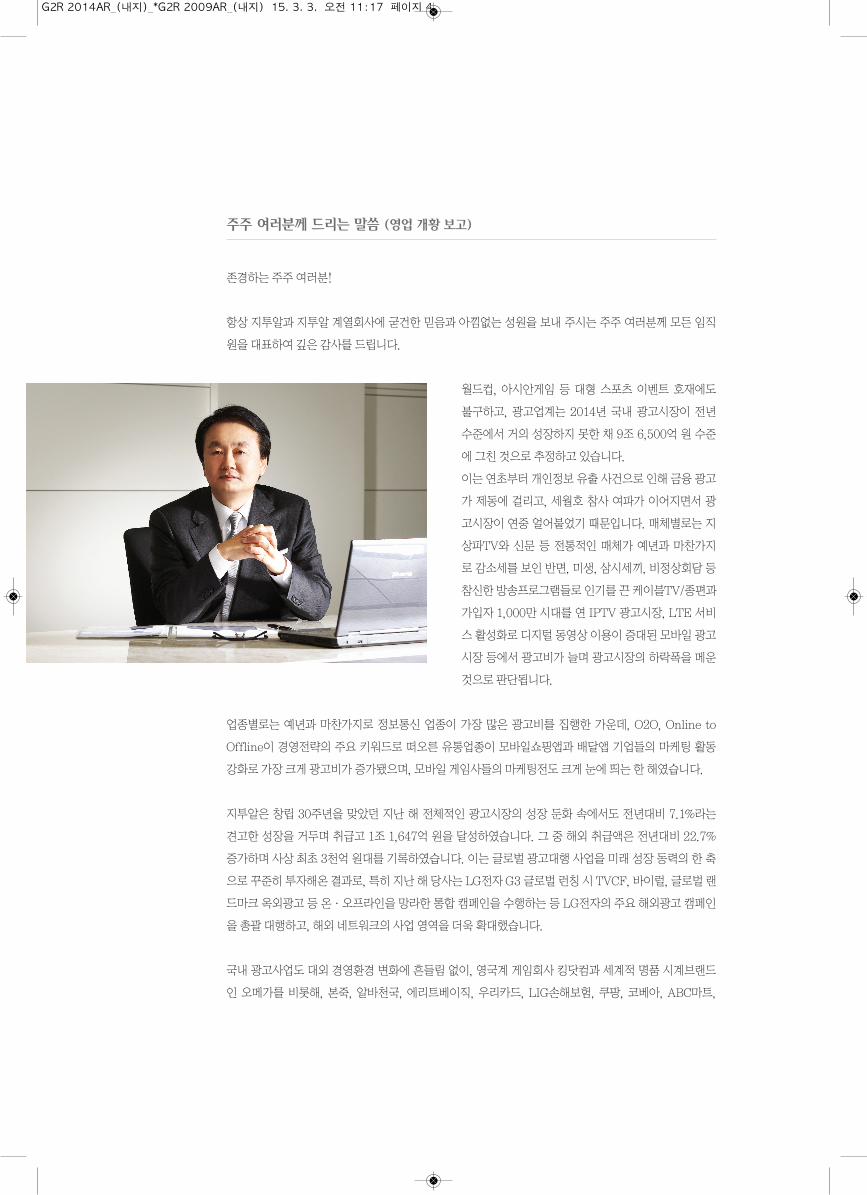
주주 여러분께 드리는 말씀 (영업 개황 보고)
존경하는 주주 여러분!
항상 지투알과 지투알 계열회사에 굳건한 믿음과 아낌없는 성원을 보내 주시는 주주 여러분께 모든 임직
원을 대표하여 깊은 감사를 드립니다.
월드컵, 아시안게임 등 대형 스포츠 이벤트 호재에도
불구하고, 광고업계는 2014년 국내 광고시장이 전년
수준에서 거의 성장하지 못한 채 9조 6,500억 원 수준
에 그친 것으로 추정하고 있습니다.
이는 연초부터 개인정보 유출 사건으로 인해 금융 광고
가 제동에 걸리고, 세월호 참사 여파가 이어지면서 광
고시장이 연중 얼어붙었기 때문입니다. 매체별로는 지
상파TV와 신문 등 전통적인 매체가 예년과 마찬가지
로 감소세를 보인 반면, 미생, 삼시세끼, 비정상회담 등
참신한 방송프로그램들로 인기를 끈 케이블TV/종편과
가입자 1,000만 시대를 연 IPTV 광고시장, LTE 서비
스 활성화로 디지털 동영상 이용이 증대된 모바일 광고
시장 등에서 광고비가 늘며 광고시장의 하락폭을 메운
것으로 판단됩니다.
업종별로는 예년과 마찬가지로 정보통신 업종이 가장 많은 광고비를 집행한 가운데, O2O, Online to
Offline이 경영전략의 주요 키워드로 떠오른 유통업종이 모바일쇼핑앱과 배달앱 기업들의 마케팅 활동
강화로 가장 크게 광고비가 증가됐으며, 모바일 게임사들의 마케팅전도 크게 눈에 띄는 한 해였습니다.
지투알은 창립 30주년을 맞았던 지난 해 전체적인 광고시장의 성장 둔화 속에서도 전년대비 7.1%라는
견고한 성장을 거두며 취급고 1조 1,647억 원을 달성하였습니다. 그 중 해외 취급액은 전년대비 22.7%
증가하며 사상 최초 3천억 원대를 기록하였습니다. 이는 글로벌 광고대행 사업을 미래 성장 동력의 한 축
으로 꾸준히 투자해온 결과로, 특히 지난 해 당사는 LG전자 G3 글로벌 런칭 시 TVCF, 바이럴, 글로벌 랜
드마크 옥외광고 등 온·오프라인을 망라한 통합 캠페인을 수행하는 등 LG전자의 주요 해외광고 캠페인
을 총괄 대행하고, 해외 네트워크의 사업 영역을 더욱 확대했습니다.
국내 광고사업도 대외 경영환경 변화에 흔들림 없이, 영국계 게임회사 킹닷컴과 세계적 명품 시계브랜드
인 오메가를 비롯해, 본죽, 알바천국, 에리트베이직, 우리카드, LIG손해보험, 쿠팡, 코베아, ABC마트,
G2R 2014AR_(내지)_*G2R 2009AR_(내지) 15. 3. 3. 오전 11:17 페이지 4
광동제약, 해태음료, 서울우유 등 각 업종의 대표 광고주들을 신규 영입하는 성과를 거뒀으며, BTL 분야
에서는 2015 괴산 세계 유기농 산업엑스포, 금호타이어 글로벌 전시 등 신규 광고주 개발을 이뤘습니다.
당사는 성공캠페인 창출에서도 큰 결실을 거뒀습니다. 지난 한 해 광고계 최고의 화제작이었던 우아한형
제들의 배달의민족 캠페인은 ‘우리가 어떤 민족입니까’라는 유행어를 낳으며, 배달의민족 배달앱이 국내
최고의 자리에 오르는 데 이바지하였고, 대한항공은 <내가 사랑한 유럽 TOP10> 광고로 에피어워드 코리
아 최고상 수상과 대한민국광고대상 4년 연속 대상 수상이라는 금자탑을 세웠습니다. 잇따른 성공캠페인
을 탄생시킨 결과로, 당사는 올해 초 열린 TVCF 어워드에서 2014년 최고의 광고회사로 선정되기도 하
였습니다. 이외에도 2014년 인천 아시안 게임 개폐회식과 오송국제바이오산업엑스포, 부산 한·아세안
특별정상회의 문화행사를 성공적으로 대행했으며, 한국미혼모지원네트워크와 초록우산어린이재단 등의
공익광고를 재능기부 형식으로 제작해 제공하여 사회적 책무 또한 소홀히 하지 않았습니다.
존경하는 주주 여러분! 각 경제연구기관들이 올해 국내 경제 성장률을 3% 내외로 전망하고 있는 가운데,
국내 광고시장은 지난 해 세월호 참사 여파로 하락폭이 컸던 지상파TV와 멀티미디어 이용 증가 트렌드가
지속되고 있는 모바일, IPTV가 중심이 돼, 국내 경제 성장률과 비슷한 수준의 성장을 기록할 것으로 전망
됩니다. 전체 광고시장은 다소나마 회복세를 보이겠지만, 일감몰아주기 이슈와 광고제작 원가 증대, 정부
의 기업체 정년연장 시책에 따른 인건비 상승 등 광고회사의 수익성 악화 요인은 아직 산재되어 있는 상황
입니다. 이에 당사는 오로지 성장만이 살 길이라는 각오로, 신규 광고주 개발과 전통적 광고대행 영역을
벗어난 신(新) 사업 추진에 매진함과 동시에, G4, OLED TV 등 LG의 시장 선도 제품의 글로벌 사업 성과
창출을 지원하고, 당사의 글로벌 사업 영역을 더욱 확대함으로써 양적인 성장 달성을 위해 임직원 모두가
최선을 다할 것입니다. 또한 지난 해 업계 최초로 독자 개발한 멀티미디어 플랫폼 광고효과 측정모델
MPM과 4-Screen 통합 미디어플래닝 솔루션 MPOPS PRO를 한층 정교화하는 등 당사만의 차별화된
소비자 및 시장 감지 능력을 제고해 질적으로도 더욱 강해질 것입니다.
올 해는 당사에게 있어 새로운 30년을 시작하는 중요한 해입니다. 겸허한 마음으로 주주 여러분과 고객
사, 협력업체 및 지역 사회, 당사의 임직원 모두에게 사랑 받는 기업이 되도록 노력하겠습니다. 당사에 늘
관심을 갖고 지켜봐 주시는 주주 여러분께 진심으로 감사 드리며, 여러분의 가정에 건강과 행복이 충만하
시기를 진심으로 기원합니다.
감사합니다.
2015년 3월 13일
주식회사 지투알 대표이사 김 종 립
G2R 2014AR_(내지)_*G2R 2009AR_(내지) 15. 3. 3. 오전 11:17 페이지 5
회사의 개황
영업의 경과 및 성과
모회사, 자회사 및 기업결합 사항 등
최근 3년간 영업실적 및 재무상태
회사가 대처할 과제
이사와 감사의 현황
대주주 현황
회사·회사 및 자회사 또는 회사의 자회사의 타회사에 대한 출자현황
주요 채권자 등
결산기 후에 생긴 중요한 사실
그밖에 영업에 관한 사항으로서 중요하다고 인정하는 사항
영 업 보 고 서
G2R 2014AR_(내지)_*G2R 2009AR_(내지) 15. 3. 3. 오전 11:17 페이지 6
2 0 1 4 G I I R A n n u a l R e p o r t 0 7
Ⅰ. 회사의 개황
1. 회사의 목적 (정관상의 사업목적)
· 지주회사업
· 광고업
· 인쇄 및 출판업
· 기타 제품 제조업
· 토목건설업
· 건물설비 설치 공사업
· 전기 및 통신공사업
· 건축마무리 공사업
· 도소매 및 상품중개업
· 부동산 임대, 공급 및 관련서비스업
· 시장조사 및 경영상담업
· 전문디자인업
· 기타 사업지원서비스업
· 영화산업
· 기타 오락, 문화 및 운동관련 산업
· 위 각 호에 부대되는 사업
2. 영업소 현황
영업소의 명칭 중요 사업내용 및 제품 소 재 지
본 사 지주회사업 서울시 마포구 마포대로 155
3. 종업원 현황 [2014년 12월 31일 현재]
구분 임원 재경 인사 법무 트래픽 기타 계
인원수 2 11 8 2 14 31 68
G2R 2014AR_(내지)_*G2R 2009AR_(내지) 15. 3. 3. 오전 11:17 페이지 7
2 0 1 4 G I I R A n n u a l R e p o r t 0 8
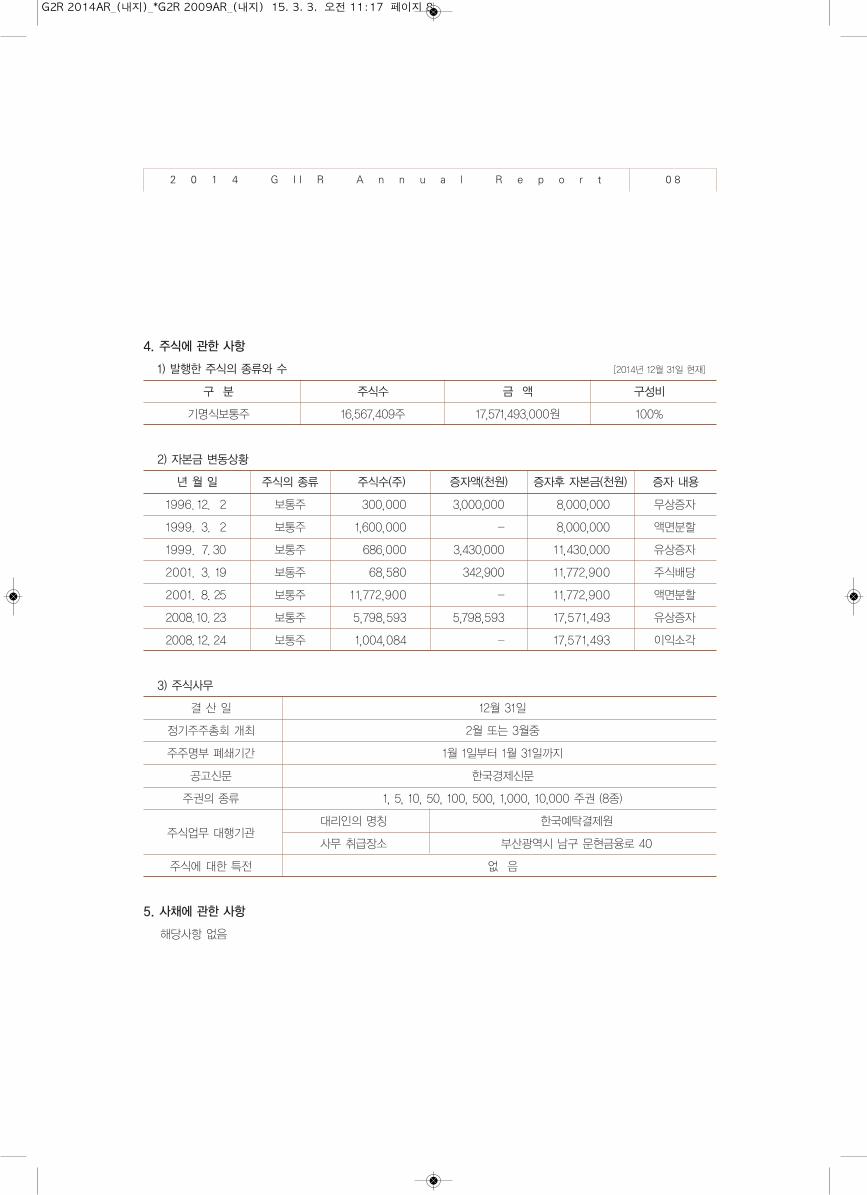
4. 주식에 관한 사항
1) 발행한 주식의 종류와 수 [2014년 12월 31일 현재]
구 분 주식수 금 액 구성비
기명식보통주 16,567,409주 17,571,493,000원 100%
2) 자본금 변동상황
년 월 일 주식의 종류 주식수(주) 증자액(천원) 증자후 자본금(천원) 증자 내용
1996. 12. 2 보통주 300,000 3,000,000 8,000,000 무상증자
1999. 3. 2 보통주 1,600,000 - 8,000,000 액면분할
1999. 7. 30 보통주 686,000 3,430,000 11,430,000 유상증자
2001. 3. 19 보통주 68,580 342,900 11,772,900 주식배당
2001. 8. 25 보통주 11,772,900 - 11,772,900 액면분할
2008.10. 23 보통주 5,798,593 5,798,593 17,571,493 유상증자
2008. 12. 24 보통주 1,004,084 - 17,571,493 이익소각
3) 주식사무
결 산 일 12월 31일
정기주주총회 개최 2월 또는 3월중
주주명부 폐쇄기간 1월 1일부터 1월 31일까지
공고신문 한국경제신문
주권의 종류 1, 5, 10, 50, 100, 500, 1,000, 10,000 주권 (8종)
주식업무 대행기관대리인의 명칭 한국예탁결제원
사무 취급장소 부산광역시 남구 문현금융로 40
주식에 대한 특전 없 음
5. 사채에 관한 사항
해당사항 없음
G2R 2014AR_(내지)_*G2R 2009AR_(내지) 15. 3. 3. 오전 11:17 페이지 8
2 0 1 4 G I I R A n n u a l R e p o r t 0 9
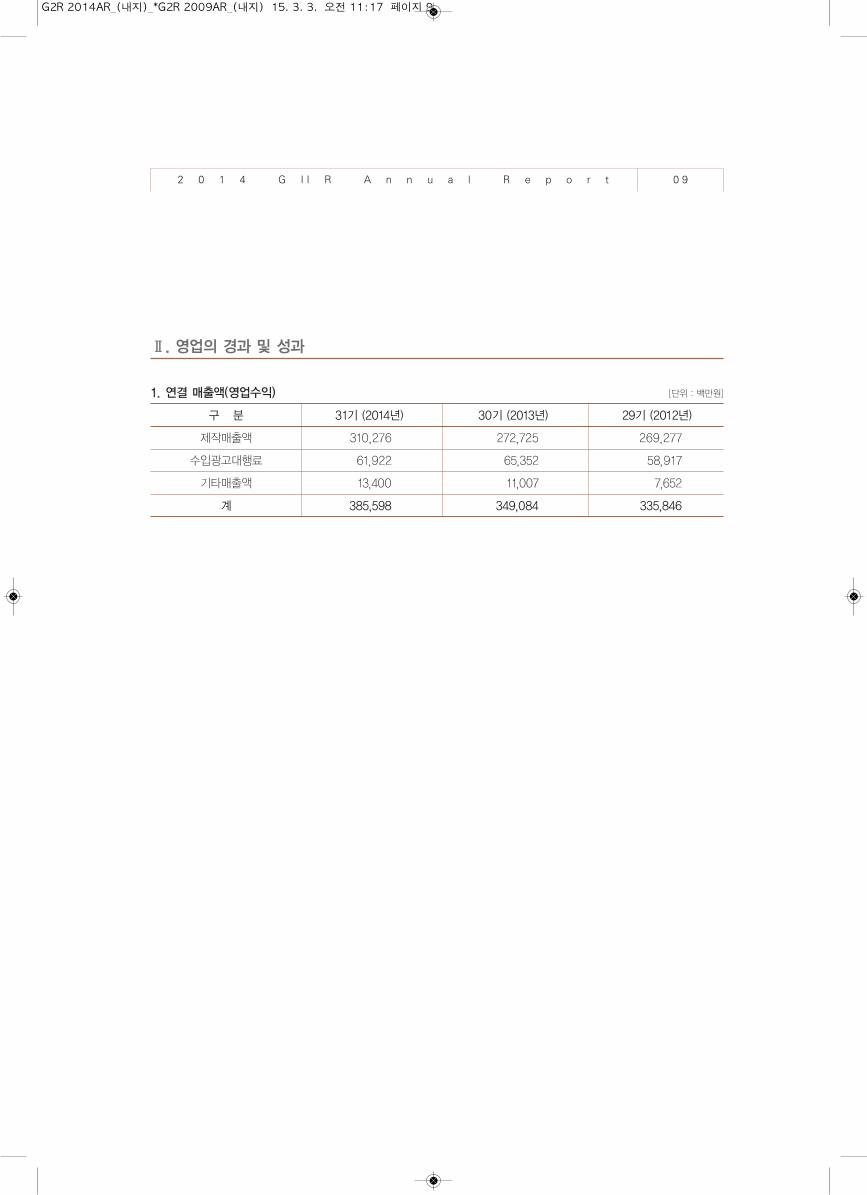
Ⅱ. 영업의 경과 및 성과
1. 연결 매출액(영업수익) [단위 : 백만원]
구 분 31기 (2014년) 30기 (2013년) 29기 (2012년)
제작매출액 310,276 272,725 269,277
수입광고대행료 61,922 65,352 58,917
기타매출액 13,400 11,007 7,652
계 385,598 349,084 335,846
G2R 2014AR_(내지)_*G2R 2009AR_(내지) 15. 3. 3. 오전 11:17 페이지 9
2 0 1 4 G I I R A n n u a l R e p o r t 1 0
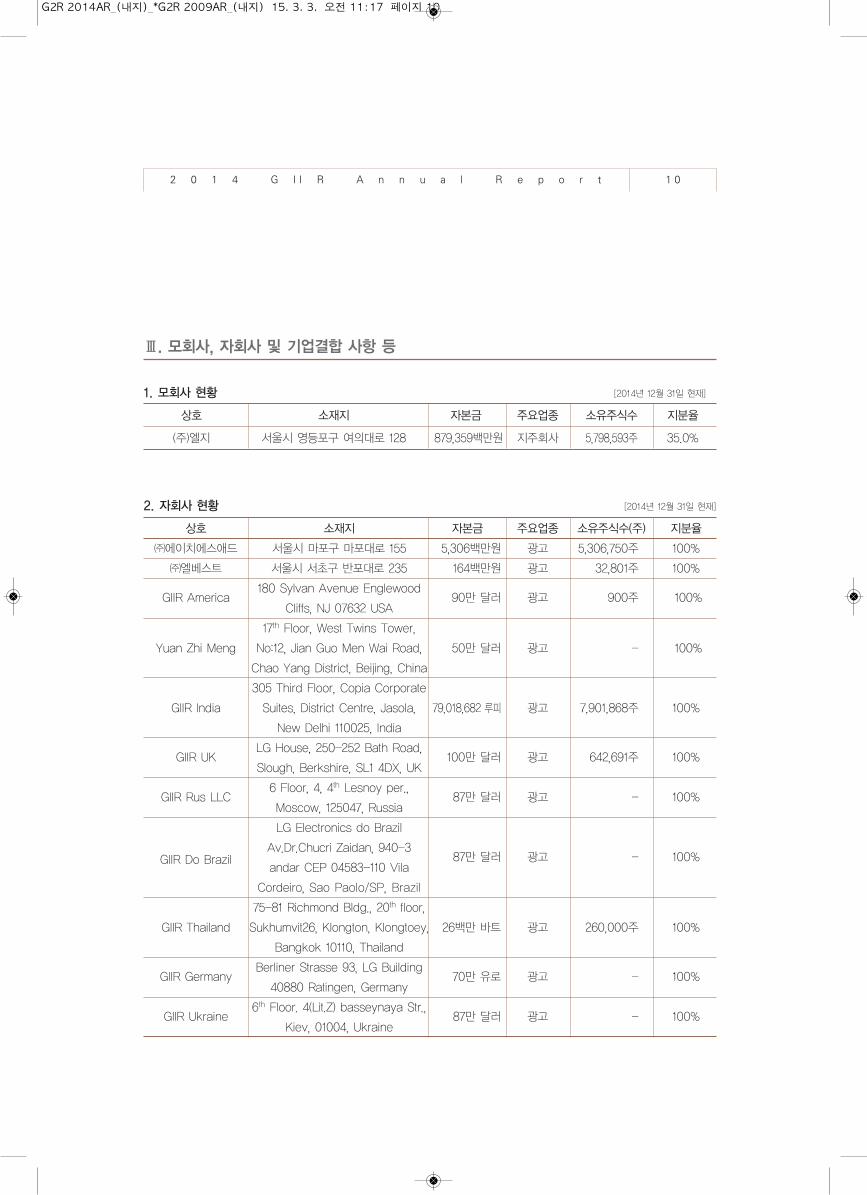
Ⅲ. 모회사, 자회사 및 기업결합 사항 등
1. 모회사 현황 [2014년 12월 31일 현재]
상호 소재지 자본금 주요업종 소유주식수 지분율
(주)엘지 서울시 영등포구 여의대로 128 879,359백만원 지주회사 5,798,593주 35.0%
2. 자회사 현황 [2014년 12월 31일 현재]
상호 소재지 자본금 주요업종 소유주식수(주) 지분율
㈜에이치에스애드 서울시 마포구 마포대로 155 5,306백만원 광고 5,306,750주 100%
㈜엘베스트 서울시 서초구 반포대로 235 164백만원 광고 32,801주 100%
GIIR America180 Sylvan Avenue Englewood
90만 달러 광고 900주 100%Cliffs, NJ 07632 USA
17th Floor, West Twins Tower,
Yuan Zhi Meng No:12, Jian Guo Men Wai Road, 50만 달러 광고 - 100%
Chao Yang District, Beijing, China
305 Third Floor, Copia Corporate
GIIR India Suites, District Centre, Jasola, 79,018,682 루피 광고 7,901,868주 100%
New Delhi 110025, India
GIIR UKLG House, 250-252 Bath Road,
100만 달러 광고 642,691주 100%Slough, Berkshire, SL1 4DX, UK
GIIR Rus LLC6 Floor, 4, 4th Lesnoy per.,
87만 달러 광고 - 100%Moscow, 125047, Russia
LG Electronics do Brazil
GIIR Do BrazilAv.Dr.Chucri Zaidan, 940-3
87만 달러 광고 - 100%andar CEP 04583-110 Vila
Cordeiro, Sao Paolo/SP, Brazil
75-81 Richmond Bldg., 20th floor,
GIIR Thailand Sukhumvit26, Klongton, Klongtoey, 26백만 바트 광고 260,000주 100%
Bangkok 10110, Thailand
GIIR GermanyBerliner Strasse 93, LG Building
70만 유로 광고 - 100%40880 Ratingen, Germany
GIIR Ukraine6th Floor. 4(Lit.Z) basseynaya Str.,
87만 달러 광고 - 100%Kiev, 01004, Ukraine
G2R 2014AR_(내지)_*G2R 2009AR_(내지) 15. 3. 3. 오전 11:17 페이지 10
2 0 1 4 G I I R A n n u a l R e p o r t 1 1
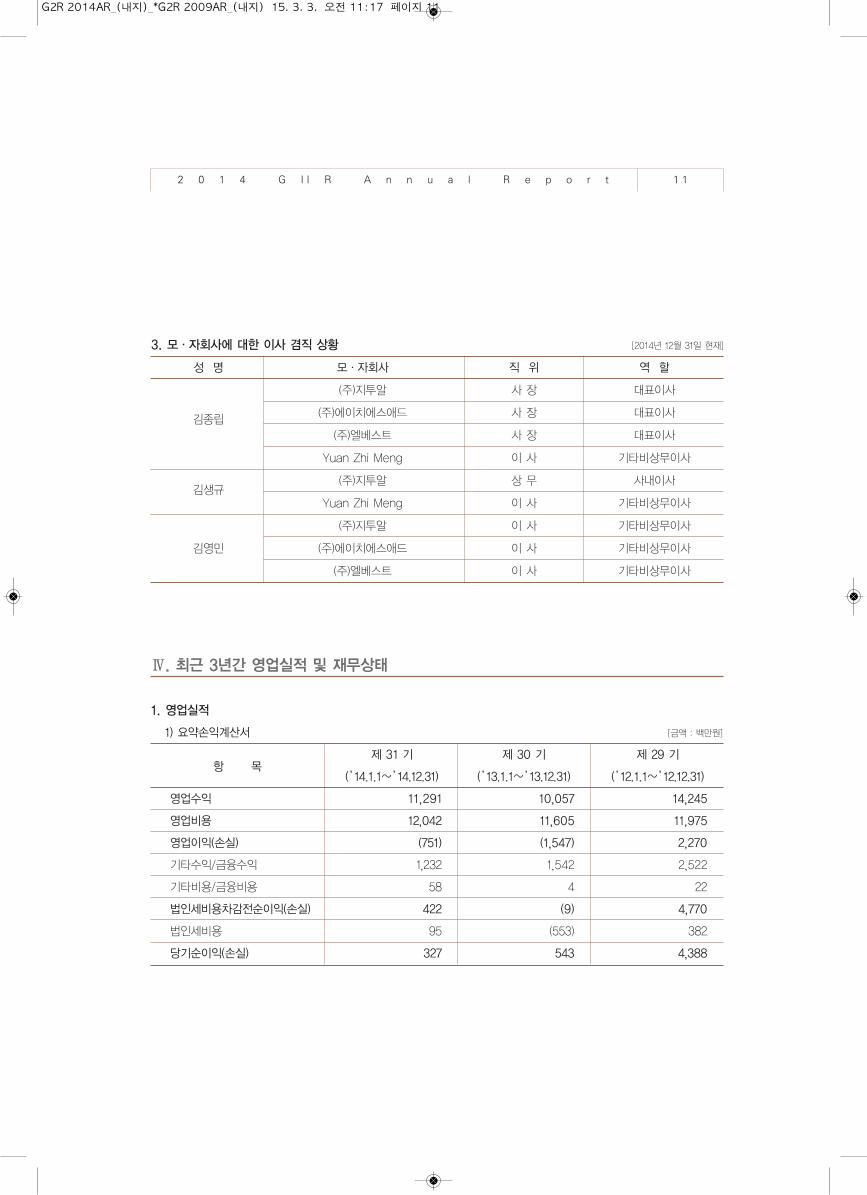
3. 모·자회사에 대한 이사 겸직 상황 [2014년 12월 31일 현재]
성 명 모·자회사 직 위 역 할
(주)지투알 사 장 대표이사
김종립(주)에이치에스애드 사 장 대표이사
(주)엘베스트 사 장 대표이사
Yuan Zhi Meng 이 사 기타비상무이사
김생규(주)지투알 상 무 사내이사
Yuan Zhi Meng 이 사 기타비상무이사
(주)지투알 이 사 기타비상무이사
김영민 (주)에이치에스애드 이 사 기타비상무이사
(주)엘베스트 이 사 기타비상무이사
Ⅳ. 최근 3년간 영업실적 및 재무상태
1. 영업실적
1) 요약손익계산서 [금액 : 백만원]
항 목제 31 기 제 30 기 제 29 기
(̀’14.1.1〜`’14.12.31) (̀’13.1.1〜`’13.12.31) (̀’12.1.1〜`’12.12.31)
영업수익 11,291 10,057 14,245
영업비용 12,042 11,605 11,975
영업이익(손실) (751) (1,547) 2,270
기타수익/금융수익 1,232 1,542 2,522
기타비용/금융비용 58 4 22
법인세비용차감전순이익(손실) 422 (9) 4,770
법인세비용 95 (553) 382
당기순이익(손실) 327 543 4,388
G2R 2014AR_(내지)_*G2R 2009AR_(내지) 15. 3. 3. 오전 11:17 페이지 11
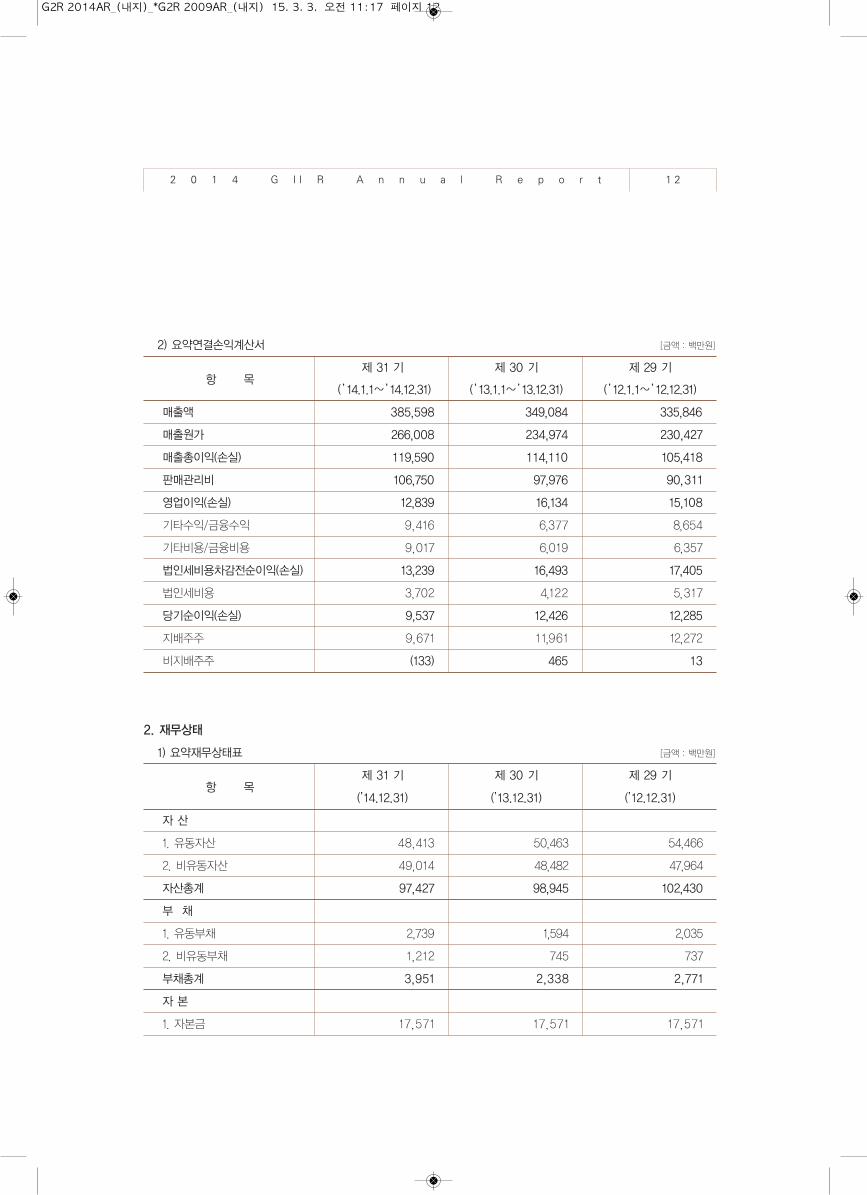
2) 요약연결손익계산서 [금액 : 백만원]
항 목제 31 기 제 30 기 제 29 기
(̀’14.1.1〜`’14.12.31) (̀’13.1.1〜`’13.12.31) (̀’12.1.1〜`’12.12.31)
매출액 385,598 349,084 335,846
매출원가 266,008 234,974 230,427
매출총이익(손실) 119,590 114,110 105,418
판매관리비 106,750 97,976 90,311
영업이익(손실) 12,839 16,134 15,108
기타수익/금융수익 9,416 6,377 8,654
기타비용/금융비용 9,017 6,019 6,357
법인세비용차감전순이익(손실) 13,239 16,493 17,405
법인세비용 3,702 4,122 5,317
당기순이익(손실) 9,537 12,426 12,285
지배주주 9,671 11,961 12,272
비지배주주 (133) 465 13
2. 재무상태
1) 요약재무상태표 [금액 : 백만원]
항 목제 31 기 제 30 기 제 29 기
(’14.12.31) (’13.12.31) (’12.12.31)
자 산
1. 유동자산 48,413 50,463 54,466
2. 비유동자산 49,014 48,482 47,964
자산총계 97,427 98,945 102,430
부 채
1. 유동부채 2,739 1,594 2,035
2. 비유동부채 1,212 745 737
부채총계 3,951 2,338 2,771
자 본
1. 자본금 17,571 17,571 17,571
2 0 1 4 G I I R A n n u a l R e p o r t 1 2
G2R 2014AR_(내지)_*G2R 2009AR_(내지) 15. 3. 3. 오전 11:17 페이지 12
2 0 1 4 G I I R A n n u a l R e p o r t 1 3
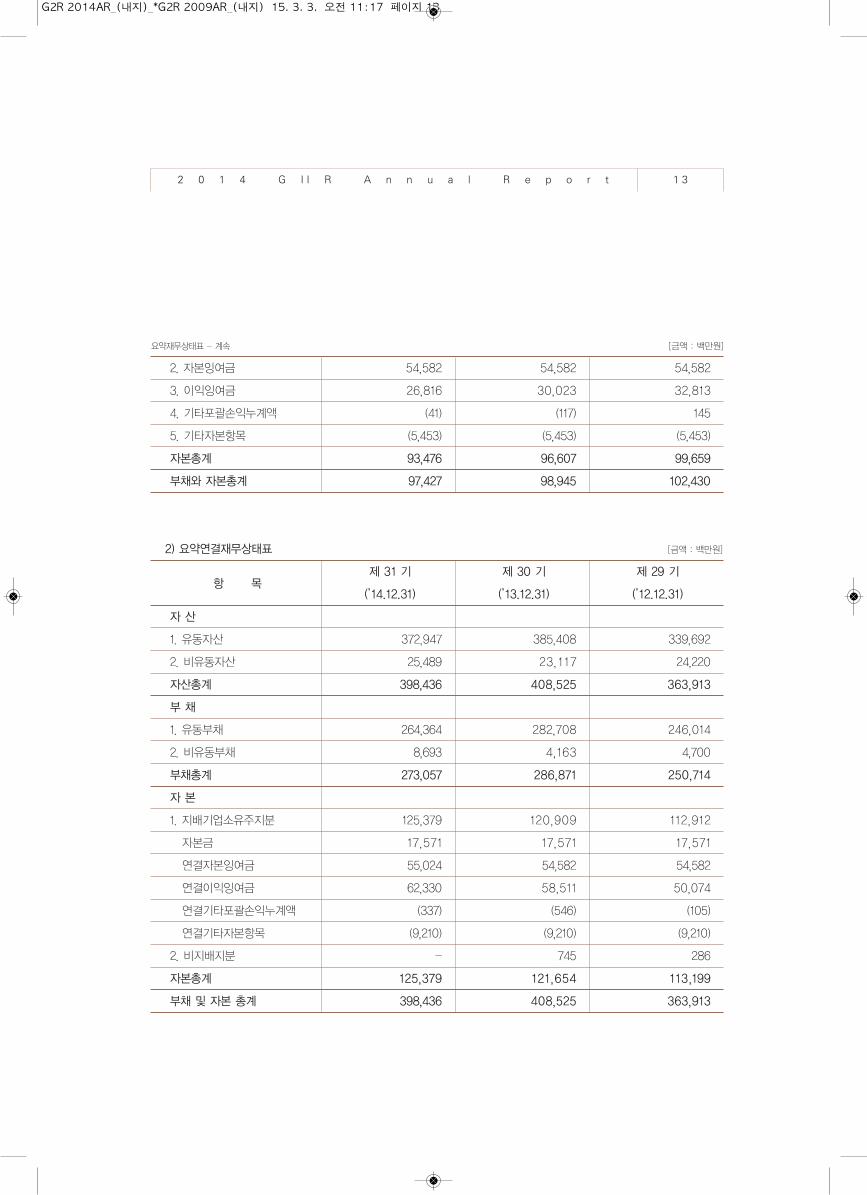
요약재무상태표 - 계속 [금액 : 백만원]
2. 자본잉여금 54,582 54,582 54,582
3. 이익잉여금 26,816 30,023 32,813
4. 기타포괄손익누계액 (41) (117) 145
5. 기타자본항목 (5,453) (5,453) (5,453)
자본총계 93,476 96,607 99,659
부채와 자본총계 97,427 98,945 102,430
2) 요약연결재무상태표 [금액 : 백만원]
항 목제 31 기 제 30 기 제 29 기
(’14.12.31) (’13.12.31) (’12.12.31)
자 산
1. 유동자산 372,947 385,408 339,692
2. 비유동자산 25,489 23,117 24,220
자산총계 398,436 408,525 363,913
부 채
1. 유동부채 264,364 282,708 246,014
2. 비유동부채 8,693 4,163 4,700
부채총계 273,057 286,871 250,714
자 본
1. 지배기업소유주지분 125,379 120,909 112,912
자본금 17,571 17,571 17,571
연결자본잉여금 55,024 54,582 54,582
연결이익잉여금 62,330 58,511 50,074
연결기타포괄손익누계액 (337) (546) (105)
연결기타자본항목 (9,210) (9,210) (9,210)
2. 비지배지분 - 745 286
자본총계 125,379 121,654 113,199
부채 및 자본 총계 398,436 408,525 363,913
G2R 2014AR_(내지)_*G2R 2009AR_(내지) 15. 3. 3. 오전 11:17 페이지 13
2 0 1 4 G I I R A n n u a l R e p o r t 1 4
3. 자본변동
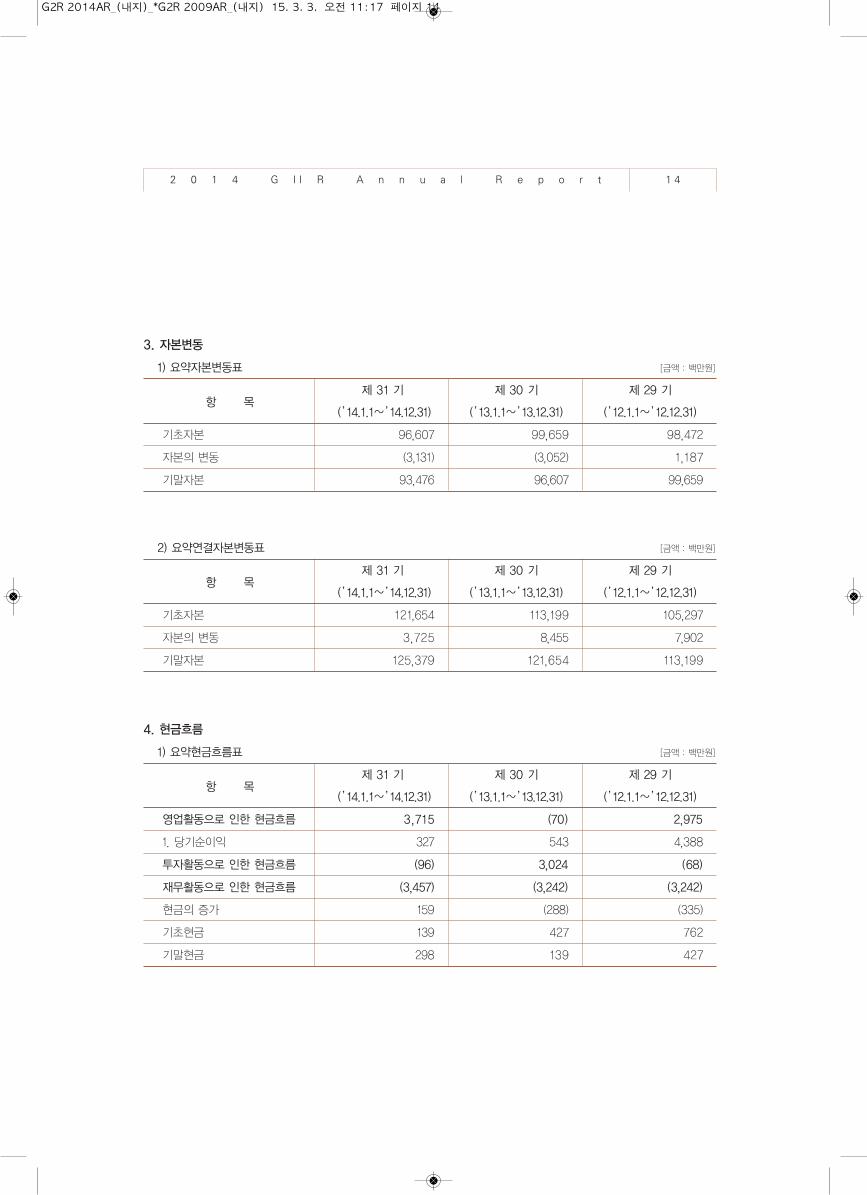
1) 요약자본변동표 [금액 : 백만원]
항 목제 31 기 제 30 기 제 29 기
(̀’14.1.1〜`’14.12.31) (̀’13.1.1〜`’13.12.31) (̀’12.1.1〜`’12.12.31)
기초자본 96,607 99,659 98,472
자본의 변동 (3,131) (3,052) 1,187
기말자본 93,476 96,607 99,659
2) 요약연결자본변동표 [금액 : 백만원]
항 목제 31 기 제 30 기 제 29 기
(̀’14.1.1〜`’14.12.31) (̀’13.1.1〜`’13.12.31) (̀’12.1.1〜`’12.12.31)
기초자본 121,654 113,199 105,297
자본의 변동 3,725 8,455 7,902
기말자본 125,379 121,654 113,199
4. 현금흐름
1) 요약현금흐름표 [금액 : 백만원]
항 목제 31 기 제 30 기 제 29 기
(̀’14.1.1〜`’14.12.31) (̀’13.1.1〜`’13.12.31) (̀’12.1.1〜`’12.12.31)
영업활동으로 인한 현금흐름 3,715 (70) 2,975
1. 당기순이익 327 543 4,388
투자활동으로 인한 현금흐름 (96) 3,024 (68)
재무활동으로 인한 현금흐름 (3,457) (3,242) (3,242)
현금의 증가 159 (288) (335)
기초현금 139 427 762
기말현금 298 139 427
G2R 2014AR_(내지)_*G2R 2009AR_(내지) 15. 3. 3. 오전 11:17 페이지 14
2 0 1 4 G I I R A n n u a l R e p o r t 1 5
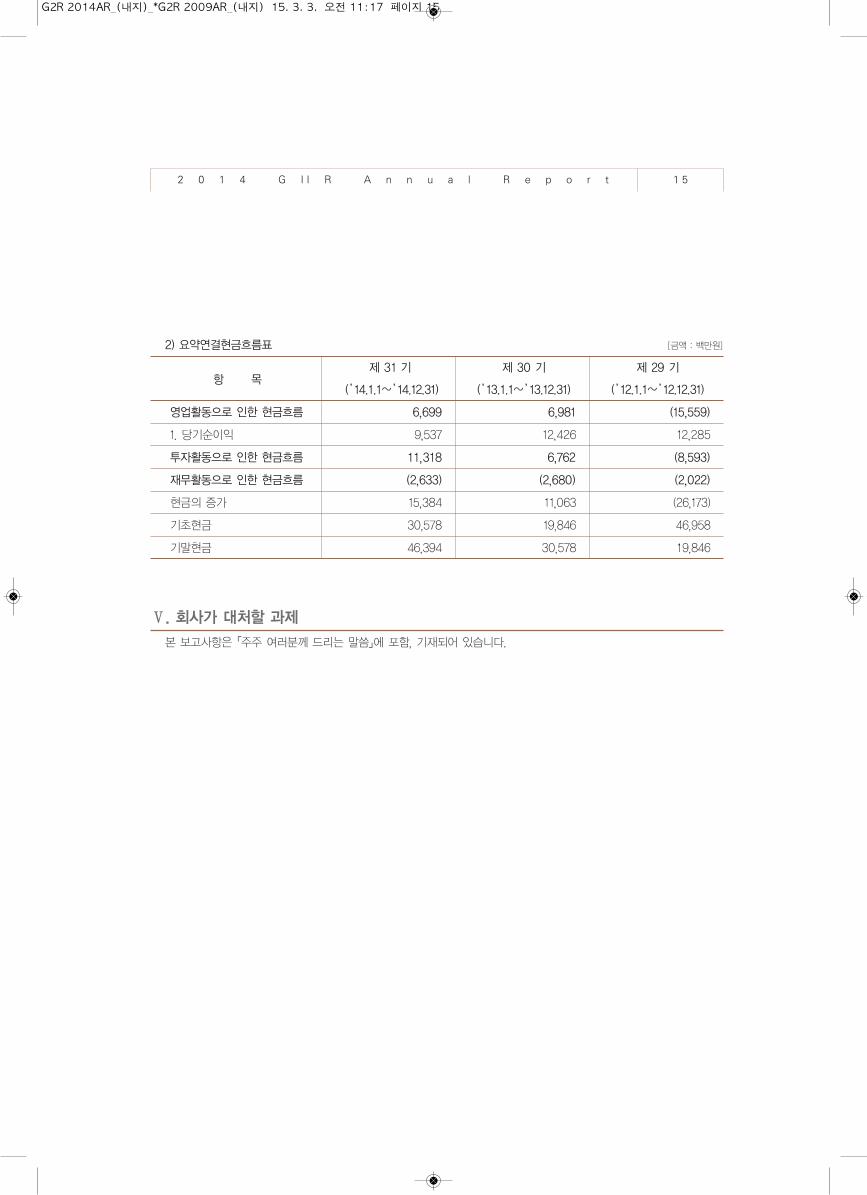
2) 요약연결현금흐름표 [금액 : 백만원]
항 목제 31 기 제 30 기 제 29 기
(̀’14.1.1〜`’14.12.31) (̀’13.1.1〜`’13.12.31) (̀’12.1.1〜`’12.12.31)
영업활동으로 인한 현금흐름 6,699 6,981 (15,559)
1. 당기순이익 9,537 12,426 12,285
투자활동으로 인한 현금흐름 11,318 6,762 (8,593)
재무활동으로 인한 현금흐름 (2,633) (2,680) (2,022)
현금의 증가 15,384 11,063 (26,173)
기초현금 30,578 19,846 46,958
기말현금 46,394 30,578 19,846
Ⅴ. 회사가 대처할 과제
본 보고사항은 「주주 여러분께 드리는 말씀」에 포함, 기재되어 있습니다.
G2R 2014AR_(내지)_*G2R 2009AR_(내지) 15. 3. 3. 오전 11:17 페이지 15
2 0 1 4 G I I R A n n u a l R e p o r t 1 6
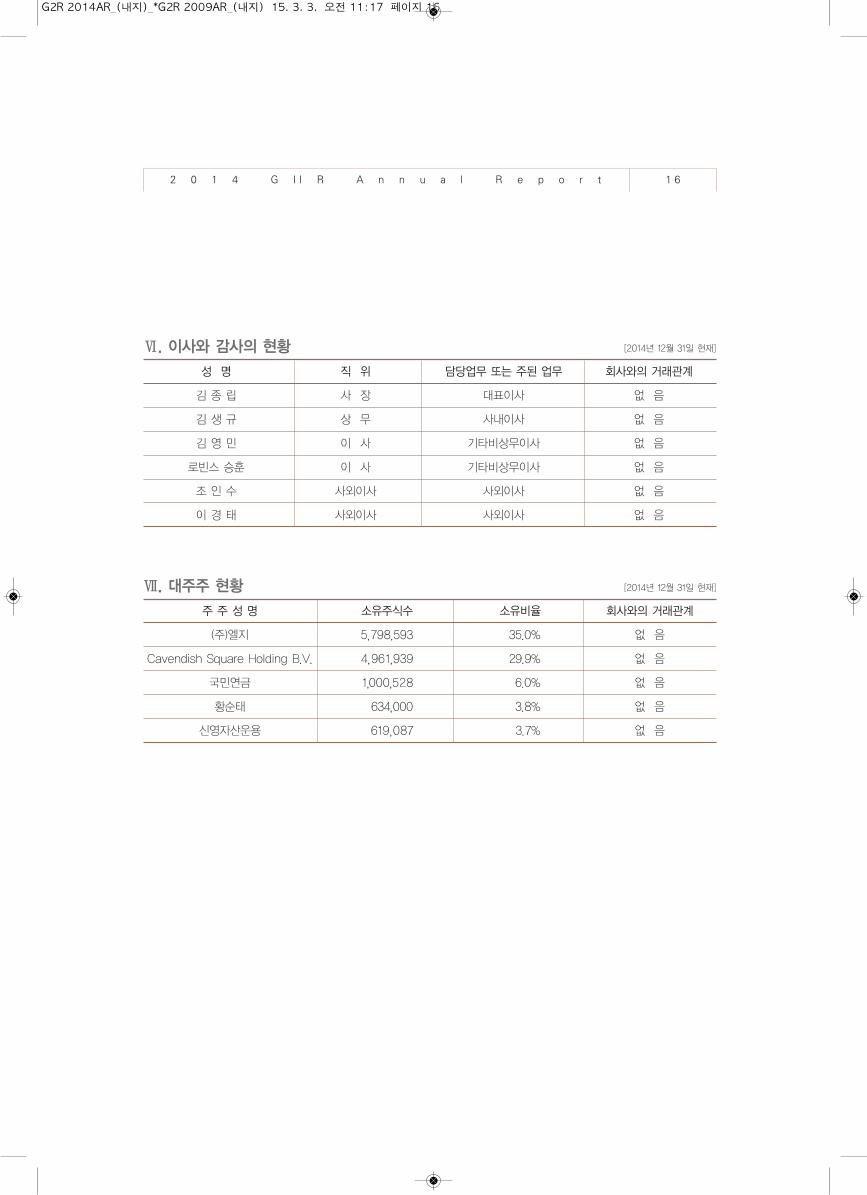
Ⅵ. 이사와 감사의 현황 [2014년 12월 31일 현재]
성 명 직 위 담당업무 또는 주된 업무 회사와의 거래관계
김 종 립 사 장 대표이사 없 음
김 생 규 상 무 사내이사 없 음
김 영 민 이 사 기타비상무이사 없 음
로빈스 승훈 이 사 기타비상무이사 없 음
조 인 수 사외이사 사외이사 없 음
이 경 태 사외이사 사외이사 없 음
Ⅶ. 대주주 현황 [2014년 12월 31일 현재]
주 주 성 명 소유주식수 소유비율 회사와의 거래관계
(주)엘지 5,798,593 35.0% 없 음
Cavendish Square Holding B.V. 4,961,939 29.9% 없 음
국민연금 1,000,528 6.0% 없 음
황순태 634,000 3.8% 없 음
신영자산운용 619,087 3.7% 없 음
G2R 2014AR_(내지)_*G2R 2009AR_(내지) 15. 3. 3. 오전 11:17 페이지 16
2 0 1 4 G I I R A n n u a l R e p o r t 1 7
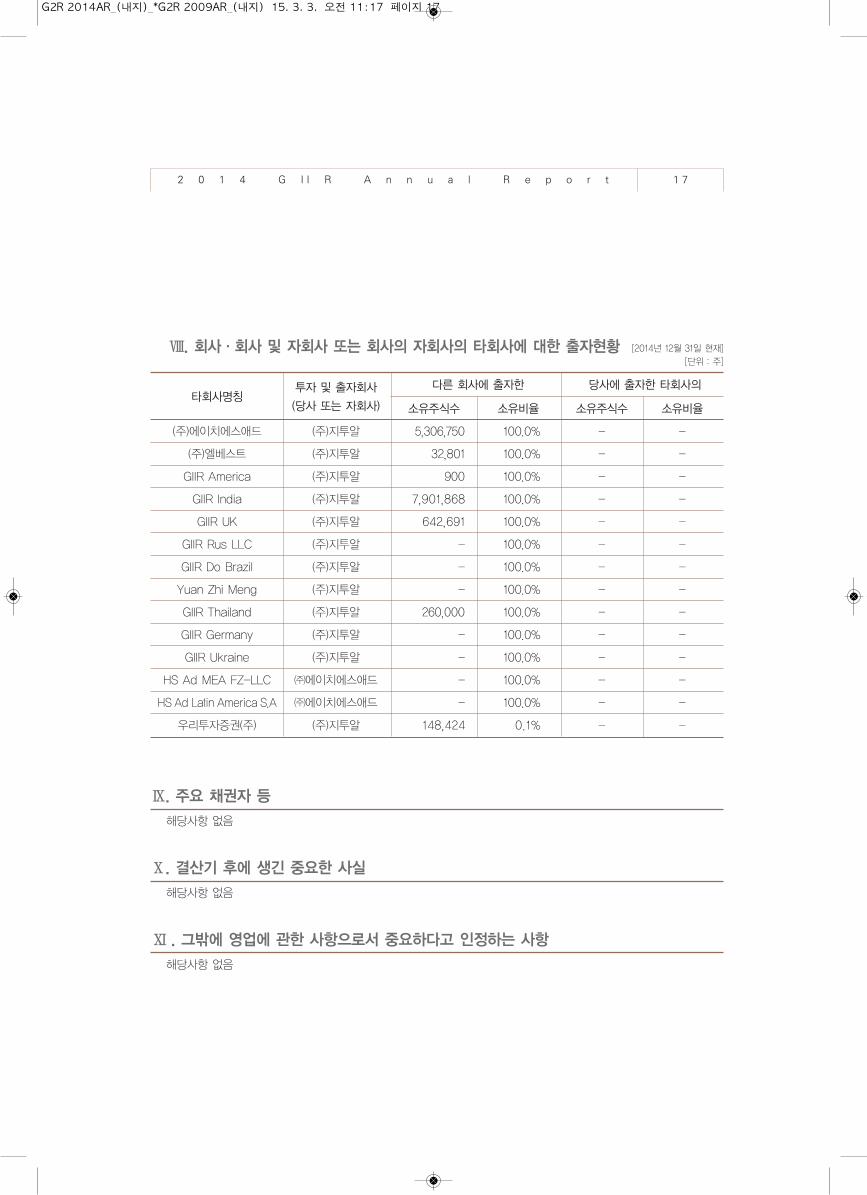
Ⅷ. 회사·회사 및 자회사 또는 회사의 자회사의 타회사에 대한 출자현황 [2014년 12월 31일 현재]
[단위 : 주]
타회사명칭투자 및 출자회사 다른 회사에 출자한 당사에 출자한 타회사의
(당사 또는 자회사) 소유주식수 소유비율 소유주식수 소유비율
(주)에이치에스애드 (주)지투알 5,306,750 100.0% - -
(주)엘베스트 (주)지투알 32,801 100.0% - -
GIIR America (주)지투알 900 100.0% - -
GIIR India (주)지투알 7,901,868 100.0% - -
GIIR UK (주)지투알 642,691 100.0% - -
GIIR Rus LLC (주)지투알 - 100.0% - -
GIIR Do Brazil (주)지투알 - 100.0% - -
Yuan Zhi Meng (주)지투알 - 100.0% - -
GIIR Thailand (주)지투알 260,000 100.0% - -
GIIR Germany (주)지투알 - 100.0% - -
GIIR Ukraine (주)지투알 - 100.0% - -
HS Ad MEA FZ-LLC ㈜에이치에스애드 - 100.0% - -
HSAd LatinAmericaS.A ㈜에이치에스애드 - 100.0% - -
우리투자증권(주) (주)지투알 148,424 0.1% - -
Ⅸ. 주요 채권자 등
해당사항 없음
Ⅹ. 결산기 후에 생긴 중요한 사실
해당사항 없음
ⅩⅠ. 그밖에 영업에 관한 사항으로서 중요하다고 인정하는 사항
해당사항 없음
G2R 2014AR_(내지)_*G2R 2009AR_(내지) 15. 3. 3. 오전 11:17 페이지 17
감사위원회의 감사보고서
감사위원회의 내부회계관리제도 평가보고서
외부감사인의 감사보고서
외부감사인의 연결감사보고서
감 사 보 고 서
G2R 2014AR_(내지)_*G2R 2009AR_(내지) 15. 3. 3. 오전 11:17 페이지 18
2 0 1 4 G I I R A n n u a l R e p o r t 1 9
감사위원회의 감사보고서
본 감사위원회는 제31기 사업연도(2014년 1월 1일부터 2014년 12월 31일까지)의 회계 및 업무에 관한 감사를 실시하고
그 결과를 다음과 같이 보고합니다.
1. 감사방법의 개요
회계감사를 위하여 회계에 관한 장부와 관계서류를 열람하고 재무제표 및 동 부속명세서를 검토하였으며 필요하다고
인정되는 경우 대조, 실사, 입회, 조회, 기타 적절한 감사절차를 적용하였습니다.
업무감사를 위하여 이사회 및 기타 중요한 회의에 출석하고 필요하다고 인정되는 경우 이사로부터 영업에 관한 보고를
받았으며, 중요한 업무에 관한 서류를 열람하고 그 내용을 검토하는 등 적절한 방법을 사용하였습니다.
2. 재무제표에 관한 사항
재무제표는 법령 및 정관에 따라 회사의 재무상태, 경영성과, 이익잉여금의 변동, 자본의 변동 및 현금흐름의 내용을
적정하게 표시하고 있습니다.
3. 영업보고서에 관한 사항
영업보고서는 법령 및 정관에 따라 회사의 상황을 정확하게 표시하고 있습니다.
2015년 2월 16일
주식회사 지투알 감사위원회
감사위원장 이 경 태
감사위원 조 인 수
감사위원 로 빈 스 승 훈
G2R 2014AR_(내지)_*G2R 2009AR_(내지) 15. 3. 3. 오전 11:17 페이지 19
2 0 1 4 G I I R A n n u a l R e p o r t 2 0
감사위원회의 내부회계관리제도 평가보고서
주식회사 지투알 주주 및 이사회 귀중
본 감사위원회는 2014년 12월 31일 현재 동일 자로 종료하는 회계연도에 대한 당사의 내부회계관리 제도의 설계 및
운영실태를 평가하였습니다.
내부회계관리제도의 설계 및 운영에 대한 책임은 내부회계관리자를 포함한 회사의 경영진에 있습니다. 본 감사위원회는
내부회계관리자가 본 감사위원회에게 제출한 내부회계관리제도 운영실태 평가 보고서를 참고로, 회사의 내부회계관리
제도가 신뢰할 수 있는 재무제표의 작성 및 공시를 위하여 재무제표의 왜곡을 초래할 수 있는 오류나 부정행위를 예방
하고 적발할 수 있도록 효과적으로 설계 및 운영되고 있는지의 여부에 대하여 평가하였습니다.
본 감사위원회는 내부회계관리제도의 설계 및 운영실태를 평가함에 있어 내부회계관리제도 모범규준을 평가기준으로
사용하였습니다.
본 감사위원회의 내부회계관리제도 운영실태 평가 결과, 2014년 12월 31일 현재 당사의 내부회계관리제도는 내부회계
관리제도 모범규준에 근거하여 볼 때, 중요성의 관점에서 효과적으로 설계되어 운영되고 있다고 판단됩니다.
2015년 2월 16일
주식회사 지투알 감사위원회
감사위원장 이 경 태
감사위원 조 인 수
감사위원 로 빈 스 승 훈
G2R 2014AR_(내지)_*G2R 2009AR_(내지) 15. 3. 3. 오전 11:17 페이지 20
2 0 1 4 G I I R A n n u a l R e p o r t 2 1
외부감사인의 감사보고서
본 감사인은 첨부된 주식회사 지투알의 2014년 12월 31일과 2013년 12월 31일 현재의 재무상태표와 2014년 12월 31일과
2013년 12월 31일로 종료되는 양 회계연도의 손익계산서, 포괄손익계산서, 자본변동표 및 현금흐름표를 감사하였습니다.
이 재무제표를 작성할 책임은 회사 경영자에게 있으며 본 감사인의 책임은 동 재무제표에 대하여 감사를 실시하고 이를
근거로 이 재무제표에 대하여 의견을 표명하는데 있습니다.
본 감사인은 한국의 회계감사기준에 따라 감사를 실시하였습니다. 이 기준은 본 감사인이 재무제표가 중요하게 왜곡 표시
되지 아니하였다는 것을 합리적으로 확신하도록 감사를 계획하고 실시할 것을 요구하고 있습니다. 감사는 재무제표상의
금액과 공시내용을 뒷받침하는 감사증거에 대하여 시사의 방법을 적용하여 검증하는 것을 포함하고 있습니다. 또한 감사
는 재무제표의 전반적인 표시내용에 대한 평가 뿐만 아니라 재무제표 작성을 위해 경영자가 적용한 회계원칙과 유의적
회계추정에 대한 평가를 포함하고 있습니다. 본 감사인이 실시한 감사가 감사의견 표명을 위한 합리적인 근거를 제공하고
있다고 본 감사인은 믿습니다.
본 감사인의 의견으로는 상기 재무제표는 주식회사 지투알의 2014년 12월 31일과 2013년 12월 31일 현재의 재무상태와
2014년 12월 31일과 2013년 12월 31일로 종료되는 양 회계연도의 재무성과 및 현금흐름의 내용을 한국채택국제회계
기준에 따라 중요성의 관점에서 적정하게 표시하고 있습니다.
감사의견에 영향을 미치지 않는 사항으로서 재무제표에 대한 주석32에서 설명하고 있는 바와 같이 회사는 당기 중 특수
관계자와의 거래가 발생하였으며, 당기말 현재 관련 채권, 채무가 존재하고 있습니다.
2015년 2월 26일
삼정회계법인
대 표 이 사
이 감사보고서는 감사보고서일(2015년 2월 26일)현재로 유효한 것입니다. 따라서 감사보고서일 이후 이 보고서를 열람하는 시점까지의 기간 사이에 첨부된 회사의 재무제표에 중대한 영향을 미칠 수 있는 사건이나 상황이 발생할 수도 있으며 이로 인하여 이 감사보고서가 수정될 수도 있습니다.
김 교 태
G2R 2014AR_(내지)_*G2R 2009AR_(내지) 15. 3. 3. 오전 11:17 페이지 21
2 0 1 4 G I I R A n n u a l R e p o r t 2 2
외부감사인의 연결감사보고서
본 감사인은 첨부된 주식회사 지투알과 그 종속기업의 2014년 12월 31일과 2013년 12월 31일 현재의 연결재무상태표와
2014년 12월 31일과 2013년 12월 31일로 종료되는 양 회계연도의 연결손익계산서, 연결포괄손익계산서, 연결자본변동표
및 연결현금흐름표를 감사하였습니다. 이 연결재무제표를 작성할 책임은 회사 경영자에게 있으며 본 감사인의 책임은
동 연결재무제표에 대하여 감사를 실시하고 이를 근거로 이 연결재무제표에 대하여 의견을 표명하는데 있습니다.
본 감사인은 한국의 회계감사기준에 따라 감사를 실시하였습니다. 이 기준은 본 감사인이 연결재무제표가 중요하게 왜곡
표시되지 아니하였다는 것을 합리적으로 확신하도록 감사를 계획하고 실시할 것을 요구하고 있습니다. 감사는 연결재무
제표상의 금액과 공시내용을 뒷받침하는 감사증거에 대하여 시사의 방법을 적용하여 검증하는 것을 포함하고 있습니다.
또한 감사는 연결재무제표의 전반적인 표시내용에 대한 평가 뿐만 아니라 연결재무제표 작성을 위해 경영자가 적용한
회계원칙과 유의적 회계추정에 대한 평가를 포함하고 있습니다. 본 감사인이 실시한 감사가 감사의견 표명을 위한 합리
적인 근거를 제공하고 있다고 본 감사인은 믿습니다.
본 감사인의 의견으로는 상기 연결재무제표는 주식회사 지투알과 그 종속기업의 2014년 12월 31일과 2013년 12월 31일
현재의 재무상태와 2014년 12월 31일과 2013년 12월 31일로 종료되는 양 회계연도의 재무성과 및 현금흐름의 내용을
한국채택국제회계기준에 따라 중요성의 관점에서 적정하게 표시하고 있습니다.
감사의견에 영향을 미치지 않는 사항으로서 재무제표에 대한 주석36에서 설명하고 있는 바와 같이 회사는 당기 중 특수
관계자와의 거래가 발생하였으며, 당기말 현재 관련 채권, 채무가 존재하고 있습니다.
2015년 2월 26일
삼정회계법인
대 표 이 사
이 감사보고서는 감사보고서일(2015년 2월 26일)현재로 유효한 것입니다. 따라서 감사보고서일 이후 이 보고서를 열람하는 시점까지의 기간 사이에 첨부된 회사의 연결재무제표에 중대한 영향을 미칠 수 있는 사건이나 상황이 발생할 수도있으며 이로 인하여 이 감사보고서가 수정될 수도 있습니다.
김 교 태
G2R 2014AR_(내지)_*G2R 2009AR_(내지) 15. 3. 3. 오전 11:17 페이지 22
재무상태표
손익계산서
포괄손익계산서
자본변동표
이익잉여금처분계산서(안)
현금흐름표
재무제표에 대한 주석(별지 참조)
연결재무상태표
연결손익계산서
연결포괄손익계산서
연결자본변동표
연결현금흐름표
연결재무제표에 대한 주석(별지 참조)
결 산 보 고 서
G2R 2014AR_(내지)_*G2R 2009AR_(내지) 15. 3. 3. 오전 11:17 페이지 23
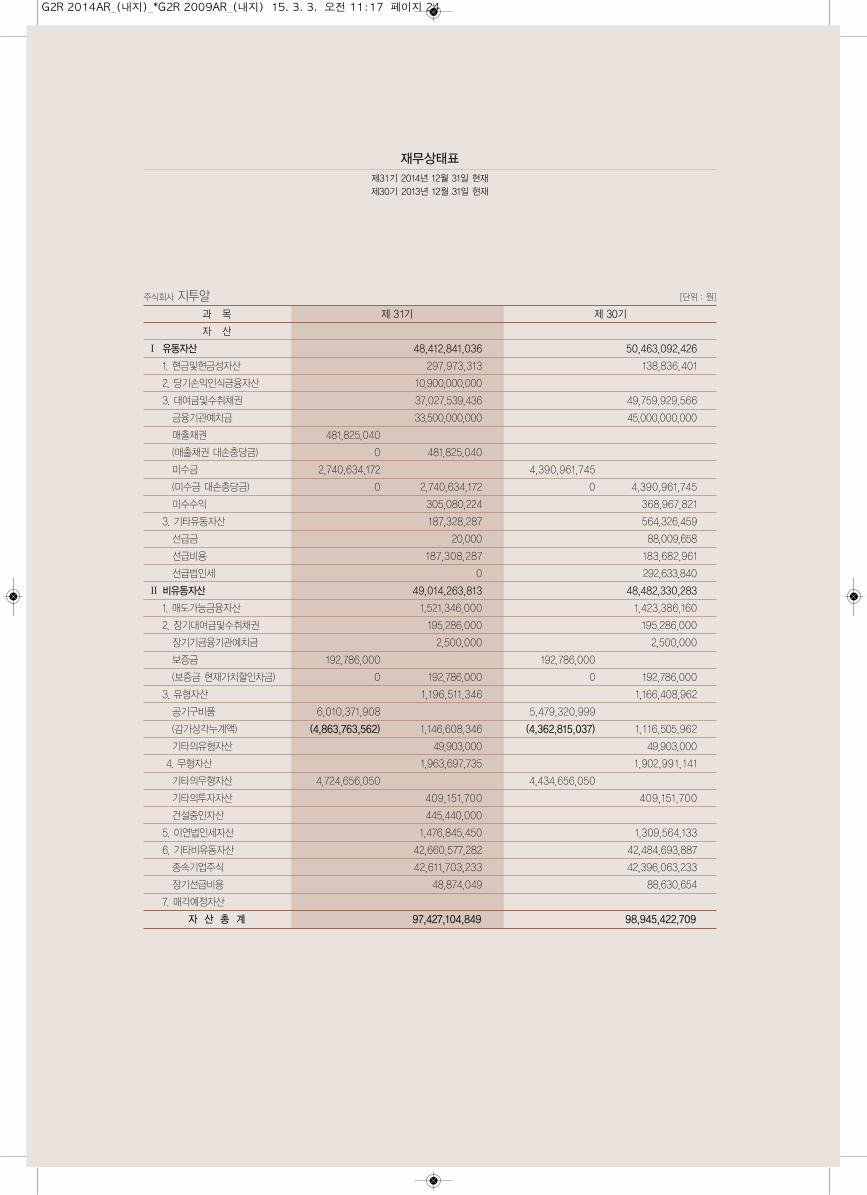
재무상태표
제31기 2014년 12월 31일 현재
제30기 2013년 12월 31일 현재
주식회사 지투알 [단위 : 원]
과 목 제 31기 제 30기
자 산
Ⅰ 유동자산 48,412,841,036 50,463,092,426
1. 현금및현금성자산 297,973,313 138,836,401
2. 당기손익인식금융자산 10,900,000,000
3. 대여금및수취채권 37,027,539,436 49,759,929,566
금융기관예치금 33,500,000,000 45,000,000,000
매출채권 481,825,040
(매출채권 대손충당금) 0 481,825,040
미수금 2,740,634,172 4,390,961,745
(미수금 대손충당금) 0 2,740,634,172 0 4,390,961,745
미수수익 305,080,224 368,967,821
3. 기타유동자산 187,328,287 564,326,459
선급금 20,000 88,009,658
선급비용 187,308,287 183,682,961
선급법인세 0 292,633,840
Ⅱ 비유동자산 49,014,263,813 48,482,330,283
1. 매도가능금융자산 1,521,346,000 1,423,386,160
2. 장기대여금및수취채권 195,286,000 195,286,000
장기기금융기관예치금 2,500,000 2,500,000
보증금 192,786,000 192,786,000
(보증금 현재가치할인차금) 0 192,786,000 0 192,786,000
3. 유형자산 1,196,511,346 1,166,408,962
공기구비품 6,010,371,908 5,479,320,999
(감가상각누계액) (4,863,763,562) 1,146,608,346 (4,362,815,037) 1,116,505,962
기타의유형자산 49,903,000 49,903,000
4. 무형자산 1,963,697,735 1,902,991,141
기타의무형자산 4,724,656,050 4,434,656,050
기타의투자자산 409,151,700 409,151,700
건설중인자산 445,440,000
5. 이연법인세자산 1,476,845,450 1,309,564,133
6. 기타비유동자산 42,660,577,282 42,484,693,887
종속기업주식 42,611,703,233 42,396,063,233
장기선급비용 48,874,049 88,630,654
7. 매각예정자산
자 산 총 계 97,427,104,849 98,945,422,709
G2R 2014AR_(내지)_*G2R 2009AR_(내지) 15. 3. 3. 오전 11:17 페이지 24
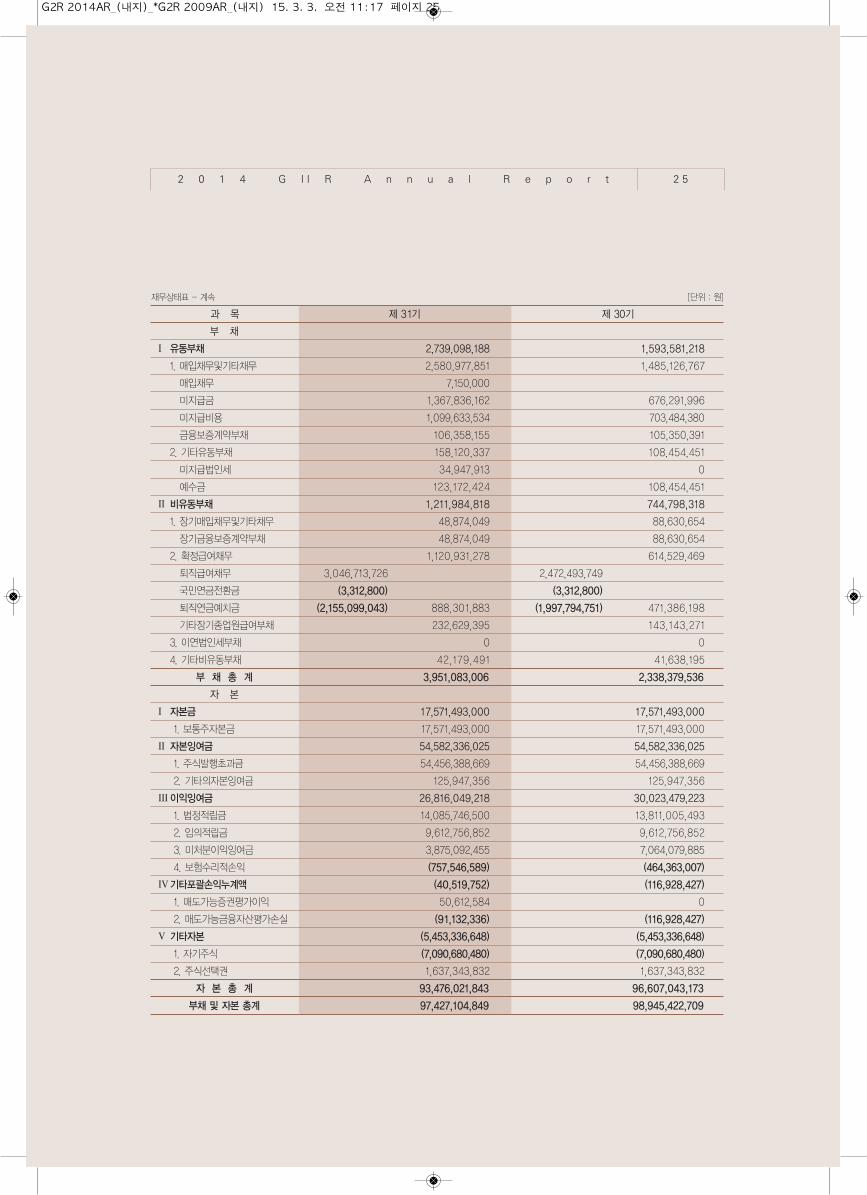
재무상태표 - 계속 [단위 : 원]
과 목 제 31기 제 30기
부 채
Ⅰ 유동부채 2,739,098,188 1,593,581,218
1. 매입채무및기타채무 2,580,977,851 1,485,126,767
매입채무 7,150,000
미지급금 1,367,836,162 676,291,996
미지급비용 1,099,633,534 703,484,380
금융보증계약부채 106,358,155 105,350,391
2. 기타유동부채 158,120,337 108,454,451
미지급법인세 34,947,913 0
예수금 123,172,424 108,454,451
Ⅱ 비유동부채 1,211,984,818 744,798,318
1. 장기매입채무및기타채무 48,874,049 88,630,654
장기금융보증계약부채 48,874,049 88,630,654
2. 확정급여채무 1,120,931,278 614,529,469
퇴직급여채무 3,046,713,726 2,472,493,749
국민연금전환금 (3,312,800) (3,312,800)
퇴직연금예치금 (2,155,099,043) 888,301,883 (1,997,794,751) 471,386,198
기타장기종업원급여부채 232,629,395 143,143,271
3. 이연법인세부채 0 0
4. 기타비유동부채 42,179,491 41,638,195
부 채 총 계 3,951,083,006 2,338,379,536
자 본
Ⅰ 자본금 17,571,493,000 17,571,493,000
1. 보통주자본금 17,571,493,000 17,571,493,000
Ⅱ 자본잉여금 54,582,336,025 54,582,336,025
1. 주식발행초과금 54,456,388,669 54,456,388,669
2. 기타의자본잉여금 125,947,356 125,947,356
Ⅲ이익잉여금 26,816,049,218 30,023,479,223
1. 법정적립금 14,085,746,500 13,811,005,493
2. 임의적립금 9,612,756,852 9,612,756,852
3. 미처분이익잉여금 3,875,092,455 7,064,079,885
4. 보험수리적손익 (757,546,589) (464,363,007)
Ⅳ기타포괄손익누계액 (40,519,752) (116,928,427)
1. 매도가능증권평가이익 50,612,584 0
2. 매도가능금융자산평가손실 (91,132,336) (116,928,427)
Ⅴ 기타자본 (5,453,336,648) (5,453,336,648)
1. 자기주식 (7,090,680,480) (7,090,680,480)
2. 주식선택권 1,637,343,832 1,637,343,832
자 본 총 계 93,476,021,843 96,607,043,173
부채 및 자본 총계 97,427,104,849 98,945,422,709
2 0 1 4 G I I R A n n u a l R e p o r t 2 5
G2R 2014AR_(내지)_*G2R 2009AR_(내지) 15. 3. 3. 오전 11:17 페이지 25
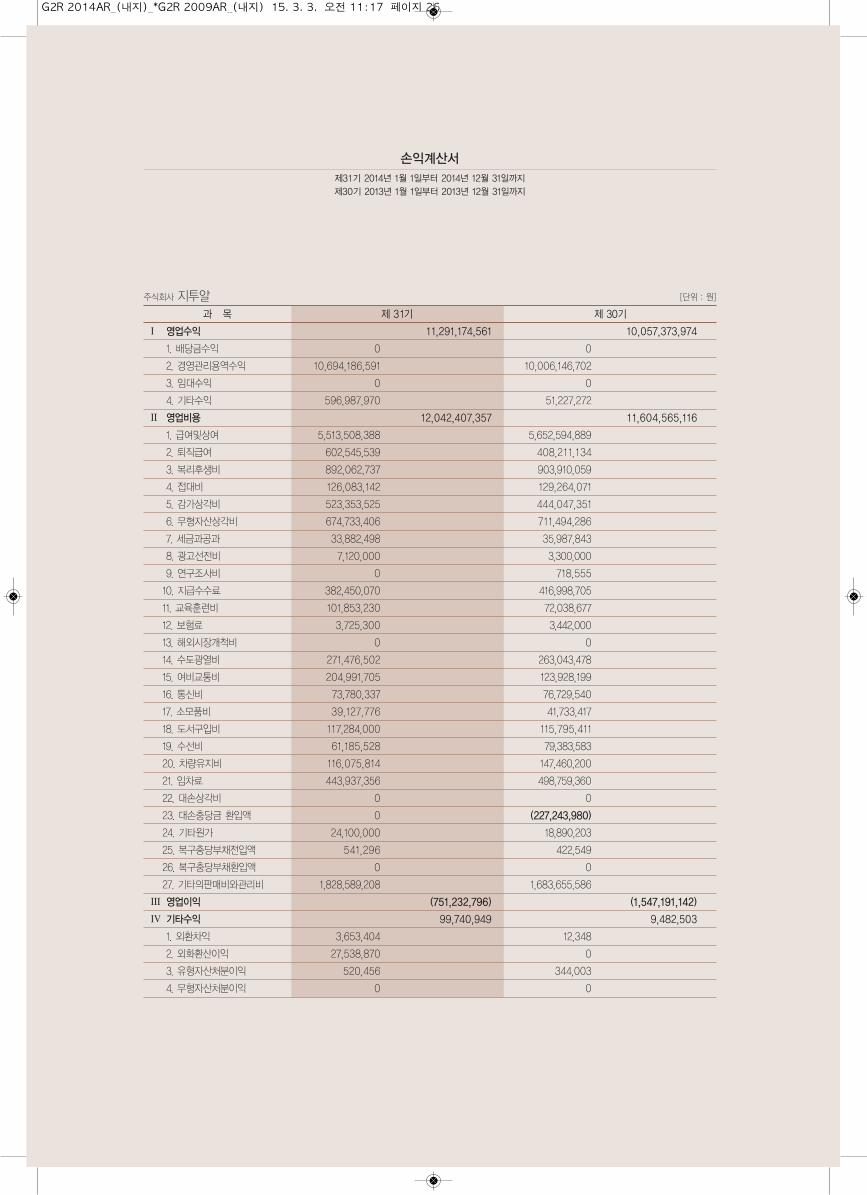
주식회사 지투알 [단위 : 원]
과 목 제 31기 제 30기
Ⅰ 영업수익 11,291,174,561 10,057,373,974
1. 배당금수익 0 0
2. 경영관리용역수익 10,694,186,591 10,006,146,702
3. 임대수익 0 0
4. 기타수익 596,987,970 51,227,272
Ⅱ 영업비용 12,042,407,357 11,604,565,116
1. 급여및상여 5,513,508,388 5,652,594,889
2. 퇴직급여 602,545,539 408,211,134
3. 복리후생비 892,062,737 903,910,059
4. 접대비 126,083,142 129,264,071
5. 감가상각비 523,353,525 444,047,351
6. 무형자산상각비 674,733,406 711,494,286
7. 세금과공과 33,882,498 35,987,843
8. 광고선전비 7,120,000 3,300,000
9. 연구조사비 0 718,555
10. 지급수수료 382,450,070 416,998,705
11. 교육훈련비 101,853,230 72,038,677
12. 보험료 3,725,300 3,442,000
13. 해외시장개척비 0 0
14. 수도광열비 271,476,502 263,043,478
15. 여비교통비 204,991,705 123,928,199
16. 통신비 73,780,337 76,729,540
17. 소모품비 39,127,776 41,733,417
18. 도서구입비 117,284,000 115,795,411
19. 수선비 61,185,528 79,383,583
20. 차량유지비 116,075,814 147,460,200
21. 임차료 443,937,356 498,759,360
22. 대손상각비 0 0
23. 대손충당금 환입액 0 (227,243,980)
24. 기타원가 24,100,000 18,890,203
25. 복구충당부채전입액 541,296 422,549
26. 복구충당부채환입액 0 0
27. 기타의판매비와관리비 1,828,589,208 1,683,655,586
Ⅲ 영업이익 (751,232,796) (1,547,191,142)
Ⅳ 기타수익 99,740,949 9,482,503
1. 외환차익 3,653,404 12,348
2. 외화환산이익 27,538,870 0
3. 유형자산처분이익 520,456 344,003
4. 무형자산처분이익 0 0
손익계산서
제31기 2014년 1월 1일부터 2014년 12월 31일까지
제30기 2013년 1월 1일부터 2013년 12월 31일까지
G2R 2014AR_(내지)_*G2R 2009AR_(내지) 15. 3. 3. 오전 11:17 페이지 26
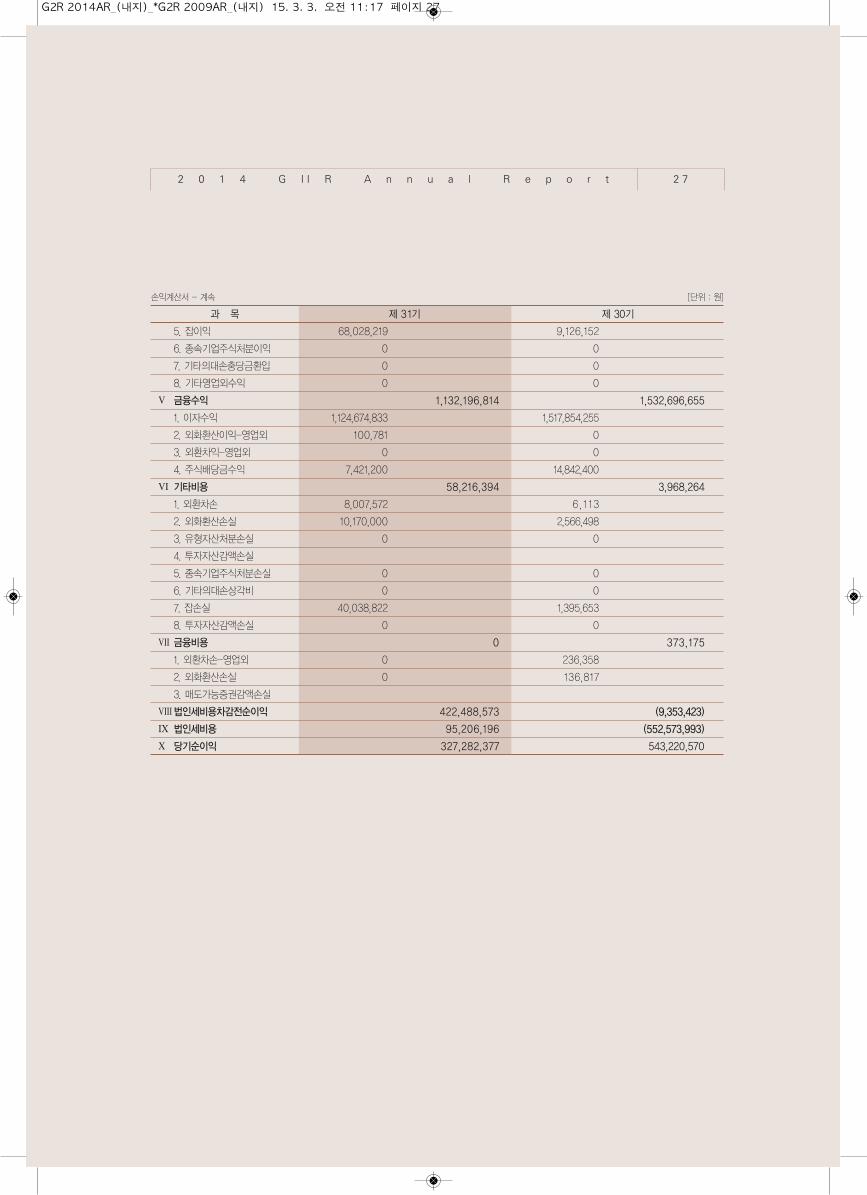
손익계산서 - 계속 [단위 : 원]
과 목 제 31기 제 30기
5. 잡이익 68,028,219 9,126,152
6. 종속기업주식처분이익 0 0
7. 기타의대손충당금환입 0 0
8. 기타영업외수익 0 0
Ⅴ 금융수익 1,132,196,814 1,532,696,655
1. 이자수익 1,124,674,833 1,517,854,255
2. 외화환산이익-영업외 100,781 0
3. 외환차익-영업외 0 0
4. 주식배당금수익 7,421,200 14,842,400
Ⅵ 기타비용 58,216,394 3,968,264
1. 외환차손 8,007,572 6,113
2. 외화환산손실 10,170,000 2,566,498
3. 유형자산처분손실 0 0
4. 투자자산감액손실
5. 종속기업주식처분손실 0 0
6. 기타의대손상각비 0 0
7. 잡손실 40,038,822 1,395,653
8. 투자자산감액손실 0 0
Ⅶ 금융비용 0 373,175
1. 외환차손-영업외 0 236,358
2. 외화환산손실 0 136,817
3. 매도가능증권감액손실
Ⅷ법인세비용차감전순이익 422,488,573 (9,353,423)
Ⅸ 법인세비용 95,206,196 (552,573,993)
Ⅹ 당기순이익 327,282,377 543,220,570
2 0 1 4 G I I R A n n u a l R e p o r t 2 7
G2R 2014AR_(내지)_*G2R 2009AR_(내지) 15. 3. 3. 오전 11:17 페이지 27
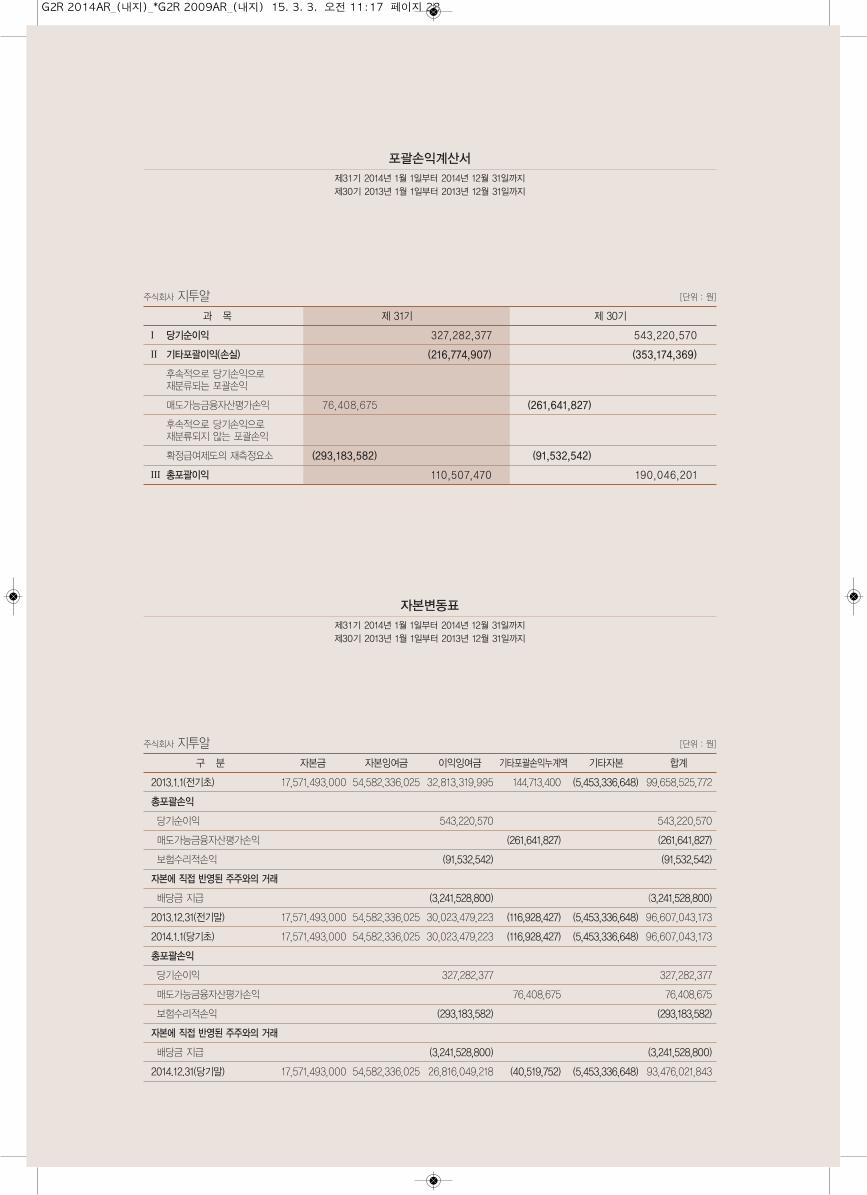
포괄손익계산서
제31기 2014년 1월 1일부터 2014년 12월 31일까지
제30기 2013년 1월 1일부터 2013년 12월 31일까지
주식회사 지투알 [단위 : 원]
과 목 제 31기 제 30기
Ⅰ 당기순이익 327,282,377 543,220,570
Ⅱ 기타포괄이익(손실) (216,774,907) (353,174,369)
후속적으로 당기손익으로 재분류되는 포괄손익
매도가능금융자산평가손익 76,408,675 (261,641,827)
후속적으로 당기손익으로 재분류되지 않는 포괄손익
확정급여제도의 재측정요소 (293,183,582) (91,532,542)
Ⅲ 총포괄이익 110,507,470 190,046,201
주식회사 지투알 [단위 : 원]
구 분 자본금 자본잉여금 이익잉여금 기타포괄손익누계액 기타자본 합계
2013.1.1(전기초) 17,571,493,000 54,582,336,025 32,813,319,995 144,713,400 (5,453,336,648) 99,658,525,772
총포괄손익
당기순이익 543,220,570 543,220,570
매도가능금융자산평가손익 (261,641,827) (261,641,827)
보험수리적손익 (91,532,542) (91,532,542)
자본에 직접 반영된 주주와의 거래
배당금 지급 (3,241,528,800) (3,241,528,800)
2013.12.31(전기말) 17,571,493,000 54,582,336,025 30,023,479,223 (116,928,427) (5,453,336,648) 96,607,043,173
2014.1.1(당기초) 17,571,493,000 54,582,336,025 30,023,479,223 (116,928,427) (5,453,336,648) 96,607,043,173
총포괄손익
당기순이익 327,282,377 327,282,377
매도가능금융자산평가손익 76,408,675 76,408,675
보험수리적손익 (293,183,582) (293,183,582)
자본에 직접 반영된 주주와의 거래
배당금 지급 (3,241,528,800) (3,241,528,800)
2014.12.31(당기말) 17,571,493,000 54,582,336,025 26,816,049,218 (40,519,752) (5,453,336,648) 93,476,021,843
자본변동표
제31기 2014년 1월 1일부터 2014년 12월 31일까지
제30기 2013년 1월 1일부터 2013년 12월 31일까지
G2R 2014AR_(내지)_*G2R 2009AR_(내지) 15. 3. 3. 오전 11:17 페이지 28
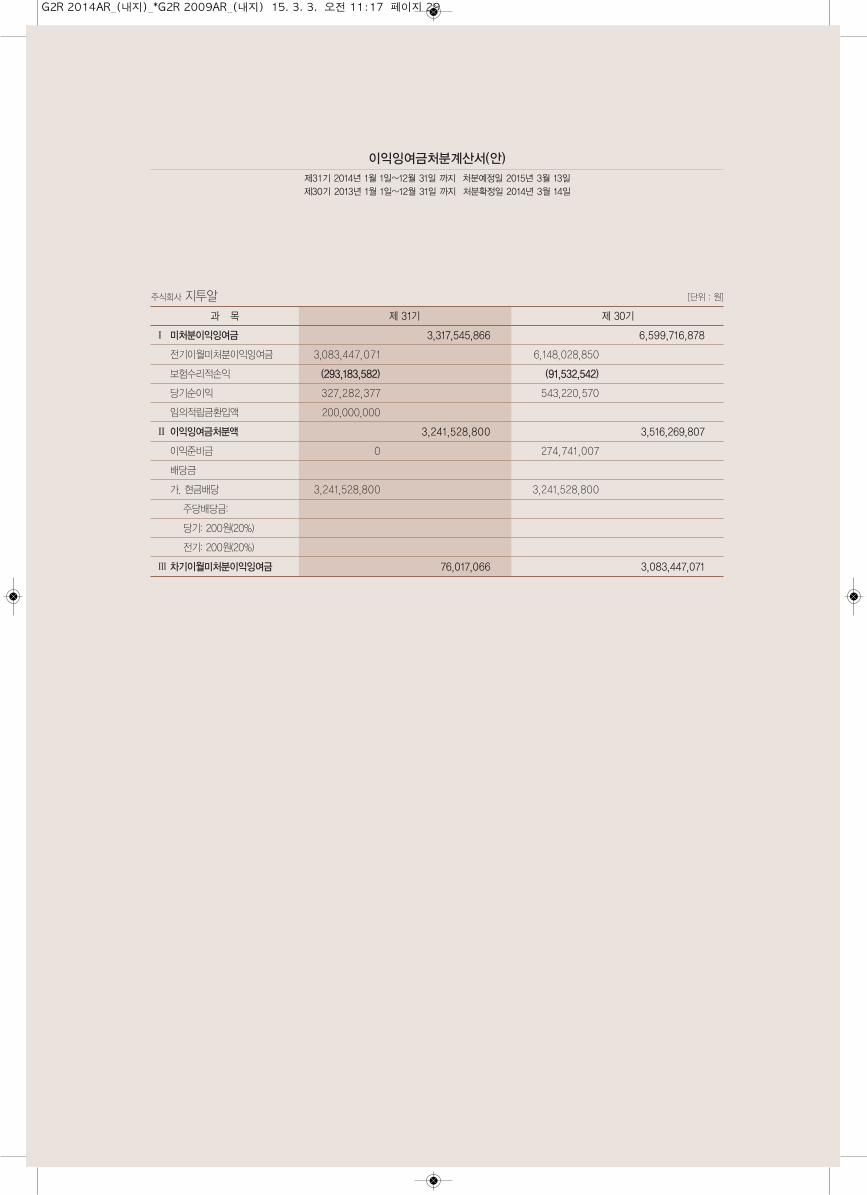
주식회사 지투알 [단위 : 원]
과 목 제 31기 제 30기
Ⅰ 미처분이익잉여금 3,317,545,866 6,599,716,878
전기이월미처분이익잉여금 3,083,447,071 6,148,028,850
보험수리적손익 (293,183,582) (91,532,542)
당기순이익 327,282,377 543,220,570
임의적립금환입액 200,000,000
Ⅱ 이익잉여금처분액 3,241,528,800 3,516,269,807
이익준비금 0 274,741,007
배당금
가. 현금배당 3,241,528,800 3,241,528,800
주당배당금:
당기: 200원(20%)
전기: 200원(20%)
Ⅲ 차기이월미처분이익잉여금 76,017,066 3,083,447,071
이익잉여금처분계산서(안)
제31기 2014년 1월 1일~12월 31일 까지 처분예정일 2015년 3월 13일
제30기 2013년 1월 1일~12월 31일 까지 처분확정일 2014년 3월 14일
G2R 2014AR_(내지)_*G2R 2009AR_(내지) 15. 3. 3. 오전 11:17 페이지 29
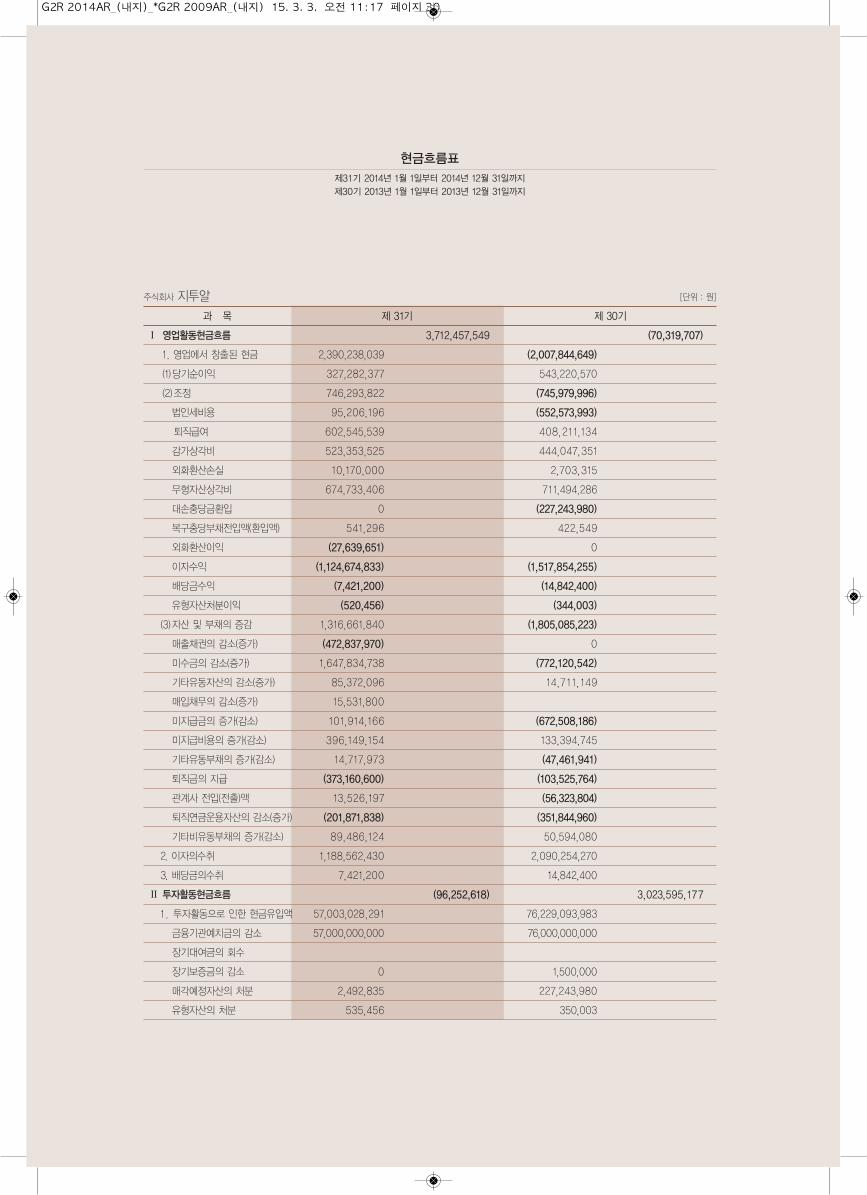
현금흐름표
제31기 2014년 1월 1일부터 2014년 12월 31일까지
제30기 2013년 1월 1일부터 2013년 12월 31일까지
주식회사 지투알 [단위 : 원]
과 목 제 31기 제 30기
Ⅰ 영업활동현금흐름 3,712,457,549 (70,319,707)
1. 영업에서 창출된 현금 2,390,238,039 (2,007,844,649)
(1)̀당기순이익 327,282,377 543,220,570
(2)̀조정 746,293,822 (745,979,996)
법인세비용 95,206,196 (552,573,993)
퇴직급여 602,545,539 408,211,134
감가상각비 523,353,525 444,047,351
외화환산손실 10,170,000 2,703,315
무형자산상각비 674,733,406 711,494,286
대손충당금환입 0 (227,243,980)
복구충당부채전입액(환입액) 541,296 422,549
외화환산이익 (27,639,651) 0
이자수익 (1,124,674,833) (1,517,854,255)
배당금수익 (7,421,200) (14,842,400)
유형자산처분이익 (520,456) (344,003)
(3)̀자산 및 부채의 증감 1,316,661,840 (1,805,085,223)
매출채권의 감소(증가) (472,837,970) 0
미수금의 감소(증가) 1,647,834,738 (772,120,542)
기타유동자산의 감소(증가) 85,372,096 14,711,149
매입채무의 감소(증가) 15,531,800
미지급금의 증가(감소) 101,914,166 (672,508,186)
미지급비용의 증가(감소) 396,149,154 133,394,745
기타유동부채의 증가(감소) 14,717,973 (47,461,941)
퇴직금의 지급 (373,160,600) (103,525,764)
관계사 전입(전출)액 13,526,197 (56,323,804)
퇴직연금운용자산의 감소(증가) (201,871,838) (351,844,960)
기타비유동부채의 증가(감소) 89,486,124 50,594,080
2. 이자의수취 1,188,562,430 2,090,254,270
3. 배당금의수취 7,421,200 14,842,400
Ⅱ 투자활동현금흐름 (96,252,618) 3,023,595,177
1 . 투자활동으로 인한 현금유입액 57,003,028,291 76,229,093,983
금융기관예치금의 감소 57,000,000,000 76,000,000,000
장기대여금의 회수
장기보증금의 감소 0 1,500,000
매각예정자산의 처분 2,492,835 227,243,980
유형자산의 처분 535,456 350,003
G2R 2014AR_(내지)_*G2R 2009AR_(내지) 15. 3. 3. 오전 11:17 페이지 30
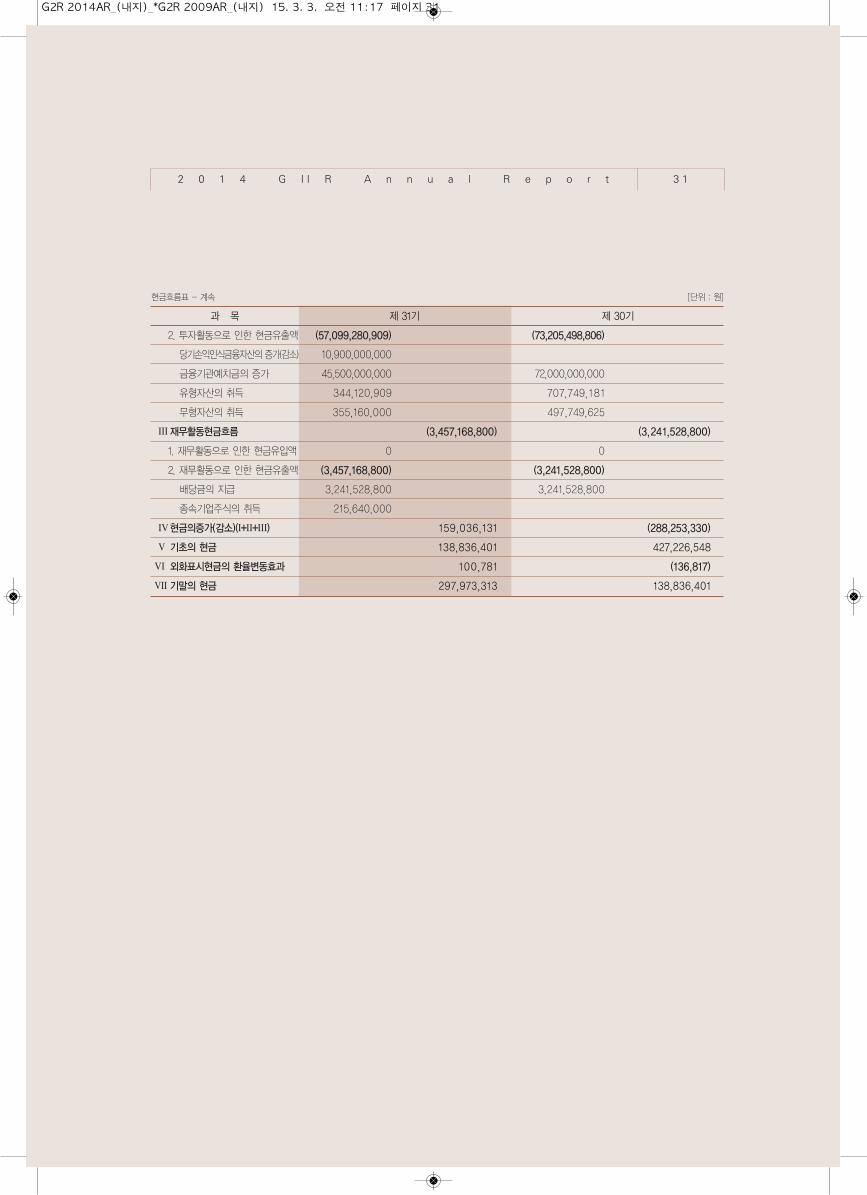
현금흐름표 - 계속 [단위 : 원]
과 목 제 31기 제 30기
2. 투자활동으로 인한 현금유출액 (57,099,280,909) (73,205,498,806)
당기손익인식금융자산의 증가(감소) 10,900,000,000
금융기관예치금의 증가 45,500,000,000 72,000,000,000
유형자산의 취득 344,120,909 707,749,181
무형자산의 취득 355,160,000 497,749,625
Ⅲ재무활동현금흐름 (3,457,168,800) (3,241,528,800)
1. 재무활동으로 인한 현금유입액 0 0
2. 재무활동으로 인한 현금유출액 (3,457,168,800) (3,241,528,800)
배당금의 지급 3,241,528,800 3,241,528,800
종속기업주식의 취득 215,640,000
Ⅳ현금의증가(감소)(Ⅰ+Ⅱ+Ⅲ) 159,036,131 (288,253,330)
Ⅴ 기초의 현금 138,836,401 427,226,548
Ⅵ 외화표시현금의 환율변동효과 100,781 (136,817)
Ⅶ 기말의 현금 297,973,313 138,836,401
2 0 1 4 G I I R A n n u a l R e p o r t 3 1
G2R 2014AR_(내지)_*G2R 2009AR_(내지) 15. 3. 3. 오전 11:17 페이지 31
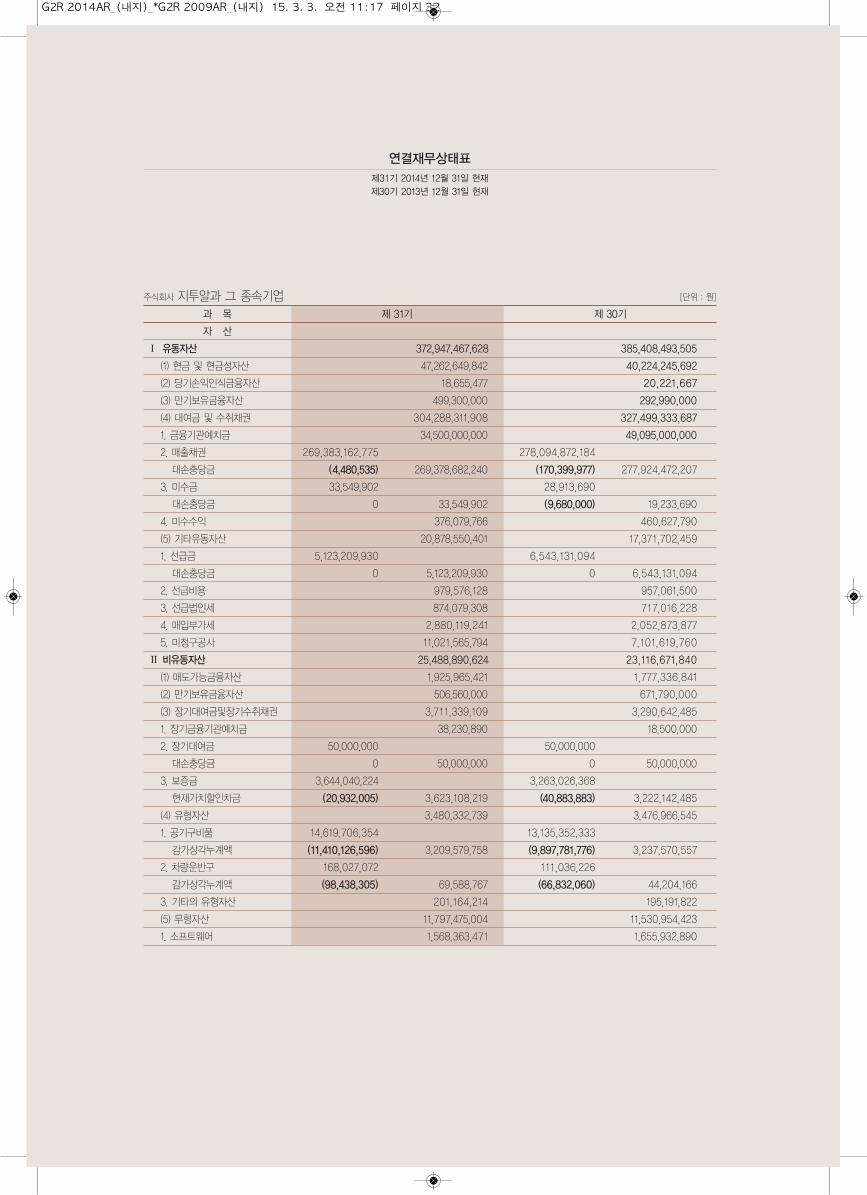
주식회사 지투알과 그 종속기업 [단위 : 원]
과 목 제 31기 제 30기
자 산
Ⅰ 유동자산 372,947,467,628 385,408,493,505
(1) 현금 및 현금성자산 47,262,649,842 40,224,245,692
(2) 당기손익인식금융자산 18,655,477 20,221,667
(3) 만기보유금융자산 499,300,000 292,990,000
(4) 대여금 및 수취채권 304,288,311,908 327,499,333,687
1. 금융기관예치금 34,500,000,000 49,095,000,000
2. 매출채권 269,383,162,775 278,094,872,184
대손충당금 (4,480,535) 269,378,682,240 (170,399,977) 277,924,472,207
3. 미수금 33,549,902 28,913,690
대손충당금 0 33,549,902 (9,680,000) 19,233,690
4. 미수수익 376,079,766 460,627,790
(5) 기타유동자산 20,878,550,401 17,371,702,459
1. 선급금 5,123,209,930 6,543,131,094
대손충당금 0 5,123,209,930 0 6,543,131,094
2. 선급비용 979,576,128 957,061,500
3. 선급법인세 874,079,308 717,016,228
4. 매입부가세 2,880,119,241 2,052,873,877
5. 미청구공사 11,021,565,794 7,101,619,760
Ⅱ 비유동자산 25,488,890,624 23,116,671,840
(1) 매도가능금융자산 1,925,965,421 1,777,336,841
(2) 만기보유금융자산 506,560,000 671,790,000
(3) 장기대여금및장기수취채권 3,711,339,109 3,290,642,485
1. 장기금융기관예치금 38,230,890 18,500,000
2. 장기대여금 50,000,000 50,000,000
대손충당금 0 50,000,000 0 50,000,000
3. 보증금 3,644,040,224 3,263,026,368
현재가치할인차금 (20,932,005) 3,623,108,219 (40,883,883) 3,222,142,485
(4) 유형자산 3,480,332,739 3,476,966,545
1. 공기구비품 14,619,706,354 13,135,352,333
감가상각누계액 (11,410,126,596) 3,209,579,758 (9,897,781,776) 3,237,570,557
2. 차량운반구 168,027,072 111,036,226
감가상각누계액 (98,438,305) 69,588,767 (66,832,060) 44,204,166
3. 기타의 유형자산 201,164,214 195,191,822
(5) 무형자산 11,797,475,004 11,530,954,423
1. 소프트웨어 1,568,363,471 1,655,932,890
연결재무상태표
제31기 2014년 12월 31일 현재
제30기 2013년 12월 31일 현재
G2R 2014AR_(내지)_*G2R 2009AR_(내지) 15. 3. 3. 오전 11:17 페이지 32
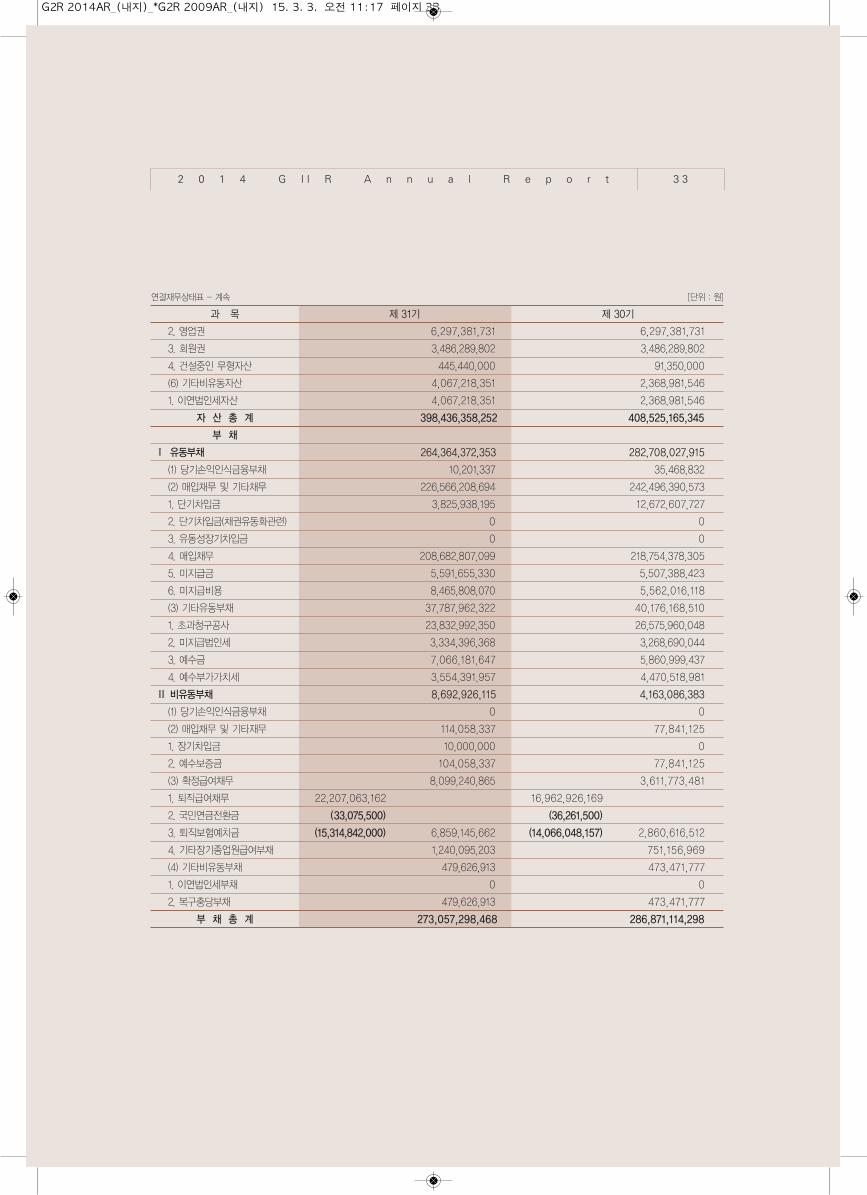
연결재무상태표 - 계속 [단위 : 원]
과 목 제 31기 제 30기
2. 영업권 6,297,381,731 6,297,381,731
3. 회원권 3,486,289,802 3,486,289,802
4. 건설중인 무형자산 445,440,000 91,350,000
(6) 기타비유동자산 4,067,218,351 2,368,981,546
1. 이연법인세자산 4,067,218,351 2,368,981,546
자 산 총 계 398,436,358,252 408,525,165,345
부 채
Ⅰ 유동부채 264,364,372,353 282,708,027,915
(1) 당기손익인식금융부채 10,201,337 35,468,832
(2) 매입채무 및 기타채무 226,566,208,694 242,496,390,573
1. 단기차입금 3,825,938,195 12,672,607,727
2. 단기차입금(채권유동화관련) 0 0
3. 유동성장기차입금 0 0
4. 매입채무 208,682,807,099 218,754,378,305
5. 미지급금 5,591,655,330 5,507,388,423
6. 미지급비용 8,465,808,070 5,562,016,118
(3) 기타유동부채 37,787,962,322 40,176,168,510
1. 초과청구공사 23,832,992,350 26,575,960,048
2. 미지급법인세 3,334,396,368 3,268,690,044
3. 예수금 7,066,181,647 5,860,999,437
4. 예수부가가치세 3,554,391,957 4,470,518,981
Ⅱ 비유동부채 8,692,926,115 4,163,086,383
(1) 당기손익인식금융부채 0 0
(2) 매입채무 및 기타재무 114,058,337 77,841,125
1. 장기차입금 10,000,000 0
2. 예수보증금 104,058,337 77,841,125
(3) 확정급여채무 8,099,240,865 3,611,773,481
1. 퇴직급여채무 22,207,063,162 16,962,926,169
2. 국민연금전환금 (33,075,500) (36,261,500)
3. 퇴직보험예치금 (15,314,842,000) 6,859,145,662 (14,066,048,157) 2,860,616,512
4. 기타장기종업원급여부채 1,240,095,203 751,156,969
(4) 기타비유동부채 479,626,913 473,471,777
1. 이연법인세부채 0 0
2. 복구충당부채 479,626,913 473,471,777
부 채 총 계 273,057,298,468 286,871,114,298
2 0 1 4 G I I R A n n u a l R e p o r t 3 3
G2R 2014AR_(내지)_*G2R 2009AR_(내지) 15. 3. 3. 오전 11:17 페이지 33
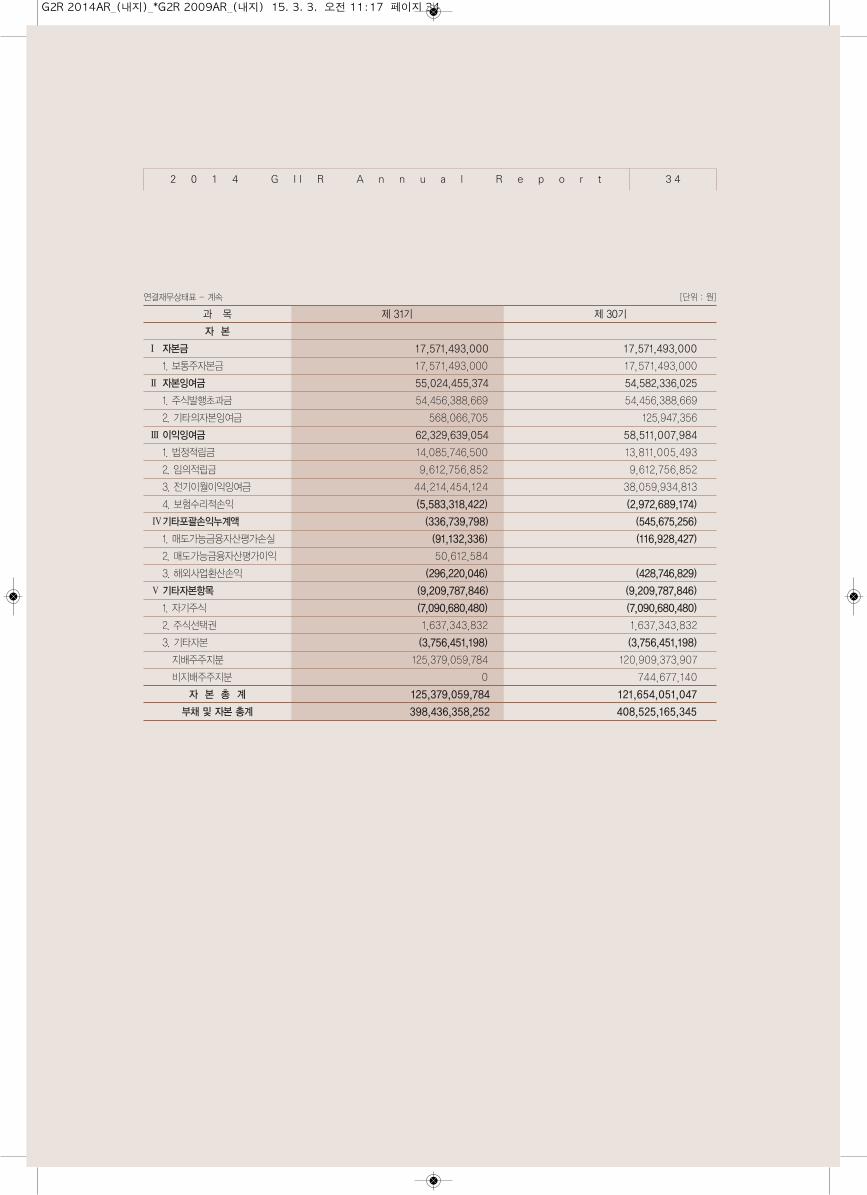
연결재무상태표 - 계속 [단위 : 원]
과 목 제 31기 제 30기
자 본
Ⅰ 자본금 17,571,493,000 17,571,493,000
1. 보통주자본금 17,571,493,000 17,571,493,000
II 자본잉여금 55,024,455,374 54,582,336,025
1. 주식발행초과금 54,456,388,669 54,456,388,669
2. 기타의자본잉여금 568,066,705 125,947,356
III 이익잉여금 62,329,639,054 58,511,007,984
1. 법정적립금 14,085,746,500 13,811,005,493
2. 임의적립금 9,612,756,852 9,612,756,852
3. 전기이월이익잉여금 44,214,454,124 38,059,934,813
4. 보험수리적손익 (5,583,318,422) (2,972,689,174)
Ⅳ기타포괄손익누계액 (336,739,798) (545,675,256)
1. 매도가능금융자산평가손실 (91,132,336) (116,928,427)
2. 매도가능금융자산평가이익 50,612,584
3. 해외사업환산손익 (296,220,046) (428,746,829)
V 기타자본항목 (9,209,787,846) (9,209,787,846)
1. 자기주식 (7,090,680,480) (7,090,680,480)
2. 주식선택권 1,637,343,832 1,637,343,832
3. 기타자본 (3,756,451,198) (3,756,451,198)
지배주주지분 125,379,059,784 120,909,373,907
비지배주주지분 0 744,677,140
자 본 총 계 125,379,059,784 121,654,051,047
부채 및 자본 총계 398,436,358,252 408,525,165,345
2 0 1 4 G I I R A n n u a l R e p o r t 3 4
G2R 2014AR_(내지)_*G2R 2009AR_(내지) 15. 3. 3. 오전 11:17 페이지 34
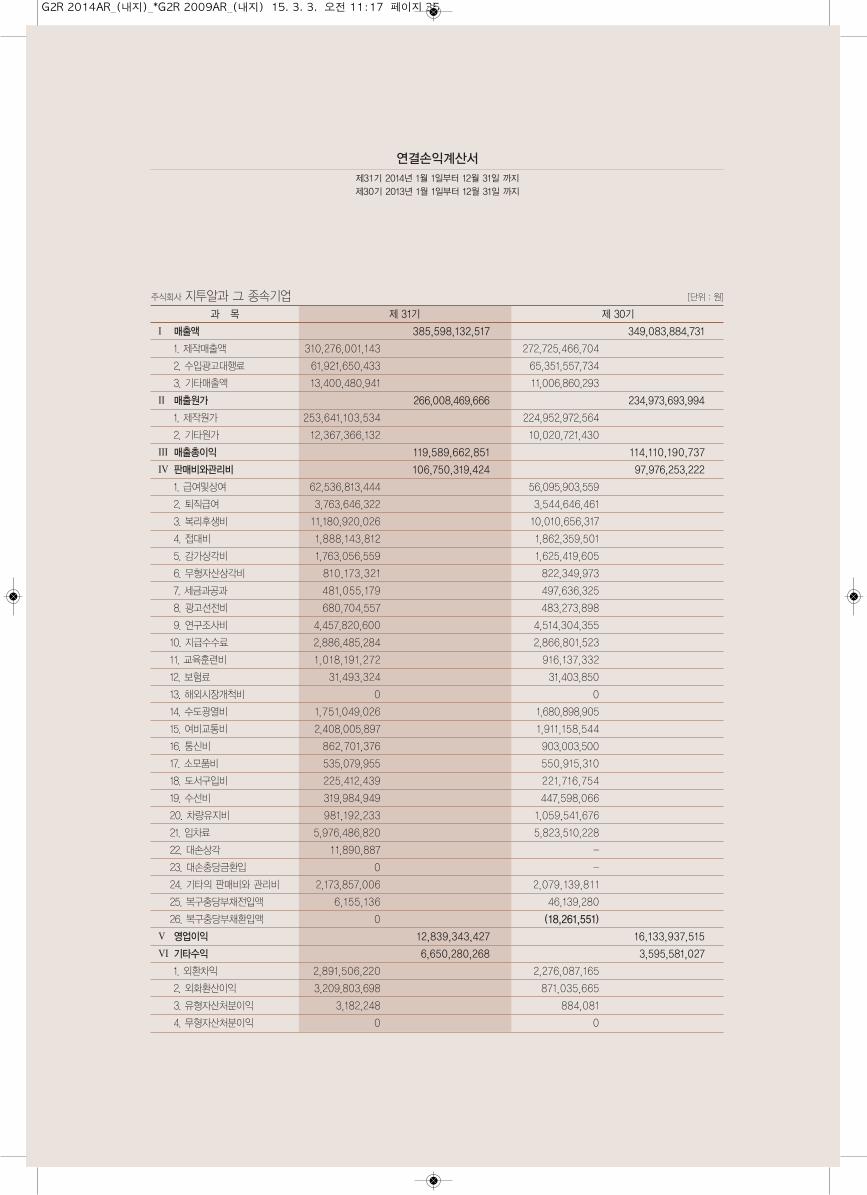
주식회사 지투알과 그 종속기업 [단위 : 원]
과 목 제 31기 제 30기
Ⅰ 매출액 385,598,132,517 349,083,884,731
1. 제작매출액 310,276,001,143 272,725,466,704
2. 수입광고대행료 61,921,650,433 65,351,557,734
3. 기타매출액 13,400,480,941 11,006,860,293
Ⅱ 매출원가 266,008,469,666 234,973,693,994
1. 제작원가 253,641,103,534 224,952,972,564
2. 기타원가 12,367,366,132 10,020,721,430
Ⅲ 매출총이익 119,589,662,851 114,110,190,737
Ⅳ 판매비와관리비 106,750,319,424 97,976,253,222
1. 급여및상여 62,536,813,444 56,095,903,559
2. 퇴직급여 3,763,646,322 3,544,646,461
3. 복리후생비 11,180,920,026 10,010,656,317
4. 접대비 1,888,143,812 1,862,359,501
5. 감가상각비 1,763,056,559 1,625,419,605
6. 무형자산상각비 810,173,321 822,349,973
7. 세금과공과 481,055,179 497,636,325
8. 광고선전비 680,704,557 483,273,898
9. 연구조사비 4,457,820,600 4,514,304,355
10. 지급수수료 2,886,485,284 2,866,801,523
11. 교육훈련비 1,018,191,272 916,137,332
12. 보험료 31,493,324 31,403,850
13. 해외시장개척비 0 0
14. 수도광열비 1,751,049,026 1,680,898,905
15. 여비교통비 2,408,005,897 1,911,158,544
16. 통신비 862,701,376 903,003,500
17. 소모품비 535,079,955 550,915,310
18. 도서구입비 225,412,439 221,716,754
19. 수선비 319,984,949 447,598,066
20. 차량유지비 981,192,233 1,059,541,676
21. 임차료 5,976,486,820 5,823,510,228
22. 대손상각 11,890,887 -
23. 대손충당금환입 0 -
24. 기타의 판매비와 관리비 2,173,857,006 2,079,139,811
25. 복구충당부채전입액 6,155,136 46,139,280
26. 복구충당부채환입액 0 (18,261,551)
Ⅴ 영업이익 12,839,343,427 16,133,937,515
Ⅵ 기타수익 6,650,280,268 3,595,581,027
1. 외환차익 2,891,506,220 2,276,087,165
2. 외화환산이익 3,209,803,698 871,035,665
3. 유형자산처분이익 3,182,248 884,081
4. 무형자산처분이익 0 0
연결손익계산서
제31기 2014년 1월 1일부터 12월 31일 까지
제30기 2013년 1월 1일부터 12월 31일 까지
G2R 2014AR_(내지)_*G2R 2009AR_(내지) 15. 3. 3. 오전 11:17 페이지 35
연결손익계산서 - 계속 [단위 : 원]
과 목 제 31기 제 30기
5. 기타비금융자산처분이익 0
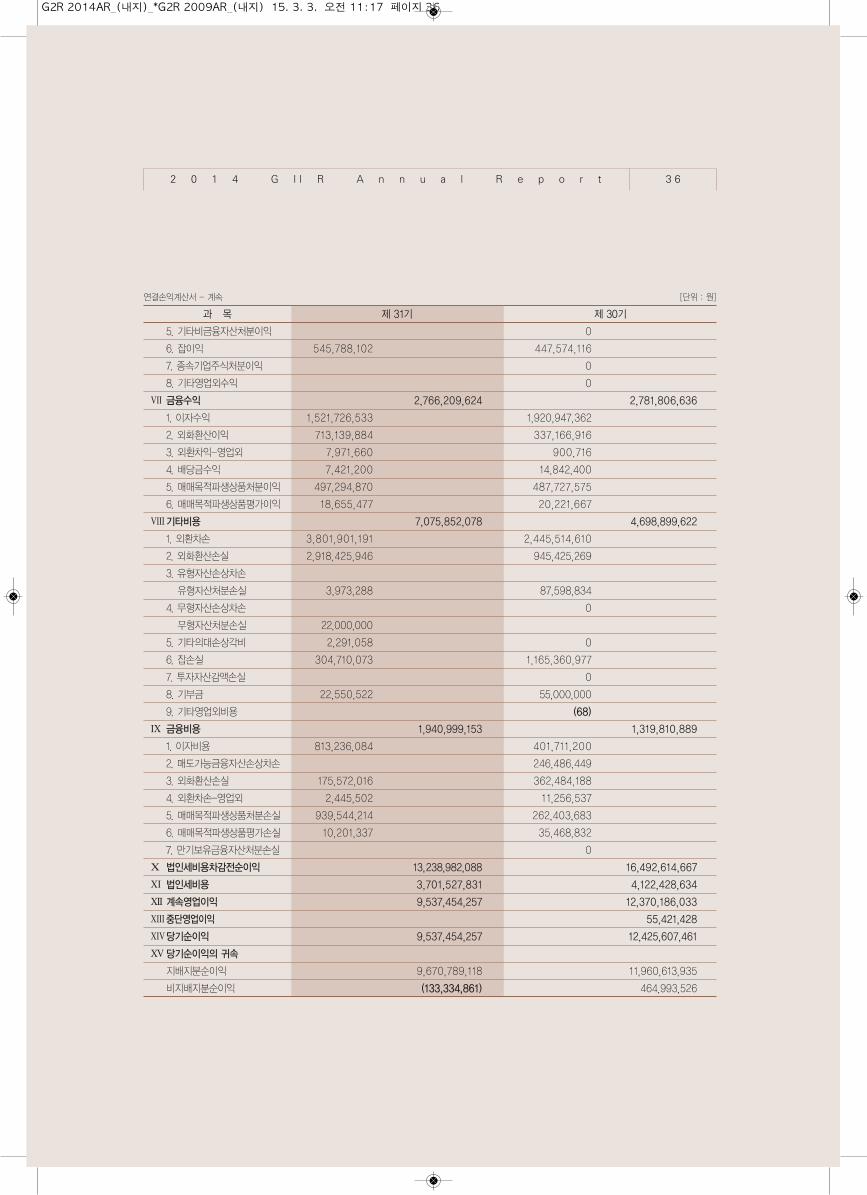
6. 잡이익 545,788,102 447,574,116
7. 종속기업주식처분이익 0
8. 기타영업외수익 0
Ⅶ 금융수익 2,766,209,624 2,781,806,636
1. 이자수익 1,521,726,533 1,920,947,362
2. 외화환산이익 713,139,884 337,166,916
3. 외환차익-영업외 7,971,660 900,716
4. 배당금수익 7,421,200 14,842,400
5. 매매목적파생상품처분이익 497,294,870 487,727,575
6. 매매목적파생상품평가이익 18,655,477 20,221,667
Ⅷ기타비용 7,075,852,078 4,698,899,622
1. 외환차손 3,801,901,191 2,445,514,610
2. 외화환산손실 2,918,425,946 945,425,269
3. 유형자산손상차손
유형자산처분손실 3,973,288 87,598,834
4. 무형자산손상차손 0
무형자산처분손실 22,000,000
5. 기타의대손상각비 2,291,058 0
6. 잡손실 304,710,073 1,165,360,977
7. 투자자산감액손실 0
8. 기부금 22,550,522 55,000,000
9. 기타영업외비용 (68)
Ⅸ 금융비용 1,940,999,153 1,319,810,889
1. 이자비용 813,236,084 401,711,200
2. 매도가능금융자산손상차손 246,486,449
3. 외화환산손실 175,572,016 362,484,188
4. 외환차손-영업외 2,445,502 11,256,537
5. 매매목적파생상품처분손실 939,544,214 262,403,683
6. 매매목적파생상품평가손실 10,201,337 35,468,832
7. 만기보유금융자산처분손실 0
Ⅹ 법인세비용차감전순이익 13,238,982,088 16,492,614,667
Ⅺ 법인세비용 3,701,527,831 4,122,428,634
XII 계속영업이익 9,537,454,257 12,370,186,033
XIII중단영업이익 55,421,428
XIV당기순이익 9,537,454,257 12,425,607,461
XV 당기순이익의 귀속
지배지분순이익 9,670,789,118 11,960,613,935
비지배지분순이익 (133,334,861) 464,993,526
2 0 1 4 G I I R A n n u a l R e p o r t 3 6
G2R 2014AR_(내지)_*G2R 2009AR_(내지) 15. 3. 3. 오전 11:17 페이지 36
주식회사 지투알과 그 종속기업 [단위 : 원]
과 목 제 31기 제 30기
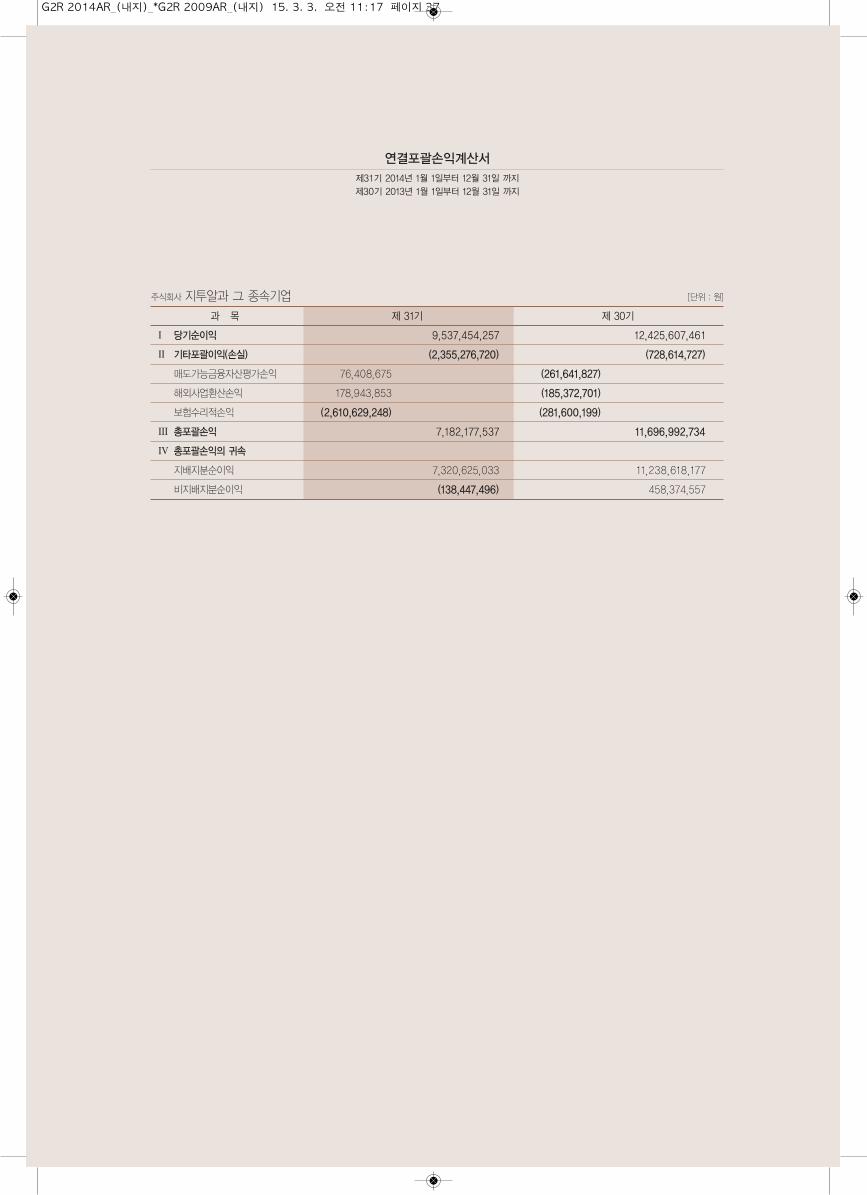
Ⅰ 당기순이익 9,537,454,257 12,425,607,461
Ⅱ 기타포괄이익(손실) (2,355,276,720) (728,614,727)
매도가능금융자산평가손익 76,408,675 (261,641,827)
해외사업환산손익 178,943,853 (185,372,701)
보험수리적손익 (2,610,629,248) (281,600,199)
Ⅲ 총포괄손익 7,182,177,537 11,696,992,734
Ⅳ 총포괄손익의 귀속
지배지분순이익 7,320,625,033 11,238,618,177
비지배지분순이익 (138,447,496) 458,374,557
연결포괄손익계산서
제31기 2014년 1월 1일부터 12월 31일 까지
제30기 2013년 1월 1일부터 12월 31일 까지
G2R 2014AR_(내지)_*G2R 2009AR_(내지) 15. 3. 3. 오전 11:17 페이지 37
주식회사 지투알과 그 종속기업 [단위 : 원]
과 목 자본금 연결자본잉여금 연결이익잉여금연결기타 연결기타
비지배지분 자본총계포괄손익누계액 자본항목
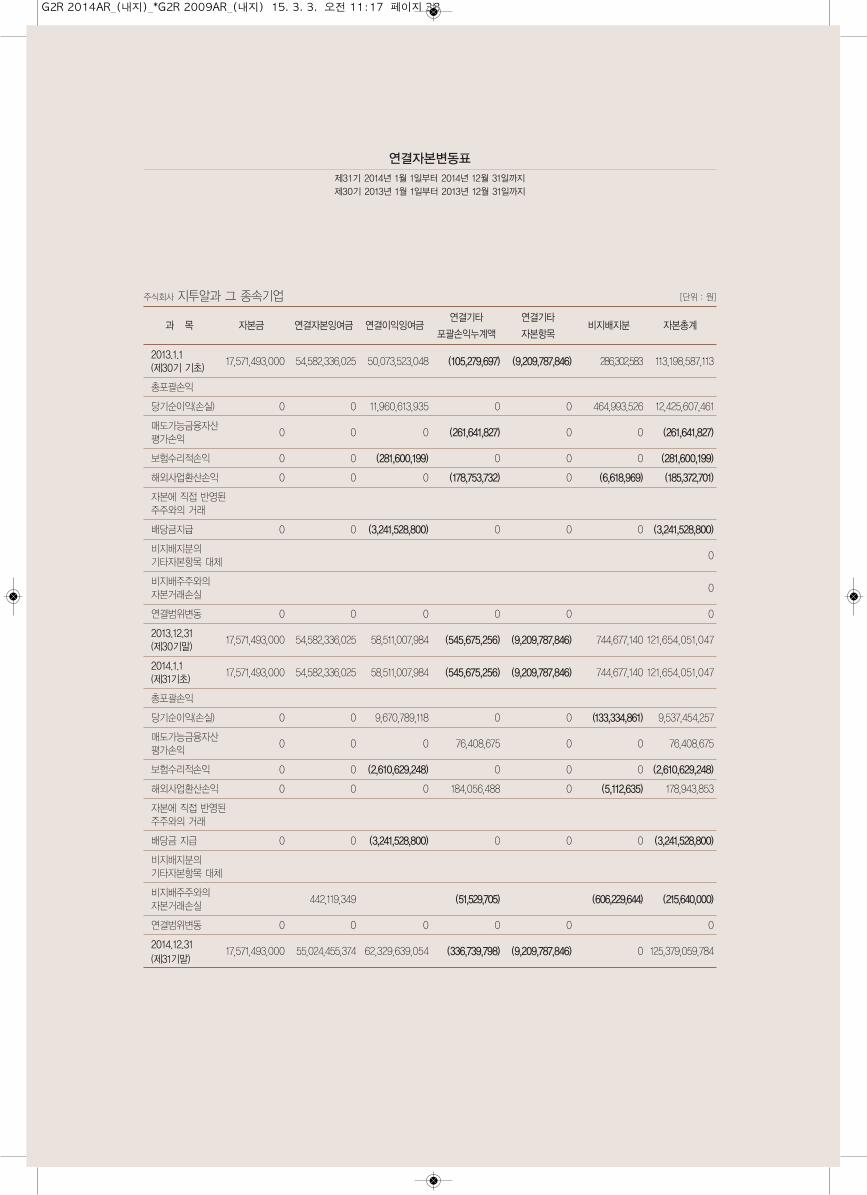
2013.1.117,571,493,000 54,582,336,025 50,073,523,048 (105,279,697) (9,209,787,846) 286,302,583 113,198,587,113
(제30기 기초)
총포괄손익
당기순이익(손실) 0 0 11,960,613,935 0 0 464,993,526 12,425,607,461
매도가능금융자산0 0 0 (261,641,827) 0 0 (261,641,827)
평가손익
보험수리적손익 0 0 (281,600,199) 0 0 0 (281,600,199)
해외사업환산손익 0 0 0 (178,753,732) 0 (6,618,969) (185,372,701)
자본에 직접 반영된주주와의 거래
배당금지급 0 0 (3,241,528,800) 0 0 0 (3,241,528,800)
비지배지분의0
기타자본항목 대체
비지배주주와의0
자본거래손실
연결범위변동 0 0 0 0 0 0
2013.12.3117,571,493,000 54,582,336,025 58,511,007,984 (545,675,256) (9,209,787,846) 744,677,140 121,654,051,047
(제30기말)
2014.1.117,571,493,000 54,582,336,025 58,511,007,984 (545,675,256) (9,209,787,846) 744,677,140 121,654,051,047
(제31기초)
총포괄손익
당기순이익(손실) 0 0 9,670,789,118 0 0 (133,334,861) 9,537,454,257
매도가능금융자산0 0 0 76,408,675 0 0 76,408,675
평가손익
보험수리적손익 0 0 (2,610,629,248) 0 0 0 (2,610,629,248)
해외사업환산손익 0 0 0 184,056,488 0 (5,112,635) 178,943,853
자본에 직접 반영된주주와의 거래
배당금 지급 0 0 (3,241,528,800) 0 0 0 (3,241,528,800)
비지배지분의기타자본항목 대체
비지배주주와의442,119,349 (51,529,705) (606,229,644) (215,640,000)
자본거래손실
연결범위변동 0 0 0 0 0 0
2014.12.3117,571,493,000 55,024,455,374 62,329,639,054 (336,739,798) (9,209,787,846) 0 125,379,059,784
(제31기말)
연결자본변동표
제31기 2014년 1월 1일부터 2014년 12월 31일까지
제30기 2013년 1월 1일부터 2013년 12월 31일까지
G2R 2014AR_(내지)_*G2R 2009AR_(내지) 15. 3. 3. 오전 11:17 페이지 38
연결현금흐름표
제31기 2014년 1월 1일부터 2014년 12월 31일까지
제30기 2013년 1월 1일부터 2013년 12월 31일까지
주식회사 지투알과 그 종속기업 [단위 : 원]
과 목 제 31기 제 30기
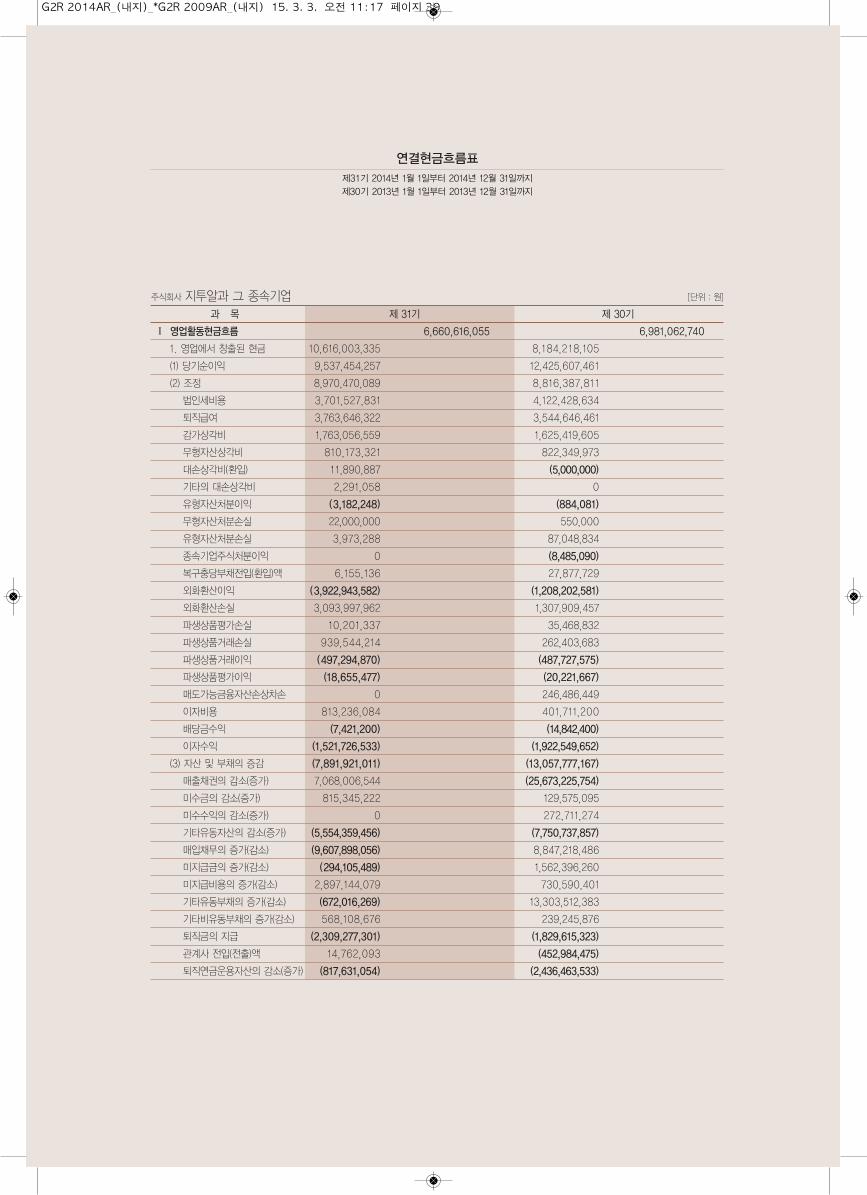
Ⅰ 영업활동현금흐름 6,660,616,055 6,981,062,740
1. 영업에서 창출된 현금 10,616,003,335 8,184,218,105
(1) 당기순이익 9,537,454,257 12,425,607,461
(2) 조정 8,970,470,089 8,816,387,811
법인세비용 3,701,527,831 4,122,428,634
퇴직급여 3,763,646,322 3,544,646,461
감가상각비 1,763,056,559 1,625,419,605
무형자산상각비 810,173,321 822,349,973
대손상각비(환입) 11,890,887 (5,000,000)
기타의 대손상각비 2,291,058 0
유형자산처분이익 (3,182,248) (884,081)
무형자산처분손실 22,000,000 550,000
유형자산처분손실 3,973,288 87,048,834
종속기업주식처분이익 0 (8,485,090)
복구충당부채전입(환입)액 6,155,136 27,877,729
외화환산이익 (3,922,943,582) (1,208,202,581)
외화환산손실 3,093,997,962 1,307,909,457
파생상품평가손실 10,201,337 35,468,832
파생상품거래손실 939,544,214 262,403,683
파생상품거래이익 (497,294,870) (487,727,575)
파생상품평가이익 (18,655,477) (20,221,667)
매도가능금융자산손상차손 0 246,486,449
이자비용 813,236,084 401,711,200
배당금수익 (7,421,200) (14,842,400)
이자수익 (1,521,726,533) (1,922,549,652)
(3) 자산 및 부채의 증감 (7,891,921,011) (13,057,777,167)
매출채권의 감소(증가) 7,068,006,544 (25,673,225,754)
미수금의 감소(증가) 815,345,222 129,575,095
미수수익의 감소(증가) 0 272,711,274
기타유동자산의 감소(증가) (5,554,359,456) (7,750,737,857)
매입채무의 증가(감소) (9,607,898,056) 8,847,218,486
미지급금의 증가(감소) (294,105,489) 1,562,396,260
미지급비용의 증가(감소) 2,897,144,079 730,590,401
기타유동부채의 증가(감소) (672,016,269) 13,303,512,383
기타비유동부채의 증가(감소) 568,108,676 239,245,876
퇴직금의 지급 (2,309,277,301) (1,829,615,323)
관계사 전입(전출)액 14,762,093 (452,984,475)
퇴직연금운용자산의 감소(증가) (817,631,054) (2,436,463,533)
G2R 2014AR_(내지)_*G2R 2009AR_(내지) 15. 3. 3. 오전 11:17 페이지 39
연결현금흐름표 - 계속 [단위 : 원]
과 목 제 31기 제 30기
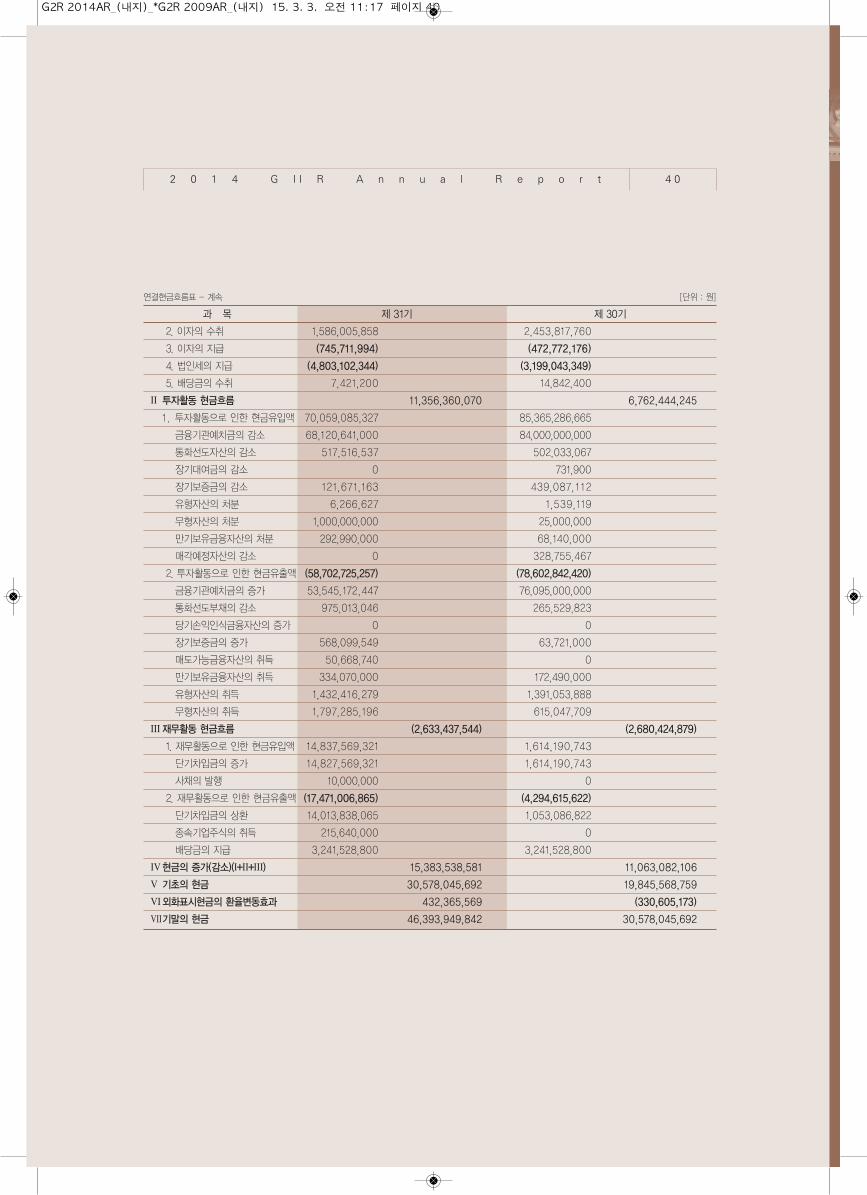
2. 이자의 수취 1,586,005,858 2,453,817,760
3. 이자의 지급 (745,711,994) (472,772,176)
4. 법인세의 지급 (4,803,102,344) (3,199,043,349)
5. 배당금의 수취 7,421,200 14,842,400
Ⅱ 투자활동 현금흐름 11,356,360,070 6,762,444,245
1 . 투자활동으로 인한 현금유입액 70,059,085,327 85,365,286,665
금융기관예치금의 감소 68,120,641,000 84,000,000,000
통화선도자산의 감소 517,516,537 502,033,067
장기대여금의 감소 0 731,900
장기보증금의 감소 121,671,163 439,087,112
유형자산의 처분 6,266,627 1,539,119
무형자산의 처분 1,000,000,000 25,000,000
만기보유금융자산의 처분 292,990,000 68,140,000
매각예정자산의 감소 0 328,755,467
2. 투자활동으로 인한 현금유출액 (58,702,725,257) (78,602,842,420)
금융기관예치금의 증가 53,545,172,447 76,095,000,000
통화선도부채의 감소 975,013,046 265,529,823
당기손익인식금융자산의 증가 0 0
장기보증금의 증가 568,099,549 63,721,000
매도가능금융자산의 취득 50,668,740 0
만기보유금융자산의 취득 334,070,000 172,490,000
유형자산의 취득 1,432,416,279 1,391,053,888
무형자산의 취득 1,797,285,196 615,047,709
Ⅲ재무활동 현금흐름 (2,633,437,544) (2,680,424,879)
1. 재무활동으로 인한 현금유입액 14,837,569,321 1,614,190,743
단기차입금의 증가 14,827,569,321 1,614,190,743
사채의 발행 10,000,000 0
2. 재무활동으로 인한 현금유출액 (17,471,006,865) (4,294,615,622)
단기차입금의 상환 14,013,838,065 1,053,086,822
종속기업주식의 취득 215,640,000 0
배당금의 지급 3,241,528,800 3,241,528,800
Ⅳ현금의 증가(감소)(Ⅰ+Ⅱ+Ⅲ) 15,383,538,581 11,063,082,106
Ⅴ 기초의 현금 30,578,045,692 19,845,568,759
Ⅵ외화표시현금의 환율변동효과 432,365,569 (330,605,173)
Ⅶ기말의 현금 46,393,949,842 30,578,045,692
2 0 1 4 G I I R A n n u a l R e p o r t 4 0
G2R 2014AR_(내지)_*G2R 2009AR_(내지) 15. 3. 3. 오전 11:17 페이지 40
1. To Our Shareholders 42
2. Business Report
1. General condition of the Company 45
2. Progress and results of operation 47
3. Parent company, subsidiary company and interlocking directorate of 48
the Company etc.
4. Operation results and financial condition for recent 3 years 49
5. Assignment of the Company 53
6. Present state of directors and auditor 54
7. Present state of major shareholder 54
8. Investment state for the Company and subsidiary company or subsidiary 55
company of the Company
9. Main creditor etc. 55
10. Important matters occurred after the accounting period 55
11. Other matters acknowledged important related to operation 55
3. Audit Report
1. Audit report by Audit Committee of GIIR Inc. 57
2. Evaluation report of the Internal Accounting Management System 58
4. Financial Statements
1. Balance Sheet 60
2. Statement of Income 62
3. Statement of Comprehensive Income 64
4. Statement of changes in Equity 65
5. Statement of Appropriations of Retained Earnings(proposal) 66
6. Cash Flows 67
7. Notes to Financial Statements
8. Balance Sheet(Consolidated) 69
9. Statement of Income(Consolidated) 72
10. Statement of Comprehensive Income(Consolidated) 74
11. Statement of Changes in Equity(Consolidated) 75
12. Cash Flows(Consolidated) 76
13. Notes to Financial Statements(Consolidated)
2 0 1 4 G I I R A n n u a l R e p o r t
G2R 2014AR_(내지)_*G2R 2009AR_(내지) 15. 3. 3. 오전 11:17 페이지 41
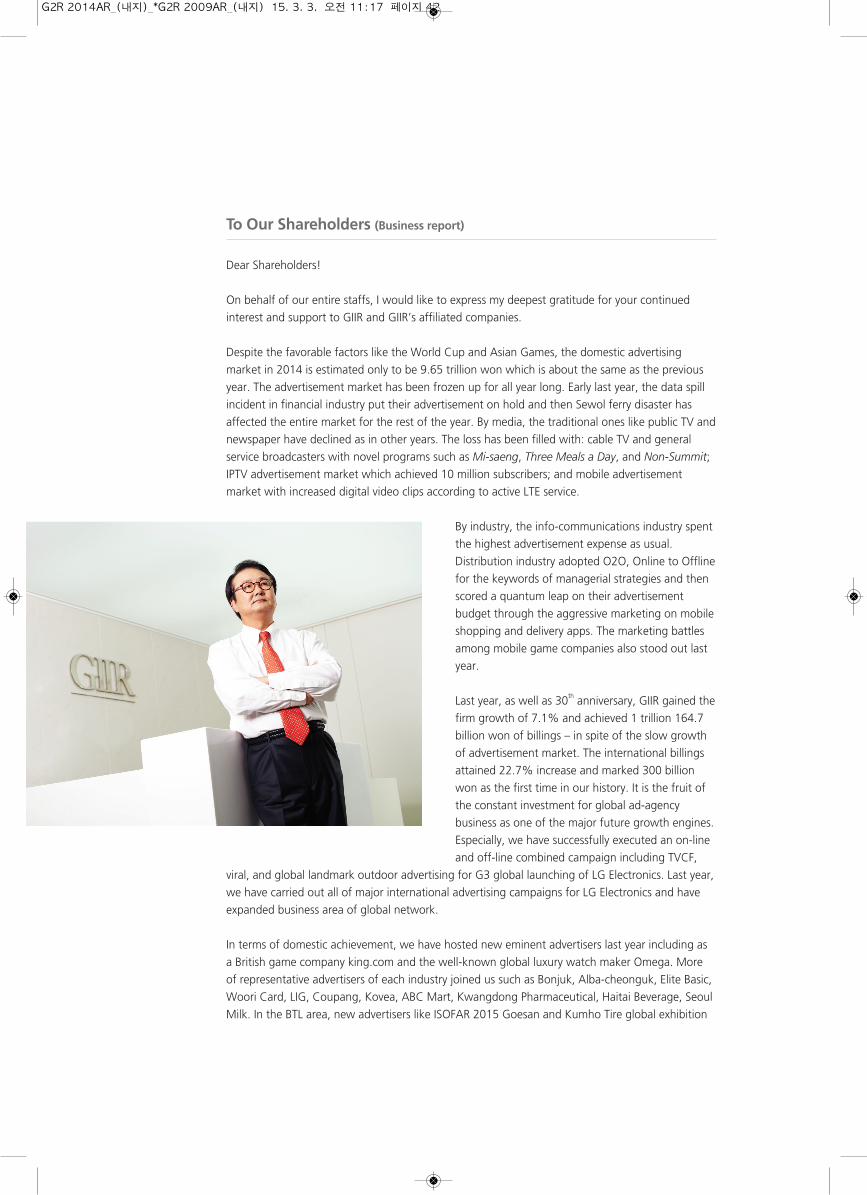
To Our Shareholders (Business report)
Dear Shareholders!
On behalf of our entire staffs, I would like to express my deepest gratitude for your continued
interest and support to GIIR and GIIR’s affiliated companies.
Despite the favorable factors like the World Cup and Asian Games, the domestic advertising
market in 2014 is estimated only to be 9.65 trillion won which is about the same as the previous
year. The advertisement market has been frozen up for all year long. Early last year, the data spill
incident in financial industry put their advertisement on hold and then Sewol ferry disaster has
affected the entire market for the rest of the year. By media, the traditional ones like public TV and
newspaper have declined as in other years. The loss has been filled with: cable TV and general
service broadcasters with novel programs such as Mi-saeng, Three Meals a Day, and Non-Summit;IPTV advertisement market which achieved 10 million subscribers; and mobile advertisement
market with increased digital video clips according to active LTE service.
By industry, the info-communications industry spent
the highest advertisement expense as usual.
Distribution industry adopted O2O, Online to Offline
for the keywords of managerial strategies and then
scored a quantum leap on their advertisement
budget through the aggressive marketing on mobile
shopping and delivery apps. The marketing battles
among mobile game companies also stood out last
year.
Last year, as well as 30th anniversary, GIIR gained the
firm growth of 7.1% and achieved 1 trillion 164.7
billion won of billings – in spite of the slow growth
of advertisement market. The international billings
attained 22.7% increase and marked 300 billion
won as the first time in our history. It is the fruit of
the constant investment for global ad-agency
business as one of the major future growth engines.
Especially, we have successfully executed an on-line
and off-line combined campaign including TVCF,
viral, and global landmark outdoor advertising for G3 global launching of LG Electronics. Last year,
we have carried out all of major international advertising campaigns for LG Electronics and have
expanded business area of global network.
In terms of domestic achievement, we have hosted new eminent advertisers last year including as
a British game company king.com and the well-known global luxury watch maker Omega. More
of representative advertisers of each industry joined us such as Bonjuk, Alba-cheonguk, Elite Basic,
Woori Card, LIG, Coupang, Kovea, ABC Mart, Kwangdong Pharmaceutical, Haitai Beverage, Seoul
Milk. In the BTL area, new advertisers like ISOFAR 2015 Goesan and Kumho Tire global exhibition
G2R 2014AR_(내지)_*G2R 2009AR_(내지) 15. 3. 3. 오전 11:17 페이지 42
have been developed.
We have created several extremely successful campaigns. The Baemin campaign for Woowa
Borthers & Sisters made a big hit in advertising industry last year, and generated a famous buzz
word ‘what kind of race we are’in order to give a big push for the Baemin app to be the top
delivery app in Korea. Korean Airline advertisement <Where’s Your Europe?> received Effie
Awards and won the Grand Prix of Korean Advertising Awards for 4 consecutive years. As the
result of the series of successful campaigns, we have been selected as the best ad-agency in TVCF
Awards 2014, early this year. We also successfully carried out cultural ceremonies such as 2014
ASEAN – Republic of Korea Commemorative Summit, opening and closing ceremonies for 17th
Asian Games Incheon 2014, and Osong International Bio Industry Exposition in Korea. We did not
ignore our social responsibilities so we provided a talent donation for public service advertisement
of Korean Unwed Mothers Support Network and Child Fund Korea.
Honorable shareholders! Economic research institutes forecast about 3% of economic growth in
Korea in this year. The domestic advertisement market is expected to be increased by the
economic growth rate, based on public TV which has been affected by Sewol ferry disaster and
mobile and IPTV which have continuous trend of rising multi-media users. The whole market may
revive gradually but there are unfavorable factors to reduce profitability of advertisement agencies,
including the issue of biased work order for affiliates, the increase of advertisement production
cost, and the increase of personnel expense due to government policy to support youth. Thus, all
employees of GIIR will try our best to achieve quantitative growth through: developing new
advertisers; striving for new business which is way beyond the traditional ad-agency areas;
supporting global business outcomes of market leading products of LG including G4 and OLED TV;
and expanding global business limit of our own. In the other hand, we will intensify our quality of
work through improving MPM, the multi-media platform for advertisement effect measurement
model, developed exclusively by us as the first time in this industry as well as the MPOPS PRO, the
4-Screen integrated media planning solution. Then we will have unique and distinctive ability to
sense consumer and market.
This year is very important year as the first year to start another 30 years. With humble and modest
mind, we will try our best for GIIR to be an enterprise to be loved from all of shareholders,
advertisers, subcontractors, local communities and employees of our own. Thank you from the
bottom of our hearts for our shareholders’ constant concerns. We wish good health and happiness
within all of your families.
Thank you.
March 13th, 2015
Representative Director of GIIR Inc., Jong Ripp Kim
G2R 2014AR_(내지)_*G2R 2009AR_(내지) 15. 3. 3. 오전 11:17 페이지 43
General Condition of the Company
Progress and Results of Operation
Parent Company, Subsidiary Companies, Interlocking Directorate, and etc.
Operation Results and Financial Conditions for the Past Three Years
Assignment of the Company
Directors and Auditor
Major Shareholders
Company and Subsidiary Companies’ Investment Status
Major Creditors
Occurrence of Significant Events After the Accounting Period
Other Important Matters Related to Operation
B u s i n e s s R epo r t
G2R 2014AR_(내지)_*G2R 2009AR_(내지) 15. 3. 3. 오전 11:17 페이지 44
2 0 1 4 G I I R A n n u a l R e p o r t 4 5
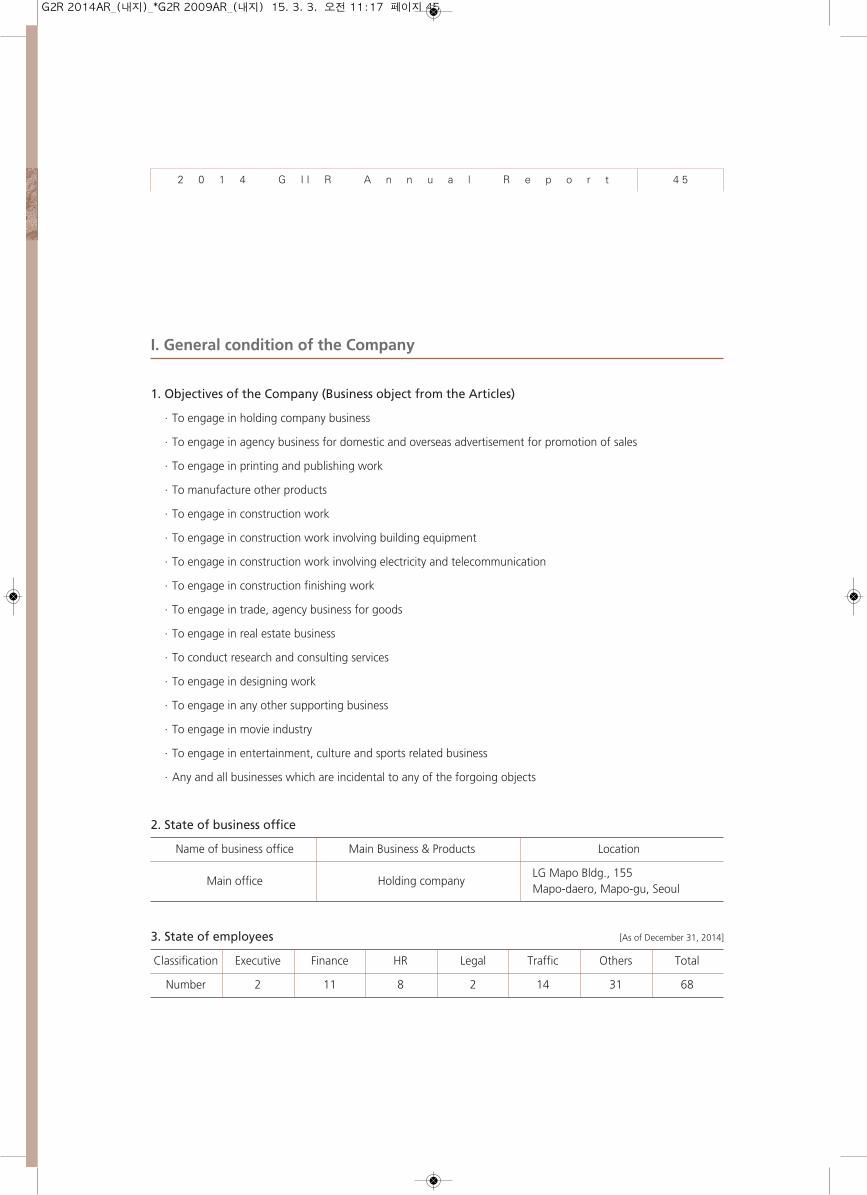
I. General condition of the Company
1. Objectives of the Company (Business object from the Articles)
·To engage in holding company business
·To engage in agency business for domestic and overseas advertisement for promotion of sales
·To engage in printing and publishing work
·To manufacture other products
·To engage in construction work
·To engage in construction work involving building equipment
·To engage in construction work involving electricity and telecommunication
·To engage in construction finishing work
·To engage in trade, agency business for goods
·To engage in real estate business
·To conduct research and consulting services
·To engage in designing work
·To engage in any other supporting business
·To engage in movie industry
·To engage in entertainment, culture and sports related business
·Any and all businesses which are incidental to any of the forgoing objects
2. State of business office
Name of business office Main Business & Products Location
Main office Holding companyLG Mapo Bldg., 155 Mapo-daero, Mapo-gu, Seoul
3. State of employees [As of December 31, 2014]
Classification Executive Finance HR Legal Traffic Others Total
Number 2 11 8 2 14 31 68
G2R 2014AR_(내지)_*G2R 2009AR_(내지) 15. 3. 3. 오전 11:17 페이지 45
2 0 1 4 G I I R A n n u a l R e p o r t 4 6
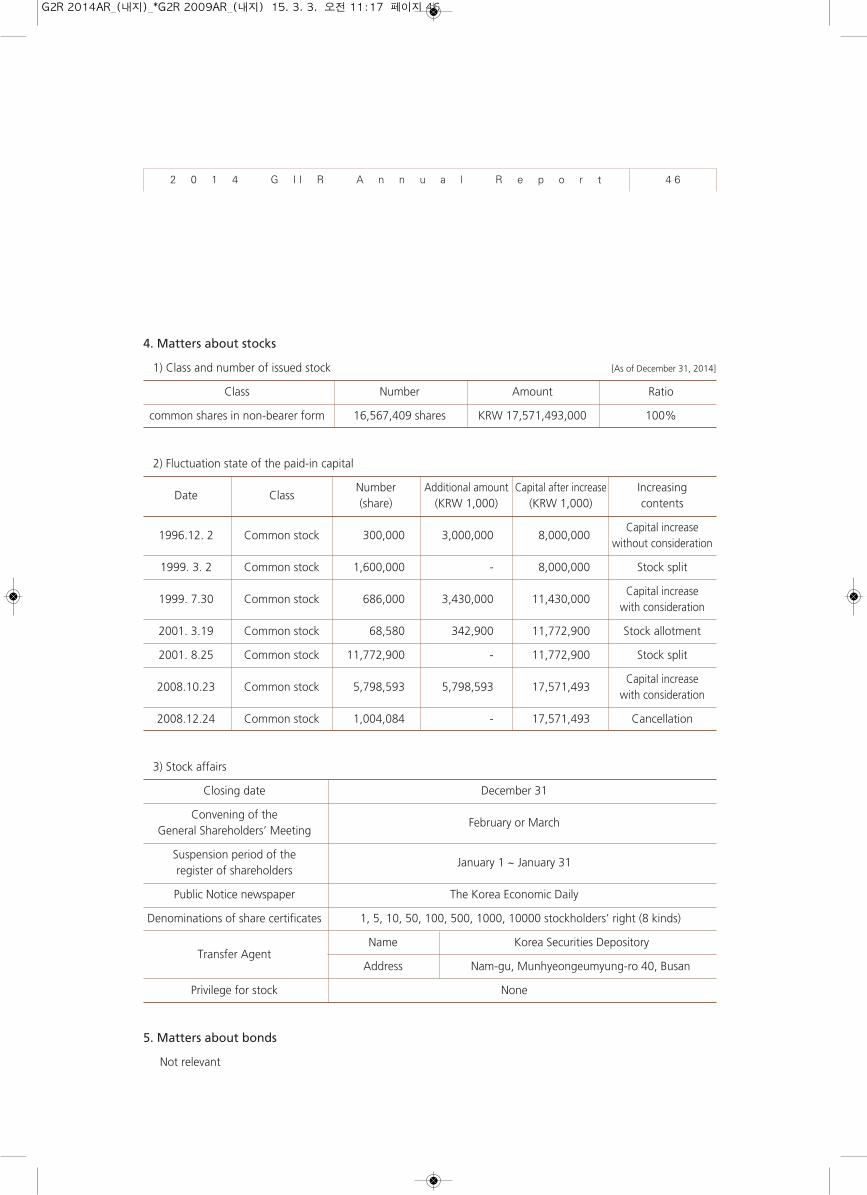
4. Matters about stocks
1) Class and number of issued stock [As of December 31, 2014]
Class Number Amount Ratio
common shares in non-bearer form 16,567,409 shares KRW 17,571,493,000 100%
2) Fluctuation state of the paid-in capital
Date ClassNumber Additional amount Capital after increase Increasing(share) (KRW 1,000) (KRW 1,000) contents
1996.12. 2 Common stock 300,000 3,000,000 8,000,000Capital increase
without consideration
1999. 3. 2 Common stock 1,600,000 - 8,000,000 Stock split
1999. 7.30 Common stock 686,000 3,430,000 11,430,000Capital increase with consideration
2001. 3.19 Common stock 68,580 342,900 11,772,900 Stock allotment
2001. 8.25 Common stock 11,772,900 - 11,772,900 Stock split
2008.10.23 Common stock 5,798,593 5,798,593 17,571,493Capital increase with consideration
2008.12.24 Common stock 1,004,084 - 17,571,493 Cancellation
3) Stock affairs
Closing date December 31
Convening of theFebruary or March
General Shareholders’ Meeting
Suspension period of theJanuary 1 ~ January 31
register of shareholders
Public Notice newspaper The Korea Economic Daily
Denominations of share certificates 1, 5, 10, 50, 100, 500, 1000, 10000 stockholders’ right (8 kinds)
Transfer AgentName Korea Securities Depository
Address Nam-gu, Munhyeongeumyung-ro 40, Busan
Privilege for stock None
5. Matters about bonds
Not relevant
G2R 2014AR_(내지)_*G2R 2009AR_(내지) 15. 3. 3. 오전 11:17 페이지 46
2 0 1 4 G I I R A n n u a l R e p o r t 4 7
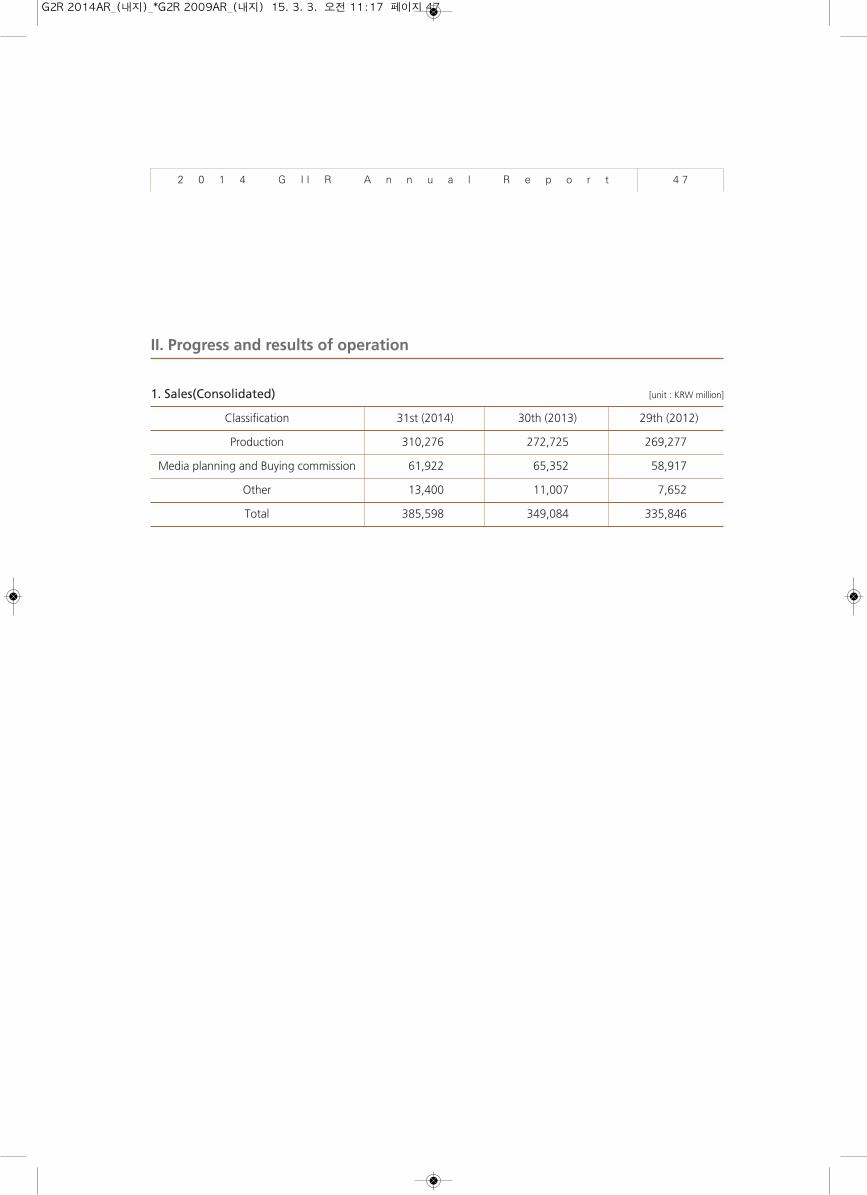
II. Progress and results of operation
1. Sales(Consolidated) [unit : KRW million]
Classification 31st (2014) 30th (2013) 29th (2012)
Production 310,276 272,725 269,277
Media planning and Buying commission 61,922 65,352 58,917
Other 13,400 11,007 7,652
Total 385,598 349,084 335,846
G2R 2014AR_(내지)_*G2R 2009AR_(내지) 15. 3. 3. 오전 11:17 페이지 47
2 0 1 4 G I I R A n n u a l R e p o r t 4 8
III. Parent company, subsidiary, and interlocking directorate of the Company etc.
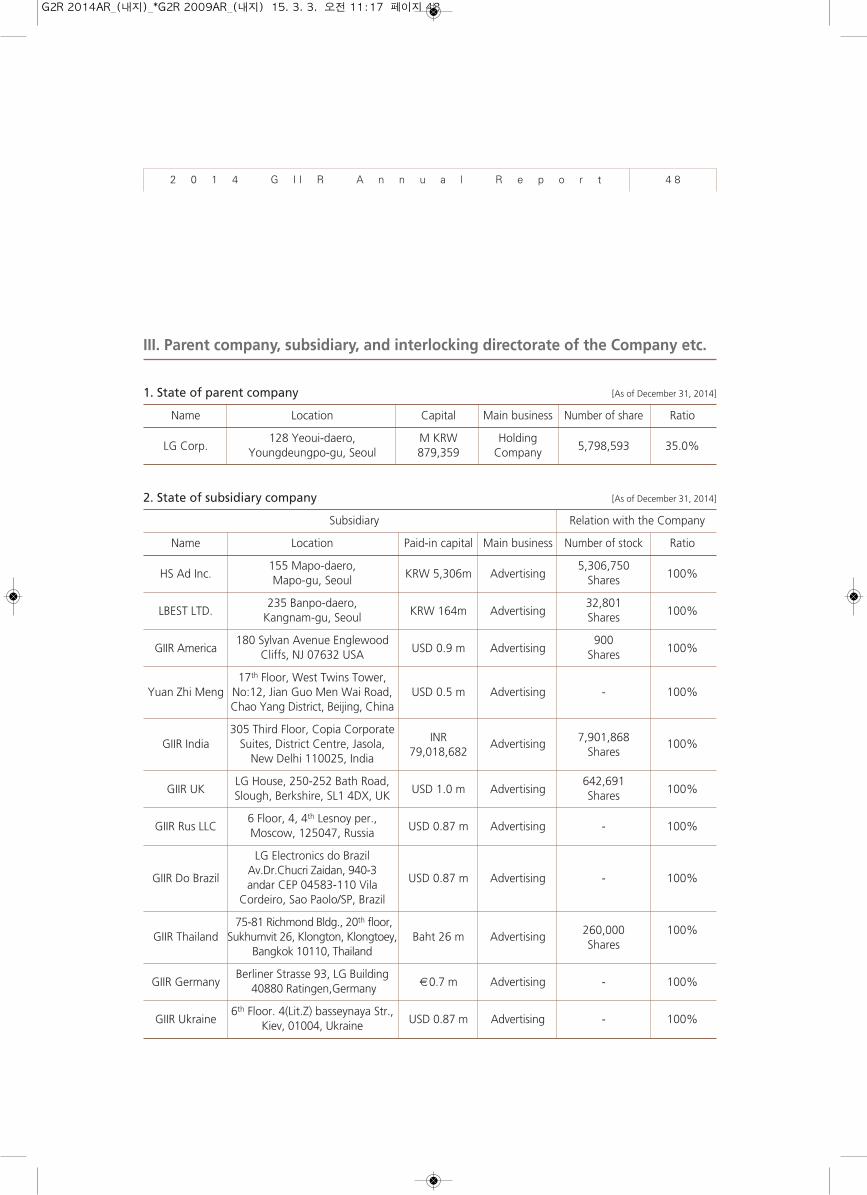
1. State of parent company [As of December 31, 2014]
Name Location Capital Main business Number of share Ratio
LG Corp. 128 Yeoui-daero, M KRW Holding
5,798,593 35.0%Youngdeungpo-gu, Seoul 879,359 Company
2. State of subsidiary company [As of December 31, 2014]
Subsidiary Relation with the Company
Name Location Paid-in capital Main business Number of stock Ratio
HS Ad Inc.155 Mapo-daero,
KRW 5,306m Advertising5,306,750
100%Mapo-gu, Seoul Shares
LBEST LTD.235 Banpo-daero,
KRW 164m Advertising32,801
100%Kangnam-gu, Seoul Shares
GIIR America180 Sylvan Avenue Englewood
USD 0.9 m Advertising900
100%Cliffs, NJ 07632 USA Shares
17th Floor, West Twins Tower, Yuan Zhi Meng No:12, Jian Guo Men Wai Road, USD 0.5 m Advertising - 100%
Chao Yang District, Beijing, China
305 Third Floor, Copia Corporate INR 7,901,868 GIIR India Suites, District Centre, Jasola,
79,018,682Advertising
Shares100%
New Delhi 110025, India
GIIR UK LG House, 250-252 Bath Road,
USD 1.0 m Advertising 642,691
100%Slough, Berkshire, SL1 4DX, UK Shares
GIIR Rus LLC 6 Floor, 4, 4th Lesnoy per.,
USD 0.87 m Advertising - 100%Moscow, 125047, Russia
LG Electronics do Brazil
GIIR Do BrazilAv.Dr.Chucri Zaidan, 940-3
USD 0.87 m Advertising - 100%andar CEP 04583-110 VilaCordeiro, Sao Paolo/SP, Brazil
75-81 Richmond Bldg., 20th floor,260,000 100%GIIR Thailand Sukhumvit 26, Klongton, Klongtoey, Baht 26 m AdvertisingSharesBangkok 10110, Thailand
GIIR GermanyBerliner Strasse 93, LG Building
€ 0.7 m Advertising - 100%40880 Ratingen,Germany
GIIR Ukraine6th Floor. 4(Lit.Z) basseynaya Str.,
USD 0.87 m Advertising - 100%Kiev, 01004, Ukraine
G2R 2014AR_(내지)_*G2R 2009AR_(내지) 15. 3. 3. 오전 11:17 페이지 48
2 0 1 4 G I I R A n n u a l R e p o r t 4 9
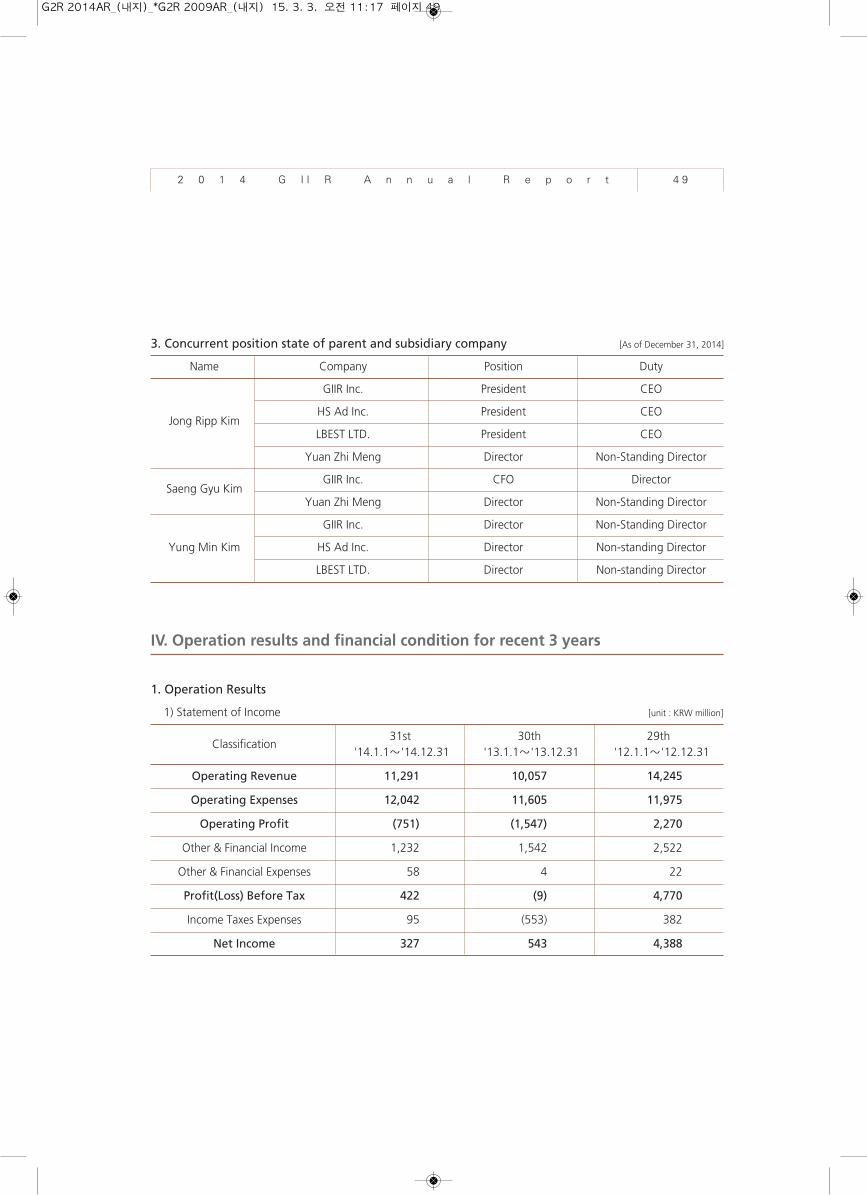
3. Concurrent position state of parent and subsidiary company [As of December 31, 2014]
Name Company Position Duty
GIIR Inc. President CEO
Jong Ripp KimHS Ad Inc. President CEO
LBEST LTD. President CEO
Yuan Zhi Meng Director Non-Standing Director
Saeng Gyu KimGIIR Inc. CFO Director
Yuan Zhi Meng Director Non-Standing Director
GIIR Inc. Director Non-Standing Director
Yung Min Kim HS Ad Inc. Director Non-standing Director
LBEST LTD. Director Non-standing Director
IV. Operation results and financial condition for recent 3 years
1. Operation Results
1) Statement of Income [unit : KRW million]
Classification31st 30th 29th
'14.1.1〜'14.12.31 '13.1.1〜'13.12.31 '12.1.1〜'12.12.31
Operating Revenue 11,291 10,057 14,245
Operating Expenses 12,042 11,605 11,975
Operating Profit (751) (1,547) 2,270
Other & Financial Income 1,232 1,542 2,522
Other & Financial Expenses 58 4 22
Profit(Loss) Before Tax 422 (9) 4,770
Income Taxes Expenses 95 (553) 382
Net Income 327 543 4,388
G2R 2014AR_(내지)_*G2R 2009AR_(내지) 15. 3. 3. 오전 11:17 페이지 49
2 0 1 4 G I I R A n n u a l R e p o r t 5 0
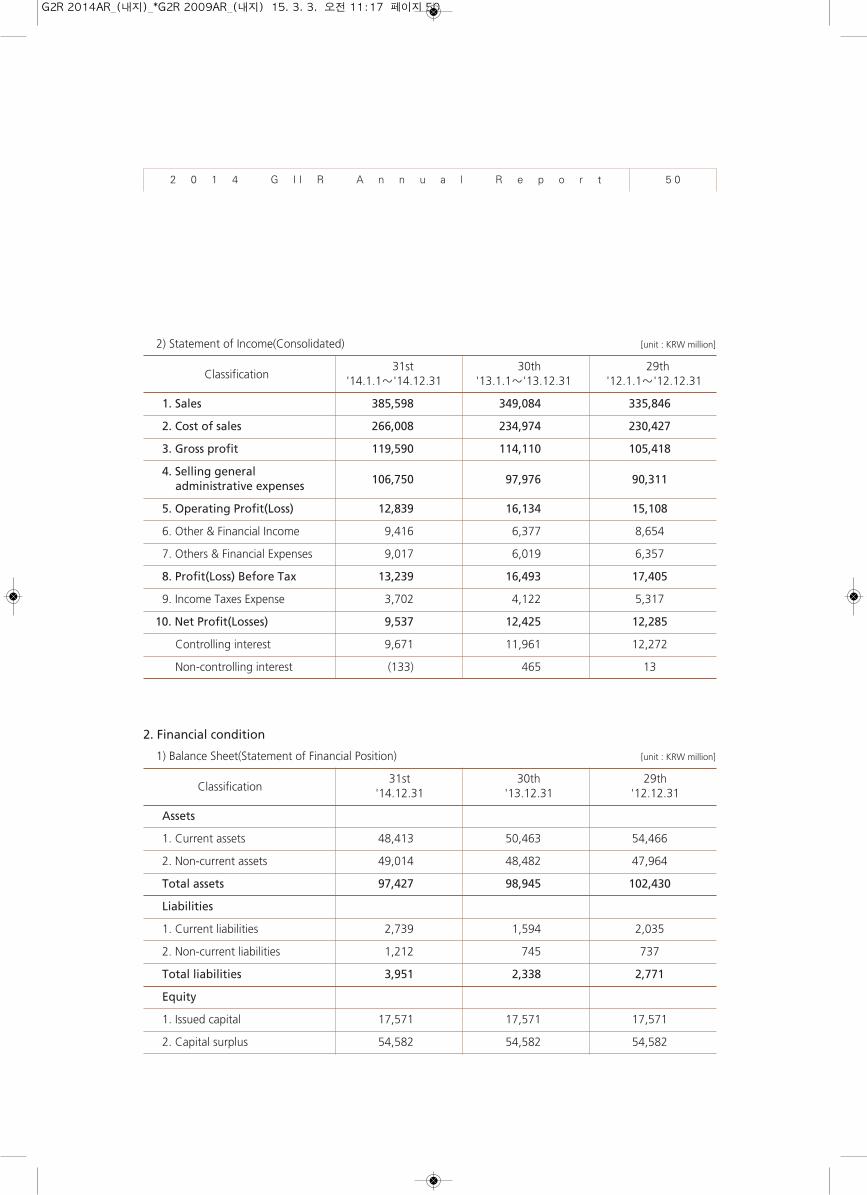
2) Statement of Income(Consolidated) [unit : KRW million]
Classification31st 30th 29th
'14.1.1〜'14.12.31 '13.1.1〜'13.12.31 '12.1.1〜'12.12.31
1. Sales 385,598 349,084 335,846
2. Cost of sales 266,008 234,974 230,427
3. Gross profit 119,590 114,110 105,418
4. Selling general 106,750 97,976 90,311administrative expenses
5. Operating Profit(Loss) 12,839 16,134 15,108
6. Other & Financial Income 9,416 6,377 8,654
7. Others & Financial Expenses 9,017 6,019 6,357
8. Profit(Loss) Before Tax 13,239 16,493 17,405
9. Income Taxes Expense 3,702 4,122 5,317
10. Net Profit(Losses) 9,537 12,425 12,285
Controlling interest 9,671 11,961 12,272
Non-controlling interest (133) 465 13
2. Financial condition
1) Balance Sheet(Statement of Financial Position) [unit : KRW million]
Classification31st 30th 29th
'14.12.31 '13.12.31 '12.12.31
Assets
1. Current assets 48,413 50,463 54,466
2. Non-current assets 49,014 48,482 47,964
Total assets 97,427 98,945 102,430
Liabilities
1. Current liabilities 2,739 1,594 2,035
2. Non-current liabilities 1,212 745 737
Total liabilities 3,951 2,338 2,771
Equity
1. Issued capital 17,571 17,571 17,571
2. Capital surplus 54,582 54,582 54,582
G2R 2014AR_(내지)_*G2R 2009AR_(내지) 15. 3. 3. 오전 11:17 페이지 50
2 0 1 4 G I I R A n n u a l R e p o r t 5 1
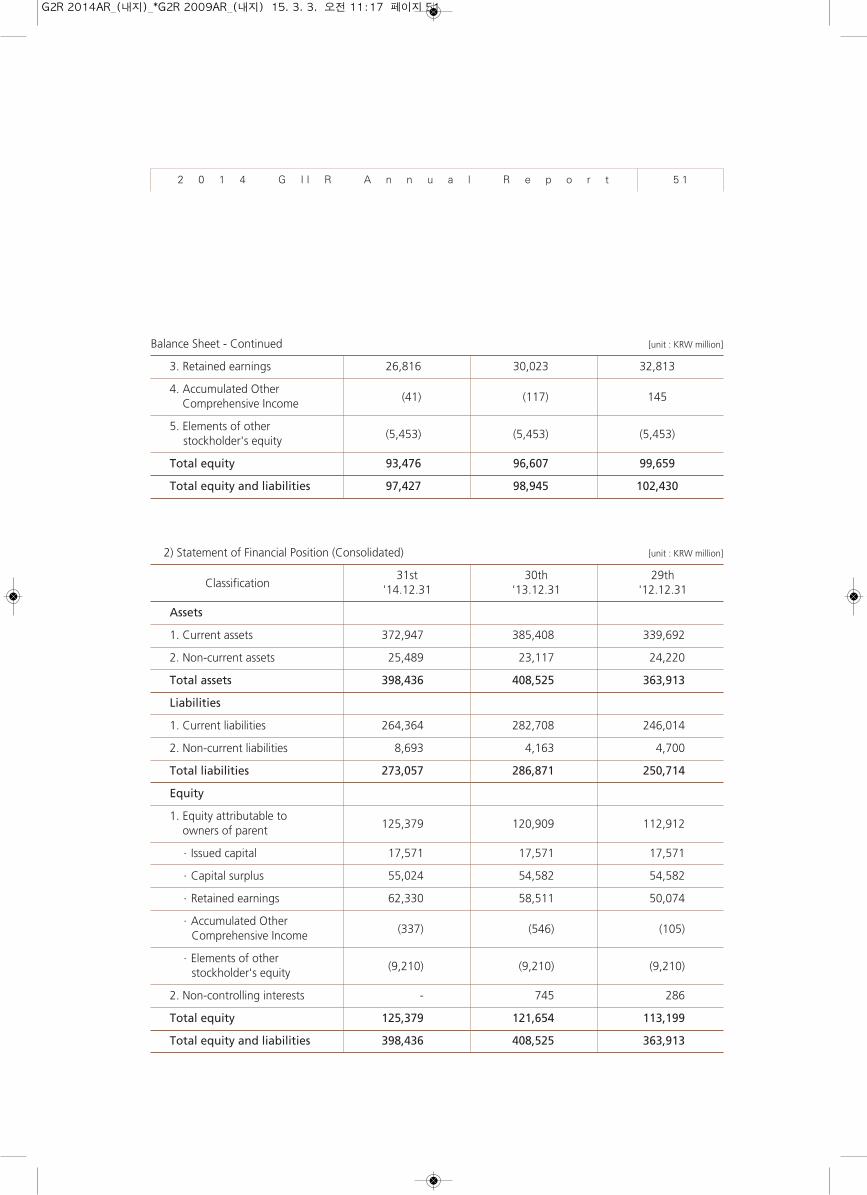
Balance Sheet - Continued [unit : KRW million]
3. Retained earnings 26,816 30,023 32,813
4. Accumulated Other (41) (117) 145Comprehensive Income
5. Elements of other (5,453) (5,453) (5,453)stockholder's equity
Total equity 93,476 96,607 99,659
Total equity and liabilities 97,427 98,945 102,430
2) Statement of Financial Position (Consolidated) [unit : KRW million]
Classification31st 30th 29th
'14.12.31 '13.12.31 '12.12.31
Assets
1. Current assets 372,947 385,408 339,692
2. Non-current assets 25,489 23,117 24,220
Total assets 398,436 408,525 363,913
Liabilities
1. Current liabilities 264,364 282,708 246,014
2. Non-current liabilities 8,693 4,163 4,700
Total liabilities 273,057 286,871 250,714
Equity
1. Equity attributable to 125,379 120,909 112,912owners of parent
·Issued capital 17,571 17,571 17,571
·Capital surplus 55,024 54,582 54,582
·Retained earnings 62,330 58,511 50,074
·Accumulated Other (337) (546) (105)Comprehensive Income
·Elements of other (9,210) (9,210) (9,210)stockholder's equity
2. Non-controlling interests - 745 286
Total equity 125,379 121,654 113,199
Total equity and liabilities 398,436 408,525 363,913
G2R 2014AR_(내지)_*G2R 2009AR_(내지) 15. 3. 3. 오전 11:17 페이지 51
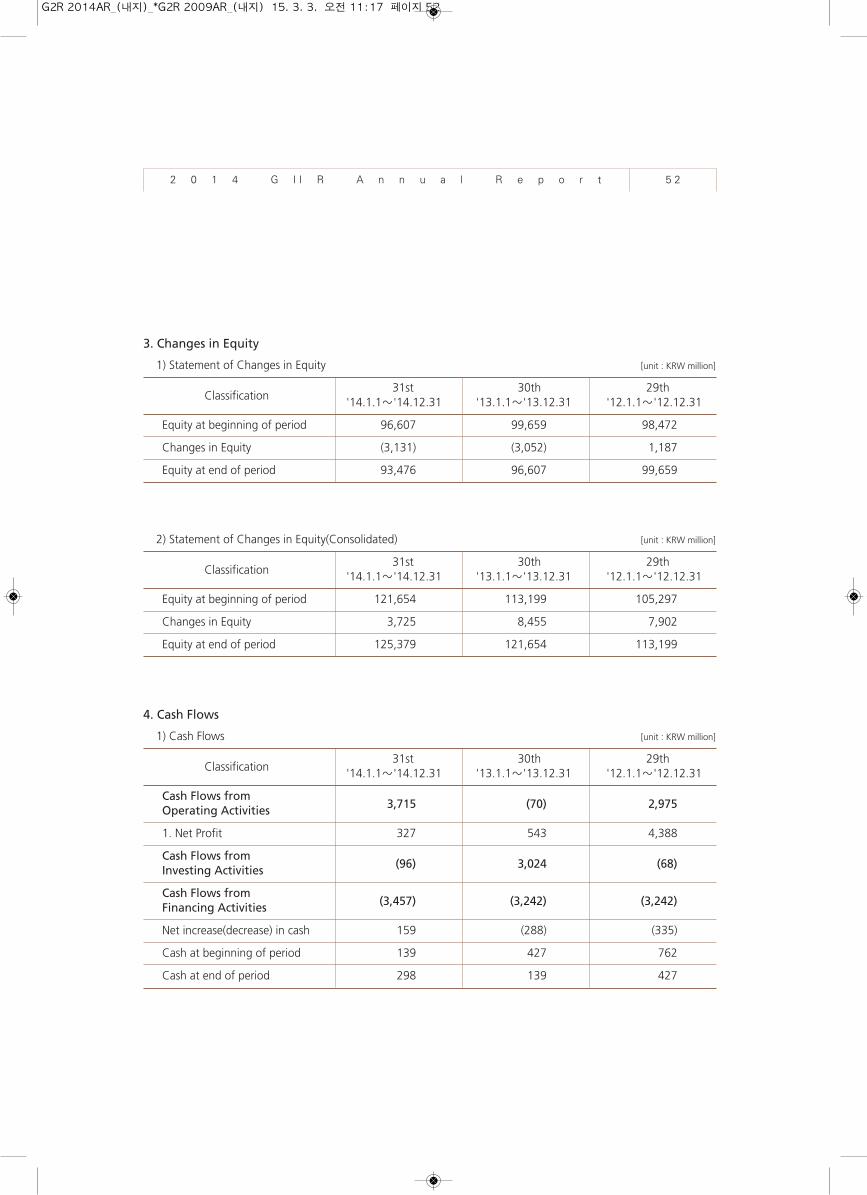
3. Changes in Equity
1) Statement of Changes in Equity [unit : KRW million]
Classification31st 30th 29th
'14.1.1〜'14.12.31 '13.1.1〜'13.12.31 '12.1.1〜'12.12.31
Equity at beginning of period 96,607 99,659 98,472
Changes in Equity (3,131) (3,052) 1,187
Equity at end of period 93,476 96,607 99,659
2) Statement of Changes in Equity(Consolidated) [unit : KRW million]
Classification31st 30th 29th
'14.1.1〜'14.12.31 '13.1.1〜'13.12.31 '12.1.1〜'12.12.31
Equity at beginning of period 121,654 113,199 105,297
Changes in Equity 3,725 8,455 7,902
Equity at end of period 125,379 121,654 113,199
4. Cash Flows
1) Cash Flows [unit : KRW million]
Classification31st 30th 29th
'14.1.1〜'14.12.31 '13.1.1〜'13.12.31 '12.1.1〜'12.12.31
Cash Flows from 3,715 (70) 2,975Operating Activities
1. Net Profit 327 543 4,388
Cash Flows from (96) 3,024 (68)Investing Activities
Cash Flows from (3,457) (3,242) (3,242)Financing Activities
Net increase(decrease) in cash 159 (288) (335)
Cash at beginning of period 139 427 762
Cash at end of period 298 139 427
2 0 1 4 G I I R A n n u a l R e p o r t 5 2
G2R 2014AR_(내지)_*G2R 2009AR_(내지) 15. 3. 3. 오전 11:17 페이지 52
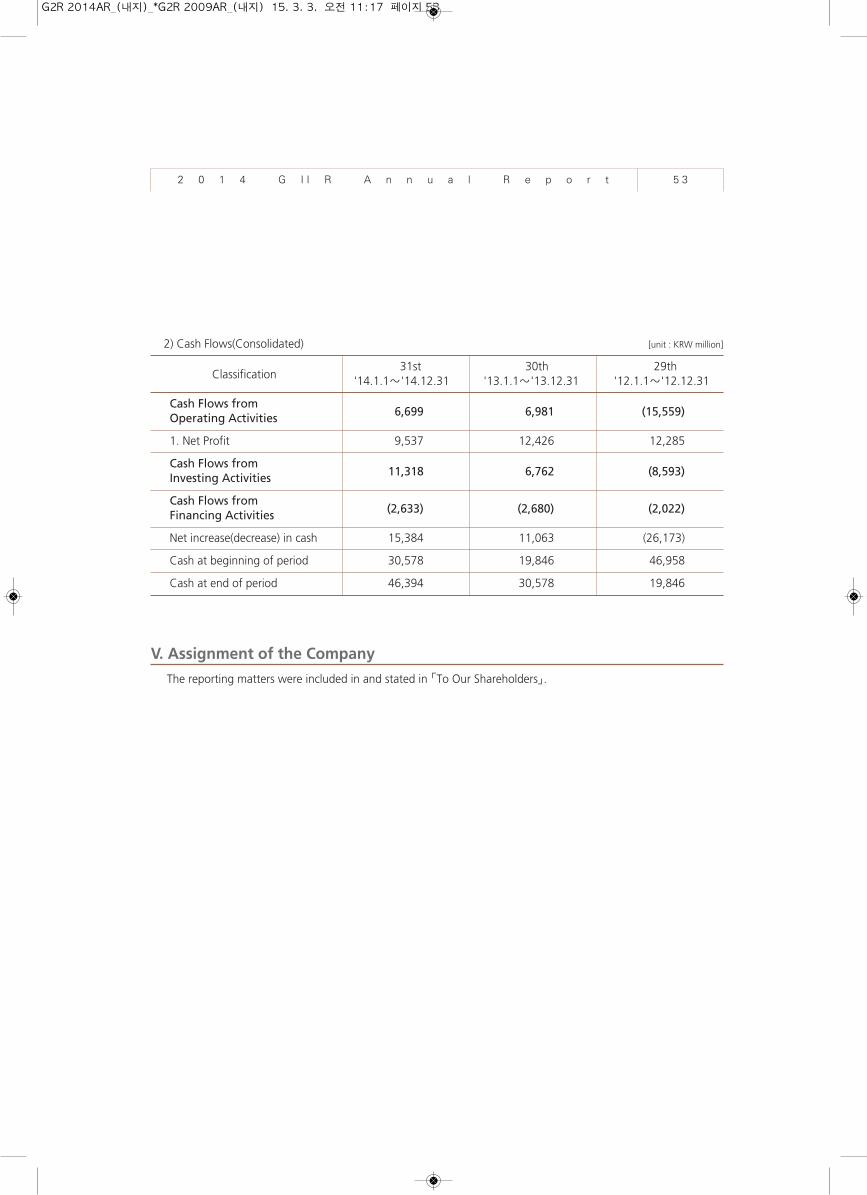
2) Cash Flows(Consolidated) [unit : KRW million]
Classification31st 30th 29th
'14.1.1〜'14.12.31 '13.1.1〜'13.12.31 '12.1.1〜'12.12.31
Cash Flows from 6,699 6,981 (15,559)Operating Activities
1. Net Profit 9,537 12,426 12,285
Cash Flows from 11,318 6,762 (8,593)Investing Activities
Cash Flows from (2,633) (2,680) (2,022)Financing Activities
Net increase(decrease) in cash 15,384 11,063 (26,173)
Cash at beginning of period 30,578 19,846 46,958
Cash at end of period 46,394 30,578 19,846
V. Assignment of the Company
The reporting matters were included in and stated in 「To Our Shareholders」.
2 0 1 4 G I I R A n n u a l R e p o r t 5 3
G2R 2014AR_(내지)_*G2R 2009AR_(내지) 15. 3. 3. 오전 11:17 페이지 53
2 0 1 4 G I I R A n n u a l R e p o r t 5 4
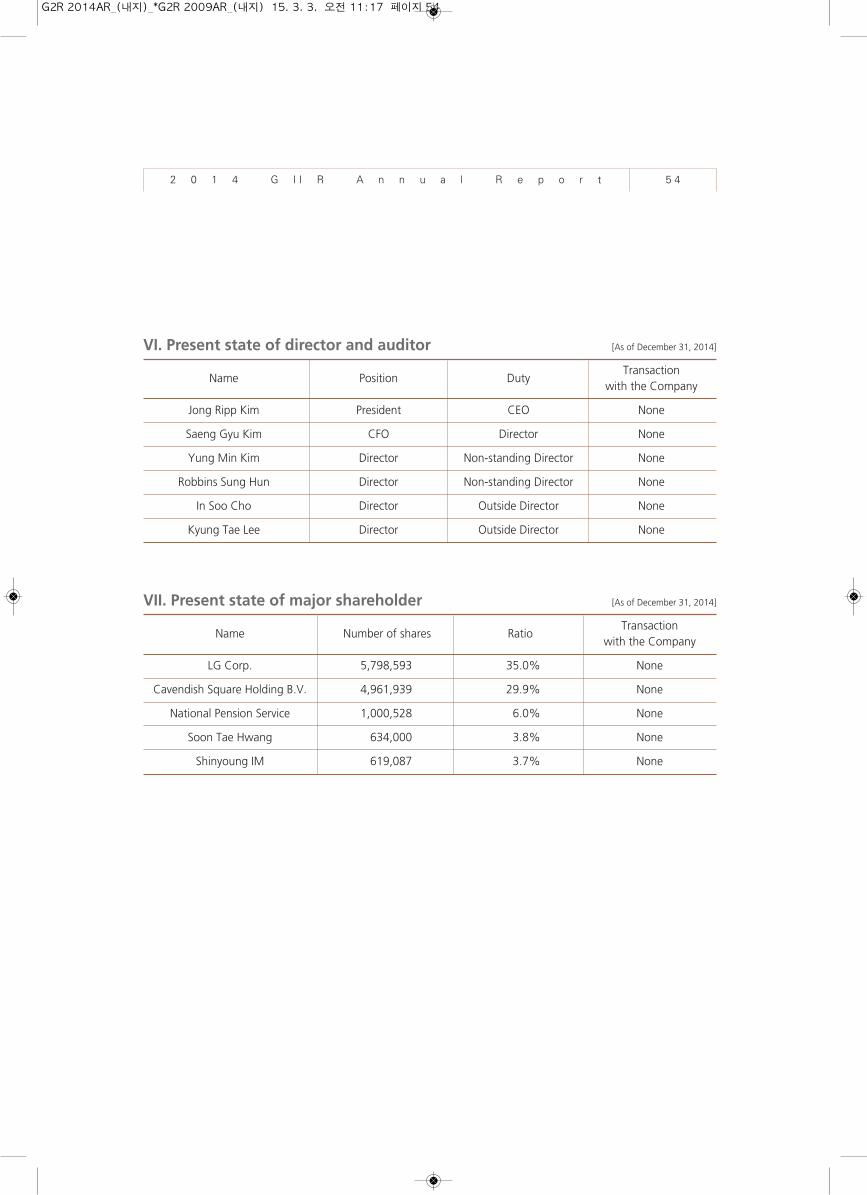
VI. Present state of director and auditor [As of December 31, 2014]
Name Position Duty Transaction
with the Company
Jong Ripp Kim President CEO None
Saeng Gyu Kim CFO Director None
Yung Min Kim Director Non-standing Director None
Robbins Sung Hun Director Non-standing Director None
In Soo Cho Director Outside Director None
Kyung Tae Lee Director Outside Director None
VII. Present state of major shareholder [As of December 31, 2014]
Name Number of shares RatioTransaction
with the Company
LG Corp. 5,798,593 35.0% None
Cavendish Square Holding B.V. 4,961,939 29.9% None
National Pension Service 1,000,528 6.0% None
Soon Tae Hwang 634,000 3.8% None
Shinyoung IM 619,087 3.7% None
G2R 2014AR_(내지)_*G2R 2009AR_(내지) 15. 3. 3. 오전 11:17 페이지 54
2 0 1 4 G I I R A n n u a l R e p o r t 5 5
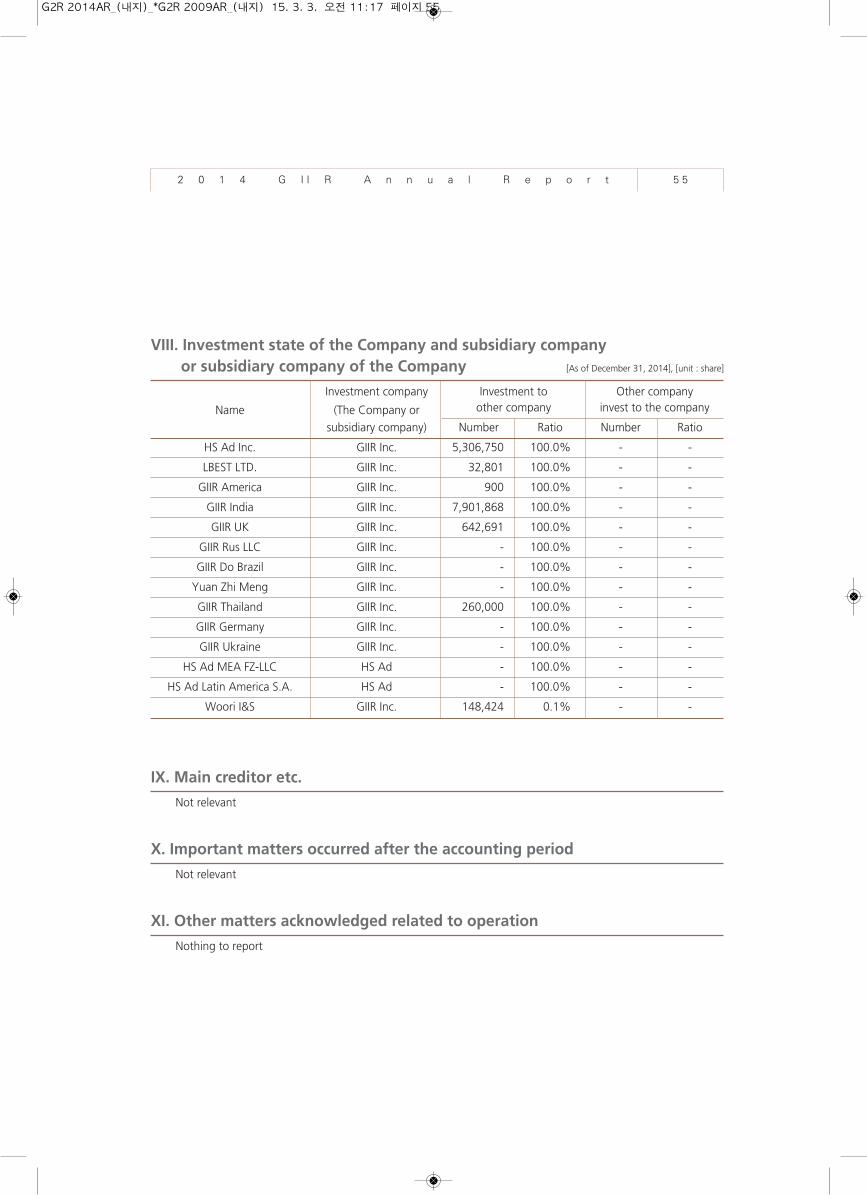
VIII. Investment state of the Company and subsidiary company or subsidiary company of the Company [As of December 31, 2014], [unit : share]
Investment company Investment to Other company
Name (The Company or other company invest to the company
subsidiary company) Number Ratio Number Ratio
HS Ad Inc. GIIR Inc. 5,306,750 100.0% - -
LBEST LTD. GIIR Inc. 32,801 100.0% - -
GIIR America GIIR Inc. 900 100.0% - -
GIIR India GIIR Inc. 7,901,868 100.0% - -
GIIR UK GIIR Inc. 642,691 100.0% - -
GIIR Rus LLC GIIR Inc. - 100.0% - -
GIIR Do Brazil GIIR Inc. - 100.0% - -
Yuan Zhi Meng GIIR Inc. - 100.0% - -
GIIR Thailand GIIR Inc. 260,000 100.0% - -
GIIR Germany GIIR Inc. - 100.0% - -
GIIR Ukraine GIIR Inc. - 100.0% - -
HS Ad MEA FZ-LLC HS Ad - 100.0% - -
HS Ad Latin America S.A. HS Ad - 100.0% - -
Woori I&S GIIR Inc. 148,424 0.1% - -
IX. Main creditor etc.
Not relevant
X. Important matters occurred after the accounting period
Not relevant
XI. Other matters acknowledged related to operation
Nothing to report
G2R 2014AR_(내지)_*G2R 2009AR_(내지) 15. 3. 3. 오전 11:17 페이지 55
Aud i t R epo r t
Audit report by Audit Committee of GIIR Inc.
Evaluation report of the Internal Accounting Management System
G2R 2014AR_(내지)_*G2R 2009AR_(내지) 15. 3. 3. 오전 11:17 페이지 56
2 0 1 4 G I I R A n n u a l R e p o r t 5 7
Audit Report
Audit Committee report the following audit result on accounting and business of the 31st fiscal year from January 1,
2014 to December 31, 2014 as an Audit Committee member of GIIR Inc.
1. Outline of the Audit Method
Audit Committee inspected the accounting book and the relevant documents and investigated the financial statements
and attached specification for examination. Audit Committee examined by applying the contrast, actual inspection,
session, inquiry and other proper audit procedures in case of need in executing the audit.
Audit Committee received the report on the business from directors if necessary to attend the Board of Directors and
other major meetings for the business inspection, inspected the important related business documents by using the
proper method like inspection of the contents.
2. Matters on Indication of Financial statement
The assets, profit and loss, change of retained earnings, change of equities and cash flows of the Company are
stated adequately according to law and the Articles in the financial statement.
3. Matters on Business Report
The general condition of the Company is indicated accurately in the business report under law and the Articles.
February 16th, 2015
Audit Committee of GIIR Inc.
Chairman of the Audit Committee of GIIR Inc. Kyung Tae Lee
Audit Committee Member of GIIR Inc. In Soo Cho
Audit Committee Member of GIIR Inc. Robbins Sung Hun
G2R 2014AR_(내지)_*G2R 2009AR_(내지) 15. 3. 3. 오전 11:17 페이지 57
2 0 1 4 G I I R A n n u a l R e p o r t 5 8
Evaluation report of the Internal Accounting Management System
To : Board of Directors of GIIR Inc.
The Internal Accounting Controller and accounting division have been appointed and organized according to the
Regulations on the Internal Accounting Management of the Company and their corresponding functions are being
performed efficiently.
The division in charge of accounting management handles accounting information in a bona fide manner in
accordance with Korean GAAP and the Regulations on the Internal Accounting Management of the Company in
order to prevent any errors in the book-keeping process.
In addition, the Internal Accounting Controller checks the reliability of the accounting information through internal
audits and audits by external auditors on a regular basis or as the occasion arises.
The Statutory Auditor’s Opinion is that GIIR’s Internal Accounting Management System in 2014 is being operated
in an efficient manner.
February 16th, 2015
Audit Committee of GIIR Inc.
Chairman of the Audit Committee of GIIR Inc. Kyung Tae Lee
Audit Committee Member of GIIR Inc. In Soo Cho
Audit Committee Member of GIIR Inc. Robbins Sung Hun
G2R 2014AR_(내지)_*G2R 2009AR_(내지) 15. 3. 3. 오전 11:17 페이지 58
Balance Sheet
Statement of Income
Statement of Comprehensive Income
Statement of Changes in Equity
Statement of Appropriations of Retained Earnings(Proposal)
Cash Flows
Balance Sheet(Consolidated)
Statement of Income(Consolidated)
Statement of Comprehensive Income(Consolidated)
Statement of Changes in Equity(Consolidated)
Cash Flows(Consolidated)
F i n an c i a l S t a t emen t s
G2R 2014AR_(내지)_*G2R 2009AR_(내지) 15. 3. 3. 오전 11:17 페이지 59
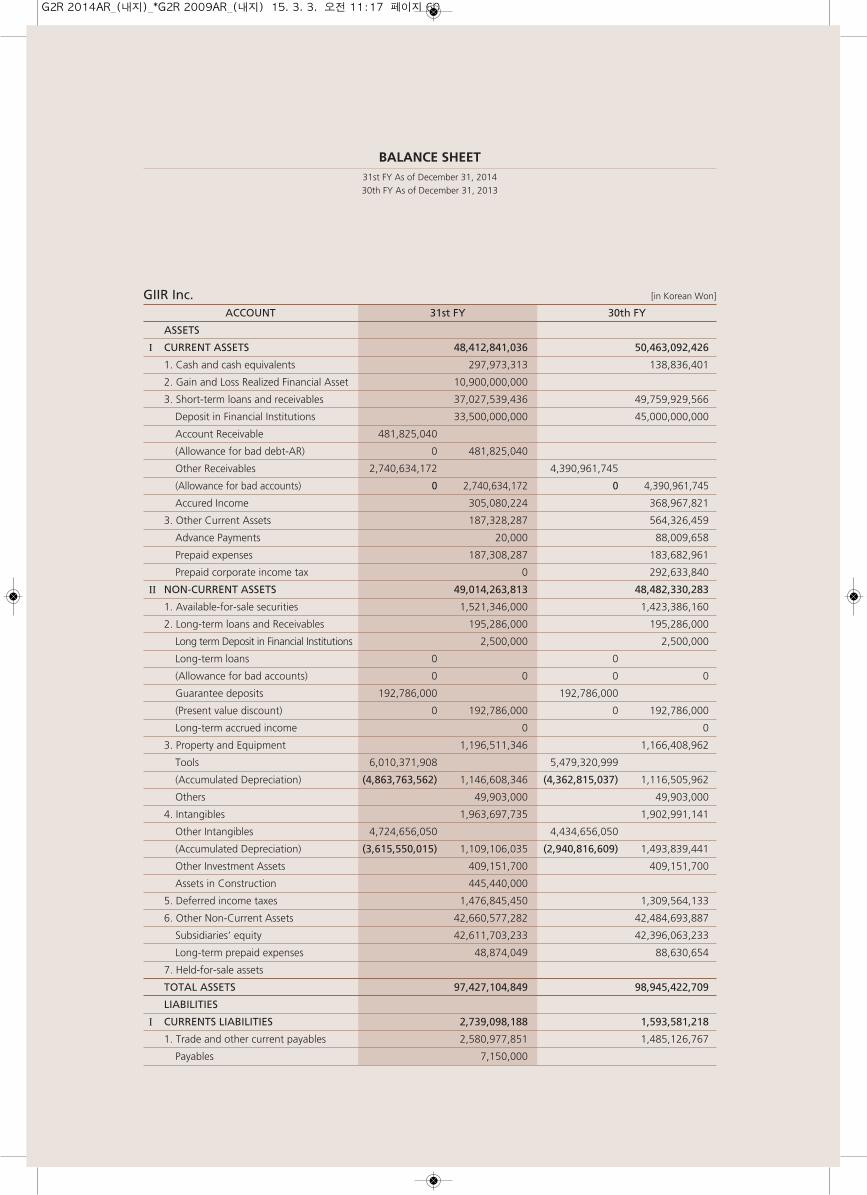
BALANCE SHEET31st FY As of December 31, 201430th FY As of December 31, 2013
GIIR Inc. [in Korean Won]
ACCOUNT 31st FY 30th FY
ASSETS
I CURRENT ASSETS 48,412,841,036 50,463,092,426
1. Cash and cash equivalents 297,973,313 138,836,401
2. Gain and Loss Realized Financial Asset 10,900,000,000
3. Short-term loans and receivables 37,027,539,436 49,759,929,566
Deposit in Financial Institutions 33,500,000,000 45,000,000,000
Account Receivable 481,825,040
(Allowance for bad debt-AR) 0 481,825,040
Other Receivables 2,740,634,172 4,390,961,745
(Allowance for bad accounts) 0 2,740,634,172 0 4,390,961,745
Accured Income 305,080,224 368,967,821
3. Other Current Assets 187,328,287 564,326,459
Advance Payments 20,000 88,009,658
Prepaid expenses 187,308,287 183,682,961
Prepaid corporate income tax 0 292,633,840
Ⅱ NON-CURRENT ASSETS 49,014,263,813 48,482,330,283
1. Available-for-sale securities 1,521,346,000 1,423,386,160
2. Long-term loans and Receivables 195,286,000 195,286,000
Long term Deposit in Financial Institutions 2,500,000 2,500,000
Long-term loans 0 0
(Allowance for bad accounts) 0 0 0 0
Guarantee deposits 192,786,000 192,786,000
(Present value discount) 0 192,786,000 0 192,786,000
Long-term accrued income 0 0
3. Property and Equipment 1,196,511,346 1,166,408,962
Tools 6,010,371,908 5,479,320,999
(Accumulated Depreciation) (4,863,763,562) 1,146,608,346 (4,362,815,037) 1,116,505,962
Others 49,903,000 49,903,000
4. Intangibles 1,963,697,735 1,902,991,141
Other Intangibles 4,724,656,050 4,434,656,050
(Accumulated Depreciation) (3,615,550,015) 1,109,106,035 (2,940,816,609) 1,493,839,441
Other Investment Assets 409,151,700 409,151,700
Assets in Construction 445,440,000
5. Deferred income taxes 1,476,845,450 1,309,564,133
6. Other Non-Current Assets 42,660,577,282 42,484,693,887
Subsidiaries’ equity 42,611,703,233 42,396,063,233
Long-term prepaid expenses 48,874,049 88,630,654
7. Held-for-sale assets
TOTAL ASSETS 97,427,104,849 98,945,422,709
LIABILITIES
I CURRENTS LIABILITIES 2,739,098,188 1,593,581,218
1. Trade and other current payables 2,580,977,851 1,485,126,767
Payables 7,150,000
G2R 2014AR_(내지)_*G2R 2009AR_(내지) 15. 3. 3. 오전 11:17 페이지 60
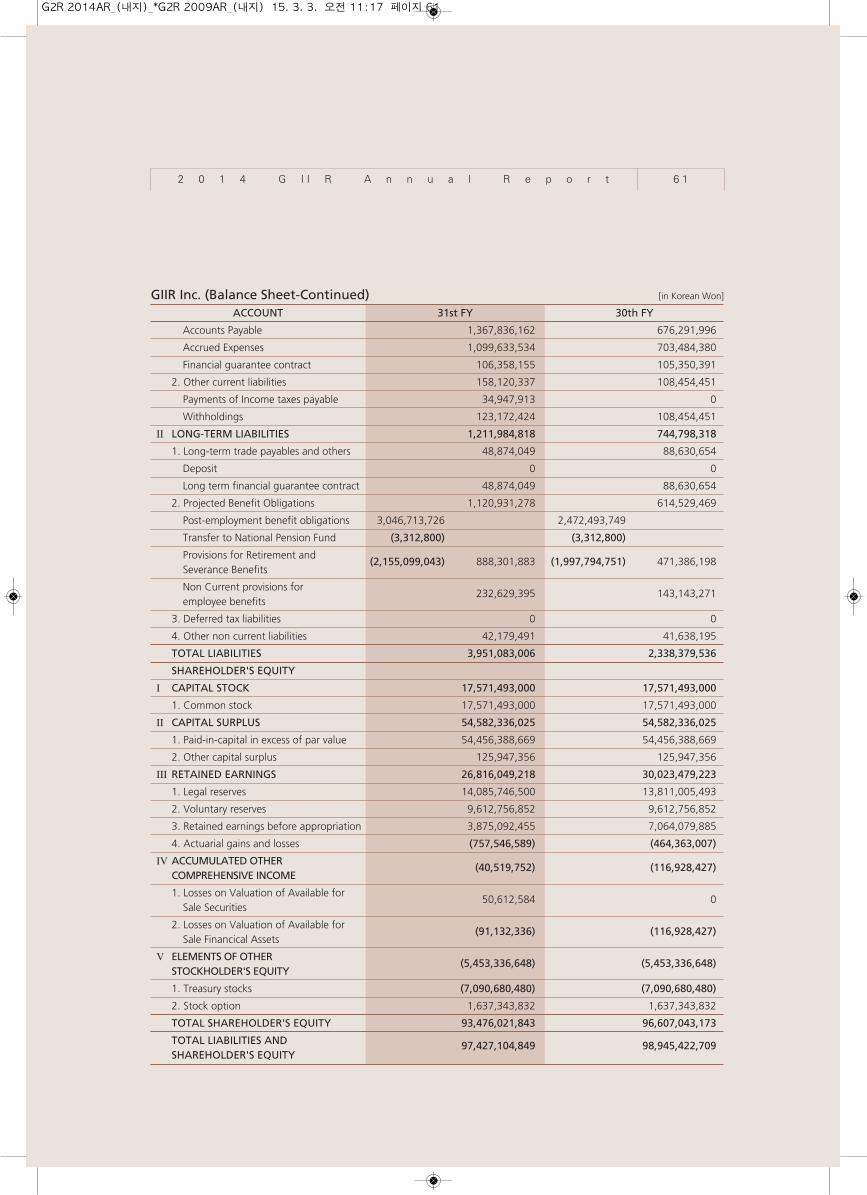
GIIR Inc. (Balance Sheet-Continued) [in Korean Won]
ACCOUNT 31st FY 30th FY
Accounts Payable 1,367,836,162 676,291,996
Accrued Expenses 1,099,633,534 703,484,380
Financial guarantee contract 106,358,155 105,350,391
2. Other current liabilities 158,120,337 108,454,451
Payments of Income taxes payable 34,947,913 0
Withholdings 123,172,424 108,454,451
Ⅱ LONG-TERM LIABILITIES 1,211,984,818 744,798,318
1. Long-term trade payables and others 48,874,049 88,630,654
Deposit 0 0
Long term financial guarantee contract 48,874,049 88,630,654
2. Projected Benefit Obligations 1,120,931,278 614,529,469
Post-employment benefit obligations 3,046,713,726 2,472,493,749
Transfer to National Pension Fund (3,312,800) (3,312,800)
Provisions for Retirement and(2,155,099,043) 888,301,883 (1,997,794,751) 471,386,198
Severance Benefits
Non Current provisions for 232,629,395 143,143,271
employee benefits
3. Deferred tax liabilities 0 0
4. Other non current liabilities 42,179,491 41,638,195
TOTAL LIABILITIES 3,951,083,006 2,338,379,536
SHAREHOLDER'S EQUITY
I CAPITAL STOCK 17,571,493,000 17,571,493,000
1. Common stock 17,571,493,000 17,571,493,000
Ⅱ CAPITAL SURPLUS 54,582,336,025 54,582,336,025
1. Paid-in-capital in excess of par value 54,456,388,669 54,456,388,669
2. Other capital surplus 125,947,356 125,947,356
Ⅲ RETAINED EARNINGS 26,816,049,218 30,023,479,223
1. Legal reserves 14,085,746,500 13,811,005,493
2. Voluntary reserves 9,612,756,852 9,612,756,852
3. Retained earnings before appropriation 3,875,092,455 7,064,079,885
4. Actuarial gains and losses (757,546,589) (464,363,007)
Ⅳ ACCUMULATED OTHER (40,519,752) (116,928,427)
COMPREHENSIVE INCOME
1. Losses on Valuation of Available for 50,612,584 0
Sale Securities
2. Losses on Valuation of Available for (91,132,336) (116,928,427)
Sale Financical Assets
V ELEMENTS OF OTHER(5,453,336,648) (5,453,336,648)
STOCKHOLDER'S EQUITY
1. Treasury stocks (7,090,680,480) (7,090,680,480)
2. Stock option 1,637,343,832 1,637,343,832
TOTAL SHAREHOLDER'S EQUITY 93,476,021,843 96,607,043,173
TOTAL LIABILITIES AND 97,427,104,849 98,945,422,709SHAREHOLDER'S EQUITY
2 0 1 4 G I I R A n n u a l R e p o r t 6 1
G2R 2014AR_(내지)_*G2R 2009AR_(내지) 15. 3. 3. 오전 11:17 페이지 61
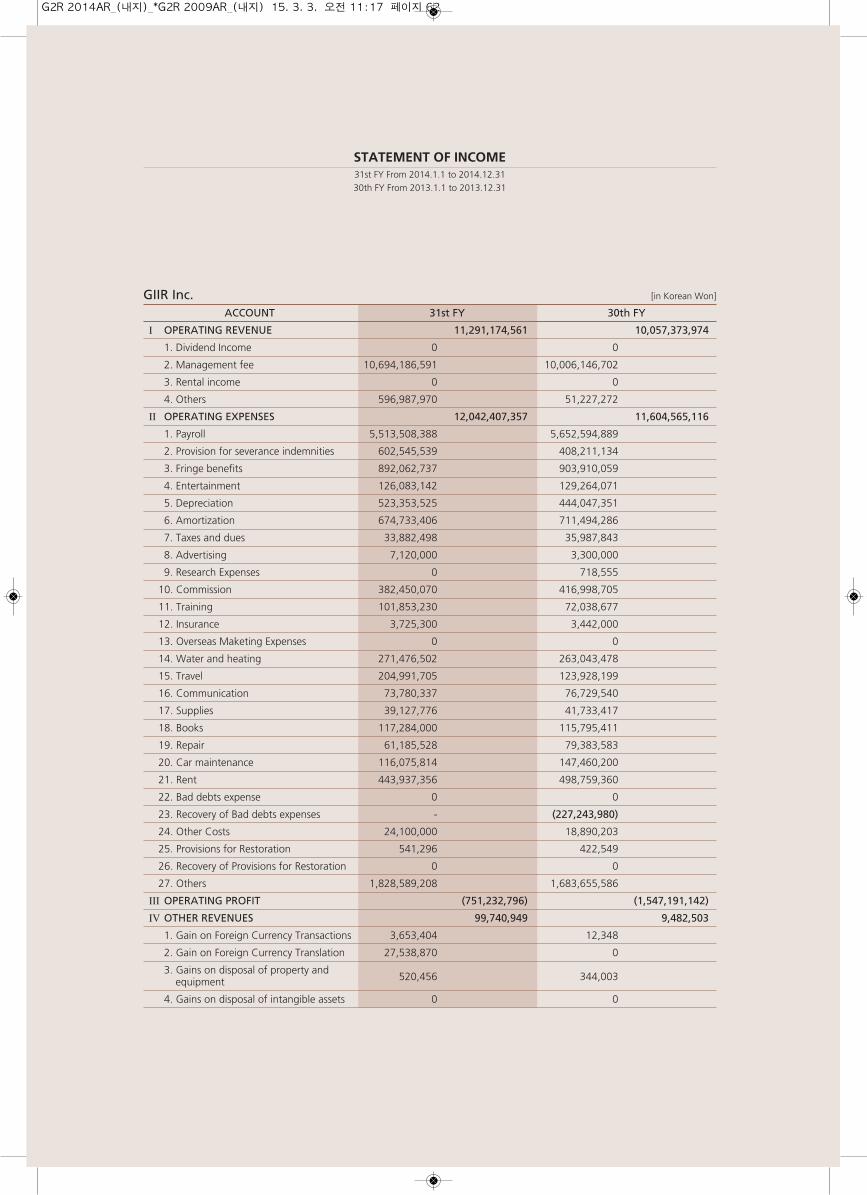
GIIR Inc. [in Korean Won]
ACCOUNT 31st FY 30th FY
I OPERATING REVENUE 11,291,174,561 10,057,373,974
1. Dividend Income 0 0
2. Management fee 10,694,186,591 10,006,146,702
3. Rental income 0 0
4. Others 596,987,970 51,227,272
Ⅱ OPERATING EXPENSES 12,042,407,357 11,604,565,116
1. Payroll 5,513,508,388 5,652,594,889
2. Provision for severance indemnities 602,545,539 408,211,134
3. Fringe benefits 892,062,737 903,910,059
4. Entertainment 126,083,142 129,264,071
5. Depreciation 523,353,525 444,047,351
6. Amortization 674,733,406 711,494,286
7. Taxes and dues 33,882,498 35,987,843
8. Advertising 7,120,000 3,300,000
9. Research Expenses 0 718,555
10. Commission 382,450,070 416,998,705
11. Training 101,853,230 72,038,677
12. Insurance 3,725,300 3,442,000
13. Overseas Maketing Expenses 0 0
14. Water and heating 271,476,502 263,043,478
15. Travel 204,991,705 123,928,199
16. Communication 73,780,337 76,729,540
17. Supplies 39,127,776 41,733,417
18. Books 117,284,000 115,795,411
19. Repair 61,185,528 79,383,583
20. Car maintenance 116,075,814 147,460,200
21. Rent 443,937,356 498,759,360
22. Bad debts expense 0 0
23. Recovery of Bad debts expenses - (227,243,980)
24. Other Costs 24,100,000 18,890,203
25. Provisions for Restoration 541,296 422,549
26. Recovery of Provisions for Restoration 0 0
27. Others 1,828,589,208 1,683,655,586
Ⅲ OPERATING PROFIT (751,232,796) (1,547,191,142)
Ⅳ OTHER REVENUES 99,740,949 9,482,503
1. Gain on Foreign Currency Transactions 3,653,404 12,348
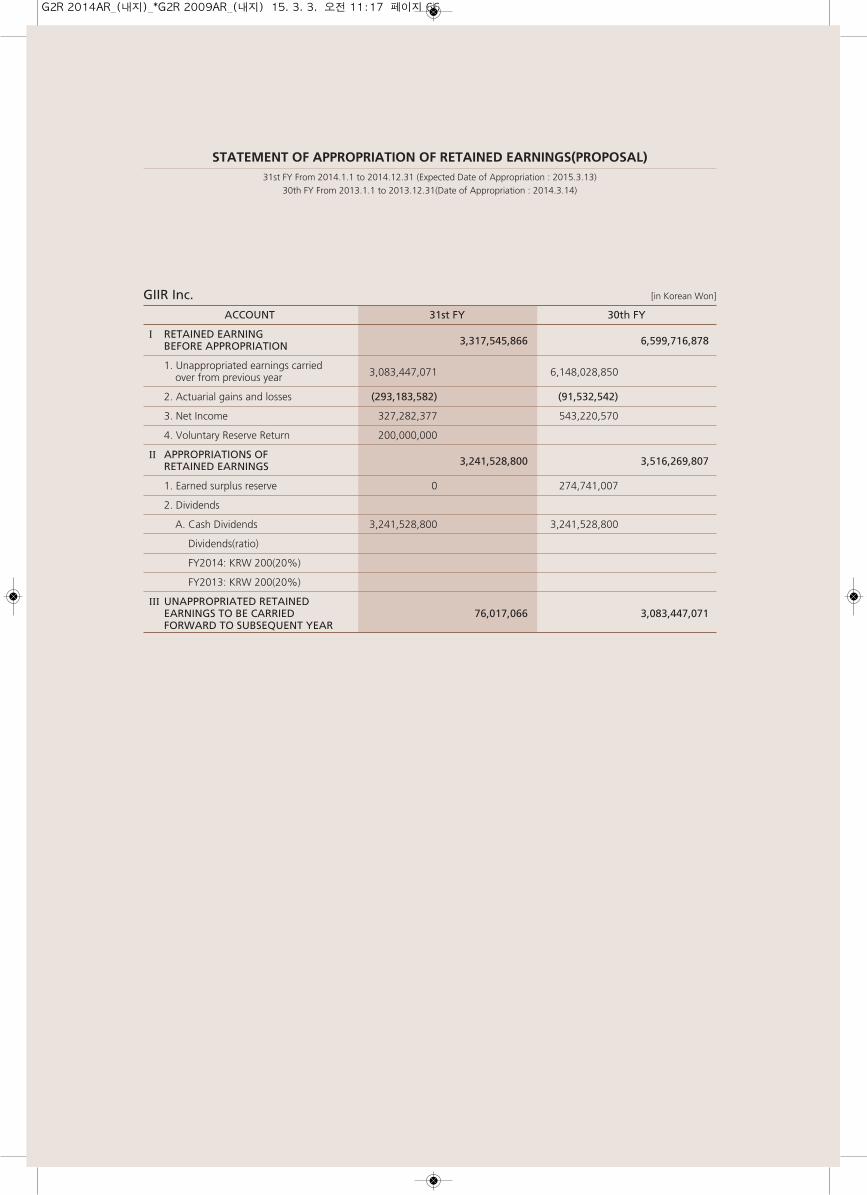
2. Gain on Foreign Currency Translation 27,538,870 0
3. Gains on disposal of property and 520,456 344,003equipment
4. Gains on disposal of intangible assets 0 0
STATEMENT OF INCOME31st FY From 2014.1.1 to 2014.12.3130th FY From 2013.1.1 to 2013.12.31
G2R 2014AR_(내지)_*G2R 2009AR_(내지) 15. 3. 3. 오전 11:17 페이지 62
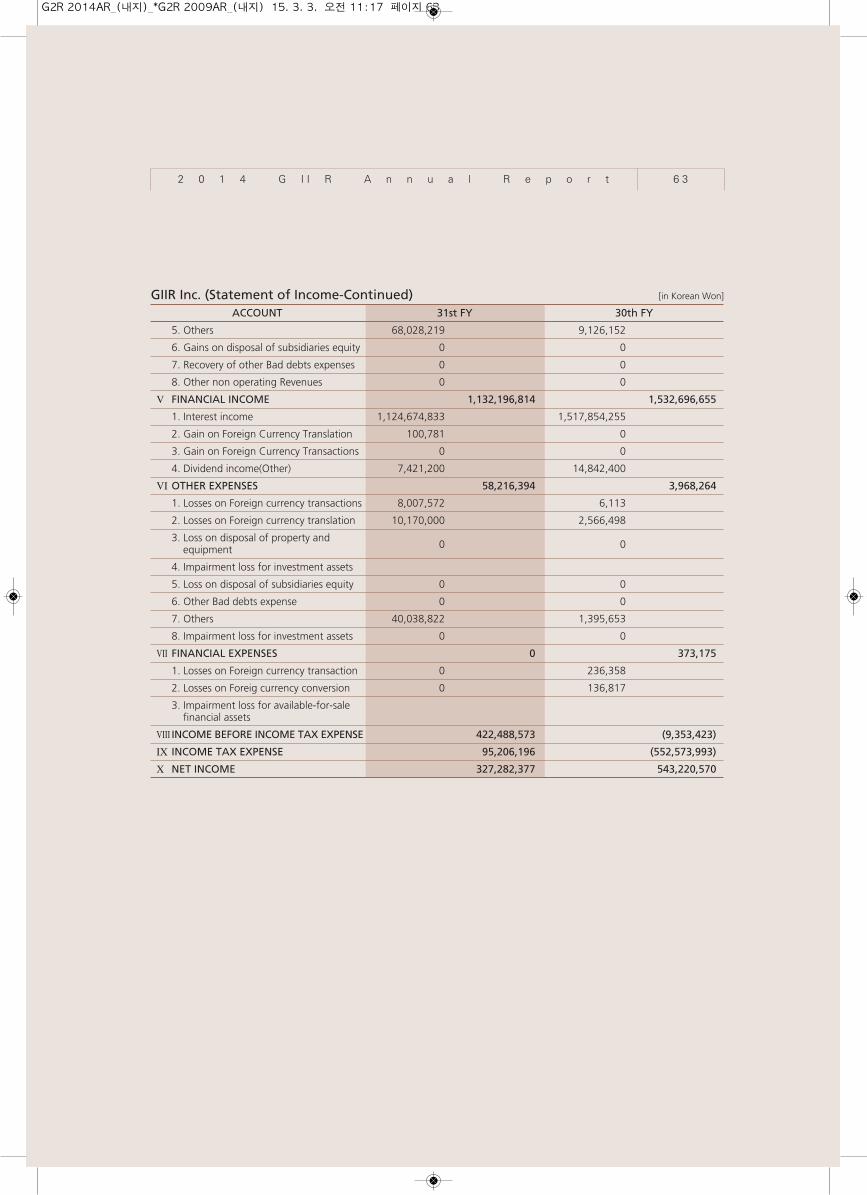
GIIR Inc. (Statement of Income-Continued) [in Korean Won]
ACCOUNT 31st FY 30th FY
5. Others 68,028,219 9,126,152
6. Gains on disposal of subsidiaries equity 0 0
7. Recovery of other Bad debts expenses 0 0
8. Other non operating Revenues 0 0
Ⅴ FINANCIAL INCOME 1,132,196,814 1,532,696,655
1. Interest income 1,124,674,833 1,517,854,255
2. Gain on Foreign Currency Translation 100,781 0
3. Gain on Foreign Currency Transactions 0 0
4. Dividend income(Other) 7,421,200 14,842,400
Ⅵ OTHER EXPENSES 58,216,394 3,968,264
1. Losses on Foreign currency transactions 8,007,572 6,113
2. Losses on Foreign currency translation 10,170,000 2,566,498
3. Loss on disposal of property and0 0equipment
4. Impairment loss for investment assets
5. Loss on disposal of subsidiaries equity 0 0
6. Other Bad debts expense 0 0
7. Others 40,038,822 1,395,653
8. Impairment loss for investment assets 0 0
Ⅶ FINANCIAL EXPENSES 0 373,175
1. Losses on Foreign currency transaction 0 236,358
2. Losses on Foreig currency conversion 0 136,817
3. Impairment loss for available-for-sale financial assets
Ⅷ INCOME BEFORE INCOME TAX EXPENSE 422,488,573 (9,353,423)
Ⅸ INCOME TAX EXPENSE 95,206,196 (552,573,993)
X NET INCOME 327,282,377 543,220,570
2 0 1 4 G I I R A n n u a l R e p o r t 6 3
G2R 2014AR_(내지)_*G2R 2009AR_(내지) 15. 3. 3. 오전 11:17 페이지 63
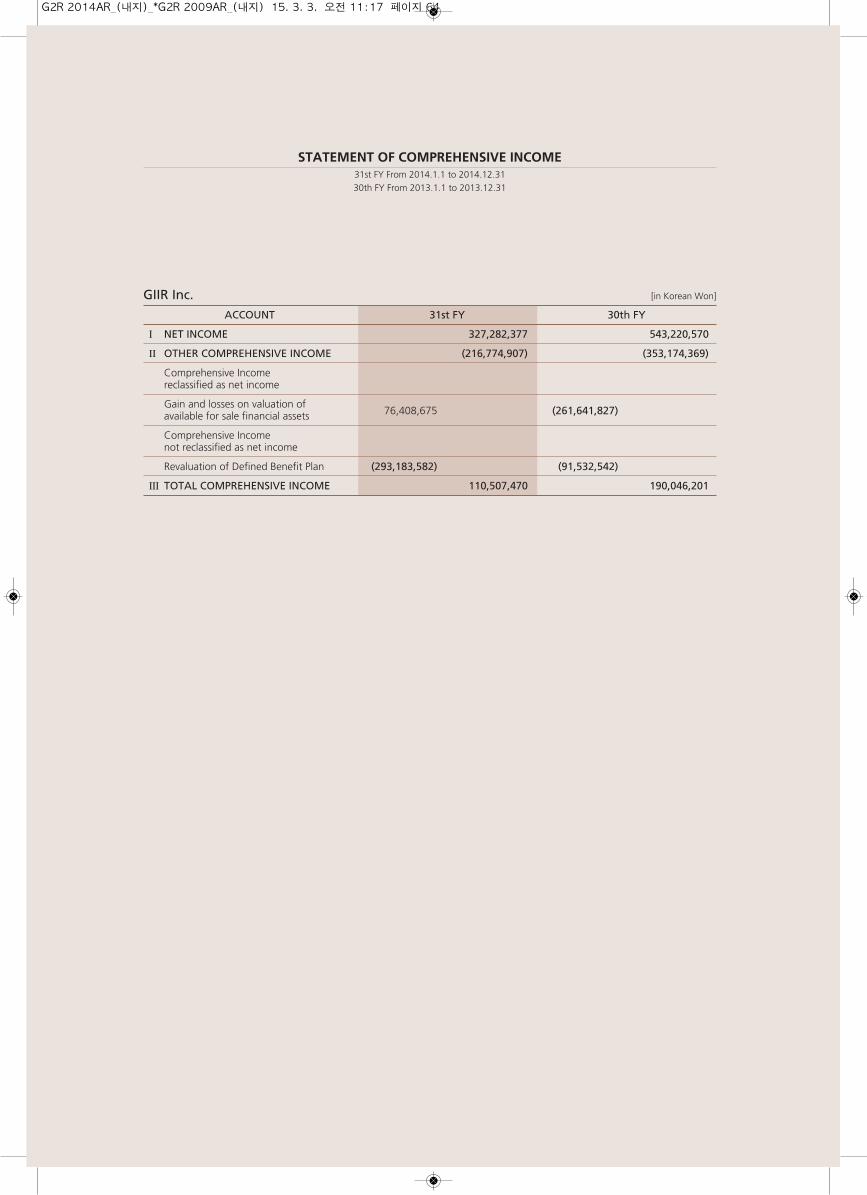
GIIR Inc. [in Korean Won]
ACCOUNT 31st FY 30th FY
I NET INCOME 327,282,377 543,220,570
II OTHER COMPREHENSIVE INCOME (216,774,907) (353,174,369)
Comprehensive Incomereclassified as net income
Gain and losses on valuation of76,408,675 (261,641,827)available for sale financial assets
Comprehensive Incomenot reclassified as net income
Revaluation of Defined Benefit Plan (293,183,582) (91,532,542)
III TOTAL COMPREHENSIVE INCOME 110,507,470 190,046,201
STATEMENT OF COMPREHENSIVE INCOME31st FY From 2014.1.1 to 2014.12.3130th FY From 2013.1.1 to 2013.12.31
G2R 2014AR_(내지)_*G2R 2009AR_(내지) 15. 3. 3. 오전 11:17 페이지 64
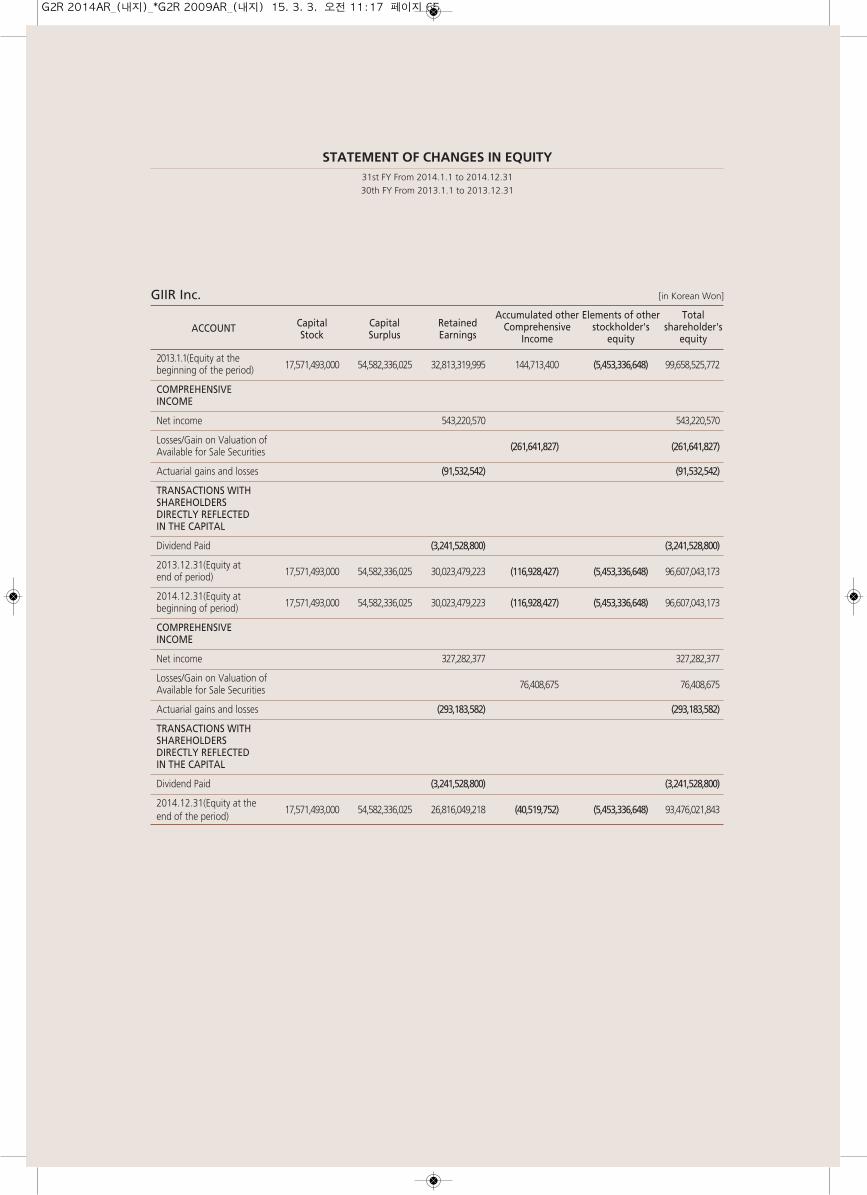
GIIR Inc. [in Korean Won]
Capital Capital RetainedAccumulated other Elements of other Total
ACCOUNTStock Surplus Earnings
Comprehensive stockholder's shareholder'sIncome equity equity
2013.1.1(Equity at the 17,571,493,000 54,582,336,025 32,813,319,995 144,713,400 (5,453,336,648) 99,658,525,772beginning of the period)
COMPREHENSIVE INCOME
Net income 543,220,570 543,220,570
Losses/Gain on Valuation of(261,641,827) (261,641,827)Available for Sale Securities
Actuarial gains and losses (91,532,542) (91,532,542)
TRANSACTIONS WITHSHAREHOLDERSDIRECTLY REFLECTEDIN THE CAPITAL
Dividend Paid (3,241,528,800) (3,241,528,800)
2013.12.31(Equity at17,571,493,000 54,582,336,025 30,023,479,223 (116,928,427) (5,453,336,648) 96,607,043,173end of period)
2014.12.31(Equity at17,571,493,000 54,582,336,025 30,023,479,223 (116,928,427) (5,453,336,648) 96,607,043,173beginning of period)
COMPREHENSIVE INCOME
Net income 327,282,377 327,282,377
Losses/Gain on Valuation of76,408,675 76,408,675Available for Sale Securities
Actuarial gains and losses (293,183,582) (293,183,582)
TRANSACTIONS WITHSHAREHOLDERSDIRECTLY REFLECTEDIN THE CAPITAL
Dividend Paid (3,241,528,800) (3,241,528,800)
2014.12.31(Equity at the 17,571,493,000 54,582,336,025 26,816,049,218 (40,519,752) (5,453,336,648) 93,476,021,843
end of the period)
STATEMENT OF CHANGES IN EQUITY31st FY From 2014.1.1 to 2014.12.3130th FY From 2013.1.1 to 2013.12.31
G2R 2014AR_(내지)_*G2R 2009AR_(내지) 15. 3. 3. 오전 11:17 페이지 65
GIIR Inc. [in Korean Won]
ACCOUNT 31st FY 30th FY
I RETAINED EARNING3,317,545,866 6,599,716,878BEFORE APPROPRIATION
1. Unappropriated earnings carried 3,083,447,071 6,148,028,850over from previous year
2. Actuarial gains and losses (293,183,582) (91,532,542)
3. Net Income 327,282,377 543,220,570
4. Voluntary Reserve Return 200,000,000
II APPROPRIATIONS OF3,241,528,800 3,516,269,807RETAINED EARNINGS
1. Earned surplus reserve 0 274,741,007
2. Dividends
A. Cash Dividends 3,241,528,800 3,241,528,800
Dividends(ratio)
FY2014: KRW 200(20%)
FY2013: KRW 200(20%)
III UNAPPROPRIATED RETAINEDEARNINGS TO BE CARRIED 76,017,066 3,083,447,071FORWARD TO SUBSEQUENT YEAR
STATEMENT OF APPROPRIATION OF RETAINED EARNINGS(PROPOSAL)31st FY From 2014.1.1 to 2014.12.31 (Expected Date of Appropriation : 2015.3.13)
30th FY From 2013.1.1 to 2013.12.31(Date of Appropriation : 2014.3.14)
G2R 2014AR_(내지)_*G2R 2009AR_(내지) 15. 3. 3. 오전 11:17 페이지 66
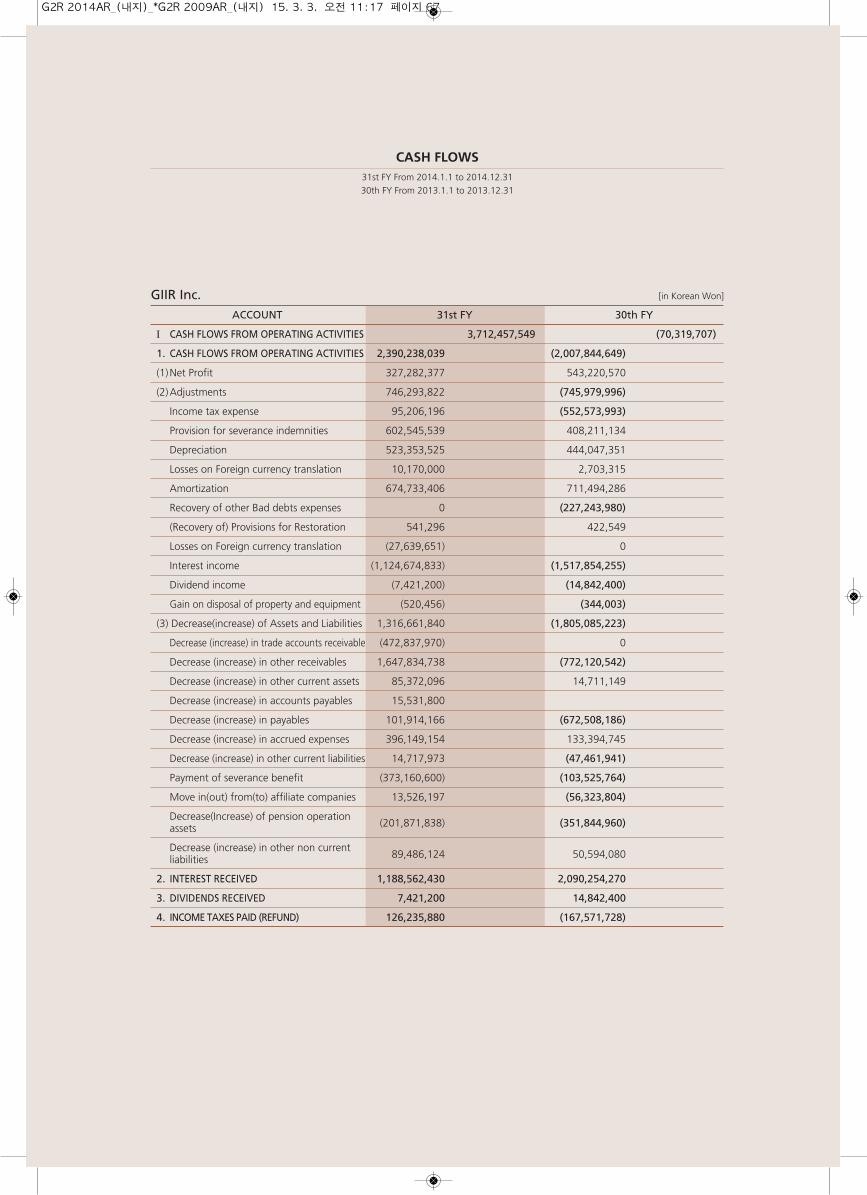
CASH FLOWS31st FY From 2014.1.1 to 2014.12.3130th FY From 2013.1.1 to 2013.12.31
GIIR Inc. [in Korean Won]
ACCOUNT 31st FY 30th FY
I CASH FLOWS FROM OPERATING ACTIVITIES 3,712,457,549 (70,319,707)
1. CASH FLOWS FROM OPERATING ACTIVITIES 2,390,238,039 (2,007,844,649)
(1)Net Profit 327,282,377 543,220,570
(2)Adjustments 746,293,822 (745,979,996)
Income tax expense 95,206,196 (552,573,993)
Provision for severance indemnities 602,545,539 408,211,134
Depreciation 523,353,525 444,047,351
Losses on Foreign currency translation 10,170,000 2,703,315
Amortization 674,733,406 711,494,286
Recovery of other Bad debts expenses 0 (227,243,980)
(Recovery of) Provisions for Restoration 541,296 422,549
Losses on Foreign currency translation (27,639,651) 0
Interest income (1,124,674,833) (1,517,854,255)
Dividend income (7,421,200) (14,842,400)
Gain on disposal of property and equipment (520,456) (344,003)
(3) Decrease(increase) of Assets and Liabilities 1,316,661,840 (1,805,085,223)
Decrease (increase) in trade accounts receivable (472,837,970) 0
Decrease (increase) in other receivables 1,647,834,738 (772,120,542)
Decrease (increase) in other current assets 85,372,096 14,711,149
Decrease (increase) in accounts payables 15,531,800
Decrease (increase) in payables 101,914,166 (672,508,186)
Decrease (increase) in accrued expenses 396,149,154 133,394,745
Decrease (increase) in other current liabilities 14,717,973 (47,461,941)
Payment of severance benefit (373,160,600) (103,525,764)
Move in(out) from(to) affiliate companies 13,526,197 (56,323,804)
Decrease(Increase) of pension operation(201,871,838) (351,844,960)assets
Decrease (increase) in other non current 89,486,124 50,594,080liabilities
2. INTEREST RECEIVED 1,188,562,430 2,090,254,270
3. DIVIDENDS RECEIVED 7,421,200 14,842,400
4. INCOME TAXES PAID (REFUND) 126,235,880 (167,571,728)
G2R 2014AR_(내지)_*G2R 2009AR_(내지) 15. 3. 3. 오전 11:17 페이지 67
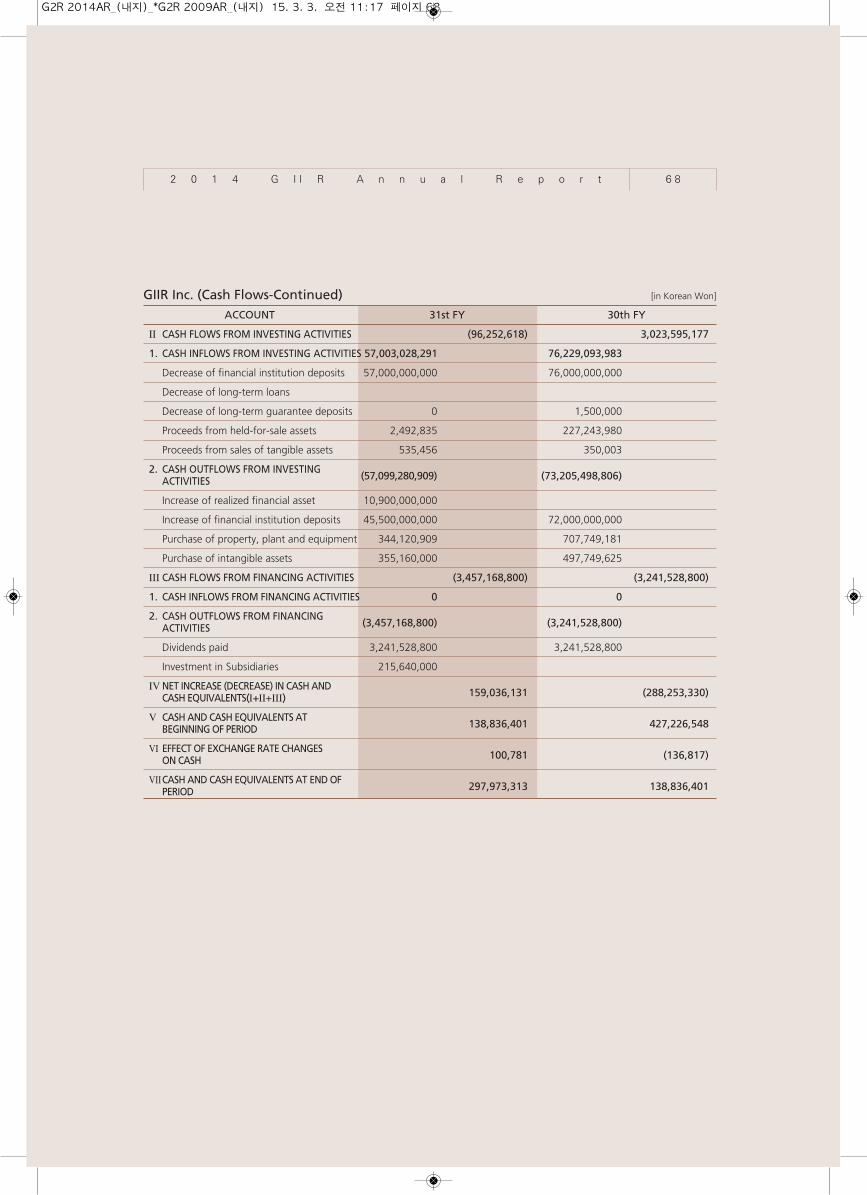
GIIR Inc. (Cash Flows-Continued) [in Korean Won]
ACCOUNT 31st FY 30th FY
Ⅱ CASH FLOWS FROM INVESTING ACTIVITIES (96,252,618) 3,023,595,177
1. CASH INFLOWS FROM INVESTING ACTIVITIES 57,003,028,291 76,229,093,983
Decrease of financial institution deposits 57,000,000,000 76,000,000,000
Decrease of long-term loans
Decrease of long-term guarantee deposits 0 1,500,000
Proceeds from held-for-sale assets 2,492,835 227,243,980
Proceeds from sales of tangible assets 535,456 350,003
2. CASH OUTFLOWS FROM INVESTING(57,099,280,909) (73,205,498,806)ACTIVITIES
Increase of realized financial asset 10,900,000,000
Increase of financial institution deposits 45,500,000,000 72,000,000,000
Purchase of property, plant and equipment 344,120,909 707,749,181
Purchase of intangible assets 355,160,000 497,749,625
Ⅲ CASH FLOWS FROM FINANCING ACTIVITIES (3,457,168,800) (3,241,528,800)
1. CASH INFLOWS FROM FINANCING ACTIVITIES 0 0
2. CASH OUTFLOWS FROM FINANCING(3,457,168,800) (3,241,528,800)ACTIVITIES
Dividends paid 3,241,528,800 3,241,528,800
Investment in Subsidiaries 215,640,000
IVNET INCREASE (DECREASE) IN CASH AND 159,036,131 (288,253,330)CASH EQUIVALENTS(Ⅰ+Ⅱ+Ⅲ)
Ⅴ CASH AND CASH EQUIVALENTS AT138,836,401 427,226,548BEGINNING OF PERIOD
Ⅵ EFFECT OF EXCHANGE RATE CHANGES 100,781 (136,817)ON CASH
ⅦCASH AND CASH EQUIVALENTS AT END OF297,973,313 138,836,401PERIOD
2 0 1 4 G I I R A n n u a l R e p o r t 6 8
G2R 2014AR_(내지)_*G2R 2009AR_(내지) 15. 3. 3. 오전 11:17 페이지 68
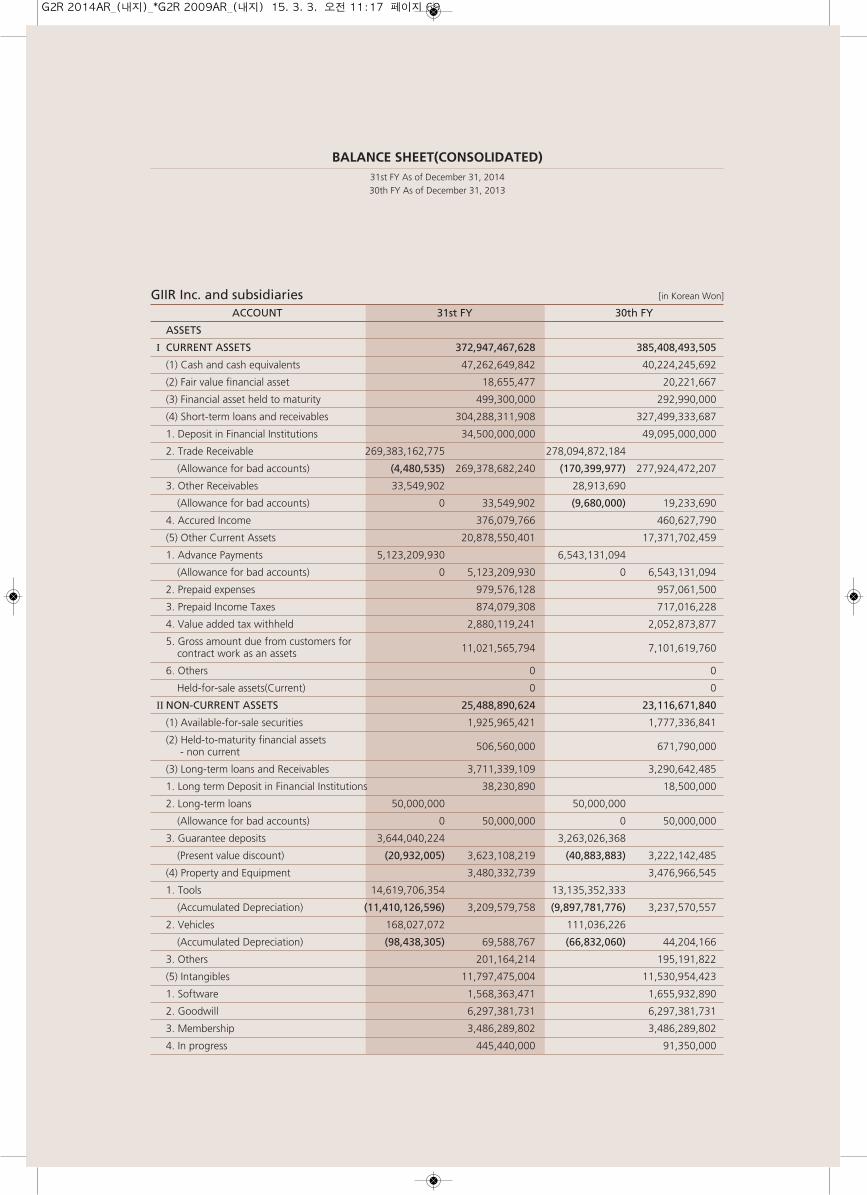
BALANCE SHEET(CONSOLIDATED)31st FY As of December 31, 201430th FY As of December 31, 2013
GIIR Inc. and subsidiaries [in Korean Won]
ACCOUNT 31st FY 30th FY
ASSETS
I CURRENT ASSETS 372,947,467,628 385,408,493,505
(1) Cash and cash equivalents 47,262,649,842 40,224,245,692
(2) Fair value financial asset 18,655,477 20,221,667
(3) Financial asset held to maturity 499,300,000 292,990,000
(4) Short-term loans and receivables 304,288,311,908 327,499,333,687
1. Deposit in Financial Institutions 34,500,000,000 49,095,000,000
2. Trade Receivable 269,383,162,775 278,094,872,184
(Allowance for bad accounts) (4,480,535) 269,378,682,240 (170,399,977) 277,924,472,207
3. Other Receivables 33,549,902 28,913,690
(Allowance for bad accounts) 0 33,549,902 (9,680,000) 19,233,690
4. Accured Income 376,079,766 460,627,790
(5) Other Current Assets 20,878,550,401 17,371,702,459
1. Advance Payments 5,123,209,930 6,543,131,094
(Allowance for bad accounts) 0 5,123,209,930 0 6,543,131,094
2. Prepaid expenses 979,576,128 957,061,500
3. Prepaid Income Taxes 874,079,308 717,016,228
4. Value added tax withheld 2,880,119,241 2,052,873,877
5. Gross amount due from customers for11,021,565,794 7,101,619,760contract work as an assets
6. Others 0 0
Held-for-sale assets(Current) 0 0
II NON-CURRENT ASSETS 25,488,890,624 23,116,671,840
(1) Available-for-sale securities 1,925,965,421 1,777,336,841
(2) Held-to-maturity financial assets506,560,000 671,790,000- non current
(3) Long-term loans and Receivables 3,711,339,109 3,290,642,485
1. Long term Deposit in Financial Institutions 38,230,890 18,500,000
2. Long-term loans 50,000,000 50,000,000
(Allowance for bad accounts) 0 50,000,000 0 50,000,000
3. Guarantee deposits 3,644,040,224 3,263,026,368
(Present value discount) (20,932,005) 3,623,108,219 (40,883,883) 3,222,142,485
(4) Property and Equipment 3,480,332,739 3,476,966,545
1. Tools 14,619,706,354 13,135,352,333
(Accumulated Depreciation) (11,410,126,596) 3,209,579,758 (9,897,781,776) 3,237,570,557
2. Vehicles 168,027,072 111,036,226
(Accumulated Depreciation) (98,438,305) 69,588,767 (66,832,060) 44,204,166
3. Others 201,164,214 195,191,822
(5) Intangibles 11,797,475,004 11,530,954,423
1. Software 1,568,363,471 1,655,932,890
2. Goodwill 6,297,381,731 6,297,381,731
3. Membership 3,486,289,802 3,486,289,802
4. In progress 445,440,000 91,350,000
G2R 2014AR_(내지)_*G2R 2009AR_(내지) 15. 3. 3. 오전 11:17 페이지 69
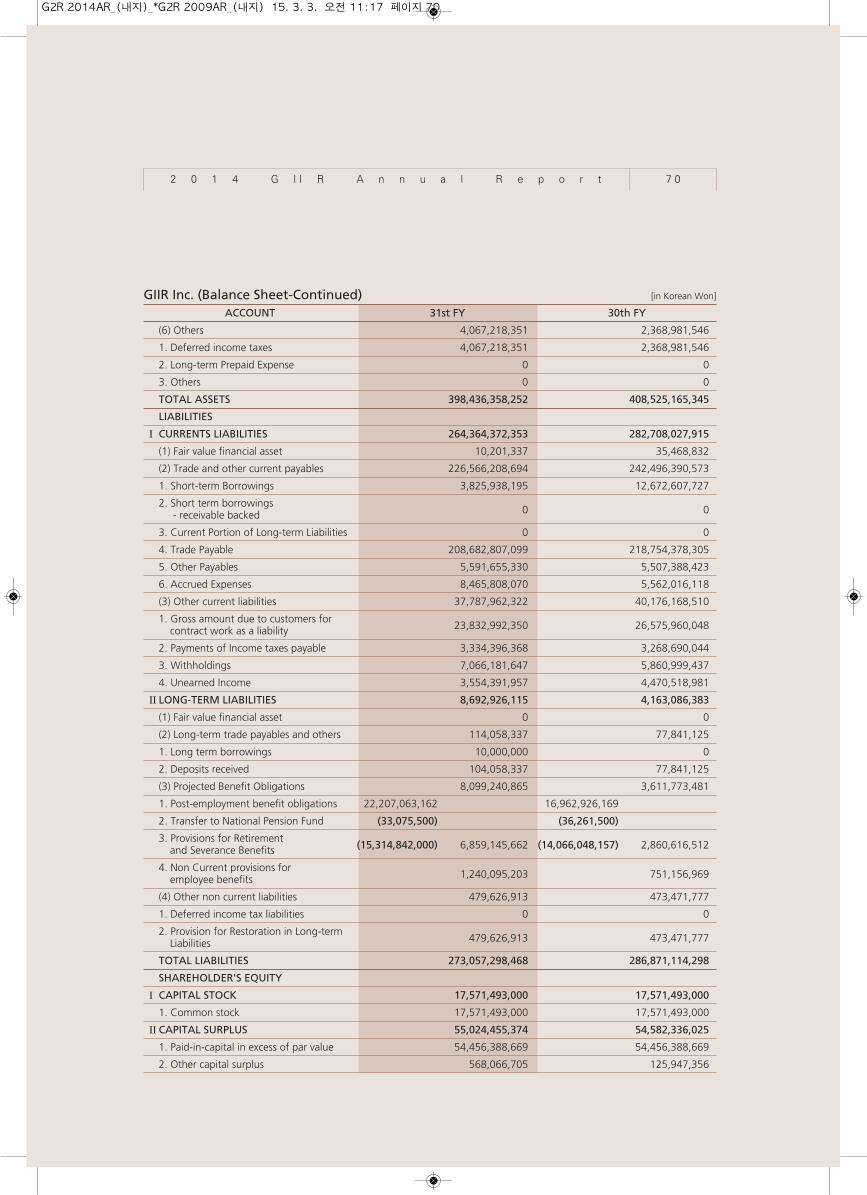
GIIR Inc. (Balance Sheet-Continued) [in Korean Won]
ACCOUNT 31st FY 30th FY
(6) Others 4,067,218,351 2,368,981,546
1. Deferred income taxes 4,067,218,351 2,368,981,546
2. Long-term Prepaid Expense 0 0
3. Others 0 0
TOTAL ASSETS 398,436,358,252 408,525,165,345
LIABILITIES
I CURRENTS LIABILITIES 264,364,372,353 282,708,027,915
(1) Fair value financial asset 10,201,337 35,468,832
(2) Trade and other current payables 226,566,208,694 242,496,390,573
1. Short-term Borrowings 3,825,938,195 12,672,607,727
2. Short term borrowings0 0- receivable backed
3. Current Portion of Long-term Liabilities 0 0
4. Trade Payable 208,682,807,099 218,754,378,305
5. Other Payables 5,591,655,330 5,507,388,423
6. Accrued Expenses 8,465,808,070 5,562,016,118
(3) Other current liabilities 37,787,962,322 40,176,168,510
1. Gross amount due to customers for 23,832,992,350 26,575,960,048contract work as a liability
2. Payments of Income taxes payable 3,334,396,368 3,268,690,044
3. Withholdings 7,066,181,647 5,860,999,437
4. Unearned Income 3,554,391,957 4,470,518,981
Ⅱ LONG-TERM LIABILITIES 8,692,926,115 4,163,086,383
(1) Fair value financial asset 0 0
(2) Long-term trade payables and others 114,058,337 77,841,125
1. Long term borrowings 10,000,000 0
2. Deposits received 104,058,337 77,841,125
(3) Projected Benefit Obligations 8,099,240,865 3,611,773,481
1. Post-employment benefit obligations 22,207,063,162 16,962,926,169
2. Transfer to National Pension Fund (33,075,500) (36,261,500)
3. Provisions for Retirement (15,314,842,000) 6,859,145,662 (14,066,048,157) 2,860,616,512and Severance Benefits
4. Non Current provisions for 1,240,095,203 751,156,969employee benefits
(4) Other non current liabilities 479,626,913 473,471,777
1. Deferred income tax liabilities 0 0
2. Provision for Restoration in Long-term 479,626,913 473,471,777Liabilities
TOTAL LIABILITIES 273,057,298,468 286,871,114,298
SHAREHOLDER'S EQUITY
I CAPITAL STOCK 17,571,493,000 17,571,493,000
1. Common stock 17,571,493,000 17,571,493,000
II CAPITAL SURPLUS 55,024,455,374 54,582,336,025
1. Paid-in-capital in excess of par value 54,456,388,669 54,456,388,669
2. Other capital surplus 568,066,705 125,947,356
2 0 1 4 G I I R A n n u a l R e p o r t 7 0
G2R 2014AR_(내지)_*G2R 2009AR_(내지) 15. 3. 3. 오전 11:17 페이지 70
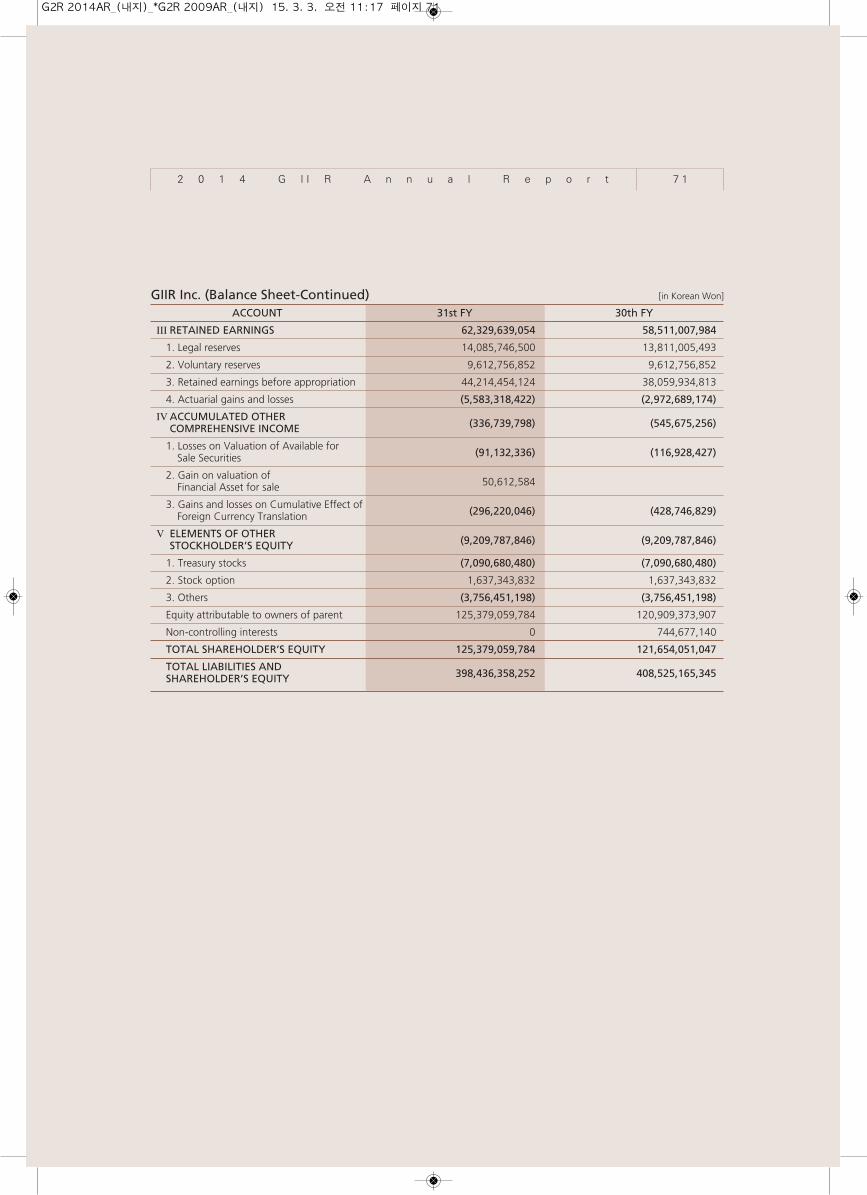
GIIR Inc. (Balance Sheet-Continued) [in Korean Won]
ACCOUNT 31st FY 30th FY
Ⅲ RETAINED EARNINGS 62,329,639,054 58,511,007,984
1. Legal reserves 14,085,746,500 13,811,005,493
2. Voluntary reserves 9,612,756,852 9,612,756,852
3. Retained earnings before appropriation 44,214,454,124 38,059,934,813
4. Actuarial gains and losses (5,583,318,422) (2,972,689,174)
ⅣACCUMULATED OTHER (336,739,798) (545,675,256)COMPREHENSIVE INCOME
1. Losses on Valuation of Available for (91,132,336) (116,928,427)Sale Securities
2. Gain on valuation of 50,612,584Financial Asset for sale
3. Gains and losses on Cumulative Effect of (296,220,046) (428,746,829)Foreign Currency Translation
Ⅴ ELEMENTS OF OTHER (9,209,787,846) (9,209,787,846)STOCKHOLDER’S EQUITY
1. Treasury stocks (7,090,680,480) (7,090,680,480)
2. Stock option 1,637,343,832 1,637,343,832
3. Others (3,756,451,198) (3,756,451,198)
Equity attributable to owners of parent 125,379,059,784 120,909,373,907
Non-controlling interests 0 744,677,140
TOTAL SHAREHOLDER’S EQUITY 125,379,059,784 121,654,051,047
TOTAL LIABILITIES AND398,436,358,252 408,525,165,345SHAREHOLDER’S EQUITY
2 0 1 4 G I I R A n n u a l R e p o r t 7 1
G2R 2014AR_(내지)_*G2R 2009AR_(내지) 15. 3. 3. 오전 11:17 페이지 71
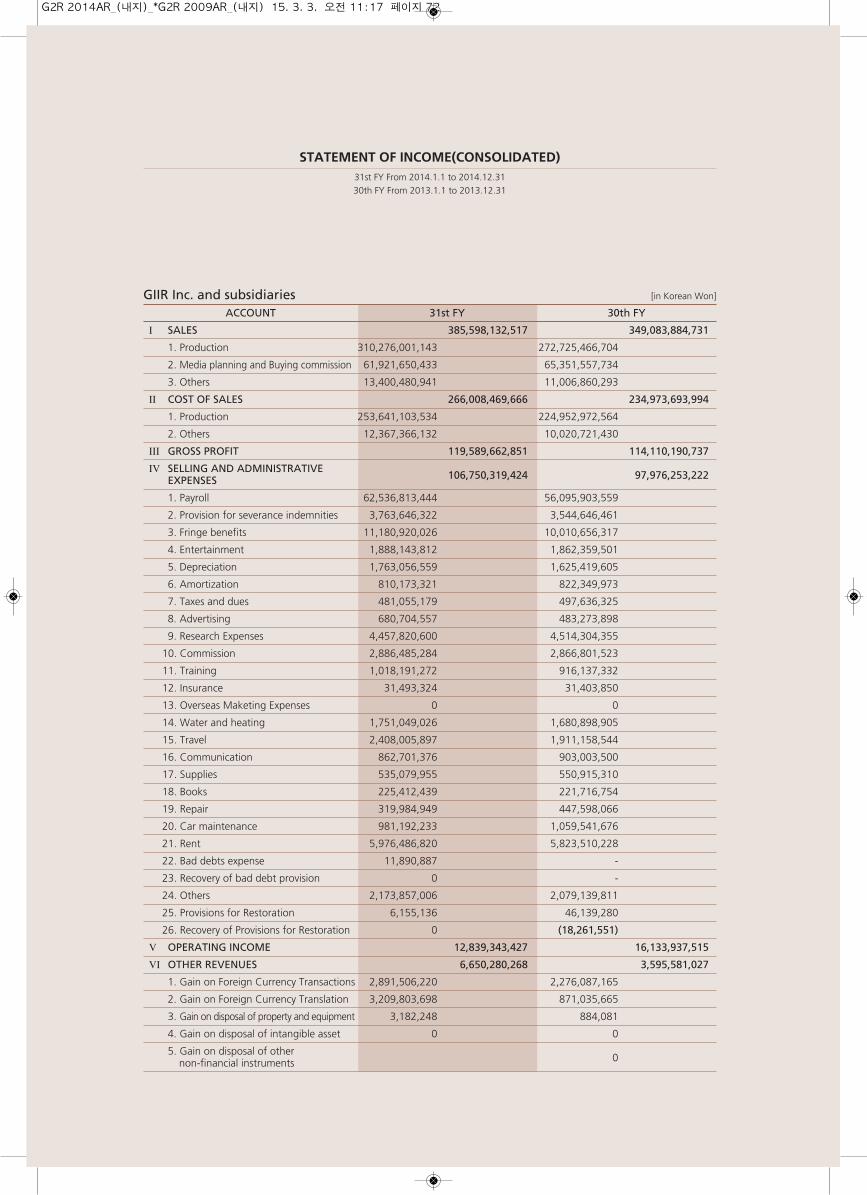
GIIR Inc. and subsidiaries [in Korean Won]
ACCOUNT 31st FY 30th FY
I SALES 385,598,132,517 349,083,884,731
1. Production 310,276,001,143 272,725,466,704
2. Media planning and Buying commission 61,921,650,433 65,351,557,734
3. Others 13,400,480,941 11,006,860,293
Ⅱ COST OF SALES 266,008,469,666 234,973,693,994
1. Production 253,641,103,534 224,952,972,564
2. Others 12,367,366,132 10,020,721,430
Ⅲ GROSS PROFIT 119,589,662,851 114,110,190,737
Ⅳ SELLING AND ADMINISTRATIVE106,750,319,424 97,976,253,222EXPENSES
1. Payroll 62,536,813,444 56,095,903,559
2. Provision for severance indemnities 3,763,646,322 3,544,646,461
3. Fringe benefits 11,180,920,026 10,010,656,317
4. Entertainment 1,888,143,812 1,862,359,501
5. Depreciation 1,763,056,559 1,625,419,605
6. Amortization 810,173,321 822,349,973
7. Taxes and dues 481,055,179 497,636,325
8. Advertising 680,704,557 483,273,898
9. Research Expenses 4,457,820,600 4,514,304,355
10. Commission 2,886,485,284 2,866,801,523
11. Training 1,018,191,272 916,137,332
12. Insurance 31,493,324 31,403,850
13. Overseas Maketing Expenses 0 0
14. Water and heating 1,751,049,026 1,680,898,905
15. Travel 2,408,005,897 1,911,158,544
16. Communication 862,701,376 903,003,500
17. Supplies 535,079,955 550,915,310
18. Books 225,412,439 221,716,754
19. Repair 319,984,949 447,598,066
20. Car maintenance 981,192,233 1,059,541,676
21. Rent 5,976,486,820 5,823,510,228
22. Bad debts expense 11,890,887 -
23. Recovery of bad debt provision 0 -
24. Others 2,173,857,006 2,079,139,811
25. Provisions for Restoration 6,155,136 46,139,280
26. Recovery of Provisions for Restoration 0 (18,261,551)
V OPERATING INCOME 12,839,343,427 16,133,937,515
VI OTHER REVENUES 6,650,280,268 3,595,581,027
1. Gain on Foreign Currency Transactions 2,891,506,220 2,276,087,165
2. Gain on Foreign Currency Translation 3,209,803,698 871,035,665
3. Gain on disposal of property and equipment 3,182,248 884,081
4. Gain on disposal of intangible asset 0 0
5. Gain on disposal of other0non-financial instruments
STATEMENT OF INCOME(CONSOLIDATED)31st FY From 2014.1.1 to 2014.12.3130th FY From 2013.1.1 to 2013.12.31
G2R 2014AR_(내지)_*G2R 2009AR_(내지) 15. 3. 3. 오전 11:17 페이지 72
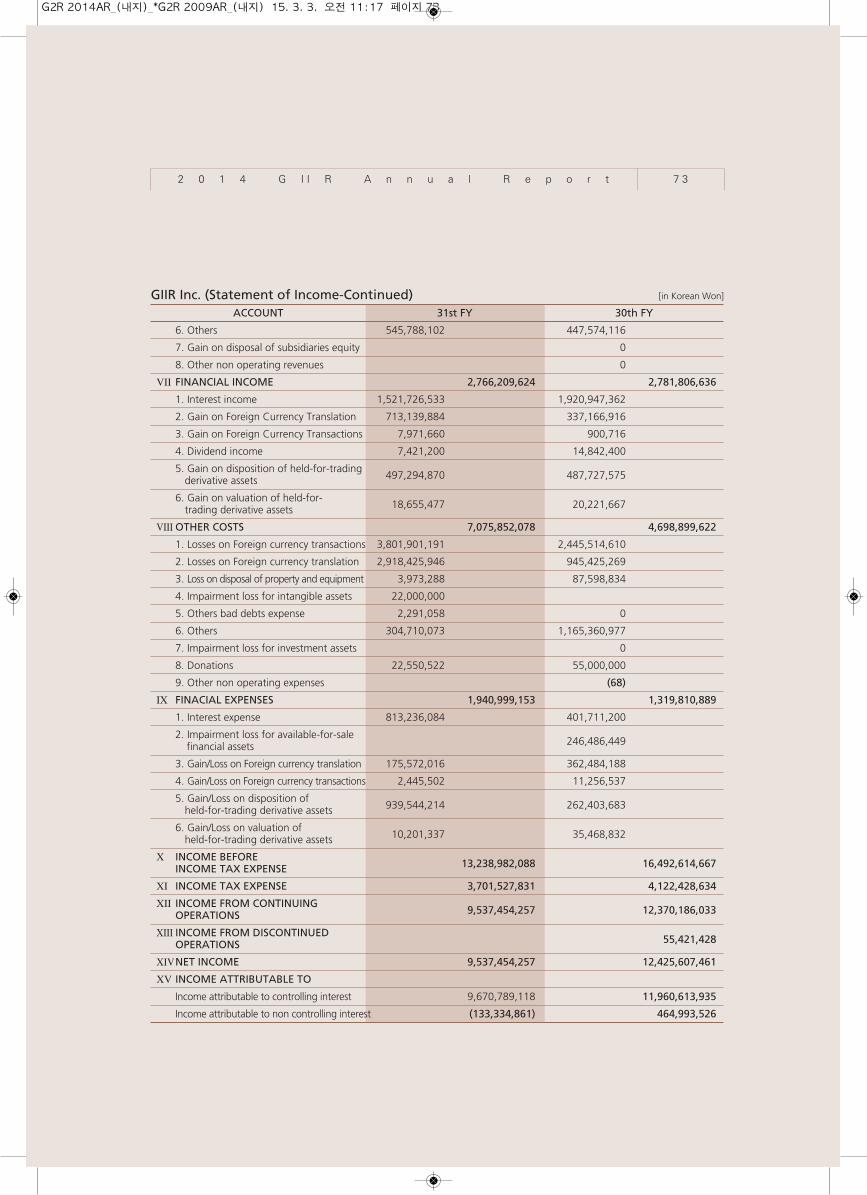
GIIR Inc. (Statement of Income-Continued) [in Korean Won]
ACCOUNT 31st FY 30th FY
6. Others 545,788,102 447,574,116
7. Gain on disposal of subsidiaries equity 0
8. Other non operating revenues 0
Ⅶ FINANCIAL INCOME 2,766,209,624 2,781,806,636
1. Interest income 1,521,726,533 1,920,947,362
2. Gain on Foreign Currency Translation 713,139,884 337,166,916
3. Gain on Foreign Currency Transactions 7,971,660 900,716
4. Dividend income 7,421,200 14,842,400
5. Gain on disposition of held-for-trading 497,294,870 487,727,575derivative assets
6. Gain on valuation of held-for- 18,655,477 20,221,667trading derivative assets
ⅧOTHER COSTS 7,075,852,078 4,698,899,622
1. Losses on Foreign currency transactions 3,801,901,191 2,445,514,610
2. Losses on Foreign currency translation 2,918,425,946 945,425,269
3. Loss on disposal of property and equipment 3,973,288 87,598,834
4. Impairment loss for intangible assets 22,000,000
5. Others bad debts expense 2,291,058 0
6. Others 304,710,073 1,165,360,977
7. Impairment loss for investment assets 0
8. Donations 22,550,522 55,000,000
9. Other non operating expenses (68)
Ⅸ FINACIAL EXPENSES 1,940,999,153 1,319,810,889
1. Interest expense 813,236,084 401,711,200
2. Impairment loss for available-for-sale246,486,449financial assets
3. Gain/Loss on Foreign currency translation 175,572,016 362,484,188
4. Gain/Loss on Foreign currency transactions 2,445,502 11,256,537
5. Gain/Loss on disposition of 939,544,214 262,403,683held-for-trading derivative assets
6. Gain/Loss on valuation of 10,201,337 35,468,832held-for-trading derivative assets
Ⅹ INCOME BEFORE 13,238,982,088 16,492,614,667INCOME TAX EXPENSE
XI INCOME TAX EXPENSE 3,701,527,831 4,122,428,634
ⅩⅡ INCOME FROM CONTINUING 9,537,454,257 12,370,186,033 OPERATIONS
ⅩⅢ INCOME FROM DISCONTINUED55,421,428OPERATIONS
ⅩⅣNET INCOME 9,537,454,257 12,425,607,461
ⅩV INCOME ATTRIBUTABLE TO
Income attributable to controlling interest 9,670,789,118 11,960,613,935
Income attributable to non controlling interest (133,334,861) 464,993,526
2 0 1 4 G I I R A n n u a l R e p o r t 7 3
G2R 2014AR_(내지)_*G2R 2009AR_(내지) 15. 3. 3. 오전 11:17 페이지 73
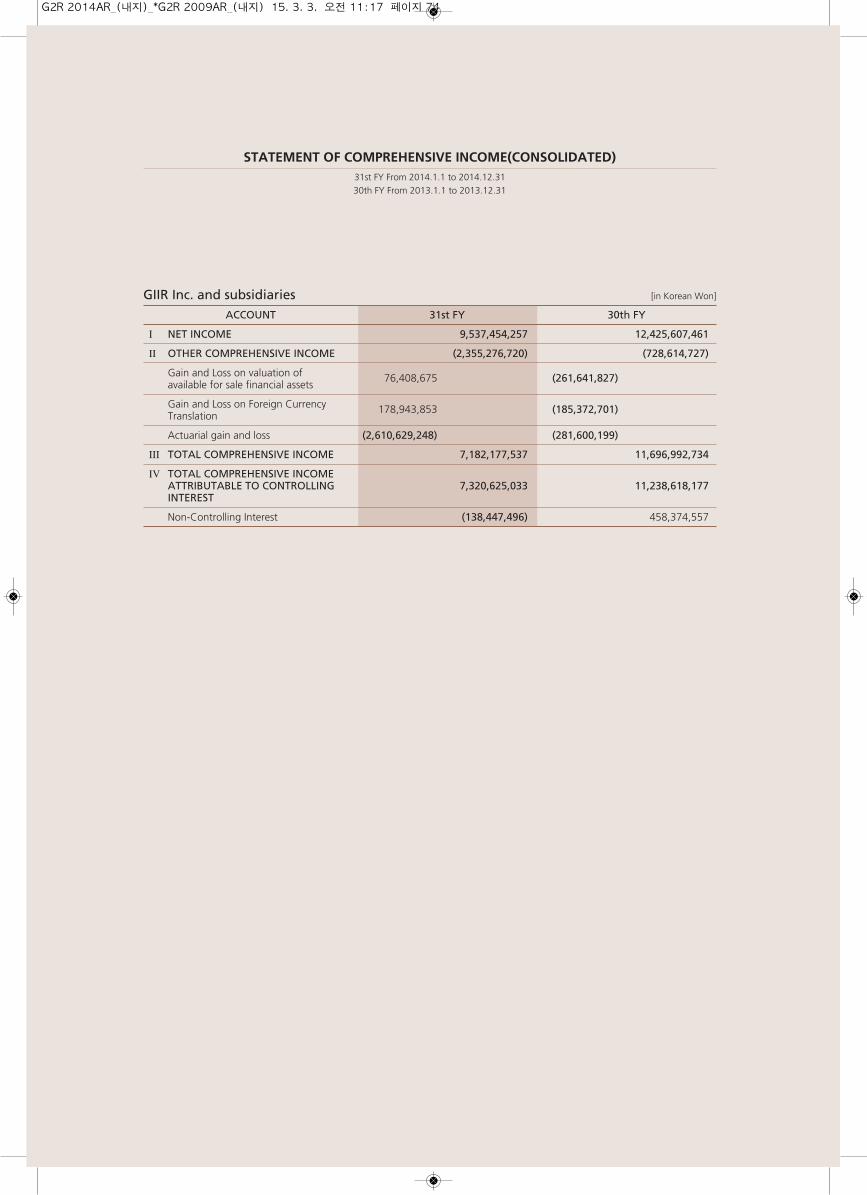
GIIR Inc. and subsidiaries [in Korean Won]
ACCOUNT 31st FY 30th FY
I NET INCOME 9,537,454,257 12,425,607,461
Ⅱ OTHER COMPREHENSIVE INCOME (2,355,276,720) (728,614,727)
Gain and Loss on valuation of 76,408,675 (261,641,827)available for sale financial assets
Gain and Loss on Foreign Currency 178,943,853 (185,372,701)Translation
Actuarial gain and loss (2,610,629,248) (281,600,199)
Ⅲ TOTAL COMPREHENSIVE INCOME 7,182,177,537 11,696,992,734
Ⅳ TOTAL COMPREHENSIVE INCOMEATTRIBUTABLE TO CONTROLLING 7,320,625,033 11,238,618,177INTEREST
Non-Controlling Interest (138,447,496) 458,374,557
STATEMENT OF COMPREHENSIVE INCOME(CONSOLIDATED)31st FY From 2014.1.1 to 2014.12.3130th FY From 2013.1.1 to 2013.12.31
G2R 2014AR_(내지)_*G2R 2009AR_(내지) 15. 3. 3. 오전 11:17 페이지 74
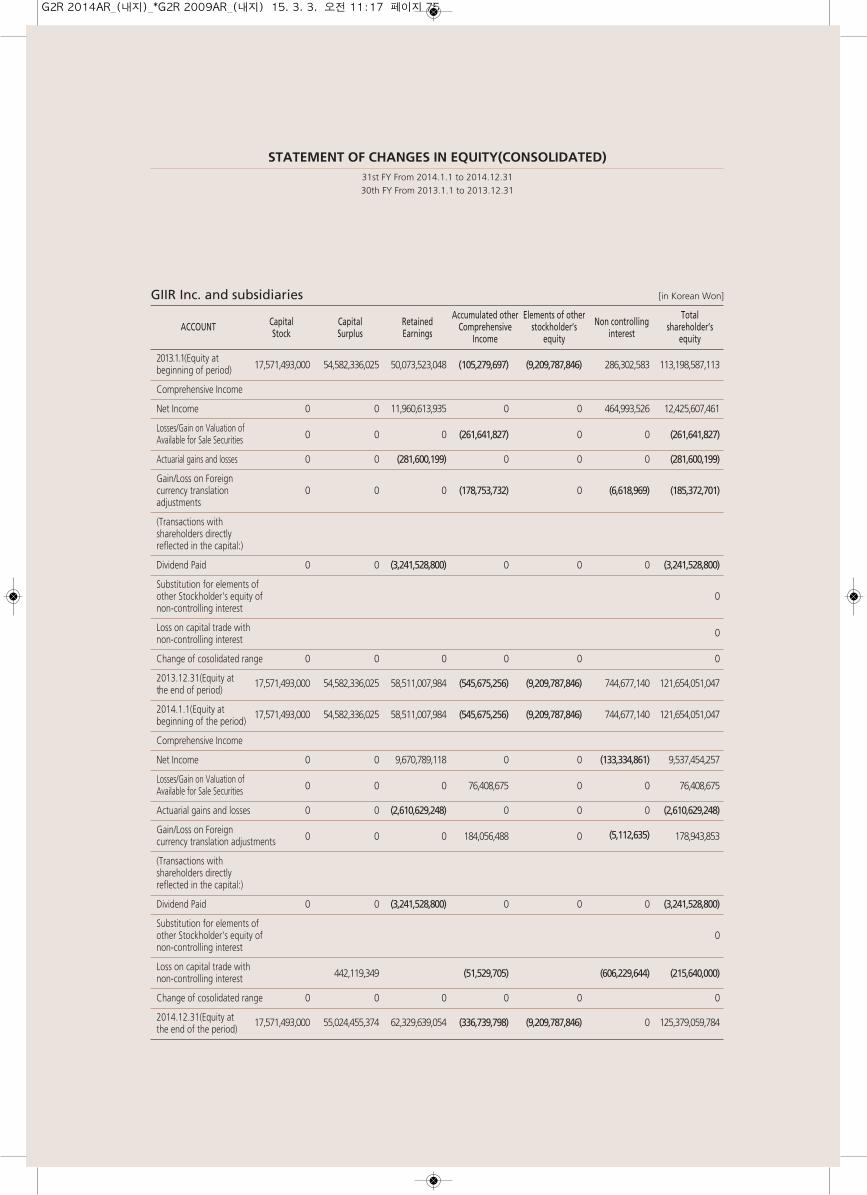
GIIR Inc. and subsidiaries [in Korean Won]
Capital Capital RetainedAccumulated other Elements of other
Non controllingTotal
ACCOUNTStock Surplus Earnings
Comprehensive stockholder’sinterest
shareholder’sIncome equity equity
2013.1.1(Equity at 17,571,493,000 54,582,336,025 50,073,523,048 (105,279,697) (9,209,787,846) 286,302,583 113,198,587,113beginning of period)
Comprehensive Income
Net Income 0 0 11,960,613,935 0 0 464,993,526 12,425,607,461
Losses/Gain on Valuation of0 0 0 (261,641,827) 0 0 (261,641,827)Available for Sale Securities
Actuarial gains and losses 0 0 (281,600,199) 0 0 0 (281,600,199)
Gain/Loss on Foreign currency translation 0 0 0 (178,753,732) 0 (6,618,969) (185,372,701)adjustments
(Transactions with shareholders directlyreflected in the capital:)
Dividend Paid 0 0 (3,241,528,800) 0 0 0 (3,241,528,800)
Substitution for elements ofother Stockholder's equity of 0non-controlling interest
Loss on capital trade with 0non-controlling interest
Change of cosolidated range 0 0 0 0 0 0
2013.12.31(Equity at 17,571,493,000 54,582,336,025 58,511,007,984 (545,675,256) (9,209,787,846) 744,677,140 121,654,051,047the end of period)
2014.1.1(Equity at 17,571,493,000 54,582,336,025 58,511,007,984 (545,675,256) (9,209,787,846) 744,677,140 121,654,051,047beginning of the period)
Comprehensive Income
Net Income 0 0 9,670,789,118 0 0 (133,334,861) 9,537,454,257
Losses/Gain on Valuation of0 0 0 76,408,675 0 0 76,408,675Available for Sale Securities
Actuarial gains and losses 0 0 (2,610,629,248) 0 0 0 (2,610,629,248)
Gain/Loss on Foreign0 0 0 184,056,488 0 (5,112,635) 178,943,853currency translation adjustments
(Transactions with shareholders directlyreflected in the capital:)
Dividend Paid 0 0 (3,241,528,800) 0 0 0 (3,241,528,800)
Substitution for elements ofother Stockholder's equity of 0non-controlling interest
Loss on capital trade with442,119,349 (51,529,705) (606,229,644) (215,640,000)non-controlling interest
Change of cosolidated range 0 0 0 0 0 0
2014.12.31(Equity at 17,571,493,000 55,024,455,374 62,329,639,054 (336,739,798) (9,209,787,846) 0 125,379,059,784the end of the period)
STATEMENT OF CHANGES IN EQUITY(CONSOLIDATED)31st FY From 2014.1.1 to 2014.12.3130th FY From 2013.1.1 to 2013.12.31
G2R 2014AR_(내지)_*G2R 2009AR_(내지) 15. 3. 3. 오전 11:17 페이지 75
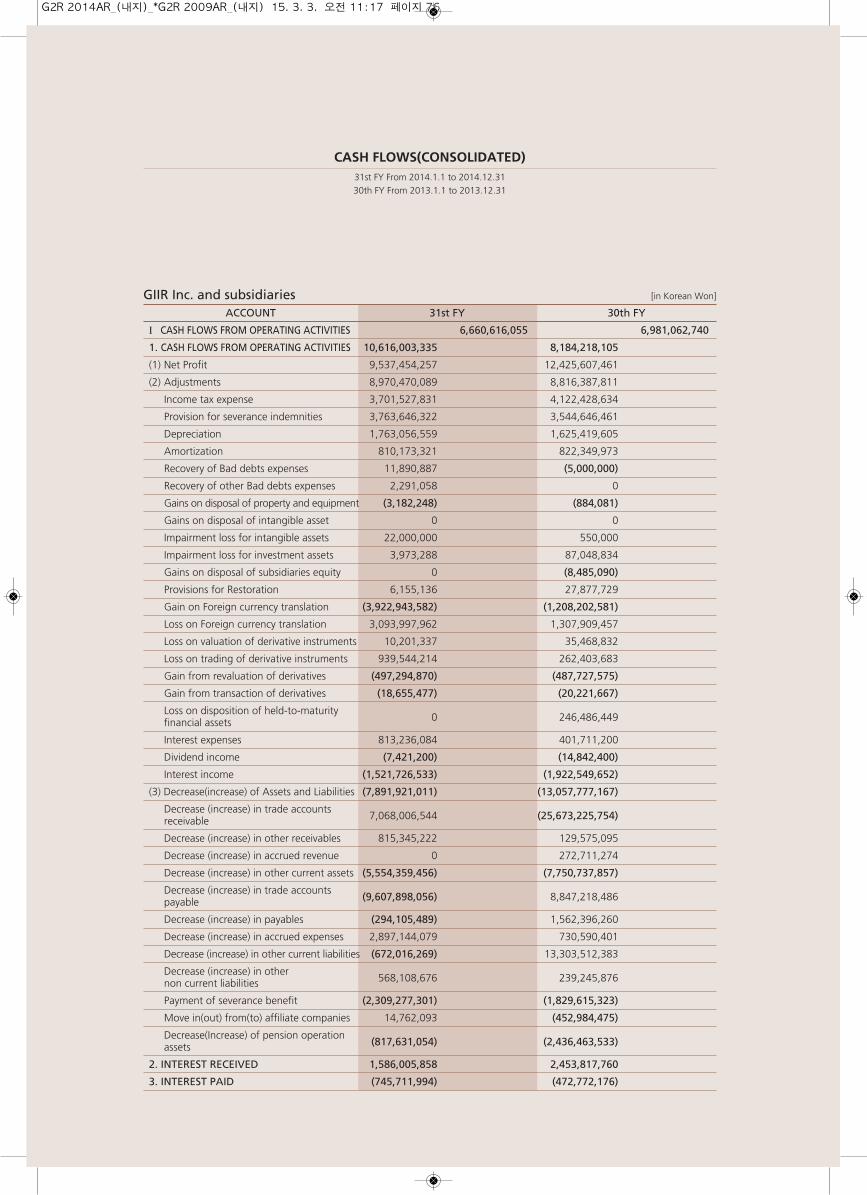
CASH FLOWS(CONSOLIDATED)31st FY From 2014.1.1 to 2014.12.3130th FY From 2013.1.1 to 2013.12.31
GIIR Inc. and subsidiaries [in Korean Won]
ACCOUNT 31st FY 30th FY
I CASH FLOWS FROM OPERATING ACTIVITIES 6,660,616,055 6,981,062,740
1. CASH FLOWS FROM OPERATING ACTIVITIES 10,616,003,335 8,184,218,105
(1) Net Profit 9,537,454,257 12,425,607,461
(2) Adjustments 8,970,470,089 8,816,387,811
Income tax expense 3,701,527,831 4,122,428,634
Provision for severance indemnities 3,763,646,322 3,544,646,461
Depreciation 1,763,056,559 1,625,419,605
Amortization 810,173,321 822,349,973
Recovery of Bad debts expenses 11,890,887 (5,000,000)
Recovery of other Bad debts expenses 2,291,058 0
Gains on disposal of property and equipment (3,182,248) (884,081)
Gains on disposal of intangible asset 0 0
Impairment loss for intangible assets 22,000,000 550,000
Impairment loss for investment assets 3,973,288 87,048,834
Gains on disposal of subsidiaries equity 0 (8,485,090)
Provisions for Restoration 6,155,136 27,877,729
Gain on Foreign currency translation (3,922,943,582) (1,208,202,581)
Loss on Foreign currency translation 3,093,997,962 1,307,909,457
Loss on valuation of derivative instruments 10,201,337 35,468,832
Loss on trading of derivative instruments 939,544,214 262,403,683
Gain from revaluation of derivatives (497,294,870) (487,727,575)
Gain from transaction of derivatives (18,655,477) (20,221,667)
Loss on disposition of held-to-maturity0 246,486,449financial assets
Interest expenses 813,236,084 401,711,200
Dividend income (7,421,200) (14,842,400)
Interest income (1,521,726,533) (1,922,549,652)
(3) Decrease(increase) of Assets and Liabilities (7,891,921,011) (13,057,777,167)
Decrease (increase) in trade accounts7,068,006,544 (25,673,225,754)receivable
Decrease (increase) in other receivables 815,345,222 129,575,095
Decrease (increase) in accrued revenue 0 272,711,274
Decrease (increase) in other current assets (5,554,359,456) (7,750,737,857)
Decrease (increase) in trade accounts(9,607,898,056) 8,847,218,486payable
Decrease (increase) in payables (294,105,489) 1,562,396,260
Decrease (increase) in accrued expenses 2,897,144,079 730,590,401
Decrease (increase) in other current liabilities (672,016,269) 13,303,512,383
Decrease (increase) in other568,108,676 239,245,876non current liabilities
Payment of severance benefit (2,309,277,301) (1,829,615,323)
Move in(out) from(to) affiliate companies 14,762,093 (452,984,475)
Decrease(Increase) of pension operation(817,631,054) (2,436,463,533)assets
2. INTEREST RECEIVED 1,586,005,858 2,453,817,760
3. INTEREST PAID (745,711,994) (472,772,176)
G2R 2014AR_(내지)_*G2R 2009AR_(내지) 15. 3. 3. 오전 11:17 페이지 76
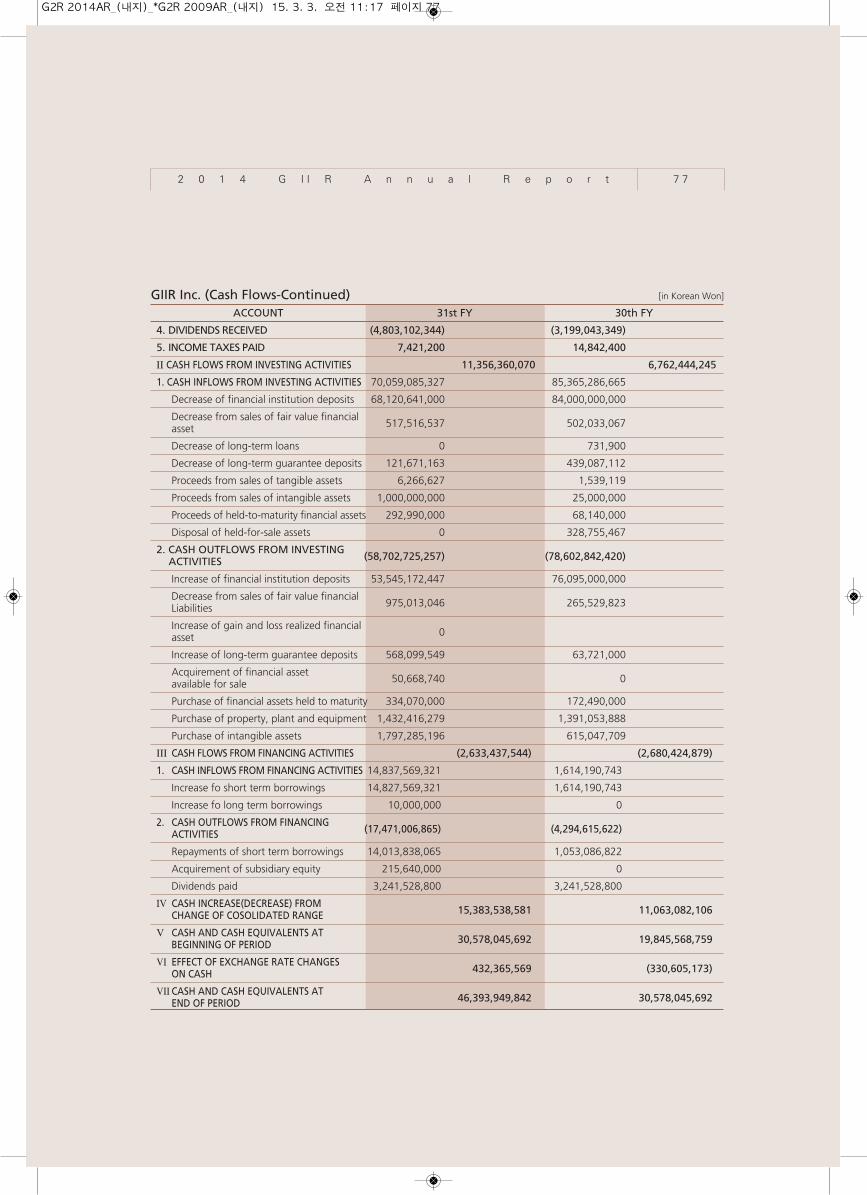
2 0 1 4 G I I R A n n u a l R e p o r t 7 7
GIIR Inc. (Cash Flows-Continued) [in Korean Won]
ACCOUNT 31st FY 30th FY
4. DIVIDENDS RECEIVED (4,803,102,344) (3,199,043,349)
5. INCOME TAXES PAID 7,421,200 14,842,400
Ⅱ CASH FLOWS FROM INVESTING ACTIVITIES 11,356,360,070 6,762,444,245
1. CASH INFLOWS FROM INVESTING ACTIVITIES 70,059,085,327 85,365,286,665
Decrease of financial institution deposits 68,120,641,000 84,000,000,000
Decrease from sales of fair value financial517,516,537 502,033,067asset
Decrease of long-term loans 0 731,900
Decrease of long-term guarantee deposits 121,671,163 439,087,112
Proceeds from sales of tangible assets 6,266,627 1,539,119
Proceeds from sales of intangible assets 1,000,000,000 25,000,000
Proceeds of held-to-maturity financial assets 292,990,000 68,140,000
Disposal of held-for-sale assets 0 328,755,467
2. CASH OUTFLOWS FROM INVESTING (58,702,725,257) (78,602,842,420)ACTIVITIES
Increase of financial institution deposits 53,545,172,447 76,095,000,000
Decrease from sales of fair value financial 975,013,046 265,529,823Liabilities
Increase of gain and loss realized financial0asset
Increase of long-term guarantee deposits 568,099,549 63,721,000
Acquirement of financial asset50,668,740 0available for sale
Purchase of financial assets held to maturity 334,070,000 172,490,000
Purchase of property, plant and equipment 1,432,416,279 1,391,053,888
Purchase of intangible assets 1,797,285,196 615,047,709
Ⅲ CASH FLOWS FROM FINANCING ACTIVITIES (2,633,437,544) (2,680,424,879)
1. CASH INFLOWS FROM FINANCING ACTIVITIES 14,837,569,321 1,614,190,743
Increase fo short term borrowings 14,827,569,321 1,614,190,743
Increase fo long term borrowings 10,000,000 0
2. CASH OUTFLOWS FROM FINANCING (17,471,006,865) (4,294,615,622)ACTIVITIES
Repayments of short term borrowings 14,013,838,065 1,053,086,822
Acquirement of subsidiary equity 215,640,000 0
Dividends paid 3,241,528,800 3,241,528,800
Ⅳ CASH INCREASE(DECREASE) FROM15,383,538,581 11,063,082,106CHANGE OF COSOLIDATED RANGE
Ⅴ CASH AND CASH EQUIVALENTS AT30,578,045,692 19,845,568,759BEGINNING OF PERIOD
Ⅵ EFFECT OF EXCHANGE RATE CHANGES432,365,569 (330,605,173)ON CASH
Ⅶ CASH AND CASH EQUIVALENTS AT 46,393,949,842 30,578,045,692END OF PERIOD
G2R 2014AR_(내지)_*G2R 2009AR_(내지) 15. 3. 3. 오전 11:17 페이지 77

G2R 2014AR_(내지)_*G2R 2009AR_(내지) 15. 3. 3. 오전 11:17 페이지 78


![모바일게임 140317 editing 수정 editing f fhome.imeritz.com/include/.../[Mobilegame_140320]김동희_48_산업분석_인터넷_SW.pdf모바일게임 업종의 주가는 연초](https://img.pdfslide.tips/doc/110x75/5d677ef688c993d4378b864a/-140317-editing-editing-f-fhome-mobilegame14032048swpdf.jpg)