Embed Size (px)
Citation preview
Bergur Sigfússon
Andreas Uihlein
2015 JRC Geothermal Energy Status Report
2015
Technology, market and eco-
nomic aspects of geothermal
energy in Europe
EUR 27623 EN
This publication is a Science for Policy report by the Joint Research Centre, the European Commission’s in-house science service. It aims to
provide evidence-based scientific support to the European policy-making process. The scientific output expressed does not imply a policy
position of the European Commission. Neither the European Commission nor any person acting on behalf of the Commission is responsible
for the use which might be made of this publication.
This publication is a re-edition (original Publications Office Catalogue Number LD-NA-27623-EN-N). The modifications are on figure 9 and
page 17.
JRC Science Hub
https://ec.europa.eu/jrc
JRC99264
EUR 27623 EN
PDF ISBN 978-92-79-54048-6 ISSN 1831-9424 doi:10.2790/959587
Print ISBN 978-92-79-54049-3 ISSN 1018-5593 doi:10.2790/757652
© European Union, 2015
Reproduction is authorised provided the source is acknowledged.
Printed in The Netherlands
How to cite: Bergur Sigfusson, Andreas Uihlein; 2015 JRC Geothermal Energy Status Report; EUR 27623 EN; doi: 10.2790/757652
All images © European Union 2015.
Contact information
Andreas Uihlein
Address: Joint Research Centre, P.O. Box 2, 1755 ZG Petten, The Netherlands
E-mail: [email protected]
Tel.: +31 224 56 5123
Abstract
This report presents the current status of the major geothermal energy technologies ranging from ground source heat pump systems, direct
use facilities to geothermal power plants. Power production from hydrothermal resources where natural permeability coincides with hot
bedrocks is a mature technology. The same is true for direct use systems and ground source heat pumps. Power and heat production from
engineered geothermal systems where there is either a lack of thermal convection or where permeability has to be artificially created is
less mature and needs further development and support. Currently, geothermal energy provides 0.2 % of EU final electricity demand. In
addition, about 36000 GWh of heat are produced by direct use systems and ground source heat pumps. In order to expand the potential for
geothermal power production, focus should be made on facilitating the deployment of engineered geothermal systems. A special chapter in
this year's edition gives an overview of past and current engineered geothermal systems projects worldwide and identifies issues needed to
overcome in order to enable further deployment of the technology. Increased deployment may be achieved by first proofing the applicability
of the method in various geological media, followed by decreasing the risk of project failure by continuous development on reservoir
identification, stimulation and management methods, both leading to higher chance of more favourable financing. The advances should
progress alongside development of cheaper drilling technologies. Finally there is a need for increasing public awareness of the technology.
Joint Research Centre
2015 JRC Geothermal Energy Status Report
Joint Research Centre
Institute for Energy and Transport
Bergur Sigfússon & Andreas Uihlein
2015
1
TABLE OF CONTENTS
1 INTRODUCTION 7
2 TECHNOLOGY STATUS AND DEVELOPMENT 9
2.1 Power Production 9
2.1.1 Heat to power conversion cycles 9
2.1.2 Drilling methods 9
2.1.3 Drilling technologies and completion 10
2.1.4 Heat exchangers 10
2.1.5 Emission abatement systems 10
2.1.6 Re-injection 11
2.1.7 Flexible generation of electricity 11
2.2 Direct use 11
2.3 Shallow geothermal 12
3 MARKET STATUS AND DEVELOPMENT 13
3.1 Deployment trends 13
3.2 Geothermal power 13
3.2.1 Power turbines 13
3.2.2 Power production 14
3.2.3 Power production targets 15
3.2.4 Market projections and outlook 16
3.3 Direct use 17
3.4 Ground Source Heat Pumps (GSHP) 18
4 ECONOMIC ASPECTS AND COST COMPONENTS 20
4.1.1 Flash power plants from a hydrothermal reservoir 20
4.1.2 ORC hydrothermal power plant 21
4.1.3 ORC EGS Power plant 22
5 POLICY SUPPORT AND POLICY FRAMEWORK 24
5.1.1 Geothermal power 24
5.1.2 Direct use and GSHP 24
6 ENGINEERED GEOTHERMAL SYSTEMS 26
6.1 Overview of EGS projects 26
6.2 EGS projects 28
6.2.1 France 28
6.2.2 France/Germany 28
6.2.3 Germany 29
2
6.2.4 Hungary 32
6.2.5 Switzerland 32
6.2.6 Austria 33
6.2.7 United Kingdom 34
6.2.8 Sweden 35
6.2.9 United States 35
6.2.10 El Salvador 37
6.2.11 Australia 38
6.2.12 Japan 39
6.3 Current challenges and possible bottlenecks of EGS 40
6.3.1 Estimate of resource potential 41
6.3.2 Drilling risks and costs 42
6.3.3 Reservoir stimulation and management 42
6.3.4 Recommendations on EGS 45
7 CONCLUSIVE REMARKS 47
8 REFERENCES 48
3
LIST OF FIGURES
Figure 1 Global installed geothermal capacity in 2015 13
Figure 2 Global installed geothermal capacity in top 15 countries in 2015 according to country13
Figure 3 Installed capacity for power generation and new additions in Europe according to turbine manufacturer 14
Figure 4 Installed capacity for power generation and new additions in Europe according to technology 14
Figure 5 Global geothermal power production between 2005 and 2014 14
Figure 6 Electricity generation from geothermal energy in Europe 15
Figure 7 Expected geothermal electricity production in the EU28 from 2020 to 2050 16
Figure 8 Expected installed geothermal power capacity in the EU28 from 2020 to 2050 16
Figure 9 Use of geothermal potential in the EU28 in 2050 17
Figure 10 Scenario analysis of perceived risk 17
Figure 11 CAPEX breakdown of a hydrothermal flash power plant 20
Figure 12 CAPEX break down for ORC hydrothermal power plant 21
Figure 13 CAPEX break down for ORC EGS power plant 22
Figure 14 Number of EGS projects according to country 26
Figure 15 Levelised costs of electricity of EGS systems according to components. Left: 7 % discount rate, middle: 12 % discount rate, right: variable discount rates 41
Figure 16 The flow path of geothermal fluid during operation of an EGS system. See text for explanations. 45
4
LIST OF TABLES
Table 1 Geothermal energy in the EU: NREAP targets and progress 15
Table 2 Installed geothermal power production capacity in the EU in MW: NREAP targets and progress 15
Table 3 Geothermal direct use in the EU in GWh: NREAP targets and progress 18
Table 4 Heat production from GSHP in the EU in GWh: NREAP targets and progress 18
Table 5 Indicators for a flash power plant extracting fluid from hydrothermal system at 2.5 km depth 20
Table 6 Learning curve for CAPEX of ORC hydrothermal power plant 21
Table 7 CAPEX shares in % for ORC hydrothermal power plant 21
Table 8 Overview of CAPEX and OPEX values for the ORC hydrothermal power plant 22
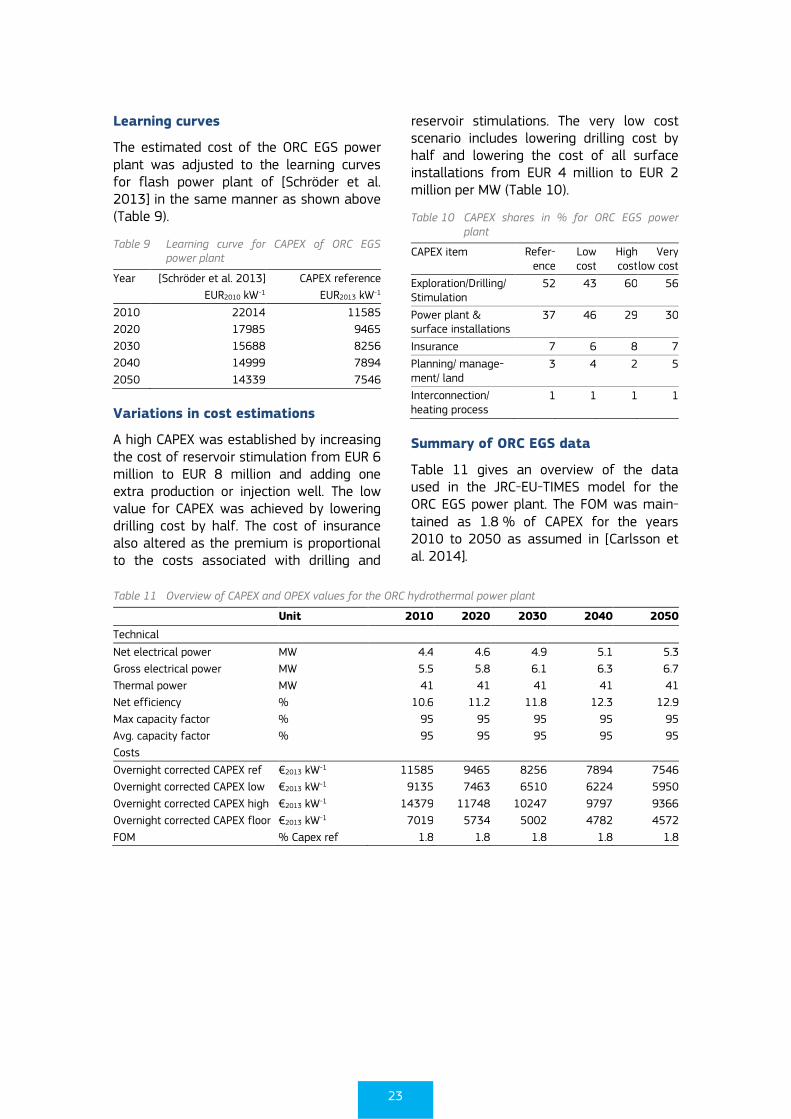
Table 9 Learning curve for CAPEX of ORC EGS power plant 23
Table 10 CAPEX shares in % for ORC EGS power plant 23
Table 11 Overview of CAPEX and OPEX values for the ORC hydrothermal power plant 23
Table 12 FIT and FIP for geothermal electricity in the EU 24
Table 13 Support schemes for geothermal heat in the EU 25
Table 14 EGS project overview 27
Table 15 Project overview of Le Mayet 28
Table 16 Project overview of Soultz-sous-Forêts 28
Table 17 Project overview: Geostras 28
Table 18 Project overview: Bruchsal 29
Table 19 Project overview: Bad Urach 29
Table 20 Project overview: Landau 30
Table 21 Project overview: Groß-Schönebeck 30
Table 22 Project overview: GeneSys 30
Table 23 Project overview: Insheim 31
Table 24 Project overview: Mauerstetten 31
Table 25 Project overview: Unterhaching 31
Table 26 Project overview: Falkenberg 32
Table 27 Project overview: Szeged 32
Table 28 Project overview: Basel 32
Table 29 Project overview: St. Gallen 33
Table 30 Project overview: Altheim 33
Table 31 Project overview: Eden 34
Table 32 Project overview: Redruth 34
5
Table 33 Project overview: Rosemanowes 34
Table 34 Project overview: Fjällbacka 35
Table 35 Project overview: Southeast Geysers 35
Table 36 Project overview: Fenton Hill 35
Table 37 Project overview: Newberry Volcano 36
Table 38 Project overview: Northwest Geysers 36
Table 39 Project overview: Raft River 36
Table 40 Project overview: Bradys 37
Table 41 Project overview: Desert Peak 37
Table 42 Project overview: Coso 37
Table 43 Project overview: Berlín 37
Table 44 Project overview: Hunter valley 38
Table 45 Project overview: Paralana 38
Table 46 Project overview: Cooper Basin 39
Table 47 Project overview: Hijiori 39
Table 48 Project overview: Ogachi 40
6
ACRONYMS AND ABBREVIATIONS
CAPEX Capital expenditure
CF Capacity factor
COP Coefficient of performance
DOE-GTO US Department of Energy Geothermal Technologies Office
EGEC European Geothermal Energy Council
EGS Engineered Geothermal System or Enhanced Geothermal System
ESCO Energy Service Companies
EU European Union
FIP Feed-in-premium
FIT Feed-in-tariff
GSHP Ground Source Heat Pump
HSA Hot Sedimentary Aquifer
LCOE Levelised cost of energy
MS Member State
NREAP National Renewable Energy Action Plan
OPEX Operating expenditure
ORC Organic Rankine Cycle
PDC Polycrystalline diamond compact bits
R&D Research and Development
RD&D Research, Development and Deployment
ROP Rate of penetration
RSS Rotary steerable systems
TD Total depth
WSA Wet sulphuric acid process
7
1 INTRODUCTION
This report is an update of the 2014 JRC Geothermal Energy Status Report by the Joint Research Centre's Institute for Energy and Transport. While the 2014 report gave an overview of the geothermal sector in the EU, including technology descriptions, this second version focuses more on identification of research needs as well as market status, developments and outlook. Finally a special chapter is provided on Engineered Geother-mal Systems (EGS).
Geothermal energy is derived from the ther-mal energy generated and stored in the earth interior. The energy is accessible since groundwater transfers the heat from rocks to the surface either through bore holes or natural cracks and faults. The geothermal resource is a renewable resource because there is a constant heat flow to the surface and atmosphere from the immense heat stored within the earth while the groundwater transferring the heat is replenished by rainfall and circulation within the crust. Geothermal energy is a commercially proven renewable form of energy that can provide constant power and heat.
The geographical distribution of heat within the Earth's crust is highly variable. Highest heat gradients are observed in areas associ-ated with active tectonic plate boundaries and volcanism.
A hot rock formation with natural fractures and or porous structure where water can move due to convection is termed hydrother-mal reservoir. The technologies associated with hydrothermal power and heat production may be considered as mature. A hot sedimen-tary formation where there is no natural convection and heat is distributed by conduc-tion is on the other hand termed Hot Sedi-mentary Aquifer (HSA) which is a sub-category of Engineered Geothermal Systems (EGS). A hot crystalline rock formation with insufficient or little natural permeability or fluid saturation that needs to be stimulated to allow for movement of water is termed petrothermal EGS. In HSA and petrothermal EGS, fluid is injected into the subsurface
where it is heated up on its way to production wells that divert the hot water to power and heat production facilities before it is re-injected to start another cycle. The EGS tech-nologies are proven on small scale since 2007 but are still in development process. To date, the large majority of geothermal energy stems from hydrothermal resources whereas one petrothermal EGS and three HSA EGS in operation exist within the EU.
The geologic potential (heat in place) for geothermal power in Europe and the World is very large and exceeds the current electricity demand in many countries. However only a small portion of the heat in place can be realistically extracted for power production and the heat in place is therefore often trans-lated to economic potential using levelised cost of energy (LCOE). The geothermal energy potential using LCOE value less than 150 EUR/MWh in 2020 is 21.2 TWh which is con-siderably higher than the planned 11 TWh production in the EU member states (MS) according to their National Renewable Energy action plan (NREAP) for the same year. For 2030, using LCOE of 100 EUR/MWh, the economic potential amounts to 34 TWh or 1 % of the projected total electricity produc-tion in the EU [van Wees et al. 2013]. The same authors estimated the economic poten-tial to grow to 2570 TWh in 2050 (as much as 50 % of the electricity produced in the EU) mainly due to economies of scale and innova-tive drilling concepts [van Wees et al. 2013]. However, innovative drilling concepts not relying on mechanical drilling have been in development for many years and to date, none has been demonstrated to reach the depth needed for high temperature geother-mal applications and it is clear that EGS have to be demonstrated more fully before the 2030 and 2050 predictions are realised.
Hydrothermal resources are categorised into low (<100 °C), medium (100 – 180 °C) and high (>180 °C) enthalpy resources. In addition to the geothermal resources mentioned above, use of supercritical unconventional resources (temperature > 374 °C and pres-
8
sure > 222 bar referring to pure water) is under investigation through the Icelandic Deep Drilling Project and the more recent DESCRAMBLE project.. The process involves transferring supercritical fluids to the surface and converting all the mass flow (compared to 20-30 % for flash power plants) into superheated steam thus increasing the over-all efficiency of the process [Friðleifsson et al. 2014].
Due to their tectonics, hydrothermal reser-voirs tend to be fractured, therefore facilitat-ing movement of water that can be extracted through production wells to the surface either to turn turbines or for direct use for heating. In addition to electricity production, the ther-mal capacity of the ground can provide heat-ing or cooling with the aid of ground source heat pumps either extracting heat from shallow soils or deeper boreholes.
Geothermal energy provides an opportunity to be exploited by cascade utilisation (stepwise usage at progressively lower temperatures) and therefore increase the total efficiency which results in economic benefits. The most important cascade applications present in today's market are power generation, district heating and cooling, industrial processing, greenhouses, fisheries, de-icing, and spa bathes.
Geothermal power and heat installations draw their energy from resources of variable depths and temperatures. So far, no general
consensus has been agreed on how to classi-fy geothermal heat sources and production. In this report, when reporting on production values, the following classification according to [Antics et al. 2013] and Directive 2009/28/EC [EU 2009] which has been adopted by Eurostat and national statistics offices, will be used:
Power generation
Direct use
Ground source heat pumps
The report aims to highlight R&D challenges of the different sectors of the geothermal industry in Europe. Chapter 2 describes briefly the sub-technologies and identified R&D opportunities. Chapter 3 describes the EU market status, targets and projections. Chapter 0 analyses the economic aspects and implications: cost aspects focus on capital costs (CAPEX), the operational expenditure (OPEX), and the resulting cost of the energy produced. Chapter 5 investigates EU policies related to geothermal energy. Chapter 6 describes past and current EGS projects worldwide and identifies issues needed to be overcome enabling large scale deployment of the technology. The reader is referred to the 2014 JRC Geothermal Status Report for more detailed descriptions of technologies and environmental impact associated with geo-thermal energy utilization.
9
2 TECHNOLOGY STATUS AND DEVELOPMENT
2.1 Power Production
The world average geothermal power plant's annual capacity factor (CF) is esti-mated at 70-80%. Even higher values up to 97-98 % might be achieved, but with in-creased maintenance costs; which might be compensated by higher-priced electricity.
2.1.1 Heat to power conversion cycles
The efficiency of the heat to power conver-sion cycle and the parasitic load and pump demand play an important role when esti-mating the economic factors under different conditions and the terms of reference should be established when collecting and comparing data from different authors. Dry steam power plants have the highest effi-ciency among all geothermal power plants, reaching values of 50-70 % [DiPippo 2012]. The single-flash and dual-flash power plants reach efficiencies between 30–35 % and 35–45 %, respectively when electricity is the sole product. The overall efficiency is greatly increased by adding heat exchang-ers and producing hot water since the conversion factor in a heat exchanger is far greater than converting heat to electricity. The ORC binary plants can reach efficiencies between 25 % and 45 % [Emerging Energy Research 2009]. The kalina binary cycle can, under certain design conditions, operate at higher cycle efficiencies of between 30 % and 65 % [Emerging Energy Research 2009]. Efficiency is largely determined by the reservoir temperature but R&D efforts that enable efficiency of the conversion process include better heat exchangers and the nozzles. Efficiency enhancements are not a priority of the sector.
2.1.2 Drilling methods
Drilling represents 30 % to 50 % of the cost of a hydrothermal geothermal electricity project and more than half of the total cost
of EGS. Lowering drilling costs is therefore a key issue for reducing the capital invest-ment and operation costs of geothermal power plants. The established deep drilling technique is the rotary drilling. Tri-cone rotary bits were introduced in 1909 and supplemented in the 1970s by the polycrys-talline diamond bit which has until now not been widely adopted by the geothermal industry.
Geothermal drilling benefits from on-going industry improvements. Examples are the placement of casings while drilling in the 1950s; top drive power swivels, air/foam balanced drilling, and polycrystalline dia-mond compact (PDC) bits in the 1970s; micro drill and coiled tubing in the 1980s; and horizontal drilling, reverse circulation cementing, logging while drilling, and envi-ronmentally safe fluid formulations since the 1990s.
Despite these improvements, drilling costs continue to be high and therefore consider-able emphasis has been placed on the development of new drilling technologies [Dumas et al. 2013]. The development of new drilling methods is ongoing. They include: jetting (high performance/mud jet bits), thermal drilling (spallation, molten ion penetration, plasma bit), direct stream, millimetre wave, high voltage electro im-pulses. Many of those new methods have been demonstrated in the laboratory but not under field conditions at significant depths.
Currently, two projects focusing on deep drilling are operating within the Horizon 2020 framework. The DESCRAMBLE project1 drills into super-critical conditions and studies drilling components as well as well completion materials, design and control. The Thermodrill project combines conven-tional rotary drilling with water jetting with the aim of achieving 50 % faster drilling in
1 www.descramble-h2020.eu
10
hard rock in addition to reduce costs by 30 % as well as reducing induced seismicity risks. Both projects started in 2015.
2.1.3 Drilling technologies and comple-
tion
High mass flows and therefore high volume flows necessitate large diameter wells for geothermal energy production. High tem-peratures in geothermal reservoirs also call for alternate equipment to that routinely used in the oil and gas industry. As geo-thermal wells, particularly those for EGS systems tend to be several km deep the need for technologies minimising tripping times are necessary to keep costs down. Casing drilling minimises tripping times due to pulling and running of the drill string and has been applied when problems are ex-pected but does not offer faster rate of penetration (ROP) than conventional drilling. Coil tubing drilling offer fast drilling process with shorter tripping times but is limited by depth. The current challenges facing the drilling industry are not technical but com-mercial. Drilling days have been reduced towards lowering costs but completion costs are still expensive and can be lowered by decreasing complexity and more standardi-sation of well components. A more thorough description of this highly important aspect of geothermal plants may be found in Section 6.3.2 and Section 6.3.3.
Developments are ongoing towards fully automated drill rigs leading to less person-nel risk and decreased drilling duration. Finally, it is anticipated that geothermal drilling will start using rotary steerable systems (RSS) adopted from the Oil and Gas industry in facilitating extended reach drilling and/or deeper directional wells.
2.1.4 Heat exchangers
In geothermal power plants, a range of heat exchangers can be installed, fulfilling vari-ous tasks such as pre-heating, and super-heating and serving as evaporator or con-denser.
Heat exchangers frequently come in contact with corrosive fluids at high temperatures in geothermal plants. The development of heat exchangers from new materials is men-tioned as a key action that may benefit several technologies (solar thermal and hybrid plants, CHP, fuel cells) in the Inte-grated Roadmap of the SET-Plan.
2.1.5 Emission abatement systems
Gases that do not condense with the steam in the power plant's condensers are referred to as non-condensable gases (NCG). The main NCG species in geothermal steam are carbon dioxide (CO2) and hydrogen sulphide (H2S). Ammonia (NH4) is often absent but may be up to 10 vol. % in the steam. Small-er amounts of H2, N2, Ar, CH4, CO and Hg may exist among the emitted gases.
Of these gases, H2S is the gas of highest concern due to its toxic nature and there-fore emphasis will be made on H2S abate-ment systems. Depending on site specific factors, a specific process may have to be incorporated into the plant process to re-move H2S from the emissions stream.
Many technologies exist for removing H2S from gases and the selection of technology depends on gas amount and composition and the level of H2S removal required. These include liquid redox sulphur recovery processes (e.g. Stretford, LO-CAT), the modified Claus process (gas phase oxida-tion), burn/scrub processes, burn/vent pro-cesses, amines and physical solvents, scrubbing H2S with caustic soda, scrubbing with other alkaline earth minerals, wet sulphuric acid process (WSA), AMIS (Mercury and H2S removal), direct acid gas injection, Paques/thiopac, ThioSolv, Biox and water adsorption and injection. These technologies are of different maturity, some have been developed for other industries and modified for the geothermal industry and others are developed within the geothermal industry. Recently ENEL Green Power completed the installation their patented AMIS system to all its geothermal power plants in Tuscany reducing H2S and Hg emissions with effi-ciency exceeding 95%.
11
The development emphasis is on process optimisation to minimize chemical additions (primarily for pH adjustments) and to treat gas streams to minimize the degrading of adsorbents.
2.1.6 Re-injection
Geothermal energy is regarded a renewable resource. However, the resource may be overexploited if there is no balance between production and inflow into the resource. The optimum level of long-term sustainable production depends on the resource charac-teristics. The production and re-injection may have to be amended during the pro-duction history and new wells (both produc-tion and re-injection wells) are often drilled in strategic locations as better understand-ing is gained on the geothermal resource behaviour. The production and re-injection rate is then controlled to prevent the ad-verse effects of premature pressure and temperature declines. The resource behav-iour should therefore be monitored by the operators. The resource is frequently moni-tored by geochemical tracers, seismicity, reservoir pressure and temperature as well as micro-gravity. Results from these moni-toring tools are then fed into reservoir simulation models which aid in planning the exploitation of the resource and predicting its behaviour in the future.
Research efforts concentrate on maintain-ing continuous flow rate without the need of maintaining abnormally high wellhead pressures. Prevention of mineral scaling in the reservoir immediately adjacent to re-injection wells is important. Temperature adjustment (for thermal fracture stimula-tion and control of the fluid chemistry have to be studied in conjunction to the overall reservoir characteristics (thermal sweep area, active reservoir volume) to enable optimal management of the reservoir.
2.1.7 Flexible generation of electricity
The large scale deployment of intermittent power sources such as wind and solar PV calls for measures to stabilise electricity
grids. Geothermal EGS-ORC power plants offer the possibility to provide such stabili-sation.
EGS are not weather dependent such as other renewable energy sources and can therefore provide base load to the system. In Hawaii, there exists a hydrothermal plant that can be adjusted from 22-38 MW [GEA 2015] although the flexibility of combined heat and power plants can be tested further [JRC 2014]. EGS plants rely on pumps to circulate fluids mining heat from the ground and ORC is always used for power conver-sion. In ORC plants, the ramp rate may be as high as 30 % of nominal power per minute. Currently, nearly all geothermal plants are operated as base load plants [GEA 2015] since a) sufficient economic considerations have not been offered to ensure acceptable return on investment according to industry survey and b) more research and development is needed to couple geothermal power production with energy storage technology (in other words store heat in the underground for later usage). For dispatchable power, future contracts need to encourage geothermal operators to offer flexibility in power deliv-ery, enabling it to compete with natural gas power plants [GEA 2015].
2.2 Direct use
Direct use applications of geothermal fluids range in temperatures from few degrees C to 150 °C. Different categories of direct use exist, for example: space and district heat-ing, greenhouse heating, aquaculture pond heating, agricultural drying, industrial uses, cooling, snow melting, bathing and swim-ming [Lund 2011]. The main applications worldwide are bathing & swimming and space/district heating.
For heating, direct use applications depend on technical advances of heat exchangers in other sectors as the geothermal fluids are often not suitable to be distributed to dis-trict heating networks.
Concerning the development of the technol-ogy, already in 1984, Gudmundsson stated
12
”the technology of direct applications is available and should not be a barrier to further developments” [Gudmundsson 1985]. Standard equipment is being used for direct use projects. Recently, [Blanco Ilzarbe et al. 2013] found that there are not many new patents in the area of direct use besides some developments regarding integration of geothermal energy use in buildings.
At the moment, district heating systems is the geothermal sector with the most dy-namic development [EGEC 2013a]. Newer developments include concepts to extend lifetime of doublet design projects by drill-ing a third production well and converting the former two wells into injection wells (triplet system). This concept, mainly applied in France, can allow for 30 additional years of use of the geothermal resource [EGEC 2013a]. Concerning new space/district heating systems, more and more triplet systems are installed. Also smaller systems are becoming more common with shallower resources, sometimes used in combination with large heat pump systems [EGEC 2013a]. More recently, geothermal re-sources of low to medium temperature are now used for combined heat and power production with a binary cycle power plant first and subsequent direct use, which also improves the economics of geothermal projects [Lund 2011].
2.3 Shallow geothermal
Ground source heat pumps (GSHP) use shallow geothermal energy which is availa-ble almost everywhere. They convert the low temperature geothermal energy to thermal energy at a higher temperature which can be used for space or water heat-ing [Ochsner 2008]. Usually, a refrigerant is used as the working fluid in a closed cycle [Self et al. 2013]. An antifreeze solution is circulated inside a closed coil and exchang-es heat with the heat source/sink through the ground heat exchanger.
Electric energy is used to drive the com-pressor and the efficiency of the perfor-
mance of a heat pump is measured by calculating the ratio of delivered to used energy which is the coefficient of perfor-mance (COP) [Ochsner 2008, Vellei 2014].
The COP depends on the temperature dif-ference between heat source and heat sink. The smaller the temperature difference, the more efficient the heat pump will be. GSHP usually have a COP in the range of 3-4 but can reach even up to 6 when well-designed [Goldstein et al. 2011, Puttagunta & Shapiro 2012, Carlsson et al. 2013].
Despite the successes in the past and continuous growth, RD&D in GSHP is focus-sing on further increasing the efficiency of GSHP systems and reducing costs [Angelone & Labini 2014a]. The main development areas include ease of maintenance and repair, improved control systems, more efficient working fluids, and increased efficiency of auxiliaries such as pumps and fans [Angelone & Labini 2014a]. Ground collectors should be improved by optimisa-tion of design and grouting material [RHC 2014]. Currently mainly plastic tubes are used for ground collectors which offer low cost and corrosion resistance but show low thermal conductivity [Angelone & Labini 2014b].
The Geothermal Energy Roadmap of the European Technology Platform on Renewa-ble Heating & Cooling recommends the development of new antifreeze fluids that are environmentally benign, and offer better thermal characteristics than current fluids [RHC 2014]. It is anticipated these above-mentioned advances can increase the efficiency of GSHP systems. The borehole thermal resistance (Rb) Performance Indica-tor has been reduced by more than 40 % over the last ten years. The overall impact of this value to a defined shallow geother-mal system is given by the Hellström-efficiency, which increased from below 60 % to about 75 % in state-of-the-art installations over the past 10 years. There is still room for improvement, so provided the technology progress is continued, efficien-cies of about 80 % in 2020 seem achieva-ble [JRC 2014].
13
3 MARKET STATUS AND DEVELOPMENT
3.1 Deployment trends
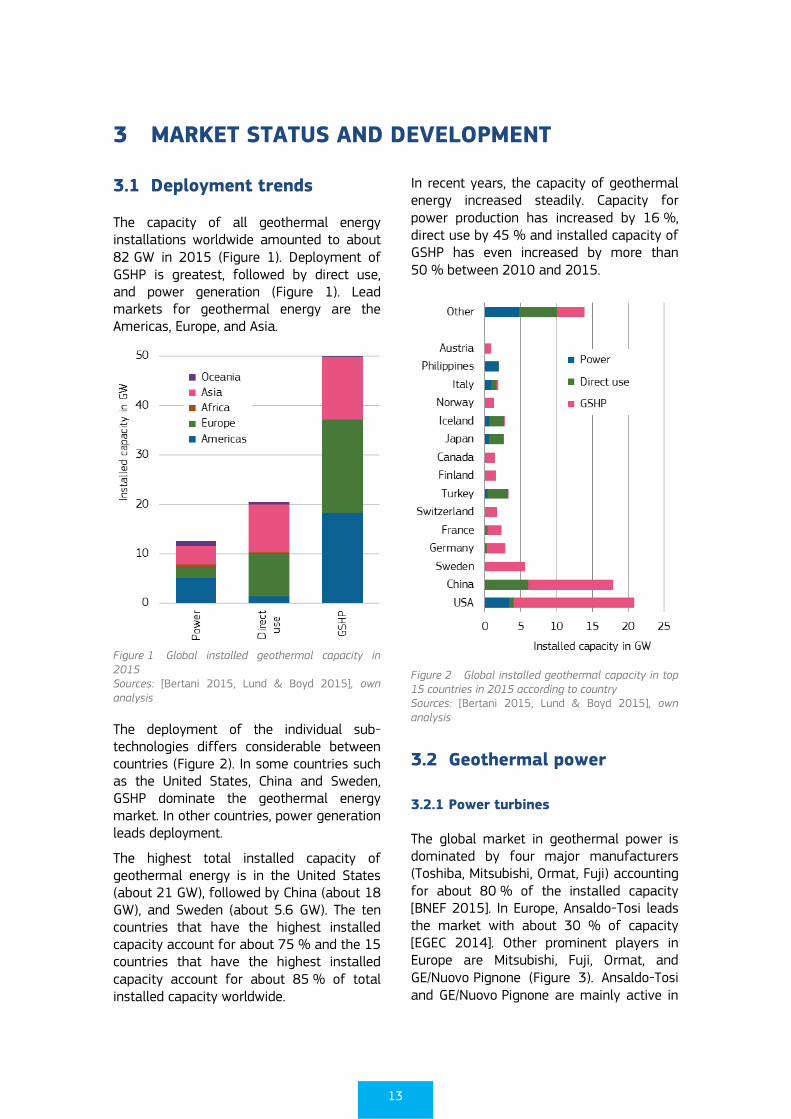
The capacity of all geothermal energy installations worldwide amounted to about 82 GW in 2015 (Figure 1). Deployment of GSHP is greatest, followed by direct use, and power generation (Figure 1). Lead markets for geothermal energy are the Americas, Europe, and Asia.
Figure 1 Global installed geothermal capacity in 2015 Sources: [Bertani 2015, Lund & Boyd 2015], own analysis
The deployment of the individual sub-technologies differs considerable between countries (Figure 2). In some countries such as the United States, China and Sweden, GSHP dominate the geothermal energy market. In other countries, power generation leads deployment.
The highest total installed capacity of geothermal energy is in the United States (about 21 GW), followed by China (about 18 GW), and Sweden (about 5.6 GW). The ten countries that have the highest installed capacity account for about 75 % and the 15 countries that have the highest installed capacity account for about 85 % of total installed capacity worldwide.
In recent years, the capacity of geothermal energy increased steadily. Capacity for power production has increased by 16 %, direct use by 45 % and installed capacity of GSHP has even increased by more than 50 % between 2010 and 2015.
Figure 2 Global installed geothermal capacity in top 15 countries in 2015 according to country Sources: [Bertani 2015, Lund & Boyd 2015], own analysis
3.2 Geothermal power
3.2.1 Power turbines
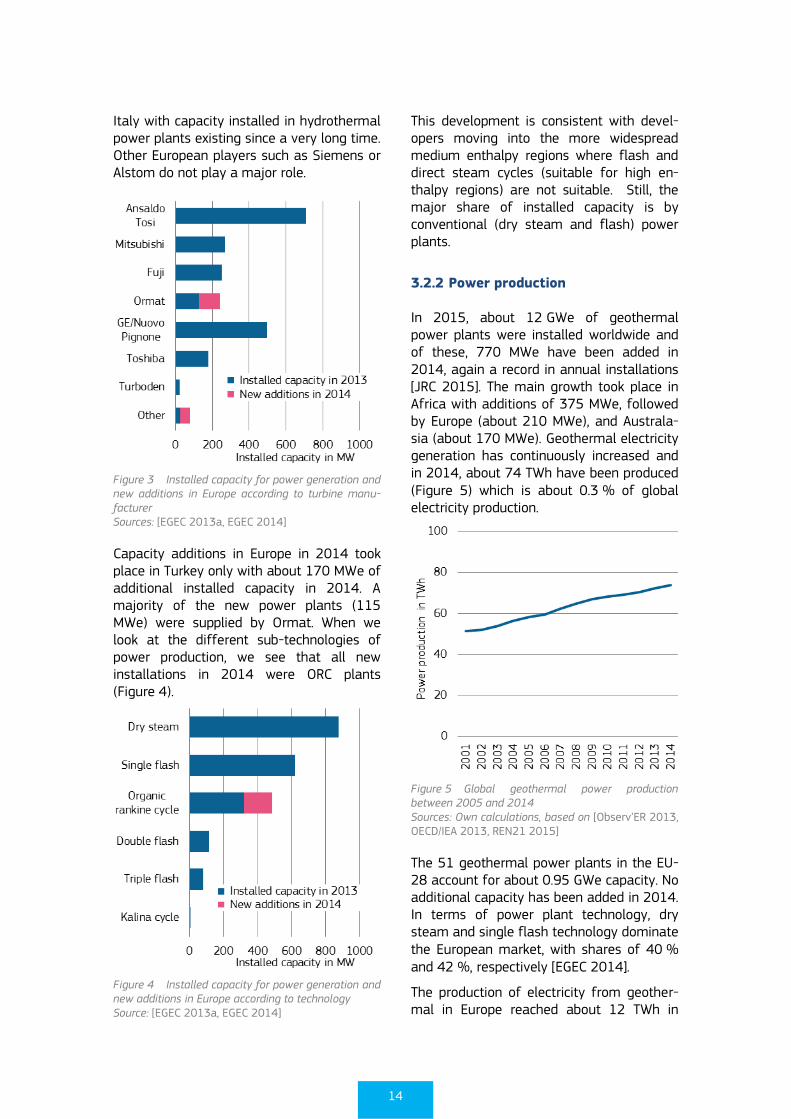
The global market in geothermal power is dominated by four major manufacturers (Toshiba, Mitsubishi, Ormat, Fuji) accounting for about 80 % of the installed capacity [BNEF 2015]. In Europe, Ansaldo-Tosi leads the market with about 30 % of capacity [EGEC 2014]. Other prominent players in Europe are Mitsubishi, Fuji, Ormat, and GE/Nuovo Pignone (Figure 3). Ansaldo-Tosi and GE/Nuovo Pignone are mainly active in
14
Italy with capacity installed in hydrothermal power plants existing since a very long time. Other European players such as Siemens or Alstom do not play a major role.
Figure 3 Installed capacity for power generation and new additions in Europe according to turbine manu-facturer Sources: [EGEC 2013a, EGEC 2014]
Capacity additions in Europe in 2014 took place in Turkey only with about 170 MWe of additional installed capacity in 2014. A majority of the new power plants (115 MWe) were supplied by Ormat. When we look at the different sub-technologies of power production, we see that all new installations in 2014 were ORC plants (Figure 4).
Figure 4 Installed capacity for power generation and new additions in Europe according to technology Source: [EGEC 2013a, EGEC 2014]
This development is consistent with devel-opers moving into the more widespread medium enthalpy regions where flash and direct steam cycles (suitable for high en-thalpy regions) are not suitable. Still, the major share of installed capacity is by conventional (dry steam and flash) power plants.
3.2.2 Power production
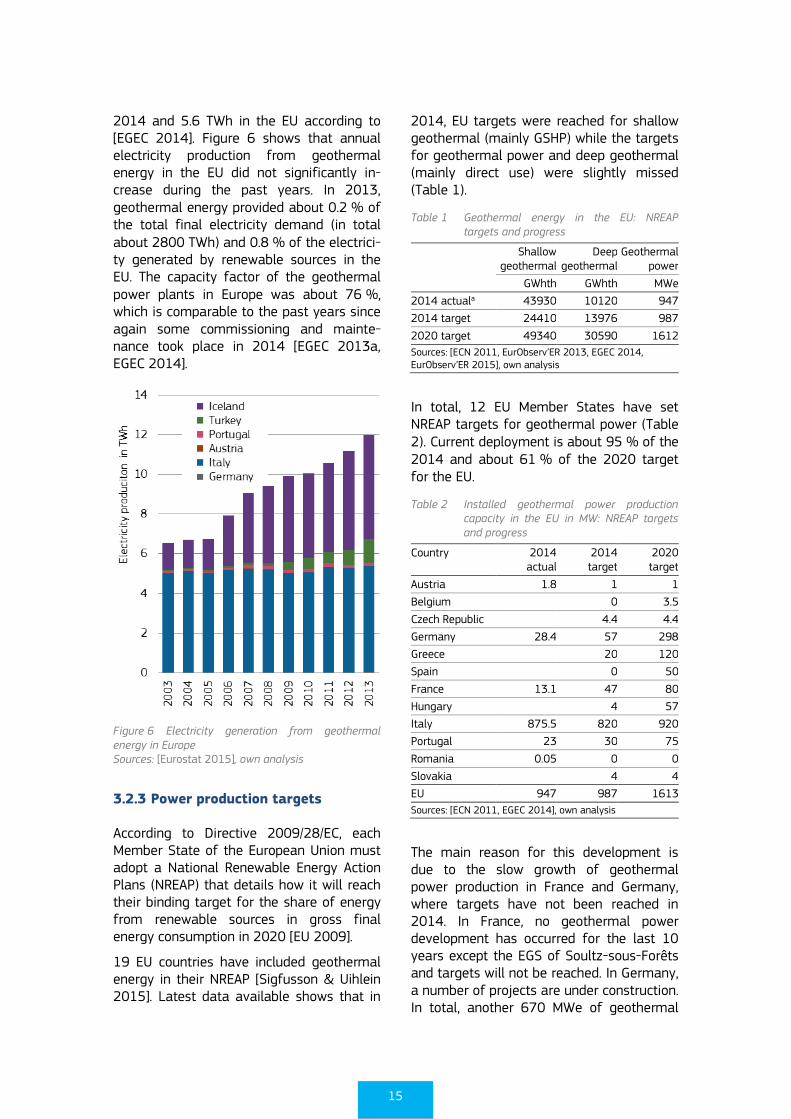
In 2015, about 12 GWe of geothermal power plants were installed worldwide and of these, 770 MWe have been added in 2014, again a record in annual installations [JRC 2015]. The main growth took place in Africa with additions of 375 MWe, followed by Europe (about 210 MWe), and Australa-sia (about 170 MWe). Geothermal electricity generation has continuously increased and in 2014, about 74 TWh have been produced (Figure 5) which is about 0.3 % of global electricity production.
Figure 5 Global geothermal power production between 2005 and 2014 Sources: Own calculations, based on [Observ’ER 2013, OECD/IEA 2013, REN21 2015]
The 51 geothermal power plants in the EU-28 account for about 0.95 GWe capacity. No additional capacity has been added in 2014. In terms of power plant technology, dry steam and single flash technology dominate the European market, with shares of 40 % and 42 %, respectively [EGEC 2014].
The production of electricity from geother-mal in Europe reached about 12 TWh in
15
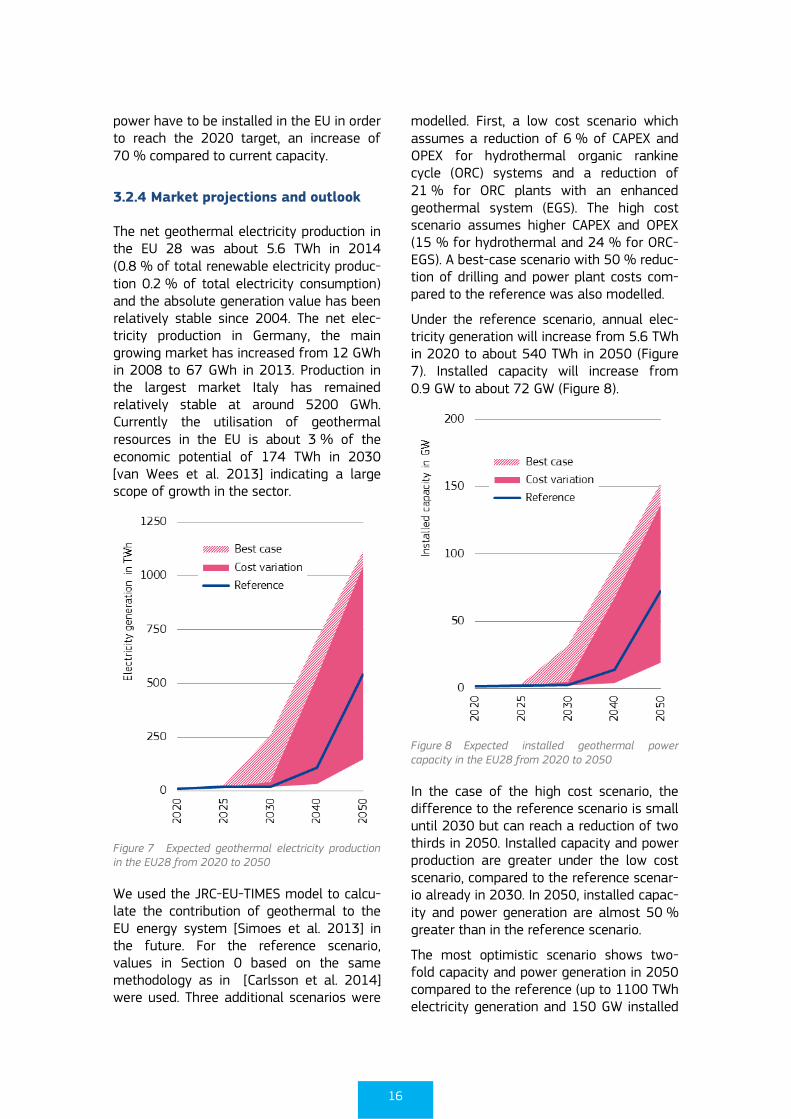
2014 and 5.6 TWh in the EU according to [EGEC 2014]. Figure 6 shows that annual electricity production from geothermal energy in the EU did not significantly in-crease during the past years. In 2013, geothermal energy provided about 0.2 % of the total final electricity demand (in total about 2800 TWh) and 0.8 % of the electrici-ty generated by renewable sources in the EU. The capacity factor of the geothermal power plants in Europe was about 76 %, which is comparable to the past years since again some commissioning and mainte-nance took place in 2014 [EGEC 2013a, EGEC 2014].
Figure 6 Electricity generation from geothermal energy in Europe Sources: [Eurostat 2015], own analysis
3.2.3 Power production targets
According to Directive 2009/28/EC, each Member State of the European Union must adopt a National Renewable Energy Action Plans (NREAP) that details how it will reach their binding target for the share of energy from renewable sources in gross final energy consumption in 2020 [EU 2009].
19 EU countries have included geothermal energy in their NREAP [Sigfusson & Uihlein 2015]. Latest data available shows that in
2014, EU targets were reached for shallow geothermal (mainly GSHP) while the targets for geothermal power and deep geothermal (mainly direct use) were slightly missed (Table 1).
Table 1 Geothermal energy in the EU: NREAP targets and progress
Shallow geothermal
Deep geothermal
Geothermal power
GWhth GWhth MWe
2014 actuala 43930 10120 947
2014 target 24410 13976 987
2020 target 49340 30590 1612
Sources: [ECN 2011, EurObserv’ER 2013, EGEC 2014, EurObserv’ER 2015], own analysis
In total, 12 EU Member States have set NREAP targets for geothermal power (Table 2). Current deployment is about 95 % of the 2014 and about 61 % of the 2020 target for the EU.
Table 2 Installed geothermal power production capacity in the EU in MW: NREAP targets and progress
Country 2014 actual
2014 target
2020 target
Austria 1.8 1 1
Belgium 0 3.5
Czech Republic 4.4 4.4
Germany 28.4 57 298
Greece 20 120
Spain 0 50
France 13.1 47 80
Hungary 4 57
Italy 875.5 820 920
Portugal 23 30 75
Romania 0.05 0 0
Slovakia 4 4
EU 947 987 1613
Sources: [ECN 2011, EGEC 2014], own analysis
The main reason for this development is due to the slow growth of geothermal power production in France and Germany, where targets have not been reached in 2014. In France, no geothermal power development has occurred for the last 10 years except the EGS of Soultz-sous-Forêts and targets will not be reached. In Germany, a number of projects are under construction. In total, another 670 MWe of geothermal
16
power have to be installed in the EU in order to reach the 2020 target, an increase of 70 % compared to current capacity.
3.2.4 Market projections and outlook
The net geothermal electricity production in the EU 28 was about 5.6 TWh in 2014 (0.8 % of total renewable electricity produc-tion 0.2 % of total electricity consumption) and the absolute generation value has been relatively stable since 2004. The net elec-tricity production in Germany, the main growing market has increased from 12 GWh in 2008 to 67 GWh in 2013. Production in the largest market Italy has remained relatively stable at around 5200 GWh. Currently the utilisation of geothermal resources in the EU is about 3 % of the economic potential of 174 TWh in 2030 [van Wees et al. 2013] indicating a large scope of growth in the sector.
Figure 7 Expected geothermal electricity production in the EU28 from 2020 to 2050
We used the JRC-EU-TIMES model to calcu-late the contribution of geothermal to the EU energy system [Simoes et al. 2013] in the future. For the reference scenario, values in Section 0 based on the same methodology as in [Carlsson et al. 2014] were used. Three additional scenarios were
modelled. First, a low cost scenario which assumes a reduction of 6 % of CAPEX and OPEX for hydrothermal organic rankine cycle (ORC) systems and a reduction of 21 % for ORC plants with an enhanced geothermal system (EGS). The high cost scenario assumes higher CAPEX and OPEX (15 % for hydrothermal and 24 % for ORC-EGS). A best-case scenario with 50 % reduc-tion of drilling and power plant costs com-pared to the reference was also modelled.
Under the reference scenario, annual elec-tricity generation will increase from 5.6 TWh in 2020 to about 540 TWh in 2050 (Figure 7). Installed capacity will increase from 0.9 GW to about 72 GW (Figure 8).
Figure 8 Expected installed geothermal power capacity in the EU28 from 2020 to 2050
In the case of the high cost scenario, the difference to the reference scenario is small until 2030 but can reach a reduction of two thirds in 2050. Installed capacity and power production are greater under the low cost scenario, compared to the reference scenar-io already in 2030. In 2050, installed capac-ity and power generation are almost 50 % greater than in the reference scenario.
The most optimistic scenario shows two-fold capacity and power generation in 2050 compared to the reference (up to 1100 TWh electricity generation and 150 GW installed
17
capacity). This means that achievements in the area of drilling technologies leading to lower drilling costs can have big impacts on the deployment of geothermal energy in the future.
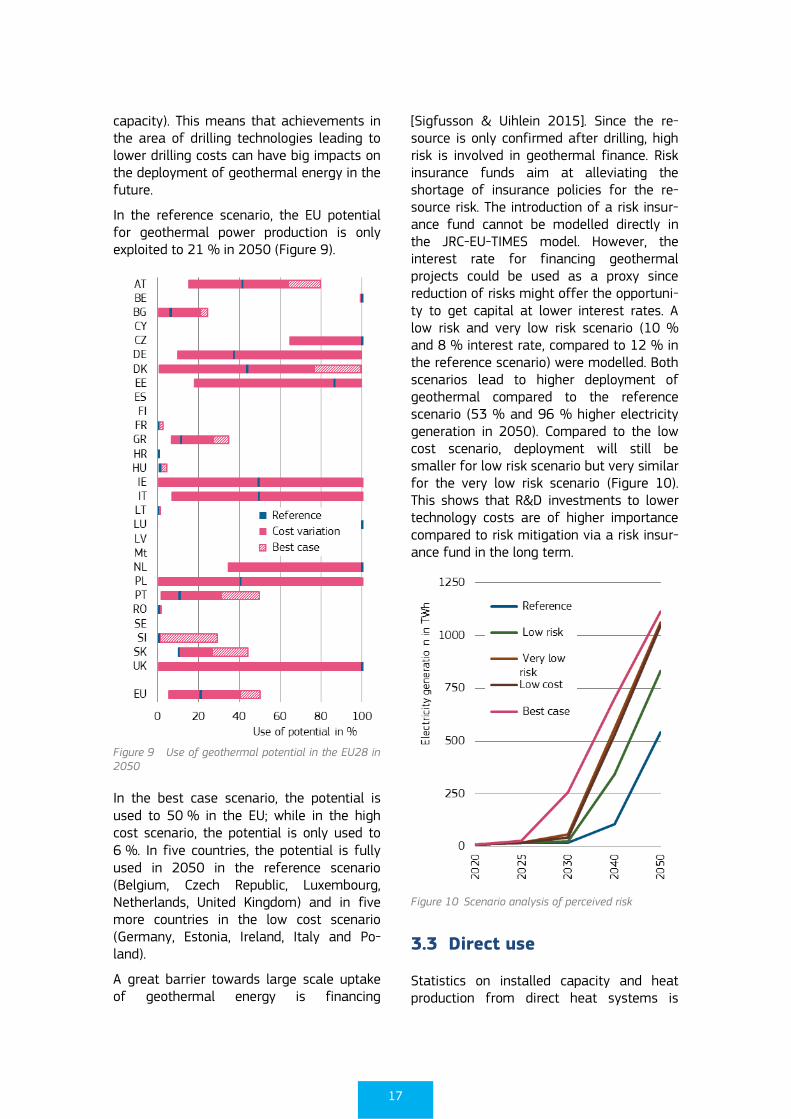
In the reference scenario, the EU potential for geothermal power production is only exploited to 21 % in 2050 (Figure 9).
Figure 9 Use of geothermal potential in the EU28 in 2050
In the best case scenario, the potential is used to 50 % in the EU; while in the high cost scenario, the potential is only used to 6 %. In five countries, the potential is fully used in 2050 in the reference scenario (Belgium, Czech Republic, Luxembourg, Netherlands, United Kingdom) and in five more countries in the low cost scenario (Germany, Estonia, Ireland, Italy and Po-land).
A great barrier towards large scale uptake of geothermal energy is financing
[Sigfusson & Uihlein 2015]. Since the re-source is only confirmed after drilling, high risk is involved in geothermal finance. Risk insurance funds aim at alleviating the shortage of insurance policies for the re-source risk. The introduction of a risk insur-ance fund cannot be modelled directly in the JRC-EU-TIMES model. However, the interest rate for financing geothermal projects could be used as a proxy since reduction of risks might offer the opportuni-ty to get capital at lower interest rates. A low risk and very low risk scenario (10 % and 8 % interest rate, compared to 12 % in the reference scenario) were modelled. Both scenarios lead to higher deployment of geothermal compared to the reference scenario (53 % and 96 % higher electricity generation in 2050). Compared to the low cost scenario, deployment will still be smaller for low risk scenario but very similar for the very low risk scenario (Figure 10). This shows that R&D investments to lower technology costs are of higher importance compared to risk mitigation via a risk insur-ance fund in the long term.
Figure 10 Scenario analysis of perceived risk
3.3 Direct use
Statistics on installed capacity and heat production from direct heat systems is
18
difficult to obtain and often not reliable. Data for this report was taken mainly from [Lund & Boyd 2015] which refers to in-stalled capacity and production in 2014.
The commissioning rate of new installations in the past was low leading to heat produc-tion of about 10120 GWhth in 2014 which is an increase of 720 GWhth or 8 % compared to 2012 (9400 GWhth). The most dynamic sector of direct use is still district heating systems where almost 80 MWth have been installed in Europe in the last year and total production reached about 4260 GWth [EGEC 2014] which is already about 40 % of total heat production from direct use systems.
Compared to geothermal power, more countries have included direct use in their NREAP (17 Member States). When we look at 2014 targets, only five countries (Austria, Bulgaria, Spain, Hungary and Slovakia) have reached their 2014 NREAP target. In terms of absolute distance to target, France (about 1760 GWh), Germany (about 1330 GWh), and the Netherlands (910 GWh) are furthest away from the 2014 target.
Table 3 Geothermal direct use in the EU in GWh: NREAP targets and progress
Country 2014 actual
2014 target
2020 target
Austria 430 291 465
Belgium 30 45 66
Bulgaria 327 35 105
Czech Republic 25 174 174
Germany 925 2256 7978
Greece 188 256 593
Spain 62 44 110
France 1380 3140 5815
Hungary 2659 1663 4152
Italy 1995 2942 3489
Lithuania 9 47 58
Netherlands 396 1303 3012
Poland 206 500 2070
Portugal 108 186 291
Romania 490 547 930
Sweden 0 0 0
Slovenia 177 221 233
Slovakia 682 326 1047
United Kingdom 30 0 0
EU 10120 13976 30589
Sources: [ECN 2011, Lund & Boyd 2015], own analysis
For the EU as whole, 3800 GWh more have to be produced in order to reach the 2014 NREAP target, which is about 34 % of current production. In order to reach the 2020 target, current production of heat from geothermal direct use has to more than triple.
3.4 Ground Source Heat
Pumps (GSHP)
The European heat pump and also the GSHP market is now a market dominated by major manufacturers [Sigfusson & Uihlein 2015]. The countries of origin of those manufacturers mirror the main markets for GSHP with many big producers being locat-ed on Germany and Sweden (e.g. BDR, Bosch, Danfoss, Nibe and Stiebel Eltron).
In total, 15 EU Member States have set NREAP targets for ground source heat pumps (Table 4).
Table 4 Heat production from GSHP in the EU in GWh: NREAP targets and progress
Country 2014 actual
2014 target
2020 target
Austria 1440 140 302
Belgium 335 647 1710
Germany 4200 4350 6059
Denmark 695 1849 2314
Greece 135 174 582
Spain 210 247 471
France 2775 4652 6629
Hungary 110 186 1244
Italy 472 1303 6071
Netherlands 880 1698 2814
Romania 32 23 93
Sweden 15200 5687 9478
Slovenia 96 256 442
Slovakia 23 47
United Kingdom 500 3175 11083
EU 27080 24409 49340
Sources: [ECN 2011], own analysis
Heat production from GSHP in 2014 was not available directly from statistics. In-stead, we estimated it using the heat pro-duction according to [ECN 2011] for 2012 and extrapolating it to 2014 using infor-mation on the number of GSHP installed

19
from [EurObserv’ER 2013, EurObserv’ER 2015]. According to this estimate, heat production from GSHP in the EU surpassed the NREAP target in 2014 and reached about 89 % of the 2020 target already (Table 4).
More than half of all countries have reached their target; Austria and Sweden have even
reached the 2020 target already. Slovakia and the UK are furthest from reaching their 2014 NREAP targets in relative terms. In absolute terms, about additional 5 400 GWh have to be produced annually in order to reach the 2020 NREAP target, which corresponds to an increase of current pro-duction by about 11 %
20
4 ECONOMIC ASPECTS AND COST COMPONENTS
The JRC performs techno-economic as-sessments of renewable energies for differ-ent current and future technologies on a regular basis [Carlsson et al. 2014]. The assessment includes the quantification of cost as well as the breakdown of capital expenditure. In the current contribution the CAPEX has been broken down in more suitable manner for geothermal power plants. For geothermal energy, three refer-ence power plant types are assessed:
Flash power plant extracting fluid from a hydrothermal system at 2.5 km depth;
ORC power plant extracting fluid from a hydrothermal system at 2.5 km depth;
ORC power plant extracting 165 °C fluid at 100 kg s-1 from EGS at 5.5 km depth.
The following sections provide the CAPEX breakdown for the power plant types. As-sumptions for cost variations of ORC plants (both hydrothermal and EGS) for sensitivity analysis of energy system modelling are furthermore provided.
4.1.1 Flash power plants from a hydro-
thermal reservoir
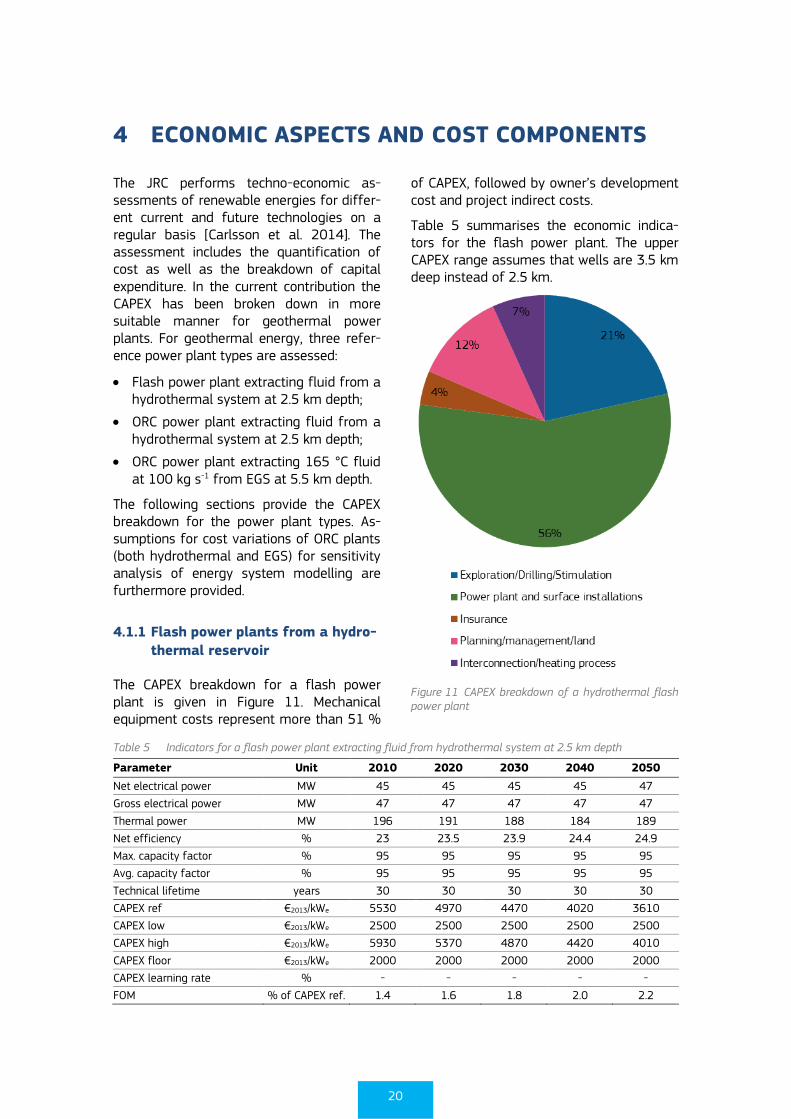
The CAPEX breakdown for a flash power plant is given in Figure 11. Mechanical equipment costs represent more than 51 %
of CAPEX, followed by owner’s development cost and project indirect costs.
Table 5 summarises the economic indica-tors for the flash power plant. The upper CAPEX range assumes that wells are 3.5 km deep instead of 2.5 km.
Figure 11 CAPEX breakdown of a hydrothermal flash power plant
Table 5 Indicators for a flash power plant extracting fluid from hydrothermal system at 2.5 km depth
Parameter Unit 2010 2020 2030 2040 2050
Net electrical power MW 45 45 45 45 47
Gross electrical power MW 47 47 47 47 47
Thermal power MW 196 191 188 184 189
Net efficiency % 23 23.5 23.9 24.4 24.9
Max. capacity factor % 95 95 95 95 95
Avg. capacity factor % 95 95 95 95 95
Technical lifetime years 30 30 30 30 30
CAPEX ref €2013/kWe 5530 4970 4470 4020 3610
CAPEX low €2013/kWe 2500 2500 2500 2500 2500
CAPEX high €2013/kWe 5930 5370 4870 4420 4010
CAPEX floor €2013/kWe 2000 2000 2000 2000 2000
CAPEX learning rate % - - - - -
FOM % of CAPEX ref. 1.4 1.6 1.8 2.0 2.2
21
4.1.2 ORC hydrothermal power plant
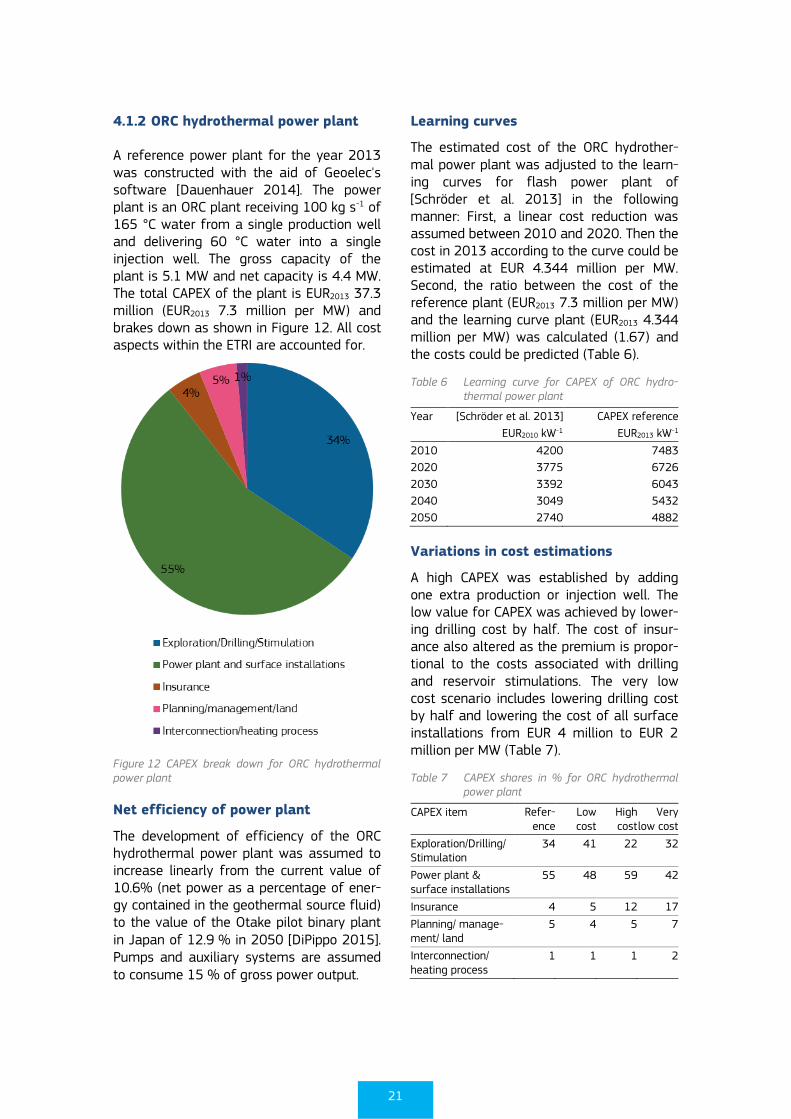
A reference power plant for the year 2013 was constructed with the aid of Geoelec's software [Dauenhauer 2014]. The power plant is an ORC plant receiving 100 kg s-1 of 165 °C water from a single production well and delivering 60 °C water into a single injection well. The gross capacity of the plant is 5.1 MW and net capacity is 4.4 MW. The total CAPEX of the plant is EUR2013 37.3 million (EUR2013 7.3 million per MW) and brakes down as shown in Figure 12. All cost aspects within the ETRI are accounted for.
Figure 12 CAPEX break down for ORC hydrothermal power plant
Net efficiency of power plant
The development of efficiency of the ORC hydrothermal power plant was assumed to increase linearly from the current value of 10.6% (net power as a percentage of ener-gy contained in the geothermal source fluid) to the value of the Otake pilot binary plant in Japan of 12.9 % in 2050 [DiPippo 2015]. Pumps and auxiliary systems are assumed to consume 15 % of gross power output.
Learning curves
The estimated cost of the ORC hydrother-mal power plant was adjusted to the learn-ing curves for flash power plant of [Schröder et al. 2013] in the following manner: First, a linear cost reduction was assumed between 2010 and 2020. Then the cost in 2013 according to the curve could be estimated at EUR 4.344 million per MW. Second, the ratio between the cost of the reference plant (EUR2013 7.3 million per MW) and the learning curve plant (EUR2013 4.344 million per MW) was calculated (1.67) and the costs could be predicted (Table 6).
Table 6 Learning curve for CAPEX of ORC hydro-thermal power plant
Year [Schröder et al. 2013] CAPEX reference
EUR2010 kW-1 EUR2013 kW-1
2010 4200 7483
2020 3775 6726
2030 3392 6043
2040 3049 5432
2050 2740 4882
Variations in cost estimations
A high CAPEX was established by adding one extra production or injection well. The low value for CAPEX was achieved by lower-ing drilling cost by half. The cost of insur-ance also altered as the premium is propor-tional to the costs associated with drilling and reservoir stimulations. The very low cost scenario includes lowering drilling cost by half and lowering the cost of all surface installations from EUR 4 million to EUR 2 million per MW (Table 7).
Table 7 CAPEX shares in % for ORC hydrothermal power plant
CAPEX item Refer-ence
Low cost
High cost
Very low cost
Exploration/Drilling/ Stimulation
34 41 22 32
Power plant & surface installations
55 48 59 42
Insurance 4 5 12 17
Planning/ manage-ment/ land
5 4 5 7
Interconnection/ heating process
1 1 1 2
22
Summary of ORC hydrothermal data
Table 8 gives an overview of the data used in the JRC-EU-TIMES model for the ORC
hydrothermal power plant. The FOM was maintained as 2 % of CAPEX for the years 2010 to 2050 as assumed in [Carlsson et al. 2014].
Table 8 Overview of CAPEX and OPEX values for the ORC hydrothermal power plant
Unit 2010 2020 2030 2040 2050
Technical
Net electrical power MW 4.4 4.6 4.9 5.1 5.3
Gross electrical power MW 5.5 5.8 6.1 6.3 6.7
Thermal power MW 41 41 41 41 41
Net efficiency % 10.6 11.2 11.8 12.3 12.9
Max capacity factor % 95 95 95 95 95
Avg. capacity factor % 95 95 95 95 95
Costs
Overnight corrected CAPEX ref €2013 kW-1 7483 6726 6043 5432 4882
Overnight corrected CAPEX low €2013 kW-1 7009 6300 5660 5088 4572
Overnight corrected CAPEX high €2013 kW-1 8614 7743 6957 6253 5620
Overnight corrected CAPEX floor €2013 kW-1 4946 4446 3995 3591 3227
FOM % Capex ref 2 2 2 2 2
4.1.3 ORC EGS Power plant
Reference cost and cost breakdown
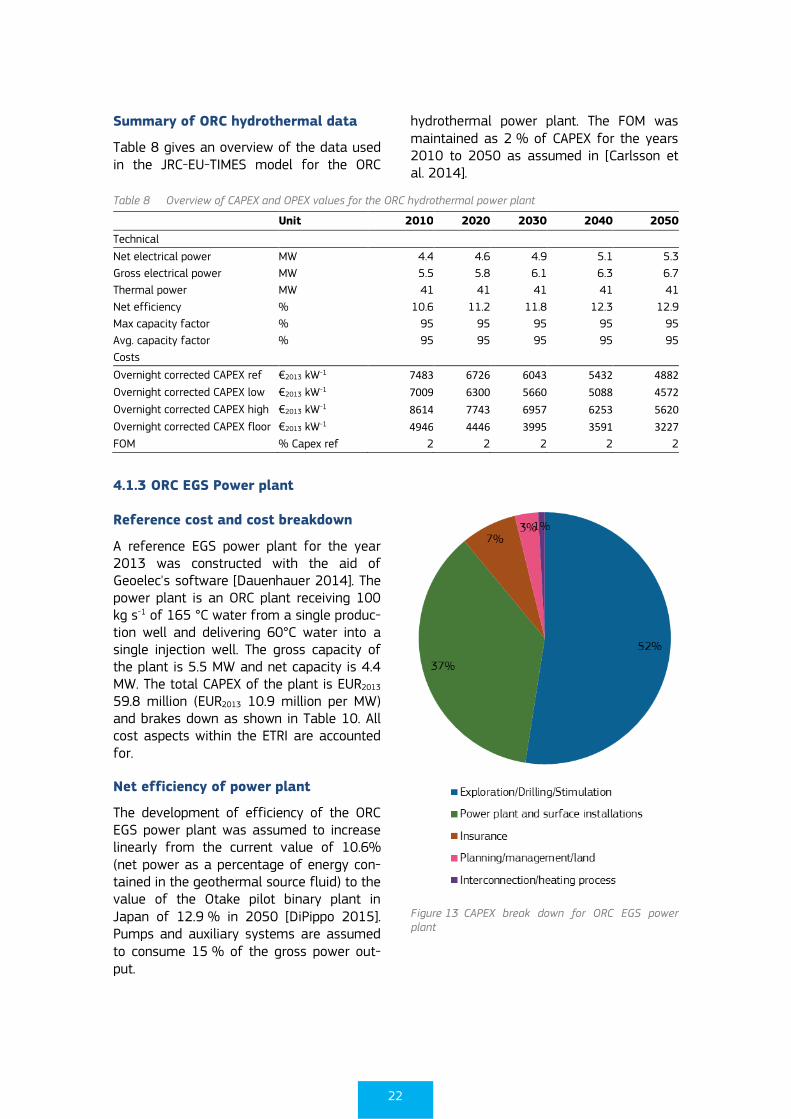
A reference EGS power plant for the year 2013 was constructed with the aid of Geoelec's software [Dauenhauer 2014]. The power plant is an ORC plant receiving 100 kg s-1 of 165 °C water from a single produc-tion well and delivering 60°C water into a single injection well. The gross capacity of the plant is 5.5 MW and net capacity is 4.4 MW. The total CAPEX of the plant is EUR2013 59.8 million (EUR2013 10.9 million per MW) and brakes down as shown in Table 10. All cost aspects within the ETRI are accounted for.
Net efficiency of power plant
The development of efficiency of the ORC EGS power plant was assumed to increase linearly from the current value of 10.6% (net power as a percentage of energy con-tained in the geothermal source fluid) to the value of the Otake pilot binary plant in Japan of 12.9 % in 2050 [DiPippo 2015]. Pumps and auxiliary systems are assumed to consume 15 % of the gross power out-put.
Figure 13 CAPEX break down for ORC EGS power plant
23
Learning curves
The estimated cost of the ORC EGS power plant was adjusted to the learning curves for flash power plant of [Schröder et al. 2013] in the same manner as shown above (Table 9).
Table 9 Learning curve for CAPEX of ORC EGS power plant
Year [Schröder et al. 2013] CAPEX reference
EUR2010 kW-1 EUR2013 kW-1
2010 22014 11585
2020 17985 9465
2030 15688 8256
2040 14999 7894
2050 14339 7546
Variations in cost estimations
A high CAPEX was established by increasing the cost of reservoir stimulation from EUR 6 million to EUR 8 million and adding one extra production or injection well. The low value for CAPEX was achieved by lowering drilling cost by half. The cost of insurance also altered as the premium is proportional to the costs associated with drilling and
reservoir stimulations. The very low cost scenario includes lowering drilling cost by half and lowering the cost of all surface installations from EUR 4 million to EUR 2 million per MW (Table 10).
Table 10 CAPEX shares in % for ORC EGS power plant
CAPEX item Refer-ence
Low cost
High cost
Very low cost
Exploration/Drilling/ Stimulation
52 43 60 56
Power plant & surface installations
37 46 29 30
Insurance 7 6 8 7
Planning/ manage-ment/ land
3 4 2 5
Interconnection/ heating process
1 1 1 1
Summary of ORC EGS data
Table 11 gives an overview of the data used in the JRC-EU-TIMES model for the ORC EGS power plant. The FOM was main-tained as 1.8 % of CAPEX for the years 2010 to 2050 as assumed in [Carlsson et al. 2014].
Table 11 Overview of CAPEX and OPEX values for the ORC hydrothermal power plant
Unit 2010 2020 2030 2040 2050
Technical
Net electrical power MW 4.4 4.6 4.9 5.1 5.3
Gross electrical power MW 5.5 5.8 6.1 6.3 6.7
Thermal power MW 41 41 41 41 41
Net efficiency % 10.6 11.2 11.8 12.3 12.9
Max capacity factor % 95 95 95 95 95
Avg. capacity factor % 95 95 95 95 95
Costs
Overnight corrected CAPEX ref €2013 kW-1 11585 9465 8256 7894 7546
Overnight corrected CAPEX low €2013 kW-1 9135 7463 6510 6224 5950
Overnight corrected CAPEX high €2013 kW-1 14379 11748 10247 9797 9366
Overnight corrected CAPEX floor €2013 kW-1 7019 5734 5002 4782 4572
FOM % Capex ref 1.8 1.8 1.8 1.8 1.8
24
5 POLICY SUPPORT AND POLICY FRAMEWORK
Policy support can take various forms and a number of support schemes exist within the EU. Policy support mechanisms differ be-tween Member States but they are also different regarding the technology (power production, direct use, GSHP).
5.1.1 Geothermal power
Geothermal project development for power production has high upfront cost and can take as little as 3 years but average devel-opment time is about five to seven years. In general, EU legislation requires that dis-patch priority is given to renewable electrici-ty insofar as the operation of the national electricity system permits [EU 2009]. How-ever, still, market barriers in terms of regulations and market transparency exist [EGEC 2012]. Policy support instruments for geothermal power production include both push and pull mechanisms such as risk insurance funds, feed-in-tariffs (FIT), feed-in-premiums (FIP), tradable certificates, tendering, and soft loans [Sigfusson & Uihlein 2015].
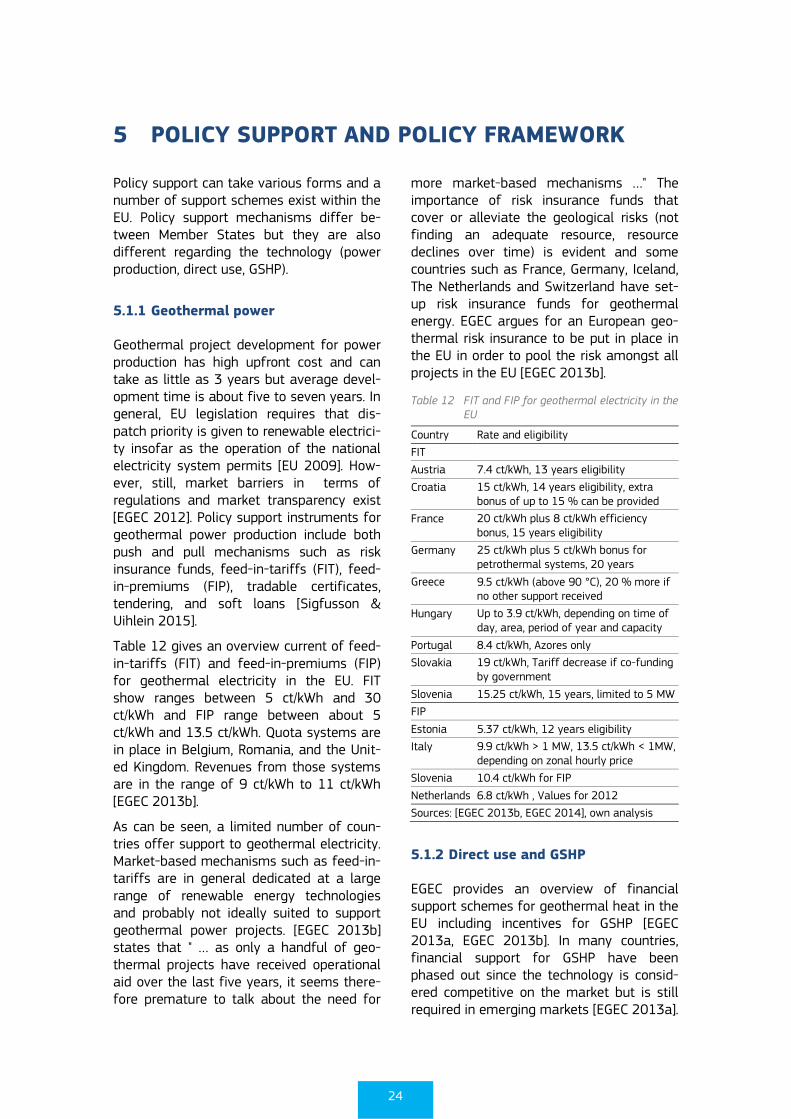
Table 12 gives an overview current of feed-in-tariffs (FIT) and feed-in-premiums (FIP) for geothermal electricity in the EU. FIT show ranges between 5 ct/kWh and 30 ct/kWh and FIP range between about 5 ct/kWh and 13.5 ct/kWh. Quota systems are in place in Belgium, Romania, and the Unit-ed Kingdom. Revenues from those systems are in the range of 9 ct/kWh to 11 ct/kWh [EGEC 2013b].
As can be seen, a limited number of coun-tries offer support to geothermal electricity. Market-based mechanisms such as feed-in-tariffs are in general dedicated at a large range of renewable energy technologies and probably not ideally suited to support geothermal power projects. [EGEC 2013b] states that " … as only a handful of geo-thermal projects have received operational aid over the last five years, it seems there-fore premature to talk about the need for
more market-based mechanisms …" The importance of risk insurance funds that cover or alleviate the geological risks (not finding an adequate resource, resource declines over time) is evident and some countries such as France, Germany, Iceland, The Netherlands and Switzerland have set-up risk insurance funds for geothermal energy. EGEC argues for an European geo-thermal risk insurance to be put in place in the EU in order to pool the risk amongst all projects in the EU [EGEC 2013b].
Table 12 FIT and FIP for geothermal electricity in the EU
Country Rate and eligibility
FIT
Austria 7.4 ct/kWh, 13 years eligibility
Croatia 15 ct/kWh, 14 years eligibility, extra bonus of up to 15 % can be provided
France 20 ct/kWh plus 8 ct/kWh efficiency bonus, 15 years eligibility
Germany 25 ct/kWh plus 5 ct/kWh bonus for petrothermal systems, 20 years
Greece 9.5 ct/kWh (above 90 °C), 20 % more if no other support received
Hungary Up to 3.9 ct/kWh, depending on time of day, area, period of year and capacity
Portugal 8.4 ct/kWh, Azores only
Slovakia 19 ct/kWh, Tariff decrease if co-funding by government
Slovenia 15.25 ct/kWh, 15 years, limited to 5 MW
FIP
Estonia 5.37 ct/kWh, 12 years eligibility
Italy 9.9 ct/kWh > 1 MW, 13.5 ct/kWh < 1MW, depending on zonal hourly price
Slovenia 10.4 ct/kWh for FIP
Netherlands 6.8 ct/kWh , Values for 2012
Sources: [EGEC 2013b, EGEC 2014], own analysis
5.1.2 Direct use and GSHP
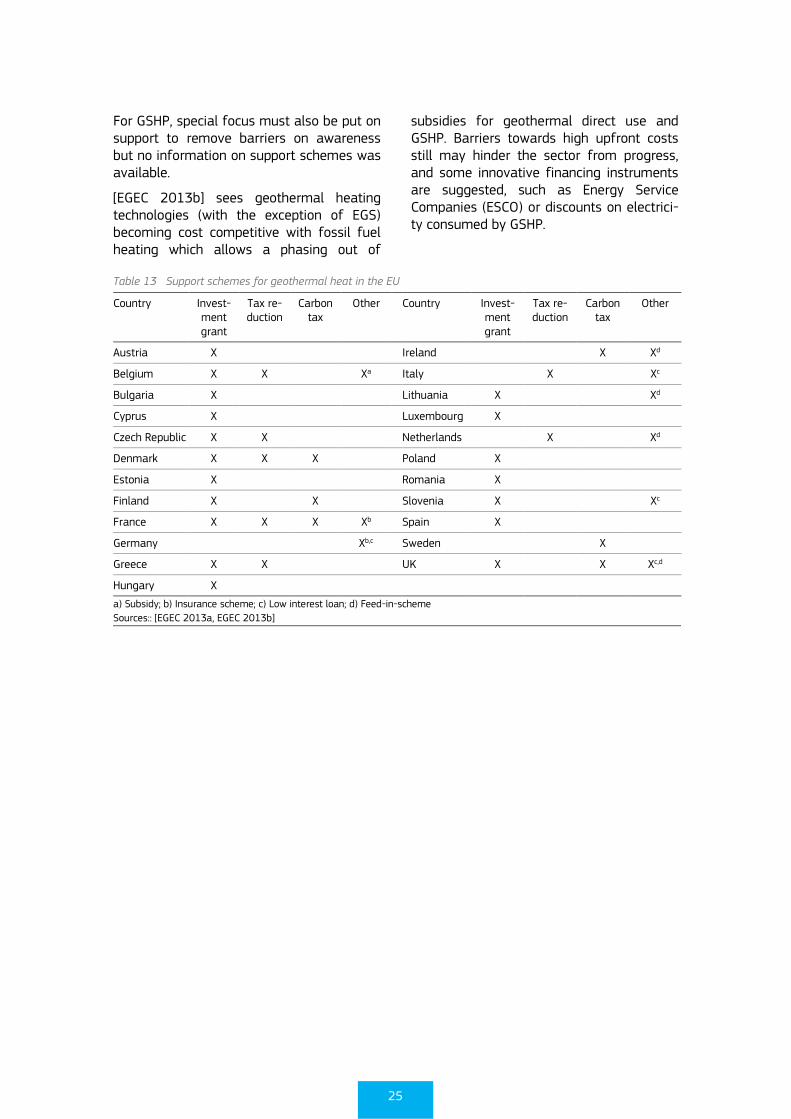
EGEC provides an overview of financial support schemes for geothermal heat in the EU including incentives for GSHP [EGEC 2013a, EGEC 2013b]. In many countries, financial support for GSHP have been phased out since the technology is consid-ered competitive on the market but is still required in emerging markets [EGEC 2013a].
25
For GSHP, special focus must also be put on support to remove barriers on awareness but no information on support schemes was available.
[EGEC 2013b] sees geothermal heating technologies (with the exception of EGS) becoming cost competitive with fossil fuel heating which allows a phasing out of
subsidies for geothermal direct use and GSHP. Barriers towards high upfront costs still may hinder the sector from progress, and some innovative financing instruments are suggested, such as Energy Service Companies (ESCO) or discounts on electrici-ty consumed by GSHP.
Table 13 Support schemes for geothermal heat in the EU
Country Invest-ment grant
Tax re-duction
Carbon tax
Other Country Invest-ment grant
Tax re-duction
Carbon tax
Other
Austria X Ireland X Xd
Belgium X X Xa Italy X Xc
Bulgaria X Lithuania X Xd
Cyprus X Luxembourg X
Czech Republic X X Netherlands X Xd
Denmark X X X Poland X
Estonia X Romania X
Finland X X Slovenia X Xc
France X X X Xb Spain X
Germany Xb,c Sweden X
Greece X X UK X X Xc,d
Hungary X a) Subsidy; b) Insurance scheme; c) Low interest loan; d) Feed-in-scheme
Sources:: [EGEC 2013a, EGEC 2013b]
26
6 ENGINEERED GEOTHERMAL SYSTEMS
High enthalpy resources have limited occur-rence in Europe with Italy (916 MWe) and the Azores (29 MWe) being the only EU member states currently producing electrici-ty from high enthalpy resources. However medium and low enthalpy hydrothermal resources are more widespread giving opportunities to widespread direct heat use and in some cases power plants have been commissioned (Austria, 1.2 MWe, Germany, 27 MWe and Romania, 0.1 MW) and more countries have projects in different stages of development (Czech Republic, Hungary, Latvia, Netherlands, Poland, Slovakia and UK) [Bertani 2015].
In addition to these hydrothermal power plants, the first 1.5 MWe EGS petrothermal pilot plant at Soultz-sous-Forêts in France is fully operative. An EGS plant relies either on a stimulation of a hot dry reservoir with limited occurrence of open faults and cracks (often termed petrothermal system) or on a stimulation of deep sedimentary aquifers where convection is absent (often termed Hot Sedimentary Aquifer, HSA).
In petrothermal systems, fluid is injected into the subsurface under carefully con-trolled conditions, which cause pre-existing fractures to re-open, creating a reservoir with sufficient permeability. Increased permeability allows fluid to circulate throughout the now-fractured rock and to transport heat to the surface where electric-ity can be generated.
In a HSA system, a reservoir with sufficient permeability already exists. Water can flow through the bulk of the reservoir but there is too much pressure gradient near the wells. Therefore, increasing the well perfor-mance and ensuring the reservoir does not clog up during production are the main challenges for the reservoir engineering. In HSA systems, flow has to be maintained by surface pumps at injection wells, or well pumps in the production wells or both.
The economic potential of geothermal electricity including EGS for the year 2050
has been estimated at 2570 TWh in the EU covering up to 50 % of its demand [van Wees et al. 2013] However, due to the much more widespread occurrence of hot dry rocks than hydrothermal systems within the EU, there is a need to fully develop and demonstrate the EGS petrothermal technol-ogy under various geological conditions if the share of geothermal energy within the EU power mix is to increase from its current 0.2 % of final electricity demand.
This chapter gives an overview of previous and existing EGS projects, evaluates the current state of the art of EGS systems, identifies and analyses the bottlenecks preventing large scale deployment and gives recommendations on the policy and incentives needed to facilitate the advances of the technology.
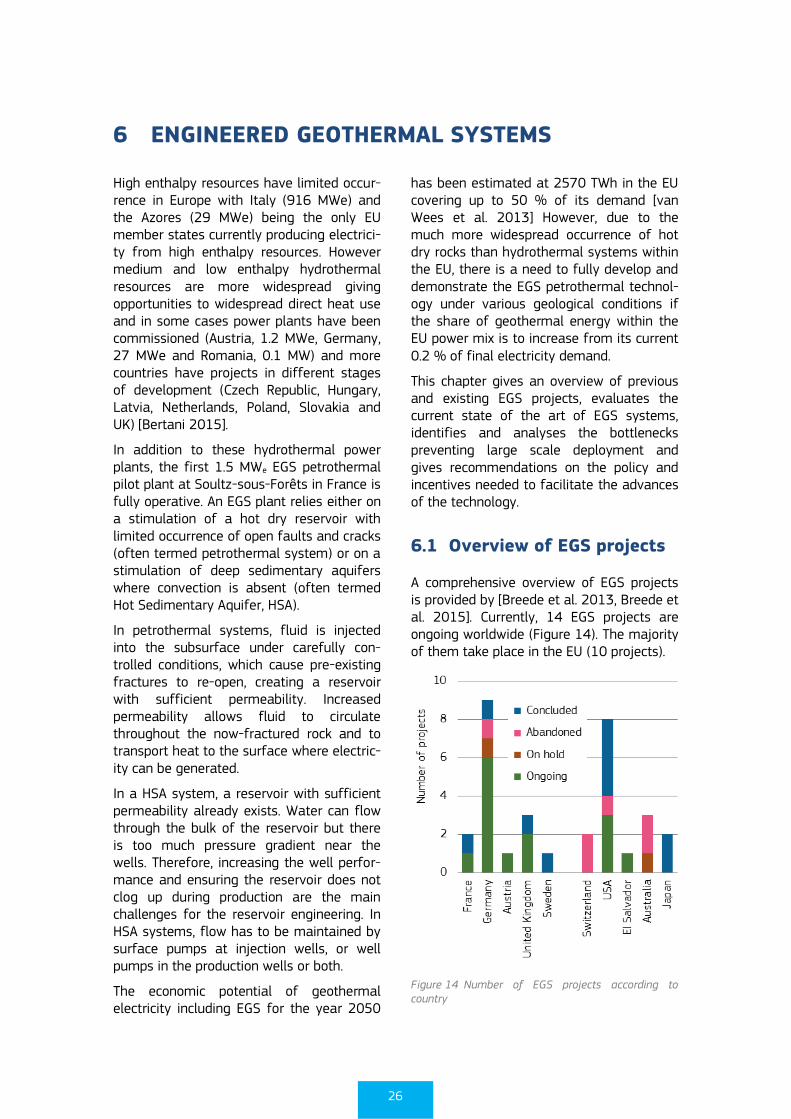
6.1 Overview of EGS projects
A comprehensive overview of EGS projects is provided by [Breede et al. 2013, Breede et al. 2015]. Currently, 14 EGS projects are ongoing worldwide (Figure 14). The majority of them take place in the EU (10 projects).
Figure 14 Number of EGS projects according to country
27
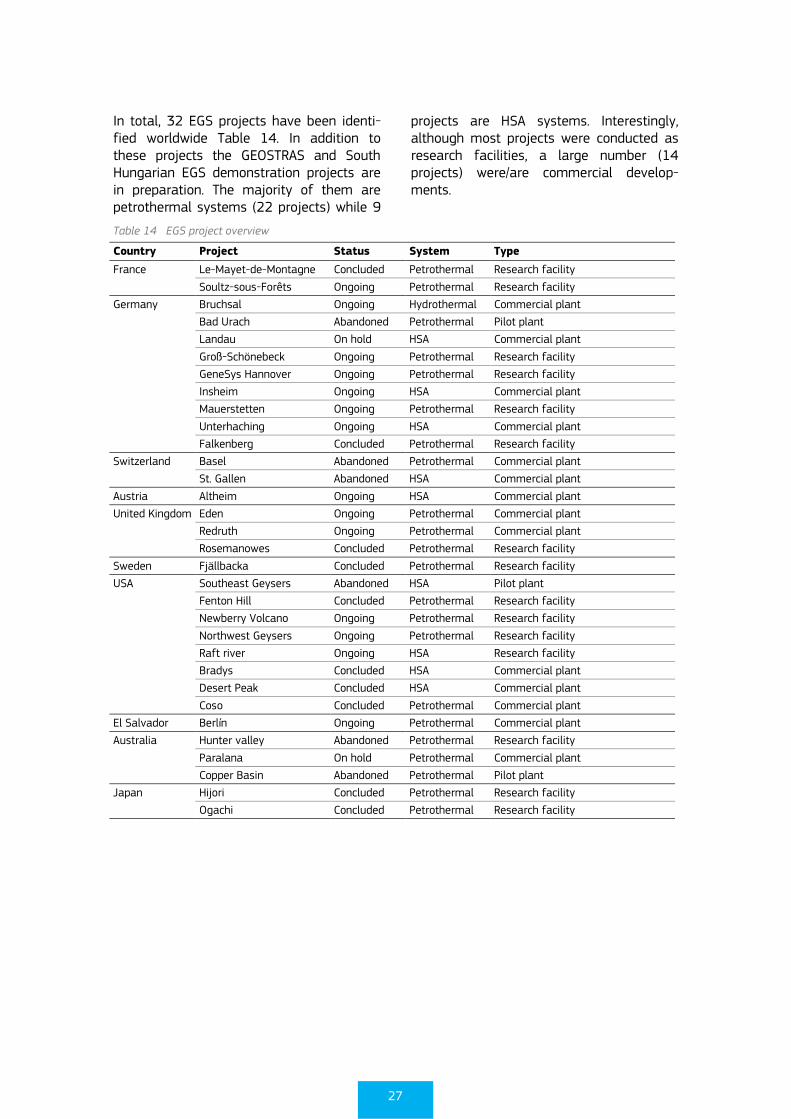
In total, 32 EGS projects have been identi-fied worldwide Table 14. In addition to these projects the GEOSTRAS and South Hungarian EGS demonstration projects are in preparation. The majority of them are petrothermal systems (22 projects) while 9
projects are HSA systems. Interestingly, although most projects were conducted as research facilities, a large number (14 projects) were/are commercial develop-ments.
Table 14 EGS project overview
Country Project Status System Type
France Le-Mayet-de-Montagne Concluded Petrothermal Research facility
Soultz-sous-Forêts Ongoing Petrothermal Research facility
Germany Bruchsal Ongoing Hydrothermal Commercial plant
Bad Urach Abandoned Petrothermal Pilot plant
Landau On hold HSA Commercial plant
Groß-Schönebeck Ongoing Petrothermal Research facility
GeneSys Hannover Ongoing Petrothermal Research facility
Insheim Ongoing HSA Commercial plant
Mauerstetten Ongoing Petrothermal Research facility
Unterhaching Ongoing HSA Commercial plant
Falkenberg Concluded Petrothermal Research facility
Switzerland Basel Abandoned Petrothermal Commercial plant
St. Gallen Abandoned HSA Commercial plant
Austria Altheim Ongoing HSA Commercial plant
United Kingdom Eden Ongoing Petrothermal Commercial plant
Redruth Ongoing Petrothermal Commercial plant
Rosemanowes Concluded Petrothermal Research facility
Sweden Fjällbacka Concluded Petrothermal Research facility
USA Southeast Geysers Abandoned HSA Pilot plant
Fenton Hill Concluded Petrothermal Research facility
Newberry Volcano Ongoing Petrothermal Research facility
Northwest Geysers Ongoing Petrothermal Research facility
Raft river Ongoing HSA Research facility
Bradys Concluded HSA Commercial plant
Desert Peak Concluded HSA Commercial plant
Coso Concluded Petrothermal Commercial plant
El Salvador Berlín Ongoing Petrothermal Commercial plant
Australia Hunter valley Abandoned Petrothermal Research facility
Paralana On hold Petrothermal Commercial plant
Copper Basin Abandoned Petrothermal Pilot plant
Japan Hijori Concluded Petrothermal Research facility
Ogachi Concluded Petrothermal Research facility
28
6.2 EGS projects
6.2.1 France
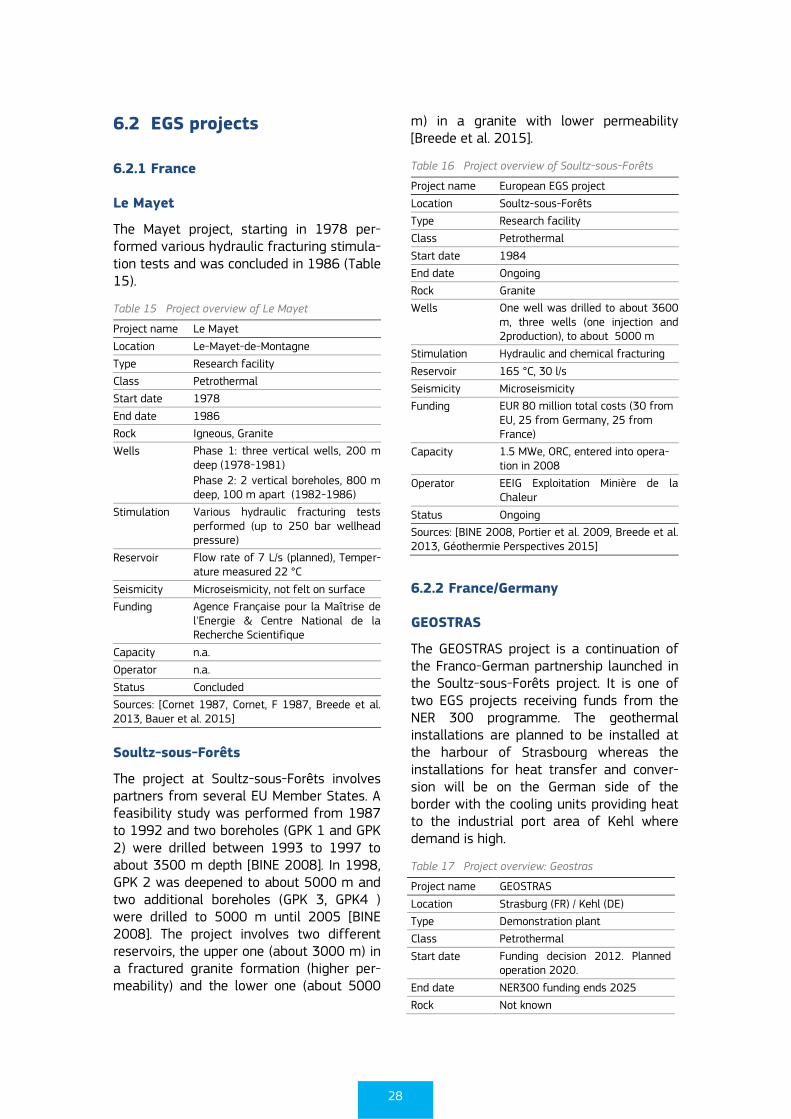
Le Mayet
The Mayet project, starting in 1978 per-formed various hydraulic fracturing stimula-tion tests and was concluded in 1986 (Table 15).
Table 15 Project overview of Le Mayet
Project name Le Mayet
Location Le-Mayet-de-Montagne
Type Research facility
Class Petrothermal
Start date 1978
End date 1986
Rock Igneous, Granite
Wells Phase 1: three vertical wells, 200 m deep (1978-1981)
Phase 2: 2 vertical boreholes, 800 m deep, 100 m apart (1982-1986)
Stimulation Various hydraulic fracturing tests performed (up to 250 bar wellhead pressure)
Reservoir Flow rate of 7 L/s (planned), Temper-ature measured 22 °C
Seismicity Microseismicity, not felt on surface
Funding Agence Française pour la Maîtrise de l'Energie & Centre National de la Recherche Scientifique
Capacity n.a.
Operator n.a.
Status Concluded
Sources: [Cornet 1987, Cornet, F 1987, Breede et al. 2013, Bauer et al. 2015]
Soultz-sous-Forêts
The project at Soultz-sous-Forêts involves partners from several EU Member States. A feasibility study was performed from 1987 to 1992 and two boreholes (GPK 1 and GPK 2) were drilled between 1993 to 1997 to about 3500 m depth [BINE 2008]. In 1998, GPK 2 was deepened to about 5000 m and two additional boreholes (GPK 3, GPK4 ) were drilled to 5000 m until 2005 [BINE 2008]. The project involves two different reservoirs, the upper one (about 3000 m) in a fractured granite formation (higher per-meability) and the lower one (about 5000
m) in a granite with lower permeability [Breede et al. 2015].
Table 16 Project overview of Soultz-sous-Forêts
Project name European EGS project
Location Soultz-sous-Forêts
Type Research facility
Class Petrothermal
Start date 1984
End date Ongoing
Rock Granite
Wells One well was drilled to about 3600 m, three wells (one injection and 2production), to about 5000 m
Stimulation Hydraulic and chemical fracturing
Reservoir 165 °C, 30 l/s
Seismicity Microseismicity
Funding EUR 80 million total costs (30 from EU, 25 from Germany, 25 from France)
Capacity 1.5 MWe, ORC, entered into opera-tion in 2008
Operator EEIG Exploitation Minière de la Chaleur
Status Ongoing
Sources: [BINE 2008, Portier et al. 2009, Breede et al. 2013, Géothermie Perspectives 2015]
6.2.2 France/Germany
GEOSTRAS
The GEOSTRAS project is a continuation of the Franco-German partnership launched in the Soultz-sous-Forêts project. It is one of two EGS projects receiving funds from the NER 300 programme. The geothermal installations are planned to be installed at the harbour of Strasbourg whereas the installations for heat transfer and conver-sion will be on the German side of the border with the cooling units providing heat to the industrial port area of Kehl where demand is high.
Table 17 Project overview: Geostras
Project name GEOSTRAS
Location Strasburg (FR) / Kehl (DE)
Type Demonstration plant
Class Petrothermal
Start date Funding decision 2012. Planned operation 2020.
End date NER300 funding ends 2025
Rock Not known
29
Project name GEOSTRAS
Wells Not known
Stimulation Not known
Reservoir >150 °C
Seismicity Not known
Funding Total investment costs not known, EUR 16.8 million from NER300.
Capacity 6.7 MWe and 35 MWth
Operator Fonroche
Status Ongoing
Sources: [EC 2014, EC 2015]
6.2.3 Germany
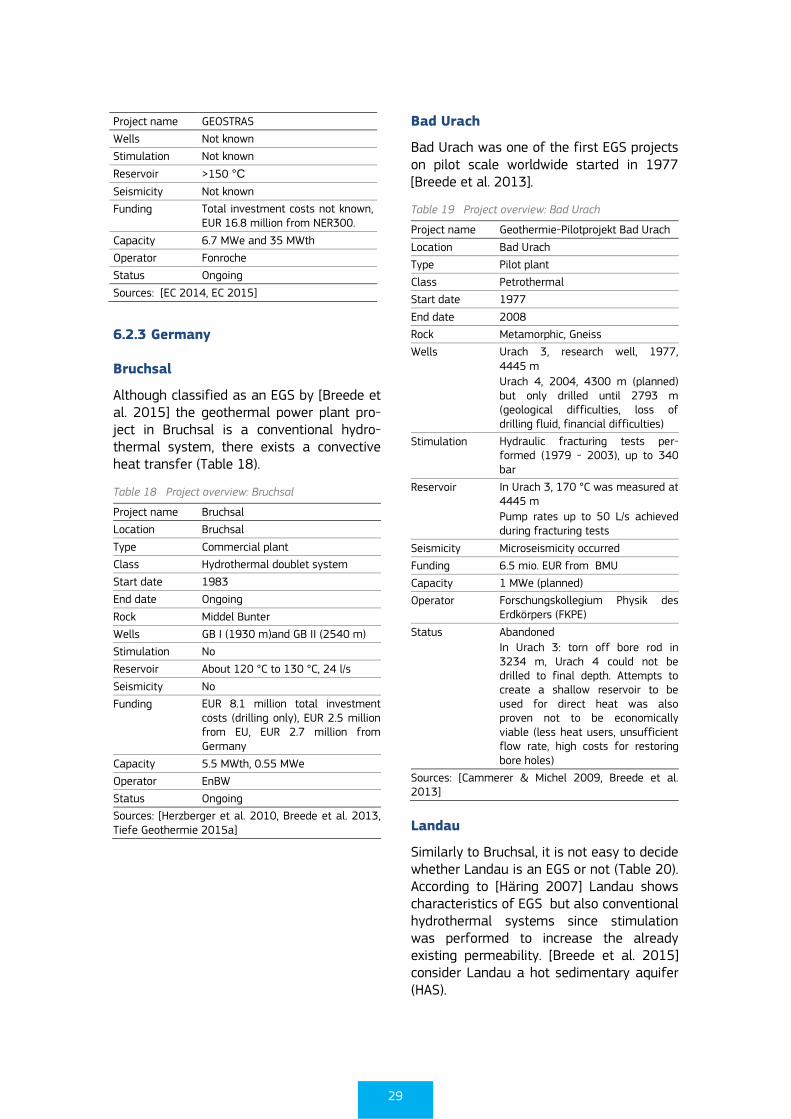
Bruchsal
Although classified as an EGS by [Breede et al. 2015] the geothermal power plant pro-ject in Bruchsal is a conventional hydro-thermal system, there exists a convective heat transfer (Table 18).
Table 18 Project overview: Bruchsal
Project name Bruchsal
Location Bruchsal
Type Commercial plant
Class Hydrothermal doublet system
Start date 1983
End date Ongoing
Rock Middel Bunter
Wells GB I (1930 m)and GB II (2540 m)
Stimulation No
Reservoir About 120 °C to 130 °C, 24 l/s
Seismicity No
Funding EUR 8.1 million total investment costs (drilling only), EUR 2.5 million from EU, EUR 2.7 million from Germany
Capacity 5.5 MWth, 0.55 MWe
Operator EnBW
Status Ongoing
Sources: [Herzberger et al. 2010, Breede et al. 2013, Tiefe Geothermie 2015a]
Bad Urach
Bad Urach was one of the first EGS projects on pilot scale worldwide started in 1977 [Breede et al. 2013].
Table 19 Project overview: Bad Urach
Project name Geothermie-Pilotprojekt Bad Urach
Location Bad Urach
Type Pilot plant
Class Petrothermal
Start date 1977
End date 2008
Rock Metamorphic, Gneiss
Wells Urach 3, research well, 1977, 4445 m
Urach 4, 2004, 4300 m (planned) but only drilled until 2793 m (geological difficulties, loss of drilling fluid, financial difficulties)
Stimulation Hydraulic fracturing tests per-formed (1979 - 2003), up to 340 bar
Reservoir In Urach 3, 170 °C was measured at 4445 m
Pump rates up to 50 L/s achieved during fracturing tests
Seismicity Microseismicity occurred
Funding 6.5 mio. EUR from BMU
Capacity 1 MWe (planned)
Operator Forschungskollegium Physik des Erdkörpers (FKPE)
Status Abandoned
In Urach 3: torn off bore rod in 3234 m, Urach 4 could not be drilled to final depth. Attempts to create a shallow reservoir to be used for direct heat was also proven not to be economically viable (less heat users, unsufficient flow rate, high costs for restoring bore holes)
Sources: [Cammerer & Michel 2009, Breede et al. 2013]
Landau
Similarly to Bruchsal, it is not easy to decide whether Landau is an EGS or not (Table 20). According to [Häring 2007] Landau shows characteristics of EGS but also conventional hydrothermal systems since stimulation was performed to increase the already existing permeability. [Breede et al. 2015] consider Landau a hot sedimentary aquifer (HAS).
30
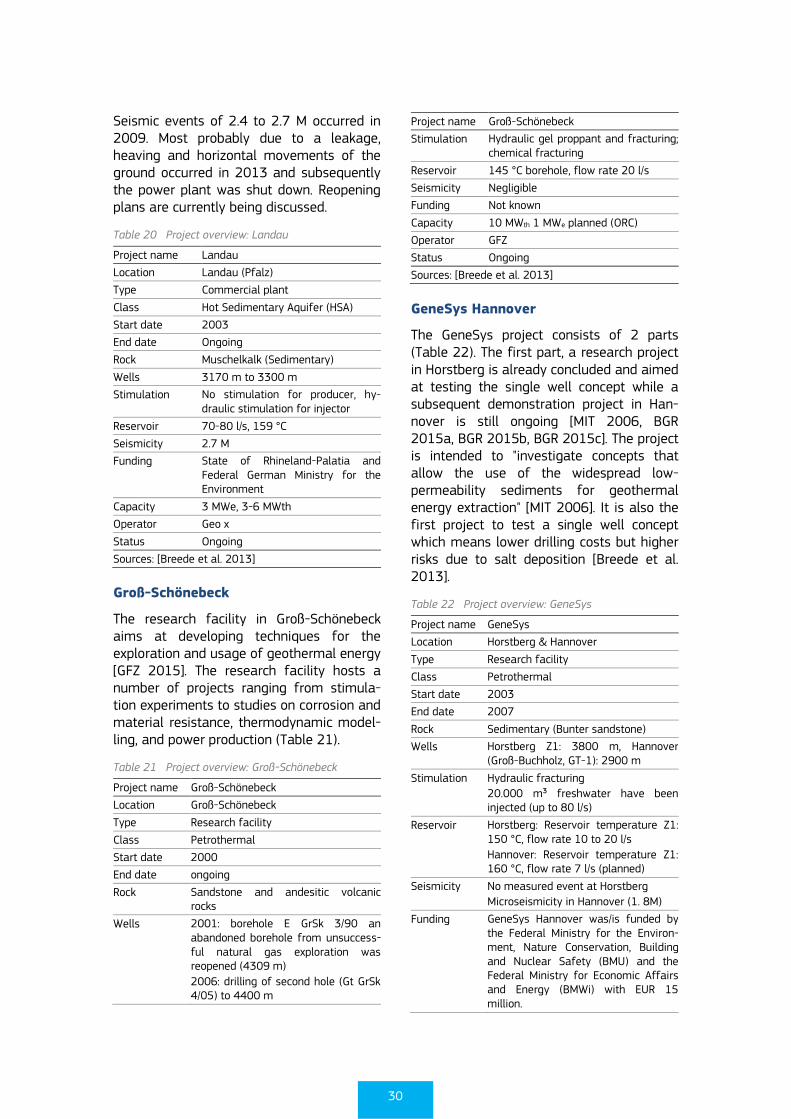
Seismic events of 2.4 to 2.7 M occurred in 2009. Most probably due to a leakage, heaving and horizontal movements of the ground occurred in 2013 and subsequently the power plant was shut down. Reopening plans are currently being discussed.
Table 20 Project overview: Landau
Project name Landau
Location Landau (Pfalz)
Type Commercial plant
Class Hot Sedimentary Aquifer (HSA)
Start date 2003
End date Ongoing
Rock Muschelkalk (Sedimentary)
Wells 3170 m to 3300 m
Stimulation No stimulation for producer, hy-draulic stimulation for injector
Reservoir 70-80 l/s, 159 °C
Seismicity 2.7 M
Funding State of Rhineland-Palatia and Federal German Ministry for the Environment
Capacity 3 MWe, 3-6 MWth
Operator Geo x
Status Ongoing
Sources: [Breede et al. 2013]
Groß-Schönebeck
The research facility in Groß-Schönebeck aims at developing techniques for the exploration and usage of geothermal energy [GFZ 2015]. The research facility hosts a number of projects ranging from stimula-tion experiments to studies on corrosion and material resistance, thermodynamic model-ling, and power production (Table 21).
Table 21 Project overview: Groß-Schönebeck
Project name Groß-Schönebeck
Location Groß-Schönebeck
Type Research facility
Class Petrothermal
Start date 2000
End date ongoing
Rock Sandstone and andesitic volcanic rocks
Wells 2001: borehole E GrSk 3/90 an abandoned borehole from unsuccess-ful natural gas exploration was reopened (4309 m)
2006: drilling of second hole (Gt GrSk 4/05) to 4400 m
Project name Groß-Schönebeck
Stimulation Hydraulic gel proppant and fracturing; chemical fracturing
Reservoir 145 °C borehole, flow rate 20 l/s
Seismicity Negligible
Funding Not known
Capacity 10 MWth 1 MWe planned (ORC)
Operator GFZ
Status Ongoing
Sources: [Breede et al. 2013]
GeneSys Hannover
The GeneSys project consists of 2 parts (Table 22). The first part, a research project in Horstberg is already concluded and aimed at testing the single well concept while a subsequent demonstration project in Han-nover is still ongoing [MIT 2006, BGR 2015a, BGR 2015b, BGR 2015c]. The project is intended to "investigate concepts that allow the use of the widespread low-permeability sediments for geothermal energy extraction" [MIT 2006]. It is also the first project to test a single well concept which means lower drilling costs but higher risks due to salt deposition [Breede et al. 2013].
Table 22 Project overview: GeneSys
Project name GeneSys
Location Horstberg & Hannover
Type Research facility
Class Petrothermal
Start date 2003
End date 2007
Rock Sedimentary (Bunter sandstone)
Wells Horstberg Z1: 3800 m, Hannover (Groß-Buchholz, GT-1): 2900 m
Stimulation Hydraulic fracturing
20.000 m³ freshwater have been injected (up to 80 l/s)
Reservoir Horstberg: Reservoir temperature Z1: 150 °C, flow rate 10 to 20 l/s
Hannover: Reservoir temperature Z1: 160 °C, flow rate 7 l/s (planned)
Seismicity No measured event at Horstberg
Microseismicity in Hannover (1. 8M)
Funding GeneSys Hannover was/is funded by the Federal Ministry for the Environ-ment, Nature Conservation, Building and Nuclear Safety (BMU) and the Federal Ministry for Economic Affairs and Energy (BMWi) with EUR 15 million.
31
Project name GeneSys
Capacity Aim: providing heat for the Geo-zentrum Hannover (2 MWth needed with 25 m³/h at 130 °C)
Operator Federal Ministry of Economics and Technology
Status Project Hannover is ongoing
The freshwater injected dissolved high amounts of salt in depths of 3500 to 3800 m. Heavy salt deposition oc-curred during pumping up the hot water, first in the annular space, then in the production string. Re-extraction of water has been stopped. Currently salt depositions have been removed and further analyses are ongoing
Sources: [Jung et al. 2006, MIT 2006, Breede et al. 2013, BGR 2015b]
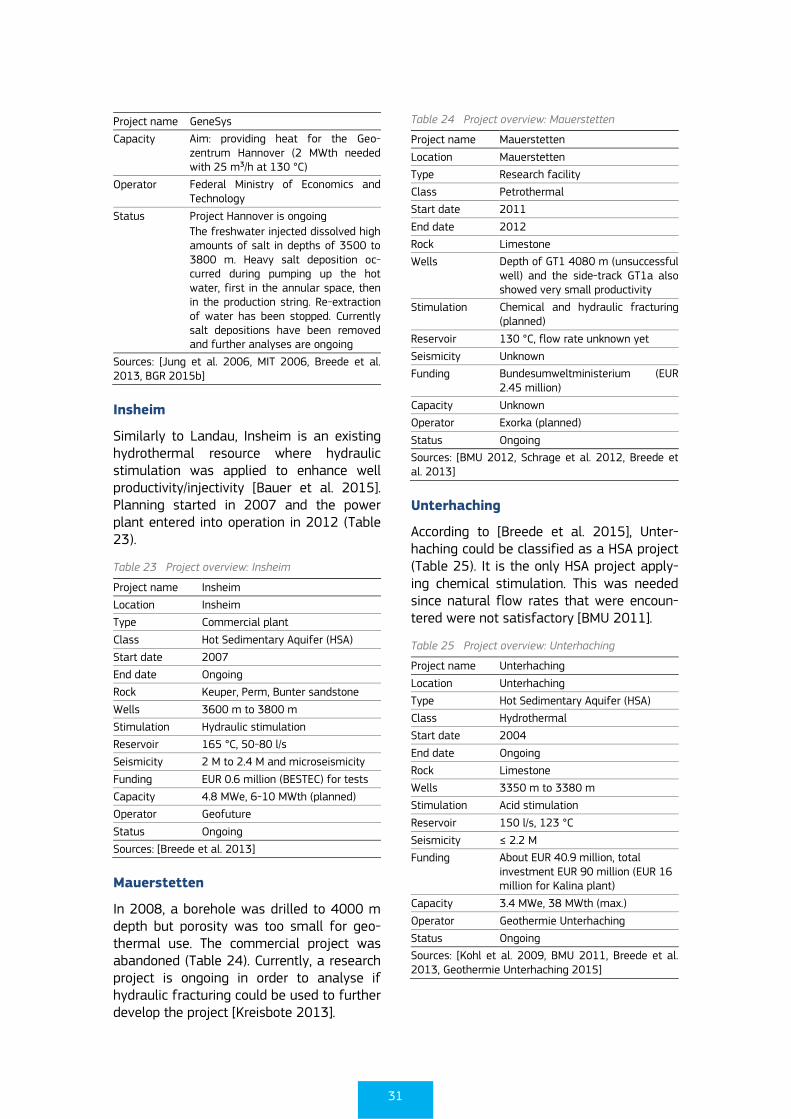
Insheim
Similarly to Landau, Insheim is an existing hydrothermal resource where hydraulic stimulation was applied to enhance well productivity/injectivity [Bauer et al. 2015]. Planning started in 2007 and the power plant entered into operation in 2012 (Table 23).
Table 23 Project overview: Insheim
Project name Insheim
Location Insheim
Type Commercial plant
Class Hot Sedimentary Aquifer (HSA)
Start date 2007
End date Ongoing
Rock Keuper, Perm, Bunter sandstone
Wells 3600 m to 3800 m
Stimulation Hydraulic stimulation
Reservoir 165 °C, 50-80 l/s
Seismicity 2 M to 2.4 M and microseismicity
Funding EUR 0.6 million (BESTEC) for tests
Capacity 4.8 MWe, 6-10 MWth (planned)
Operator Geofuture
Status Ongoing
Sources: [Breede et al. 2013]
Mauerstetten
In 2008, a borehole was drilled to 4000 m depth but porosity was too small for geo-thermal use. The commercial project was abandoned (Table 24). Currently, a research project is ongoing in order to analyse if hydraulic fracturing could be used to further develop the project [Kreisbote 2013].
Table 24 Project overview: Mauerstetten
Project name Mauerstetten
Location Mauerstetten
Type Research facility
Class Petrothermal
Start date 2011
End date 2012
Rock Limestone
Wells Depth of GT1 4080 m (unsuccessful well) and the side-track GT1a also showed very small productivity
Stimulation Chemical and hydraulic fracturing (planned)
Reservoir 130 °C, flow rate unknown yet
Seismicity Unknown
Funding Bundesumweltministerium (EUR 2.45 million)
Capacity Unknown
Operator Exorka (planned)
Status Ongoing
Sources: [BMU 2012, Schrage et al. 2012, Breede et al. 2013]
Unterhaching
According to [Breede et al. 2015], Unter-haching could be classified as a HSA project (Table 25). It is the only HSA project apply-ing chemical stimulation. This was needed since natural flow rates that were encoun-tered were not satisfactory [BMU 2011].
Table 25 Project overview: Unterhaching
Project name Unterhaching
Location Unterhaching
Type Hot Sedimentary Aquifer (HSA)
Class Hydrothermal
Start date 2004
End date Ongoing
Rock Limestone
Wells 3350 m to 3380 m
Stimulation Acid stimulation
Reservoir 150 l/s, 123 °C
Seismicity ≤ 2.2 M
Funding About EUR 40.9 million, total investment EUR 90 million (EUR 16 million for Kalina plant)
Capacity 3.4 MWe, 38 MWth (max.)
Operator Geothermie Unterhaching
Status Ongoing
Sources: [Kohl et al. 2009, BMU 2011, Breede et al. 2013, Geothermie Unterhaching 2015]
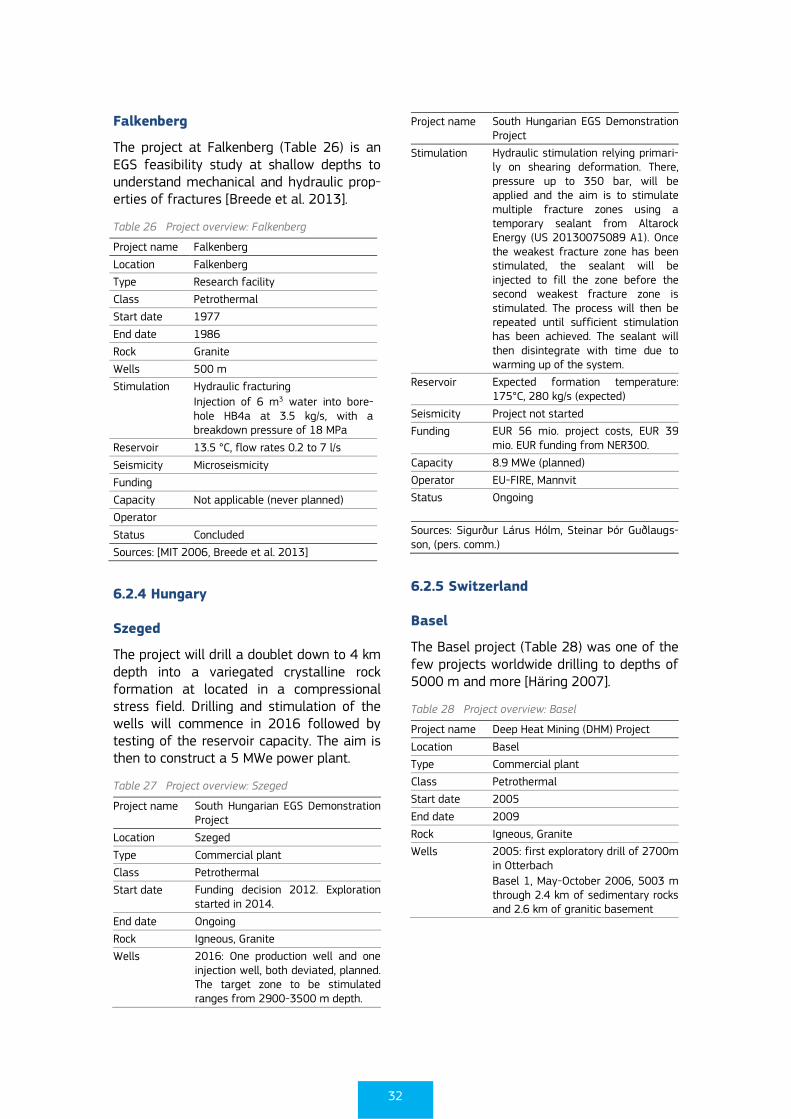
32
Falkenberg
The project at Falkenberg (Table 26) is an EGS feasibility study at shallow depths to understand mechanical and hydraulic prop-erties of fractures [Breede et al. 2013].
Table 26 Project overview: Falkenberg
Project name Falkenberg
Location Falkenberg
Type Research facility
Class Petrothermal
Start date 1977
End date 1986
Rock Granite
Wells 500 m
Stimulation Hydraulic fracturing
Injection of 6 m3 water into bore-hole HB4a at 3.5 kg/s, with a breakdown pressure of 18 MPa
Reservoir 13.5 °C, flow rates 0.2 to 7 l/s
Seismicity Microseismicity
Funding
Capacity Not applicable (never planned)
Operator
Status Concluded
Sources: [MIT 2006, Breede et al. 2013]
6.2.4 Hungary
Szeged
The project will drill a doublet down to 4 km depth into a variegated crystalline rock formation at located in a compressional stress field. Drilling and stimulation of the wells will commence in 2016 followed by testing of the reservoir capacity. The aim is then to construct a 5 MWe power plant.
Table 27 Project overview: Szeged
Project name South Hungarian EGS Demonstration Project
Location Szeged
Type Commercial plant
Class Petrothermal
Start date Funding decision 2012. Exploration started in 2014.
End date Ongoing
Rock Igneous, Granite
Wells 2016: One production well and one injection well, both deviated, planned. The target zone to be stimulated ranges from 2900-3500 m depth.
Project name South Hungarian EGS Demonstration Project
Stimulation Hydraulic stimulation relying primari-ly on shearing deformation. There, pressure up to 350 bar, will be applied and the aim is to stimulate multiple fracture zones using a temporary sealant from Altarock Energy (US 20130075089 A1). Once the weakest fracture zone has been stimulated, the sealant will be injected to fill the zone before the second weakest fracture zone is stimulated. The process will then be repeated until sufficient stimulation has been achieved. The sealant will then disintegrate with time due to warming up of the system.
Reservoir Expected formation temperature: 175°C, 280 kg/s (expected)
Seismicity Project not started
Funding EUR 56 mio. project costs, EUR 39 mio. EUR funding from NER300.
Capacity 8.9 MWe (planned)
Operator EU-FIRE, Mannvit
Status Ongoing
Sources: Sigurður Lárus Hólm, Steinar Þór Guðlaugs-son, (pers. comm.)
6.2.5 Switzerland
Basel
The Basel project (Table 28) was one of the few projects worldwide drilling to depths of 5000 m and more [Häring 2007].
Table 28 Project overview: Basel
Project name Deep Heat Mining (DHM) Project
Location Basel
Type Commercial plant
Class Petrothermal
Start date 2005
End date 2009
Rock Igneous, Granite
Wells 2005: first exploratory drill of 2700m in Otterbach
Basel 1, May-October 2006, 5003 m through 2.4 km of sedimentary rocks and 2.6 km of granitic basement
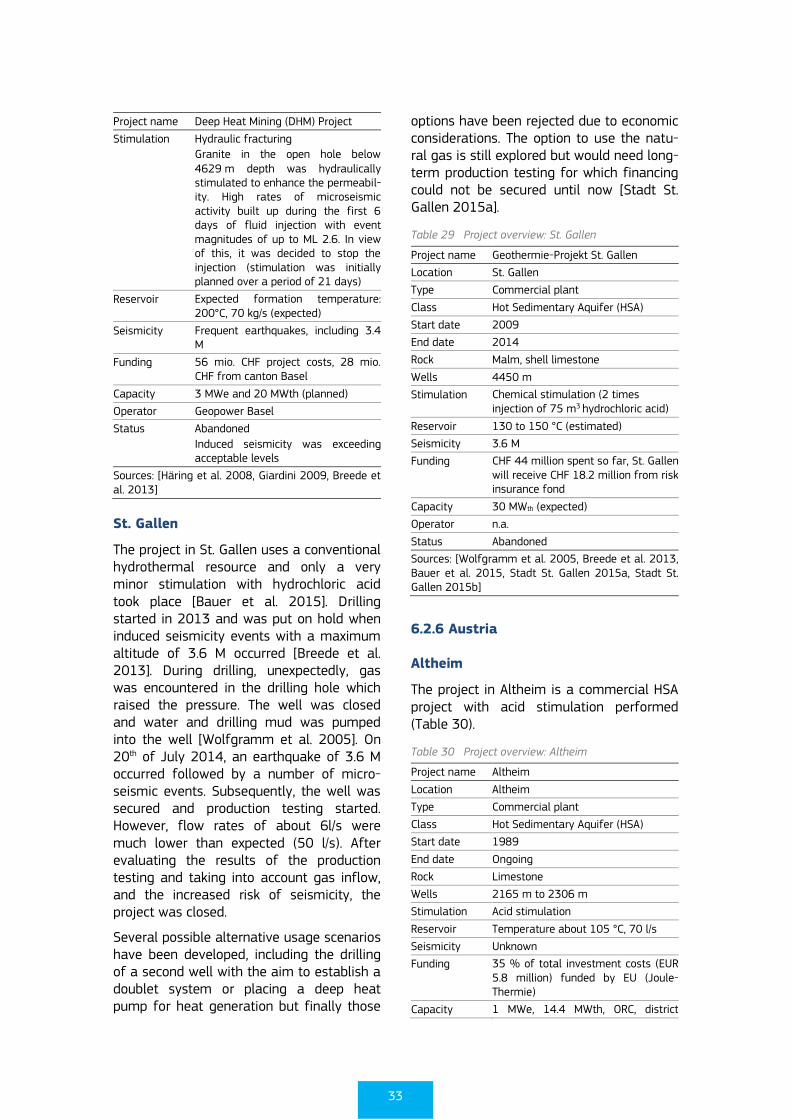
33
Project name Deep Heat Mining (DHM) Project
Stimulation Hydraulic fracturing
Granite in the open hole below 4629 m depth was hydraulically stimulated to enhance the permeabil-ity. High rates of microseismic activity built up during the first 6 days of fluid injection with event magnitudes of up to ML 2.6. In view of this, it was decided to stop the injection (stimulation was initially planned over a period of 21 days)
Reservoir Expected formation temperature: 200°C, 70 kg/s (expected)
Seismicity Frequent earthquakes, including 3.4 M
Funding 56 mio. CHF project costs, 28 mio. CHF from canton Basel
Capacity 3 MWe and 20 MWth (planned)
Operator Geopower Basel
Status Abandoned
Induced seismicity was exceeding acceptable levels
Sources: [Häring et al. 2008, Giardini 2009, Breede et al. 2013]
St. Gallen
The project in St. Gallen uses a conventional hydrothermal resource and only a very minor stimulation with hydrochloric acid took place [Bauer et al. 2015]. Drilling started in 2013 and was put on hold when induced seismicity events with a maximum altitude of 3.6 M occurred [Breede et al. 2013]. During drilling, unexpectedly, gas was encountered in the drilling hole which raised the pressure. The well was closed and water and drilling mud was pumped into the well [Wolfgramm et al. 2005]. On 20th of July 2014, an earthquake of 3.6 M occurred followed by a number of micro-seismic events. Subsequently, the well was secured and production testing started. However, flow rates of about 6l/s were much lower than expected (50 l/s). After evaluating the results of the production testing and taking into account gas inflow, and the increased risk of seismicity, the project was closed.
Several possible alternative usage scenarios have been developed, including the drilling of a second well with the aim to establish a doublet system or placing a deep heat pump for heat generation but finally those
options have been rejected due to economic considerations. The option to use the natu-ral gas is still explored but would need long-term production testing for which financing could not be secured until now [Stadt St. Gallen 2015a].
Table 29 Project overview: St. Gallen
Project name Geothermie-Projekt St. Gallen
Location St. Gallen
Type Commercial plant
Class Hot Sedimentary Aquifer (HSA)
Start date 2009
End date 2014
Rock Malm, shell limestone
Wells 4450 m
Stimulation Chemical stimulation (2 times injection of 75 m3 hydrochloric acid)
Reservoir 130 to 150 °C (estimated)
Seismicity 3.6 M
Funding CHF 44 million spent so far, St. Gallen will receive CHF 18.2 million from risk insurance fond
Capacity 30 MWth (expected)
Operator n.a.
Status Abandoned
Sources: [Wolfgramm et al. 2005, Breede et al. 2013, Bauer et al. 2015, Stadt St. Gallen 2015a, Stadt St. Gallen 2015b]
6.2.6 Austria
Altheim
The project in Altheim is a commercial HSA project with acid stimulation performed (Table 30).
Table 30 Project overview: Altheim
Project name Altheim
Location Altheim
Type Commercial plant
Class Hot Sedimentary Aquifer (HSA)
Start date 1989
End date Ongoing
Rock Limestone
Wells 2165 m to 2306 m
Stimulation Acid stimulation
Reservoir Temperature about 105 °C, 70 l/s
Seismicity Unknown
Funding 35 % of total investment costs (EUR 5.8 million) funded by EU (Joule-Thermie)
Capacity 1 MWe, 14.4 MWth, ORC, district
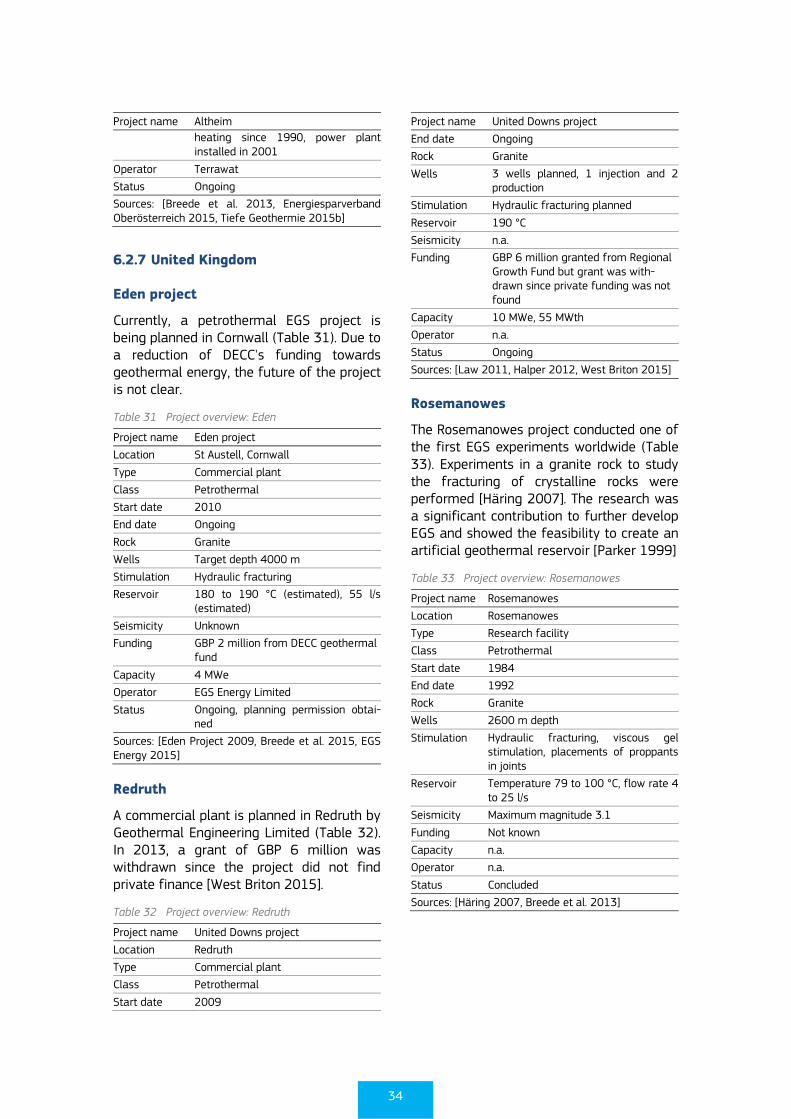
34
Project name Altheim
heating since 1990, power plant installed in 2001
Operator Terrawat
Status Ongoing
Sources: [Breede et al. 2013, Energiesparverband Oberösterreich 2015, Tiefe Geothermie 2015b]
6.2.7 United Kingdom
Eden project
Currently, a petrothermal EGS project is being planned in Cornwall (Table 31). Due to a reduction of DECC's funding towards geothermal energy, the future of the project is not clear.
Table 31 Project overview: Eden
Project name Eden project
Location St Austell, Cornwall
Type Commercial plant
Class Petrothermal
Start date 2010
End date Ongoing
Rock Granite
Wells Target depth 4000 m
Stimulation Hydraulic fracturing
Reservoir 180 to 190 °C (estimated), 55 l/s (estimated)
Seismicity Unknown
Funding GBP 2 million from DECC geothermal fund
Capacity 4 MWe
Operator EGS Energy Limited
Status Ongoing, planning permission obtai-ned
Sources: [Eden Project 2009, Breede et al. 2015, EGS Energy 2015]
Redruth
A commercial plant is planned in Redruth by Geothermal Engineering Limited (Table 32). In 2013, a grant of GBP 6 million was withdrawn since the project did not find private finance [West Briton 2015].
Table 32 Project overview: Redruth
Project name United Downs project
Location Redruth
Type Commercial plant
Class Petrothermal
Start date 2009
Project name United Downs project
End date Ongoing
Rock Granite
Wells 3 wells planned, 1 injection and 2 production
Stimulation Hydraulic fracturing planned
Reservoir 190 °C
Seismicity n.a.
Funding GBP 6 million granted from Regional Growth Fund but grant was with-drawn since private funding was not found
Capacity 10 MWe, 55 MWth
Operator n.a.
Status Ongoing
Sources: [Law 2011, Halper 2012, West Briton 2015]
Rosemanowes
The Rosemanowes project conducted one of the first EGS experiments worldwide (Table 33). Experiments in a granite rock to study the fracturing of crystalline rocks were performed [Häring 2007]. The research was a significant contribution to further develop EGS and showed the feasibility to create an artificial geothermal reservoir [Parker 1999]
Table 33 Project overview: Rosemanowes
Project name Rosemanowes
Location Rosemanowes
Type Research facility
Class Petrothermal
Start date 1984
End date 1992
Rock Granite
Wells 2600 m depth
Stimulation Hydraulic fracturing, viscous gel stimulation, placements of proppants in joints
Reservoir Temperature 79 to 100 °C, flow rate 4 to 25 l/s
Seismicity Maximum magnitude 3.1
Funding Not known
Capacity n.a.
Operator n.a.
Status Concluded
Sources: [Häring 2007, Breede et al. 2013]
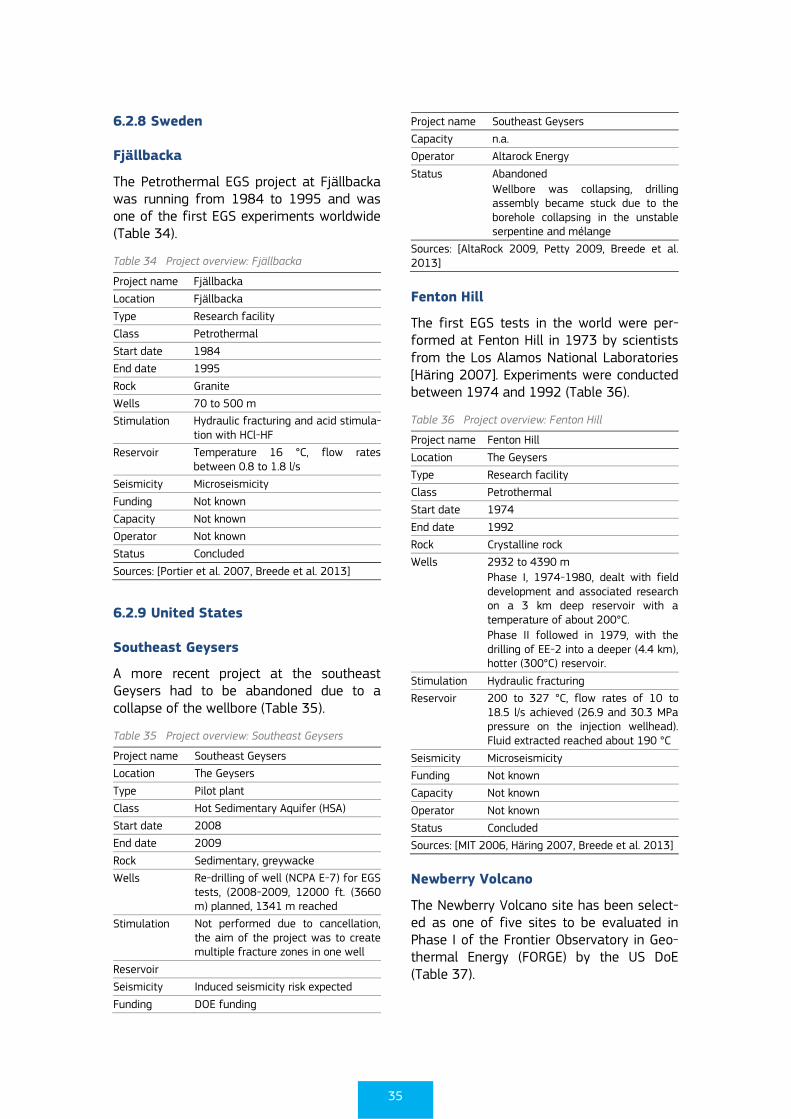
35
6.2.8 Sweden
Fjällbacka
The Petrothermal EGS project at Fjällbacka was running from 1984 to 1995 and was one of the first EGS experiments worldwide (Table 34).
Table 34 Project overview: Fjällbacka
Project name Fjällbacka
Location Fjällbacka
Type Research facility
Class Petrothermal
Start date 1984
End date 1995
Rock Granite
Wells 70 to 500 m
Stimulation Hydraulic fracturing and acid stimula-tion with HCl-HF
Reservoir Temperature 16 °C, flow rates between 0.8 to 1.8 l/s
Seismicity Microseismicity
Funding Not known
Capacity Not known
Operator Not known
Status Concluded
Sources: [Portier et al. 2007, Breede et al. 2013]
6.2.9 United States
Southeast Geysers
A more recent project at the southeast Geysers had to be abandoned due to a collapse of the wellbore (Table 35).
Table 35 Project overview: Southeast Geysers
Project name Southeast Geysers
Location The Geysers
Type Pilot plant
Class Hot Sedimentary Aquifer (HSA)
Start date 2008
End date 2009
Rock Sedimentary, greywacke
Wells Re-drilling of well (NCPA E-7) for EGS tests, (2008-2009, 12000 ft. (3660 m) planned, 1341 m reached
Stimulation Not performed due to cancellation, the aim of the project was to create multiple fracture zones in one well
Reservoir
Seismicity Induced seismicity risk expected
Funding DOE funding
Project name Southeast Geysers
Capacity n.a.
Operator Altarock Energy
Status Abandoned
Wellbore was collapsing, drilling assembly became stuck due to the borehole collapsing in the unstable serpentine and mélange
Sources: [AltaRock 2009, Petty 2009, Breede et al. 2013]
Fenton Hill
The first EGS tests in the world were per-formed at Fenton Hill in 1973 by scientists from the Los Alamos National Laboratories [Häring 2007]. Experiments were conducted between 1974 and 1992 (Table 36).
Table 36 Project overview: Fenton Hill
Project name Fenton Hill
Location The Geysers
Type Research facility
Class Petrothermal
Start date 1974
End date 1992
Rock Crystalline rock
Wells 2932 to 4390 m
Phase I, 1974-1980, dealt with field development and associated research on a 3 km deep reservoir with a temperature of about 200°C.
Phase II followed in 1979, with the drilling of EE-2 into a deeper (4.4 km), hotter (300°C) reservoir.
Stimulation Hydraulic fracturing
Reservoir 200 to 327 °C, flow rates of 10 to 18.5 l/s achieved (26.9 and 30.3 MPa pressure on the injection wellhead). Fluid extracted reached about 190 °C
Seismicity Microseismicity
Funding Not known
Capacity Not known
Operator Not known
Status Concluded
Sources: [MIT 2006, Häring 2007, Breede et al. 2013]
Newberry Volcano
The Newberry Volcano site has been select-ed as one of five sites to be evaluated in Phase I of the Frontier Observatory in Geo-thermal Energy (FORGE) by the US DoE (Table 37).
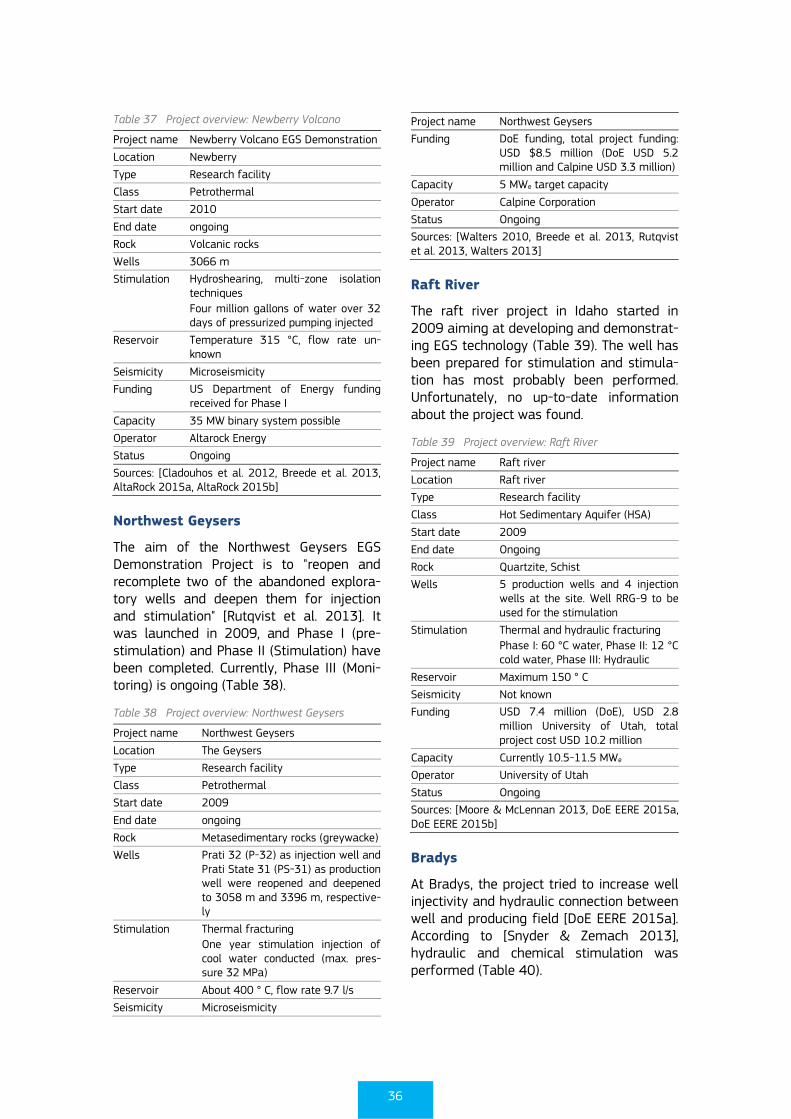
36
Table 37 Project overview: Newberry Volcano
Project name Newberry Volcano EGS Demonstration
Location Newberry
Type Research facility
Class Petrothermal
Start date 2010
End date ongoing
Rock Volcanic rocks
Wells 3066 m
Stimulation Hydroshearing, multi-zone isolation techniques
Four million gallons of water over 32 days of pressurized pumping injected
Reservoir Temperature 315 °C, flow rate un-known
Seismicity Microseismicity
Funding US Department of Energy funding received for Phase I
Capacity 35 MW binary system possible
Operator Altarock Energy
Status Ongoing
Sources: [Cladouhos et al. 2012, Breede et al. 2013, AltaRock 2015a, AltaRock 2015b]
Northwest Geysers
The aim of the Northwest Geysers EGS Demonstration Project is to "reopen and recomplete two of the abandoned explora-tory wells and deepen them for injection and stimulation" [Rutqvist et al. 2013]. It was launched in 2009, and Phase I (pre-stimulation) and Phase II (Stimulation) have been completed. Currently, Phase III (Moni-toring) is ongoing (Table 38).
Table 38 Project overview: Northwest Geysers
Project name Northwest Geysers
Location The Geysers
Type Research facility
Class Petrothermal
Start date 2009
End date ongoing
Rock Metasedimentary rocks (greywacke)
Wells Prati 32 (P-32) as injection well and Prati State 31 (PS-31) as production well were reopened and deepened to 3058 m and 3396 m, respective-ly
Stimulation Thermal fracturing
One year stimulation injection of cool water conducted (max. pres-sure 32 MPa)
Reservoir About 400 ° C, flow rate 9.7 l/s
Seismicity Microseismicity
Project name Northwest Geysers
Funding DoE funding, total project funding: USD $8.5 million (DoE USD 5.2 million and Calpine USD 3.3 million)
Capacity 5 MWe target capacity
Operator Calpine Corporation
Status Ongoing
Sources: [Walters 2010, Breede et al. 2013, Rutqvist et al. 2013, Walters 2013]
Raft River
The raft river project in Idaho started in 2009 aiming at developing and demonstrat-ing EGS technology (Table 39). The well has been prepared for stimulation and stimula-tion has most probably been performed. Unfortunately, no up-to-date information about the project was found.
Table 39 Project overview: Raft River
Project name Raft river
Location Raft river
Type Research facility
Class Hot Sedimentary Aquifer (HSA)
Start date 2009
End date Ongoing
Rock Quartzite, Schist
Wells 5 production wells and 4 injection wells at the site. Well RRG-9 to be used for the stimulation
Stimulation Thermal and hydraulic fracturing
Phase I: 60 °C water, Phase II: 12 °C cold water, Phase III: Hydraulic
Reservoir Maximum 150 ° C
Seismicity Not known
Funding USD 7.4 million (DoE), USD 2.8 million University of Utah, total project cost USD 10.2 million
Capacity Currently 10.5-11.5 MWe
Operator University of Utah
Status Ongoing
Sources: [Moore & McLennan 2013, DoE EERE 2015a, DoE EERE 2015b]
Bradys
At Bradys, the project tried to increase well injectivity and hydraulic connection between well and producing field [DoE EERE 2015a]. According to [Snyder & Zemach 2013], hydraulic and chemical stimulation was performed (Table 40).
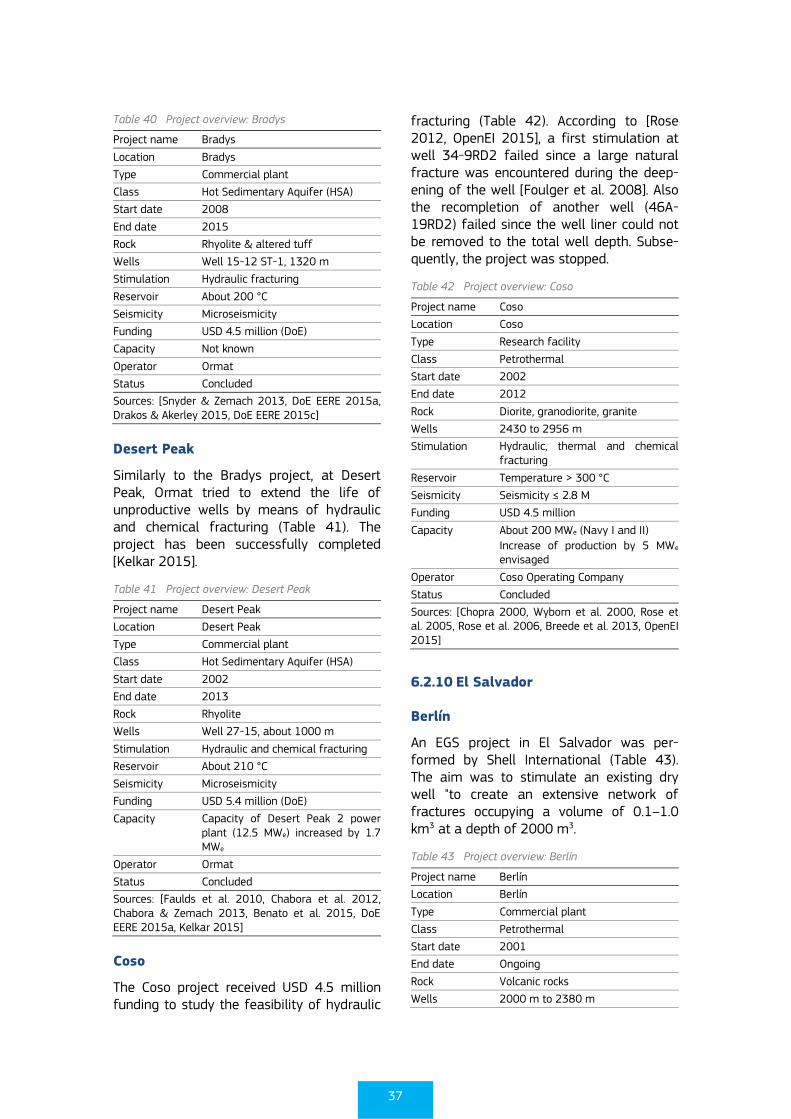
37
Table 40 Project overview: Bradys
Project name Bradys
Location Bradys
Type Commercial plant
Class Hot Sedimentary Aquifer (HSA)
Start date 2008
End date 2015
Rock Rhyolite & altered tuff
Wells Well 15-12 ST-1, 1320 m
Stimulation Hydraulic fracturing
Reservoir About 200 °C
Seismicity Microseismicity
Funding USD 4.5 million (DoE)
Capacity Not known
Operator Ormat
Status Concluded
Sources: [Snyder & Zemach 2013, DoE EERE 2015a, Drakos & Akerley 2015, DoE EERE 2015c]
Desert Peak
Similarly to the Bradys project, at Desert Peak, Ormat tried to extend the life of unproductive wells by means of hydraulic and chemical fracturing (Table 41). The project has been successfully completed [Kelkar 2015].
Table 41 Project overview: Desert Peak
Project name Desert Peak
Location Desert Peak
Type Commercial plant
Class Hot Sedimentary Aquifer (HSA)
Start date 2002
End date 2013
Rock Rhyolite
Wells Well 27-15, about 1000 m
Stimulation Hydraulic and chemical fracturing
Reservoir About 210 °C
Seismicity Microseismicity
Funding USD 5.4 million (DoE)
Capacity Capacity of Desert Peak 2 power plant (12.5 MWe) increased by 1.7 MWe
Operator Ormat
Status Concluded
Sources: [Faulds et al. 2010, Chabora et al. 2012, Chabora & Zemach 2013, Benato et al. 2015, DoE EERE 2015a, Kelkar 2015]
Coso
The Coso project received USD 4.5 million funding to study the feasibility of hydraulic
fracturing (Table 42). According to [Rose 2012, OpenEI 2015], a first stimulation at well 34-9RD2 failed since a large natural fracture was encountered during the deep-ening of the well [Foulger et al. 2008]. Also the recompletion of another well (46A-19RD2) failed since the well liner could not be removed to the total well depth. Subse-quently, the project was stopped.
Table 42 Project overview: Coso
Project name Coso
Location Coso
Type Research facility
Class Petrothermal
Start date 2002
End date 2012
Rock Diorite, granodiorite, granite
Wells 2430 to 2956 m
Stimulation Hydraulic, thermal and chemical fracturing
Reservoir Temperature > 300 °C
Seismicity Seismicity ≤ 2.8 M
Funding USD 4.5 million
Capacity About 200 MWe (Navy I and II)
Increase of production by 5 MWe envisaged
Operator Coso Operating Company
Status Concluded
Sources: [Chopra 2000, Wyborn et al. 2000, Rose et al. 2005, Rose et al. 2006, Breede et al. 2013, OpenEI 2015]
6.2.10 El Salvador
Berlín
An EGS project in El Salvador was per-formed by Shell International (Table 43). The aim was to stimulate an existing dry well "to create an extensive network of fractures occupying a volume of 0.1–1.0 km3 at a depth of 2000 m3.
Table 43 Project overview: Berlín
Project name Berlín
Location Berlín
Type Commercial plant
Class Petrothermal
Start date 2001
End date Ongoing
Rock Volcanic rocks
Wells 2000 m to 2380 m
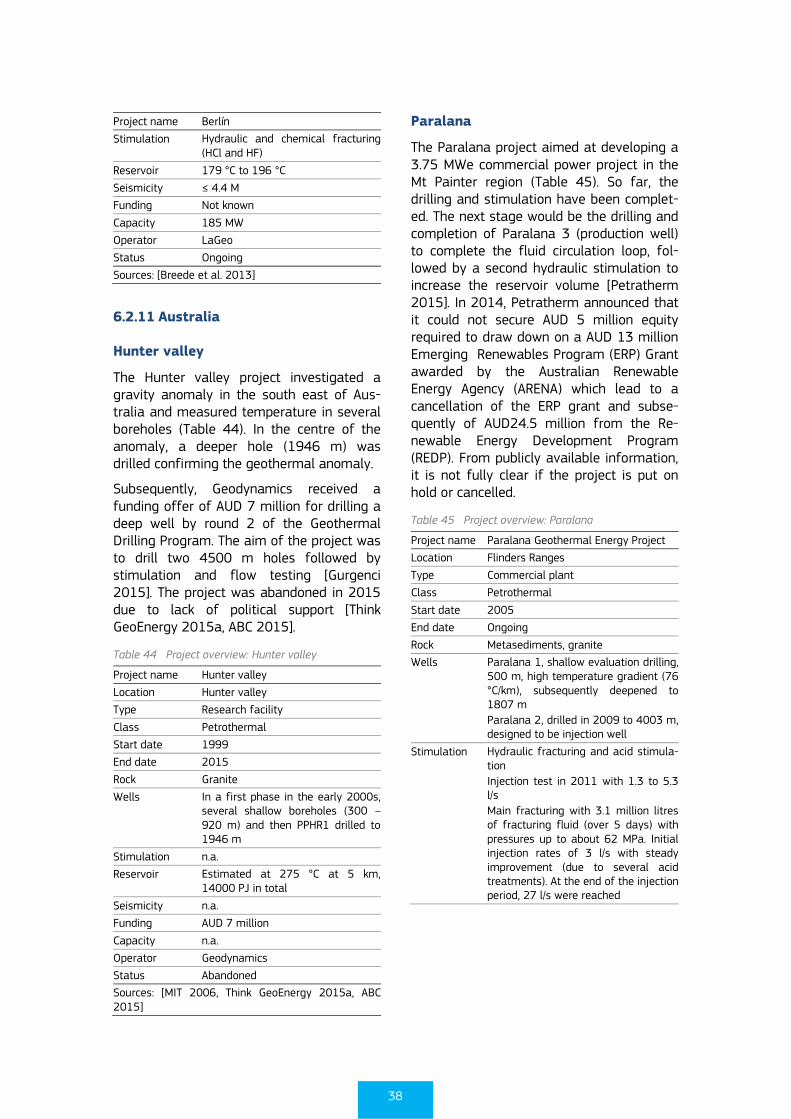
38
Project name Berlín
Stimulation Hydraulic and chemical fracturing (HCl and HF)
Reservoir 179 °C to 196 °C
Seismicity ≤ 4.4 M
Funding Not known
Capacity 185 MW
Operator LaGeo
Status Ongoing
Sources: [Breede et al. 2013]
6.2.11 Australia
Hunter valley
The Hunter valley project investigated a gravity anomaly in the south east of Aus-tralia and measured temperature in several boreholes (Table 44). In the centre of the anomaly, a deeper hole (1946 m) was drilled confirming the geothermal anomaly.
Subsequently, Geodynamics received a funding offer of AUD 7 million for drilling a deep well by round 2 of the Geothermal Drilling Program. The aim of the project was to drill two 4500 m holes followed by stimulation and flow testing [Gurgenci 2015]. The project was abandoned in 2015 due to lack of political support [Think GeoEnergy 2015a, ABC 2015].
Table 44 Project overview: Hunter valley
Project name Hunter valley
Location Hunter valley
Type Research facility
Class Petrothermal
Start date 1999
End date 2015
Rock Granite
Wells In a first phase in the early 2000s, several shallow boreholes (300 – 920 m) and then PPHR1 drilled to 1946 m
Stimulation n.a.
Reservoir Estimated at 275 °C at 5 km, 14000 PJ in total
Seismicity n.a.
Funding AUD 7 million
Capacity n.a.
Operator Geodynamics
Status Abandoned
Sources: [MIT 2006, Think GeoEnergy 2015a, ABC 2015]
Paralana
The Paralana project aimed at developing a 3.75 MWe commercial power project in the Mt Painter region (Table 45). So far, the drilling and stimulation have been complet-ed. The next stage would be the drilling and completion of Paralana 3 (production well) to complete the fluid circulation loop, fol-lowed by a second hydraulic stimulation to increase the reservoir volume [Petratherm 2015]. In 2014, Petratherm announced that it could not secure AUD 5 million equity required to draw down on a AUD 13 million Emerging Renewables Program (ERP) Grant awarded by the Australian Renewable Energy Agency (ARENA) which lead to a cancellation of the ERP grant and subse-quently of AUD24.5 million from the Re-newable Energy Development Program (REDP). From publicly available information, it is not fully clear if the project is put on hold or cancelled.
Table 45 Project overview: Paralana
Project name Paralana Geothermal Energy Project
Location Flinders Ranges
Type Commercial plant
Class Petrothermal
Start date 2005
End date Ongoing
Rock Metasediments, granite
Wells Paralana 1, shallow evaluation drilling, 500 m, high temperature gradient (76 °C/km), subsequently deepened to 1807 m
Paralana 2, drilled in 2009 to 4003 m, designed to be injection well
Stimulation Hydraulic fracturing and acid stimula-tion
Injection test in 2011 with 1.3 to 5.3 l/s
Main fracturing with 3.1 million litres of fracturing fluid (over 5 days) with pressures up to about 62 MPa. Initial injection rates of 3 l/s with steady improvement (due to several acid treatments). At the end of the injection period, 27 l/s were reached
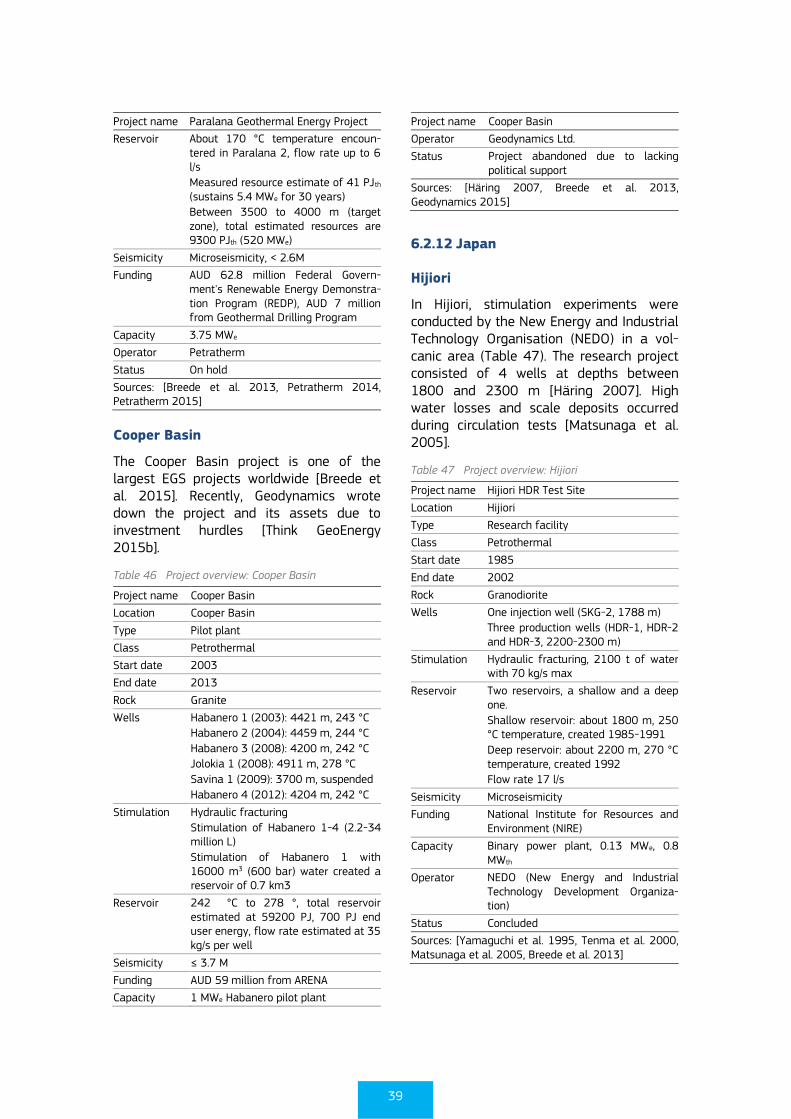
39
Project name Paralana Geothermal Energy Project
Reservoir About 170 °C temperature encoun-tered in Paralana 2, flow rate up to 6 l/s
Measured resource estimate of 41 PJth (sustains 5.4 MWe for 30 years)
Between 3500 to 4000 m (target zone), total estimated resources are 9300 PJth (520 MWe)
Seismicity Microseismicity, < 2.6M
Funding AUD 62.8 million Federal Govern-ment's Renewable Energy Demonstra-tion Program (REDP), AUD 7 million from Geothermal Drilling Program
Capacity 3.75 MWe
Operator Petratherm
Status On hold
Sources: [Breede et al. 2013, Petratherm 2014, Petratherm 2015]
Cooper Basin
The Cooper Basin project is one of the largest EGS projects worldwide [Breede et al. 2015]. Recently, Geodynamics wrote down the project and its assets due to investment hurdles [Think GeoEnergy 2015b].
Table 46 Project overview: Cooper Basin
Project name Cooper Basin
Location Cooper Basin
Type Pilot plant
Class Petrothermal
Start date 2003
End date 2013
Rock Granite
Wells Habanero 1 (2003): 4421 m, 243 °C
Habanero 2 (2004): 4459 m, 244 °C
Habanero 3 (2008): 4200 m, 242 °C
Jolokia 1 (2008): 4911 m, 278 °C
Savina 1 (2009): 3700 m, suspended
Habanero 4 (2012): 4204 m, 242 °C
Stimulation Hydraulic fracturing
Stimulation of Habanero 1-4 (2.2-34 million L)
Stimulation of Habanero 1 with 16000 m3 (600 bar) water created a reservoir of 0.7 km3
Reservoir 242 °C to 278 °, total reservoir estimated at 59200 PJ, 700 PJ end user energy, flow rate estimated at 35 kg/s per well
Seismicity ≤ 3.7 M
Funding AUD 59 million from ARENA
Capacity 1 MWe Habanero pilot plant
Project name Cooper Basin
Operator Geodynamics Ltd.
Status Project abandoned due to lacking political support
Sources: [Häring 2007, Breede et al. 2013, Geodynamics 2015]
6.2.12 Japan
Hijiori
In Hijiori, stimulation experiments were conducted by the New Energy and Industrial Technology Organisation (NEDO) in a vol-canic area (Table 47). The research project consisted of 4 wells at depths between 1800 and 2300 m [Häring 2007]. High water losses and scale deposits occurred during circulation tests [Matsunaga et al. 2005].
Table 47 Project overview: Hijiori
Project name Hijiori HDR Test Site
Location Hijiori
Type Research facility
Class Petrothermal
Start date 1985
End date 2002
Rock Granodiorite
Wells One injection well (SKG-2, 1788 m)
Three production wells (HDR-1, HDR-2 and HDR-3, 2200-2300 m)
Stimulation Hydraulic fracturing, 2100 t of water with 70 kg/s max
Reservoir Two reservoirs, a shallow and a deep one.
Shallow reservoir: about 1800 m, 250 °C temperature, created 1985-1991
Deep reservoir: about 2200 m, 270 °C temperature, created 1992
Flow rate 17 l/s
Seismicity Microseismicity
Funding National Institute for Resources and Environment (NIRE)
Capacity Binary power plant, 0.13 MWe, 0.8 MWth
Operator NEDO (New Energy and Industrial Technology Development Organiza-tion)
Status Concluded
Sources: [Yamaguchi et al. 1995, Tenma et al. 2000, Matsunaga et al. 2005, Breede et al. 2013]
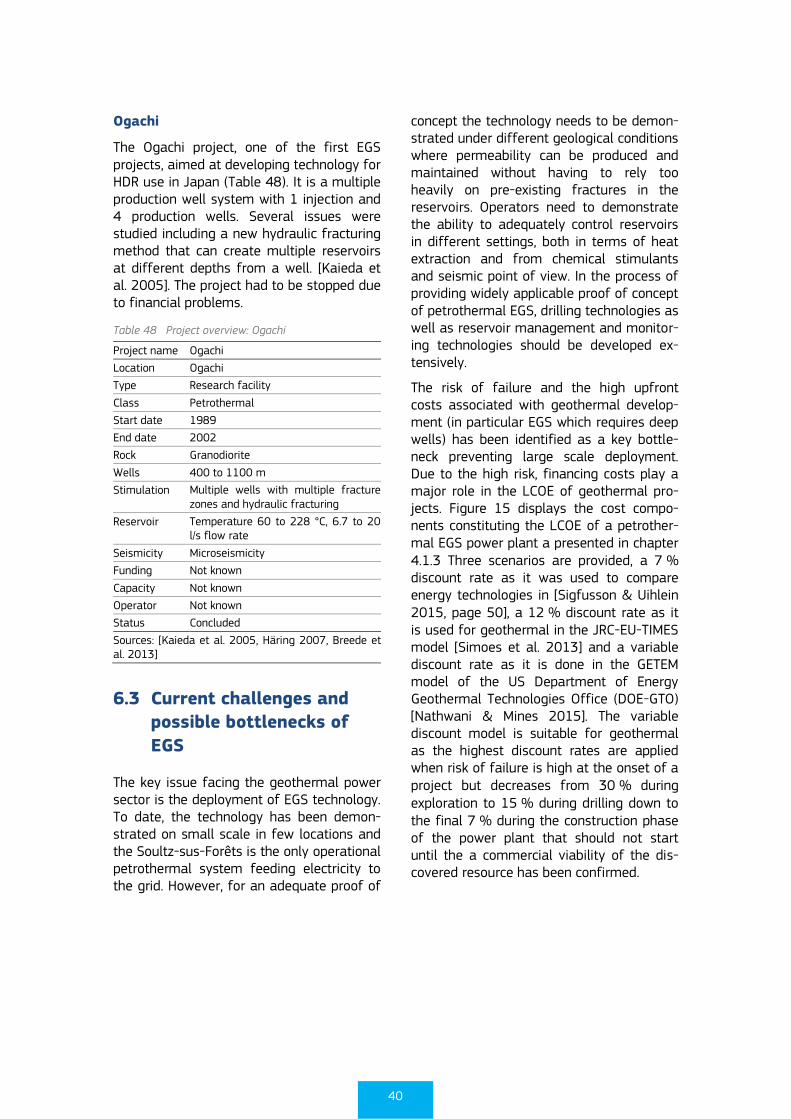
40
Ogachi
The Ogachi project, one of the first EGS projects, aimed at developing technology for HDR use in Japan (Table 48). It is a multiple production well system with 1 injection and 4 production wells. Several issues were studied including a new hydraulic fracturing method that can create multiple reservoirs at different depths from a well. [Kaieda et al. 2005]. The project had to be stopped due to financial problems.
Table 48 Project overview: Ogachi
Project name Ogachi
Location Ogachi
Type Research facility
Class Petrothermal
Start date 1989
End date 2002
Rock Granodiorite
Wells 400 to 1100 m
Stimulation Multiple wells with multiple fracture zones and hydraulic fracturing
Reservoir Temperature 60 to 228 °C, 6.7 to 20 l/s flow rate
Seismicity Microseismicity
Funding Not known
Capacity Not known
Operator Not known
Status Concluded
Sources: [Kaieda et al. 2005, Häring 2007, Breede et al. 2013]
6.3 Current challenges and
possible bottlenecks of
EGS
The key issue facing the geothermal power sector is the deployment of EGS technology. To date, the technology has been demon-strated on small scale in few locations and the Soultz-sus-Forêts is the only operational petrothermal system feeding electricity to the grid. However, for an adequate proof of
concept the technology needs to be demon-strated under different geological conditions where permeability can be produced and maintained without having to rely too heavily on pre-existing fractures in the reservoirs. Operators need to demonstrate the ability to adequately control reservoirs in different settings, both in terms of heat extraction and from chemical stimulants and seismic point of view. In the process of providing widely applicable proof of concept of petrothermal EGS, drilling technologies as well as reservoir management and monitor-ing technologies should be developed ex-tensively.
The risk of failure and the high upfront costs associated with geothermal develop-ment (in particular EGS which requires deep wells) has been identified as a key bottle-neck preventing large scale deployment. Due to the high risk, financing costs play a major role in the LCOE of geothermal pro-jects. Figure 15 displays the cost compo-nents constituting the LCOE of a petrother-mal EGS power plant a presented in chapter 4.1.3 Three scenarios are provided, a 7 % discount rate as it was used to compare energy technologies in [Sigfusson & Uihlein 2015, page 50], a 12 % discount rate as it is used for geothermal in the JRC-EU-TIMES model [Simoes et al. 2013] and a variable discount rate as it is done in the GETEM model of the US Department of Energy Geothermal Technologies Office (DOE-GTO) [Nathwani & Mines 2015]. The variable discount model is suitable for geothermal as the highest discount rates are applied when risk of failure is high at the onset of a project but decreases from 30 % during exploration to 15 % during drilling down to the final 7 % during the construction phase of the power plant that should not start until the a commercial viability of the dis-covered resource has been confirmed.
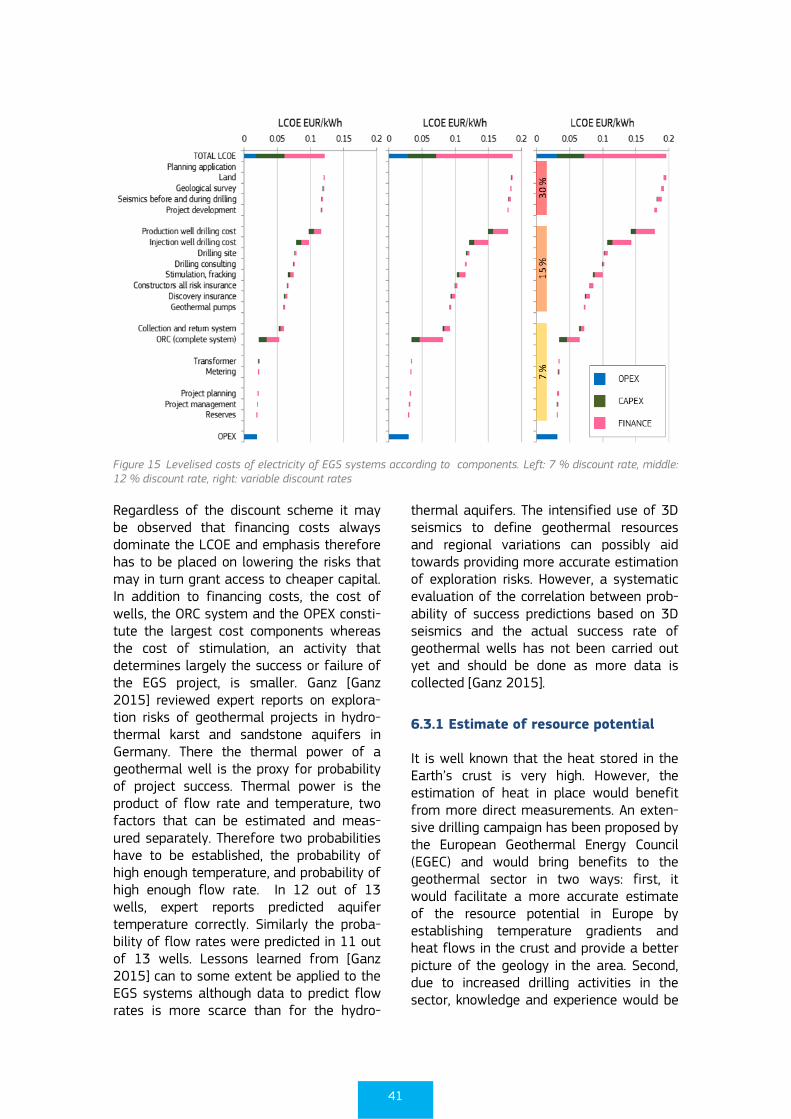
41
Figure 15 Levelised costs of electricity of EGS systems according to components. Left: 7 % discount rate, middle: 12 % discount rate, right: variable discount rates
Regardless of the discount scheme it may be observed that financing costs always dominate the LCOE and emphasis therefore has to be placed on lowering the risks that may in turn grant access to cheaper capital. In addition to financing costs, the cost of wells, the ORC system and the OPEX consti-tute the largest cost components whereas the cost of stimulation, an activity that determines largely the success or failure of the EGS project, is smaller. Ganz [Ganz 2015] reviewed expert reports on explora-tion risks of geothermal projects in hydro-thermal karst and sandstone aquifers in Germany. There the thermal power of a geothermal well is the proxy for probability of project success. Thermal power is the product of flow rate and temperature, two factors that can be estimated and meas-ured separately. Therefore two probabilities have to be established, the probability of high enough temperature, and probability of high enough flow rate. In 12 out of 13 wells, expert reports predicted aquifer temperature correctly. Similarly the proba-bility of flow rates were predicted in 11 out of 13 wells. Lessons learned from [Ganz 2015] can to some extent be applied to the EGS systems although data to predict flow rates is more scarce than for the hydro-
thermal aquifers. The intensified use of 3D seismics to define geothermal resources and regional variations can possibly aid towards providing more accurate estimation of exploration risks. However, a systematic evaluation of the correlation between prob-ability of success predictions based on 3D seismics and the actual success rate of geothermal wells has not been carried out yet and should be done as more data is collected [Ganz 2015].
6.3.1 Estimate of resource potential
It is well known that the heat stored in the Earth’s crust is very high. However, the estimation of heat in place would benefit from more direct measurements. An exten-sive drilling campaign has been proposed by the European Geothermal Energy Council (EGEC) and would bring benefits to the geothermal sector in two ways: first, it would facilitate a more accurate estimate of the resource potential in Europe by establishing temperature gradients and heat flows in the crust and provide a better picture of the geology in the area. Second, due to increased drilling activities in the sector, knowledge and experience would be
42
accumulated quicker. These factors both lead to lower overall capital costs lower risk of failure which in turn may lead to lower financing cost of the project.
6.3.2 Drilling risks and costs
Today, drilling costs often constitute more than half of the cost associated with con-struction and commissioning of a geother-mal power plant. Drilling into hydrothermal reservoirs includes drilling into highly heter-ogeneous materials where hard rocks may alternate with fractures where complete loss of circulation and collapsing geological formations may be experienced. Loss of circulation can lead to extensive losses of drill muds and cements. Collapsing for-mations may prevent movement of casings and in worst cases lead to the necessity of cutting the drill string causing the bottom hole assembly, collars and parts of the drill string to be left in the well [Sveinbjornsson & Thorhallsson 2014]. The main reason for higher drilling costs of EGS systems com-pared to hydrothermal resources is the depth of wells. The elevated depth requires longer non-productive times during re-placement of drill bits and equipment and more energy to rotate the drill string. An intensive drilling campaign as mentioned in the chapter above provides the opportunity to develop and test novel drilling technolo-gies in a reasonably short period of time and better direct resource potential and drilling development projects are therefore highly complementary.
6.3.3 Reservoir stimulation and man-
agement
Reservoir stimulation is the single most critical research enabling the development of the EGS technology. Circulation of fluids must occur at sufficient rates to ensure sufficient commercial return, preferably with as small injection pressure as possible to lower pumping costs. At the same time, the volume of the reservoir has to be large enough to prevent premature breakthrough of injected waters with associated tempera-
ture decrease in production wells. Early thermal breakthrough has been observed where distance between injector and pro-ducer were less than 200 m [Roegiers et al. 2012] and references therein. The distance between the injectors and producers is not the only factor preventing thermal break-through and ensuring adequate thermal sweep from the reservoir. The key issue is making sure the fluids come in contact with sufficient reservoir volume.
Directional drilling and horizontal wells have become cheaper due to technical develop-ments in the oil and gas industry for en-hanced oil recovery and fracking. It can be of high value for geothermal operators to observe developments in this larger sector with the aim of more widespread imple-mentation for geothermal reservoir produc-tion. Fracture networks propagate from the wellbores in specific orientation that is related to the existing stresses in the geo-thermal reservoir. At several km depths the orientation of the fractures with the lowest fracture initiation pressure tend not to be horizontal (and therefore perpendicular to traditionally vertically drilled wells) but rather near vertical, depending on the regional tectonics. Hence, horizontal drilling increases the change of intersecting several fracture zones that can be stimulated. The elevated change of intersecting several potential fracture zones increases the change of commercially feasible power plant as experience has shown a single fracture zones only tend to sustain approx-imately 1-2 MW final production on the surface and furthermore increasing the sweeping volume of geothermal reservoirs is always of high priority of geothermal operators to prevent premature thermal drawdown at the production wells.
Stimulation of a geothermal reservoir may be carried out in four principal ways or combination of these [Roegiers et al. 2012, Schumacher & Schulz 2013]
1. Hydraulic stimulation is the process of injecting fluid into a rock mass at, or be-low the fracture opening pressure (Also known as matrix stimulation). The stimu-lation seeks to induce shear deformation
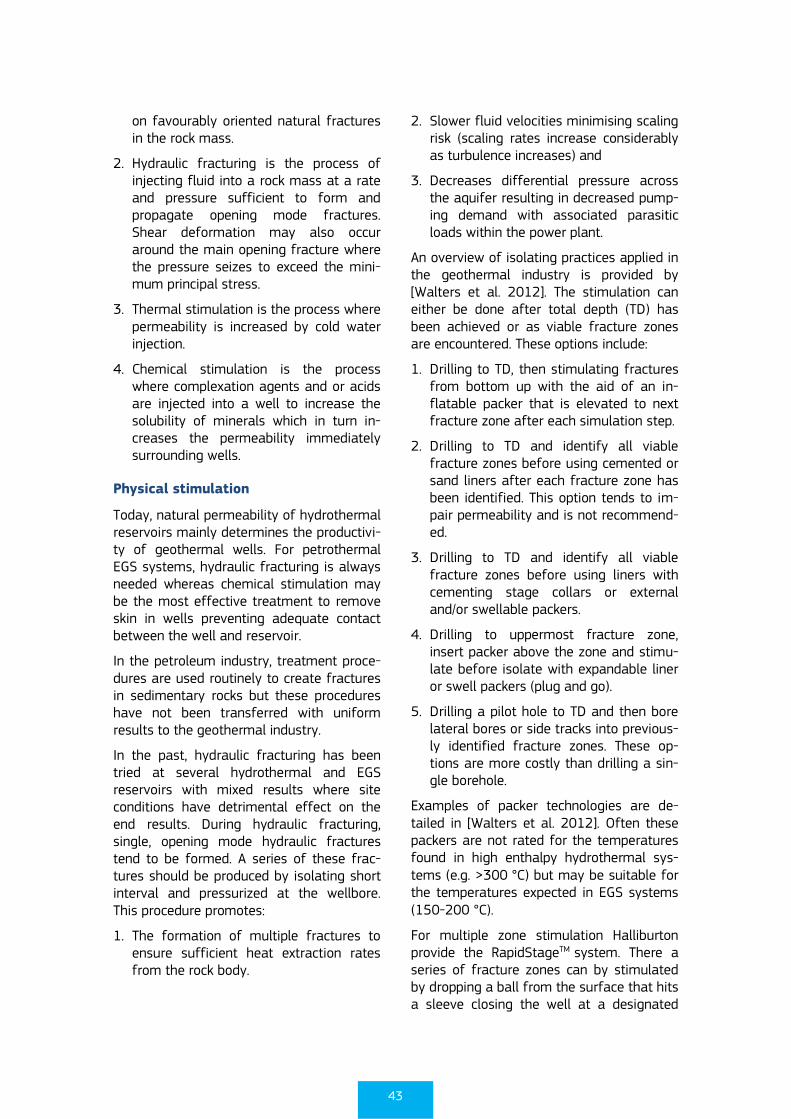
43
on favourably oriented natural fractures in the rock mass.
2. Hydraulic fracturing is the process of injecting fluid into a rock mass at a rate and pressure sufficient to form and propagate opening mode fractures. Shear deformation may also occur around the main opening fracture where the pressure seizes to exceed the mini-mum principal stress.
3. Thermal stimulation is the process where permeability is increased by cold water injection.
4. Chemical stimulation is the process where complexation agents and or acids are injected into a well to increase the solubility of minerals which in turn in-creases the permeability immediately surrounding wells.
Physical stimulation
Today, natural permeability of hydrothermal reservoirs mainly determines the productivi-ty of geothermal wells. For petrothermal EGS systems, hydraulic fracturing is always needed whereas chemical stimulation may be the most effective treatment to remove skin in wells preventing adequate contact between the well and reservoir.
In the petroleum industry, treatment proce-dures are used routinely to create fractures in sedimentary rocks but these procedures have not been transferred with uniform results to the geothermal industry.
In the past, hydraulic fracturing has been tried at several hydrothermal and EGS reservoirs with mixed results where site conditions have detrimental effect on the end results. During hydraulic fracturing, single, opening mode hydraulic fractures tend to be formed. A series of these frac-tures should be produced by isolating short interval and pressurized at the wellbore. This procedure promotes:
1. The formation of multiple fractures to ensure sufficient heat extraction rates from the rock body.
2. Slower fluid velocities minimising scaling risk (scaling rates increase considerably as turbulence increases) and
3. Decreases differential pressure across the aquifer resulting in decreased pump-ing demand with associated parasitic loads within the power plant.
An overview of isolating practices applied in the geothermal industry is provided by [Walters et al. 2012]. The stimulation can either be done after total depth (TD) has been achieved or as viable fracture zones are encountered. These options include:
1. Drilling to TD, then stimulating fractures from bottom up with the aid of an in-flatable packer that is elevated to next fracture zone after each simulation step.
2. Drilling to TD and identify all viable fracture zones before using cemented or sand liners after each fracture zone has been identified. This option tends to im-pair permeability and is not recommend-ed.
3. Drilling to TD and identify all viable fracture zones before using liners with cementing stage collars or external and/or swellable packers.
4. Drilling to uppermost fracture zone, insert packer above the zone and stimu-late before isolate with expandable liner or swell packers (plug and go).
5. Drilling a pilot hole to TD and then bore lateral bores or side tracks into previous-ly identified fracture zones. These op-tions are more costly than drilling a sin-gle borehole.
Examples of packer technologies are de-tailed in [Walters et al. 2012]. Often these packers are not rated for the temperatures found in high enthalpy hydrothermal sys-tems (e.g. >300 °C) but may be suitable for the temperatures expected in EGS systems (150-200 °C).
For multiple zone stimulation Halliburton provide the RapidStageTM system. There a series of fracture zones can by stimulated by dropping a ball from the surface that hits a sleeve closing the well at a designated
44
zone. The process is then repeated towards the wellhead. No removal of the balls is required afterwards as they degrade after operations.
Altarock have developed a method (US Patent 8272437) where the fracture zone with the lowest fracture pressure is stimu-lated by hydraulic shearing. Once adequate stimulation of this single fracture zone has been achieved, a temporary fracture sealant is injected into the well. The sealant enters the newly stimulated zone and blocks it. Thereafter, more water is pumped to the well to stimulate a new fracture zone with the weakest fracture pressure. The process is then repeated until sufficient number of fracture zones have been stimulated. The sealant is thermally unstable and therefore degrades as the well warms up after drilling and stimulation activities have seized.
Chemical stimulation
Chemical stimulation procedures are typi-cally carried out to remove skin in geother-mal wells, in other words, promoting en-hanced connection between the well and reservoir. Chemical stimulation further serves to remove drill muds that may clog fractures and pores near the well. Chemical stimulation methods may be applied to limestone reservoirs to create fracture networks (wormholes) but they have not been shown to enhance matrix permeability [Kalfayan 2008] except immediately near the well [Flores-Armenta 2010]. The disso-lution rate of reservoir minerals differs by several orders of magnitude with car-bonates dissolving much faster than sili-cates and generally mineral dissolution rate is higher under acidic conditions than neu-tral or slightly alkaline conditions. Hydro-chloric acid (HCl) is frequently used to dissolve carbonates near wells whereas fluoric acid (HF), usually combined with HCl, is needed to dissolve silicates. Carbonate minerals, being mainly calcite and dolomite frequently precipitate in fractures under elevated temperatures and calcite precipita-tion surrounding of hydrothermal systems is a common phenomenon. Schumacher and Schulz [Schumacher & Schulz 2013] studied
the effectiveness of acidizing geothermal well in the South German molasses basin (carbonate reservoirs) and reported the largest effect of initial acid treatments while subsequent treatments improved the wells only marginally. The main feed zones enabling fluid flow between wells of the Soultz-sus Forêts EGS system contain 3.3 % calcite and 0.8 % dolomite which have been shown to the most impact on porosity and in turn permeability of the reservoir [Fritz et al. 2010]. Although the carbonate minerals in reservoirs may best be treated with HCl, the HF is often added to dissolve drilling muds and chips that may clog pores and fractures near the well since these cannot be dissolved by HCl.
Scaling prevention
Scaling prevention plays an important role during stimulation and subsequent opera-tion of geothermal reservoirs. The issue is particularly relevant for EGS systems were re-injected fluids are far from equilibrium following the heat extraction process on the surface. As an example the circulating fluids in the Soultz-sus-Forêts project [Fritz et al. 2010] are supersaturated with regards to pyrite, a rapidly crystallising mineral as well as galena, potassium feldspar, quarts and smectite all leading to risk of scaling imme-diately adjacent to the well bore. On the contrary the cooled waters are undersatu-rated with regards to the fast dissolving calcite and dolomite and a series of slower dissolving silicates and sulphates. These will dissolve immediately adjacent to the well. The challenge is therefore to ensure contin-uous flow rates through the reservoir by preventing immediate precipitation of pyrite around the well and at the same time preventing the formation of calcite further from the well.
Calcite reactions in reservoirs such as Soultz-sous-Forêts may be represented by the following equation:
𝐶𝑎𝐶𝑂3 + 𝐶𝑂2 +𝐻2𝑂 = 𝐶𝑎2+ + 2𝐻𝐶𝑂3−
Where the equilibrium constant is deter-mined by the reservoir temperature. Consid-ering this reaction the overall process of an
45
EGS system can be simplified and described at 5 areas in the process (Figure 16)
Figure 16 The flow path of geothermal fluid during operation of an EGS system. See text for explanations.
1. Fluid as is at mineral equilibrium with rocks at reservoir conditions. A produc-tion pump (PP) at depth in the production well (PW) extracts fluid from the reser-voir towards the heat exchangers (E).
2. It is important to maintain high pressure towards the heat exchanger to prevent boiling of CO2 from the fluid as removal of CO2 shifts the equilibrium to the left leading to calcite scaling in pipes and the pump. If high pressure maintenance is somehow unfeasible small amount of acid may be added to lower pH thus pre-venting calcite formation.
3. Once the fluid enters the heat exchanger, it is rapidly cooled down leading to un-dersaturation of calcite but at the cost of increased precipitation risk of silica and pyrite as their solubility decreases at low temperature.
4. Calcite is undersaturated at this low temperature but there is still a silica and pyrite scaling risk.
5. Once the cold fluid enters the reservoir, calcite is dissolved adjacent to the well releasing calcium ion (Ca2+) but as the fluids move from the well and are heat-ed up the calcite soon becomes oversat-urated in the fluid. A complexing agent such as acetic acid might be added to the solution to complex Ca2+ thus pre-venting it forming calcite. Contrary to calcite, there exists a considerable risk of silica and pyrite precipitation next to
immediately adjacent to the well, a risk that decreases as the water is heated up in the reservoir.
Calibration of these geochemical processes is under reservoir conditions somehow difficult due to a number of assumptions that need to be made.
6.3.4 Recommendations on EGS
The potential placement of facilities relying on hydrothermal resources is by far more limited than those of HSA-EGS which in turn is much smaller than petrothermal EGS. However these potentials remain inversely correlated with the associated risks of failure engaging in these projects once a potential resource has been identified.
It is paramount to develop and apply tech-nologies to increase the probability of success of geothermal wells tapping into deep petrothermal systems.
Reservoir stimulation
So far it has proved difficult to create petrothermal reservoirs will sufficiently low impedance to allow for commercial flow rates. More efforts have to be made in creating multiple fracture networks between two wells enabling sufficient thermal sweep of the reservoirs without the need of drilling multiple wells.
Methods for stimulation and maintenance of permeability need to be applicable under variety of geological conditions to enable large scale deployment.
Although fracturing costs are much smaller than drilling costs, development of effective stimulation methods is a fundamental issue for EGS. Without a successfully stimulated reservoir, a 4-5 km deep well doublet has limited commercial value from power pro-duction point of view. Furthermore, increas-ing the mass flow through a system can be much more beneficial than drilling into warmer reservoirs [Sigfusson & Uihlein 2015].
46
Drilling
The geothermal industry will benefit from advances in directional drilling, fracking and blocking developed within the oil and gas industry. These advances need to be applied under conditions relevant for geothermal reservoirs.
A large emphasis should be made on lower-ing drilling costs by new methods that can increase rate of penetration and preferably technologies should evolve towards reduced tripping times primarily associated with replacement of drill bits.
Risks
Induced seismicity constitutes the largest risk factor associated with EGS while at the same time being the tool for creating the geothermal reservoir. The risk assessment of induced seismicity of a particular reser-voir should be a prerequisite to its inclusion of resource assessment. Therefore, the risk needs to be assessed under a variety of
geological conditions in order to provide more relevant resource assessment on continental scale.
Public opinion
Seismic events associated with stimulation and geothermal operations have led to public debate and negative perception on the geothermal industry.
Parallel to the technical developments to reduce induced seismicity risks, emphasis has to be made on increasing public aware-ness of the technology. Operators need to work according to general guidelines where the public is kept notified of operations, in particularly when stimulation is being car-ried out as well as when large changes are expected in the operation of the geothermal plants.
The understanding of the role of geother-mal energy in futures energy mix may contribute to increased public tolerance towards EGS systems [Bauer et al. 2015].
47
7 CONCLUSIVE REMARKS
The geothermal industry operating within the EU is currently small but evidence exists that the potential for power and heat pro-duction is large with only a small fraction having been utilized so far.
Nineteen EU countries have included geo-thermal energy in their NREAP. Latest data available shows that in 2014, EU targets were reached for shallow geothermal (mainly ground source heat pumps) while the targets for deep geothermal (mainly direct use) and geothermal power were missed. In order to reach the 2020 target, current production (72 % of 2014 target) of heat from geothermal direct use has to more than triple. Concerning, geothermal electricity production, current deployment is about 95 % of the 2014 target and about 61 % of the 2020 target for the EU.
There are still some technical barriers preventing large scale geothermal electricity production. If EGS will be demonstrated in larger variety of geological conditions, the supply may grow from the current produc-tion of 5.6 TWh by a factor of hundred to 540 TWh in 2050 according to the JRC-EU-
TIMES model. This prediction assumes that EGS will be a proven technology in the future but does not assume any major cost reductions. This growth corresponds to a change from current market share of 0.2 % to 12.6 % of total generated electricity in the EU assuming the baseline CAP scenario.
Cost reductions associated with drilling and surface installations might increase the market share to 24.5 % (1050-1100 TWh) of generated electricity in 2050 according to the JRC-EU-TIMES model.
Direct use of geothermal has been growing recently and this growth will continue as the risk is much lower when drilling depths do not exceed few kilometres as in the case of EGS. Of the geothermal technologies cov-ered in this report, the EGS technology is the one that needs the highest public financial support as it is by far the least market ready and will need considerable political support in the form of funding as well as more transparent regulations will be needed to facilitate large scale deployment of the technology.
48
8 REFERENCES
[ABC 2015] Plans scrapped for Upper Hunter hot rocks renewable energy. Accessed: 07/17/2015. URL: http://www.abc.net.au/news/2015-06-16/plans-scrapped-for-upper-hunter-hot-rocks-renewable-energy/6548454
[AltaRock 2009] AltaRock EGS Demonstration Project Status with NCPA at The Geysers. AltaRock. Available at: http://test.altarockenergy.com/wp-content/uploads/2014/02/AltaRock_EGS_Demonstration_NCPA_Geysers_Project_Status_101909.pdf
[AltaRock 2015a] AltaRock Davenport Newberry Holdings. Accessed: 07/14/2015. URL: http://altarockenergy.com/projects/dnh/
[AltaRock 2015b] Newberry EGS Demonstration, Oregon. Accessed: 07/14/2015. URL: http://altarockenergy.com/projects/newberry-egs-demonstration/
[Angelone & Labini 2014a] Angelone M and Labini SS: Overcoming Research Challenges for Geothermal Energy. DRAFT. Energy Research Knowledge Centre (ERKC)
[Angelone & Labini 2014b] Angelone M and Labini SS: Geothermal Energy Thematic Research Summary. Full Draft. Energy Research Knowledge Centre (ERKC)
[Antics et al. 2013] Antics M, Bertani R and Sanner B: Summary of EGC 2013 country update reports on geothermal energy in Europe. Proceedings European Geothermal Congress 2013. Pisa. Available at: http://www.gpc-france.com/archives/EGC2013_Keynote 1.pdf
[RHC 2014] Aposteanu A, Berre I, Bertani R, Clauser C, Jaudin F, Kujbus A, Sanner B and Urchueguia J: Geothermal Technology Roadmap. European Technology Platform on Renewable Heating and Cooling, Brussels
[Bauer et al. 2015] Bauer C, Burgherr P, Hirschberg S, Miotti M, Oshikawa H, Schenler W, Spada M, Treyer K, Zhang X, Evans K, Giardini D, Kant M, Kissling E, Kraft T, Landtwing D, Moser C, Muggli N, Obermann A, Rohr PR von, Rothenfluh T, Schechinger B, Schuler M, Stathopoulos P, Stauffacher M, Valley B, Wiemer S, Benighaus C, Benighaus L, Jovanovic A, Renn O, Abegg A and Wiederkehr R: Energy from the Earth. Deep Geothermal as a Resource for the Future? Hirschberg S, Wiemer S and Burgherr P (ed). 62/2015. vdf Hochschulverlag AG, Zürich
[Benato et al. 2015] Benato S, Hickman S, Davatzes NC, Taron J, Spielman P, Elsworth D, Majer EL and Boyle K: Conceptual model and numerical analysis of the Desert Peak EGS project: Reservoir response to the shallow medium flow-rate hydraulic stimulation phase. Geothermics (In Press). DOI:10.1016/j.geothermics.2015.06.008
[Bertani 2015] Bertani R: Geothermal Power Generation in the World 2010-2014 Update Report. Proceedings World Geothermal Congress 2015. Melbourne. Available at: https://pangea.stanford.edu/ERE/db/WGC/papers/WGC/2015/01001.pdf
[ECN 2011] Beurskens LWM, Hekkenberg M and Vethman P: Renewable Energy Projections as Published in the National Renewable Energy Action Plans of the European Member States. Database. ECN, Petten. Available at: https://www.ecn.nl/projects/nreap/2010/data/
[BGR 2015a] BGR - GeneSys Horstberg. Accessed: 05/29/2015. URL: http://www.genesys-hannover.de/Genesys/DE/Horstberg/horstberg_node.html
[BGR 2015b] BGR - GeneSys Hannover. Accessed: 05/29/2015. URL: http://www.genesys-hannover.de/Genesys/DE/Hannover/hannover_node.html
[BGR 2015c] BGR - Aktuelles. Accessed: 05/29/2015. URL: http://www.genesys-hannover.de/Genesys/DE/Aktuelles/aktuelles_node.html
[BINE 2008] Geothermal electricity generation in Soultz-sous-Forêts. FIZ Karlsruhe, Karlsruhe. Available at: www.bine.info
49
[Blanco Ilzarbe et al. 2013] Blanco Ilzarbe JM, Malpartida JG and Rojí Chandro E: Recent Patents On Geothermal Power Extraction Devices. Recent Patents on Engineering 7 (2–24). DOI:10.2174/10002
[BMU 2012] Forschungsjahrbuch Erneuerbare Energien 2011. Forschungsprojekte im Überblick. Bundesministerium für Umwelt, Naturschutz und Reaktorsicherheit (BMU), Berlin. Available at: https://www.ptj.de/lw_resource/datapool/_items/item_4006/forschungsjahrbuch_erneuerbare_energien_2011.pdf
[Breede et al. 2015] Breede K, Dzebisashvili K and Falcone G: Overcoming challenges in the classification of deep geothermal potential. Geothermal Energy Science 3 (19–39). DOI:10.5194/gtes-3-19-2015
[Breede et al. 2013] Breede K, Dzebisashvili K, Xiaolei L and Falcone G: A systematic review of enhanced (or engineered) geothermal systems: past, present and future. Geothermal Energy 1:4 (1–27). DOI:10.1186/2195-9706-1-4
[Cammerer & Michel 2009] Cammerer F and Michel W: Machbarkeitsstudie für ein HOT DRY ROCK - Wärme- und Stromnutzungskonzept Bad Urach. Stadtwerke Bad Urach, Radolfzell. Available at: http://edok01.tib.uni-hannover.de/edoks/e01fb09/613154053.pdf
[Carlsson et al. 2013] Carlsson J, Lacal-Arantegui R, Jäger-Waldau A, Bocin-Dumitriu A, Sigfusson B, Zubi G, Magagna D, Moss R, Fortes M del MP, Lazarou S, Baxter D, Scarlat N, Giuntoli J, Moro A, Padella M, Kousoulidou M, Vorkapic V, Marelli L, Steen M, Zucker A, Moya Rodriguez J, Bloem H and Moles C: 2013 Technology Map of the European Strategic Energy Technology Plan. JRC86357/EUR 26345 EN. Publications Office of the European Union, Luxembourg
[Carlsson et al. 2014] Carlsson J, Lacal-Arantegui R, Jäger-Waldau A, Vellei M, Sigfusson B, Magagna D, Jakubcionis M, Perez Fortes M del M, Lazarou S, Weidner E, de Marco G, Spisto A and Moles C: Energy Technology Reference Indicator (ETRI) Projections for 2010-2050. JRC92496/EUR 26950 EN. Publications Office of the European Union, Luxembourg
[Chabora & Zemach 2013] Chabora E and Zemach E: Desert Peak EGS Project. Geothermal Technologies Office 2015 Peer Review. Doe EERE. Available at: https://www4.eere.energy.gov/geothermal/sites/default/files/documents/desert_peak_egs_peer2013.pdf
[Chabora et al. 2012] Chabora E, Zemach E, Spielman P, Drakos P, Hickman S, Lutz S, Boyle K, Falconer A, Robertson-Tait A, Davatzes NC, Rose P, Majer E and Jarpe S: Hydraulic stimulation of well 27-15, desert peak geothermal field, Nevada, USA. Thirty-Seventh Workshop on Geothermal Reservoir Engineering. Stanford, California, 30 January - 1 February 2012
[Chopra 2000] Chopra PN: Status of the Geothermal Industry in Australia , 2000-2005. World Geothermal Congress 2000. Tokyo. Available at: https://pangea.stanford.edu/ERE/db/IGAstandard/record_detail.php?id=1078
[Cladouhos et al. 2012] Cladouhos TT, Osborn WL, Petty S, Bour D, Iovenitti J, Callahan O, Nordin Y, Perry D and Stern PL: Newberry Volcano EGS Demonstration - Phase I results. Thirty-Seventh Workshop on Geothermal Reservoir Engineering. Stanford, California, 30 January - 1 February 2012
[Cornet 1987] Cornet F: The Learning Curve; The Le Mayet de Montagne Experiment (1978-1987). ICEGS 2012. Freiburg
[Cornet, FH 1987] Cornet F: Results from Le Mayet de Montagne project. Geothermics 16 (355–374). DOI:10.1016/0375-6505(87)90016-2
[Dauenhauer 2014] Dauenhauer E: GGSC Software
[DiPippo 2012] DiPippo R: Geothermal Power Plants. Principles, Applications, Case Studies and Environmental Impact. Butterworth-Heinemann, Oxford
[DiPippo 2015] DiPippo R: Geothermal power plants: Evolution and performance assessments. Geothermics 53 (291–307). DOI:10.1016/j.geothermics.2014.07.005
[DoE EERE 2015a] Enhanced Geothermal Systems Demonstration Projects. Accessed: 07/16/2015. URL: http://energy.gov/eere/geothermal/enhanced-geothermal-systems-demonstration-projects#raftriver
[DoE EERE 2015b] Enhanced Geothermal Systems - Concept Testing and Development at the Raft River Geothermal Field. Accessed: 07/16/2015. URL: https://www4.eere.energy.gov/geothermal/projects/125
50
[DoE EERE 2015c] Feasibility of EGS Development at Brady’s Hot Springs. Accessed: 07/16/2015. URL: https://www4.eere.energy.gov/geothermal/projects/124
[Drakos & Akerley 2015] Drakos P and Akerley J: Bradys EGS Project. Geothermal Technologies Office 2015 Peer Review. DoE EERE
[Dumas et al. 2013] Dumas P, Antics M and Ungemach P: GeoELEC - Report on Geothermal Drilling. Geoelec. Available at: http://www.geoelec.eu/wp-content/uploads/2011/09/D-3.3-GEOELEC-report-on-drilling.pdf
[EC 2014] Commission Implementing Decision of 8.7.2014. Award Decision under the second call for proposals of the NER 300 funding programme
[EC 2015] Commission Implementing Decision of 13.10.2015 amending Commission Implementing Decisions C(2012) 9432 and C(2014) 4493 so as to modify the Award Decisions under the first and second call for proposals of the NER 300 funding programme
[Eden Project 2009] The Department of Energy and Climate Change announces the award to EGS Energy Limited of £2.011m from the Deep Geothermal Challenge Fund. Accessed: 07/21/2015. URL: https://www.edenproject.com/media/2011/the-department-of-energy-and-climate-change-announces-the-award-to-egs-energy-limited-of-
[EGEC 2012] EGEC Market Report 2012. European Geothermal Energy Council (EGEC), Brussels
[EGEC 2013a] EGEC Market Report 2013/2014. European Geothermal Energy Council (EGEC), Brussels. Available at: http://egec.info/publications/
[EGEC 2013b] Financing Geothermal Energy. European Geothermal Energy Council (EGEC), Brussels. Available at: http://egec.info/wp-content/uploads/2013/07/EGEC-policy-paper-on-financing-geothermal_.pdf
[EGEC 2014] EGEC Market Report 2013/2014 Update. Angelino L, Dumas P and Latham A (ed). European Geothermal Energy Council (EGEC), Brussels. Available at: http://egec.info/wp-content/uploads/2011/03/EGEC-Market-Report-Update-ONLINE.pdf
[EGS Energy 2015] Eden Deep Geothermal Plant. Accessed: 07/21/2015. URL: http://www.egs-energy.com/projects/eden-egs-plant.html
[Emerging Energy Research 2009] Emerging Energy Research: Global Geothermal Markets & Strategies
[Energiesparverband Oberösterreich 2015] Geothermie Altheim. Accessed: 07/21/2015. URL: http://www.esv.or.at/foerderungen/oekostrom/beispiele/geothermie-altheim/
[EU 2009] Directive 2009/28 of the European Parliament and of the Council of 23 April 2009 on the promotion of the use of energy from renewable sources and amending and subsequently repealing Directives 2001/77/EC and 2003/30/EC/EC. Available at: http://eur-lex.europa.eu/legal-content/EN/ALL/?uri=CELEX:32009L0028
[EurObserv’ER 2013] Heat pumps barometer. Observ’ER, Paris. Available at: http://www.energies-renouvelables.org/observ-er/stat_baro/observ/baro218_en.pdf
[EurObserv’ER 2015] EurObserv’ER: Heat pumps barometer. EurObserv’ER, Brussels. Available at: http://www.eurobserv-er.org/heat-pump-barometer-2015/
[Eurostat 2015] Eurostat: Supply, transformation, consumption - electricity - annual data
[Faulds et al. 2010] Faulds JE, Coolbaugh MF, Benoit D, Oppliger G, Perkins M, Moeck I and Drakos P: Structural Controls of Geothermal Activity in the Northern Hot Springs Mountains, Western Nevada: The Tale of Three Geothermal Systems (Brady’s, Desert Peak, and Desert Queen). GRC Transactions 34 (675–683)
[Flores-Armenta 2010] Flores-Armenta M: Evaluation of Acid Treatments in Mexican Geothermal Fields. Proceedings World Geothermal Congress 2010. Bali
[Foulger et al. 2008] Foulger GR, Julian BR and Monastero FC: Seismic monitoring of EGS tests at the Coso geothermal area, California, using accurate MEQ locations and full moment tensors. Proceedings, Thirty-third workshop on geothermal reservoir engineering, Stanford University, Stanford, California, January 28-30 2008 (261–268)
[Friðleifsson et al. 2014] Friðleifsson GÓ, Elders W a. and Albertsson A: The concept of the Iceland deep drilling project. Geothermics 49 (2–8). DOI:10.1016/j.geothermics.2013.03.004
51
[Fritz et al. 2010] Fritz B, Jacquot E, Jacquemont B, Baldeyrou-Bailly A, Rosener M and Vidal O: Geochemical modelling of fluid–rock interactions in the context of the Soultz-sous-Forêts geothermal system. Comptes Rendus Geoscience 342 (653–667). DOI:10.1016/j.crte.2010.02.005
[Ganz 2015] Ganz B: Evaluation of Expert Reports to Quantify the Exploration Risk for Geothermal Projects in Germany. Energy Procedia 76 (341–350). DOI:10.1016/j.egypro.2015.07.839
[GEA 2015] GEA: Geothermal Energy Association Issue Brief : Firm and Flexible Power Services Available from Geothermal Facilities
[Geodynamics 2015] Innamincka (EGS) Project. Accessed: 07/20/2015. URL: http://geodynamics.com.au/Our-Projects/Innamincka-Deeps.aspx
[Géothermie Perspectives 2015] La centrale EGS de Soultz-Sous-Forêts, Alsace. Accessed: 07/21/2015. URL: http://www.geothermie-perspectives.fr/article/centrale-egs-soultz-forets-alsace
[Geothermie Unterhaching 2015] Daten & Fakten: Geothermie Unterhaching. Accessed: 07/20/2015. URL: https://www.geothermie-unterhaching.de/cms/geothermie/web.nsf/id/pa_daten_fakten.html
[GFZ 2015] Geothermie-Forschungsplattform Groß Schönebeck. Accessed: 07/13/2015. URL: http://www.gfz-potsdam.de/wissenschaftliche-infrastruktur/labore/gross-schoenebeck/
[Giardini 2009] Giardini D: Geothermal quake risks must be faced. Nature 462 (848–849). DOI:10.1038/462848a
[Goldstein et al. 2011] Goldstein B, Hiriart G, Bertani R, Bromley C, Gutiérrez-Negrín L, Huenges E, Muraoka H, Ragnarsson A, Tester J and Zui V: Geothermal Energy. In: Edenhofer O, Pichs-Madruga R, Sokona Y, Seyboth K, Matschoss P, Kadner S, Zwickel T, Eickemeier P, Hansen G, Schlömer S and von Stechow C (ed): IPCC Special Report on Renewable Energy Sources and Climate Change Mitigation. Cambridge University Press, Cambridge/New York. Available at: http://srren.ipcc-wg3.de/report/IPCC_SRREN_Ch04.pdf
[Gudmundsson 1985] Gudmundsson JS: Direct uses of geothermal energy in 1984. GRC Bulletin 14 (3–13)
[Gurgenci 2015] Gurgenci H: Results announced from the Second Round of the Geothermal Drilling Program: $35m to five projects in four states. Accessed: 07/17/2015. URL: http://www.geothermal.uq.edu.au/14-December-2009
[Halper 2012] Halper M: Geothermal Power to the People: Forget Iceland, Hot Rocks Are Everywhere. Accessed: 07/21/2015. URL: http://www.ecomagination.com/geothermal-power-to-the-people
[Häring 2007] Häring MO: Geothermische Stromproduktion aus Enhanced Geothermal Systems (EGS) - Stand der Technik. Elektrizitätswerk der Stadt Zürich (EWZ), Pratteln. Available at: http://www.city-of-zurich.ch/content/dam/stzh/ewz/Deutsch/Energiedienstleistungen/Publikationen und Broschueren/Geothermische_Stromproduktion.pdf
[Häring et al. 2008] Häring MO, Schanz U, Ladner F and Dyer BC: Characterisation of the Basel 1 enhanced geothermal system. Geothermics 37 (469–495). DOI:10.1016/j.geothermics.2008.06.002
[Herzberger et al. 2010] Herzberger P, Münch W, Köbel T, Bruchmann U, Schlagermann P, H. H, Wolf L, Rettenmaier D, Steger H, Zorn R, Seibt P, Möllmann GU, Sauter M, Ghergut J and Ptak T: The geothermal plant Bruchsal. World Geothermal Congress 2010 (25–29)
[JRC 2014] Joint Research Centre: Towards an Integrated Roadmap: Research and Innovation Challenges and Needs of the EU Energy System - Annex 1: Research and innovation actions. Available at: http://ec.europa.eu/energy/technology/set_plan/set_plan_en.htm
[Jung et al. 2006] Jung R, Orzol J, Kehrer P and Jatho R: Verbundprojekt: GeneSys. Vorstudie – Erprobung der Wasserfrac-Technik und des Einsonden-Zweischichtverfahrens für die Direktwärmenutzung aus gering permeablen Sedimentgesteinen. Abschlussbericht. Vorhaben FKZ 0327112 & 0327116. Bundesministerium für Umwelt, Naturschutz und Reaktorsicherheit, Hannover
[Kaieda et al. 2005] Kaieda H, Ito H, Kiho K, Suzuki K, Suenaga H and Shin K: Review of the Ogachi HDR Project in Japan. Proceedings World Geothermal Congress 2005. 24-29 April 2005. Antalya
52
[Kalfayan 2008] Kalfayan L: Production enhancement with acid stimulation. PennWell Corporation
[Kelkar 2015] Kelkar S: Desert Peak Numerical Modeling. Geothermal Technologies Office 2015 Peer Review. Doe EERE
[Kohl et al. 2009] Kohl T, Baujard C, Ollinger D, Berli S, Kramer M, Wyss R, Blum A, Naef H and Schäpp HJ: Machbarkeitsstudie Tiefengeothermie Stadt St . Gallen. Schlussbericht. Bundesamt für Energie (BFE), Bern
[Kreisbote 2013] Forschungsprojekt bei Mauerstetten löst Debatte aus. Accessed: 11/11/2015. URL: http://www.kreisbote.de/lokales/kaufbeuren/forschungsprojekt-mauerstetten-loest-debatte-2753618.html
[Law 2011] Law R: Deep geothermal UK - United Downs Project, Redruth. Ground Source Live. Peterborough. Available at: http://www.gshp.org.uk/GroundSourceLive2011/RyanLaw_gsl.pdf
[Lund & Boyd 2015] Lund JW and Boyd T: Direct Utilization of Geothermal Energy 2015 Worldwide Review. Proceedings World Geothermal Congress 2015. Melbourne. Available at: https://pangea.stanford.edu/ERE/db/WGC/papers/WGC/2015/01000.pdf
[Lund 2011] Lund JW, Freeston DH and Boyd TL: Direct utilization of geothermal energy 2010 worldwide review. Geothermics 40 (159–180). DOI:10.1016/j.geothermics.2011.07.004
[Matsunaga et al. 2005] Matsunaga I, Niitsuma H and Oikawa Y: Review of the HDR Development at Hijiori Site, Japan. Proceedings of the World Geothermal Congress 20052. Antalya
[MIT 2006] The Future of Geothermal Energy. Impact of Enhanced Geothermal Systems (EGS) on the United States in the 21st Century. INL/EXT-06-11746. Massachusetts Institute of Technology (MIT), Idaho. Available at: https://www1.eere.energy.gov/geothermal/pdfs/future_geo_energy.pdf
[Moore & McLennan 2013] Moore J and McLennan J: Concept testing and development at the Raft River geothermal field, Idaho. Geothermal Technologies Office 2013 Peer Review. Available at: http://www1.eere.energy.gov/geothermal/pdfs/raft_river_peer2013.pdf
[Nathwani & Mines 2015] Nathwani J and Mines G: Cost Contributors to Geothermal Power Generation. Proceedings World Geothermal Congress 2015. Melbourne
[Observ’ER 2013] Worldwide electricity production from renewable energy sources. Observ’ER. Available at: http://www.energies-renouvelables.org/observ-er/html/inventaire/pdf/15e-inventaire-Chap02.pdf
[Ochsner 2008] Ochsner K: Geothermal Heat Pumps. A guide for Planning & Installing. Earthscan, London
[OECD/IEA 2013] World - Renewable and Waste Energy Supply (ktoe)
[OpenEI 2015] Coso Geothermal Area | Open Energy Information. Accessed: 07/17/2015. URL: http://en.openei.org/wiki/Coso_Geothermal_Area
[Parker 1999] Parker R: The Rosemanowes HDR project 1983-1991. Geothermics 28 (603–615)
[Petratherm 2014] Renewable Energy Grants Lapse. In: Petratherm (ed): ASX Release. Available at: http://www.petratherm.com.au/_literature_137248/Renewable_Energy_Grants_lapse_-_21_July_2014
[Petratherm 2015] Paralana. Accessed: 05/13/2015. URL: http://www.petratherm.com.au/projects/paralana
[Petty 2009] Petty S: AltaRock Energy updates EGS demonstration project. The Geysers Steamline 25 (1–4)
[Portier et al. 2007] Portier S, Andre L and Vuataz F-D: Review on chemical stimulation techniques in oil indistry and applications to geothermal systems. Neuchatel University
[Portier et al. 2009] Portier S, Vuataz F-D, Nami P, Sanjuan B and Gérard A: Chemical stimulation techniques for geothermal wells: experiments on the three-well EGS system at Soultz-sous-Forêts, France. Geothermics 38 (349–359). DOI:10.1016/j.geothermics.2009.07.001
[Puttagunta & Shapiro 2012] Puttagunta S and Shapiro C: An In-Depth Look at Ground Source Heat Pumps and Other Electric Loads in Two GreenMax Homes. NREL, Oak Ridge. Available at: http://www.nrel.gov/docs/fy12osti/54240.pdf
53
[REN21 2015] Renewables 2015 - Global Status Report. Accessed: 12/08/2015. URL: http://www.ren21.net/wp-content/uploads/2015/07/REN12-GSR2015_Onlinebook_low1.pdf
[Roegiers et al. 2012] Roegiers J-C, Jeffrey R, Axelsson G, Evans K and Powell T: International Partnership for Geothermal Technology Stimulation Procedures Whitepaper
[Rose 2012] Rose P: Final Report for the Project Entitled Creation of an Enhanced Geothermal System through Hydraulic and Thermal Stimulation. University of Utah. Available at: http://www.osti.gov/geothermal/servlets/purl/1076594/1076594.pdf
[Rose et al. 2006] Rose P, Hickman S, McCulloch J, Davatzes N, Moore JM, Kovac K, Mella M, Julian B, Foulger G and Monastero F: Creation of an Enhanced Geothermal System through Hydraulic and Thermal Stimulation. Progress Report 2006. University of Utah
[Rose et al. 2005] Rose P, Sheridan J, McCulloch J, Moore JN, Kovac K, Weidler R and Hickman S: An Enhanced Geothermal System at Coso, California—Recent Accomplishments. World Geothermal Congress 2005
[Rutqvist et al. 2013] Rutqvist J, Dobson PF, Garcia J, Hartline C, Jeanne P, Oldenburg CM, Vasco DW and Walters M: The Northwest Geysers EGS Demonstration Project, California: Pre-stimulation Modeling and Interpretation of the Stimulation. Mathematical Geosciences 47 (3–29). DOI:10.1007/s11004-013-9493-y
[Schrage et al. 2012] Schrage C, Bems C, Kreuter H, Hild S and Volland S: Overview of the enhanced geothermal energy project in Mauerstetten, Germany
[Schröder et al. 2013] Schröder A, Kunz F, Meiss J, Mendelevitch R and von Hirschhausen C: Current and Prospective Costs of Electricity Generation until 2050. DIW
[Schumacher & Schulz 2013] Schumacher S and Schulz R: Effectiveness of acidizing geothermal wells in the South German Molasse Basin. Geoth. Energ. Sci. 1 (1–11). DOI:10.5194/gtes-1-1-2013
[Self et al. 2013] Self SJ, Reddy B V. and Rosen MA: Geothermal heat pump systems: Status review and comparison with other heating options. Applied Energy 101 (341–348). DOI:10.1016/j.apenergy.2012.01.048
[Sigfusson & Uihlein 2015] Sigfusson B and Uihlein A: 2014 JRC Geothermal Energy Status Report. Publications Office of the European Union, Luxembourg
[Simoes et al. 2013] Simoes S, Nijs W, Ruiz P, Sgobbi A, Radu D, Bolat P, Thiel C and Peteves S: The JRC-EU-TIMES model. Assessing the long-term role of the SET Plan Energy technologies. Publications Office of the European Union, Luxembourg
[Snyder & Zemach 2013] Snyder K and Zemach E: Bradys EGS Project. Geothermal Technologies Office 2013 Peer Review
[Stadt St. Gallen 2015a] Das Geothermie-Projekt der Stadt St. Gallen: Übersicht. Accessed: 12/10/2015. URL: http://www.geothermie.stadt.sg.ch/aktuell/uebersicht.html
[Stadt St. Gallen 2015b] Das Geothermie-Projekt der Stadt St. Gallen: Projektende. Accessed: 12/10/2015. URL: http://www.geothermie.stadt.sg.ch/projekt/projektende.html
[BMU 2011] Stober I, Fritzer T, Obst K and Schulz R: Tiefe Geothermie. Nutzungsmöglichkeiten in Deutschland. Bundesministerium für Umwelt, Naturschutz und Reaktorsicherheit (BMU), Berlin
[Sveinbjornsson & Thorhallsson 2014] Sveinbjornsson BM and Thorhallsson S: Drilling performance, injectivity and productivity of geothermal wells. Geothermics 50 (76–84). DOI:10.1016/j.geothermics.2013.08.011
[BNEF 2015] Taylor M: H1 2015 Geothermal Market Outlook. Bloomberg New Energy Finance
[Tenma et al. 2000] Tenma N, Yamaguchi T, Tezuka K, Karasawa H and Zyvoloski G: Estimation of the Productivity of the Deep Reservoir at the Hijiori HDR Test Site Using FEHM. Geothermal Resources Council 24 (175–179)
[Think GeoEnergy 2015a] Geodynamics scraps development of Upper Hunter project, Australia. Accessed: 07/17/2015. URL: http://www.thinkgeoenergy.com/geodynamics-abandoning-its-egs-project-in-australia/
[Think GeoEnergy 2015b] Geodynamics planning now small scale commercial project at Cooper Basin. Accessed: 07/20/2015. URL: http://www.thinkgeoenergy.com/geodynamics-planning-now-small-scale-commercial-project-at-cooper-basin/

54
[Tiefe Geothermie 2015a] Bruchsal. Accessed: 07/20/2015. URL: http://www.tiefegeothermie.de/projekte/bruchsal
[Tiefe Geothermie 2015b] Altheim (Oberösterreich). Accessed: 07/21/2015. URL: http://www.tiefegeothermie.de/projekte/altheim-oberoesterreich
[JRC 2015] Uihlein A: JRC Geothermal Power Plant Database. Joint Research Centre, Institute for Energy and Transport, Petten
[van Wees et al. 2013] van Wees J-D, Boxem T, Angelino L and Dumas P: A prospective study on the geothermal potential in the EU. D2.5. Geoelec
[Vellei 2014] Vellei M: A review of factors affecting environmental and economic life-cycle performance for electrically-driven heat pumps. JRC 92170/EUR 26887 EN. Publications Office of the European Union, Petten. Available at: https://setis.ec.europa.eu/sites/default/files/reports/A-review-of-factors-affecting-environmental-and-economic-life-cycle-performance-for-electrically-driven-heat-pumps.pdf
[Walters et al. 2012] Walters J, Thorhallsson S and Wood E: Zonal Isolation for Geothermal Wells
[Walters 2013] Walters M: Demonstration of an Enhanced Geothermal System at the Northwest Geysers Geothermal Field, CA. Geothermal Technologies Office 2013 Peer Review. U.S. Department of Energy (DoE). Available at: https://www4.eere.energy.gov/geothermal/sites/default/files/documents/egs_calpine_peer2013.pdf
[Walters 2010] Walters M and Dobson P: Demonstration of an Enhanced Geothermal System at the Northwest Geysers Geothermal Field, California
[West Briton 2015] Geothermal project on rocks after funding blow. Accessed: 07/21/2015. URL: http://www.westbriton.co.uk/Geothermal-project-rocks-funding-blow/story-18607175-detail/story.html
[Wolfgramm et al. 2005] Wolfgramm M, Bloch T, Bartels J, Heuberger S, Kuhn P, Naef H, Voigt H-D, Seibt P, Sonderegger M, Steiger T and Uhlig S: Reservoir-Geological Characterization of a Fractured Limestone: Results Obtained from the Geothermal Well St. Gallen GT-1 (Switzerland). Proceedings of the World Geothermal Congress 2005. Antalya
[Wyborn et al. 2000] Wyborn D, Chopra P, Weber C and Vlahovic W: Current Status of Hot Rock Geothermal Energy extraction. Renewable Energy Transforming Business. Brisbane
[Yamaguchi et al. 1995] Yamaguchi T, Kobayashi H, Matsunaga I and Sato Y: Hydraulic and Thermal Behavior of the Hijiori HDR Upper Reservoir. Geothermal Resources Council 19 (279–285)

How to obtain EU publications
Our publications are available from EU Bookshop (http://bookshop.europa.eu),
where you can place an order with the sales agent of your choice.
The Publications Office has a worldwide network of sales agents.
You can obtain their contact details by sending a fax to (352) 29 29-42758.
Europe Direct is a service to help you find answers to your questions about the European Union
Free phone number (*): 00 800 6 7 8 9 10 11
(*) Certain mobile telephone operators do not allow access to 00 800 numbers or these calls may be billed.
A great deal of additional information on the European Union is available on the Internet.
It can be accessed through the Europa server http://europa.eu
JRC Mission As the Commission’s in-house science service, the Joint Research Centre’s mission is to provide EU policies with independent, evidence-based scientific and technical support throughout the whole policy cycle. Working in close cooperation with policy Directorates-General, the JRC addresses key societal challenges while stimulating innovation through developing new methods, tools and standards, and sharing its know-how with the Member States, the scientific community and international partners.
Serving society Stimulating innovation Supporting legislation
LD
-NA
-27
62
3-E
N-2
doi:10.2790/959587
ISBN 978-92-79-54048-6