Embed Size (px)
Citation preview

دولة فلسطين هاز المركزي لإلحصاء الفلسطينيجلا
2015، أداء االقتصاد الفلسطيني
2016، مايو/أيار

PCBS :2015داء االقتصاد الفلسطيني، أ
2016 ،أيار – ه1436، شعبان.
.جميع الحقوق محفوظة
:في حالة االقتباس، يرجى اإلشارة إلى هذه المطبوعة كالتالي
.فلسطين -اهللا رام .2015أداء االقتصاد الفلسطيني، .2016 الجهاز المركزي لإلحصاء الفلسطيني،
:ىتوجه إل تسالرالما يعجم لإلحصاء الفلسطيني زيركلما ازجهال
.ينفلسط - اهللام را، 1647: ب.ص 2700 298 2 (970/972): فتاه
2710 298 2 (970/972): سفاك 1800300300: الرقم المجاني
[email protected]: ينو ر تكلإ دير ب 2197: الرمز المرجعي http://www.pcbs.gov.ps: ةينلكترو إ ةصفح
ميثاق تم إعداد هذا التقرير حسب اإلجراءات المعيارية المحددة في 2006الممارسات لإلحصاءات الرسمية الفلسطينية

PCBS :2015داء االقتصاد الفلسطيني، أ
فريق العمل
إعداد التقرير • مهند حمايل أحمد عمر
تدقيق معايير النشر •
ةحنان جناجر
المراجعة األولية •
جامعة بيرزيت /عمال واالقتصادكلية األ -مشارك أستاذمحمد نصر . د صالح الكفري. د
المراجعة النهائية •
محمد قاللوة
اإلشراف العام • عال عوض رئيس الجهاز

PCBS :2015داء االقتصاد الفلسطيني، أ
PCBS :2015داء االقتصاد الفلسطيني، أ
تقديم
تم إعداد تقرير األداء ،اإلحصائية تقاريرال وتحديث تطوير فيالجهاز المركزي لإلحصاء الفلسطيني استمرارًا لسياسةليوفر أداة للباحثين وصانعي السياسات االقتصادية لرسم صورة للواقع االقتصادي من ،2015للعام يفلسطينالاالقتصادي
ميزان ،األسعار ،سوق العمل ،جماليمؤشرات الناتج المحلي اإل(مثل ،خالل دراسة المؤشرات االقتصادية المختلفةهذا التقرير يعرضحيث ، )القطاع المصرفي ،المالية العامة ،الدين الخارجيرصيد وضع االستثمار الدولي، المدفوعات،
.2015لعام األداء االقتصادي لواقع إحصائياً وصفاً
برز مؤشرات االقتصاد الكلي ومقارنتها أ متضمناً ،2015عام لل يفلسطينالنا تقديم هذا التقرير حول األداء االقتصادي يسرّ .2014لعام ل األداء االقتصاديمع
، وأن يوفر األداة 2015عام النأمل أن يسهم هذا التقرير بإعطاء صورة عن طبيعة وكيفية أداء االقتصاد الفلسطيني خالل .قبالتمس لالقتصاد الفلسطيني عملية التحليل والتخطيطفي وصانعي القرار الباحثين لمساعدة
واهللا ولي التوفيق،،،
عال عوض 2016، يارأ رئيس الجهاز

PCBS :2015داء االقتصاد الفلسطيني، أ
PCBS :2015داء االقتصاد الفلسطيني، أ
قائمة المحتويات
1Bالصفحة الموضوع
2Bقائمة الجداول 3Bملخص أداء االقتصاد الفلسطيني
4B 2015األداء االقتصادي للعام
13 جماليالناتج المحلي اإل -1 18 سوق العمل -2 24 األنشطة االقتصادية -3 27 األسعار والقوة الشرائية -4 29 ميزان المدفوعات -5 32 وضع االستثمار الدولي -6 33 الدين الخارجي -7 34 المالية العامة -8 37 القطاع المصرفي -9

PCBS :2015داء االقتصاد الفلسطيني، أ

PCBS :2015داء االقتصاد الفلسطيني، أ
قائمة الجداول
5Bالصفحة الجدول
6B سنة : باألسعار الثابتة 2015 -2010المؤشرات االقتصادية الرئيسية حسب المنطقة، : 1جدول 2004ساس األ
15
7B باألسعار الثابتة 2015 -2010القيمة المضافة لألنشطة االقتصادية حسب المنطقة، :2جدول :
2004ساس سنة األ
16
8B 9 :3جدولB 10 2015 -2010سنة فأكثر حسب المنطقة، 15مؤشرات سوق العمل لألفرادB18
11B 22 2015 -2010عدد العاملين حسب النشاط االقتصادي والمنطقة، :4جدول
12B 24 2015أبرز األنشطة االقتصادية وأهم خصائصها في فلسطين، :5جدول
13B والوزن النسبي حسب مجموعات 2015لعام ل المستهلكرقام القياسية ألسعار متوسط األ :6جدول
100= 2010ساس سنة األ: نفاق الرئيسية والمنطقةاال
28
14B 30 2015 -2010ميزان المدفوعات في فلسطين، :7جدول
15B 16 :8جدولB 17 2015 -2010، األعواموضع االستثمار الدولي في فلسطين في نهايةB32
18B 19 :9جدولBاألعوامفي فلسطين في نهاية على القطاعات االقتصادية الدين الخارجيرصيد إجمالي ،
2011- 2015
20B33
21B 22 :10جدولB23 2015 -2010برز مؤشرات القطاع المصرفي في فلسطين، أB37

PCBS :2015داء االقتصاد الفلسطيني، أ

PCBS :2015داء االقتصاد الفلسطيني، أ
ملخص أداء االقتصاد الفلسطيني
شهد الناتج المحلـي اإلجمـالي فـي فلسـطين نمـوًا بنسـبة نصـيب ارتفعونتيجة لذلك، .2015خالل العام % 3.5
ليصـل % 0.5الفرد من الناتج المحلي اإلجمـالي بنسـبة ــى تفاوتــت معــدالت النمــو .أمريكــي دوالر 1,745.9إل
فــــي النــــاتج المحلــــي اإلجمــــالي بــــين قطــــاع غــــزة والضــــفة ، حيـــث بلــغ معـــدل النمـــو فـــي 2015الغربيــة خـــالل العـــام
. فــــي الضــــفة الغربيــــة% 2.5مقارنــــة مــــع % 6.8القطـــاع مســاهمة ارتفعــتنتيجـة لهــذا التبـاين فــي معــدالت النمـو، و
إلـــــىجمـــــالي لتصـــــل فـــــي النـــــاتج المحلـــــي اإل غـــــزة قطـــــاعارتفــــع نصــــيب الفــــرد مــــن النــــاتج المحلــــي كمــــا ،23.6%
% 44.3يمثـل بقـياإلجمالي في قطاع غزة قليًال، ولكنـه ارتفعـــــت القيمـــــة .فـــــي الضـــــفة الغربيـــــة مثيلـــــه فقـــــط مـــــن
خــالل فـي فلسـطين المضـافة لجميـع األنشـطة االقتصـاديةالزراعـــــــة والصـــــــناعة، أنشـــــــطة، باســـــــتثناء 2015العـــــــام
نتيجــــة إعــــادة أعلــــى ارتفــــاعاإلنشــــاءات أنشــــطة تســــجلو الخدمات والفروع األخرى أنشطة، ولكن عمار قطاع غزةإ
المساهم األكبر في الناتج المحلي اإلجمالي في كٍل تظل .من الضفة الغربية وقطاع غزة
ة ببنســــ 2015عــــام ال خــــاللزاد حجــــم القــــوى العاملــــة
فيما انخفضتألف فرد، 1,295.4، ليصل إلى 4.3% إلـــىلتصـــل قلـــيالً المشـــاركة فـــي القـــوى العاملـــةنســـبة ، %5.1ارتفــع بنســبة فقــد عــدد العــاملين أمــا .46.0%
معـــدل البطالــة فـــي فلســطين إلـــى انخفــاضممــا أدى إلـــى فـي العـام % 27.2مقارنة مع 2015في العام % 25.92014.
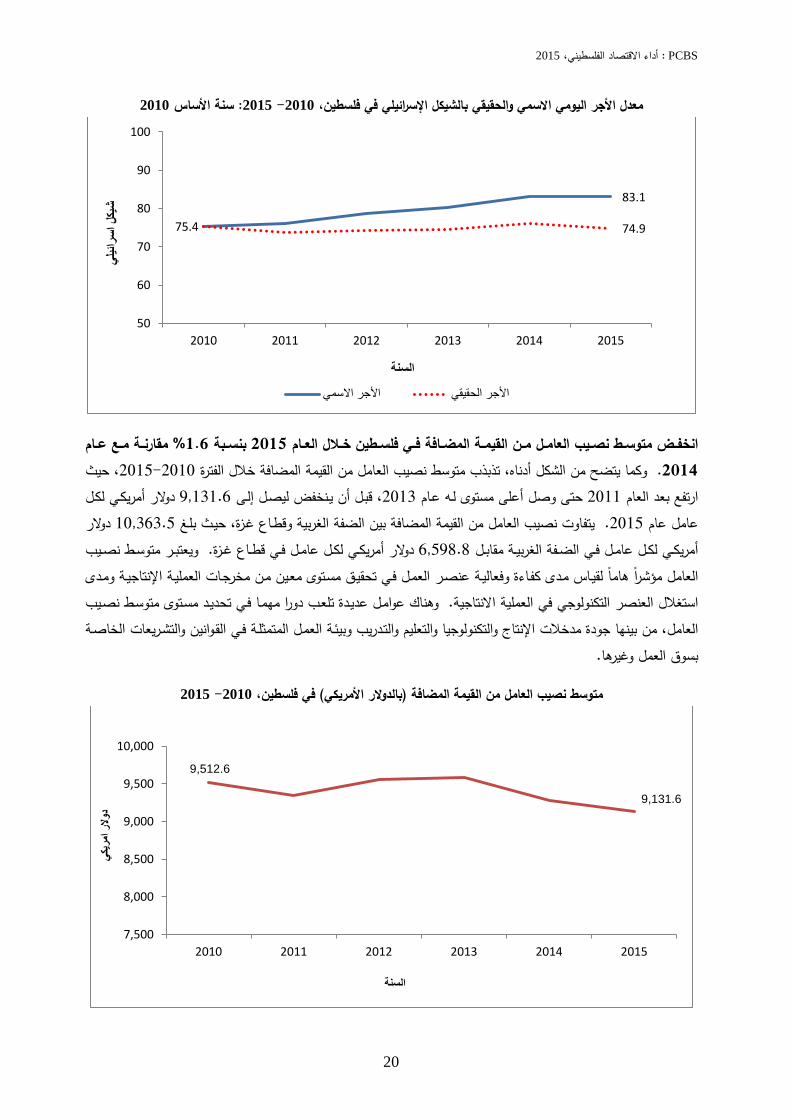
معدل األجر اليومي االسمي في فلسطين خالل لم يتغير
شيكل، وهو نفس المعدل 83.1حيث بلغ 2015العام معدل األجـر اليـومي الحقيقـي ولكن، 2014العام خالل
انخفـضكما .الفترةخالل نفس % 1.4بنسبة انخفضنصــيب العامــل مــن القيمــة المضــافة فــي فلســطين متوســط
ــــــة مــــــع عــــــام % 1.6بنســــــبة 2015خــــــالل العــــــام مقارن2014 .
ارتفاعــًا فــي شــهدت األنشــطة االقتصــادية فــي فلســطين
ـــاملين ـــام خـــالل العـــدد الع أنشـــطة، باســـتثناء 2015عارتفـاع فـي ىأعل النقل والتخزين أنشطة تسجل .الزراعة
تجـــــارة الجملـــــة والتجزئـــــة أنشـــــطة اعـــــدد العـــــاملين، تالهـــــفـــــي الضـــــفة و . اإلنشـــــاءات أنشـــــطةو الصـــــناعة أنشـــــطةو
األنشطة االقتصادية زيادة فـي عـدد معظمت حققالغربية، المعلومـات و اإلنشـاءاتو باستثناء أنشطة الزراعة العاملين
ت جميع األنشطة االقتصادية في شهد، بينما واالتصاالت أنشـــطة فـــي عـــدد العـــاملين، باســـتثناء ارتفاعـــاً قطـــاع غـــزة
ـــع النســـبي للعـــاملين فـــي األنشـــطة . الزراعـــة ولكـــن التوزيمشـابهًا لمــا بقـي 2015خـالل العـام االقتصـادية المختلفـة
. 2014كان الوضع عليه عام
ـــى مســـتوى األنشـــطة االقتصـــادية، ـــوعل أنشـــطة تاحتلالمرتبــة األولــى فــي االقتصــاد األخــرىالخــدمات والفــروع
تـال ذلـك ،والعمالـة الفلسطيني من حيث القيمة المضافةبينمـا الصـناعة، أنشـطةثم تجارة الجملة والتجزئة، أنشطةمرتبــــة الزراعــــة أنشــــطةو النقــــل والتخــــزين أنشــــطة تاحتلــــ
ــــي ــــاتج المحل ــــي الن ــــث نســــبة المســــاهمة ف متدنيــــة مــــن حينصيب العامل من القيمة لمتوسط أما بالنسبة .جمالياإل
ــــ المعلومــــات واالتصــــاالت ت أنشــــطةالمضــــافة، فقــــد احتل والفــروع األخــرى، الخــدمات ا أنشــطةالمرتبــة األولــى، تالهــ
بلــغ معــدل األجــر اليــومي االســمي . الصــناعة أنشــطةثــم اتالهـالمعلومـات واالتصـاالت، أنشـطةاعلى قيمة لـه فـي
وكانت أقل قيمة له في ؛الخدمات والفروع األخرى أنشطة .الزراعة أنشطةثم في النقل والتخزين أنشطة
فـي الرقم القياسي العـام ألسـعار المسـتهلك مؤشر ارتفع
ليصل إلـى % 1.43بنسبة 2015فلسطين خالل العام ـــع 110.99 ـــة م ـــام 109.42مقارن 2014خـــالل الع

PCBS :2015داء االقتصاد الفلسطيني، أ
ـــاع مؤشـــر ).2010ســـنة األســـاس ( ـــرقم ويعـــزى ارتف الإلـى 2015خـالل العـام القياسي العام ألسـعار المسـتهلك
موعــات الرئيســية المج بعــض الســلع ضــمن ارتفــاع أســعارســــعار مجموعــــة المشــــروبات ، منهــــا أذات الــــوزن االعلــــى
.الكحولية والتبغ
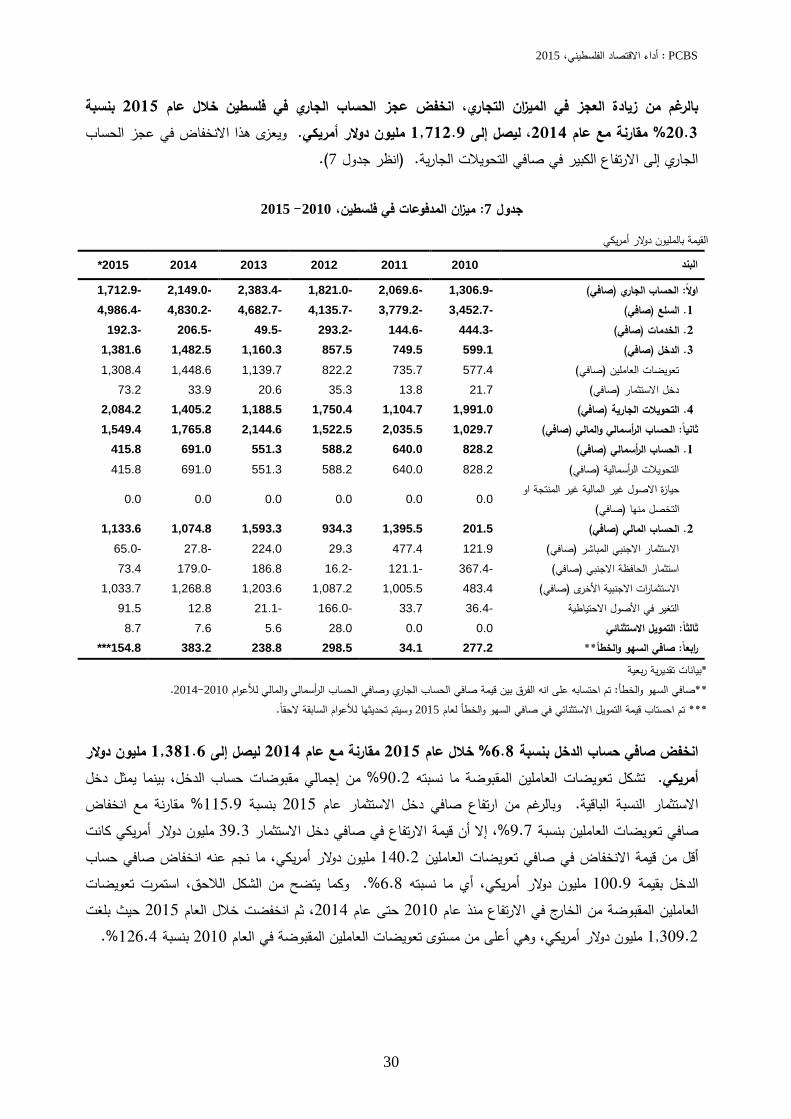
بـــالرغم مـــن زيـــادة العجـــز فـــي الميـــزان التجـــاري بنســـبة ــي فلســطين 2.8% ، انخفــض عجــز الحســاب الجــاري ف
بنســبة ، 2014عــام المقارنــة مــع ،2015عــام الخــالل .مليــون دوالر أمريكــي 1,712.9ليصــل إلــى % 20.3
ويعـــزى هـــذا االنخفـــاض فـــي عجـــز الحســـاب الجـــاري إلـــى االرتفاع الكبير في صافي التحـويالت الجاريـة التـي زادت
صــــافي حســــاب بينمــــا انخفــــض ؛%48.3قيمتهــــا بنســــبة صــافي تعويضــات انخفــاضنتيجــة % 6.8الــدخل بنســبة
انخفضــــت مــــن جهــــة أخــــرى،%. 9.7العــــاملين بنســــبة التحــــــويالت الرأســــــمالية المقبوضــــــة مــــــن الخــــــارج بنســــــبة
مليـون دوالر أمريكـي خـالل 415.8إلى لتصل 39.8% . 2015عام
ــدولي فــي فلســطين انخفــض صــافي وضــع االســتثمار ال 899.0ليصـل إلـى 2015خالل عام % 35.1بنسبة
إجمــــالي انخفــــاضوذلــــك نتيجــــة مليــــون دوالر أمريكــــي،فــــي فــــي الخـــارج أرصـــدة األصـــول الفلســــطينية المســـتثمرة
أرصــدة إجمـالي وارتفـاع% 4.6بنسـبة 2015نهايـة عـام ، %4.2فلســطين بنســبة المســتثمرة فــيالخصــوم األجنبيــة
رصــيد إجمــالي ارتفــعبالمقابــل، . 2014العــام مــع مقارنــة خــالل عــام % 6.9الــدين الخــارجي علــى فلســطين بنســبة
. مليون دوالر أمريكي 1,649.0ليصل إلى 2015
انخفضت قيمة العجز المالي،وفيما يتعلق بالوضع خالل العام يةفلسطينال الحكومة الجاري في موازنة
مليون 1,218.8 إلىلتصل % 8.2بنسبة 2015انخفض الدعم الخارجي لسد العجز كما .دوالر أمريكيليصل ،%31.2بنسبة يةفلسطينالحكومة الفي موازنة
ويعزى .2015مليون دوالر أمريكي عام 708.8إلى
إلى انخفاض النفقات المالي قيمة العجزفي نخفاض الالتصل إلى ،2015عام %2.6الحكومية بنسبة
إجمالي، مع استقرار مليون دوالر أمريكي 4,028.9 ، وهو2014عام عند نفس مستواها يراداتصافي اإل . مليون دوالر أمريكي 2,810.1
لوحدها ما نسبته المحلية الضريبية يراداتشكلت اإل
، 2015عام يراداتصافي اإل إجماليمن % 21.5 ،أمريكي مليون دوالر 605.2 قيمتها حيث بلغت
غير الضريبية المحلية ما نسبته يراداتشكلت اإلو التحصيالت المخصصة ما في حين شكلت ،8.9%
ما المقاصة إيرادات إجمالي شكل بينما ،%2.0نسبته عام يراداتصافي اإل إجماليمن % 73.1نسبته . 2014نفس النسبة التي شّكلها عام ، وهي2015
لـــدى القطــاع المصـــرفيودائــع ال إجمـــاليقيمــة تارتفعــ
لتصـــل فـــي نهايـــة ،2015خـــالل عـــام % 8.1بنســـبة تشــــكل .مليــــون دوالر أمريكــــي 9,654.6العــــام إلــــى
، ودائـعالمن إجمـالي %67.1األشخاص المقيمين ودائع% 5.1الفلســطينية المركزيــة الحكومــةبينمــا تشــكل ودائــع
ــــع .هــــامن ــــة إجمــــاليكمــــا ارتف ــــي التســــهيالت اإلئتماني الت% 19.0بنســــبة 2015منحهــــا القطــــاع المصــــرفي عــــام
.مريكيأمليون دوالر 5,824.7 لتصل إلى
، والقوى العاملة، وميزان جماليالبيانات المتعلقة بالناتج المحلي اإل :مالحظةالمــدفوعات ال تشــمل ذلــك الجــزء مــن محافظــة القــدس الــذي ضــمته اســرائيل
.1967 عنـــــــــــــــــــــــوة بعيـــــــــــــــــــــــد احتاللهـــــــــــــــــــــــا للضـــــــــــــــــــــــفة الغربيـــــــــــــــــــــــة عـــــــــــــــــــــــام

PCBS: 2015داء االقتصاد الفلسطيني، أ
13
2015األداء االقتصادي للعام
0Fجماليالناتج المحلي اإل -1
1:
خالل % 0.2، مقارنة مع تراجع بنسبة 2015خالل العام % 3.5بنسبة نمواً فلسطينفي جماليالناتج المحلي اإل شهد 2011خالل العام بلغ ذروته ، 2013-2010 انتعاشا ملحوظا خالل الفترةوكان االقتصاد الفلسطيني قد شهد .2014العام
يعود ان ، قبل 2014خالل العام %0.2أن أصبح سالبًا إلىتدريجيا انخفض ثم ،%12.4 إلى حين وصل معدل النمو %.3.5ليصل إلى 2015ويرتفع خالل عام
، حيث بلغ معدل النمو 2015بين قطاع غزة والضفة الغربية خالل العام جماليتفاوتت معدالت النمو في الناتج المحلي اإلويعزى النمو في قطاع غزة إلى مجموعة من العوامل، أهمها .في الضفة الغربية% 2.5مقارنة مع % 6.8في القطاع
عمار قطاع غزة، وتقليل القيود المفروضة على استيراد المواد الخام ومواد البناء، وزيادة المعونات والمساعدات إعادة إالبدء بالناتج المحلي قيمة ، إال أن2015وبالرغم من هذا النمو الملحوظ في قطاع غزة خالل العام .القطاع إلىالتي تصل
تدهور كبير والذي أدى إلى 2014في شهر تموز قبل العدوان اإلسرائيلي على القطاع عليه تأقل مما كان تظل جمالياإل، ولكنه 2013-2011مضطردًا خالل األعوام ، فقد شهد القطاع نمواً )1(وكما يتضح من جدول . في النشاط االقتصادي
العدوان اإلسرائيلي والحصار نتيجة % 15.1بنسبة جماليحيث انخفض الناتج المحلي اإل 2014تراجع بشكل كبير عام انخفض معدل النمو في الناتج المحلي أما في الضفة الغربية، فقد .%6.8قبل أن يرتفع ثانية بنسبة الخانق على القطاع
عام % 5.3قبل أن يرتفع ثانية إلى ،2013عام % 1.0إلى ، ثم 2012عام % 6.0إلى 2011عام % 10.7من جمالياإلالقيود اإلسرائيلية على ويعزى ذلك بشكل رئيسي إلى استمرار .%2.5 إلىليصل 2015عام ثم يعاود االنخفاض ،2014
.خصوصا مع تراجع الدعم الخارجي بشكل كبير ،النشاط االقتصادي واألزمة المالية التي تعاني منها دولة فلسطين
إلــىلتصــل قلــيالً جمــاليفــي النــاتج المحلــي اإل غــزة مســاهمة قطــاع ارتفعــتفقــد نتيجــة لهــذا التبــاين فــي معــدالت النمــو، ولكنهــا ظلــت أقــل بكثيــر ممــا كانــت عليــه قبــل عشــر .2014فــي عــام % 22.9مقارنــة مــع 2015خــالل العــام % 23.6
لقطـــاع غـــزة جمـــالي، بلـــغ النـــاتج المحلـــي اإلالالحـــقكمـــا يتضـــح مـــن الشـــكل و .2005عـــام % 37.4ســـنوات، حيـــث بلغـــت .أمريكيمليون دوالر 7,721.7 لفلسطين في حين بلغ، 2015مليون دوالر أمريكي عام 1,825.9) باألسعار الثابتة(
، كما ان بيانات الناتج المحلي اإلجمالي 1967ذلك الجزء من محافظة القدس الذي ضمته اسرائيل عنوة بعيد احتاللها للضفة الغربية عام ال تشملالبيانات 1
ونجم ذلك عن يالحظ وجود بعض االختالفات الطفيفة في قيم المتغيرات، هي اولية مبنية على تقديرات ربعية وهي عرضة للتنقيح والتعديل، 2015ومكوناته لعام
.التقريب المصاحب لعمليات المعالجة على الحاسب
PCBS: 2015داء االقتصاد الفلسطيني، أ
14
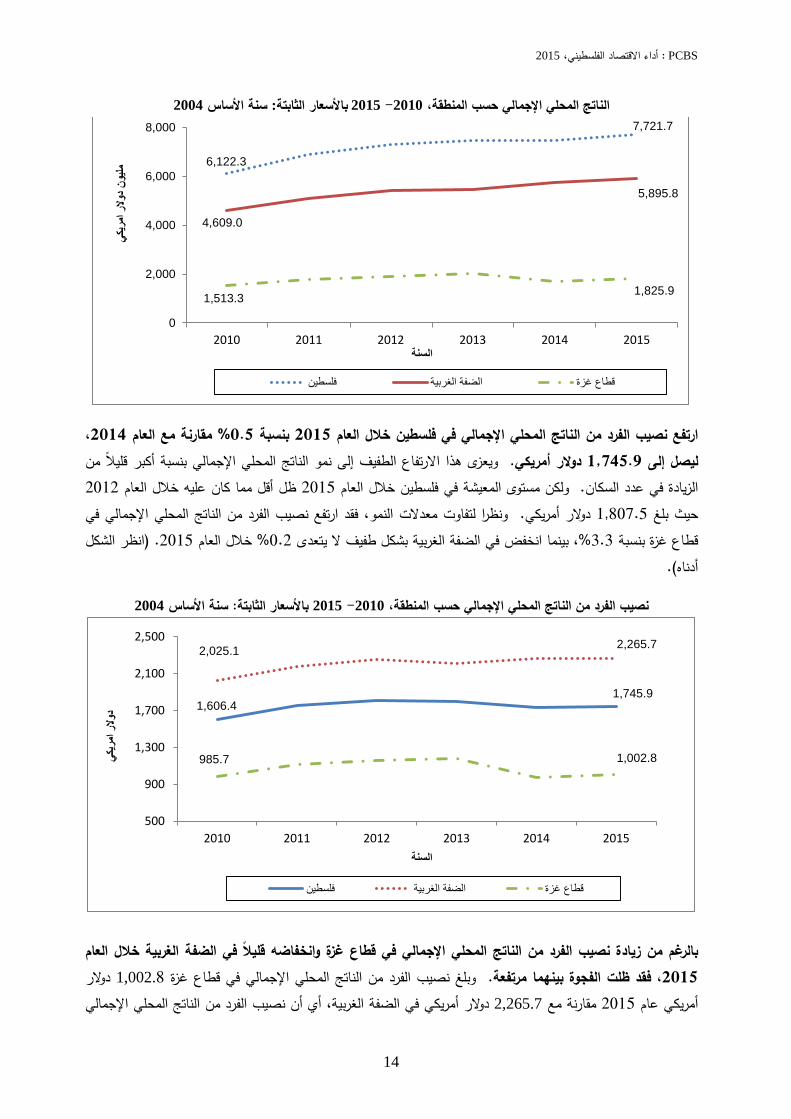
2004سنة األساس :باألسعار الثابتة 2015 -2010حسب المنطقة، جماليالناتج المحلي اإل
، 2014مقارنة مع العام % 0.5بنسبة 2015خالل العام في فلسطين جمالينصيب الفرد من الناتج المحلي اإل ارتفعمن قليًال بنسبة أكبر جماليالناتج المحلي اإل نمو إلىالطفيف االرتفاعهذا ويعزى .أمريكي دوالر 1,745.9ليصل إلى
2012ظل أقل مما كان عليه خالل العام 2015فلسطين خالل العام مستوى المعيشة في ولكن . الزيادة في عدد السكانالفرد من الناتج المحلي اإلجمالي في نصيبونظرا لتفاوت معدالت النمو، فقد ارتفع .دوالر أمريكي 1,807.5حيث بلغ
شكل الانظر (. 2015خالل العام % 0.2، بينما انخفض في الضفة الغربية بشكل طفيف ال يتعدى %3.3قطاع غزة بنسبة ).أدناه
2004سنة األساس : باألسعار الثابتة 2015 -2010حسب المنطقة، جمالينصيب الفرد من الناتج المحلي اإل
الضفة الغربية خالل العام وانخفاضه قليًال في في قطاع غزة جمالينصيب الفرد من الناتج المحلي اإلزيادة بالرغم من دوالر .81,002قطاع غزة في جماليبلغ نصيب الفرد من الناتج المحلي اإلو .مرتفعة هماالفجوة بينلت ظفقد ، 2015 جماليفي الضفة الغربية، أي أن نصيب الفرد من الناتج المحلي اإل أمريكي دوالر 2,265.7مقارنة مع 2015عام أمريكي
6,122.3
7,721.7
4,609.0
5,895.8
1,513.3 1,825.9
0
2,000
4,000
6,000
8,000
2010 2011 2012 2013 2014 2015
كيمري
ر اوال
ن ديو
مل
السنة
قطاع غزة الضفة الغربية فلسطين
1,606.4 1,745.9
2,025.1 2,265.7
985.7 1,002.8
500
900
1,300
1,700
2,100
2,500
2010 2011 2012 2013 2014 2015
كيري
امالر
دو
السنة
قطاع غزة الضفة الغربية فلسطين
PCBS: 2015داء االقتصاد الفلسطيني، أ
15
مما كانت عليه عام أعلى قليالً ، وهي 2015م اعنصيب الفرد في الضفة الغربية منفقط % 44.3 يمثلفي قطاع غزة %.90.7، وهي قبل عشر سنواتالنسبة التي كانت اقل بكثير من، ولكنها %42.8، وهي 2014
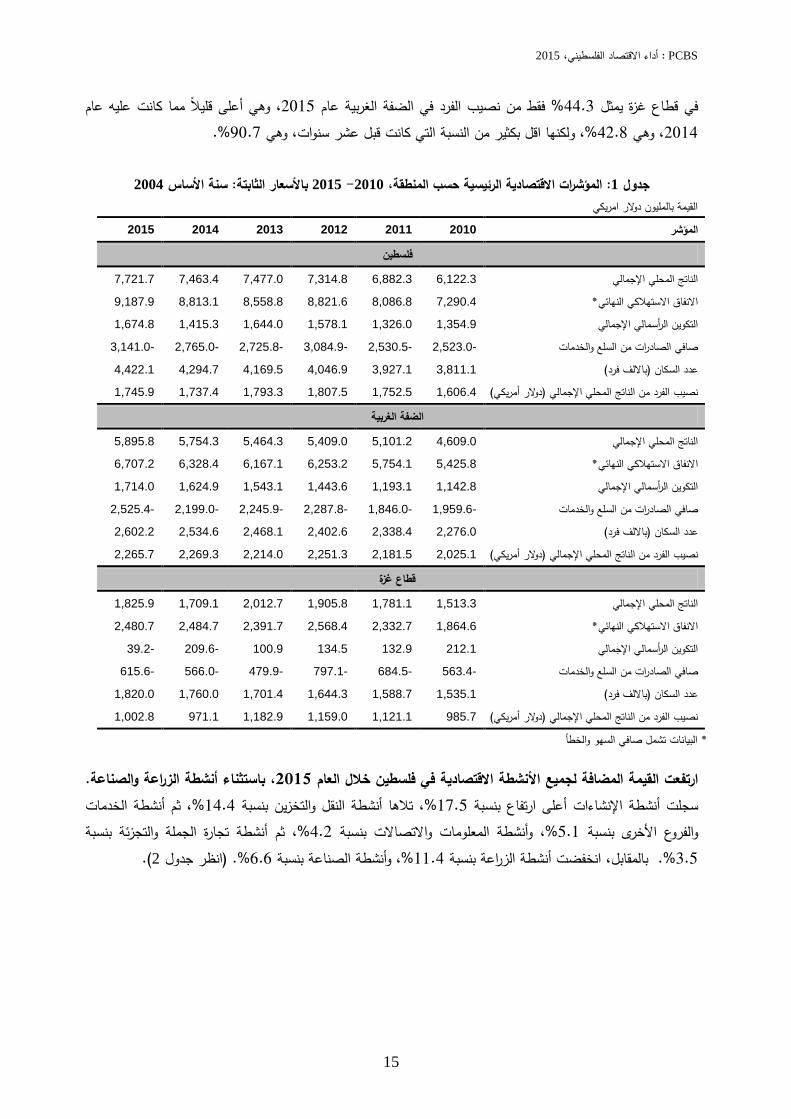
2004ساس سنة األ: باألسعار الثابتة 2015 -2010حسب المنطقة، الرئيسية االقتصاديةمؤشرات ال :1جدول
القيمة بالمليون دوالر امريكي
والخطأ البيانات تشمل صافي السهو*
.الزراعة والصناعة أنشطة، باستثناء 2015خالل العام في فلسطين القيمة المضافة لجميع األنشطة االقتصادية ارتفعتالخدمات أنشطةثم ، %14.4بنسبة النقل والتخزين أنشطة اهتال، %17.5 بنسبة على ارتفاعأ اإلنشاءات أنشطة تسجل
بنسبة تجارة الجملة والتجزئة أنشطةثم ،%4.2بنسبة المعلومات واالتصاالت وأنشطة ،%5.1بنسبة األخرىوالفروع ).2انظر جدول (. %6.6الصناعة بنسبة وأنشطة، %11.4بنسبة الزراعة أنشطة تانخفض بالمقابل،. 3.5%
2015 2014 2013 2012 2011 2010 المؤشر
فلسطين
7,721.7 7,463.4 7,477.0 7,314.8 6,882.3 6,122.3 جماليالناتج المحلي اإل
9,187.9 8,813.1 8,558.8 8,821.6 8,086.8 7,290.4 *النهائياالنفاق االستهالكي
1,674.8 1,415.3 1,644.0 1,578.1 1,326.0 1,354.9 جماليالتكوين الرأسمالي اإل
-3,141.0 -2,765.0 -2,725.8 -3,084.9 -2,530.5 -2,523.0 صافي الصادرات من السلع والخدمات
4,422.1 4,294.7 4,169.5 4,046.9 3,927.1 3,811.1 )بااللف فرد(عدد السكان
1,745.9 1,737.4 1,793.3 1,807.5 1,752.5 1,606.4 )دوالر أمريكي( جمالينصيب الفرد من الناتج المحلي اإل
الضفة الغربية
5,895.8 5,754.3 5,464.3 5,409.0 5,101.2 4,609.0 جماليالناتج المحلي اإل
6,707.2 6,328.4 6,167.1 6,253.2 5,754.1 5,425.8 *االنفاق االستهالكي النهائي
1,714.0 1,624.9 1,543.1 1,443.6 1,193.1 1,142.8 جماليالتكوين الرأسمالي اإل
-2,525.4 -2,199.0 -2,245.9 -2,287.8 -1,846.0 -1,959.6 صافي الصادرات من السلع والخدمات
2,602.2 2,534.6 2,468.1 2,402.6 2,338.4 2,276.0 )بااللف فرد(عدد السكان
2,265.7 2,269.3 2,214.0 2,251.3 2,181.5 2,025.1 )دوالر أمريكي( جمالينصيب الفرد من الناتج المحلي اإل
قطاع غزة
1,825.9 1,709.1 2,012.7 1,905.8 1,781.1 1,513.3 جماليالناتج المحلي اإل
2,480.7 2,484.7 2,391.7 2,568.4 2,332.7 1,864.6 *االنفاق االستهالكي النهائي
-39.2 -209.6 100.9 134.5 132.9 212.1 جماليالتكوين الرأسمالي اإل
-615.6 -566.0 -479.9 -797.1 -684.5 -563.4 صافي الصادرات من السلع والخدمات
1,820.0 1,760.0 1,701.4 1,644.3 1,588.7 1,535.1 )بااللف فرد(عدد السكان
1,002.8 971.1 1,182.9 1,159.0 1,121.1 985.7 )دوالر أمريكي( جمالينصيب الفرد من الناتج المحلي اإل
PCBS: 2015داء االقتصاد الفلسطيني، أ
16
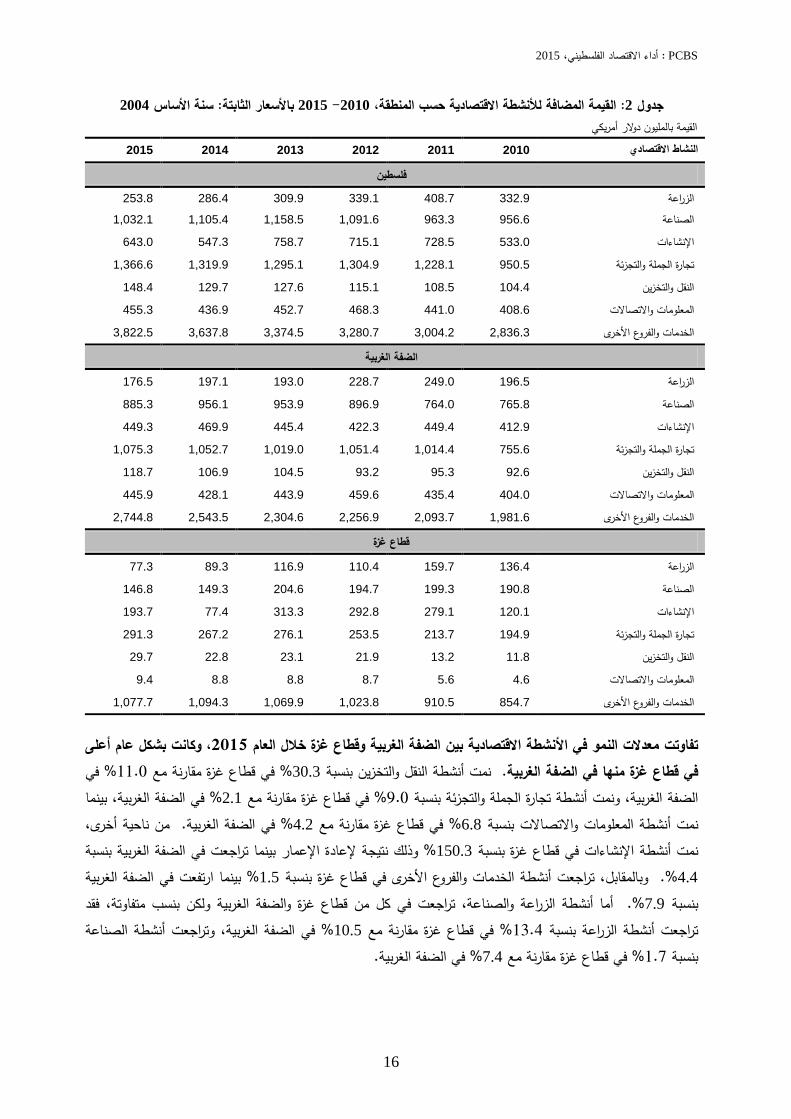
2004ساس سنة األ: باألسعار الثابتة 2015 -2010، ة حسب المنطقةالقيمة المضافة لألنشطة االقتصادي: 2 جدول أمريكيالقيمة بالمليون دوالر
وكانت بشكل عام أعلى ،2015خالل العام بين الضفة الغربية وقطاع غزةفي األنشطة االقتصادية النموتفاوتت معدالت في % 11.0في قطاع غزة مقارنة مع % 30.3النقل والتخزين بنسبة أنشطة تنم .في قطاع غزة منها في الضفة الغربية
في الضفة الغربية، بينما % 2.1في قطاع غزة مقارنة مع % 9.0بنسبة تجارة الجملة والتجزئة أنشطة تونم، الضفة الغربية ،من ناحية أخرى. في الضفة الغربية% 4.2قارنة مع في قطاع غزة م% 6.8المعلومات واالتصاالت بنسبة أنشطة تنم
الغربية بنسبة في الضفة تبينما تراجع وذلك نتيجة إلعادة اإلعمار %150.3في قطاع غزة بنسبة اإلنشاءاتأنشطة نمتفي الضفة الغربية تبينما ارتفع% 1.5في قطاع غزة بنسبة األخرىالخدمات والفروع أنشطة توبالمقابل، تراجع%. 4.4
في كل من قطاع غزة والضفة الغربية ولكن بنسب متفاوتة، فقد الزراعة والصناعة، تراجعتأنشطة أما . %7.9بنسبة عة الصناأنشطة تفي الضفة الغربية، وتراجع% 10.5في قطاع غزة مقارنة مع % 13.4بنسبة الزراعة أنشطة تتراجع
.في الضفة الغربية %7.4في قطاع غزة مقارنة مع % 1.7بنسبة
2015 2014 2013 2012 2011 2010 النشاط االقتصادي
فلسطين
253.8 286.4 309.9 339.1 408.7 332.9 الزراعة
1,032.1 1,105.4 1,158.5 1,091.6 963.3 956.6 الصناعة
643.0 547.3 758.7 715.1 728.5 533.0 اإلنشاءات
1,366.6 1,319.9 1,295.1 1,304.9 1,228.1 950.5 تجارة الجملة والتجزئة
148.4 129.7 127.6 115.1 108.5 104.4 النقل والتخزين
455.3 436.9 452.7 468.3 441.0 408.6 المعلومات واالتصاالت
3,822.5 3,637.8 3,374.5 3,280.7 3,004.2 2,836.3 األخرىوالفروع الخدمات
الضفة الغربية
176.5 197.1 193.0 228.7 249.0 196.5 الزراعة
885.3 956.1 953.9 896.9 764.0 765.8 الصناعة
449.3 469.9 445.4 422.3 449.4 412.9 اإلنشاءات
1,075.3 1,052.7 1,019.0 1,051.4 1,014.4 755.6 تجارة الجملة والتجزئة
118.7 106.9 104.5 93.2 95.3 92.6 النقل والتخزين
445.9 428.1 443.9 459.6 435.4 404.0 المعلومات واالتصاالت
2,744.8 2,543.5 2,304.6 2,256.9 2,093.7 1,981.6 األخرىوالفروع الخدمات
قطاع غزة
77.3 89.3 116.9 110.4 159.7 136.4 الزراعة
146.8 149.3 204.6 194.7 199.3 190.8 الصناعة
193.7 77.4 313.3 292.8 279.1 120.1 اإلنشاءات
291.3 267.2 276.1 253.5 213.7 194.9 تجارة الجملة والتجزئة
29.7 22.8 23.1 21.9 13.2 11.8 النقل والتخزين
9.4 8.8 8.8 8.7 5.6 4.6 المعلومات واالتصاالت
1,077.7 1,094.3 1,069.9 1,023.8 910.5 854.7 األخرىوالفروع الخدمات

PCBS: 2015داء االقتصاد الفلسطيني، أ
17
عام فلسطينفي جمالياألنشطة االقتصادية في الناتج المحلي اإلانعكس التفاوت في معدالت النمو على مساهمة والنقل والتخزين والخدمات اإلنشاءاتأنشطة وارتفعت مساهمة ،الزراعة والصناعة أنشطةتراجعت مساهمة حيث ،2015
انخفضت مساهمة .المعلومات واالتصاالت وأنشطة تجارة الجملة والتجزئة أنشطةروع األخرى، ولم تتغير مساهمة والف بينما انخفضت مساهمة ،2014عام % 3.8مقارنة مع 2015عام %3.3 إلى جماليالزراعة في الناتج المحلي اإل أنشطة
زادت فقد ، األخرىالخدمات والفروع أنشطة أما . 2014عام خالل % 14.8مقارنة مع %13.4 لتصبحالصناعة أنشطة وتعزى هذه الزيادة في .2014خالل العام % 48.8مقارنة مع %49.5 لتصبح جماليفي الناتج المحلي اإل امساهمتهمقارنة باألنشطة األخرى 2015خالل العام األنشطة هالنمو السريع في هذالخدمات والفروع األخرى إلى أنشطة مساهمة
والي نصف الناتج حهيمن على تالخدمات والفروع األخرى أنشطة تأصبحوبذلك .تراجعتنمت بشكل بطئ أو التي من بينها الفرعية، شمل مجموعة كبيرة من األنشطة تخرى الخدمات والفروع األأنشطة ويعود ذلك إلى أن ،جماليالمحلي اإل
والمهنية والعلمية والتقنيةواإليجارية العقارية واألنشطة قامة والطعامأنشطة خدمات اإلو نشطة المالية وأنشطة التأمين األفي اارتفعت مساهمته ، فقداإلنشاءاتأنشطة أما .يرهاوغ والعمل االجتماعي والتعليم والصحة واإلدارية والخدمات المساندة
. 2014عام %7.3مقارنة مع ، 2015عام %8.3 إلى جماليالناتج المحلي اإل
الخدمات والفروع أنشطة، ولكن 2015تباينت هيكلية األنشطة االقتصادية بين الضفة الغربية وقطاع غزة خالل العام بينما ،%59.1لقطاع غزة جماليالناتج المحلي اإلفي األنشطة مساهمة هذه بلغت .في كٍل منهما ت المهيمنةاألخرى ظل
المرتبة تاحتل، فقد تجارة الجملة والتجزئةأنشطة أما %. 46.6 للضفة الغربية جماليالناتج المحلي اإلفي اتهمساهم تبلغ .قطاع غزةفي % 16.0مقابل الضفة الغربيةفي جماليمن الناتج المحلي اإل% 18.2 بنسبة تساهمالثانية، حيث
أنشطة تساهمو في قطاع غزة، % 8.0مقابل في الضفة الغربية % 15.0بنسبة الصناعةأنشطة تساهمبالمقابل، على ،%0.5 و %10.6مقابل ،في الضفة الغربيةلكل منهما % 7.6بنسبة المعلومات واالتصاالت أنشطةو اإلنشاءات
قطاع غزة، في % 4.2مقابل في الضفة الغربية% 3.0 بنسبة تساهمقد ف، الزراعةأنشطة أما . في قطاع غزة ،التوالي ).انظر الشكل أدناه( .في قطاع غزة% 1.6في الضفة الغربية مقابل % 2.0النقل والتخزين بنسبة أنشطة تساهمو
2004سنة األساس : باألسعار الثابتة 2015حسب المنطقة، جمالينشطة االقتصادية في الناتج المحلي اإلنسبة مساهمة األ
59.1
16.0 10.6 8.0
4.2 1.6 0.5
46.6
18.2
7.6
15.0
3.0 2.0 7.6
0
10
20
30
40
50
60
70
سبةالن
النشاط االقتصادي
الضفة الغربية قطاع غزة

PCBS: 2015داء االقتصاد الفلسطيني، أ
18
1Fسوق العمل -2
2
محدوديــة المــوارد الطبيعيــة والســيطرة ظــل فــي ، خصوصــاً العمــل أهــم عوامــل اإلنتــاج فــي االقتصــاد الفلســطينيعنصــر يعتبــر أهم مؤشرات سوق ) 3(جدول ويبّين . اإلسرائيلية على األراضي والمياه والقيود على حركة األشخاص والسلع ورؤوس األموال
. 2015-2010العمل خالل الفترة
2015 -2010، حسب المنطقةسنة فأكثر 15عمل لألفراد مؤشرات سوق ال: 3جدول
.لمالحظة القوة الشرائية للعامل باألسعار الثابتة )2010سنة االساس ( تم ربط معدل األجر اليومي االسمي بالرقم القياسي ألسعار المستهلك * .عدد العاملين/القيمة المضافة= العامل من القيمة المضافةنصيب متوسط **
مـا فيألـف فـرد، 1,295.4صـل إلـى ، لي2014مقارنـة مـع العـام % 4.3ة بسـبن 2015عـام ال خـاللزاد حجم القوى العاملـة ويعـزى ذلـك .خـالل نفـس الفتـرة% 46.7مقارنـة مـع % 46.0 إلـىلتصـل قليًال نسبة المشاركة في القوى العاملة انخفضت
. القــوة البشــرية إجمــاليأقــل مــن الزيــادة فــي كانــت 2015عــام الالــذين دخلــوا ســوق العمــل خــالل األفــرادعــدد فــي زيــادةن الأإلــى فـي الضـفة الغربيـة % 46.4تفاوتت نسبة المشاركة فـي القـوى العاملـة بـين الضـفة الغربيـة وقطـاع غـزة، حيـث بلغـت هـذه النسـبة
، كما ان بيانات العاملين ومعدل االجر ال تشمل 1967ذلك الجزء من محافظة القدس الذي ضمته اسرائيل عنوة بعيد احتاللها للضفة الغربية عام ال تشملالبيانات 2
.ايضا العاملين باسرائيل والمستوطنات والخارج
2015 2014 2013 2012 2011 2010 المؤشر
فلسطين
1,295.4 1,242.3 1,137.5 1,085.8 1,012.7 923.5 )فرد باأللف(حجم القوى العاملة 845.6 804.5 780.0 764.8 736.5 643.6 )فرد باأللف ( العاملينعدد 46.0 46.7 44.5 44.4 43.4 41.3 (%) القوى العاملة نسبة المشاركة في 25.9 27.2 23.8 23.5 21.8 25.0 (%) معدل البطالة 83.1 83.2 80.2 78.7 76.0 75.4 )شيكل(معدل األجر اليومي االسمي 74.9 76.0 74.6 74.4 73.9 75.4 )*شيكل( معدل األجر اليومي الحقيقي 9,131.6 9,277.1 9,585.9 9,564.3 9,344.6 9,512.6 )عامل/ بالدوالر**(متوسط نصيب العامل من القيمة المضافة
الضفة الغربية
824.7 798.5 741.3 714.4 671.2 612.8 )فرد باأللف(حجم القوى العاملة 568.9 556.1 513.0 508.5 492.9 450.3 )بااللف فرد( العاملينعدد 46.4 48.0 46.5 46.9 46.4 44.3 (%) نسبة المشاركة في القوى العاملة 17.3 18.0 19.0 19.7 18.4 18.5 (%) معدل البطالة 94.0 90.7 88.4 85.7 82.7 82.6 )شيكل(اليومي االسمي معدل األجر 82.5 80.7 79.6 79.5 79.9 82.6 )*شيكل( معدل األجر اليومي الحقيقي 10,363.5 10,347.6 10,651.7 10,637.2 10,349.4 10,235.4 )عامل/ بالدوالر**(متوسط نصيب العامل من القيمة المضافة
قطاع غزة
470.7 443.8 396.2 371.4 341.5 310.7 )فرد باأللف(حجم القوى العاملة 276.7 248.4 267.0 256.3 243.6 193.3 )بااللف فرد( العاملينعدد 45.3 44.4 41.2 40.1 38.4 36.4 (%) نسبة المشاركة في القوى العاملة 41.0 43.9 32.6 31.0 28.7 37.8 (%) معدل البطالة 61.9 64.0 63.2 64.3 61.6 58.2 )شيكل(معدل األجر اليومي االسمي 59.0 62.1 63.0 63.6 61.2 58.2 )*شيكل( معدل األجر اليومي الحقيقي 6,598.8 6,880.4 7,538.2 7,435.8 7,311.6 7,828.8 )عامل/ بالدوالر**(متوسط نصيب العامل من القيمة المضافة

PCBS: 2015داء االقتصاد الفلسطيني، أ
19
نسـبة كانـتوتعكـس هـذه النسـبة تحسـنًا فـي معـدل المشـاركة فـي قطـاع غـزة الـذي .في قطاع غزة% 45.3، مقابل 2015عام ويعـزى ذلـك .2014 عـام %48.0 النسـبة بلغتحيث ،الضفة الغربية فيما انخفضت في، 2014عام % 44.4 فيه المشاركة
كانــت اقــل مــن الزيــادة فــي إجمــالي القــوى 2015خــالل العــام فــي الضــفة الغربيــةفــي حجــم القــوى العاملــة الزيــادةإلــى أن نســبة أكبـر مـن الزيـادة فـي إجمـالي 2015فـي قطـاع غـزة خـالل العـام فـي حجـم القـوى العاملـة الزيـادةنسبة بالمقابل، كانت . البشرية
. القوى البشرية
حيـث وصـل عـدد العـاملين فـي فلسـطين ،2014مقارنـة مـع عـام % 5.1بنسبة في عدد العاملين ارتفاعاً 2015شهد عام نسـبة الزيـادة فـي عـدد العـاملين وصـلت .2014عام في عامل ألف 804.5، مقابل 2015ألف عامل خالل العام 845.6
.2015عام خالل ال في الضفة الغربية% 2.3مقابل ،%11.4 في قطاع غزة
.2014فــي العــام % 27.2مقارنــة مــع 2015فــي العــام %25.9 فــي فلســطين إلــىنســبة العــاطلين عــن العمــل انخفضــت ض انخفـو كمـا . حجـم القـوى العاملـة الزيـادة فـيمن أكبرزيادة عدد العاملين بنسبة إلىفي معدل البطالة هذا االنخفاضويعزى
بعـد أن ،2015خـالل عـام علـى التـوالي% 41.0و %17.3 إلـىوقطاع غزة ليصل الضفة الغربيةكل من معدل البطالة في .2014خالل عام % 43.9و %18.0كان
2015 -2010، حسب المنطقةمعدل البطالة
معـدل األجـر اليـومي ولكـن، 2014العـام مقارنة مع 2015معدل األجر اليومي االسمي في فلسطين خالل العام لم يتغيروكمـا يتضـح مـن جـدول . فـي األسـعارالتغيـر الحاصـل ويعـزى ذلـك إلـى ،الفتـرةخالل نفس % 1.4بنسبة انخفض الحقيقي
74.9الحقيقـي اليـومي معـدل األجـر بينمـا بلـغ 2015شـيكل خـالل العـام 83.1بلغ معدل األجر اليـومي االسـمي فقد ،)3(مــن وبالمقارنــة، كــان معــدل األجــر اليــومي االســمي والحقيقــي فــي الضــفة الغربيــة أعلــى ).انظــر أيضــًا الشــكل الالحــق(شــيكل شـيكل فـي قطـاع 61.9شـيكل مقابـل 94.0قطاع غزة، حيث بلغ معدل األجر اليومي االسمي في الضفة الغربية في مثيليهما
شــيكل فــي قطــاع غــزة 59.0شــيكل مقابــل 82.5، كمــا بلــغ معــدل األجــر اليــومي الحقيقــي فــي الضــفة الغربيــة 2015غــزة عــام . خالل نفس العام
25.0 25.9
18.5 17.3
37.8 41.0
0.0
10.0
20.0
30.0
40.0
50.0
2010 2011 2012 2013 2014 2015
الةبط
الدل
مع
السنة
قطاع غزة الضفة الغربية فلسطين
PCBS: 2015داء االقتصاد الفلسطيني، أ
20
2010سنة األساس : 2015 -2010اإلسرائيلي في فلسطين، معدل األجر اليومي االسمي والحقيقي بالشيكل
ــة مــع عــام % 1.6بنســبة 2015نصــيب العامــل مــن القيمــة المضــافة فــي فلســطين خــالل العــام متوســط انخفــض مقارن، حيث 2015-2010خالل الفترة من القيمة المضافة نصيب العامل متوسط تذبذب، أدناهوكما يتضح من الشكل .2014
لكـل أمريكـي دوالر 9,131.6 إلـىليصـل يـنخفضقبـل أن ،2013مستوى لـه عـام أعلىحتى وصل 2011بعد العام ارتفع دوالر 10,363.5يتفاوت نصيب العامل من القيمة المضافة بين الضفة الغربية وقطـاع غـزة، حيـث بلـغ .2015عامل عام
نصــيب متوســط ويعتبــر. لكــل عامــل فــي قطــاع غــزة أمريكــي دوالر 6,598.8لكــل عامــل فــي الضــفة الغربيــة مقابــل أمريكــيومـدى العامل مؤشرًا هامًا لقيـاس مـدى كفـاءة وفعاليـة عنصـر العمـل فـي تحقيـق مسـتوى معـين مـن مخرجـات العمليـة اإلنتاجيـة
نصـيب وسـط متوهناك عوامـل عديـدة تلعـب دورا مهمـا فـي تحديـد مسـتوى . استغالل العنصر التكنولوجي في العملية االنتاجيةالعامل، من بينها جودة مدخالت اإلنتاج والتكنولوجيا والتعليم والتـدريب وبيئـة العمـل المتمثلـة فـي القـوانين والتشـريعات الخاصـة
. بسوق العمل وغيرها
2015 -2010في فلسطين، ) األمريكي بالدوالر(متوسط نصيب العامل من القيمة المضافة
75.4
83.1
74.9
50
60
70
80
90
100
2010 2011 2012 2013 2014 2015
ليائي
سرل ا
شيك
السنة
األجر الحقيقي األجر االسمي
9,512.6
9,131.6
7,500
8,000
8,500
9,000
9,500
10,000
2010 2011 2012 2013 2014 2015
كيري
امالر
دو
السنة

PCBS: 2015داء االقتصاد الفلسطيني، أ
21
تسجل .الزراعة أنشطة، باستثناء 2015عام خالل الفي فلسطين العاملين عددقتصادية ارتفاعًا في شهدت األنشطة االتال ذلك ، 2014مقارنة مع عام % 16.5بنسبة 2015في عدد العاملين خالل العام ارتفاعأعلى النقل والتخزين أنشطة أنشطة، و %7.4 بنسبة اإلنشاءات ، وأنشطة%7.5بنسبة الصناعة أنشطة، ثم %9.3 بنسبة والتجزئة تجارة الجملة أنشطة
2Fالخدمات والفروع األخرى
انخفض عدد العاملين بالمقابل %.4.9بنسبة المعلومات واالتصاالت وأنشطة، %5.5بنسبة 3 .مقارنة بالعام الذي سبقه% 14.3بنسبة 2015عام الزراعة أنشطةفي
.2015خالل العام العاملين في األنشطة االقتصادية بين الضفة الغربية وقطاع غزة عددفي الزيادةتفاوتت معدالت والمعلومات اإلنشاءاتنشطة الزراعة و يادة في عدد العاملين باستثناء أة الغربية ز األنشطة االقتصادية في الضف معظمت حقق
. الزراعة أنشطة في أعداد العاملين، باستثناء ارتفاعاً قطاع غزةت جميع األنشطة االقتصادية في شهدما ك، واالتصاالتتال ، %10.3 بنسبة في الضفة الغربية 2015في عدد العاملين خالل عام زيادةأعلى نسبة النقل والتخزين أنشطة توحققبة بنس الصناعة وأنشطة% 5.3 بنسبة األخرىالخدمات والفروع أنشطةثم %6.8بنسبة تجارة الجملة والتجزئة أنشطةذلك اإلنشاءات أنشطة، وفي %14.4بنسبة في الضفة الغربية الزراعة أنشطةبالمقابل، انخفض عدد العاملين في .3.8%
جميع األنشطة االقتصادية زيادة ت، شهدقطاع غزةأما في %. 1.8بنسبة المعلومات واالتصاالت وأنشطة% 2.5بنسبة أنشطةذلك تال% 140.0بنسبة أعلى نسبة زيادة اإلنشاءات أنشطة تسجلو . الزراعة أنشطةفي عدد العاملين باستثناء
وأنشطة% 19.2 بنسبة المعلومات واالتصاالت أنشطة، ثم %27.7 بنسبة النقل والتخزين وأنشطة %31.1 بنسبة الصناعةانخفض عدد العاملين في بالمقابل، .%5.8 بنسبة األخرىالخدمات والفروع وأنشطة% 15.7 بنسبة تجارة الجملة والتجزئة
).4انظر جدول ( %.14.0الزراعة بنسبة أنشطة
يالحكومالقطاع العاملين في تشمل 3

PCBS: 2015داء االقتصاد الفلسطيني، أ
22
2015 -2010المنطقة، و عدد العاملين حسب النشاط االقتصادي : 4جدول
تشمل العاملين في القطاع الحكومي*
، بقي 2015في عدد العاملين في األنشطة االقتصادية المختلفة خالل العام الزيادةمعدالت بالرغم من التفاوت في تركز العاملون في فلسطين بشكل و .2014لما كان الوضع عليه عام مشابهاً في تلك األنشطة التوزيع النسبي للعاملين
، تال 2015خالل العام % 42.1 األنشطة ه، حيث بلغت نسبة العاملين في هذوالفروع األخرى الخدمات أنشطةكبير في وتفاوتت نسبة العاملين %.13.7بنسبة الصناعة وأنشطة ،%20.0تجارة الجملة والتجزئة بنسبة أنشطةن في و ذلك العاملوالفروع الخدمات أنشطة فيبلغت نسبة العاملين ، حيث بشكل واضح بين الضفة الغربية وقطاع غزة األنشطةفي هذه تجارة الجملة أنشطةفي قطاع غزة، بينما بلغت نسبة العاملين في % 56.3مقابل % 35.4في الضفة الغربية األخرى في % 17.0 الصناعة أنشطةفي قطاع غزة، وبلغت نسبة العاملين في % 18.4في الضفة الغربية مقابل % 20.7 والتجزئة
).الالحقانظر الشكل ( .في قطاع غزة% 7.0الضفة الغربية مقابل
2015 2014 2013 2012 2011 2010 النشاط االقتصادي
فلسطين
73,200 85,400 84,100 91,100 93,000 81,100 الزراعة 115,900 107,800 101,100 98,200 89,300 75,200 الصناعة 77,200 71,900 77,800 74,800 69,900 56,700 اإلنشاءات 168,700 154,300 143,300 140,600 141,200 115,900 تجارة الجملة والتجزئة 45,300 38,900 44,400 41,200 39,700 32,300 النقل والتخزين 8,500 8,100 7,600 8,300 5,900 6,600 المعلومات واالتصاالت 356,800 338,100 321,700 310,600 297,500 275,800 *األخرىوالفروع الخدمات
الضفة الغربية
54,800 64,000 61,600 69,700 69,600 66,200 الزراعة 96,500 93,000 84,600 82,300 74,500 64,800 الصناعة 65,200 66,900 59,200 55,000 55,400 51,000 اإلنشاءات 117,900 110,400 96,000 98,900 99,000 84,100 تجارة الجملة والتجزئة 27,800 25,200 24,400 21,400 22,100 20,900 النقل والتخزين 5,400 5,500 5,400 6,500 4,800 4,900 المعلومات واالتصاالت 201,300 191,100 181,800 174,700 167,500 158,400 *األخرىوالفروع الخدمات
قطاع غزة
18,400 21,400 22,500 21,400 23,400 14,900 الزراعة 19,400 14,800 16,500 15,900 14,800 10,400 الصناعة 12,000 5,000 18,600 19,800 14,500 5,700 اإلنشاءات 50,800 43,900 47,300 41,700 42,200 31,800 تجارة الجملة والتجزئة 17,500 13,700 20,000 19,800 17,600 11,400 النقل والتخزين 3,100 2,600 2,200 1,800 1,100 1,700 المعلومات واالتصاالت 155,500 147,000 139,900 135,900 130,000 117,400 *األخرىوالفروع الخدمات

PCBS: 2015داء االقتصاد الفلسطيني، أ
23
2015، التوزيع النسبي لعدد العاملين حسب النشاط االقتصادي والمنطقة
56.3
18.4
7.0 6.6 6.3 4.3 1.1
35.4
20.7 17.0
9.6 4.9
11.5
0.9 0
10
20
30
40
50
60
سبةالن
النشاط االقتصادي
الضفة الغربية قطاع غزة

PCBS: 2015داء االقتصاد الفلسطيني، أ
24
3Fاألنشطة االقتصادية -3
4
حيــث يعتبــر االقتصــاد يتــوزع االقتصــاد الفلســطيني علــى مجموعــة مــن األنشــطة االقتصــادية التــي تمثــل هيكــل وبنيــة االقتصــاد، جمـاليالنـاتج المحلـي اإلبـه فـي الخـدمات والفـروع األخـرى المرتبطـة لنشـاطالفلسطيني اقتصاد خدماتي نظـرا للمسـاهمة البـارزة
).5انظر جدول ( .والعمالة
2015أبرز األنشطة االقتصادية وأهم خصائصها في فلسطين، : 5جدول
النشاط االقتصادينسبة المساهمة في
جماليالناتج المحلي اإل(%)
نصيب العامل من متوسط القيمة المضافة
*)عامل/بالدوالر(
نسبة المساهمة في (%)العمالة
معدل األجر اليومي )شيكل( االسمي
معدل األجر اليومي **)شيكل( الحقيقي
46.2 51.3 8.7 3,467.2 3.3 الزراعة 66.1 73.4 13.7 8,905.1 13.4 الصناعة 77.5 86.0 9.1 8,329.0 8.3 اإلنشاءات 50.0 55.5 20.0 8,100.8 17.7 تجارة الجملة والتجزئة 39.3 43.6 5.4 3,275.9 1.9 النقل والتخزين 108.2 120.1 1.0 53,564.7 5.9 المعلومات واالتصاالت 86.4 95.9 42.1 10,713.3 49.5 األخرىوالفروع الخدمات
.عدد العاملين/القيمة المضافة= العامل من القيمة المضافةنصيب * .لمالحظة القوة الشرائية للعامل باألسعار الثابتة) 2010سنة االساس (تم ربط معدل األجر اليومي االسمي بالرقم القياسي ألسعار المستهلك **
حيـث ،والعمالـةسـطيني مـن حيـث القيمـة المضـافة خرى المرتبة األولى في االقتصـاد الفلالخدمات والفروع األ أنشطة تاحتلبلغــت القيمــة .2015عــام % 42.1وفــي العمالــة % 49.5 جمــاليفــي النــاتج المحلــي اإل األنشــطة ة هــذهبلغــت مســاهم
عــام المقارنــة مــع %5.1بارتفــاع ،2015عــام أمريكــي مليــون دوالر 3,822.5خــرى الخــدمات والفــروع األ ألنشــطةالمضــافة هونظـرا لزيـادة القيمـة المضـافة لهـذ . خالل نفـس الفتـرة% 5.5زيادة ، بعامل ألف 356.8 عدد العاملين فيه بلغ، كما 2014
الخـدمات أنشـطة متوسط نصيب العامل من القيمة المضافة فـي انخفضفقد ،امن زيادة عدد العاملين فيه أقلبنسبة األنشطةدوالر امريكــي 10,759.5، مقارنــة مــع 2015أمريكــي عــام دوالر 10,713.3 إلــىليصــل %0.4 بنســبة خــرىاألوالفــروع
95.9 إلـىليصـل األنشـطة ههـذلمسـتخدمين بـأجر فـي للعـاملين امعـدل األجـر اليـومي االسـمي ارتفـع بالمقابل، .2014عام .المعلومات واالتصاالت نشاطبعد نشطة االقتصاديةبين األ األعلىوهو ، شيكل
.2015عـــام الخـــالل % 13.7فـــي العمالـــة و ،%13.4 جمـــاليالنـــاتج المحلــي اإل الصـــناعة فـــي أنشـــطةبلغــت مســـاهمة % 6.6 بتراجـع نســبته، أمريكــي مليـون دوالر 1,032.1 لتصـل إلــى 2015عـام الصــناعة ألنشـطةالقيمـة المضــافة انخفضـت
115.9 إلـى ليصـل، 2014مقارنـة مـع عـام ،%7.5بنسـبة األنشـطة هـذهارتفـع عـدد العـاملين فـي بينمـا ،2014عام ال عنعــام % 13.2 بنســبةالصــناعة أنشــطةنصــيب العامــل مــن القيمــة المضــافة فــي متوســط انخفــض ،ونتيجــة لــذلك .عامــلألــف
معـدل ارتفـع بالمقابـل، . 2014دوالر عـام 10,254.2، مقارنـة مـع لكـل عامـل أمريكـي دوالر 8,905.1ليصل إلـى 2015 .2015عام شيكل 73.4 إلى األنشطة هذهاألجر اليومي االسمي للعاملين المستخدمين بأجر في
، كما ان بيانات العاملين ومعدل االجر ال تشمل 1967ذلك الجزء من محافظة القدس الذي ضمته اسرائيل عنوة بعيد احتاللها للضفة الغربية عام ال تشملالبيانات 4
.ايضا العاملين باسرائيل والمستوطنات والخارج

PCBS: 2015داء االقتصاد الفلسطيني، أ
25
في العمالة امساهمتهتراجعت و ، %3.3 لتصل إلى جماليفي الناتج المحلي اإل امساهمته تراجعتالزراعة، فقد أنشطةأما بتراجـع ، 2015عـام أمريكـي مليـون دوالر 253.8الزراعـة ألنشـطةبلغـت القيمـة المضـافة .2015عام % 8.7 لتصل إلى
ليصل عدد 2014مقارنة مع العام % 14.3في عدد العاملين بنسبة انخفاضرافق ذلك و ،2014عن العام % 11.4 نسبتهانخفـاض بنسـبة أقـل مـن األنشـطة هونظـرا النخفـاض القيمـة المضـافة لهـذ .ألف عامـل 73.2 إلى األنشطة هالعاملين في هذ
% 3.4بنسبة الزراعة أنشطةفي 2015خالل عام نصيب العامل من القيمة المضافةمتوسط فقد ارتفع ،اعدد العاملين فيهنشـطة األقـل بـين األ ولكنـه ظـل، 2014خـالل عـام دوالر أمريكـي 3,353.6مقارنـة مـع أمريكي دوالر 3,467.2 إلىليصل
معـدل األجـر ارتفـع ،مـن جهـة أخـرى .األنشـطة هـذه ما يعكس ضعف اإلنتاجية في ،)والتخزين النقل أنشطةبعد (االقتصادية ، وهــو أيضــا األقــل بــين األنشــطة شــيكل 51.3 إلــىليصــل الزراعــة أنشــطةبــأجر فــي اليــومي االســمي للعــاملين المســتخدمين
.النقل والتخزين أنشطةاالقتصادية، بعد
فـي النـاتج اعتبر من األنشطة الهامة فـي االقتصـاد الفلسـطيني، بلغـت مسـاهمتهتي تتجارة التجزئة والجملة، وال أنشطةأما تجــارة ألنشــطة بلغــت القيمــة المضــافة .2015عــام % 20.0فــي العمالــة اوبلغــت مســاهمته، %17.7 جمــاليالمحلــي اإل
وترافــق ذلـــك مـــع . 2014العـــام عـــن % 3.5 نســبته بارتفـــاع، 2015عـــام أمريكــي مليـــون دوالر 1,366.6التجزئــة والجملـــة ونظـراً .2015عـام ألـف عامـل 168.7 إلـى األنشـطة هذهـ عـدد العـاملين فـيليصـل % 9.3ارتفاع في عدد العاملين بنسـبة
، انخفــض متوســط نصــيب العامــل مــن القيمــة ابنســبة أقــل مــن زيــادة عــدد العــاملين فيهــ األنشــطة هــذهلزيــادة القيمــة المضــافة لمقارنـــة مـــع 2015أمريكـــي عـــام دوالر 8,100.8 إلـــىليصـــل %5.3بنســـبة تجـــارة التجزئـــة والجملـــة أنشـــطة المضـــافة فـــي
ههـــذمعـــدل األجـــر اليـــومي االســـمي للعـــاملين المســـتخدمين بـــأجر فـــي انخفـــضكمـــا . 2014دوالر أمريكـــي عـــام 8,554.1 .شيكل 55.5 ليصل إلى 2015عام األنشطة
فـي العمالـة امسـاهمتهو ، %8.3 إلـى جمـاليفي الناتج المحلـي اإل امساهمته ارتفعت، فقد اإلنشاءات ألنشطةأما بالنسبة أعلــى ، وهــي 2015عــام أمريكــي مليــون دوالر 643.0 األنشــطة هفــي هــذ بلغــت القيمــة المضــافة .2015عــام %9.1 إلــى
مقارنـة مـع % 7.4بنسـبة ه االنشـطةهـذفـي في عدد العـاملين تفاعر ارافق ذلك ، و %17.5بنسبة 2014عام مما كانت عليهنصـيب العامـل متوسـط ارتفـع ونتيجة لـذلك. 2015عامل خالل عام ألف 77.2 إلى اعدد العاملين فيهليصل 2014العام
دوالر 7,612.0مقارنــة مــع أمريكــي دوالر 8,329.0لــى إليصــل % 9.4بنســبة اإلنشــاءات أنشــطةفــي مــن القيمــة المضــافةشـكل تو . شـيكل 86.0 إلـى ه االنشـطةهـذمعـدل األجـر اليـومي االسـمي للعامـل فـي انخفـض بالمقابـل، . 2014أمريكي عـام
مثـل ت ي، وهـجماليأساسيًا في التكوين الرأسمالي الثابت الذي يدخل ضمن احتساب الناتج المحلي اإل مكوناً اإلنشاءات أنشطة . بالتالي بعدًا أساسيا في دراسة بنية وتطور االقتصاد الفلسطيني
ارتفعــت، 2015وخــالل العــام . فــي فلســطين اإلنشــاءات أنشــطةتعتبــر رخــص األبنيــة مــن المؤشــرات الهامــة التــي تعكــس أظهرت السجالت اإلداريـة الصـادرة عـن و .رخصة 9,214.0إلىلتصل ،2014مقارنة مع ،%1.5رخص األبنية بنسبة
، فهنــاك الالحــقوكمــا يتضــح فــي الشــكل . مــن الــرخص الصــادرة هــي رخــص ألبنيــة جديــدة %70.3وزارة الحكــم المحلــي أن باســتثناء انخفاضــها بشــكل طفيــف 2015 -2010 فــي عــدد رخــص األبنيــة الصــادرة فــي فلســطين خــالل الفتــرةمضــطرة زيــادة
.2014خالل عام

PCBS: 2015داء االقتصاد الفلسطيني، أ
26
2015 -2010الصادرة في فلسطين، * عدد رخص األبنية
.البيانات ال تشمل رخص االسوار *
الـف طـن مقارنـة 1,902.3لتصـل إلـى % 24.2بنسـبة 2015كميـات اإلسـمنت المسـتوردة عـام زادت ،من ناحية اخرىنســبتها بسـيطة زيـادة سـجلت كميـات اإلســمنت المسـتوردة فـي الضـفة الغربيــة و .2014ألـف طــن خـالل عــام 1,531.1مـع تفاع الجـامح فـي كميـات ر ويعزى هذا اال .%847.1في قطاع غزة نسبته كبير ارتفاع مقارنة مع، 2015خالل عام % 2.3
انظــر . (االسـمنت ومــا يتطلبـه ذلــك مـن مــواد بنـاء، وخصوصــاً عمـارعمليـة إعــادة اإل إلــىاالسـمنت المســتوردة فـي قطــاع غـزة ).الشكل أدناه
2015 -2010، حسب المنطقةكميات اإلسمنت المستوردة
6,332
9,214
4000
5000
6000
7000
8000
9000
10000
2010 2011 2012 2013 2014 2015
عددال
السنة
1,340.1 1,526.2
4.3
376.1
0
200
400
600
800
1000
1200
1400
1600
1800
2010 2011 2012 2013 2014 2015
طنف
أل
السنة
قطاع غزة الضفة الغربية

PCBS: 2015داء االقتصاد الفلسطيني، أ
27
األسعار والقوة الشرائية -4
ليصـل % 1.43بنسـبة 2015خالل العـام في فلسطين) الرقم القياسي العام ألسعار المستهلك( غالء المعيشة رارتفع مؤشخصوصـا الفتـرة التـي سـبقت عـام ، السـابقةأقـل حـدة مـن السـنوات وتعتبـر هـذه النسـبة ).2010سنة األسـاس ( 110.99إلى
ومـن أبــرز المجموعــات السـلعية التــي ســاهمت فـي رفــع المؤشــر هـذا العــام مجموعــة المشــروبات ). انظـر الشــكل أدنــاه( 2013، متأثرة بارتفاع الجمارك على سـلعة التبـغ، يليهـا مجموعـة خـدمات التعلـيم بنسـبة %10.92الكحولية والتبغ التي ارتفعت بنسبة
، ومجموعــــة االثــــاث والمفروشــــات والســــلع المنزليــــة بنســــبة %4.75بنســــبة ، ومجموعــــة األقمشــــة والمالبــــس واالحذيــــة 4.98%مجموعــة المــواد الغذائيــة والمشــروبات المرطبــة ، ثــم %2.27ومجموعــة خــدمات المطــاعم والمقــاهي والفنــادق بنســبة ، 3.41%
بنســــبة ومجموعــــة االتصــــاالت% 5.64ســــكن ومســــتلزماته بنســــبة مبالمقابــــل، انخفضــــت أســــعار مجموعــــة ال%. 1.90بنســــبة .2015خالل العام % 2.10
2015 -2010، قياسي ألسعار المستهلك في فلسطينالرقم ال اتجاه
، حيث الذي سبقهمقارنة بالعام 2015تفاوت التغير في أسعار المستهلك على مستوى المناطق الفلسطينية خالل العام 4Fسجلت األسعار في الضفة الغربية
كما سجل مؤشر أسعار، %1.77وفي قطاع غزة بنسبة ، %1.29ارتفاعًا بنسبة 55Fالقدسالمستهلك في
وتشترك المناطق الثالث في ارتفاع اسعار بعض السلع ضمن بعض .%0.33 بنسبة طفيفاً ارتفاعاً 6اث المجموعات الرئيسية، وخصوصًا أسعار اللحوم واالرز والخضروات الطازجة والسجائر والمالبس الجاهزة واالحذية واالث
باالضافة إلى ارتفاع أسعار تلك السلع في هذه المجموعات، سجلت أسعار المستهلك في الضفة الغربية .والمفروشات، وأسعار مجموعة االثاث والمفروشات والسلع المنزلية %6.95في أسعار مجموعة خدمات التعليم بنسبة ملحوظا ارتفاعًا وأسعار مجموعة السلع والخدمات الترفيهية ، %4.24س واالحذية بنسبة ، وأسعار مجموعة األقمشة والمالب%4.37بنسبة
، واسعار مجموعة المشروبات %2.62وأسعار مجموعة المواد الغذائية والمشروبات المرطبة بنسبة ، %3.01والثقافية بنسبة يسية عن ارتفاع أسعار بينما نتج االرتفاع في أسعار المستهلك في القدس بصورة رئ%. 1.56الكحولية والتبغ بنسبة
.1967فظة القدس الذي ضمته اسرائيل عنوة بعيد احتاللها للضفة الغربية عام ذلك الجزء من محا ال تشملالبيانات 5 .1967الجزء من محافظة القدس الذي ضمته اسرائيل عنوة بعيد احتاللها للضفة الغربية عام تشمل ذلك 6
110.99
100
102
104
106
108
110
112
2010 2011 2012 2013 2014 2015
سيقيا
الرقم
ال
السنة

PCBS: 2015داء االقتصاد الفلسطيني، أ
28
، وأسعار %6.87، وأسعار مجموعة االثاث والمفروشات والسلع المنزلية بنسبة %7.69مجموعة الخدمات الطبية بنسبة ، %2.54وأسعار مجموعة خدمات المطاعم والمقاهي والفنادق بنسبة ، %6.04مجموعة المشروبات الكحولية والتبغ بنسبة
، وأسعار مجموعة األقمشة والمالبس واالحذية بنسبة %2.41وأسعار مجموعة المواد الغذائية والمشروبات المرطبة بنسبة ، %16.24األسعار نتيجة ارتفاع أسعار مجموعة المشروبات الكحولية والتبغ بنسبة مؤشر وفي قطاع غزة، ارتفع%. 2.25
، %4.87وأسعار مجموعة خدمات المطاعم والمقاهي والفنادق بنسبة ، %15.24صالت بنسبة اوأسعار مجموعة النقل والمو ، وأسعار %1.60، وأسعار مجموعة خدمات التعليم بنسبة %3.40ة وأسعار مجموعة األقمشة والمالبس واالحذية بنسب
بنسبة والثقافية السلع والخدمات الترفيهية، وأسعار مجموعة %1.33بنسبة االثاث والمفروشات والسلع المنزليةمجموعة %1.05 المواد الغذائية والمشروبات المرطبة، وأسعار مجموعة 1.28%
فكما يتضح .في فلسطين ويختلف الوزن النسبي للمجموعات الرئيسية التي يتشكل منها الرقم القياسي ألسعار المستهلكحيث ،ي في سلة المستهلك في فلسطينتشكل مجموعة المواد الغذائية والمشروبات المرطبة أعلى وزن نسب، 6من جدول
مجموعة السلع ثم ،%13.8بحوالي مجموعة النقل والمواصالت من سلة المستهلك، يليها % 35.0تستحوذ على حوالي حذية قمشة والمالبس واألومجموعة األ ،%8.9بحوالي مجموعة المسكن ومستلزماته و ،%11.5والخدمات المتنوعة بحوالي
ومجموعة خدمات المطاعم والمقاهي والفنادق نسبة السلع والخدمات الترفيهية والثقافية، بينما تحتل مجموعة ،%6.3بحوالي .مما يجعل تأثيرها على الرقم القياسي ألسعار المستهلك محدوداً متدنية من سلة المستهلك
:المنطقةو الرئيسية نفاقاإل مجموعات والوزن النسبي حسب 2015للعام تهلكألسعار المس ةالقياسي رقاممتوسط األ : 6جدول
100= 2010ساس سنة األ
مجموعات االنفاق الرئيسية
**القدس قطاع غزة *الضفة الغربية فلسطين
الرقم القياسي
الوزن ***النسبي
الرقم القياسي
الوزن ***النسبي
الرقم القياسي
الوزن ***النسبي
الرقم القياسي
الوزن ***النسبي
23.67 112.21 41.18 104.42 34.96 109.62 35.02 107.82 المواد الغذائية والمشروبات المرطبة
4.06 165.40 2.32 139.36 5.22 160.35 4.31 159.59 المشروبات الكحولية والتبغ
6.91 123.41 7.09 87.13 5.79 119.74 6.29 109.29 األقمشة والمالبس واألحذية
9.28 115.75 8.73 98.85 8.83 112.55 8.87 108.28 ومستلزماتهالمسكن
5.42 120.64 6.55 93.03 4.83 111.46 5.36 105.37 األثاث والمفروشات والسلع المنزلية
3.32 122.41 3.08 98.02 4.44 121.77 3.93 116.67 الخدمات الطبية
18.37 112.00 7.93 110.38 15.33 101.15 13.83 102.22 النقل والمواصالت
4.69 99.80 3.17 94.07 3.46 95.48 3.55 95.74 االتصاالت
2.69 105.82 2.39 97.32 1.78 105.56 2.07 102.22 السلع والخدمات الترفيهية والثقافية
2.51 117.24 3.38 109.06 3.59 127.17 3.39 120.95 خدمات التعليم
2.70 110.83 1.65 106.27 1.86 130.34 1.92 121.91 خدمات المطاعم والمقاهي والفنادق
16.38 102.77 12.50 122.25 9.91 119.60 11.48 118.22 سلع وخدمات متنوعة
100.00 114.02 100.00 104.97 100.00 113.89 100.00 110.99 الرقم القياسي العام ألسعار المستهلك
.1967ذلك الجزء من محافظة القدس الذي ضمته إسرائيل عنوة بعيد احتاللها للضفة الغربية عام ال تشملالبيانات * .1967الجزء من محافظة القدس الذي ضمته اسرائيل عنوة بعيد احتاللها للضفة الغربية عام تشمل ذلك **
.2010لعام والمنطقة بناًء على بيانات مسح انفاق واستهالك االسرة الرئيسية مجموعات االنفاقحسب الوزان الترجيح السعار المستهلك الوزن النسبي***

PCBS: 2015داء االقتصاد الفلسطيني، أ
29
6ميزان المدفوعات -5 F
7
يعتبر ميزان المدفوعات سجًال منظمًا موجزًا تدون فيه جميع المعامالت االقتصادية التي تتم بين المقيمين في فلسطين وغير ويتكون ميزان المدفوعات من جزأين هما الحساب الجاري . سنة واحدة المقيمين خالل فترة زمنية معينة، تكون في العادة
والميزان التجاري ، الميزان التجاري السلعي(ويشمل الحساب الجاري أربع حسابات فرعية . والحساب الرأسمالي والماليبينما يشمل الحساب الرأسمالي والمالي حسابين هما الحساب الرأسمالي ،)التحويالت الجاريةميزان و ،الدخلوميزان ، الخدمي
االجنبي االستثمار( الحساب الماليو ) وحيازة األصول غير المالية غير المنتجة أو التخلص منها ،الرأسماليةالتحويالت ( .)طيةواألصول االحتيا ،األخرى االجنبية واالستثمارات الحافظة االجنبي، واستثمار، المباشر
مليون دوالر 5,178.7، ليصل إلى 2014مقارنة مع عام 2015عام % 2.8ارتفع العجز في الميزان التجاري بنسبة 150.5بمبلغ من السلع والخدمات الصادرات إجمالي ارتفاعويعزى هذا االرتفاع في عجز الميزان التجاري إلى .أمريكي
مليون دوالر 292.5الواردات بمبلغ إجمالي مقابل ارتفاعأمريكي مليون دوالر 2,322.7ليصل إلى مليون دوالر أمريكي مليون دوالر أمريكي 142.0، مما أدى إلى زيادة العجز التجاري بمبلغ أمريكي مليون دوالر 7,501.4ليصل إلى أمريكي
% 69.0لتصل إلى بشكل بسيط وبالرغم من ذلك، انخفضت نسبة العجز في الميزان التجاري إلى الواردات. 2015عام مقابل ارتفاع الواردات %6.9بنسبة ارتفاع الصادرات ويعزى ذلك إلى . 2014عام % 69.9مقارنة مع نسبة ،2015عام
تفاقمت قيمة العجز في الميزان التجاري بشكل ملحوظ خالل الفترةفقد وكما يتضح من الشكل أدناه، . فقط% 4.1بنسبة ولكن نسبة العجز إلى الواردات انخفضت من رد، مطّ بشكل الصادرات عن قيمة الواردات قيمة زيادة نتيجة 2010-2015الزيادة نسبة من السلع والخدمات بنسبة أكبر من الصادراتنظرا لزيادة قيمة 2015عام % 69.0إلى 2010عام % 74.0
خالل الفترة المذكورة، زادت قيمة % 69.9ففي حين زادت قيمة الصادرات بنسبة .الواردت خالل تلك الفترةفي قيمة ).أدناهشكل الانظر ( فقط %42.5الواردات بنسبة
2015 -2010الميزان التجاري للسلع والخدمات في فلسطين،
.1967ذلك الجزء من محافظة القدس الذي ضمته اسرائيل عنوة بعيد احتاللها للضفة الغربية عام ال تشملالبيانات 7
-6,000
-4,500
-3,000
-1,500
0
1,500
3,000
4,500
6,000
7,500
9,000
2010 2011 2012 2013 2014 2015
كيمري
ر اوال
ن ديو
مل
السنة
العجز الوارد الصادر
PCBS: 2015داء االقتصاد الفلسطيني، أ
30
بنسبة 2015انخفض عجز الحساب الجاري في فلسطين خالل عام بالرغم من زيادة العجز في الميزان التجاري، في عجز الحساب ويعزى هذا االنخفاض .أمريكي مليون دوالر 1,712.9، ليصل إلى 2014مقارنة مع عام % 20.3
).7انظر جدول ( .في صافي التحويالت الجارية الكبير إلى االرتفاعالجاري
2015 -2010، فلسطينفي ميزان المدفوعات: 7 جدول
أمريكي القيمة بالمليون دوالر
*2015 2014 2013 2012 2011 2010 البند
-1,712.9 -2,149.0 -2,383.4 -1,821.0 -2,069.6 -1,306.9 )صافي( الحساب الجاري: اوالً -4,986.4 -4,830.2 -4,682.7 -4,135.7 -3,779.2 -3,452.7 )صافي(السلع .1 -192.3 -206.5 -49.5 -293.2 -144.6 -444.3 )صافي(الخدمات .2 1,381.6 1,482.5 1,160.3 857.5 749.5 599.1 )صافي(الدخل .3
1,308.4 1,448.6 1,139.7 822.2 735.7 577.4 )صافي(تعويضات العاملين 73.2 33.9 20.6 35.3 13.8 21.7 )صافي(دخل االستثمار
2,084.2 1,405.2 1,188.5 1,750.4 1,104.7 1,991.0 )صافي(التحويالت الجارية .4 1,549.4 1,765.8 2,144.6 1,522.5 2,035.5 1,029.7 )صافي(الحساب الرأسمالي والمالي : ثانياً 415.8 691.0 551.3 588.2 640.0 828.2 )صافي(الحساب الرأسمالي .1
415.8 691.0 551.3 588.2 640.0 828.2 ) صافي(التحويالت الرأسمالية حيازة االصول غير المالية غير المنتجة او
)صافي(التخصل منها 0.0 0.0 0.0 0.0 0.0 0.0
1,133.6 1,074.8 1,593.3 934.3 1,395.5 201.5 )صافي(الحساب المالي .2 -65.0 -27.8 224.0 29.3 477.4 121.9 )صافي(االستثمار االجنبي المباشر 73.4 179.0- 186.8 -16.2 -121.1 -367.4 )صافي(استثمار الحافظة االجنبي 1,033.7 1,268.8 1,203.6 1,087.2 1,005.5 483.4 )صافي(االستثمارات االجنبية األخرى 91.5 12.8 -21.1 -166.0 33.7 -36.4 االحتياطية األصول في التغير 8.7 7.6 5.6 28.0 0.0 0.0 التمويل االستثنائي: ثالثاً ***154.8 383.2 238.8 298.5 34.1 277.2 **صافي السهو والخطأ: رابعاً
بيانات تقديرية ربعية* .2014-2010لألعوام سابه على انه الفرق بين قيمة صافي الحساب الجاري وصافي الحساب الرأسمالي والماليتحاتم : صافي السهو والخطأ** .لسابقة الحقاً اوسيتم تحديثها لألعوام 2015قيمة التمويل االستثنائي في صافي السهو والخطأ لعام تم احستاب* **
مليون دوالر 1,381.6صل إلى يل 2014عام مقارنة مع 2015خالل عام % 6.8صافي حساب الدخل بنسبة انخفضمقبوضات حساب الدخل، بينما يمثل دخل إجماليمن % 90.2تشكل تعويضات العاملين المقبوضة ما نسبته .أمريكي
مقارنة مع انخفاض % 115.9بنسبة 2015عام صافي دخل االستثماروبالرغم من ارتفاع .االستثمار النسبة الباقيةمليون دوالر أمريكي كانت 39.3 صافي دخل االستثمار قيمة االرتفاع فيإال أن ، %9.7 بنسبةصافي تعويضات العاملين
ما نجم عنه انخفاض صافي حساب ، والر أمريكيمليون د 140.2صافي تعويضات العاملين في نخفاضاال قيمةأقل من تعويضات ، استمرتالالحقكما يتضح من الشكل و .%6.8، أي ما نسبته مليون دوالر أمريكي 100.9 بقيمةالدخل
بلغت حيث 2015عام الانخفضت خالل ، ثم2014حتى عام 2010العاملين المقبوضة من الخارج في االرتفاع منذ عام %. 126.4بنسبة 2010 مستوى تعويضات العاملين المقبوضة في العام وهي أعلى من، أمريكي مليون دوالر 1,309.2

PCBS: 2015داء االقتصاد الفلسطيني، أ
31
2015 -2010من الخارج في فلسطين، يناتجاه تعويضات العاملين ودخل االستثمار المقبوض
ويعزى .مليون دوالر أمريكي 2,084.2لتصل إلى %48.3 بنسبة 2015عام صافي التحويالت الجارية ة زادت قيممليون 2,630.8لتصل إلى % 30.7بنسبة 2015ع التحويالت الجارية المقبوضة من الخارج خالل عام اارتفذلك إلى
وهو ما يعكس اعتماد االقتصاد الفلسطيني الكبير ،2014عام أمريكي مليون دوالر 2,013.2، مقارنة مع أمريكي دوالر . على التحويالت الخارجية التي تتلقاها فلسطين لدعم الموازنة العامة والتحويالت الخارجية للقطاع الخاص
مليون دوالر 415.8إلى لتصل %39.8من جهة أخرى، انخفضت التحويالت الرأسمالية المقبوضة من الخارج بنسبة في التحويالت تذبذباً 2015-2010شهدت الفترة .2014مليون دوالر عام 691.0مقابل 2015عام خالل أمريكي
نتيجة التطورات السياسية التي شهدتها فلسطين خالل 2010م مستوى لها خالل العا أعلىالرأسمالية المقبوضة، حيث بلغت انظر الشكل ( .2015قيمة لها عام أدنىلتصل إلى ،2014، باستثناء العام تدريجيا بعد ذلك انخفضتتلك الفترة، ولكنها
).أدناه
2015 -2010، فلسطينالمقبوضة من الخارج في التحويالت الجارية والرأسمالية اتجاه
0
200
400
600
800
1,000
1,200
1,400
1,600
2010 2011 2012 2013 2014 2015
ي ريك
امالر
دون
يومل
السنة
دخل االستثمار المقبوض تعويضات العاملين المقبوضة
0
500
1,000
1,500
2,000
2,500
3,000
3,500
2010 2011 2012 2013 2014 2015
ي ريك
امالر
دون
يومل
السنة
التحويالت الرأسمالية المقبوضة التحويالت الجارية المقبوضة

PCBS: 2015داء االقتصاد الفلسطيني، أ
32
وضع االستثمار الدولي -6
والشركات األفراد(فلسطين في المقيمين استثمارات يسجل أرصدة محاسبي كشف بأنه الدولي االستثمار وضع فرّ يع للمقيمين خارج المملوكة االستثمارات وأرصدة جهة، من) األصول(مسمى تحت الخارجي العالم في المستثمرة) والحكومة .أخرى جهة من) الخصوم(مسمى تحت فلسطين والمستثمرة في) والحكومات والشركات األفراد(فلسطين
مليون دوالر 899.0ليصل إلى 2015خالل عام %35.1صافي وضع االستثمار الدولي في فلسطين بنسبة انخفضأرصدة األصول الفلسطينية المستثمرة انخفاضنتيجة ،2014مليون دوالر أمريكي عام 1,385.0أمريكي، مقارنة مع
أرصدة األصول إجمالي انخفض .2015عام الخالل المستثمرة في فلسطين أرصدة الخصوم األجنبية وارتفاعفي الخارج مليون دوالر 5,855.0 إلىصل ي، ل2014مقارنة بالعام % 4.6بنسبة 2015الخارجية الفلسطينية المستثمرة في نهاية عام
من قيمة هذه األصول، بينما شكلت استثمارات الحافظة في % 6.0شكل االستثمار األجنبي المباشر في الخارج . أمريكي، واألصول االحتياطية )منها% 99.4شكلت العملة والودائع ( %65.6واالستثمارات األخرى في الخارج ،%18.5الخارج
مقارنة 2015خالل عام % 4.2بنسبة ارتفعأرصدة الخصوم األجنبية على االقتصاد الفلسطيني فقد إجماليأما %. 9.9من هذه % 50.1 في فلسطين ر األجنبي المباشرشكل االستثما .مليون دوالر أمريكي 4,956.0بلغ يل ،2014بالعام
انظر ( %.33.3، واالستثمارات األخرى األجنبية في فلسطين %16.6واستثمارات الحافظة األجنبية في فلسطين الخصوم، ).8جدول
2015 -2010، في نهاية األعوام وضع االستثمار الدولي في فلسطين :8جدول
أمريكي القيمة بالمليون دوالر
2015 2014 2013 2012 2011 2010 البند
899.0 1,385.0 880.0 667.0 721.0 1,286.0 *)صافي(وضع االستثمار الدولي
5,855.0 6,139.0 5,828.0 5,262.0 5,233.0 5,423.0 مجموع األصول الخارجية
352.0 358.0 171.0 232.0 192.0 241.0 االستثمار األجنبي المباشر في الخارج
1,084.0 1,172.0 1,005.0 1,030.0 1,147.0 938.0 استثمارات الحافظة في الخارج
3,838.0 3,937.0 3,967.0 3,336.0 3,397.0 3,713.0 االستثمارات األخرى في الخارج
581.0 672.0 685.0 664.0 497.0 531.0 األصول االحتياطية
4,956.0 4,754.0 4,948.0 4,595.0 4,512.0 4,137.0 مجموع الخصوم األجنبية
2,486.0 2,487.0 2,459.0 2,336.0 2,328.0 2,175.0 االستثمار األجنبي المباشر في فلسطين
821.0 725.0 768.0 676.0 611.0 612.0 استثمارات الحافظة األجنبية في فلسطين
1,649.0 1,542.0 1,721.0 1,583.0 1,573.0 1,350.0 االستثمارات األخرى األجنبية في فلسطين
.تساوي مجموع األصول الخارجية مطروح منها مجموع الخصوم األجنبية): صافي(وضع االستثمار الدولي *

PCBS: 2015داء االقتصاد الفلسطيني، أ
33
الدين الخارجي -7بما في ذلك الدين الخارجي سجًال ألرصدة الدين المستحقة على قطاعات االقتصاد الفلسطيني لصالح غير المقيمين، يمثل
القروض من غير المقيمين وودائع غير المقيمين المودعة في القطاع المصرفي في فلسطين والسندات الفلسطينية المشتراة من قبل غير المقيمين ومعامالت الدين التي تتم بين الشركات غير المقيمة وتلك التابعة والمنتسبة في فلسطين وأية التزامات
.لسطيني غير التي ذكرتأخرى على االقتصاد الف
مليون دوالر 1,649.0ليصل إلى 2015خالل عام % 6.9بنسبة رصيد الدين الخارجي على فلسطين إجمالي ارتفع% 64.9 الدين الخارجي على الحكومة العامةوشكل .2014مليون دوالر أمريكي عام 1,542.0أمريكي، مقارنة مع
، بينما شكل الدين الخارجي على البنوك العاملة مليون دوالر أمريكي 1,070.0بواقع رصيد الدين الخارجي إجماليمن قيمة .مليون دوالر أمريكي 530.0بواقع % 32.1في فلسطين
2015 -2011 ،في نهاية األعوام فلسطين القطاعات االقتصادية في رصيد الدين الخارجي على إجمالي: 9جدول
القيمة بالمليون دوالر أمريكي
. 2015تمثل بيانات الربع الرابع *
*2015 2014 2013 2012 2011 القطاع االقتصادي
1,070.0 1,089.0 1,109.0 1,097.0 1,114.0 الحكومة العامة 0.0 0.0 0.0 0.0 0.0 السلطات النقدية
530.0 404.0 552.0 443.0 359.0 البنوك 49.0 49.0 60.0 43.0 100.0 القطاعات األخرى
0.0 0.0 4.0 18.0 24.0 )الشركات التابعة والمنتسبةاالقتراض ما بين (االستثمار المباشر 1,649.0 1,542.0 1,725.0 1,601.0 1,597.0 رصيد الدين الخارجي إجمالي

PCBS: 2015داء االقتصاد الفلسطيني، أ
34
7Fالمالية العامة -8
8 1,218.8 لتصـل إلـى % 8.2بنسـبة 2015خـالل عـام الجـاري فـي موازنـة الحكومـة الفلسـطينية انخفضت قيمـة العجـز
قيمــة العجــز إلــى فــي نخفــاضاالويعــزى .2014عــام أمريكــيمليــون دوالر 1,327.3مقارنــة مــع أمريكــيمليــون دوالر فـــي مســـتوى الـــدعم انخفـــاضرافـــق ذلـــك و .العامـــة يـــراداتاإلصـــافي إجمـــالياســـتقرار مـــع انخفـــاض قيمـــة النفقـــات الحكوميـــة
أمريكي مليون دوالر 708.8 قيمة الدعم الخارجي إجماليحيث بلغ ، %31.2بنسبة العامةموازنة الالخارجي لسد العجز في ).انظر الشكل أدناه( .2014عام أمريكي مليون دوالر 1,029.7، مقارنة مع 2015عام
2015 -2010، الموازنة العامة في فلسطين مكونات
الجاري ال يشمل النفقات التطويرية العجز*
نفـس مسـتواه عـام تقريبـا وهـو، أمريكـي مليـون دوالر 2,810.1 عنـد 2015خـالل عـام يـراداتاإلصـافي إجمـالي استقرصافي إجمالي من% 32.4) والتحصيالت المخصصة الضريبية وغير الضريبية(المحلية يراداتاإل إجماليشكل . 2014
صـافي إجمـالي، زاد أعـالهوكمـا يتضـح مـن الشـكل .2015مليون دوالر امريكي عام 910.6 إلىلتصل قيمته ،يراداتاإل .سنوياً % 9.2، أي بحوالي %45.8بنسبة 2015-2010خالل الفترة يراداتاإل
، حيــث بلغــت2015عــام يــراداتاإل صــافي إجمــاليمــن % 21.5لوحــدها مــا نســبته المحليــة الضــريبية يــراداتاإلشــكلت نتيجة اإلصالحات الحكومية 2007باالرتفاع منذ العام المحلية الضريبية يراداتاإلت استمر .أمريكي مليون دوالر 605.2
مع خطة التنمية واإلصالح التي عكفت الحكومة علـى تنفيـذها، لتصـل أعلـى قيمـة لهـا عـام في مجال جباية الضرائب، تماشياً خـــالل تذبـــذبت يـــراداتاإل صـــافي إجمـــاليفـــي المحليـــة الضـــريبية يـــراداتاإلولكـــن مســـاهمة . )انظـــر الشـــكل الالحـــق( 2015
قبــل أن تــنخفض إلــى ،2013عــام % 25.8ثــم ارتفعــت لتصــل إلــى ،2009عــام % 18.9 حيــث بلغــت ،الســنوات الماضــيةالمحليـة الضـريبية يـراداتإلل النسـبة المتدنيـةهـذا التذبـذب، وكـذلك عكـس يو .2015عـام % 21.5، ثـم 2014عام % 21.4
لتغطيـة النفقـات غيـر مسـتقرة ضعف القاعدة الضريبية لفلسـطين واعتمادهـا علـى مصـادر أخـرى ،يراداتاإلصافي إجماليمن .العامة
.، البيانات حسب مبدا االلتزامالبيانات من خالل وزارة المالية ،)المجالس والبلديات(المالية العامة ال تشمل بيانات الحكومة المحلية 8
1,927.8
2,810.1 3,076.8
4,028.9
-1,149.0 -1,218.8 -2,000
-1,000
0
1,000
2,000
3,000
4,000
5,000
2010 2011 2012 2013 2014 2015
ي ريك
امالر
دون
يومل
السنة
*العجز اجمالي النفقات اجمالي صافي اإليرادات
PCBS: 2015داء االقتصاد الفلسطيني، أ
35
2015 -2010الضريبية المحلية في فلسطين، يراداتاإل
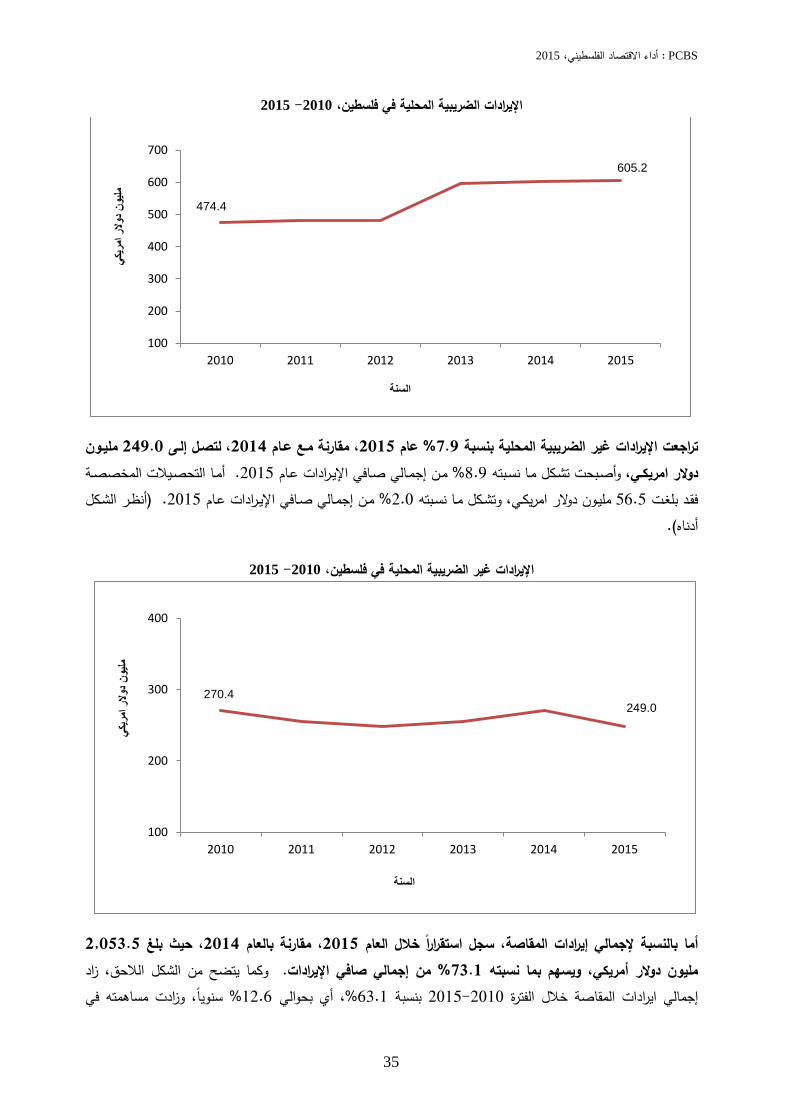
مليـون 249.0 إلـى، لتصـل 2014، مقارنة مـع عـام 2015عام % 7.9بنسبة غير الضريبية المحلية يراداتاإلتراجعت أمــا التحصــيالت المخصصــة. 2015عــام مــن إجمــالي صــافي اإليــرادات% 8.9مــا نســبته بحت تشــكل وأصــ دوالر امريكــي،
أنظــر الشــكل ( .2015عــام يــراداتصــافي اإل إجمــاليمــن % 2.0مــا نســبته تشــكل و ، مليــون دوالر امريكــي 56.5بلغــت قــد ف ).أدناه
2015 -2010ضريبية المحلية في فلسطين، الغير يراداتاإل
2,053.5 حيث بلغ، 2014مقارنة بالعام ،2015عام الخالل اً استقرار سجلالمقاصة، إيرادات جماليإل بالنسبة أمازاد ، الالحقشكل الوكما يتضح من .يراداتصافي اإل إجماليمن % 73.1بما نسبته سهميو ،مليون دوالر أمريكي
مساهمته في وزادت سنويًا، %12.6، أي بحوالي %63.1بنسبة 2015-2010خالل الفترة ايرادات المقاصة إجمالي
474.4
605.2
100
200
300
400
500
600
700
2010 2011 2012 2013 2014 2015
كيمري
ر اوال
ن ديو
مل
السنة
270.4 249.0
100
200
300
400
2010 2011 2012 2013 2014 2015
كيمري
ر اوال
ن ديو
مل
السنة

PCBS: 2015داء االقتصاد الفلسطيني، أ
36
الحكومة الفلسطينية ما يعكس مدى اعتماد موازنة خالل نفس الفترة، % 73.1إلى % 65.3من يراداتصافي اإل إجمالي . على إسرائيل بشكل خطير
2015 -2010، فلسطينفي المقاصة إيرادات إجمالي
، أمريكـي مليـون دوالر4,028.9 إلـىصل يل% 2.6بنسبة 2015خالل عام النفقات الحكومية إجمالي انخفضبالمقابل، نفـاق الحكـومي اإل حـوالي نصـف الرواتـب واالجـور وتشكل .2014خالل عام أمريكي مليون دوالر 4,137.5مقارنة مع
% 47.5، أي مـا نسـبته 2015خـالل عـام امريكي مليون دوالر 1,912.5حيث بلغت فاتورة الرواتب واالجور في فلسطين،اإلنفـــاق الحكـــومي عـــام إجمـــاليمـــن % 7.5إلـــى صـــافي اإلقـــراض نســـبة تارتفعـــ بالمقابـــل، .النفقـــات الحكوميـــة إجمـــاليمـــن
).الشكلين أدناهانظر ( . 2014عام % 6.9، مقارنة مع 2015
1,259.2
2,053.5
300
600
900
1,200
1,500
1,800
2,100
2010 2011 2012 2013 2014 2015
كيمري
ر اوال
ن ديو
مل
السنة
النفقات وصافي اإلقراض في جماليالتوزيع النسبي إل 2014فلسطين،
النفقات وصافي اإلقراض في جماليالتوزيع النسبي إل 2015 فلسطين،
رواتب واجور49.7%
غير اجور43.4%
صافي االقراض
6.9%
رواتب واجور47.5%
غير اجور45.0%
صافي االقراض
7.5%

PCBS: 2015داء االقتصاد الفلسطيني، أ
37
القطاع المصرفي -9
2015-2010في فلسطين، برز مؤشرات القطاع المصرفيأ: 10 جدول
القيمة بالمليون دوالر أمريكي
لتصل إلى ، 2014مقارنة مع العام % 8.1 ةنسبب 2015خالل العام لدى القطاع المصرفي الودائع إجماليقيمة ارتفعت
مريكي أي ما نسبته أمليون دوالر 6,475.7المقيمين لالشخاصقيمة الودائع بلغت .مريكيأمليون دوالر 9,654.6مليون دوالر 487.6الفلسطينية الحكومة المركزيةبلغت ودائع بينما ، 2015قيمة الودائع عام إجماليمن % 67.1
.الودائع تلك قيمة إجماليمن % 5.1أي ما نسبته ،مريكيأ ، مريكيأمليون دوالر 5,824.7 ما قيمته 2015عام التي منحها القطاع المصرفي التسهيالت االئتمانية إجمالي بلغ
1,456.0بلغت التسهيالت االئتمانية المقدمة للقطاع العام .2014مقارنة مع العام % 19.0ارتفاعًا نسبته مسجالً ممنوحة من القطاع المصرفي عام ال ةاالئتماني سهيالتتقيمة ال إجماليمن % 25.0أي ما نسبته ،أمريكي مليون دوالر
بلغت قيمة التسهيالت كما%. 17.4أي بارتفاع نسبته ،2014عام أمريكي مليون دوالر 1,239.8مقارنة مع 2015 سهيالتتقيمة ال إجماليمن % 18.7أي ما نسبته دوالر أمريكي، مليون 1,088.4تمويل القروض االستهالكية لالمقدمة
أي ما نسبته ،أمريكي دوالر مليون 200.7تمويل السيارات والمركبات ل بلغت قيمة التسهيالت المقدمة االئتمانية، بينما .االئتمانية سهيالتتالقيمة إجماليمن % 3.4
، %6.78 إلىليصل 2015خالل عام % 5.8نسبته ارتفاعاً ميركي األسعر الفائدة على القروض بالدوالر سجل متوسط
%. 0.94 إلىليصل ميركيبالدوالر األ بينما ارتفع متوسط سعر الفائدة على الودائع
2015 2014 2013 2012 2011 2010 المؤشر
5,824.7 4,895.1 4,480.1 4,199.3 3,550.7 2,885.9 التسهيالت االئتمانية إجمالي 9,654.6 8,934.5 8,303.7 7,484.1 6,972.7 6,802.4 الودائع إجمالي 1,088.4 921.7 885.6 783.0 415.2 144.3 القروض االستهالكية إجمالي
6.78 6.41 7.51 6.97 6.79 6.33 (%)متوسط سعر الفائدة على القروض بالدوالر
PCBS: 2015داء االقتصاد الفلسطيني، أ
38
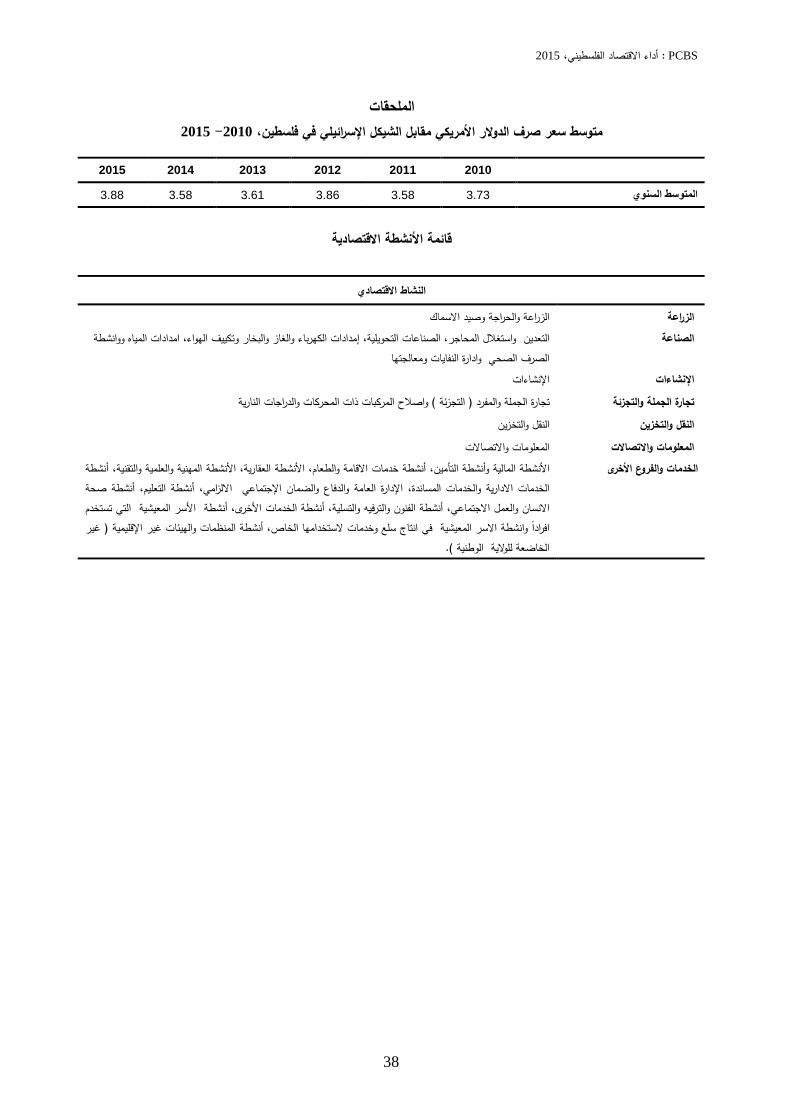
الملحقات 2015 -2010، فلسطينفي مقابل الشيكل اإلسرائيلي األمريكيمتوسط سعر صرف الدوالر
2010 2011 2012 2013 2014 2015
3.88 3.58 3.61 3.86 3.58 3.73 المتوسط السنوي
قائمة األنشطة االقتصادية
النشاط االقتصادي
الزراعة والحراجة وصيد االسماك الزراعة
امدادات المياه ووانشطة ، إمدادات الكهرباء والغاز والبخار وتكييف الهواء، الصناعات التحويلية، التعدين واستغالل المحاجر الصناعة الصرف الصحي وادارة النفايات ومعالجتها
اإلنشاءات اإلنشاءات
المركبات ذات المحركات والدراجات النارية واصالح) التجزئة ( تجارة الجملة والمفرد تجارة الجملة والتجزئة
النقل والتخزين النقل والتخزين
المعلومات واالتصاالت المعلومات واالتصاالت
أنشطة ، األنشطة المهنية والعلمية والتقنية، األنشطة العقارية، نشطة خدمات االقامة والطعام، أنشطة المالية وأنشطة التأميناأل األخرىوالفروع الخدماتنشطة صحة ، أالتعليم، أنشطة اإلدارة العامة والدفاع والضمان اإلجتماعي االلزامي، الخدمات االدارية والخدمات المساندة
أنشطة األسر المعيشية التي تستخدم ، نشطة الخدمات األخرى، أالفنون والترفيه والتسلية، أنشطة االنسان والعمل االجتماعيغير ( نشطة المنظمات والهيئات غير اإلقليمية ، ألمعيشية في انتاج سلع وخدمات الستخدامها الخاصافرادًا وانشطة االسر ا
.)الخاضعة للوالية الوطنية

State of Palestine
Palestinian Central Bureau of Statistics
Performance of the Palestinian
Economy, 2015
May, 2016

PCBS: Performance of the Palestinian Economy, 2015
PAGE NUMBERS OF ENGLISH TEXT ARE PRINTED IN SQUARE BRACKETS.
TABLES ARE PRINTED IN ARABIC FORMAT (FROM RIGHT TO LEFT).
May, 2016.
All Rights Reserved
Citation:
Palestinian Central Bureau of Statistics, 2016. Performance of the Palestinian Economy,
2015. Ramallah – Palestine.
All correspondence should be directed to:
Palestinian Central Bureau of Statistics
P.O. Box 1647, Ramallah, Palestine.
Tel: (970/972) 2 298 2700
Fax: (970/972) 2 298 2710
Toll Free: 1800300300
E-Mail: [email protected]
Website: http://www.pcbs.gov.ps Reference ID: 2197
This document is prepared in accordance with the standard
procedures stated in the Code of Practice for Palestine Official
Statistics 2006

PCBS: Performance of the Palestinian Economy, 2015
Work Team
Report Preparation
Mohannad Hamayel
Ahmad Omar
Dissemination Standards
Hanan Janajreh
Preliminary Review
Mohamed Nasr, Ph.D Associate Professor- College of Business and Economics/
Birzeit University
Saleh Al Kafri, Ph.D
Final Review
Mohammad Qalalwa
Overall Supervision
Ola Awad President of PCBS

PCBS: Performance of the Palestinian Economy, 2015
PCBS: Performance of the Palestinian Economy, 2015
Preface
In line with the function of the PCBS to develop and update statistical reports, we are
pleased to release this report on the Performance of the Palestinian Economy for 2015.
The report highlights the main economic indicators for 2015 and compares them to the
situation in 2014.
The report provides an overview of the economic reality and the nature of the economy
using a number of economic indicators: GDP, labor market, prices, balance of payments,
international investment position, external debt position, public finance and banking
sector.
PCBS hopes that the findings of this report will provide a comprehensive picture of the
characteristics and performance of the Palestinian economy during 2015 and will provide
a resource to measure past performance. It also hopes it will also assist researchers and
decision makers in the analysis and planning of policies for the Palestinian economy in
the future.
May, 2016
Ola Awad
President of PCBS

PCBS: Performance of the Palestinian Economy, 2015
PCBS: Performance of the Palestinian Economy, 2015
Table of Contents
Subject Page
List of Tables
Summary of Performance of the Palestinian Economy
Economic Performance in 2015
1. Gross Domestic Product (GDP) 31
2. Labor Market 18
3. Economic Activities 24
4. Prices and Purchasing Power 27
5. Balance of Payments 29
6. International Investment Position (IIP) 32
7. External Debt 33
8. Public Finance 34
9. Banking Sector 37

PCBS: Performance of the Palestinian Economy, 2015
PCBS: Performance of the Palestinian Economy, 2015
List of Tables
Table Page
Table 1: Main economic indicators by region, 2010- 2015 at constant
prices: base year 2004 15
Table 2: Value added of economic activities by region, 2010 - 2015 at
constant prices: base year 2004 16
Table 3: Labor market indicators for individuals aged 15 years and
above by region, 2010- 2015 18
Table 4: Number of employed persons by economic activity and region,
2010- 2015 22
Table 5: Main economic activities by major characteristics in Palestine,
2015
24
Table 6: Average Consumer Price Index and relative weight by major
Groups of Expenditure and Region, 2015: base year 2010=100 28
Table 7: Balance of Payments in Palestine, 2010- 2015 30
Table 8: International Investment Position (IIP) in Palestine at the end of
the years, 2010- 2015 32
Table 9: Gross external debt position on the economic sector in Palestine
at the end of the years, 1133 - 2015 33
Table 10: Main indicators of banking sector in Palestine, 2010- 2015 37

PCBS: Performance of the Palestinian Economy, 2015

PCBS: Performance of the Palestinian Economy, 2015
Summary of Performance of the Palestinian Economy
Gross Domestic Product (GDP) in
Palestine grew by 3.5% during 2015.
As a result, GDP per capita grew by
0.5% to USD 1,745.9. The growth
rate in GDP varied between the West
Bank and Gaza Strip during the year
2015, the growth rate in GDP in Gaza
Strip was 6.8% compared to 2.5% in
the West Bank. As a result of this
variation in growth rates , Gaza Strip
contribution to GDP increased to reach
23.6%, and the GDP per capita in Gaza
Strip recorded a slight increase, but it
still a 44.3% of the GDP per capita in
the West Bank. The value added for
all economic activities increased
during the year 2015, with the
exception of agriculture and industry
activities; the construction activities
recorded highest increase in 2015 due
to reconstruction of Gaza Strip; the
services and other branches activities
still represented the largest
contribution to GDP in both the West
Bank and Gaza Strip.
The labor force increased in 5102 by
3.4%, to 1,592.3 thousand persons,
while participation rate in labor
force decreased slightly to 46.0%.
Nonetheless, the number of employed
persons rose by 5.1% only, thus
lowering the unemployment rate in
Palestine to 25.9% in 2015 compared
to 27.2% in 2014.
During 2015, the nominal average
daily wage in Palestine stabilized at
NIS 83.1, remaining at same levels as
in 2014, while real average daily
wage declined by 1.4% during the
same period. Furthermore, the
average value added per employed
person in Palestine fell by 1.6% in
2015 compared with 2014.
The number of employed persons
rose in most economic activities in
Palestine in 2015, with the exception
of agriculture activities. The
transportation and storage activities
recorded the highest increase in the
number of employed persons, followed
by wholesale and retail trade activities
and industry activities and construction
activities. In the West Bank, all of the
economic activities recorded an
increase in the number of employed
persons with the exception of
agriculture, construction and
information and communications
activities, while in Gaza Strip all of the
economic activities recorded an
increase, except for the agriculture
activities. However, the percent
contribution for the employed persons
in economic activities during 2015
remained similar to that of 2014.
Services and other branches
activities rank first place in the
Palestinian economy in terms of the
value added and labor, followed by
wholesale and retail trade activities,
then industry activities, while the value
added in the transportation and storage
activities and agriculture activities
contribution to GDP was low. As
regards the average value added per
employed person, the information and
communications activities took first
place, followed by services and other
branches activities, then industry
activities. The average nominal daily
PCBS: Performance of the Palestinian Economy, 2015
wage reached its highest value in the
information and communications
activities, followed by services and
other branches activities, while it was
the lowest in the transportation and
storage activities then agriculture
activities.
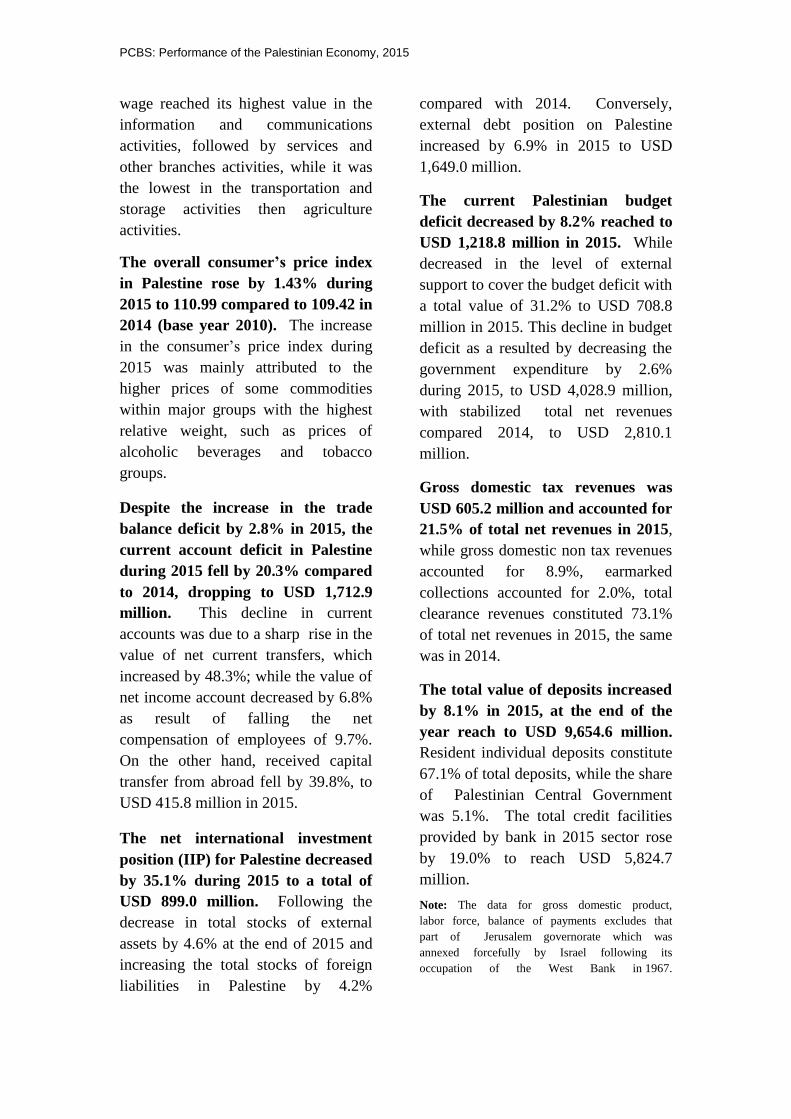
The overall consumer’s price index
in Palestine rose by 1.43% during
2015 to 110.99 compared to 109.42 in
2014 (base year 2010). The increase
in the consumer’s price index during
2015 was mainly attributed to the
higher prices of some commodities
within major groups with the highest
relative weight, such as prices of
alcoholic beverages and tobacco
groups.
Despite the increase in the trade
balance deficit by 2.8% in 2015, the
current account deficit in Palestine
during 2015 fell by 20.3% compared
to 2014, dropping to USD 1,712.9
million. This decline in current
accounts was due to a sharp rise in the
value of net current transfers, which
increased by 48.3%; while the value of
net income account decreased by 6.8%
as result of falling the net
compensation of employees of 9.7%.
On the other hand, received capital
transfer from abroad fell by 39.8%, to
USD 415.8 million in 2015.
The net international investment
position (IIP) for Palestine decreased
by 35.1% during 2015 to a total of
USD 899.0 million. Following the
decrease in total stocks of external
assets by 4.6% at the end of 2015 and
increasing the total stocks of foreign
liabilities in Palestine by 4.2%
compared with 2014. Conversely,
external debt position on Palestine
increased by 6.9% in 2015 to USD
1,649.0 million.
The current Palestinian budget
deficit decreased by 8.2% reached to
USD 1,218.8 million in 2015. While
decreased in the level of external
support to cover the budget deficit with
a total value of 31.2% to USD 708.8
million in 2015. This decline in budget
deficit as a resulted by decreasing the
government expenditure by 2.6%
during 2015, to USD 4,028.9 million,
with stabilized total net revenues
compared 2014, to USD 2,810.1
million.
Gross domestic tax revenues was
USD 605.2 million and accounted for
21.5% of total net revenues in 2015,
while gross domestic non tax revenues
accounted for 8.9%, earmarked
collections accounted for 2.0%, total
clearance revenues constituted 73.1%
of total net revenues in 2015, the same
was in 2014.
The total value of deposits increased
by 8.1% in 2015, at the end of the
year reach to USD 9,654.6 million.
Resident individual deposits constitute
67.1% of total deposits, while the share
of Palestinian Central Government
was 5.1%. The total credit facilities
provided by bank in 2015 sector rose
by 19.0% to reach USD 5,824.7
million.
Note: The data for gross domestic product,
labor force, balance of payments excludes that
part of Jerusalem governorate which was
annexed forcefully by Israel following its
occupation of the West Bank in 1967.

PCBS: Performance of the Palestinian Economy, 2015
[13]
Economic Performance in 2015
1 – Gross Domestic Product (GDP)1
The Gross Domestic Product (GDP) in Palestine grew by 3.5% during 2015, while it had
declined by 0.2% during 2014. The Palestinian economy exhibited a recovery during 2010-
2013, peaked in 2011 when growth rate reached 12.4%, then fell by 0.2% in 2014, before
increase during 2015 to 3.5%.
The growth rates in GDP varied between Gaza Strip and the West Bank during 2015,
where the growth rate in Gaza Strip reached 6.8% compared to 2.5% in the West Bank.
The growth in Gaza Strip was higher because of a number of factors, most importantly the
reconstruction efforts, and to reduced restrictions on the importation of raw materials and
construction materials, as well as the increased aid and assistance sent to the Strip. Despite
this remarkable growth in Gaza Strip during 2015, the GDP value has been less than it was
before the Israeli assault on Gaza Strip in July 2014, which culminated in significant
deterioration in the economic activity. As shown in Table 1, the strip witnessed steady
growth in the period 2011-2013, but dropped significantly in 2014, where GDP fell by 15.1%
following the Israeli aggression and siege on Gaza Strip before rising again by 6.8%. In the
West Bank, GDP growth rate dropped from 10.7% in 2011 to 6.0% in 2012, then to 1.0% in
2013, before rising again to 5.3% in 2014, and then re-dropped in 2015 to 2.5% . This is
mainly due to continued Israeli restrictions on the economic activity and the financial crisis
faced by the State of Palestine, especially with the dramatic decline in external support.
Due to this variation in growth rates, the contribution of Gaza Strip to GDP slightly rose
to 23.6% during 2015 compared to 22.9% in 2014. It is still significantly lower than it
was ten years ago, when it represented 37.4% in 2005. As shown in the following figure, the
GDP of Gaza Strip (at constant prices) reached USD 1,825.9 million in 2015, while the GDP
for Palestine stood at USD 7,721.7 million.
1 The data excludes that part of Jerusalem governorate which was annexed forecefully by Israel following its occupation of
the West Bank in 1967, and the data for GDP and its components for 2015 are preliminary based on quarterly estimates and
will be revised; there are some minor differences in the values of variables due to the convergence of standard treatment
processes on the computer.

PCBS: Performance of the Palestinian Economy, 2015
[14]
GDP by region, 2010- 2015 at constant prices: base year 2004
The GDP per capita in Palestine grew by 0.5% in 2015 compared to 2014, rising to USD
1,745.9. This slight growth resulted from minor increase in GDP more than population
growth. Still, the standards of living in Palestine during 2015 remained lower than during
1131, when it stood at USD 1,718.5. As a result of the verified GDP growth, the GDP per
capita in Gaza Strip has increased by 3.3%, while it has slightly decreased in the West Bank
by 0.2% during 2015. (See figure below).
GDP per capita by region, 2010- 2015 at constant prices: base year 2004
Although GDP per capita in Gaza Strip increased and that it decreased in the West Bank
during 2015, the gap remained unchanged. The GDP per capita in Gaza Strip totalled USD
1,002.8 in 2015 compared to USD 2,265.7 in the West Bank. This means that GDP per capita
in Gaza Strip represented 44.3% that in the West Bank in 2015, but it is higher than its level
6,122.3
7,721.7
4,609.0
5,895.8
1,513.3 1,825.9
0
2,000
4,000
6,000
8,000
2010 2011 2012 2013 2014 2015
USD
Mill
ion
Year
Palestine West Bank Gaza Strip
1,606.4 1,745.9
2,025.1 2,265.7
985.7 1,002.8
500
900
1,300
1,700
2,100
2,500
2010 2011 2012 2013 2014 2015
USD
Year
Palestine West Bank Gaza Strip

PCBS: Performance of the Palestinian Economy, 2015
[15]
in 2014, which was 42.8%. Nonetheless, it was lower than its ten years ago, when it was
90.7%.
Table 1: Main Economic Indicators by region, 2010- 2015 at constant prices: base year 2004
Value in USD million
Indicator 2010 2011 2012 2013 2014 2015
Palestine
Gross Domestic Product (GDP) 6,122.3 6,882.3 7,314.8 7,477.0 7,463.4 7,721.7 Final Consumption* 7,290.4 8,086.8 8,821.6 8,558.8 8,813.1 9,187.9 Gross Capital Formation 1,354.9 1,326.0 1,578.1 1,644.0 1,415.3 1,674.8 Net Exports of goods and services -2,523.0 -2,530.5 -3,084.9 -2,725.8 -2,765.0 -3,141.0 Number of Population (thousand person) 3,811.1 3,927.1 4,046.9 4,169.5 4,294.7 4,422.1 GDP per capita (USD) 1,606.4 1,752.5 1,807.5 1,793.3 1,737.4 1,745.9
West Bank
Gross Domestic Product (GDP) 4,609.0 5,101.2 5,409.0 5,464.3 5,754.3 5,895.8 Final Consumption* 5,425.8 5,754.1 6,253.2 6,167.1 6,328.4 6,707.2 Gross Capital Formation 1,142.8 1,193.1 1,443.6 1,543.1 1,624.9 1,714.0 Net Exports of goods and services -1,959.6 -1,846.0 -2,287.8 -2,245.9 -2,199.0 -2,525.4 Number of Population (thousand person) 2,276.0 2,338.4 2,402.6 2,468.1 2,534.6 2,602.2 GDP per capita (USD) 2,025.1 2,181.5 2,251.3 2,214.0 2,269.3 2,265.7
Gaza Strip
Gross Domestic Product (GDP) 1,513.3 1,781.1 1,905.8 2,012.7 1,709.1 1,825.9 Final Consumption* 1,864.6 2,332.7 2,568.4 2,391.7 2,484.7 2,480.7 Gross Capital Formation 212.1 132.9 134.5 100.9 -209.6 -39.2 Net Exports of goods and services -563.4 -684.5 -797.1 -479.9 -566.0 -615.6 Number of Population (thousand person) 1,535.1 1,588.7 1,644.3 1,701.4 1,760.0 1,820.0 GDP per capita (USD) 985.7 1,121.1 1,159.0 1,182.9 971.1 1,002.8
* Data include net errors and omissions.
The value added of all economic activities rose in Palestine during the year 2015, with
the exception of agriculture and industry. Construction activities recorded the highest
increase (17.5%), followed by transportation and storage activities (14.4%), and service and
other branches activities (5.1%), while for the information and communications activities it
was 4.2%, and wholesale and retail trade activities increased by 3.5%. In contrast, agriculture
activities fell by 11.4%, and industry activities fell by 6.6%. (See Table 2).

PCBS: Performance of the Palestinian Economy, 2015
[16]
Table 2: Value added of economic activities by region 2010 - 2015, at constant prices: base year 2004
Value in USD Millions Economic Activity 2010 2011 2012 2013 2014 2015
Palestine
Agriculture 332.9 408.7 339.1 309.9 286.4 253.8 Industry 956.6 963.3 1,091.6 1,158.5 1,105.4 1,032.1 Construction 533.0 728.5 715.1 758.7 547.3 643.0 Wholesale and retail trade 950.5 1,228.1 1,304.9 1,295.1 1,319.9 1,366.6 Transportation and storage 104.4 108.5 115.1 127.6 129.7 148.4 Information and communications 408.6 441.0 468.3 452.7 436.9 455.3 Services and other branches 2,836.3 3,004.2 3,280.7 3,374.5 3,637.8 3,822.5
West Bank
Agriculture 196.5 249.0 228.7 193.0 197.1 176.5 Industry 765.8 764.0 896.9 953.9 956.1 885.3 Construction 412.9 449.4 422.3 445.4 469.9 449.3 Wholesale and retail trade 755.6 1,014.4 1,051.4 1,019.0 1,052.7 1,075.3 Transportation and storage 92.6 95.3 93.2 104.5 106.9 118.7 Information and communications 404.0 435.4 459.6 443.9 428.1 445.9 Services and other branches 1,981.6 2,093.7 2,256.9 2,304.6 2,543.5 2,744.8
Gaza Strip
Agriculture 136.4 159.7 110.4 116.9 89.3 77.3 Industry 190.8 199.3 194.7 204.6 149.3 146.8 Construction 120.1 279.1 292.8 313.3 77.4 193.7 Wholesale and retail trade 194.9 213.7 253.5 276.1 267.2 291.3 Transportation and storage 11.8 13.2 21.9 23.1 22.8 29.7 Information and communications 4.6 5.6 8.7 8.8 8.8 9.4 Services and other branches 854.7 910.5 1,023.8 1,069.9 1,094.3 1,077.7
The growth rates varied in economic activities between the West Bank and Gaza Strip
during the year 2015, and were generally higher in Gaza Strip than in the West Bank.
Transportation and storage activities grew by 30.3% in Gaza Strip compared to 11.0% in the
West Bank, wholesale and retail trade activities grew by 9.0% in Gaza Strip, compared to
2.1% in the West Bank, while information and communications activities grew by 6.8% in
Gaza Strip compared to 4.2% in the West Bank. On the other hand, the construction activities
in Gaza Strip grew by 150.3% mainly due to reconstruction, while in the West Bank fell by
4.4%. In contrast, services and other branches activities in Gaza Strip declined by 1.5%,
while in the West Bank rose by 7.9%. The agriculture and industry activities, marked a
decline in both Gaza Strip and the West Bank, but at varying percentages, the agriculture
activities declined by 13.4% in Gaza Strip, compared to 10.5% in the West Bank, the industry
activities fell by 1.7% in Gaza Strip, compared to 7.4% in the West Bank.
The disparity in growth rates reflected on the contribution of economic activities in the
gross domestic product in Palestine in 2015. Indeed, the contribution of agriculture and
industry activities dropped, while contribution of construction, transportation and
storage, services and other branches activities increased, while no change was observed

PCBS: Performance of the Palestinian Economy, 2015
[17]
in wholesale and retail trade and information and communications activities. The
contribution of agriculture activities to the GDP has declined to reach 3.3% in 2015 compared
to 3.8% in 2014, while the contribution of the industry activities dropped to 13.4% compared
to 14.8% in 2014. The services and other branches activities increased their contribution to
GDP up to 49.5% compared to 48.8% during the year 2014. This increase is attributed to the
rapid growth in these activities during the year 2015 compared to other activities that showed
either slow growth or a decrease. In the outcome, services and other branches activities
represented about half of the GDP. This may be explained by the fact that the services and
other branches activities include a wide range of activities like financial and insurance
activities, accommodation and food service activities, real estate activities, professional,
scientific and technical activities, administrative and support service activities, education,
human health and social work activities. The construction activities, has increased its
contribution to GDP to 8.3% in 2015, compared to 7.3% in 2014.
The structure of the economic activities differed between the West Bank and Gaza Strip
during 2015, but the services and other branches activities remained the largest
contributor to GDP in both regions, its share stood at 59.1% of GDP in Gaza Strip while it
constituted 46.6% of GDP in the West Bank. The wholesale and retail trade activities ranked
second, contributing 18.2% of GDP in the West Bank versus 16.0% in Gaza Strip. In
contrast, the industry activities share stood at 15.0% in the West Bank versus 8.0% in Gaza
Strip, the construction activities and the information and communications activities accounted
for 7.6% for each in the West Bank, versus 10.6% and 0.5%, respectively, in Gaza Strip. The
agriculture activities, has contributed to a 3.0% in the West Bank versus 4.2% in Gaza Strip,
the transportation and storage activities was 2.0% in the West Bank versus 1.6% in Gaza
Strip. (See figure follow).
Percentage contribution of economic activities to GDP by region, 2015 at constant prices: base year 2004
59.1
16.0 10.6 8.0
4.2 1.6 0.5
46.6
18.2
7.6 15.0
3.0 2.0 7.6
0
10
20
30
40
50
60
70
Perc
enta
ge
Economic activity
Gaza Strip West Bank

PCBS: Performance of the Palestinian Economy, 2015
[18]
2–Labor Market2
Labor is the most important production factor in the Palestinian economy, especially in the
face of limited natural resources and Israeli control over land, water and mobility of people,
goods and capital. Table (3) shows the main labor market indicators in the period 2010-2015.
Table 3: Labor market indicators for individuals aged 15 years and above by region, 2010- 2015
Indicator 2010 2011 2012 2013 2014 2015 Palestine
Labor force (thousand person) 923.5 1,012.7 1,085.8 1,137.5 1,242.3 1,295.4 Employed persons (thousand person) 643.6 736.5 764.8 780.0 804.5 845.6 Participation rate (%) 41.3 43.4 44.4 44.5 46.7 46.0 Unemployment rate (%) 25.0 21.8 23.5 23.8 27.2 25.9 Nominal average daily wage (NIS) 75.4 76.0 78.7 80.2 83.2 83.1 Real average daily wage (NIS)* 75.4 73.9 74.4 74.6 76.0 74.9 Average value added per employed person** (USD/ employed person) 9,512.6 9,344.6 9,564.3 9,585.9 9,277.1 9,131.6
West Bank
Labor force (thousand person) 612.8 671.2 714.4 741.3 798.5 824.7 Employed persons (thousand person) 450.3 492.9 508.5 513.0 556.1 568.9 Participation rate (%) 44.3 46.4 46.9 46.5 48.0 46.4 Unemployment rate (%) 18.5 18.4 19.7 19.0 18.0 17.3 Nominal average daily wage (NIS) 82.6 82.7 85.7 88.4 90.7 94.0 Real average daily wage (NIS)* 82.6 79.9 79.5 79.6 80.7 82.5 Average value added per employed person** (USD/ employed person) 10,235.4 10,349.4 10,637.2 10,651.7 10,347.6 10,363.5
Gaza Strip
Labor force (thousand person) 310.7 341.5 371.4 396.2 443.8 470.7 Employed persons (thousand person) 193.3 243.6 256.3 267.0 248.4 276.7 Participation rate (%) 36.4 38.4 40.1 41.2 44.4 45.3 Unemployment rate (%) 37.8 28.7 31.0 32.6 43.9 41.0 Nominal average daily wage (NIS) 58.2 61.6 64.3 63.2 64.0 61.9 Real average daily wage (NIS)* 58.2 61.2 63.6 63.0 62.1 59.0 Average value added per employed person** (USD/ employed person) 7,828.8 7,311.6 7,435.8 7,538.2 6,880.4 6,598.8
* The nominal daily wage was linked to CPI to monitor the purchasing power of employees at constant prices (base year 2010).
** Average value added per employed person = value added / number of employed persons.
The size of labor force increased by 4.3% in 2015 compared to 2014, reaching 1,295.4
thousand employed person, however, the labor force participation rate has slightly
decreased, dropping from 46.7% in 2014 to 46.0% in 2015. This was due to the rise of the
number of persons entering the labor market in 2015 was less than the increase in the total
manpower. The labor force participation rate varied between the West Bank and Gaza Strip,
it was 46.4% in the West Bank in 2015, compared to 45.3% in Gaza Strip. This figure shows
2 The data excludes that part of Jerusalem governorate which was annexed forecefully by Israel following its occupation of
the West Bank in 1967, also the data for employees and wages doesn’t include the employees in Israel and settlements and
abroad.

PCBS: Performance of the Palestinian Economy, 2015
[19]
some improvement in Gaza Strip, since it stood at 44.4% in 2014. However, it decreasing in
the West Bank from its 48.0% level in 2014. This is due to the fact that the increasing rate in
size of the labor force in the West Bank during 2015 was lower than the increasing rate in the
total manpower. Conversely, the increasing rate in size of the labor force in Gaza Strip during
2015 was larger than the increasing rate in the total manpower.
The number of employed persons in 2015 rose by 5.1% compared to 2014, totalling
845.6 thousand in Palestine compared to 804.5 thousand in 2014. In Gaza Strip, the
number of employed persons increased by 11.4% versus to 2.3% in the West Bank in 2015.
Unemployment rate fell for work in Palestine to 25.9% in 2015 compared to 27.2% in
2014. Unemployment rate fell with more employed persons than the size of the labor force.
It dropped in the West Bank and Gaza Strip reached to 17.3%, 41.0%, respectively in 2015,
after that it was 18.0%, 43.9% in 2014.
Unemployment rate by region, 2010- 2015
During the year 2015, the nominal average daily wage stabilized in Palestine compared
to the year 2014, while real average daily wage fell by 1.4% in the same period, because
of the change in the prices. As shown in table (3), the nominal average daily wage was NIS
83.1 during the year 2015 while the real average daily wage was NIS 74.9 (See figure follow).
The nominal and real average daily wage in the West Bank was higher than in Gaza Strip.
Indeed, the nominal average daily wage in the West Bank stood at NIS 94.0 compared to NIS
61.9 in Gaza Strip. As for the real average daily wage, it was NIS 82.5 in the West Bank and
NIS 59.0 in Gaza Strip.
25.0 25.9
18.5 17.3
37.8 41.0
0.0
10.0
20.0
30.0
40.0
50.0
2010 2011 2012 2013 2014 2015
Une
mpl
oym
ent
rate
Year
Palestine West Bank Gaza Strip
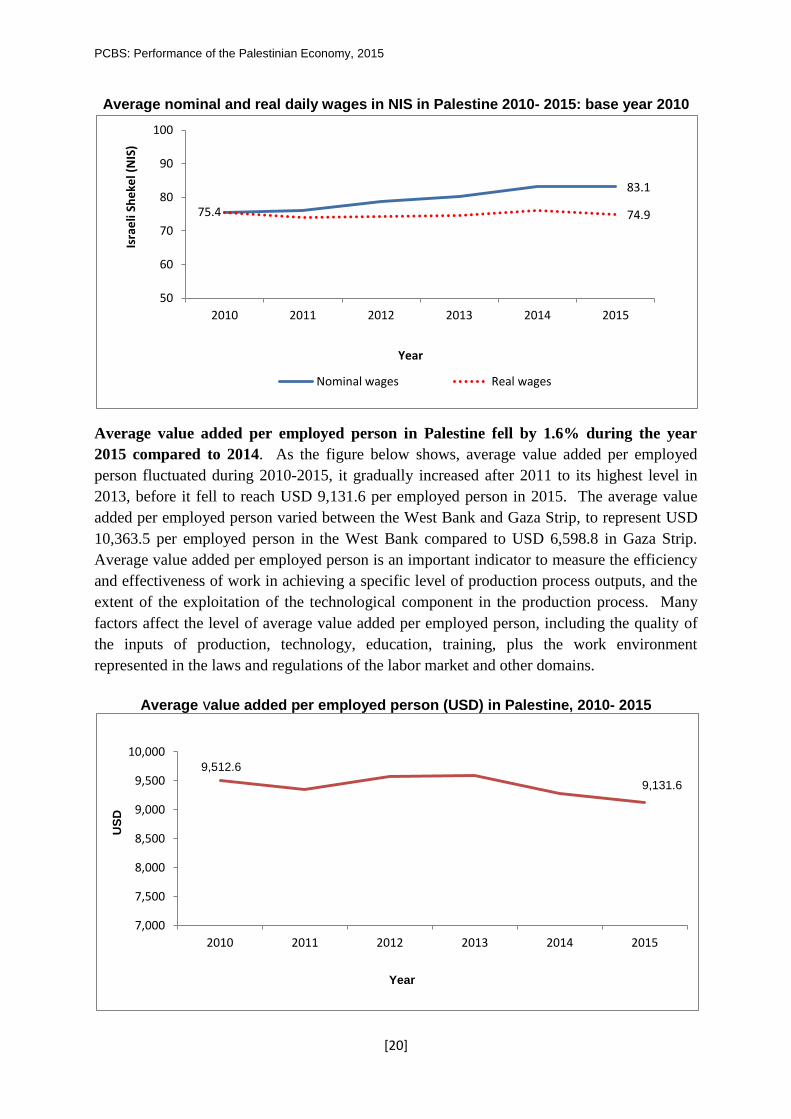
PCBS: Performance of the Palestinian Economy, 2015
[20]
Average nominal and real daily wages in NIS in Palestine 2010- 2015: base year 2010
Average value added per employed person in Palestine fell by 1.6% during the year
2015 compared to 2014. As the figure below shows, average value added per employed
person fluctuated during 2010-2015, it gradually increased after 2011 to its highest level in
2013, before it fell to reach USD 9,131.6 per employed person in 2015. The average value
added per employed person varied between the West Bank and Gaza Strip, to represent USD
10,363.5 per employed person in the West Bank compared to USD 6,598.8 in Gaza Strip.
Average value added per employed person is an important indicator to measure the efficiency
and effectiveness of work in achieving a specific level of production process outputs, and the
extent of the exploitation of the technological component in the production process. Many
factors affect the level of average value added per employed person, including the quality of
the inputs of production, technology, education, training, plus the work environment
represented in the laws and regulations of the labor market and other domains.
Average value added per employed person (USD) in Palestine, 2010- 2015
75.4
83.1
74.9
50
60
70
80
90
100
2010 2011 2012 2013 2014 2015
Isra
eli
She
kel (
NIS
)
Year
Nominal wages Real wages
9,512.6 9,131.6
7,000
7,500
8,000
8,500
9,000
9,500
10,000
2010 2011 2012 2013 2014 2015
USD
Year
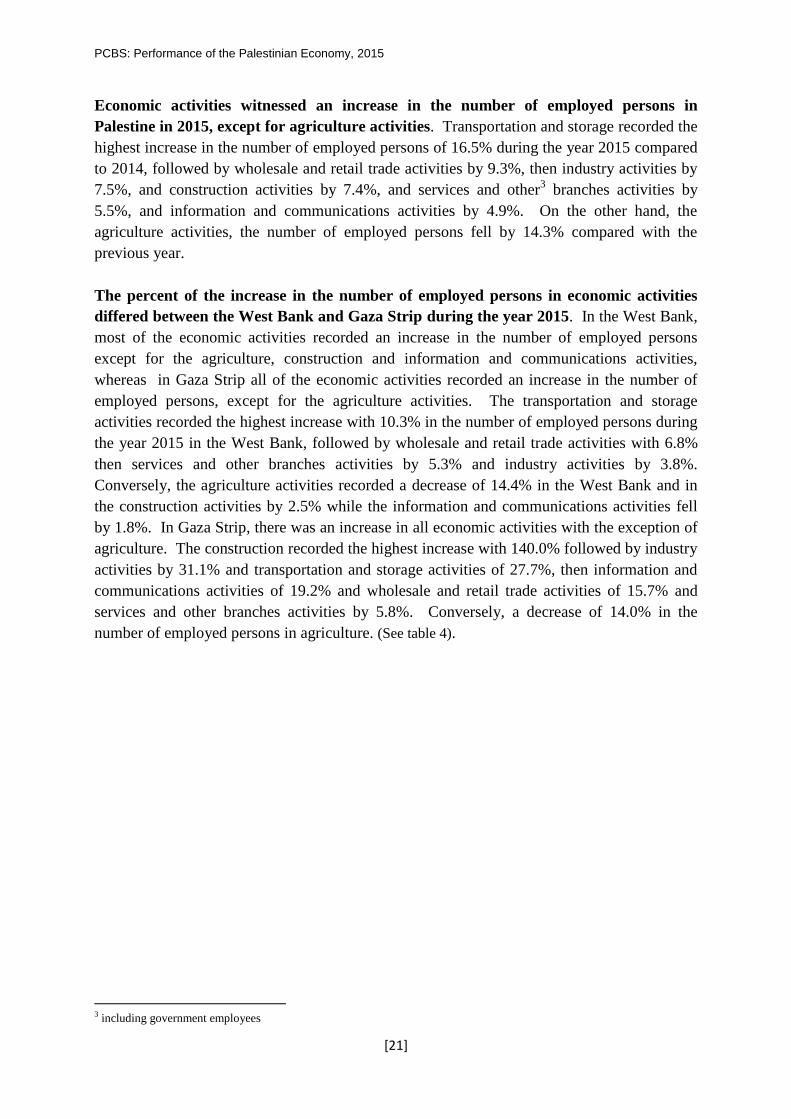
PCBS: Performance of the Palestinian Economy, 2015
[21]
Economic activities witnessed an increase in the number of employed persons in
Palestine in 2015, except for agriculture activities. Transportation and storage recorded the
highest increase in the number of employed persons of 16.5% during the year 2015 compared
to 2014, followed by wholesale and retail trade activities by 9.3%, then industry activities by
7.5%, and construction activities by 7.4%, and services and other3 branches activities by
5.5%, and information and communications activities by 4.9%. On the other hand, the
agriculture activities, the number of employed persons fell by 14.3% compared with the
previous year.
The percent of the increase in the number of employed persons in economic activities
differed between the West Bank and Gaza Strip during the year 2015. In the West Bank,
most of the economic activities recorded an increase in the number of employed persons
except for the agriculture, construction and information and communications activities,
whereas in Gaza Strip all of the economic activities recorded an increase in the number of
employed persons, except for the agriculture activities. The transportation and storage
activities recorded the highest increase with 10.3% in the number of employed persons during
the year 2015 in the West Bank, followed by wholesale and retail trade activities with 6.8%
then services and other branches activities by 5.3% and industry activities by 3.8%.
Conversely, the agriculture activities recorded a decrease of 14.4% in the West Bank and in
the construction activities by 2.5% while the information and communications activities fell
by 1.8%. In Gaza Strip, there was an increase in all economic activities with the exception of
agriculture. The construction recorded the highest increase with 140.0% followed by industry
activities by 31.1% and transportation and storage activities of 27.7%, then information and
communications activities of 19.2% and wholesale and retail trade activities of 15.7% and
services and other branches activities by 5.8%. Conversely, a decrease of 14.0% in the
number of employed persons in agriculture. (See table 4).
3 including government employees
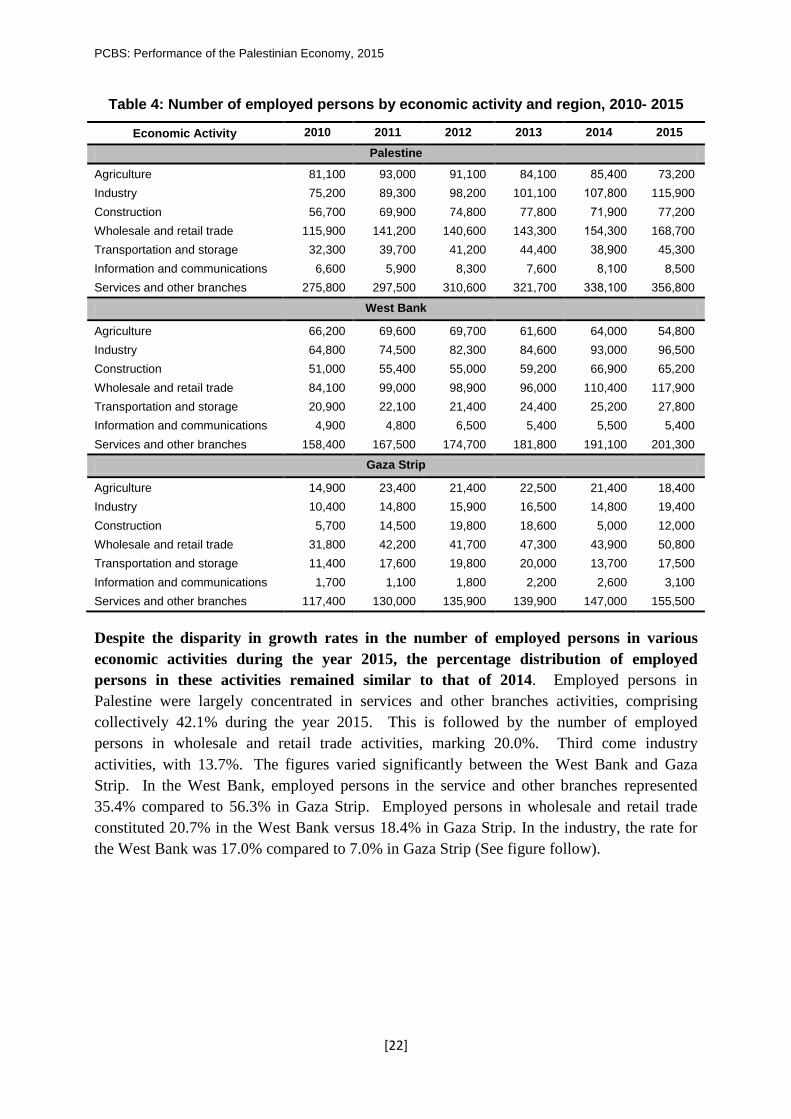
PCBS: Performance of the Palestinian Economy, 2015
[22]
Table 4: Number of employed persons by economic activity and region, 2010- 2015
Economic Activity 2010 2011 2012 2013 2014 2015 Palestine
Agriculture 81,100 93,000 91,100 84,100 004,88 73,200 Industry 75,200 89,300 98,200 101,100 1874088 115,900 Construction 56,700 69,900 74,800 77,800 714,88 77,200 Wholesale and retail trade 115,900 141,200 140,600 143,300 10,4488 168,700 Transportation and storage 32,300 39,700 41,200 44,400 404,88 45,300 Information and communications 6,600 5,900 8,300 7,600 04188 8,500 Services and other branches 275,800 297,500 310,600 321,700 4404188 356,800
West Bank
Agriculture 66,200 69,600 69,700 61,600 64,000 54,800 Industry 64,800 74,500 82,300 84,600 93,000 96,500 Construction 51,000 55,400 55,000 59,200 66,900 65,200 Wholesale and retail trade 84,100 99,000 98,900 96,000 110,400 117,900 Transportation and storage 20,900 22,100 21,400 24,400 25,200 27,800 Information and communications 4,900 4,800 6,500 5,400 5,500 5,400 Services and other branches 158,400 167,500 174,700 181,800 191,100 201,300
Gaza Strip
Agriculture 14,900 23,400 21,400 22,500 21,400 18,400 Industry 10,400 14,800 15,900 16,500 14,800 19,400 Construction 5,700 14,500 19,800 18,600 5,000 12,000 Wholesale and retail trade 31,800 42,200 41,700 47,300 43,900 50,800 Transportation and storage 11,400 17,600 19,800 20,000 13,700 17,500 Information and communications 1,700 1,100 1,800 2,200 2,600 3,100 Services and other branches 117,400 130,000 135,900 139,900 147,000 155,500
Despite the disparity in growth rates in the number of employed persons in various
economic activities during the year 2015, the percentage distribution of employed
persons in these activities remained similar to that of 2014. Employed persons in
Palestine were largely concentrated in services and other branches activities, comprising
collectively 42.1% during the year 2015. This is followed by the number of employed
persons in wholesale and retail trade activities, marking 20.0%. Third come industry
activities, with 13.7%. The figures varied significantly between the West Bank and Gaza
Strip. In the West Bank, employed persons in the service and other branches represented
35.4% compared to 56.3% in Gaza Strip. Employed persons in wholesale and retail trade
constituted 20.7% in the West Bank versus 18.4% in Gaza Strip. In the industry, the rate for
the West Bank was 17.0% compared to 7.0% in Gaza Strip (See figure follow).
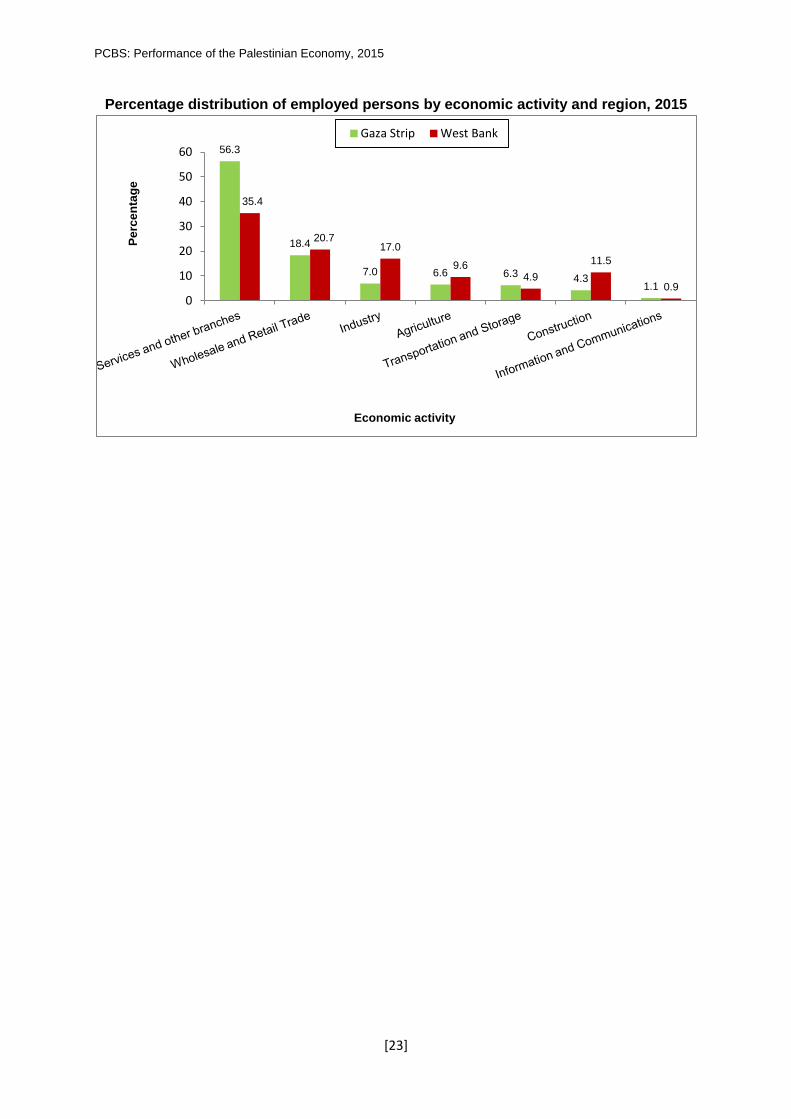
PCBS: Performance of the Palestinian Economy, 2015
[23]
Percentage distribution of employed persons by economic activity and region, 2015
56.3
18.4
7.0 6.6 6.3 4.3 1.1
35.4
20.7 17.0
9.6 4.9
11.5
0.9 0
10
20
30
40
50
60
Perc
enta
ge
Economic activity
Gaza Strip West Bank

PCBS: Performance of the Palestinian Economy, 2015
[24]
3 - Economic Activities4
The Palestinian economy encompasses several economic activities. It is predominantly
a service economy because of the services activities contribution to GDP and to employment
(See table 5).
Table 5: Main economic activities by major characteristics in Palestine, 2015
Activity Contribution to GDP (%)
Average value added per
employed person (Dollar/
employed person)*
Contribution to
employment (%)
Nominal average
daily wage (NIS)
Real average
daily wage
(NIS)**
Agriculture 3.3 3,467.2 8.7 51.3 46.2 Industry 13.4 8,905.1 13.7 73.4 66.1
Construction 8.3 8,329.0 9.1 86.0 77.5
Wholesale and retail trade 17.7 8,100.8 20.0 55.5 50.0
Transportation and storage 1.9 3,275.9 5.4 43.6 39.3
Information and communications
5.9 53,564.7 1.0 120.1 108.2
Services and other branches 49.5 10,713.3 42.1 95.9 86.4
* Value added per employed person = value added / number of employed persons. ** The nominal daily wage was linked to CPI to monitor the purchasing power of employees at constant prices (base year
2010).
Services and other branches activities ranked first in the Palestinian economy, value
added and employment, the percentage contribution to GDP was 49.5% and in
employment 42.1% in 2015. The value added for services and other branches activities was
USD 3,822.5 million in 2015, which represents an increase of 5.1% compared to 2014, and
the number of employed persons was 356.8 thousand employed person, with increased by
5.5% during the same period. Moreover, because the value added for these activities
increased less than the increasing of number of employed persons, then average value added
per employed person for services and other branches activities decreased by 0.4% dropping to
USD 10,713.3 in 2015, compared to USD 10,759.5 in 2014. Conversely, the nominal average
daily wage for waged employees in these activities increased to NIS 95.9, considered as the
highest of the main economic activities (after information and communications activities).
Industry activities contributed 13.4% to GDP in 2015, and employed 13.7% of
employment during the year 2015. The value added for industry activities in 2015 totaled
USD 1,032.1 million, a decline of 6.6% compared to 2014. While the number of employed
persons increased by 7.5% compared to 2014, rising to 115.9 thousand employed person. As
a result, the average value added per employed person in industry activities fell by 13.2% in
2015 to amounted USD 8,905.1 per employed person, compared to USD 10,254.2 in 2014.
4 The data excludes that part of Jerusalem governorate which was annexed forecefully by Israel following its occupation of
the West Bank in 1967, also the data for employees and wages doesn’t include the employees in Israel and settlements and
abroad.

PCBS: Performance of the Palestinian Economy, 2015
[25]
Conversely, the nominal average daily wage of waged employees in these activities increased
to NIS 73.4 in 2015
The Agriculture activities, contribution to GDP fell to 3.3%, and declined to constitute
8.7% of employment in 2015. The value added of the agriculture activities was USD 253.8
million in 2015, a fall of 11.4% compared to 2014, with decreasing in the number of
employed persons by 14.3% compared to 2014 with 73.2 thousand employed person. Since
the decline in the value added of these activities was lower than the decrease in the number of
employed persons, the average value added per employed person in agriculture activities grew
by 3.4% in 2015 to reach USD 3,467.2, compared to USD 3,353.6 in 2014. It is the lowest in
the main economic activities (after Transportation and storage activities). This situation
reflects the weak productivity in these activities. On the other hand, the nominal average
daily wage of waged employees in agriculture activities increased to NIS 51.3, which is the
lowest of the main economic activities.
Wholesale and retail trade is a vital activity in the Palestinian economy and contributed
17.7% to GDP, and 20.0% to employment in 2015. The value added of wholesale and
retail trade activities totalled USD 1,366.6 million in 2015, marking an increase of 3.5%
compared to 2014. With the increasing in the number of employed persons by 9.3%
compared to 2014 to reach 168.7 thousand employed person in 2015. As a result of the
increasing the value added for these activities less than the increasing in the number of
employed persons, the average value added per employed person in wholesale and retail trade
activities fell by 5.3% to USD 8,100.8 in 2015 compared to USD 8,554.1 in 2014. The
nominal average daily wage of waged employees in these activities declined in 2015 to NIS
55.5.
The construction activities, contribution to GDP increased in 2015 to 8.3%, and in
employment to 9.1%. The value added in these activities totalled USD 643.0 million in
2015, 17.5% more than compared to 2014, with increasing in the number of employed
persons in these activities by 7.4% compared to 2014 as it reached 77.2 thousand of employed
person in 2015. Consequently, the average value added per employed person in the
construction activities increased by 9.4% to USD 8,329.0 compared to USD 7,612.0 in 2014.
Conversely, the nominal average daily wage of waged employees in these activities decreased
to NIS 86.0. The construction activities are a key item of fixed capital formation, which
constitutes part of GDP and represents a basic element in the study of the structure and
evolution of the Palestinian economy.
Building licenses are indicators of the status of construction in Palestine. During 2015,
the number of building licenses grew by 1.5% compared to 2014, totalling 9,214.0
license. Administrative records from the Ministry of Local Government showed that 70.3%
of licenses issued for new buildings. As the figure follow shows, there was a sharp increase
in number of licenses issued during 2010-2015, but with the exception of a slight decrease
witnessed in 2014.

PCBS: Performance of the Palestinian Economy, 2015
[26]
Number of building licenses* issued in Palestine, 2010- 2015
* The data excludes boundary walls licenses.
On the other hand, the quantities of cement imported increased by 24.2% in 2015 to
1,902.3 thousand ton compared to 1,531.1 thousand ton in 2014. The quantities of cement
imported into the West Bank recorded a slight increase by 2.3% in 2015, whereas in Gaza
Strip, there was a sharp increase by 847.1%. This sharp increase in cement imported into
Gaza Strip resulted from the need of material for the reconstruction efforts, especially
cement.(See figure below).
Quantities of cement imported by region, 2010- 2015
6,332
9,214
4000
5000
6000
7000
8000
9000
10000
2010 2011 2012 2013 2014 2015
Num
ber
Year
1,340.1 1,526.2
4.3
376.1
0
200 400
600 800
1000
1200 1400 1600
1800
2010 2011 2012 2013 2014 2015
Thou
sand
ton
Year
West Bank Gaza Strip

PCBS: Performance of the Palestinian Economy, 2015
[27]
4-Prices and Purchasing Power
The cost of living (overall consumer’s price index - CPI) increased by 1.43% in Palestine
during 2015 to 110.99 (base year 2010). This increase is considered less severe than in
comparison with previous years especially 2013 (See figure below).
The increase resulted mainly from the rise in customs on alcoholic beverages and tobacco
groups by 10.92%, it was followed by education, which marched an increase of 4.98%. Third
came the textiles, clothing and footwear with an increase of 4.75%, followed by furniture,
household goods with an increase of 3.41%, restaurants and cafes marked an increase of
2.27%, followed by food and soft drinks, which increased by 1.90%. Conversely, housing
marked a decrease of 5.64% and the communications declined as well by 2.10 in 2015.
Trends in consumer’s price index (CPI) in Palestine, 2010- 2015
Changes in consumer’s prices varied by region in Palestine in 2015 compared to
previous year, prices increased by 1.29% in the West Bank5, and by 1.77% in Gaza
Strip, while the consumer’s price index in the Jerusalem6 recorded a slight increase by
0.33%. The three regions were all affected by the rise in prices of some goods within some
major groups, especially meat, rice, fresh vegetables, tobacco, readymade garments, footwear,
and furniture and carpets. In addition to the affect of the rise in prices of these goods,
consumer’s prices in the West Bank was mainly triggered by in the rise in the prices of
education by 6.95%, furniture, household goods by 4.37%, clothing and footwear by 4.24%,
recreational, cultural goods and services by 3.01%, and food and soft drinks by 2.62%,
alcoholic beverages and tobacco by 1.56%. However, in Jerusalem, the rise in the consumer’s
price index was mainly due to price rises in medical care by 7.69%, furniture, household
goods by 6.87%, alcoholic beverages and tobacco by 6.04%, restaurants and cafes by 2.54%,
food and soft drinks by 2.41%, and clothing and footwear by 2.25%. In Gaza Strip, prices
increased due to price rises in alcoholic beverages and tobacco by 16.24%, transportation by
5 The data excludes that part of Jerusalem governorate which was annexed forecefully by Israel following its occupation of
the West Bank in 1967. 6 Includes that part of Jerusalem which was annexed forcefully by Israel following its occupation of the West Bank in 1967.
110.99
100
102
104
106
108
110
112
2010 2011 2012 2013 2014 2015
Inde
x
Year

PCBS: Performance of the Palestinian Economy, 2015
[28]
15.24%, restaurants and cafes by 4.87%, clothing and footwear by 3.40%, education by
1.60%, furniture, household goods by 1.33%, recreational, cultural goods and services by
1.28%, and food and soft drinks by 1.05%.
The relative weight of groups that make up the consumer’s price index in Palestine can
vary. As Table (6) shows, the food and soft drinks group has a higher relative weight in the
consumer’s basket in Palestine since they constitute approximately 35.0% of total
consumption. They are followed by transportation with approximately with 13.8%,
miscellaneous goods and service with approximately 11.5%, housing with approximately
8.9%, and textiles, clothing and footwear with approximately 6.3%; recreational, cultural
goods and services, and restaurants and cafes occupy a low proportion of the consumer
basket.
Table 6: Average Consumer Price Index and relative weight by major Groups of Expenditure and Region, 2015: base year 2010=100
Palestine West Bank* Gaza Strip Jerusalem**
Main groups CPI
Relative Weight***
CPI
Relative Weight***
CPI
Relative Weight***
CPI
Relative Weight***
Food and soft drinks 107.82 40.83 109.62 4,.,3 104.42 ,1.10 112.21 34.37 Alcoholic beverages and tobacco 159.59 ,.41 160.35 0.33 139.36 3.43 165.40 ,.83
Textiles, clothing and footwear 109.29 3.3, 119.74 0.7, 87.13 7.8, 123.41 3.,1
Housing 108.28 0.07 112.55 0.04 98.85 0.74 115.75 ,.30 Furniture, household goods 105.37 0.43 111.46 ,.04 93.03 3.00 120.64 0.,3
Medical care 116.67 4.,4 121.77 ,.,, 98.02 4.80 122.41 4.43 Transportation 102.22 14.04 101.15 10.44 110.38 7.,4 112.00 10.47 Communications 95.74 4.00 95.48 4.,3 94.07 4.17 99.80 ,.3, Recreational, cultural goods & services 102.22 3.87 105.56 1.70 97.32 3.4, 105.82 3.3,
Education 120.95 4.4, 127.17 4.0, 109.06 4.40 117.24 3.01 Restaurants and cafes 121.91 1.,3 130.34 1.03 106.27 1.30 110.83 3.78 Miscellaneous goods and service 118.22 11.,0 119.60 ,.,1 122.25 13.08 102.77 13.40
Overall Consumer Price Index 110.99 011011 113.89 011011 104.97 011011 114.02 011011
* The data excludes that part of Jerusalem governorate which was annexed forecefully by Israel following its occupation of the
West Bank in 1967.
** Includes that part of Jerusalem which was annexed forcefully by Israel following its occupation of the West Bank in 1967.
*** Relative weight for consumer prices by major groups of expenditure and region based on the Expenditure and Consumption
Survey2010.

PCBS: Performance of the Palestinian Economy, 2015
[29]
5 - Balance of Payments7
The balance of payments is an organized summary record of all economic transactions
between residents in Palestine and non-residents during a set period time, usually one year.
The balance of payments consists of two accounts, the current account and the capital and
financial account. The current account includes four sub-accounts, which are (trade balance
of goods, trade balance of services, balance of income and balance of current transfers). The
capital and financial account consists tow accounts, the capital account (capital transfers and
acquisition or disposal of non-produced non-financial assets), and the financial account
(foreign direct investment, foreign portfolio investment, and foreign other investments and
reserve assets).
The trade balance deficit increased by 2.8% in 2015 compared to 2014, reach USD
5,178.7 million. This increase in the trade balance deficit resulted from the increase in the
total exports of goods and services by USD 150.5 million reached to USD 2,322.7 million.
On the other hand, there was an increase in the total imports by USD 292.5 million reached to
USD 7,501.4 million, which led to an increase in the trade deficit by USD 142.0 million in
2015. However, the ratio of deficit to imports slightly fell to 69.0% in 2015, compared to
69.9% in 2014. Due to an increase in exports by 6.9% compared to an increase in the imports
by 4.1% only. As shown in the figure below, the deficit in the trade balance value
significantly has worsened during the period 2010-2015 as a result of increasing the imports
value more than the value of exports steadily, but the ratio of deficit to imports decreased
from 74.0% in 2010 to 69.0% in 2015 due to the increase of exports of goods and services
value by a larger percentage compared to the increase in the percentage of the imports value
during that period. While the value of exports increased by 69.9% during the mentioned
period, the value of imports increased by only 42.5% (see figure follow).
Trade balance of goods and services in Palestine, 2010- 2015
7 The data excludes that part of Jerusalem governorate which was annexed forecefully by Israel following its occupation of
the West Bank in 1967.
-6,000.0
-4,500.0
-3,000.0
-1,500.0
0.0
1,500.0
3,000.0
4,500.0
6,000.0
7,500.0
9,000.0
2010 2011 2012 2013 2014 2015
USD
Mill
ion
Year
Exports Imports Deficit
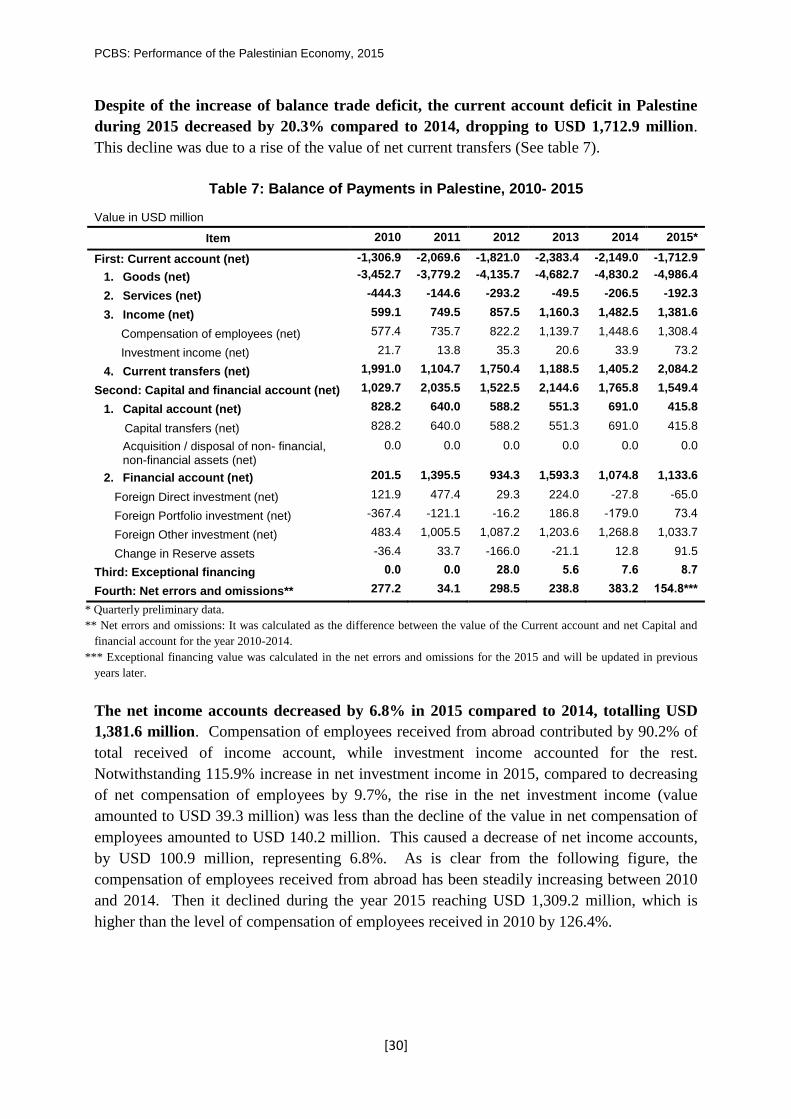
PCBS: Performance of the Palestinian Economy, 2015
[30]
Despite of the increase of balance trade deficit, the current account deficit in Palestine
during 2015 decreased by 20.3% compared to 2014, dropping to USD 1,712.9 million.
This decline was due to a rise of the value of net current transfers (See table 7).
Table 7: Balance of Payments in Palestine, 2010- 2015
Value in USD million
Item 2010 2011 2012 2013 2014 2015*
First: Current account (net) -1,306.9 -2,069.6 -1,821.0 -2,383.4 -2,149.0 -1,712.9 1. Goods (net) -3,452.7 -3,779.2 -4,135.7 -4,682.7 -4,830.2 -4,986.4
2. Services (net) -444.3 -144.6 -293.2 -49.5 -206.5 -192.3
3. Income (net) 599.1 749.5 857.5 1,160.3 1,482.5 1,381.6
Compensation of employees (net) 077., 735.7 822.2 1,139.7 1,448.6 1,308.4
Investment income (net) 21.7 13.8 35.3 20.6 33.9 73.2
4. Current transfers (net) 1,991.0 1,104.7 1,750.4 1,188.5 1,405.2 2,084.2
Second: Capital and financial account (net) 1,029.7 2,035.5 1,522.5 2,144.6 1,765.8 1,549.4
1. Capital account (net) 828.2 640.0 588.2 551.3 691.0 415.8
Capital transfers (net) 828.2 640.0 588.2 551.3 691.0 415.8
Acquisition / disposal of non- financial, non-financial assets (net)
0.0 0.0 0.0 0.0 0.0 0.0
2. Financial account (net) 201.5 1,395.5 934.3 1,593.3 1,074.8 1,133.6
Foreign Direct investment (net) 121.9 477.4 29.3 224.0 -27.8 -65.0
Foreign Portfolio investment (net) -367.4 -121.1 -16.2 186.8 -17,.8 74.,
Foreign Other investment (net) 483.4 1,005.5 1,087.2 1,203.6 1,268.8 1,033.7
Change in Reserve assets -36.4 33.7 -166.0 -21.1 12.8 91.5
Third: Exceptional financing 101 101 0.01 605 605 .06
Fourth: Net errors and omissions** 277.2 34.1 298.5 238.8 3.300 0640.***
* Quarterly preliminary data.
** Net errors and omissions: It was calculated as the difference between the value of the Current account and net Capital and
financial account for the year 2010-2014.
*** Exceptional financing value was calculated in the net errors and omissions for the 2015 and will be updated in previous
years later.
The net income accounts decreased by 6.8% in 2015 compared to 2014, totalling USD
1,381.6 million. Compensation of employees received from abroad contributed by 90.2% of
total received of income account, while investment income accounted for the rest.
Notwithstanding 115.9% increase in net investment income in 2015, compared to decreasing
of net compensation of employees by 9.7%, the rise in the net investment income (value
amounted to USD 39.3 million) was less than the decline of the value in net compensation of
employees amounted to USD 140.2 million. This caused a decrease of net income accounts,
by USD 100.9 million, representing 6.8%. As is clear from the following figure, the
compensation of employees received from abroad has been steadily increasing between 2010
and 2014. Then it declined during the year 2015 reaching USD 1,309.2 million, which is
higher than the level of compensation of employees received in 2010 by 126.4%.

PCBS: Performance of the Palestinian Economy, 2015
[31]
Trend of compensation of employees and investment income received from abroad in Palestine, 2010- 2015
Net current transfers value increased by 48.3% during the year 2015 and reached to
USD 2,084.2 million. Due to an increase in current transfers received from abroad during the
year 2015 by 30.7% ( representing USD 2,630.8 million, compared to USD 2,013.2 million in
2014). This reflects a heavy dependency of the Palestinian economy on current transfers
received from abroad to support the general budget and the external transfers to the private
sector.
On the other hand, capital transfers received from abroad decreased by 39.8% reached
to USD 415.8 million during the year 2015 compared to USD 691.0 million in 2014.
Received capital transfers were fluctuating during 2010- 2015, reaching their highest level
during 2010 as a result of the political changes in Palestine during that period, but gradually
decreased after that, except 2014, reaching their lowest value in 2015 (See figure below).
Trend of current and capital transfers received from abroad in Palestine, 2010- 2015
0
200
400
600
800
1,000
1,200
1,400
2010 2011 2012 2013 2014 2015
Received Compensation employees Received investment income
0
500
1,000
1,500
2,000
2,500
3,000
3,500
4,000
2010 2011 2012 2013 2014 2015
USD
Mill
ion
Year Received current transfers Received capital transfers

PCBS: Performance of the Palestinian Economy, 2015
[32]
6 - International Investment Position (IIP)
The International Investment Position (IIP) is defined as an accounting sheet records of the
investments stocks of residents in Palestine (individuals, institutions and government)
invested in the rest of the world abroad under the name of (assets), plus the investments
stocks owned by residents outside Palestine (individuals, institutions and governments)
invested in Palestine under the name of (liabilities).
The net international investment position (IIP) for Palestine decreased by 35.1% during
2015 dropping to USD 899.0 million, compared to USD 1,385.0 million in 2014. As result
of decreasing the total stocks of external assets for Palestine and increasing the total
stocks of foreign liabilities in Palestine in 2015. The total stocks of external assets had
decreased by 4.6% by the end of 2015 to USD 5,855.0 million. Foreign direct investment
abroad contributed 6.0%, portfolio investments abroad represented 18.5%, other investments
abroad represented 65.6% (currency and deposits represented 99.4% of them), and reserve
assets formed 9.9%. The total stocks of foreign liabilities in Palestine increased by 4.2%
during 2015 compared with 2014 to USD 4,956.0 million. Foreign direct investment in
Palestine contributed 50.1%, portfolio investments in Palestine formed 16.6%, and other
investments in Palestine contributed 33.3% (See table 8).
Table 8: International Investment Position (IIP) in Palestine at the end of the years, 2010- 2015
Value in million USD Item 2010 2011 2012 0103 0104 0106
International investment position (net)* 1,286.0 721.0 667.0 880.0 1,385.0 .9901 Total external assets 5,423.0 5,233.0 5,262.0 5,828.0 6,139.0 5,855.0 Foreign direct investment abroad 241.0 192.0 232.0 171.0 358.0 352.0 Portfolio investments abroad 938.0 1,147.0 1,030.0 1,005.0 1,172.0 1,084.0 Other investments abroad 3,713.0 3,397.0 3,336.0 3,967.0 3,937.0 3,838.0 Reserve assets 531.0 497.0 664.0 685.0 672.0 581.0 Total foreign liabilities 4,137.0 4,512.0 4,595.0 4,948.0 4,754.0 4,956.0 Foreign direct investment in Palestine 2,175.0 2,328.0 2,336.0 2,459.0 2,487.0 2,486.0 Foreign portfolio investments in Palestine 612.0 611.0 676.0 768.0 725.0 821.0 Foreign other investments in Palestine 1,350.0 1,573.0 1,583.0 1,721.0 1,542.0 1,649.0
* International investment position (net) equals total external assets minus total foreign liabilities.

PCBS: Performance of the Palestinian Economy, 2015
[33]
7- External Debt
The External Debt is defined as an accounting sheet records the debt stocks on Palestinian economy
sectors due to nonresidents, which include (loans from nonresident, the nonresidents deposits
deposited in the banks sector in Palestine, the Palestinian bonds purchased by nonresidents, debt
transactions between the non-resident enterprises and fellow enterprises in Palestine, in addition to any
other liabilities on Palestinian economy).
The gross external debt position on Palestine increased by 6.9% during 2015, marking a
total of USD 1,649.0 million compared to USD 1,542.0 million in 2014. The external debt
on general government contributed 64.9% of the gross external debt position as USD 1,070.0
million, and the external debt on banks working in Palestine represented 32.1% as USD 530.0
million.
Table 9: Gross external debt position on the economic sector in Palestine at the end of
the years, 0100 - 2015 Value in USD million
Economic Sector 2011 2012 2013 2014 2015* General Government 1411,.8 148,7.8 1418,.8 1,089.0 1,070.0 Monetary Authorities 8.8 8.8 8.8 0.0 8.8 Banks 40,.8 ,,4.8 552.0 404.0 048.8 Other Sectors 188.8 ,4.8 60.0 49.0 ,,.8 Direct investment: lending between affiliated 3,.8 10.8 ,.8 0.0 8.8 Gross External Debt Position 0.69601 0.51001 0.60601 1,542.0 1,649.0 *Represents the data for fourth quarter 2015

PCBS: Performance of the Palestinian Economy, 2015
[34]
8-Public Finance8
The current Palestinian budget deficit decreased by 8.2% in 2015, falling to USD 1,218.8
million compared to USD 1,327.3 million in 2014. This is mainly explained by the decrease
in government expenditure with stability in the total net revenues. With decreasing in the
external support to cover the budget deficit by 31.2%, the total value of external support was
USD 708.8 million in 2015 compared to USD 1,029.7 million in 2014 (See figure below).
Components of general budget in Palestine, 2010- 2015
* Current deficit does not include development expenditure.
Total net revenues stabilized in 2015 at USD 2,810.1 million, which is almost the same
level in 2014. The Gross domestic revenues (tax and non-tax and earmarked collections)
represented a 32.4% of total net revenues, for up to USD 910.6 million in 2015. As
shown by the above figure, the total net revenues increased during 2010-2015 by 45.8%,
accounted for 9.2% annually.
Domestic tax revenues accounted for 21.5% of total net revenues in 2015, and totalled
USD 605.2 million. Domestic tax revenues have risen continuously since 2007 as a result of
government reforms in the tax collection, in line with Reform and Development Plan, which
the government has embarked on the implementation. It peaked in 2015 (See figure follow).
But the contribution of domestic tax revenues to the total net revenues fluctuated over the past
years, reaching 18.9% in 2009, and then rose to 25.8% in 2013, before declining to 21.4% in
2014, and 21.5% in 2015. Reflects this fluctuating, and the low proportion of the domestic
tax revenues to the total net revenues weakness of the tax base for Palestine and its
dependence on other sources to cover expenses.
8 Public financial statements do not include local governments (local councils and municipalities), the data during Ministry of
finance, and the data at commitment basis.
1,927.8
2,810.1 3,076.8
4,028.9
-1,149.0 -1,218.8 -2,000
-1,000
0
1,000
2,000
3,000
4,000
5,000
2010 2011 2012 2013 2014 2015
USD
Mill
ion
Year
Total net revenue Total Expendture Deficit*

PCBS: Performance of the Palestinian Economy, 2015
[35]
Domestic tax revenues in Palestine, 2010- 2015
Domestic non-tax revenues fell by 7.9% in 2015, compared to 2014, to reach USD 249.0
million, becoming comprising 8.9% of total net revenues in 2015. The earmarked collections
were amounted to USD 56.5 million, and accounting for 2.0% of total net revenues in 2015.
(See figure below).
Domestic non tax revenues in Palestine, 2010- 2015
As for the gross clearance revenues, recorded stability during the year 2015, compared
to 2014, and reached to USD 2,053.5 million, and constituted 73.1% of total net revenues
in 2015. As shown in the following figure, gross clearance revenues during the period
2010-2015 increased by 63.1%, approximately 12.6% annually, and increased its contribution
to the total net revenues from 65.3% to 73.1% during the same period, which reflects the
extent of the reliance of Palestinian budget on Israel.
474.4
605.2
100
200
300
400
500
600
700
2010 2011 2012 2013 2014 2015
USD
Mill
ion
Year
270.4 249.0
100
200
300
400
2010 2011 2012 2013 2014 2015
USD
Mill
ion
Year

PCBS: Performance of the Palestinian Economy, 2015
[36]
Gross clearance revenues in Palestine, 2010- 2015
Conversely, total government expenditure decreased by 2.6% in 2015 to USD 4,028.9
million compared to USD 4,137.5 million in 2014. Salaries and wages are constituted
about half of government expenditure in Palestine. The total salaries and wages bill was
USD 1,912.5 million in 2015, making up 47.5% of total expenditures. In contrast, net lending
rate rose to 7.5% of total government expenditure in 2015, compared to 6.9% in 2014. (See
two Figures below).
1,259.2
2,053.5
300
600
900
1,200
1,500
1,800
2,100
2010 2011 2012 2013 2014 2015
USD
Mill
ion
Year
Percentage distribution of total expenditure and net lending in
Palestine, 2015
Percentage distribution of total expenditure and net lending in
Palestine, 2014
Salaries and
Wages 47.5%
Non Wages 45.0%
Net Lending
7.5%
Salaries and
Wages 49.7%
Non Wages 43.4%
Net Lending
6.9%

PCBS: Performance of the Palestinian Economy, 2015
[37]
9 – Banking Sector
Table 10: Main indicators of banking sector in Palestine, 2010- 2015
Value in USD million
Indicator 2010 2011 2012 2013 2014 2015
Total credit facilities 2,885.9 3,550.7 4,199.3 4,480.1 4,895.1 5,824.7 Total deposits 6,802.4 6,972.7 7,484.1 8,303.7 8,934.5 9,654.6 Total consumer loans 144.3 415.2 783.0 885.6 ,31.7 1,088.4 Average interest rates on dollar 3.44 3.7, 3.,7 7.01 3.,1 3.70
The value of total deposits in bank sector during 2015 recorded an increase of 8.1%
compared to 2014 and reached to USD 9,654.6 million. The value of deposits to resident
individuals was USD 6,475.7 million, accounted to 67.1% of the total value of deposits in
2015, while deposits to the Palestinian Central Government reached to USD 487.6 million,
represented 5.1% of the total value of deposits.
The value of total credit facilities, were provided by banking sector, stood at USD
5,824.7 million, showing an increase of 19.0% compared to 2014. The credit facilities
provided to the public sector amounted to USD 1,456.0 million, represented 25.0% of the
total value of the credit facilities provided by banking sector in 2015 compared to USD
1,239.8 million in 2014, showing thus a rise by 17.4%. While the value of the facilities
provided to finance consumption loans was USD 1,088.4 million, represented to 18.7% of the
total value of credit facilities, while the value of the facilities offered to finance cars and
vehicles was USD 200.7 million, accounted for 3.4% of the total value of the credit facilities.
The average interest rate on loans to the USD price recorded an increase of 5.8% during
the year 2015 to reach 6.78%, while the average interest rate on USD deposits of up to
0.94%.
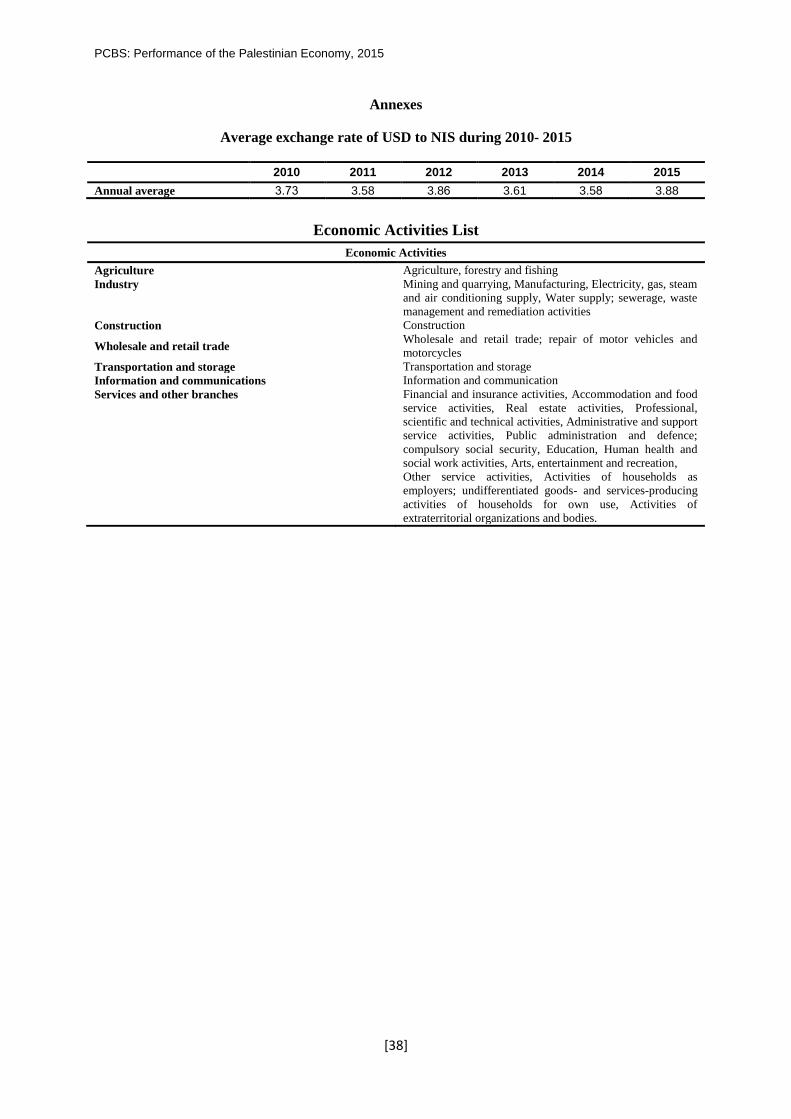
PCBS: Performance of the Palestinian Economy, 2015
[38]
Annexes
Average exchange rate of USD to NIS during 2010- 2015
2010 2011 2012 2013 2014 2015 Annual average 4.74 3.58 3.83 3.61 3.50 3.88
Economic Activities List
Economic Activities
Agriculture Agriculture, forestry and fishing
Industry Mining and quarrying, Manufacturing, Electricity, gas, steam
and air conditioning supply, Water supply; sewerage, waste
management and remediation activities
Construction Construction
Wholesale and retail trade Wholesale and retail trade; repair of motor vehicles and
motorcycles
Transportation and storage Transportation and storage
Information and communications Information and communication
Services and other branches Financial and insurance activities, Accommodation and food
service activities, Real estate activities, Professional,
scientific and technical activities, Administrative and support
service activities, Public administration and defence;
compulsory social security, Education, Human health and
social work activities, Arts, entertainment and recreation,
Other service activities, Activities of households as
employers; undifferentiated goods- and services-producing
activities of households for own use, Activities of
extraterritorial organizations and bodies.