Embed Size (px)
Citation preview
Greystone Equity Fund 2016-2017 Annual Report
Marist College
2
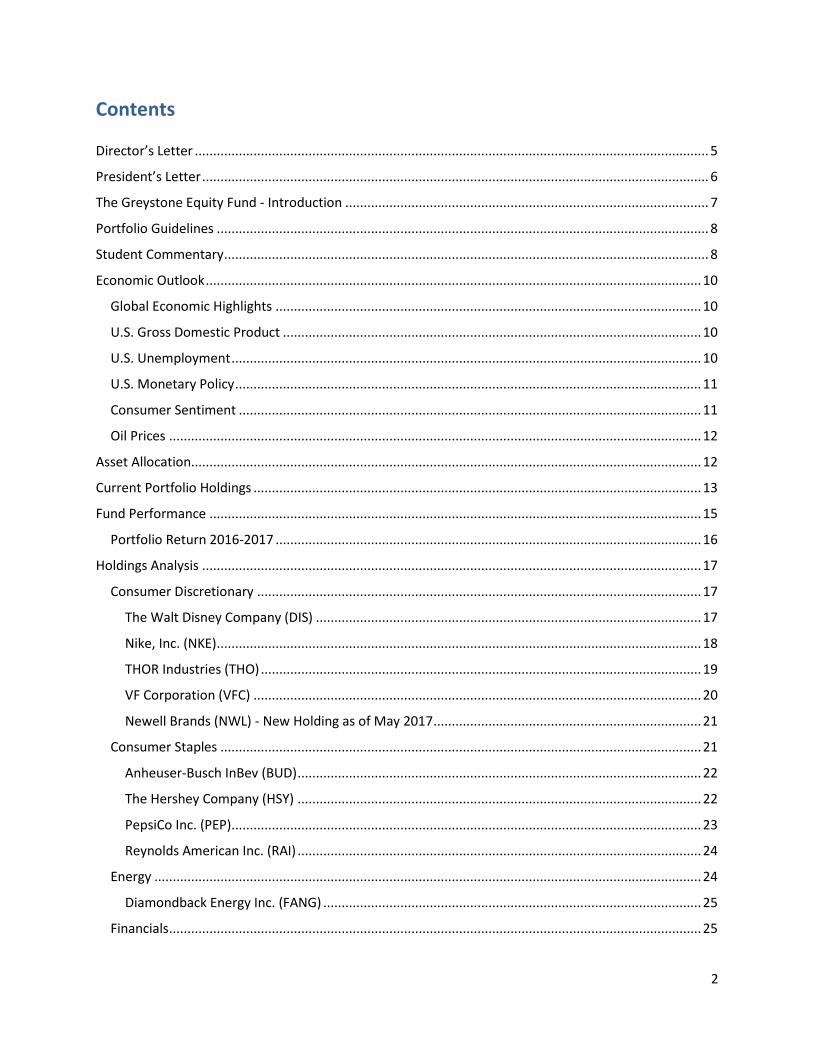
Contents Director’s Letter ............................................................................................................................................ 5
President’s Letter .......................................................................................................................................... 6
The Greystone Equity Fund - Introduction ................................................................................................... 7
Portfolio Guidelines ...................................................................................................................................... 8
Student Commentary .................................................................................................................................... 8
Economic Outlook ....................................................................................................................................... 10
Global Economic Highlights .................................................................................................................... 10
U.S. Gross Domestic Product .................................................................................................................. 10
U.S. Unemployment ................................................................................................................................ 10
U.S. Monetary Policy ............................................................................................................................... 11
Consumer Sentiment .............................................................................................................................. 11
Oil Prices ................................................................................................................................................. 12
Asset Allocation........................................................................................................................................... 12
Current Portfolio Holdings .......................................................................................................................... 13
Fund Performance ...................................................................................................................................... 15
Portfolio Return 2016-2017 .................................................................................................................... 16
Holdings Analysis ........................................................................................................................................ 17
Consumer Discretionary ......................................................................................................................... 17
The Walt Disney Company (DIS) ......................................................................................................... 17
Nike, Inc. (NKE) .................................................................................................................................... 18
THOR Industries (THO) ........................................................................................................................ 19
VF Corporation (VFC) .......................................................................................................................... 20
Newell Brands (NWL) - New Holding as of May 2017 ......................................................................... 21
Consumer Staples ................................................................................................................................... 21
Anheuser-Busch InBev (BUD) .............................................................................................................. 22
The Hershey Company (HSY) .............................................................................................................. 22
PepsiCo Inc. (PEP) ................................................................................................................................ 23
Reynolds American Inc. (RAI) .............................................................................................................. 24
Energy ..................................................................................................................................................... 24
Diamondback Energy Inc. (FANG) ....................................................................................................... 25
Financials ................................................................................................................................................. 25
3
Assured Guaranty (AGO) ..................................................................................................................... 26
M&T Bank (MTB) ................................................................................................................................. 26
Wells Fargo (WFC) ............................................................................................................................... 27
Bank of the Ozarks (OZRK) - New Holding as of May 2017 ................................................................. 28
Health Care ............................................................................................................................................. 28
Abbott Laboratories (ABT) .................................................................................................................. 29
Emergent BioSolutions, Inc. (EBS) ....................................................................................................... 29
Aptevo Therapeutics Incorporated (APVO) ........................................................................................ 30
Gilead Sciences Inc. (GILD) .................................................................................................................. 31
Industrials ................................................................................................................................................ 32
Roper Technologies, Inc. (ROP) ........................................................................................................... 33
Snap-On, Inc. (SNA) ............................................................................................................................. 34
Union Pacific Corporation (UNP) ........................................................................................................ 34
Industrial Select Sector SPDR ETF (XLI) ............................................................................................... 35
Information Technology .......................................................................................................................... 36
Corning Inc. (GLW) .............................................................................................................................. 36
Facebook, Inc. (FB) .............................................................................................................................. 37
Palo Alto Networks, Inc. (PANW) ........................................................................................................ 37
Paycom Software, Inc. (PAYC) ............................................................................................................. 38
Visa Inc. (V) .......................................................................................................................................... 38
Materials ................................................................................................................................................. 39
LyondellBasell Industries (LYB) ........................................................................................................... 39
Chase Corporation (CCF) - New Holding as of May 2017 .................................................................... 40
Real Estate .............................................................................................................................................. 40
American Tower Corporation (AMT) .................................................................................................. 41
First Industrial Realty Trust (FR) - New Holding as of May 2017 ........................................................ 42
Telecommunication Services .................................................................................................................. 42
T-Mobile US Inc. (TMUS) – New Holding as of May 2017 ................................................................... 43
Utilities .................................................................................................................................................... 44
Aqua America, Inc. (WTR) ................................................................................................................... 44
Greystone Fund Events – 2016/2017.......................................................................................................... 46
2017 CFA Research Challenge ................................................................................................................. 46
G.A.M.E Forum ........................................................................................................................................ 48

4
Marist Splash ........................................................................................................................................... 49
Guest Speakers ....................................................................................................................................... 50
Student Analysts ......................................................................................................................................... 51
Disclaimer.................................................................................................................................................... 56
5
Director’s Letter Summer 2017 On behalf of the students who participated in Marist College’s student-managed investment program in 2017, I am pleased to present the Greystone Equity Fund Annual Report for the period ending April 30, 2017. The report was written by the students. Students who participate in the program are tasked with managing the equity portfolio over the course of a single semester. They are responsible for all aspects of the portfolio management process, from evaluating the current state of the economy to screening, analyzing and evaluating potential stocks and writing analyst reports, and voting on portfolio allocation decisions. Each class has had to make decisions in the face of uncertainty and incomplete information, and they have done an excellent job. This year has once again proven challenging, with value stocks continuing to underperform the broad market. Nevertheless, we maintained our value focus, with the students taking the long view in the belief that, in the long run, value will win out. Our students continue to take part in various inter-collegiate activities. This year a team of students competed in the CFA Institute Research Challenge, making it to the final four of the NY regional competition. As our first time participating it proved a useful learning experience, and we look forward to competing again in the future. Students also benefited from our annual trip to the GAME forum, a conference for student‐managed investment funds, where the Marist representatives had the opportunity to hear from industry leaders and to share their experiences with peers from other colleges and universities across the country. The students would not be able to participate in these exciting initiatives without the support of the Marist administration. I would like to thank the Board of Trustees for allowing the Greystone Equity Fund to manage a portion of the College endowment and for providing the Fund a home in the state‐of‐the art Investment Center in the Hancock Center. John Pecchia, the CFO, and the Dean of the School of Management, Lawrence Singleton, have helped us enormously, while our guest speakers have been overwhelmingly generous with their time and support. Our experience with the Greystone Equity Fund has been exciting and rewarding. The students have demonstrated a tremendous capacity for hard work and a thirst for knowledge. I am confident that the team‐based, practical learning experience gained by the student participants will serve them well in their future careers and, notwithstanding the challenges of the world economy, I believe that the Greystone Equity Fund will continue to provide our students with the opportunity to excel. Brian J Haughey, CFA, FRM, CAIA Director, Marist College Investment Center.
6
President’s Letter My name is Nicholas Arnold, and I served as the Fund President during the Spring 2017 semester. I have
been fortunate enough to work alongside 14 other students who have demonstrated exponential
growth in their knowledge surrounding the financial markets. Together, we were able to work toward
the same goal of selecting securities that showed a large potential for upward growth, while mitigating
downside risk over a long-term time horizon.
In order to accomplish this goal, each student was assigned two different sectors to follow and analyze
throughout the entirety of the semester. Each analyst was able to provide crucial insight into different
aspects of their sectors such as future trends within specific markets, or economic and political changes
that are likely to develop, impacting the entire landscape of the equity markets.
After a rigid screening process entailing trial and error with different parameters such as P/E ratio, Funds
from Operations (FFO) and Altman’s Z-Score, each team of sector analysts were then required to pick
one company with the perceived greatest upside, and pitch that stock to the entire class. Each and every
student demonstrated increased comfort in presenting his or her findings and analyses as the semester
progressed. In order to supplement the presentation, analysts were required to construct a
comprehensive report that provided a full background on the recommended company, as well as a price
target derived from multiple valuation methods.
Although some companies received a “Hold” recommendation after arriving at a mediocre price target,
the Fund was able to add six new holdings to the portfolio following incredibly successful pitches. The
new holdings provide the portfolio with increased diversity, as they operated in sectors ranging from
Telecommunications to Real Estate. The six new holdings include: Bank of the Ozarks, Chase
Corporation, First Industrial Realty Trust, Newell Brands, LabCorp, and T-Mobile.
This past semester has allowed each analyst to gain incredible experiences in Equity Research that will
translate incredibly well to various fields within the industry. Although all members of the Fund were
challenged every day, Professor Haughey provided us with extensive resources, ranging from Bloomberg
Terminals to weekly forums covering various trending topics. The requirements of the Fund allowed
students to gain a well-rounded understanding of the economic environment, which will prove to be
incredibly crucial for those who will be entering the workforce within the next few months.
I speak for all members of the Fund when I say that it has been both an honor and a privilege to work
amongst so many passionate and determined students this semester who have provided incredible
recommendations. I would like to thank Professor Haughey who has consistently provided unparalleled
opportunities in and outside of the classroom for all students throughout his time at Marist College. I
would also like to thank the School of Management, and everyone else who has made this extraordinary
opportunity possible.
Nicholas Arnold
President, Greystone Equity Fund
7
The Greystone Equity Fund - Introduction The Greystone Equity Fund – a student‐managed investment fund (SMIF) – was established in 2011 to provide Marist College students with “hands‐on” experience in investment management, by bridging the gap between traditional classroom instruction and “real world” application. The aim of the program is to maximize the long‐term total rate of return on Fund assets, while providing student managers the opportunity to gain experience in identifying, analyzing, valuing and investing in securities, in the management of a portfolio, and in the reporting of portfolio performance. Student participants in the SMIF submit to a recruitment process that is designed to be both highly selective and representative of what students will be exposed to when they graduate. Each applicant was required to complete an application form, and to provide a letter of recommendation from one of their professors. Other than in exceptional circumstances, only applications from those students with a GPA of 3.0 or better were considered. After an initial screening process, selected applicants were invited to take part in an interview process. Students who acquitted themselves satisfactorily in the interview were then invited to participate in the class. The class is organized just as an investment management firm might be. Each student has responsibility for two of eleven market sectors, and is responsible for identifying and researching potential stock investments, and writing an analyst report on his or her stock suggestion. The entire class comprises the investment committee, responsible for asset allocation and formulating investment strategy, subject to the provisions of the Fund’s Investment Policy Statement, and votes on each investment proposal. A supermajority is required for a proposal to be accepted. Students meet formally for regularly scheduled classes, as well as informally while performing research, and are required to dress professionally when in the Investment Center. Students in the SMIF learn how to assess the current state of the economy to determine the likely performance of industries and companies. They work on their own and in small teams, and gain experience in performing both quantitative and qualitative analysis, and in presenting their findings both verbally and in written analyst reports. Equally importantly, they gain experience in decision making with incomplete information, and in weighing and evaluating several prospective outcomes. They perform “top‐down” analysis to determine the Fund’s sector weighting, by evaluating the macroeconomic environment, examining leading economic indicators and keeping abreast of political, economic and regulatory news. They then perform a “bottom‐up” fundamental analysis, screening for stocks in a given sector on the basis of relative value to identify undervalued securities, and performing a comprehensive evaluation of their selected stock. This analysis entails evaluating the company’s financial statements, earnings guidance, competitive position and industry research, and using discounted cash flow models and relative valuation metrics to determine what the students believe is a “fair value” for the security. The emphasis in the program is on bridging the gap between the academic and the practical, and in this we have been assisted by a group of Wall Street professionals who have generously devoted their time to visiting the class and making presentations. Students in the Greystone Equity Fund also benefit from the resources available in Marist’s world‐class Investment Center, featuring a dozen Bloomberg terminals, the Morningstar data service, stock tickers and TV displays, and their rich learning experience would not be possible without the resources provided by the College administration.
8
Portfolio Guidelines The investment objective of the Greystone Equity Fund is to maximize the long-term total rate of return
on Fund assets, consistent with prudent risk limits and diversification requirements, while providing its
student managers with the opportunity to gain experience in identifying, analyzing, valuing and
investing in securities, in the management of a portfolio, and in the reporting of portfolio performance.
The portfolio is managed against a benchmark, the S&P 500 index, with student managers being subject
to the provisions of the Fund’s Investment Policy Statement. Consistent with this policy, student
managers may only invest in stocks that are either domiciled in the US or that have ADRs traded on a US
exchange. Permitted asset classes include equities, convertible bonds, ETFs and cash. The Fund may
invest in common and preferred stocks of US domestic equities with market capitalization of at least
$100 million. No more than 20% of Fund assets may be invested in small-cap stocks, and no more than
40% may be invested in medium-cap stocks, where small-cap stocks are defined as those with a market
capitalization of between $100 million and $2 billion, and medium-cap stocks are defined as those with
a market capitalization of between $2 billion and $5 billion.
The Fund seeks to outperform the index by overweighting those market sectors the managers believe,
on the basis of their analysis, will outperform the market over the next 12 months, and underweighting
those sectors they believe will underperform. Within each of the market sectors the managers seek to
identify individual stocks that will outperform their peers. The portfolio remains fully invested over the
summer and winter breaks, in order to replicate the performance of a buy-and-hold portfolio. The class
could choose to liquidate the portfolio between semesters, but to do so would expose the Fund to basis
risk, that is, the risk that the market could recover from a decline, or appreciate significantly leading to
significant underperformance by the cash only portfolio.
Student Commentary The Greystone Equity Fund was initiated during the spring semester of 2011. The first class of this
student-managed investment fund met in January of that year and since then, eleven additional classes
have participated in the program. The first cohort of students selected a group of exchanges traded
funds (ETFs) that covered each major market sector for the initial allocation of portfolio assets. As the
semester progressed, the class then analyzed individual stocks that they later pitched to the class and,
after a vote, liquidated a portion of the ETF investments and allocated the proceeds to the selected
equities. During subsequent semesters, each incoming class examined the ETF and stock selections of
the preceding students, choosing to either maintain the current investments or sell and invest in new
holdings. At the end of each semester, the current class voted to accept the stocks that were pitched,
and liquidated some of the existing ETF and previous equity holdings to fund the stock purchases.
Each student cohort learned how to access and evaluate the market environment by using tools such as
Morningstar and Bloomberg. Each member of the class was responsible for specific roles that would
help the whole team achieve the best conclusions. Members responsible for the analysis of the
economic environment kept the class updated about facts that could affect final decisions. In addition,
the class used valuation models developed both by Bloomberg and themselves to help analyze the
chosen stocks.
9
The benchmark used for the Fund assets is the S&P 500, and we analyzed the market using sectors
defined by Standard and Poor’s: Consumer Discretionary, Consumer Staples, Energy, Financials,
Healthcare, Industrial, Information Technology, Materials, Real Estate, Telecommunication services, and
Utilities.
We sought to generate Alpha, or outperformance relative to the benchmark, by overweighting sectors
we believed would outperform, as well as picking what we considered to be superior stocks within each
sector. We discuss our sector weights in a subsequent section. Our stock research primarily focused on
fundamental analysis, although we did pay some attention to technical analysis, and the Investment
Center’s Bloomberg terminals provided the class with an extensive array of stock screening tools which
each student could tailor to fit their own preferred criteria. Students also made use of company financial
statements (Income Statement, Balance Sheet, Statement of Cash Flows, and Statement of Retained
Earnings).
The most popular initial screens used by students focused on the Price/Book ratio, the Price/Earnings
ratio, Price/Sales, and Earnings per Share. The Price/Book (P/B) ratio provides an excellent measure
regarding the relative value of an underlying stock. It compares the current price of the stock to the
proceeds likely to be realized if the company were to be liquidated today. Typically, investors searching
for a bargain purchase should buy a stock with a P/B ratio of less than 1. This suggests that an investor
will be buying a stock at a “discount” based on the assets on the company’s balance sheet.
The Price/Earnings (P/E) ratio tells an investor how much he is paying for a company’s earnings power.
Some stocks may feature a high P/E (generally above 20, but can vary by the sector) stock; in such cases
an investor is prepared to pay more for the stock because of its higher expected earnings power,
although these stocks typically carry more risk than a low P/E (20 or below) stock. Examples of
companies that demand high price to earnings are the new, innovative tech companies such as Apple,
Google, and Micron Technologies. Investors in a stock that maintain a low P/E (15 or below) expect the
company to maintain a steady cash flow. These companies include General Electric, NextEra, and
Verizon, and they usually pay dividends. Conversely, high P/E stocks do not tend to pay dividends.
The Earnings Per Share (EPS) screen is a useful indicator that shows how much profit the company
produced for one share of common stock. EPS provides investors with a solid screen because if EPS
increases year after year, the stock has consistent earnings growth or earnings momentum, while a
history of paying dividends is attractive also. We also used a variety of other screens, such as the
Pietrowski F‐score, to rank stocks.
The portfolio’s weighted‐average Beta is 1.04, slightly higher than that of the Benchmark, the S&P500,
which has a beta of 1.00. This beta gives us a relatively safe position considering the market’s
uncertainties while still allowing for excess expected growth over the benchmark. Our opportunity to
generate Alpha is based on our ability to identify companies that are likely to outperform peers. In
accordance with current economic conditions, we believe we have addressed both the risk of an
economic downturn and the opportunity for continued expansion.
10
Economic Outlook
Global Economic Highlights According to the IMF, the global economy is expected to expand by 3.5% in 2017, slightly higher than the expected growth in 2016 of 3.1%. Growth rates among countries tend to vary based on the level of economic advancement. The United States economy is expected to expand at a rate of 2.3% in 2017, which is moderately above the expected growth of 2.0% for other “Advanced Economies” similar to the United States, such as the Euro Area, Japan, United Kingdom, and Canada. Comparatively, the IMF’s projected growth rate for 2017 for Emerging Markets and Developing Countries is currently 4.5%. Most notably, China’s 6.6% projected growth represents a deceleration in growth due to policy controls and overcapacity that will likely be partially offset by continued policy support, as the government continues to invest heavily in infrastructure. The direction of commodity prices will also play a major role in driving global growth. With oil-exporting countries’ recent agreement to trim supply, it is possible that a rise in commodity prices will help drive inflation rates higher toward global targets. Despite these upward growth projections, there are several risks that the global economy faces. Specifically, the IMF cites high corporate debt levels, declining profitability, weak balance sheets and geopolitical risks among the most important to look out for.
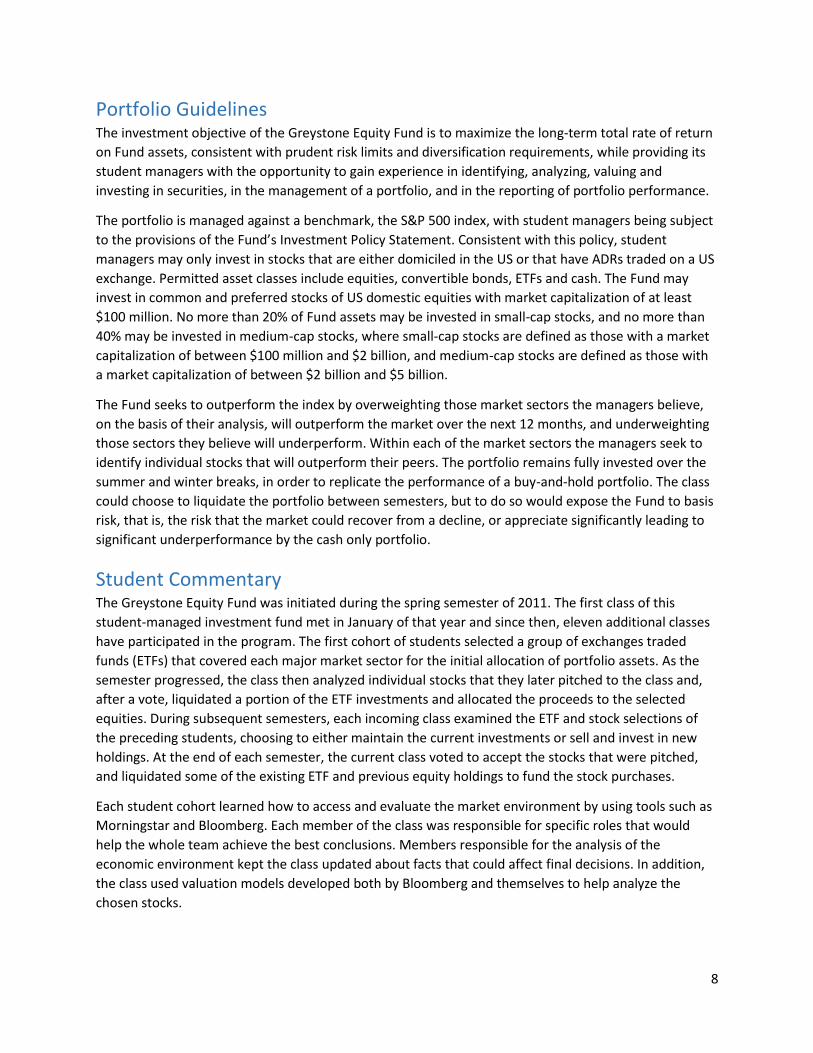
U.S. Gross Domestic Product The U.S. economy continues to show signs of strength in the months since the 2016 presidential election. GDP expanded at an annualized rate of 2.1 percent in the 4th quarter of 2016. Over the 10-year period ended Q4 2016, Personal Consumption Expenditure (PCE) as a share of GDP has increased about 9.0 percent. 1 This has had the effect of insulating the U.S. economy from negative international market catalysts through strong domestic demand. Q1 2017 saw a contraction in PCE resulting in an annualized growth rate of 0.7%. The exact details of President Trump’s infrastructure and tax policies remain to be seen but, if implemented as stated, could result in the expansion of other areas of GDP such as investment and government spending. If consumer spending remains unchanged, this could result in an expansion of growth estimates for the United States.
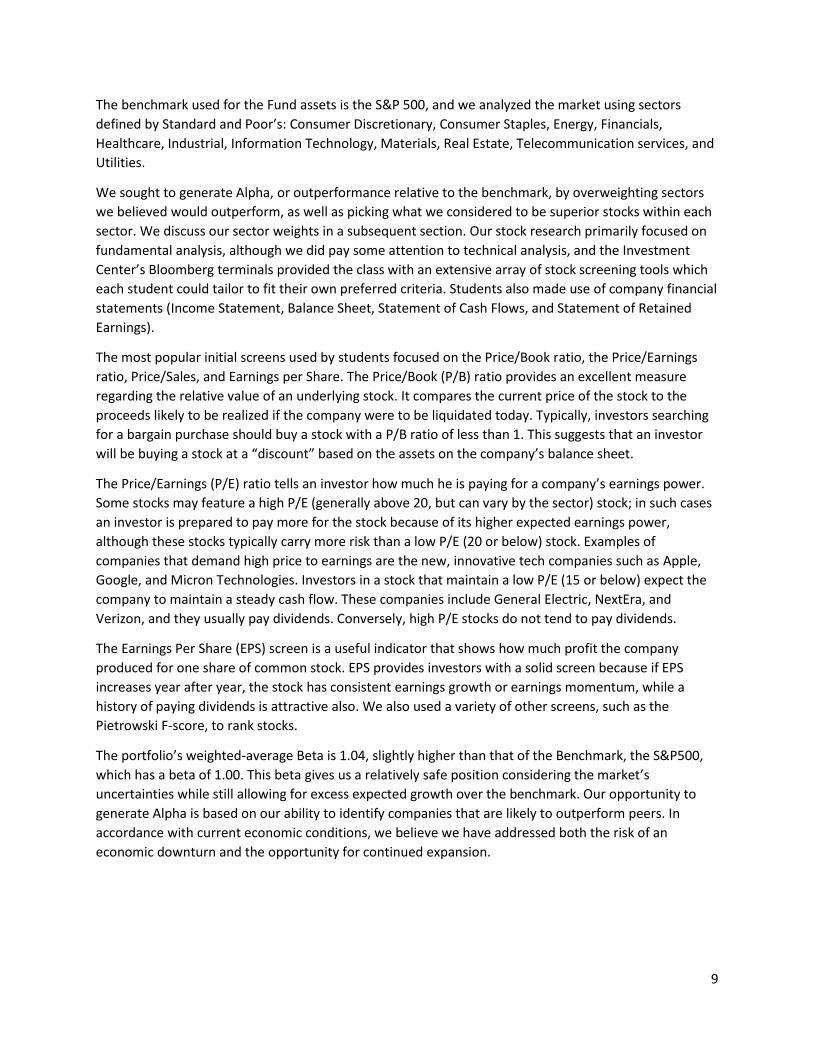
U.S. Unemployment Headline unemployment (U-3), now holding at around 4.5 percent, has nearly recovered to pre-recession levels.2 However, the underemployment rate (U-6) is still roughly 1.0 percent above where it was before the recession, suggesting that a significant number of individuals have accepted either part-time jobs or jobs of lesser skill requirements relative to pre-recession places of employment. In addition, the Labor Force Participation Rate, which measures the number of people who are employed or actively looking for
1 US Department of Commerce, BEA, Bureau of Economic Analysis. "Gross Domestic Product." U.S. Bureau
of Economic Analysis. March 30, 2017. Accessed April 18, 2017. 2 "Employment Situation Summary." U.S. Bureau of Labor Statistics. April 7, 2017. Accessed April 18, 2017.
FIGURE 1 – QUARTERLY CHANGE IN GDP
11
work as a percentage of the working age population, has exhibited a consistent decline since the recession that ended June 2009. An increase in the labor force participation rate could begin to drive inflation through wage pressures as more individuals enter the labor force. Regardless, as more individuals become employed, wages should begin to face upward pressure, increasing income and driving inflation.
FIGURE 2 – EMPLOYMENT, UNDER-EMPLOYMENT AND LABOR FORCE PARTICIPATION
U.S. Monetary Policy The positive outlook for the labor market has led the Federal Reserve (Fed) to begin reducing the simulative nature of its monetary policy. It appears the Fed will do this through a gradual shrinkage of its balance sheet and a gradual pace of rate hikes. We expect that the Fed will raise rates two or three more times this year, which would likely raise the Fed Funds rate to roughly 1.25-1.50 percent by the end of the year. The Fed believes that the employment piece of its ‘dual mandate’ has been met and inflation has been trending towards the 2.0 percent target rate. The Fed wants to remain flexible regarding its more restrictive monetary policy as the fiscal implications of the Trump Administration remain uncertain.
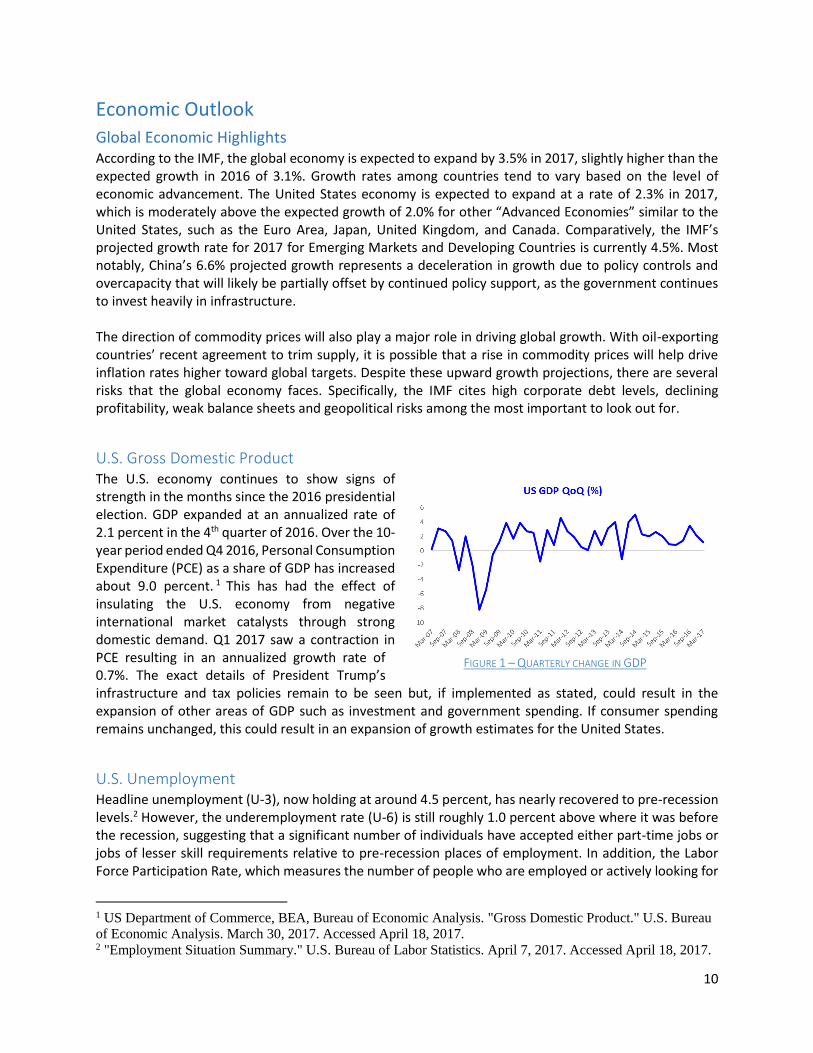
Consumer Sentiment The University of Michigan Survey of Consumer Confidence Sentiment Index has been improving significantly since the recession ended June 2009. In January 2017, the index reached a new 10-year high of 98.5. These index readings, previously seen only before the recession, are a signal that individuals in the U.S. economy are optimistic with respect to the growth prospects of the United States economy.
FIGURE 3 – CONSUMER SENTIMENT
12
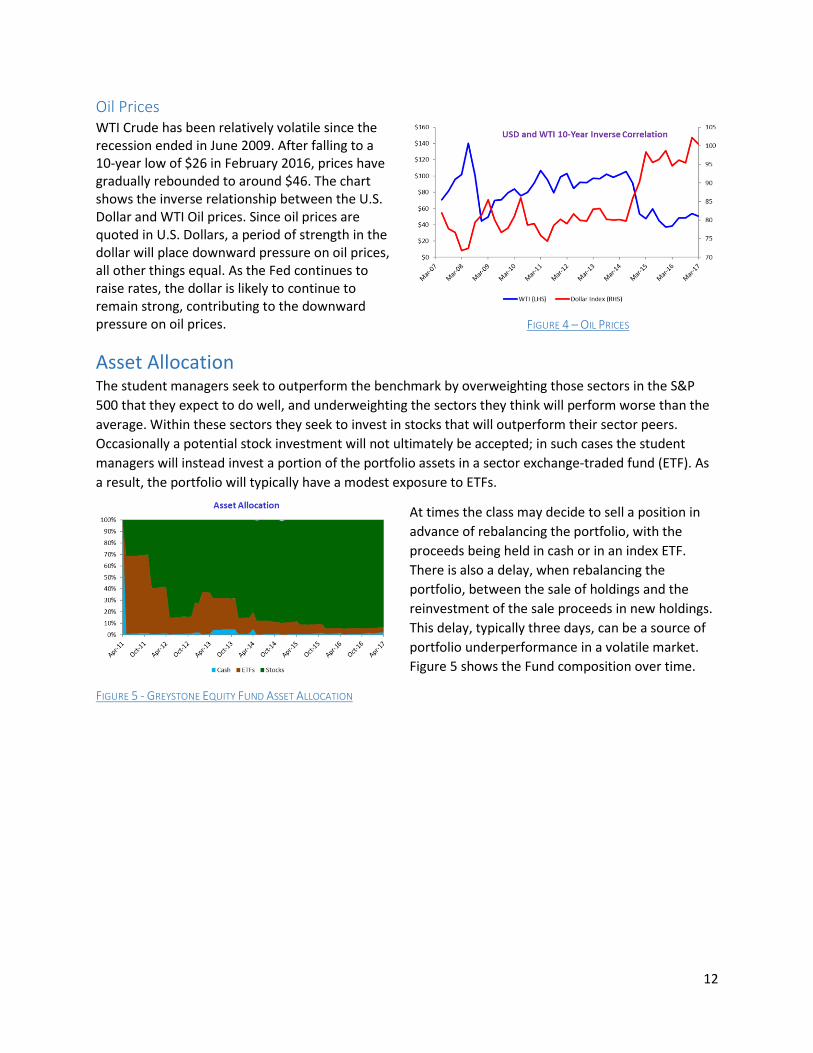
Oil Prices WTI Crude has been relatively volatile since the recession ended in June 2009. After falling to a 10-year low of $26 in February 2016, prices have gradually rebounded to around $46. The chart shows the inverse relationship between the U.S. Dollar and WTI Oil prices. Since oil prices are quoted in U.S. Dollars, a period of strength in the dollar will place downward pressure on oil prices, all other things equal. As the Fed continues to raise rates, the dollar is likely to continue to remain strong, contributing to the downward pressure on oil prices. FIGURE 4 – OIL PRICES
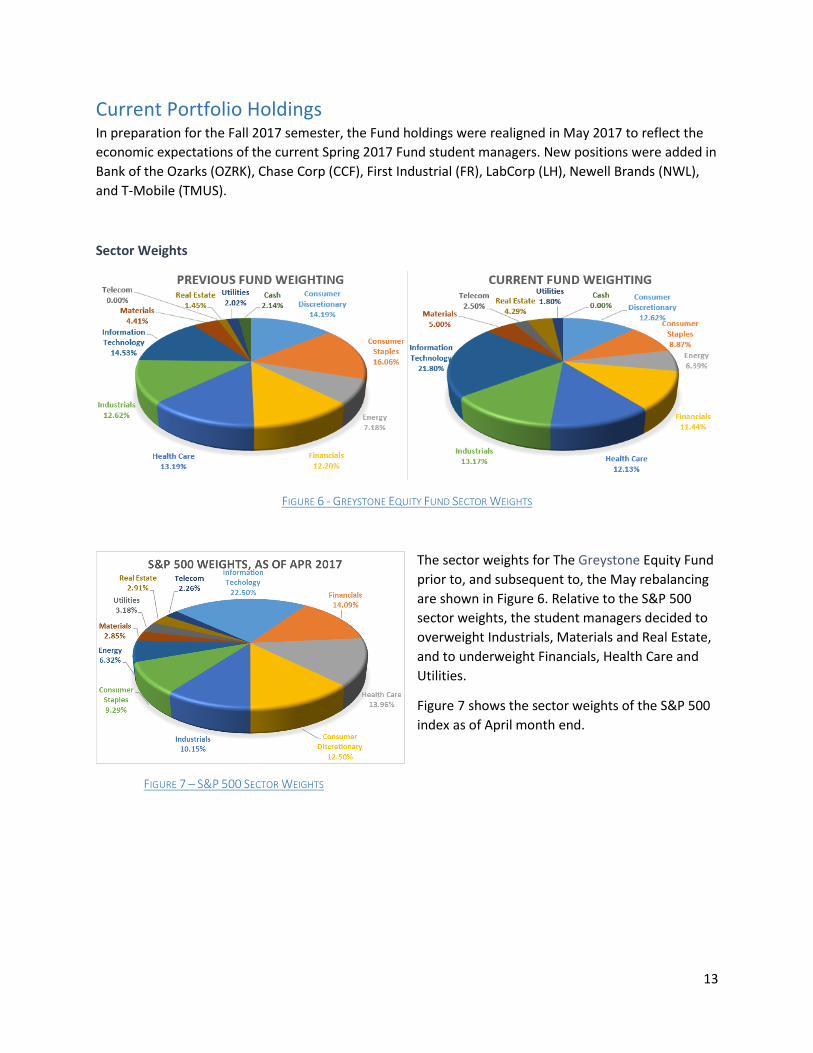
Asset Allocation The student managers seek to outperform the benchmark by overweighting those sectors in the S&P
500 that they expect to do well, and underweighting the sectors they think will perform worse than the
average. Within these sectors they seek to invest in stocks that will outperform their sector peers.
Occasionally a potential stock investment will not ultimately be accepted; in such cases the student
managers will instead invest a portion of the portfolio assets in a sector exchange-traded fund (ETF). As
a result, the portfolio will typically have a modest exposure to ETFs.
At times the class may decide to sell a position in
advance of rebalancing the portfolio, with the
proceeds being held in cash or in an index ETF.
There is also a delay, when rebalancing the
portfolio, between the sale of holdings and the
reinvestment of the sale proceeds in new holdings.
This delay, typically three days, can be a source of
portfolio underperformance in a volatile market.
Figure 5 shows the Fund composition over time.
FIGURE 5 - GREYSTONE EQUITY FUND ASSET ALLOCATION
13
Current Portfolio Holdings In preparation for the Fall 2017 semester, the Fund holdings were realigned in May 2017 to reflect the
economic expectations of the current Spring 2017 Fund student managers. New positions were added in
Bank of the Ozarks (OZRK), Chase Corp (CCF), First Industrial (FR), LabCorp (LH), Newell Brands (NWL),
and T-Mobile (TMUS).
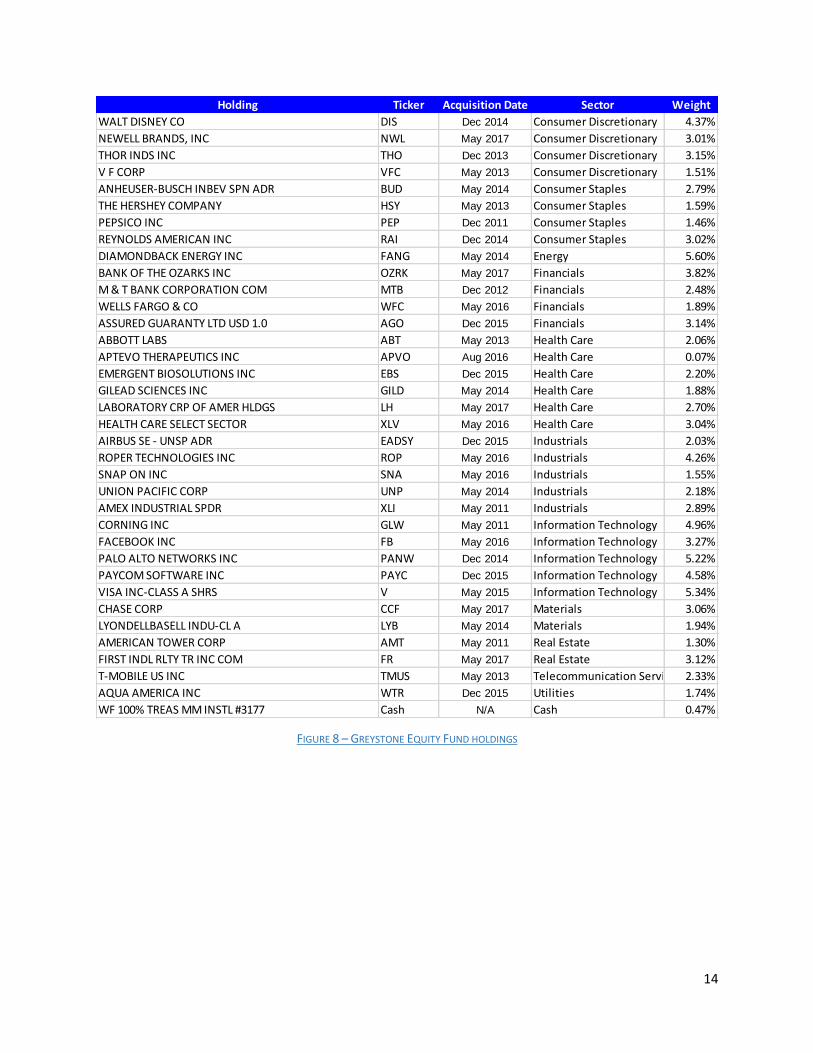
Sector Weights
FIGURE 6 - GREYSTONE EQUITY FUND SECTOR WEIGHTS
The sector weights for The Greystone Equity Fund
prior to, and subsequent to, the May rebalancing
are shown in Figure 6. Relative to the S&P 500
sector weights, the student managers decided to
overweight Industrials, Materials and Real Estate,
and to underweight Financials, Health Care and
Utilities.
Figure 7 shows the sector weights of the S&P 500
index as of April month end.
FIGURE 7 – S&P 500 SECTOR WEIGHTS
14
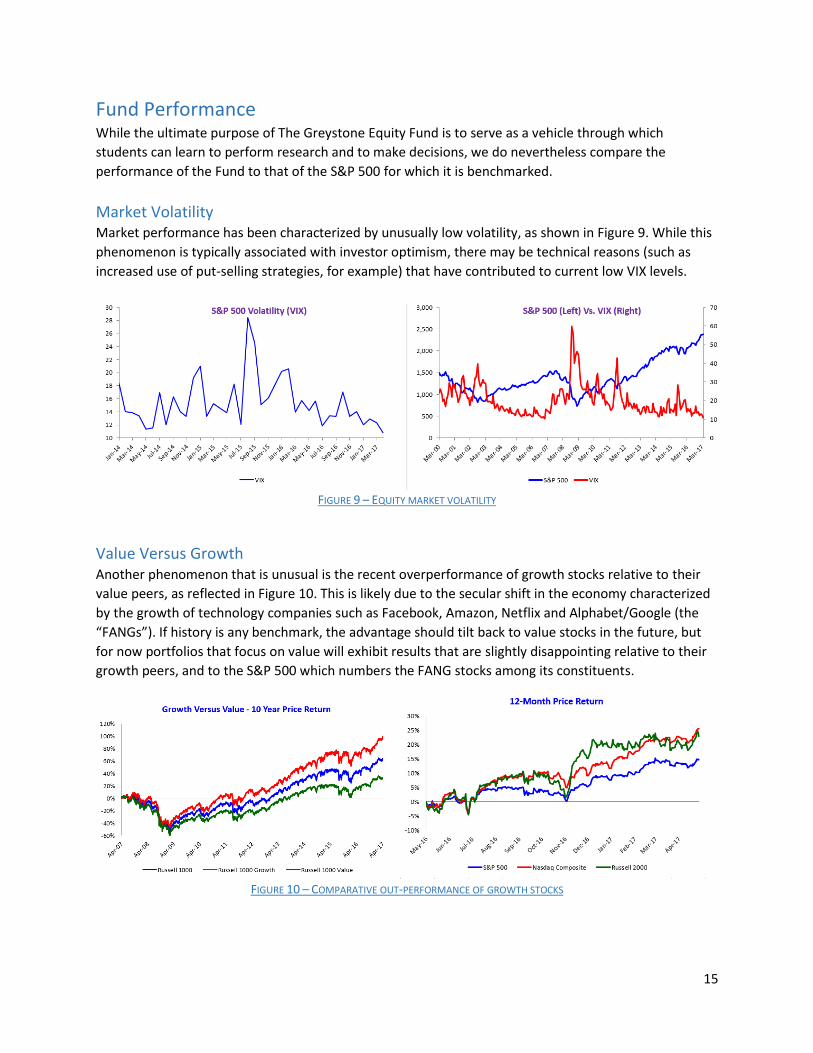
FIGURE 8 – GREYSTONE EQUITY FUND HOLDINGS
Holding Ticker Acquisition Date Sector Weight
WALT DISNEY CO DIS Dec 2014 Consumer Discretionary 4.37%
NEWELL BRANDS, INC NWL May 2017 Consumer Discretionary 3.01%
THOR INDS INC THO Dec 2013 Consumer Discretionary 3.15%
V F CORP VFC May 2013 Consumer Discretionary 1.51%
ANHEUSER-BUSCH INBEV SPN ADR BUD May 2014 Consumer Staples 2.79%
THE HERSHEY COMPANY HSY May 2013 Consumer Staples 1.59%
PEPSICO INC PEP Dec 2011 Consumer Staples 1.46%
REYNOLDS AMERICAN INC RAI Dec 2014 Consumer Staples 3.02%
DIAMONDBACK ENERGY INC FANG May 2014 Energy 5.60%
BANK OF THE OZARKS INC OZRK May 2017 Financials 3.82%
M & T BANK CORPORATION COM MTB Dec 2012 Financials 2.48%
WELLS FARGO & CO WFC May 2016 Financials 1.89%
ASSURED GUARANTY LTD USD 1.0 AGO Dec 2015 Financials 3.14%
ABBOTT LABS ABT May 2013 Health Care 2.06%
APTEVO THERAPEUTICS INC APVO Aug 2016 Health Care 0.07%
EMERGENT BIOSOLUTIONS INC EBS Dec 2015 Health Care 2.20%
GILEAD SCIENCES INC GILD May 2014 Health Care 1.88%
LABORATORY CRP OF AMER HLDGS LH May 2017 Health Care 2.70%
HEALTH CARE SELECT SECTOR XLV May 2016 Health Care 3.04%
AIRBUS SE - UNSP ADR EADSY Dec 2015 Industrials 2.03%
ROPER TECHNOLOGIES INC ROP May 2016 Industrials 4.26%
SNAP ON INC SNA May 2016 Industrials 1.55%
UNION PACIFIC CORP UNP May 2014 Industrials 2.18%
AMEX INDUSTRIAL SPDR XLI May 2011 Industrials 2.89%
CORNING INC GLW May 2011 Information Technology 4.96%
FACEBOOK INC FB May 2016 Information Technology 3.27%
PALO ALTO NETWORKS INC PANW Dec 2014 Information Technology 5.22%
PAYCOM SOFTWARE INC PAYC Dec 2015 Information Technology 4.58%
VISA INC-CLASS A SHRS V May 2015 Information Technology 5.34%
CHASE CORP CCF May 2017 Materials 3.06%
LYONDELLBASELL INDU-CL A LYB May 2014 Materials 1.94%
AMERICAN TOWER CORP AMT May 2011 Real Estate 1.30%
FIRST INDL RLTY TR INC COM FR May 2017 Real Estate 3.12%
T-MOBILE US INC TMUS May 2013 Telecommunication Services 2.33%
AQUA AMERICA INC WTR Dec 2015 Utilities 1.74%
WF 100% TREAS MM INSTL #3177 Cash N/A Cash 0.47%
15
Fund Performance While the ultimate purpose of The Greystone Equity Fund is to serve as a vehicle through which
students can learn to perform research and to make decisions, we do nevertheless compare the
performance of the Fund to that of the S&P 500 for which it is benchmarked.
Market Volatility Market performance has been characterized by unusually low volatility, as shown in Figure 9. While this
phenomenon is typically associated with investor optimism, there may be technical reasons (such as
increased use of put-selling strategies, for example) that have contributed to current low VIX levels.
FIGURE 9 – EQUITY MARKET VOLATILITY
Value Versus Growth Another phenomenon that is unusual is the recent overperformance of growth stocks relative to their
value peers, as reflected in Figure 10. This is likely due to the secular shift in the economy characterized
by the growth of technology companies such as Facebook, Amazon, Netflix and Alphabet/Google (the
“FANGs”). If history is any benchmark, the advantage should tilt back to value stocks in the future, but
for now portfolios that focus on value will exhibit results that are slightly disappointing relative to their
growth peers, and to the S&P 500 which numbers the FANG stocks among its constituents.
FIGURE 10 – COMPARATIVE OUT-PERFORMANCE OF GROWTH STOCKS
16
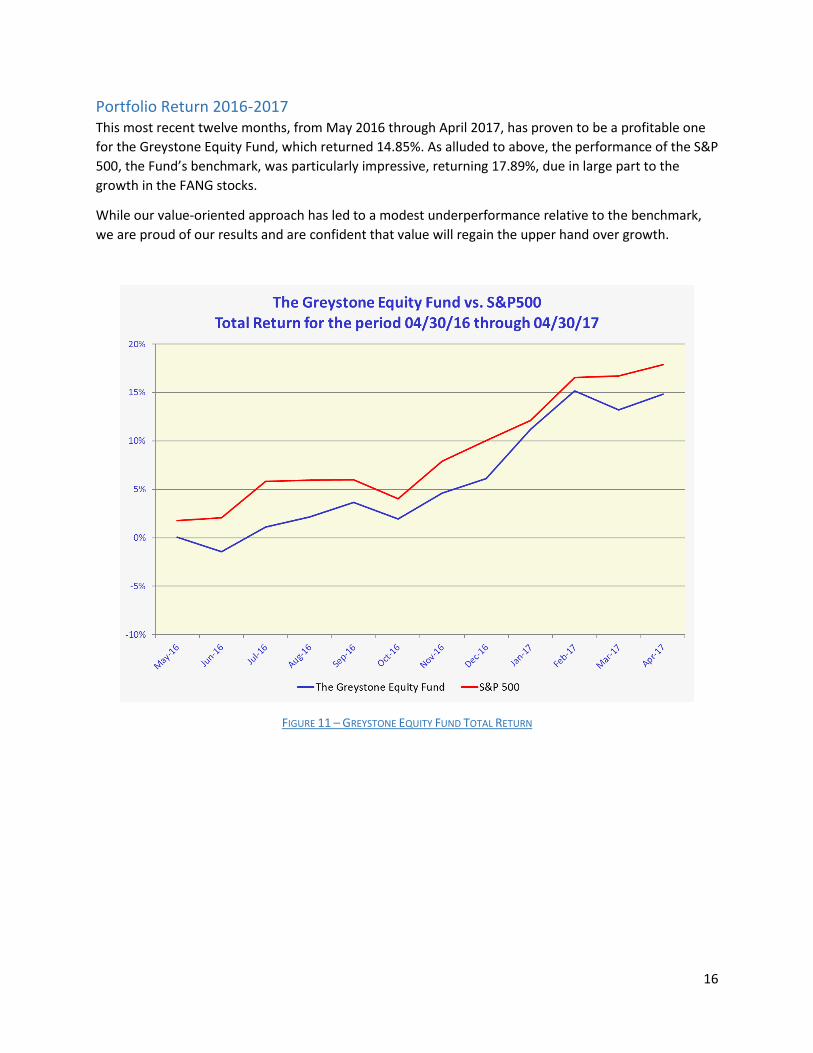
Portfolio Return 2016-2017 This most recent twelve months, from May 2016 through April 2017, has proven to be a profitable one
for the Greystone Equity Fund, which returned 14.85%. As alluded to above, the performance of the S&P
500, the Fund’s benchmark, was particularly impressive, returning 17.89%, due in large part to the
growth in the FANG stocks.
While our value-oriented approach has led to a modest underperformance relative to the benchmark,
we are proud of our results and are confident that value will regain the upper hand over growth.
FIGURE 11 – GREYSTONE EQUITY FUND TOTAL RETURN
17
Holdings Analysis
Consumer Discretionary The Consumer Discretionary sector consists of companies that sell nonessential goods and services.
Major industries within this sector include: Consumer Services, Retailing, Media, Automobiles &
Components, and Consumer Durables & Apparel. The Consumer Discretionary sector tends to be
sensitive to economic cycles, and is impacted by changes in key economic indicators, such as disposable
income, unemployment rate, consumer confidence, and interest rates. The Consumer Discretionary
sector is the fourth largest sector within the S&P 500, amounting to a 12.50% weight of the total index.
The Greystone Fund has slightly over-weighted the sector with an allocation of 12.62%, due to our
confidence in the increasing strength of the U.S. consumer and economy.
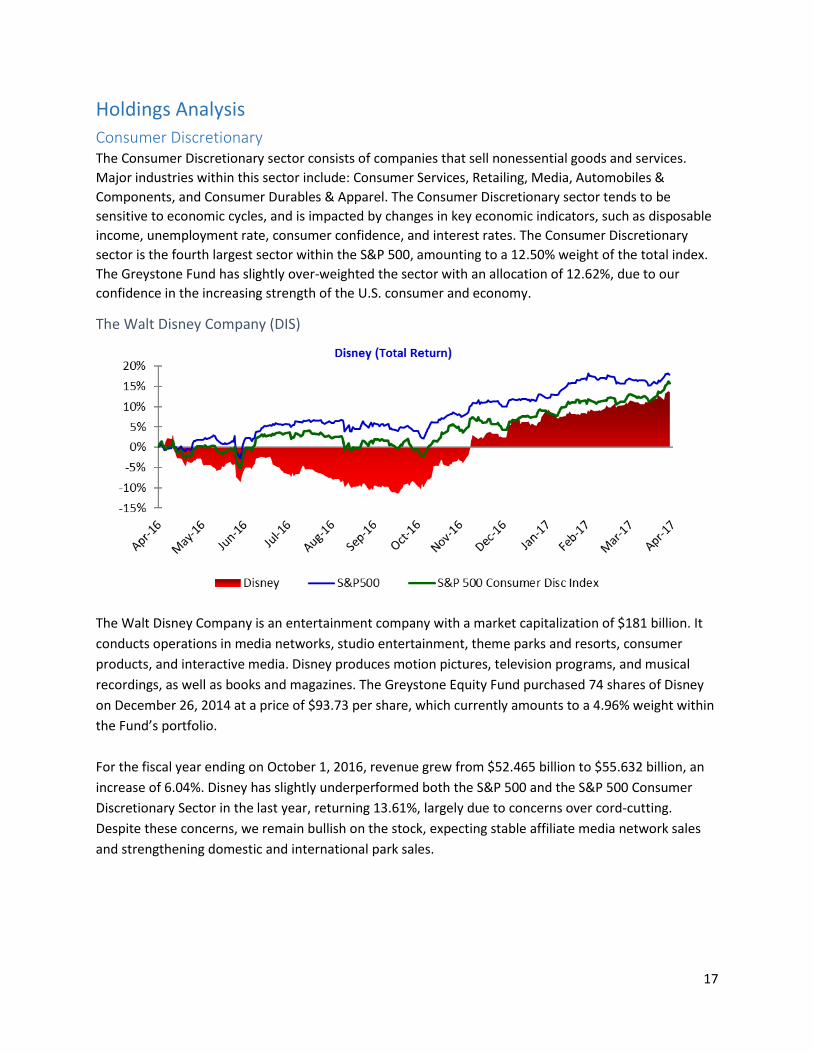
The Walt Disney Company (DIS)
The Walt Disney Company is an entertainment company with a market capitalization of $181 billion. It
conducts operations in media networks, studio entertainment, theme parks and resorts, consumer
products, and interactive media. Disney produces motion pictures, television programs, and musical
recordings, as well as books and magazines. The Greystone Equity Fund purchased 74 shares of Disney
on December 26, 2014 at a price of $93.73 per share, which currently amounts to a 4.96% weight within
the Fund’s portfolio.
For the fiscal year ending on October 1, 2016, revenue grew from $52.465 billion to $55.632 billion, an
increase of 6.04%. Disney has slightly underperformed both the S&P 500 and the S&P 500 Consumer
Discretionary Sector in the last year, returning 13.61%, largely due to concerns over cord-cutting.
Despite these concerns, we remain bullish on the stock, expecting stable affiliate media network sales
and strengthening domestic and international park sales.
18
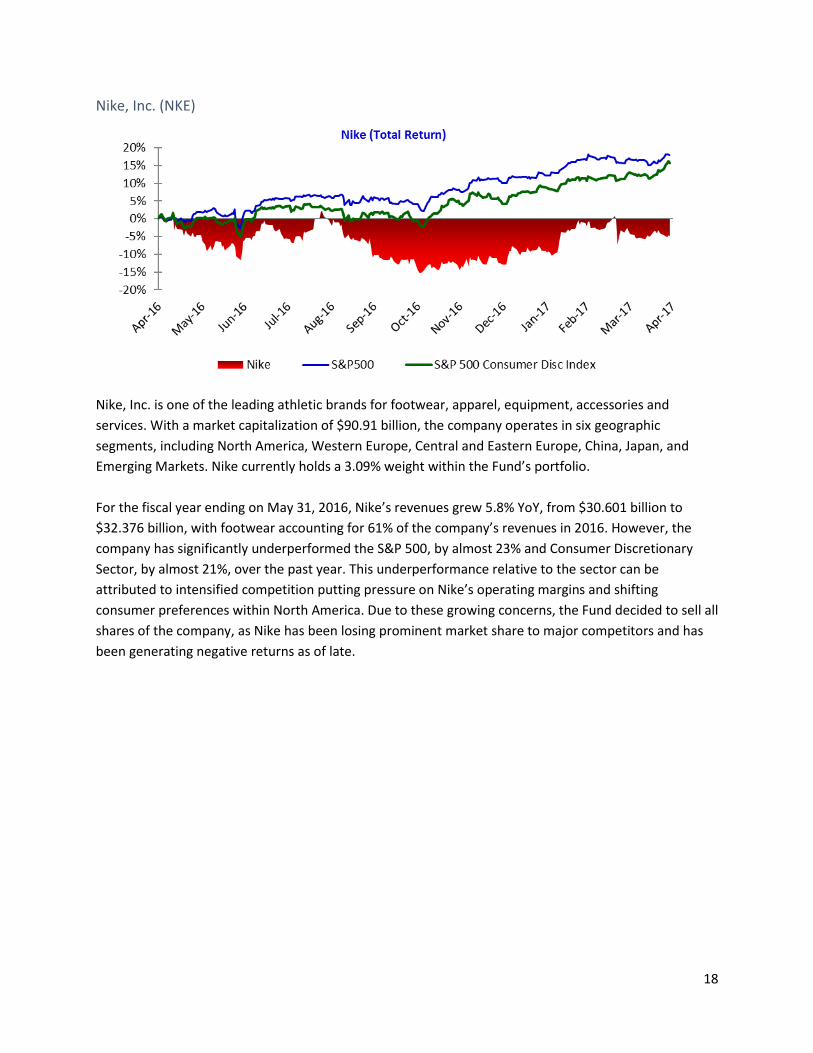
Nike, Inc. (NKE)
Nike, Inc. is one of the leading athletic brands for footwear, apparel, equipment, accessories and
services. With a market capitalization of $90.91 billion, the company operates in six geographic
segments, including North America, Western Europe, Central and Eastern Europe, China, Japan, and
Emerging Markets. Nike currently holds a 3.09% weight within the Fund’s portfolio.
For the fiscal year ending on May 31, 2016, Nike’s revenues grew 5.8% YoY, from $30.601 billion to
$32.376 billion, with footwear accounting for 61% of the company’s revenues in 2016. However, the
company has significantly underperformed the S&P 500, by almost 23% and Consumer Discretionary
Sector, by almost 21%, over the past year. This underperformance relative to the sector can be
attributed to intensified competition putting pressure on Nike’s operating margins and shifting
consumer preferences within North America. Due to these growing concerns, the Fund decided to sell all
shares of the company, as Nike has been losing prominent market share to major competitors and has
been generating negative returns as of late.
19
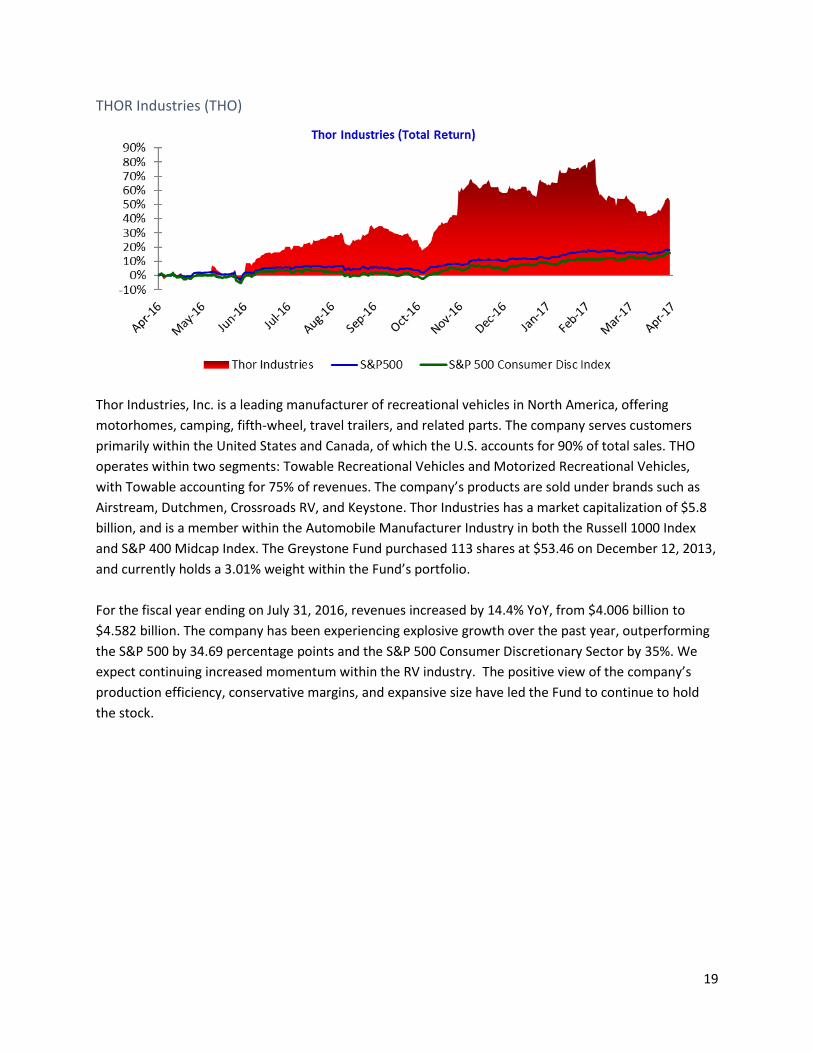
THOR Industries (THO)
Thor Industries, Inc. is a leading manufacturer of recreational vehicles in North America, offering
motorhomes, camping, fifth-wheel, travel trailers, and related parts. The company serves customers
primarily within the United States and Canada, of which the U.S. accounts for 90% of total sales. THO
operates within two segments: Towable Recreational Vehicles and Motorized Recreational Vehicles,
with Towable accounting for 75% of revenues. The company’s products are sold under brands such as
Airstream, Dutchmen, Crossroads RV, and Keystone. Thor Industries has a market capitalization of $5.8
billion, and is a member within the Automobile Manufacturer Industry in both the Russell 1000 Index
and S&P 400 Midcap Index. The Greystone Fund purchased 113 shares at $53.46 on December 12, 2013,
and currently holds a 3.01% weight within the Fund’s portfolio.
For the fiscal year ending on July 31, 2016, revenues increased by 14.4% YoY, from $4.006 billion to
$4.582 billion. The company has been experiencing explosive growth over the past year, outperforming
the S&P 500 by 34.69 percentage points and the S&P 500 Consumer Discretionary Sector by 35%. We
expect continuing increased momentum within the RV industry. The positive view of the company’s
production efficiency, conservative margins, and expansive size have led the Fund to continue to hold
the stock.
20
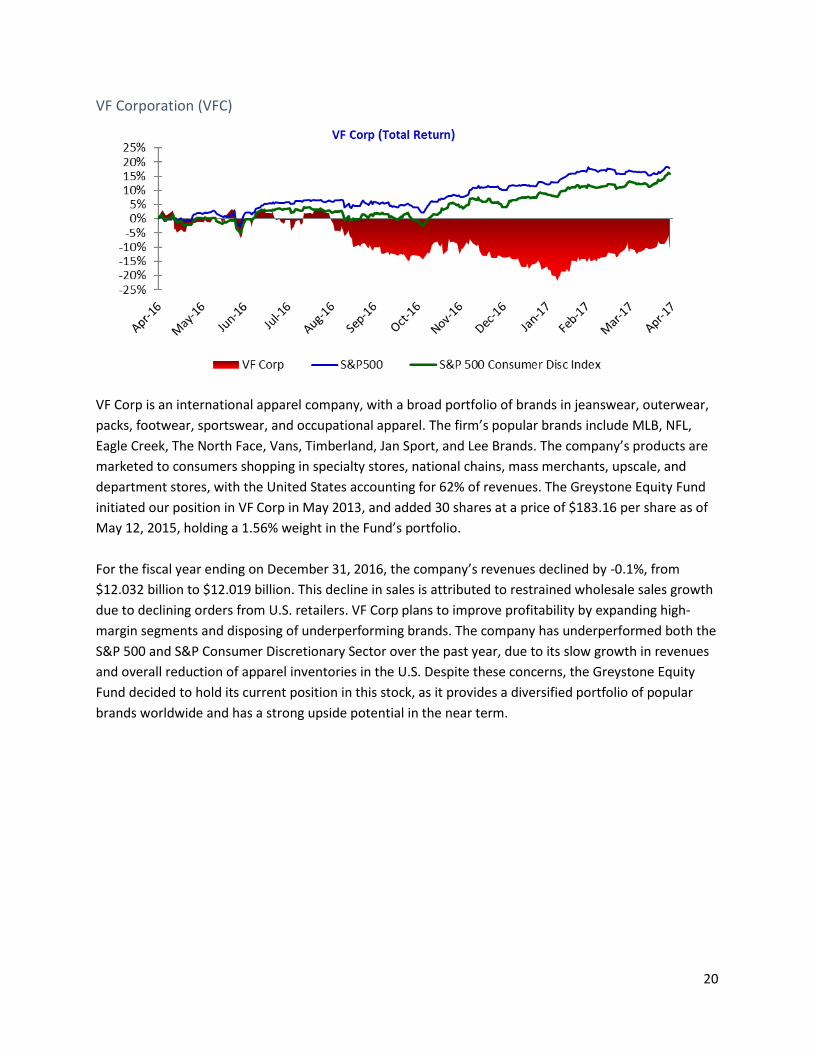
VF Corporation (VFC)
VF Corp is an international apparel company, with a broad portfolio of brands in jeanswear, outerwear,
packs, footwear, sportswear, and occupational apparel. The firm’s popular brands include MLB, NFL,
Eagle Creek, The North Face, Vans, Timberland, Jan Sport, and Lee Brands. The company’s products are
marketed to consumers shopping in specialty stores, national chains, mass merchants, upscale, and
department stores, with the United States accounting for 62% of revenues. The Greystone Equity Fund
initiated our position in VF Corp in May 2013, and added 30 shares at a price of $183.16 per share as of
May 12, 2015, holding a 1.56% weight in the Fund’s portfolio.
For the fiscal year ending on December 31, 2016, the company’s revenues declined by -0.1%, from
$12.032 billion to $12.019 billion. This decline in sales is attributed to restrained wholesale sales growth
due to declining orders from U.S. retailers. VF Corp plans to improve profitability by expanding high-
margin segments and disposing of underperforming brands. The company has underperformed both the
S&P 500 and S&P Consumer Discretionary Sector over the past year, due to its slow growth in revenues
and overall reduction of apparel inventories in the U.S. Despite these concerns, the Greystone Equity
Fund decided to hold its current position in this stock, as it provides a diversified portfolio of popular
brands worldwide and has a strong upside potential in the near term.
21
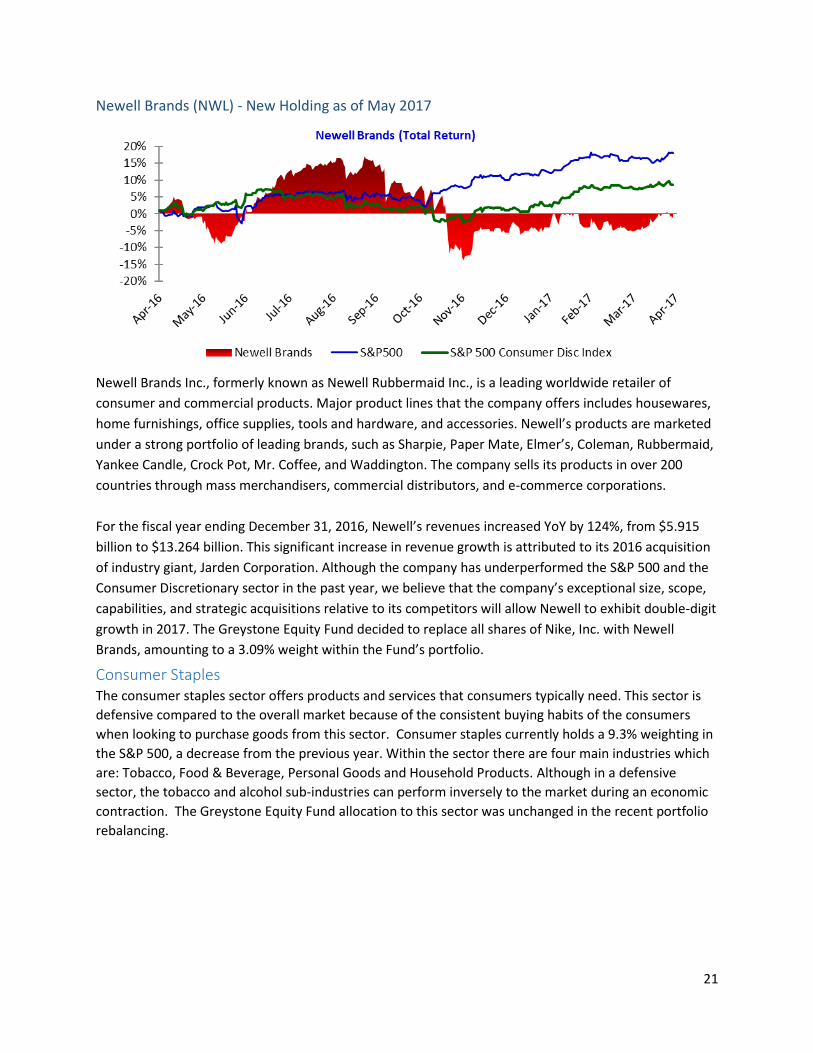
Newell Brands (NWL) - New Holding as of May 2017
Newell Brands Inc., formerly known as Newell Rubbermaid Inc., is a leading worldwide retailer of
consumer and commercial products. Major product lines that the company offers includes housewares,
home furnishings, office supplies, tools and hardware, and accessories. Newell’s products are marketed
under a strong portfolio of leading brands, such as Sharpie, Paper Mate, Elmer’s, Coleman, Rubbermaid,
Yankee Candle, Crock Pot, Mr. Coffee, and Waddington. The company sells its products in over 200
countries through mass merchandisers, commercial distributors, and e-commerce corporations.
For the fiscal year ending December 31, 2016, Newell’s revenues increased YoY by 124%, from $5.915
billion to $13.264 billion. This significant increase in revenue growth is attributed to its 2016 acquisition
of industry giant, Jarden Corporation. Although the company has underperformed the S&P 500 and the
Consumer Discretionary sector in the past year, we believe that the company’s exceptional size, scope,
capabilities, and strategic acquisitions relative to its competitors will allow Newell to exhibit double-digit
growth in 2017. The Greystone Equity Fund decided to replace all shares of Nike, Inc. with Newell
Brands, amounting to a 3.09% weight within the Fund’s portfolio.
Consumer Staples The consumer staples sector offers products and services that consumers typically need. This sector is
defensive compared to the overall market because of the consistent buying habits of the consumers
when looking to purchase goods from this sector. Consumer staples currently holds a 9.3% weighting in
the S&P 500, a decrease from the previous year. Within the sector there are four main industries which
are: Tobacco, Food & Beverage, Personal Goods and Household Products. Although in a defensive
sector, the tobacco and alcohol sub-industries can perform inversely to the market during an economic
contraction. The Greystone Equity Fund allocation to this sector was unchanged in the recent portfolio
rebalancing.
22
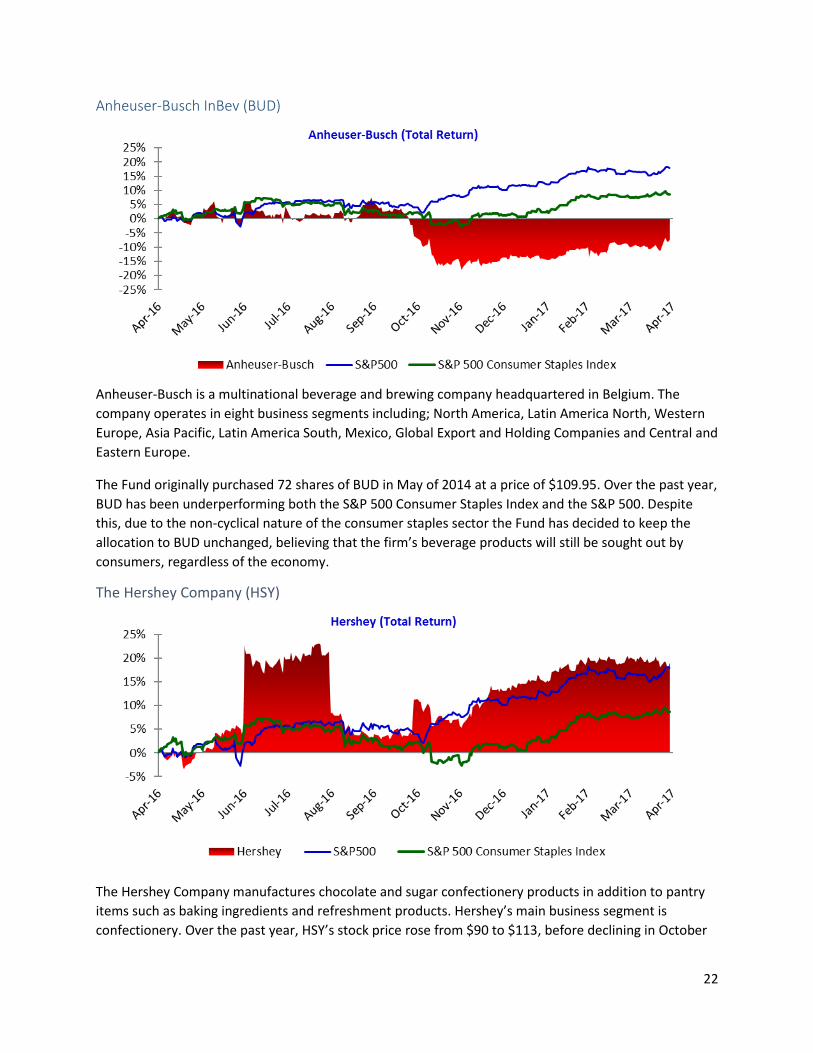
Anheuser-Busch InBev (BUD)
Anheuser-Busch is a multinational beverage and brewing company headquartered in Belgium. The
company operates in eight business segments including; North America, Latin America North, Western
Europe, Asia Pacific, Latin America South, Mexico, Global Export and Holding Companies and Central and
Eastern Europe.
The Fund originally purchased 72 shares of BUD in May of 2014 at a price of $109.95. Over the past year,
BUD has been underperforming both the S&P 500 Consumer Staples Index and the S&P 500. Despite
this, due to the non-cyclical nature of the consumer staples sector the Fund has decided to keep the
allocation to BUD unchanged, believing that the firm’s beverage products will still be sought out by
consumers, regardless of the economy.
The Hershey Company (HSY)
The Hershey Company manufactures chocolate and sugar confectionery products in addition to pantry
items such as baking ingredients and refreshment products. Hershey’s main business segment is
confectionery. Over the past year, HSY’s stock price rose from $90 to $113, before declining in October
23
2016 when the price fell again to $95. Since that decrease, the share price has recovered. HSY was
originally bought for 21 shares at $108.20 at a weighting of 1.47% of the total Fund. Due to its consistent
dividend history, the Fund voted to keep the weighting of Hershey consistent at the 1.47% weighting
moving forward into the next semester.
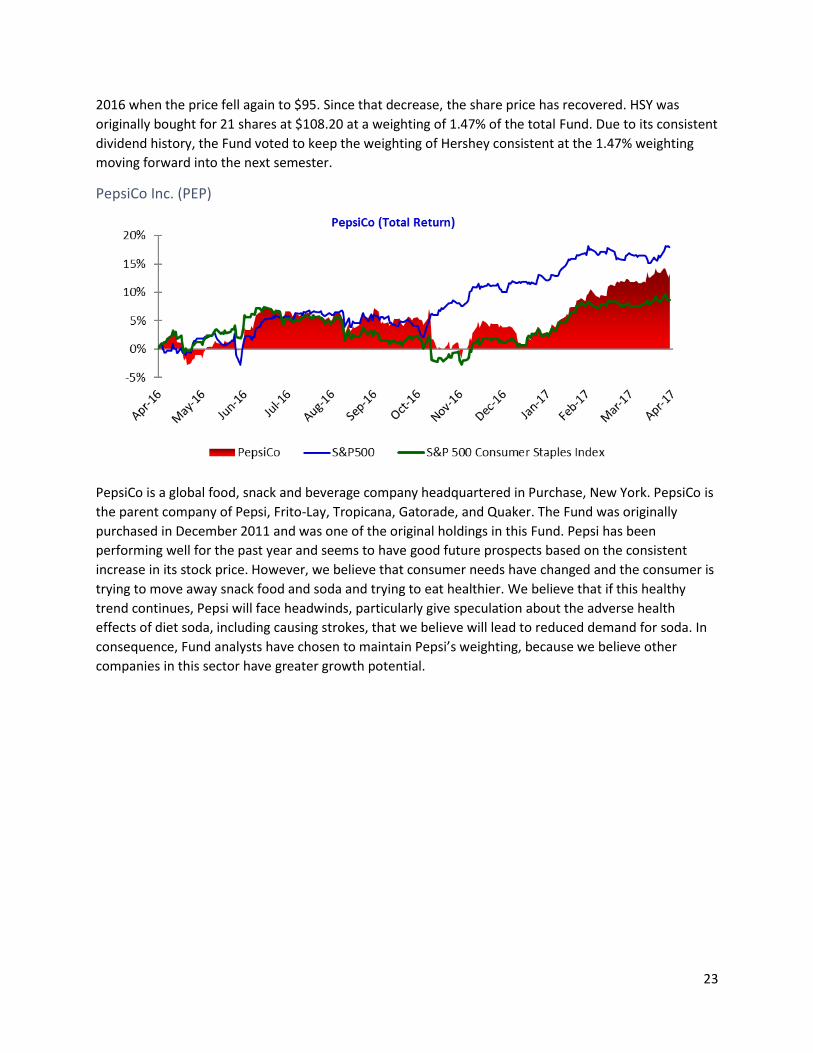
PepsiCo Inc. (PEP)
PepsiCo is a global food, snack and beverage company headquartered in Purchase, New York. PepsiCo is
the parent company of Pepsi, Frito-Lay, Tropicana, Gatorade, and Quaker. The Fund was originally
purchased in December 2011 and was one of the original holdings in this Fund. Pepsi has been
performing well for the past year and seems to have good future prospects based on the consistent
increase in its stock price. However, we believe that consumer needs have changed and the consumer is
trying to move away snack food and soda and trying to eat healthier. We believe that if this healthy
trend continues, Pepsi will face headwinds, particularly give speculation about the adverse health
effects of diet soda, including causing strokes, that we believe will lead to reduced demand for soda. In
consequence, Fund analysts have chosen to maintain Pepsi’s weighting, because we believe other
companies in this sector have greater growth potential.
24
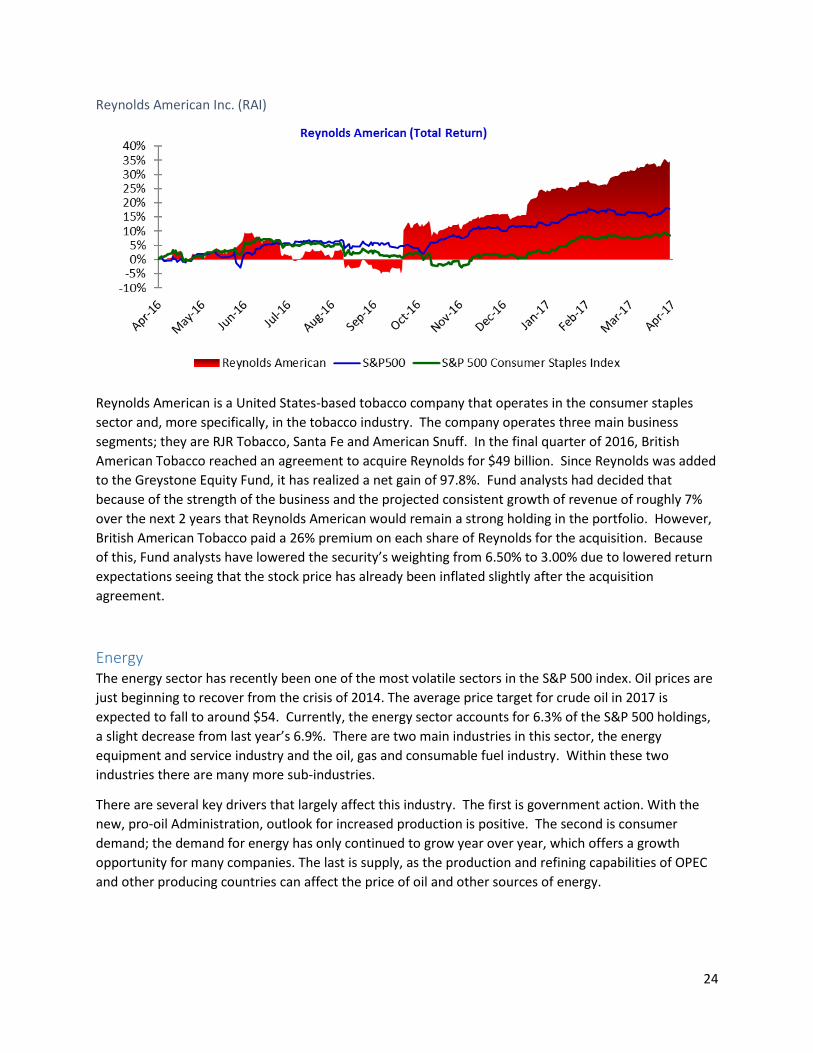
Reynolds American Inc. (RAI)
Reynolds American is a United States-based tobacco company that operates in the consumer staples
sector and, more specifically, in the tobacco industry. The company operates three main business
segments; they are RJR Tobacco, Santa Fe and American Snuff. In the final quarter of 2016, British
American Tobacco reached an agreement to acquire Reynolds for $49 billion. Since Reynolds was added
to the Greystone Equity Fund, it has realized a net gain of 97.8%. Fund analysts had decided that
because of the strength of the business and the projected consistent growth of revenue of roughly 7%
over the next 2 years that Reynolds American would remain a strong holding in the portfolio. However,
British American Tobacco paid a 26% premium on each share of Reynolds for the acquisition. Because
of this, Fund analysts have lowered the security’s weighting from 6.50% to 3.00% due to lowered return
expectations seeing that the stock price has already been inflated slightly after the acquisition
agreement.
Energy The energy sector has recently been one of the most volatile sectors in the S&P 500 index. Oil prices are
just beginning to recover from the crisis of 2014. The average price target for crude oil in 2017 is
expected to fall to around $54. Currently, the energy sector accounts for 6.3% of the S&P 500 holdings,
a slight decrease from last year’s 6.9%. There are two main industries in this sector, the energy
equipment and service industry and the oil, gas and consumable fuel industry. Within these two
industries there are many more sub-industries.
There are several key drivers that largely affect this industry. The first is government action. With the
new, pro-oil Administration, outlook for increased production is positive. The second is consumer
demand; the demand for energy has only continued to grow year over year, which offers a growth
opportunity for many companies. The last is supply, as the production and refining capabilities of OPEC
and other producing countries can affect the price of oil and other sources of energy.

25
Diamondback Energy Inc. (FANG)
Diamondback Energy Inc. is an independent oil and natural gas company currently focused on the
acquisition, development, exploration, and exploitation of unconventional onshore and natural gas
reserves in the Permian Basin in West Texas. Diamondback’s current growth strategy includes boosting
production and reserves by developing their current oil-rich resource base, focusing on increasing
hydrocarbon recovery through horizontal drilling and increased well density, as well as pursuing
strategic acquisitions with oil resource potential.
Fund analysts believe that Diamondback still holds immense growth potential for 2017 due to their
recent acquisition of Brigham Resources Operating and Brigham Resources Midstream, LLC. With this
purchase we expect Diamondback to gain 73,000 acres of drillable land in Texas’ Delaware Basin.
Revenues in Q4 of 2016 grew by 30% from the previous quarter and are expected to grow 125% in 2017
to $1.19 billion, with a commensurate increase in earnings throughout the year.
Diamondback Energy was admitted to the Fund on May 23, 2014 at a price of $72.78. As of April 28,
2017 the price was $99.84. This represents a gain of about 37.18% since inception. This company has
brought strong returns to the Fund and because of that the analysts have chosen to hold the current
position of Diamondback, which currently accounts for 6.39% of the Fund.
Financials The financial sector is divided into six categories; asset management, banking, institutional financial
services, insurance, real estate/REIT, and specialty finance. It is the second largest in the S&P 500,
comprising 14.10% of the overall index. Financial firms generally provide financial services to retail and
commercial clients, and the sector is sensitive to the interest rate environment due to the nature of the
business the companies within the sector conduct. At this point in time, there is a rather bullish outlook
for the financial sector. With interest rates on track to rise two to three times in 2017, financial
institutions will experience an increase in interest revenue, as customers will be charged a higher rate
for their respective banks’ products and services. Deregulation under the Trump Administration also
contributes to this bullish outlook, as the new Administration is aiming to repeal some of the many
regulations that have been inhibiting banks over the past few years.
26
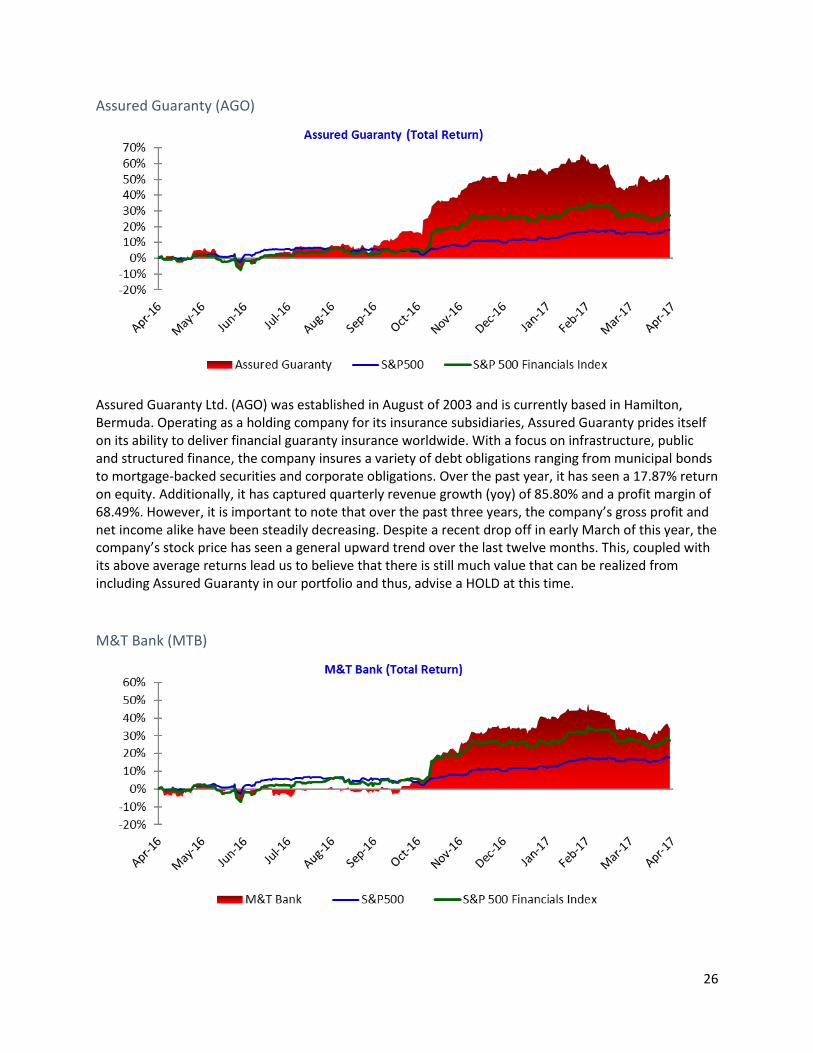
Assured Guaranty (AGO)
Assured Guaranty Ltd. (AGO) was established in August of 2003 and is currently based in Hamilton, Bermuda. Operating as a holding company for its insurance subsidiaries, Assured Guaranty prides itself on its ability to deliver financial guaranty insurance worldwide. With a focus on infrastructure, public and structured finance, the company insures a variety of debt obligations ranging from municipal bonds to mortgage-backed securities and corporate obligations. Over the past year, it has seen a 17.87% return on equity. Additionally, it has captured quarterly revenue growth (yoy) of 85.80% and a profit margin of 68.49%. However, it is important to note that over the past three years, the company’s gross profit and net income alike have been steadily decreasing. Despite a recent drop off in early March of this year, the company’s stock price has seen a general upward trend over the last twelve months. This, coupled with its above average returns lead us to believe that there is still much value that can be realized from including Assured Guaranty in our portfolio and thus, advise a HOLD at this time.
M&T Bank (MTB)
27
M&T Bank Corporation (MTB) was founded in 1856 and is currently headquartered in Buffalo. MTB is a
bank holding company that, through its banking subsidiaries, offers a variety of commercial banking,
trust, and investment services. It operates in six segments: Retail Banking 25%, Commercial Banking
25%, Commercial Real Estate 15%, Residential Mortgage Banking 10%, Business Banking 10%, and
Discretionary Portfolio 15%. It has offices in New York, Maryland, Pennsylvania, Delaware, New Jersey,
Virginia, West Virginia and the District of Columbia and its current strategy is to expand into the mid-
Atlantic region. M&T Bank’s revenue and profits have been increasing over the past few years, mainly
due to their growing loan business that is derived from their recent bank acquisitions. In 2016 net
revenue increased 13.5%, when in 2015 it only increased by 4.8%. This upward trend, with favorable
market conditions leads the group’s decision to be a HOLD.
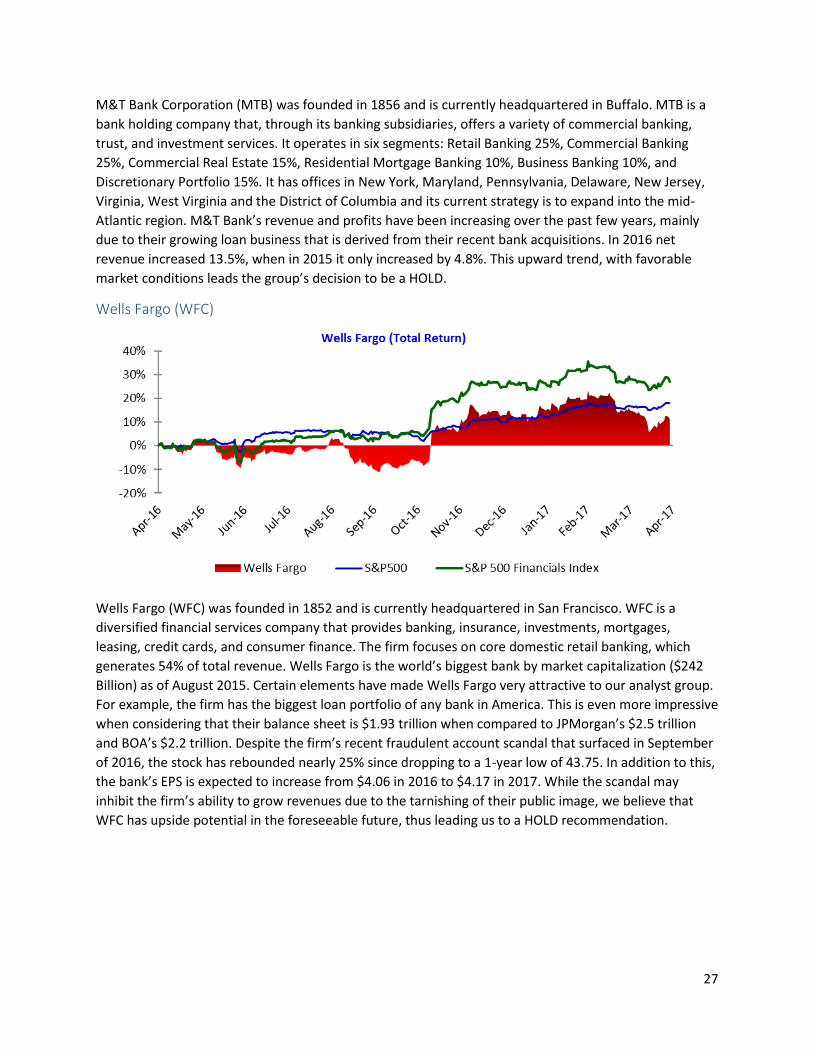
Wells Fargo (WFC)
Wells Fargo (WFC) was founded in 1852 and is currently headquartered in San Francisco. WFC is a
diversified financial services company that provides banking, insurance, investments, mortgages,
leasing, credit cards, and consumer finance. The firm focuses on core domestic retail banking, which
generates 54% of total revenue. Wells Fargo is the world’s biggest bank by market capitalization ($242
Billion) as of August 2015. Certain elements have made Wells Fargo very attractive to our analyst group.
For example, the firm has the biggest loan portfolio of any bank in America. This is even more impressive
when considering that their balance sheet is $1.93 trillion when compared to JPMorgan’s $2.5 trillion
and BOA’s $2.2 trillion. Despite the firm’s recent fraudulent account scandal that surfaced in September
of 2016, the stock has rebounded nearly 25% since dropping to a 1-year low of 43.75. In addition to this,
the bank’s EPS is expected to increase from $4.06 in 2016 to $4.17 in 2017. While the scandal may
inhibit the firm’s ability to grow revenues due to the tarnishing of their public image, we believe that
WFC has upside potential in the foreseeable future, thus leading us to a HOLD recommendation.
28
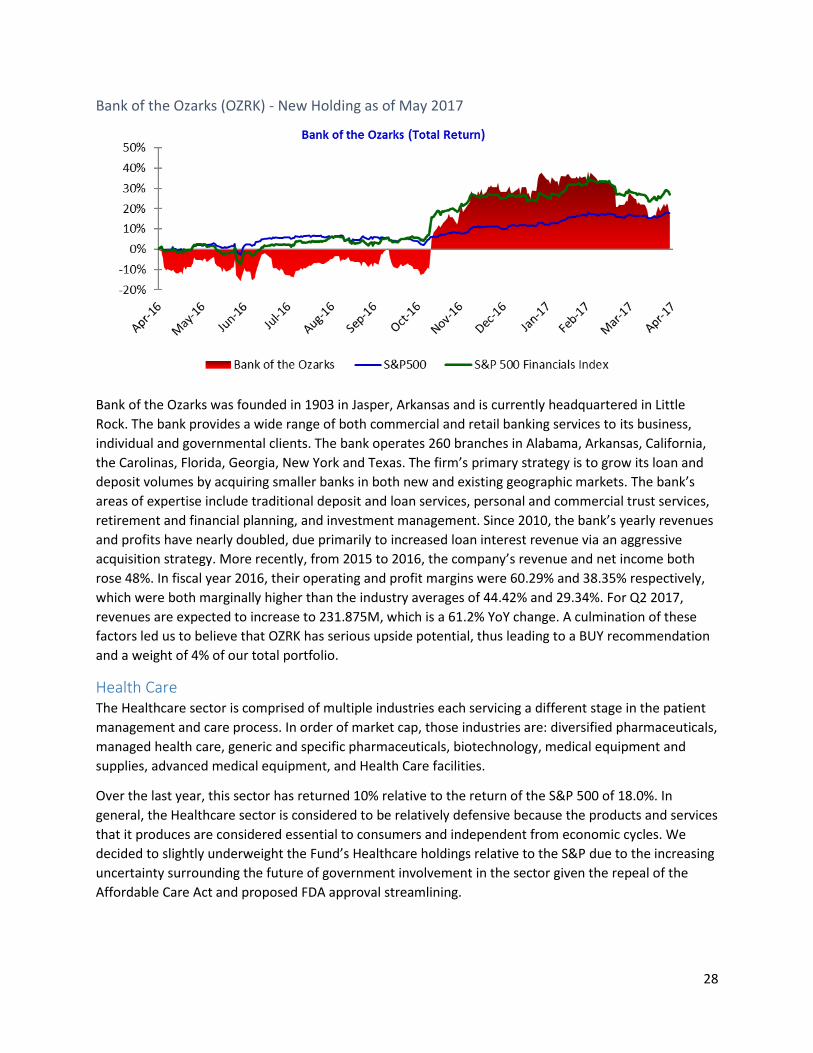
Bank of the Ozarks (OZRK) - New Holding as of May 2017
Bank of the Ozarks was founded in 1903 in Jasper, Arkansas and is currently headquartered in Little
Rock. The bank provides a wide range of both commercial and retail banking services to its business,
individual and governmental clients. The bank operates 260 branches in Alabama, Arkansas, California,
the Carolinas, Florida, Georgia, New York and Texas. The firm’s primary strategy is to grow its loan and
deposit volumes by acquiring smaller banks in both new and existing geographic markets. The bank’s
areas of expertise include traditional deposit and loan services, personal and commercial trust services,
retirement and financial planning, and investment management. Since 2010, the bank’s yearly revenues
and profits have nearly doubled, due primarily to increased loan interest revenue via an aggressive
acquisition strategy. More recently, from 2015 to 2016, the company’s revenue and net income both
rose 48%. In fiscal year 2016, their operating and profit margins were 60.29% and 38.35% respectively,
which were both marginally higher than the industry averages of 44.42% and 29.34%. For Q2 2017,
revenues are expected to increase to 231.875M, which is a 61.2% YoY change. A culmination of these
factors led us to believe that OZRK has serious upside potential, thus leading to a BUY recommendation
and a weight of 4% of our total portfolio.
Health Care The Healthcare sector is comprised of multiple industries each servicing a different stage in the patient
management and care process. In order of market cap, those industries are: diversified pharmaceuticals,
managed health care, generic and specific pharmaceuticals, biotechnology, medical equipment and
supplies, advanced medical equipment, and Health Care facilities.
Over the last year, this sector has returned 10% relative to the return of the S&P 500 of 18.0%. In
general, the Healthcare sector is considered to be relatively defensive because the products and services
that it produces are considered essential to consumers and independent from economic cycles. We
decided to slightly underweight the Fund’s Healthcare holdings relative to the S&P due to the increasing
uncertainty surrounding the future of government involvement in the sector given the repeal of the
Affordable Care Act and proposed FDA approval streamlining.
29
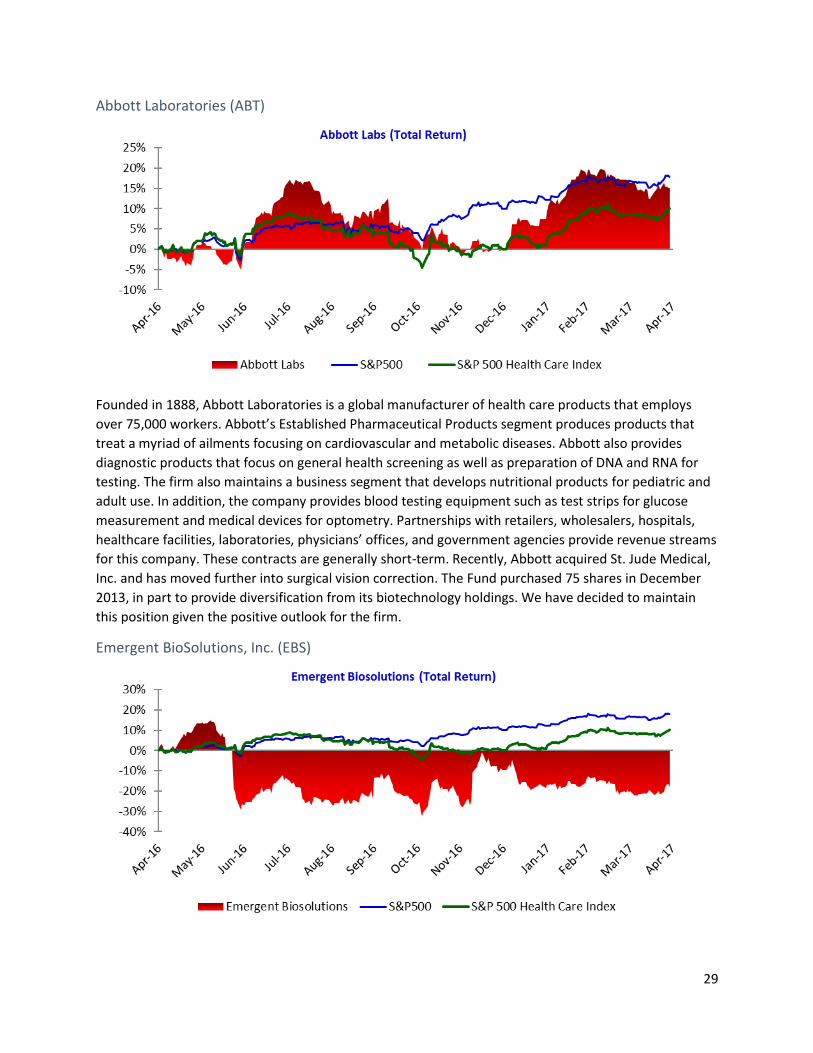
Abbott Laboratories (ABT)
Founded in 1888, Abbott Laboratories is a global manufacturer of health care products that employs
over 75,000 workers. Abbott’s Established Pharmaceutical Products segment produces products that
treat a myriad of ailments focusing on cardiovascular and metabolic diseases. Abbott also provides
diagnostic products that focus on general health screening as well as preparation of DNA and RNA for
testing. The firm also maintains a business segment that develops nutritional products for pediatric and
adult use. In addition, the company provides blood testing equipment such as test strips for glucose
measurement and medical devices for optometry. Partnerships with retailers, wholesalers, hospitals,
healthcare facilities, laboratories, physicians’ offices, and government agencies provide revenue streams
for this company. These contracts are generally short-term. Recently, Abbott acquired St. Jude Medical,
Inc. and has moved further into surgical vision correction. The Fund purchased 75 shares in December
2013, in part to provide diversification from its biotechnology holdings. We have decided to maintain
this position given the positive outlook for the firm.
Emergent BioSolutions, Inc. (EBS)
30
Emergent works to provide and commercialize solutions and countermeasures for public health threats.
The company’s focus is primarily on chemical, biological, radiological, nuclear, and explosive threats, as
well as infectious diseases, with its major business lines focusing on biodefense and biosciences.
Emergent provides a vaccine called BioThrax which protects against infection from Anthrax which has
been licensed to the German Federal Ministry, the Ministry of Health in Singapore, and the CDC in the
United States, providing a stable cash flow. The Fund initiated ownership of this company in December
2015. The original investment thesis was based on Emegent’s development of an Ebola vaccine during
the media storm based around the outbreak of Ebola in Western Africa beginning in 2014. Recently the
company has worked to provide a vaccine for the Zika virus. The investment outlook for this company
remains strong based on their earnings and product pipeline. No allocative changes were made
regarding EBS.
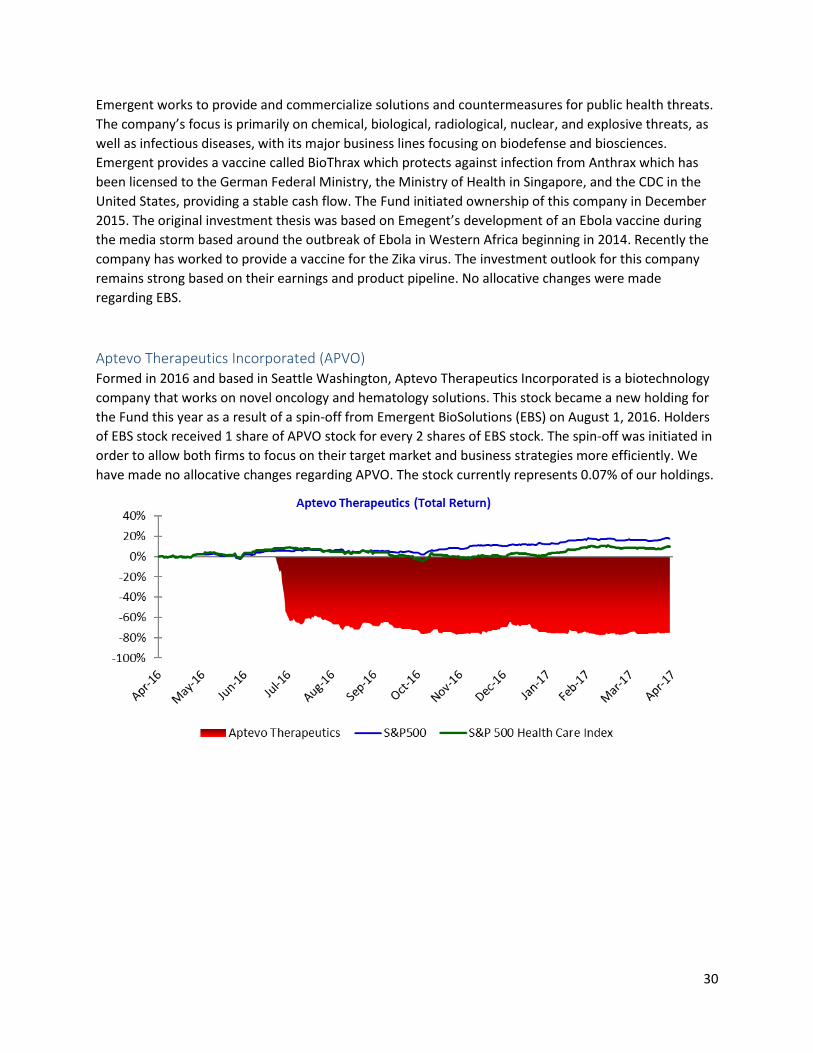
Aptevo Therapeutics Incorporated (APVO) Formed in 2016 and based in Seattle Washington, Aptevo Therapeutics Incorporated is a biotechnology
company that works on novel oncology and hematology solutions. This stock became a new holding for
the Fund this year as a result of a spin-off from Emergent BioSolutions (EBS) on August 1, 2016. Holders
of EBS stock received 1 share of APVO stock for every 2 shares of EBS stock. The spin-off was initiated in
order to allow both firms to focus on their target market and business strategies more efficiently. We
have made no allocative changes regarding APVO. The stock currently represents 0.07% of our holdings.
31
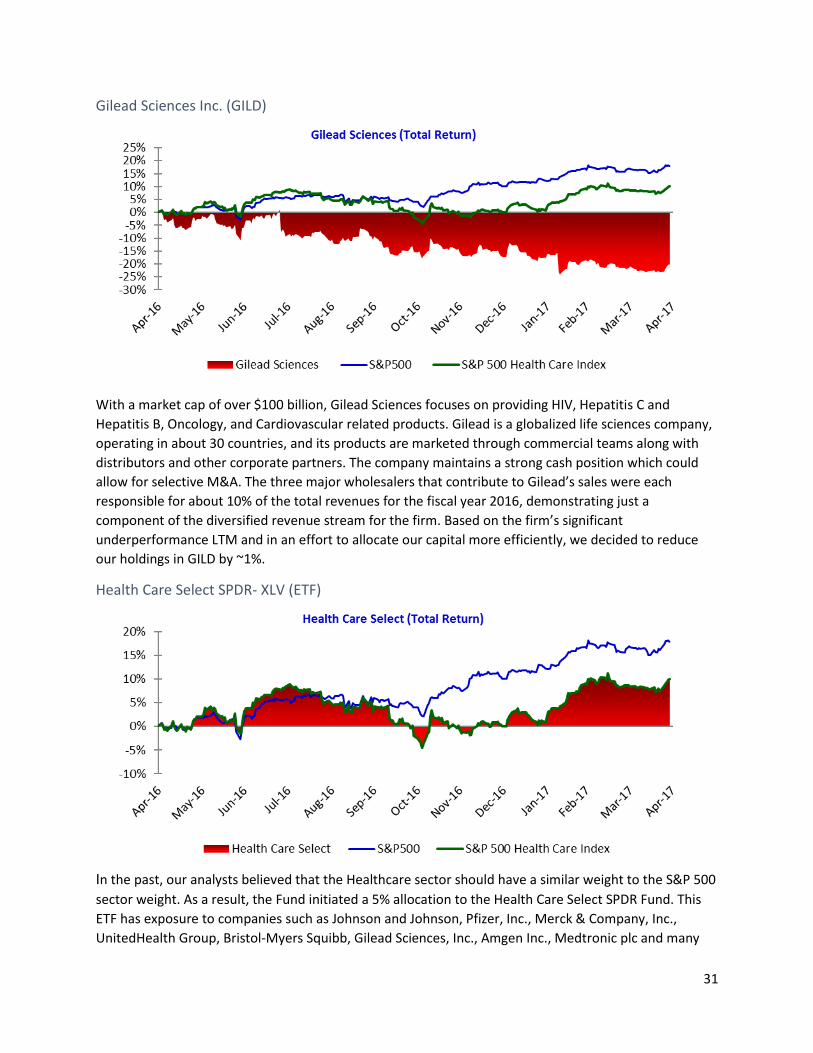
Gilead Sciences Inc. (GILD)
With a market cap of over $100 billion, Gilead Sciences focuses on providing HIV, Hepatitis C and
Hepatitis B, Oncology, and Cardiovascular related products. Gilead is a globalized life sciences company,
operating in about 30 countries, and its products are marketed through commercial teams along with
distributors and other corporate partners. The company maintains a strong cash position which could
allow for selective M&A. The three major wholesalers that contribute to Gilead’s sales were each
responsible for about 10% of the total revenues for the fiscal year 2016, demonstrating just a
component of the diversified revenue stream for the firm. Based on the firm’s significant
underperformance LTM and in an effort to allocate our capital more efficiently, we decided to reduce
our holdings in GILD by ~1%.
Health Care Select SPDR- XLV (ETF)
In the past, our analysts believed that the Healthcare sector should have a similar weight to the S&P 500
sector weight. As a result, the Fund initiated a 5% allocation to the Health Care Select SPDR Fund. This
ETF has exposure to companies such as Johnson and Johnson, Pfizer, Inc., Merck & Company, Inc.,
UnitedHealth Group, Bristol-Myers Squibb, Gilead Sciences, Inc., Amgen Inc., Medtronic plc and many
32
others. However, given changing market conditions and the identification of LabCorp as a new holding
to be invested in, we have decided to reduce our holdings of XLV to 3%.
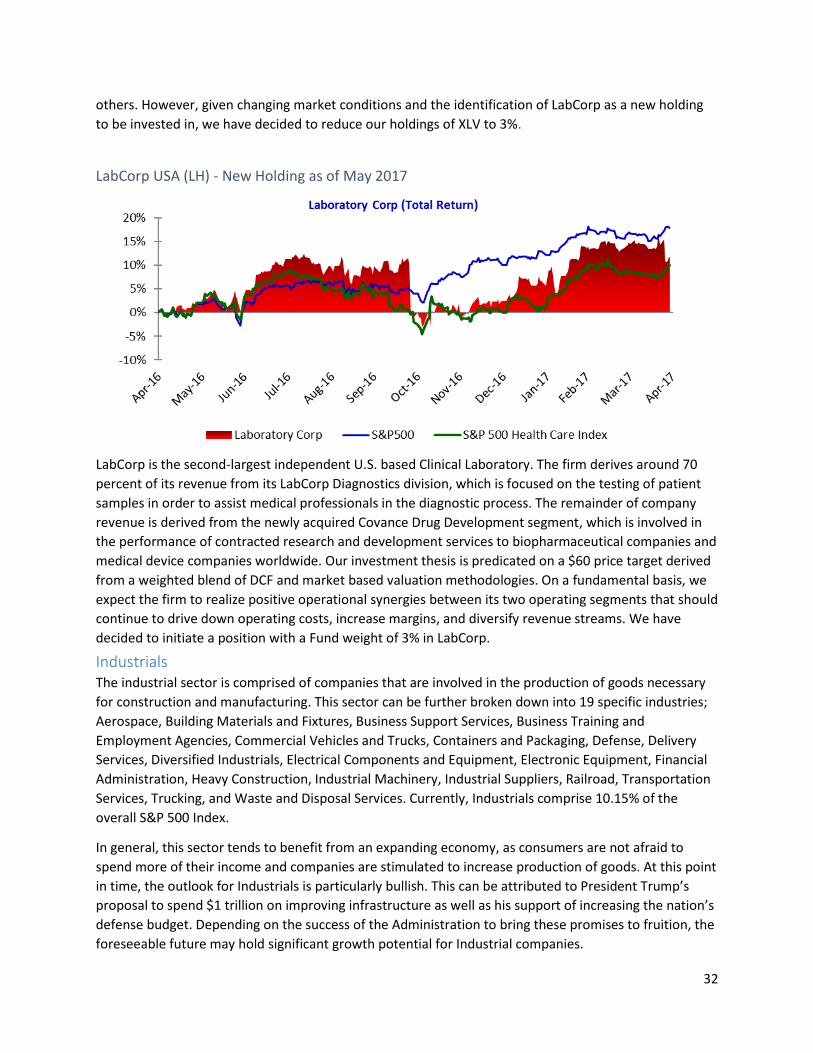
LabCorp USA (LH) - New Holding as of May 2017
LabCorp is the second-largest independent U.S. based Clinical Laboratory. The firm derives around 70
percent of its revenue from its LabCorp Diagnostics division, which is focused on the testing of patient
samples in order to assist medical professionals in the diagnostic process. The remainder of company
revenue is derived from the newly acquired Covance Drug Development segment, which is involved in
the performance of contracted research and development services to biopharmaceutical companies and
medical device companies worldwide. Our investment thesis is predicated on a $60 price target derived
from a weighted blend of DCF and market based valuation methodologies. On a fundamental basis, we
expect the firm to realize positive operational synergies between its two operating segments that should
continue to drive down operating costs, increase margins, and diversify revenue streams. We have
decided to initiate a position with a Fund weight of 3% in LabCorp.
Industrials The industrial sector is comprised of companies that are involved in the production of goods necessary
for construction and manufacturing. This sector can be further broken down into 19 specific industries;
Aerospace, Building Materials and Fixtures, Business Support Services, Business Training and
Employment Agencies, Commercial Vehicles and Trucks, Containers and Packaging, Defense, Delivery
Services, Diversified Industrials, Electrical Components and Equipment, Electronic Equipment, Financial
Administration, Heavy Construction, Industrial Machinery, Industrial Suppliers, Railroad, Transportation
Services, Trucking, and Waste and Disposal Services. Currently, Industrials comprise 10.15% of the
overall S&P 500 Index.
In general, this sector tends to benefit from an expanding economy, as consumers are not afraid to
spend more of their income and companies are stimulated to increase production of goods. At this point
in time, the outlook for Industrials is particularly bullish. This can be attributed to President Trump’s
proposal to spend $1 trillion on improving infrastructure as well as his support of increasing the nation’s
defense budget. Depending on the success of the Administration to bring these promises to fruition, the
foreseeable future may hold significant growth potential for Industrial companies.
33
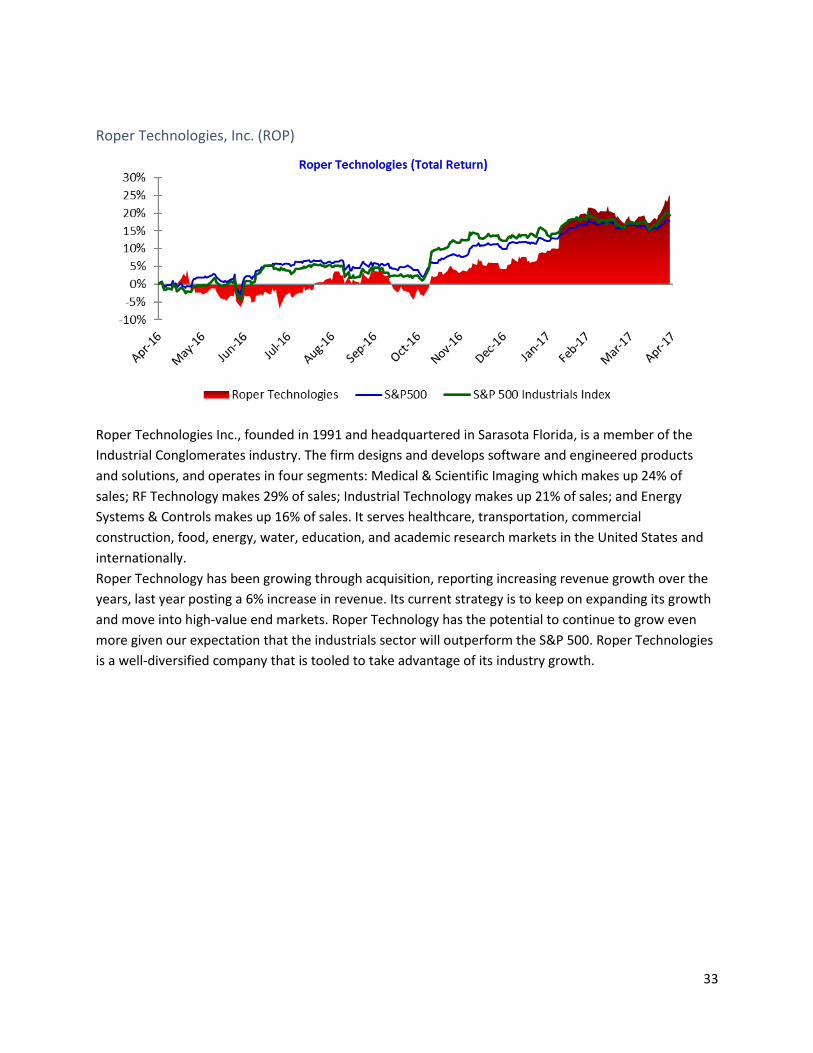
Roper Technologies, Inc. (ROP)
Roper Technologies Inc., founded in 1991 and headquartered in Sarasota Florida, is a member of the
Industrial Conglomerates industry. The firm designs and develops software and engineered products
and solutions, and operates in four segments: Medical & Scientific Imaging which makes up 24% of
sales; RF Technology makes 29% of sales; Industrial Technology makes up 21% of sales; and Energy
Systems & Controls makes up 16% of sales. It serves healthcare, transportation, commercial
construction, food, energy, water, education, and academic research markets in the United States and
internationally.
Roper Technology has been growing through acquisition, reporting increasing revenue growth over the
years, last year posting a 6% increase in revenue. Its current strategy is to keep on expanding its growth
and move into high-value end markets. Roper Technology has the potential to continue to grow even
more given our expectation that the industrials sector will outperform the S&P 500. Roper Technologies
is a well-diversified company that is tooled to take advantage of its industry growth.
34
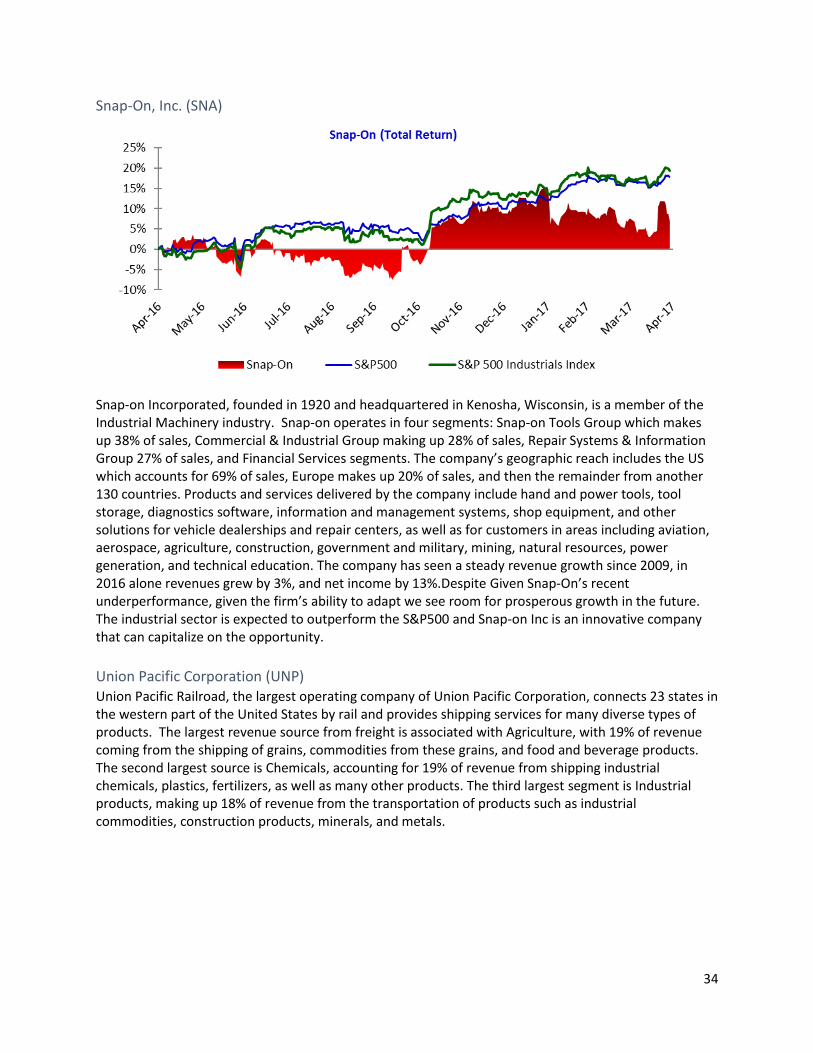
Snap-On, Inc. (SNA)
Snap-on Incorporated, founded in 1920 and headquartered in Kenosha, Wisconsin, is a member of the Industrial Machinery industry. Snap-on operates in four segments: Snap-on Tools Group which makes up 38% of sales, Commercial & Industrial Group making up 28% of sales, Repair Systems & Information Group 27% of sales, and Financial Services segments. The company’s geographic reach includes the US which accounts for 69% of sales, Europe makes up 20% of sales, and then the remainder from another 130 countries. Products and services delivered by the company include hand and power tools, tool storage, diagnostics software, information and management systems, shop equipment, and other solutions for vehicle dealerships and repair centers, as well as for customers in areas including aviation, aerospace, agriculture, construction, government and military, mining, natural resources, power generation, and technical education. The company has seen a steady revenue growth since 2009, in 2016 alone revenues grew by 3%, and net income by 13%.Despite Given Snap-On’s recent underperformance, given the firm’s ability to adapt we see room for prosperous growth in the future. The industrial sector is expected to outperform the S&P500 and Snap-on Inc is an innovative company that can capitalize on the opportunity.
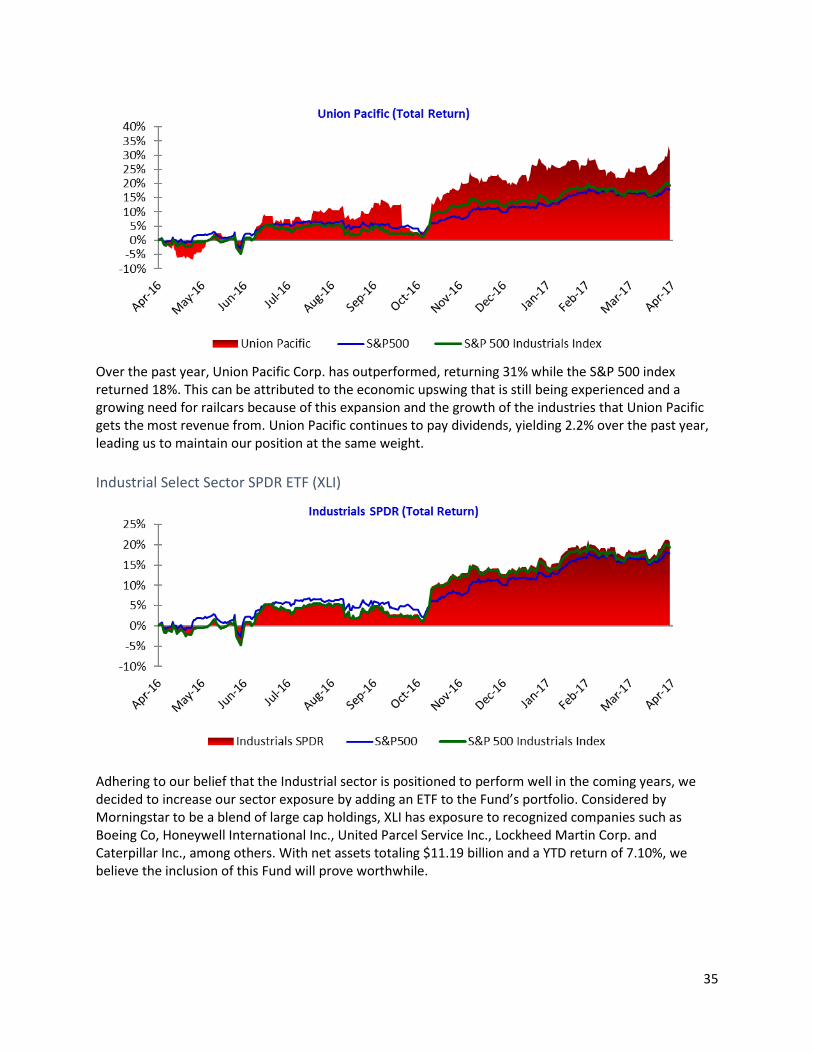
Union Pacific Corporation (UNP) Union Pacific Railroad, the largest operating company of Union Pacific Corporation, connects 23 states in the western part of the United States by rail and provides shipping services for many diverse types of products. The largest revenue source from freight is associated with Agriculture, with 19% of revenue coming from the shipping of grains, commodities from these grains, and food and beverage products. The second largest source is Chemicals, accounting for 19% of revenue from shipping industrial chemicals, plastics, fertilizers, as well as many other products. The third largest segment is Industrial products, making up 18% of revenue from the transportation of products such as industrial commodities, construction products, minerals, and metals.
35
Over the past year, Union Pacific Corp. has outperformed, returning 31% while the S&P 500 index returned 18%. This can be attributed to the economic upswing that is still being experienced and a growing need for railcars because of this expansion and the growth of the industries that Union Pacific gets the most revenue from. Union Pacific continues to pay dividends, yielding 2.2% over the past year, leading us to maintain our position at the same weight.
Industrial Select Sector SPDR ETF (XLI)
Adhering to our belief that the Industrial sector is positioned to perform well in the coming years, we decided to increase our sector exposure by adding an ETF to the Fund’s portfolio. Considered by Morningstar to be a blend of large cap holdings, XLI has exposure to recognized companies such as Boeing Co, Honeywell International Inc., United Parcel Service Inc., Lockheed Martin Corp. and Caterpillar Inc., among others. With net assets totaling $11.19 billion and a YTD return of 7.10%, we believe the inclusion of this Fund will prove worthwhile.
36
Information Technology The information technology sector focuses on companies engaged in the research, development, and
distribution of technology based services or products. Most of the businesses in the sector operate in
electronics manufacturing, software development, and information technology. This sector has a market
cap of $7.37 trillion and consists of seven industries: computer hardware, IT services and consulting,
software, semiconductors, communications equipment, semiconductor equipment and testing, and
office equipment.
Information technology companies work to provide tools, processes, and methodologies to provide,
manipulate and present information differently. The S&P 500 Sector Fund has returned 31% over the
past year and provides a dividend of 1.88%. This sector is primarily made up of growth companies that
command a higher price because of their potential to expand rapidly. This sector is cyclical as companies
are more likely to purchase technology solutions when revenues are increasing. We expect the
information technology sector to grow with the United States economy.
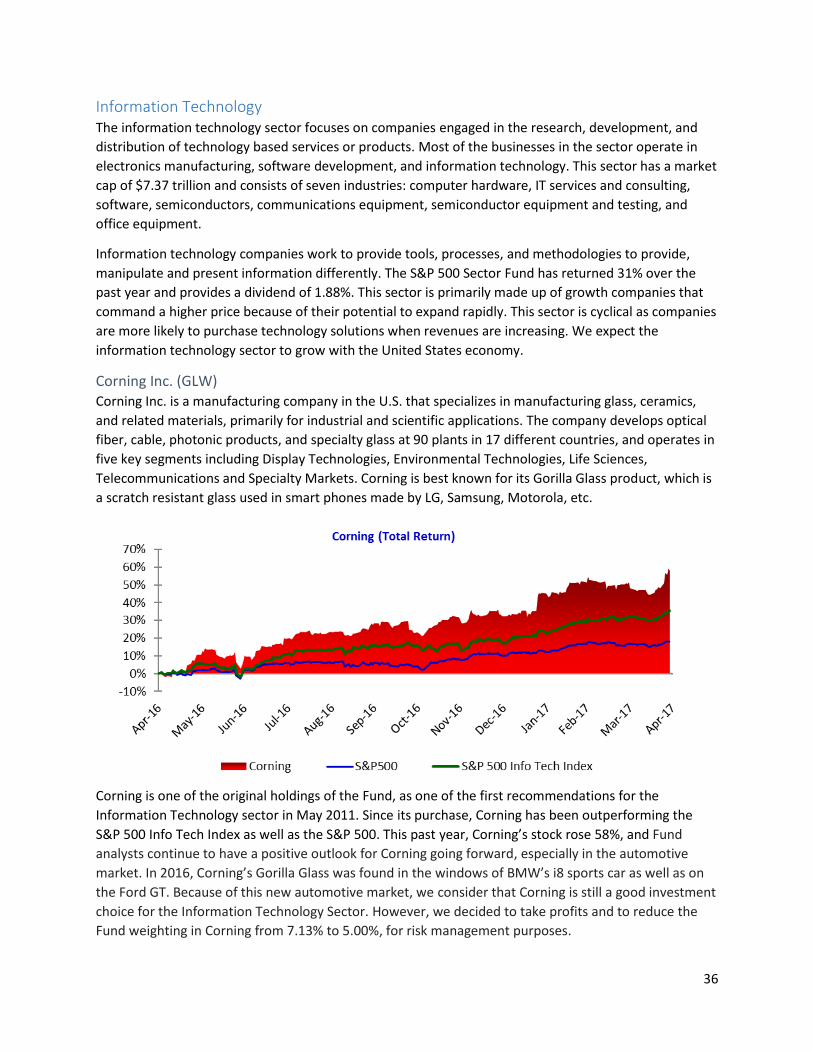
Corning Inc. (GLW) Corning Inc. is a manufacturing company in the U.S. that specializes in manufacturing glass, ceramics,
and related materials, primarily for industrial and scientific applications. The company develops optical
fiber, cable, photonic products, and specialty glass at 90 plants in 17 different countries, and operates in
five key segments including Display Technologies, Environmental Technologies, Life Sciences,
Telecommunications and Specialty Markets. Corning is best known for its Gorilla Glass product, which is
a scratch resistant glass used in smart phones made by LG, Samsung, Motorola, etc.
Corning is one of the original holdings of the Fund, as one of the first recommendations for the
Information Technology sector in May 2011. Since its purchase, Corning has been outperforming the
S&P 500 Info Tech Index as well as the S&P 500. This past year, Corning’s stock rose 58%, and Fund
analysts continue to have a positive outlook for Corning going forward, especially in the automotive
market. In 2016, Corning’s Gorilla Glass was found in the windows of BMW’s i8 sports car as well as on
the Ford GT. Because of this new automotive market, we consider that Corning is still a good investment
choice for the Information Technology Sector. However, we decided to take profits and to reduce the
Fund weighting in Corning from 7.13% to 5.00%, for risk management purposes.
37
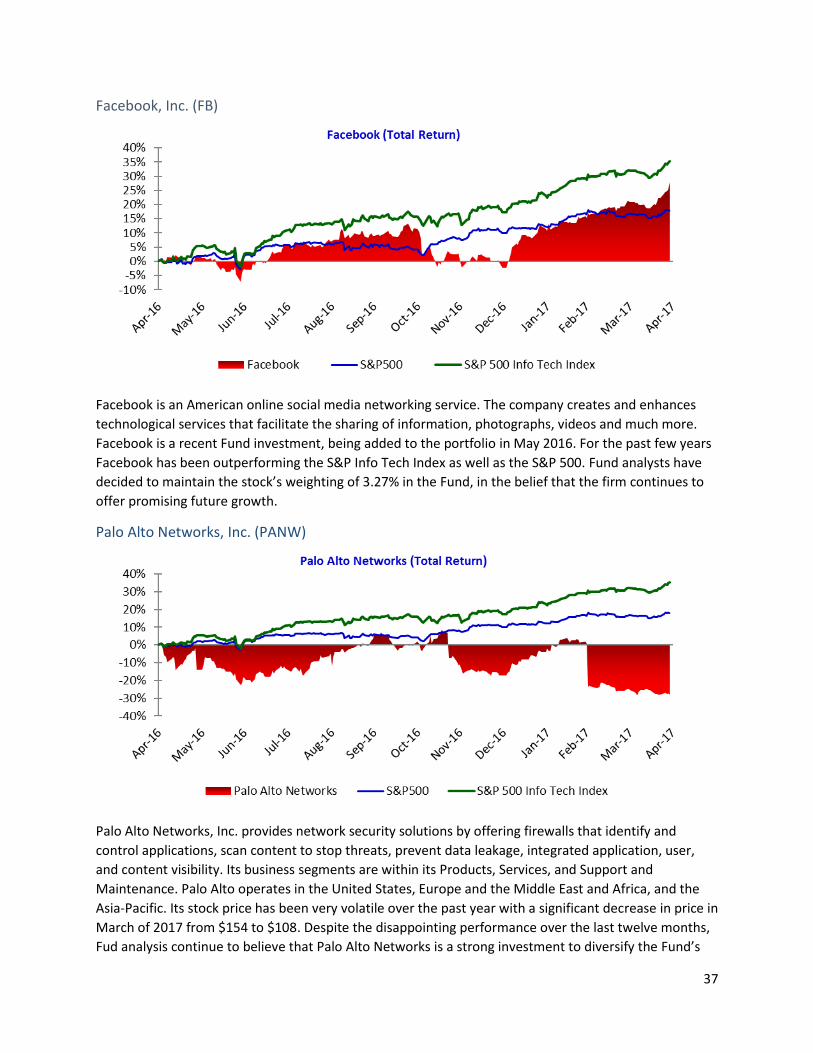
Facebook, Inc. (FB)
Facebook is an American online social media networking service. The company creates and enhances
technological services that facilitate the sharing of information, photographs, videos and much more.
Facebook is a recent Fund investment, being added to the portfolio in May 2016. For the past few years
Facebook has been outperforming the S&P Info Tech Index as well as the S&P 500. Fund analysts have
decided to maintain the stock’s weighting of 3.27% in the Fund, in the belief that the firm continues to
offer promising future growth.
Palo Alto Networks, Inc. (PANW)
Palo Alto Networks, Inc. provides network security solutions by offering firewalls that identify and
control applications, scan content to stop threats, prevent data leakage, integrated application, user,
and content visibility. Its business segments are within its Products, Services, and Support and
Maintenance. Palo Alto operates in the United States, Europe and the Middle East and Africa, and the
Asia-Pacific. Its stock price has been very volatile over the past year with a significant decrease in price in
March of 2017 from $154 to $108. Despite the disappointing performance over the last twelve months,
Fud analysis continue to believe that Palo Alto Networks is a strong investment to diversify the Fund’s
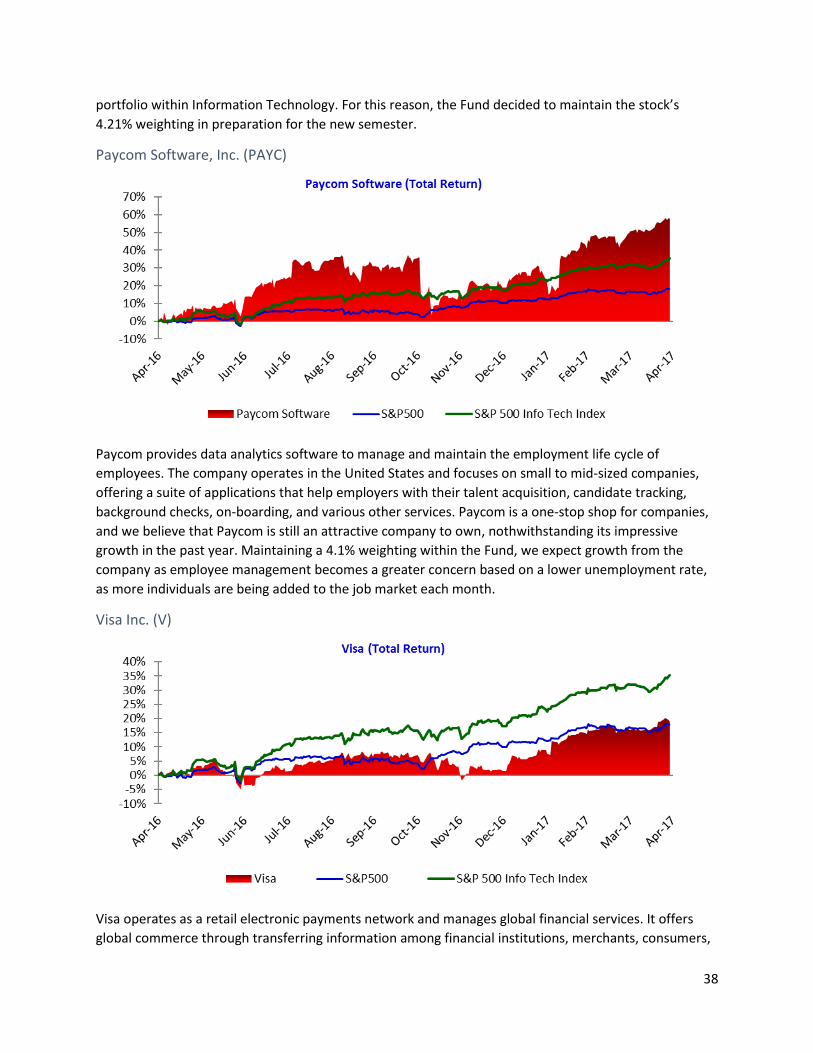
38
portfolio within Information Technology. For this reason, the Fund decided to maintain the stock’s
4.21% weighting in preparation for the new semester.
Paycom Software, Inc. (PAYC)
Paycom provides data analytics software to manage and maintain the employment life cycle of
employees. The company operates in the United States and focuses on small to mid-sized companies,
offering a suite of applications that help employers with their talent acquisition, candidate tracking,
background checks, on-boarding, and various other services. Paycom is a one-stop shop for companies,
and we believe that Paycom is still an attractive company to own, nothwithstanding its impressive
growth in the past year. Maintaining a 4.1% weighting within the Fund, we expect growth from the
company as employee management becomes a greater concern based on a lower unemployment rate,
as more individuals are being added to the job market each month.
Visa Inc. (V)
Visa operates as a retail electronic payments network and manages global financial services. It offers
global commerce through transferring information among financial institutions, merchants, consumers,
39
businesses and government entities. Its business segments are divided by service, data processing,
international transactions, client incentives, VISA debit and credit. 52% of VISA operates in the US and
46% is International. It is worth noting that while V provides services to banks and merchants, with
revenues dependent on global commerce, it does not have any consumer debt exposure; it can, in
effect, be considered a broker.
Visa has proven to be a strong investment with a 19% return over the past year. The Fund bought VISA
for 84 shares which generated a $1,821 gain. Its weighting over the past year has been at 5.22% of the
Fund and will stay at that weighting moving forward into next semester, with Fund analysts believing
that the firm will be able to capitalize on the increasing trend for mobile and online payments.
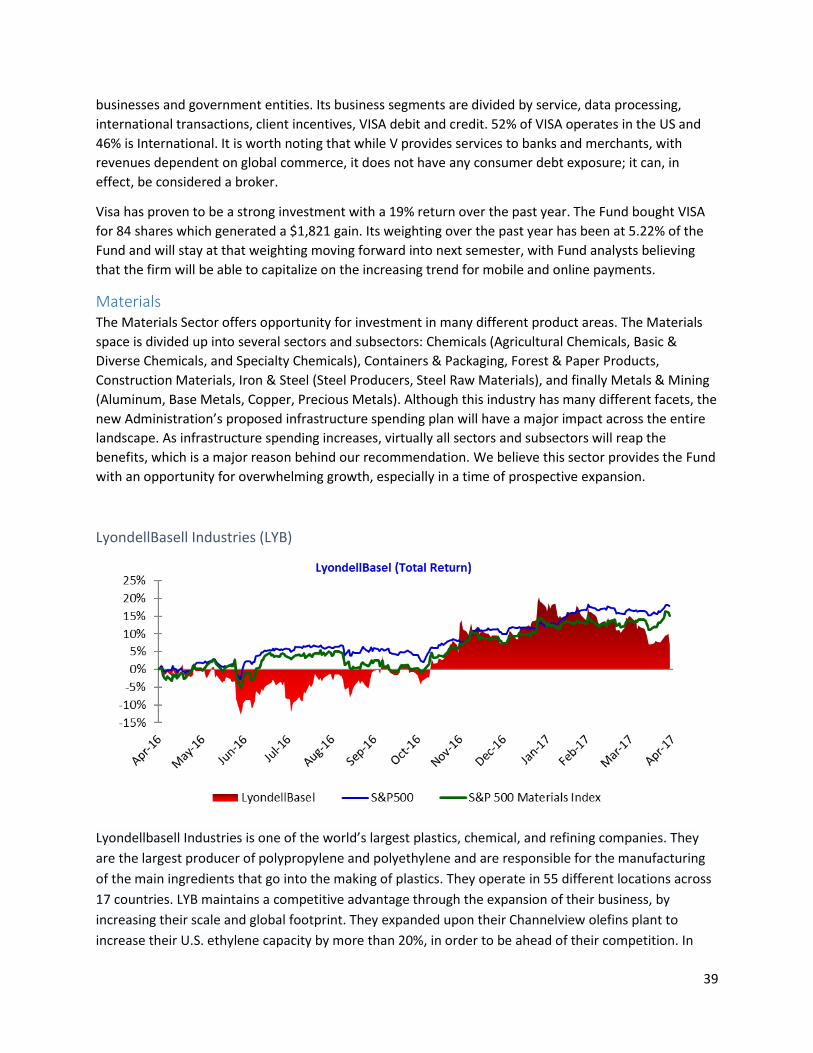
Materials The Materials Sector offers opportunity for investment in many different product areas. The Materials
space is divided up into several sectors and subsectors: Chemicals (Agricultural Chemicals, Basic &
Diverse Chemicals, and Specialty Chemicals), Containers & Packaging, Forest & Paper Products,
Construction Materials, Iron & Steel (Steel Producers, Steel Raw Materials), and finally Metals & Mining
(Aluminum, Base Metals, Copper, Precious Metals). Although this industry has many different facets, the
new Administration’s proposed infrastructure spending plan will have a major impact across the entire
landscape. As infrastructure spending increases, virtually all sectors and subsectors will reap the
benefits, which is a major reason behind our recommendation. We believe this sector provides the Fund
with an opportunity for overwhelming growth, especially in a time of prospective expansion.
LyondellBasell Industries (LYB)
Lyondellbasell Industries is one of the world’s largest plastics, chemical, and refining companies. They
are the largest producer of polypropylene and polyethylene and are responsible for the manufacturing
of the main ingredients that go into the making of plastics. They operate in 55 different locations across
17 countries. LYB maintains a competitive advantage through the expansion of their business, by
increasing their scale and global footprint. They expanded upon their Channelview olefins plant to
increase their U.S. ethylene capacity by more than 20%, in order to be ahead of their competition. In
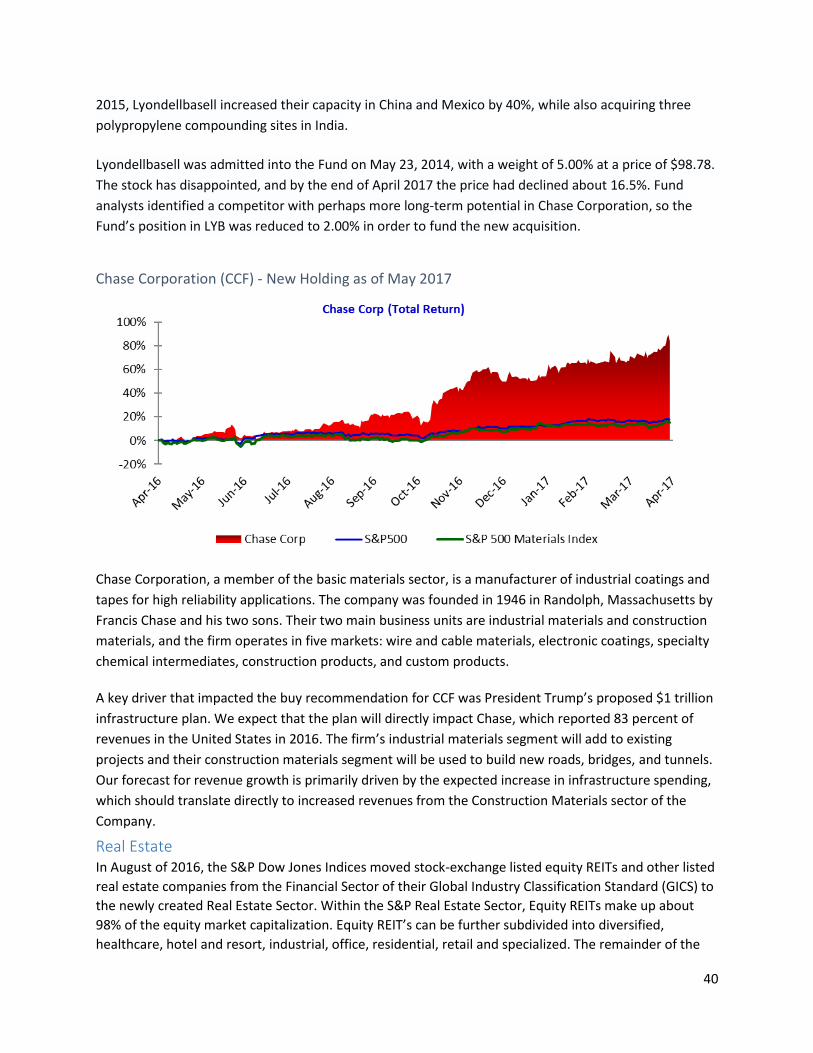
40
2015, Lyondellbasell increased their capacity in China and Mexico by 40%, while also acquiring three
polypropylene compounding sites in India.
Lyondellbasell was admitted into the Fund on May 23, 2014, with a weight of 5.00% at a price of $98.78.
The stock has disappointed, and by the end of April 2017 the price had declined about 16.5%. Fund
analysts identified a competitor with perhaps more long-term potential in Chase Corporation, so the
Fund’s position in LYB was reduced to 2.00% in order to fund the new acquisition.
Chase Corporation (CCF) - New Holding as of May 2017
Chase Corporation, a member of the basic materials sector, is a manufacturer of industrial coatings and
tapes for high reliability applications. The company was founded in 1946 in Randolph, Massachusetts by
Francis Chase and his two sons. Their two main business units are industrial materials and construction
materials, and the firm operates in five markets: wire and cable materials, electronic coatings, specialty
chemical intermediates, construction products, and custom products.
A key driver that impacted the buy recommendation for CCF was President Trump’s proposed $1 trillion
infrastructure plan. We expect that the plan will directly impact Chase, which reported 83 percent of
revenues in the United States in 2016. The firm’s industrial materials segment will add to existing
projects and their construction materials segment will be used to build new roads, bridges, and tunnels.
Our forecast for revenue growth is primarily driven by the expected increase in infrastructure spending,
which should translate directly to increased revenues from the Construction Materials sector of the
Company.
Real Estate In August of 2016, the S&P Dow Jones Indices moved stock-exchange listed equity REITs and other listed
real estate companies from the Financial Sector of their Global Industry Classification Standard (GICS) to
the newly created Real Estate Sector. Within the S&P Real Estate Sector, Equity REITs make up about
98% of the equity market capitalization. Equity REIT’s can be further subdivided into diversified,
healthcare, hotel and resort, industrial, office, residential, retail and specialized. The remainder of the
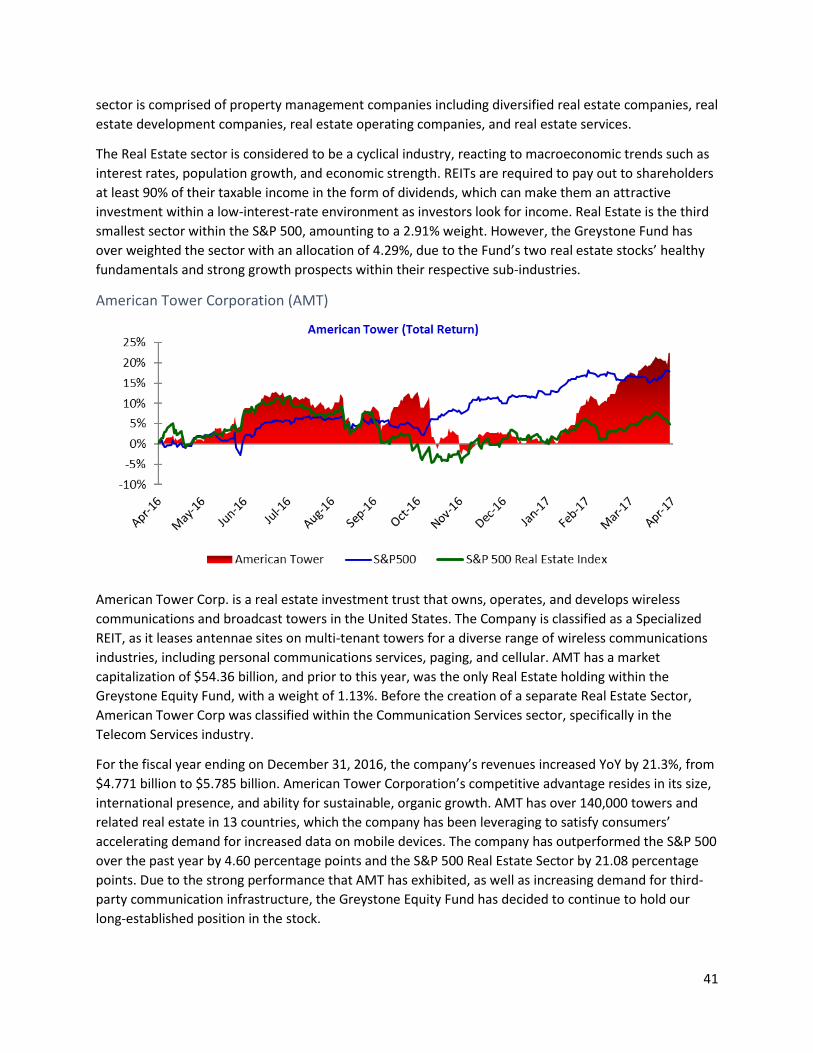
41
sector is comprised of property management companies including diversified real estate companies, real
estate development companies, real estate operating companies, and real estate services.
The Real Estate sector is considered to be a cyclical industry, reacting to macroeconomic trends such as
interest rates, population growth, and economic strength. REITs are required to pay out to shareholders
at least 90% of their taxable income in the form of dividends, which can make them an attractive
investment within a low-interest-rate environment as investors look for income. Real Estate is the third
smallest sector within the S&P 500, amounting to a 2.91% weight. However, the Greystone Fund has
over weighted the sector with an allocation of 4.29%, due to the Fund’s two real estate stocks’ healthy
fundamentals and strong growth prospects within their respective sub-industries.
American Tower Corporation (AMT)
American Tower Corp. is a real estate investment trust that owns, operates, and develops wireless
communications and broadcast towers in the United States. The Company is classified as a Specialized
REIT, as it leases antennae sites on multi-tenant towers for a diverse range of wireless communications
industries, including personal communications services, paging, and cellular. AMT has a market
capitalization of $54.36 billion, and prior to this year, was the only Real Estate holding within the
Greystone Equity Fund, with a weight of 1.13%. Before the creation of a separate Real Estate Sector,
American Tower Corp was classified within the Communication Services sector, specifically in the
Telecom Services industry.
For the fiscal year ending on December 31, 2016, the company’s revenues increased YoY by 21.3%, from
$4.771 billion to $5.785 billion. American Tower Corporation’s competitive advantage resides in its size,
international presence, and ability for sustainable, organic growth. AMT has over 140,000 towers and
related real estate in 13 countries, which the company has been leveraging to satisfy consumers’
accelerating demand for increased data on mobile devices. The company has outperformed the S&P 500
over the past year by 4.60 percentage points and the S&P 500 Real Estate Sector by 21.08 percentage
points. Due to the strong performance that AMT has exhibited, as well as increasing demand for third-
party communication infrastructure, the Greystone Equity Fund has decided to continue to hold our
long-established position in the stock.
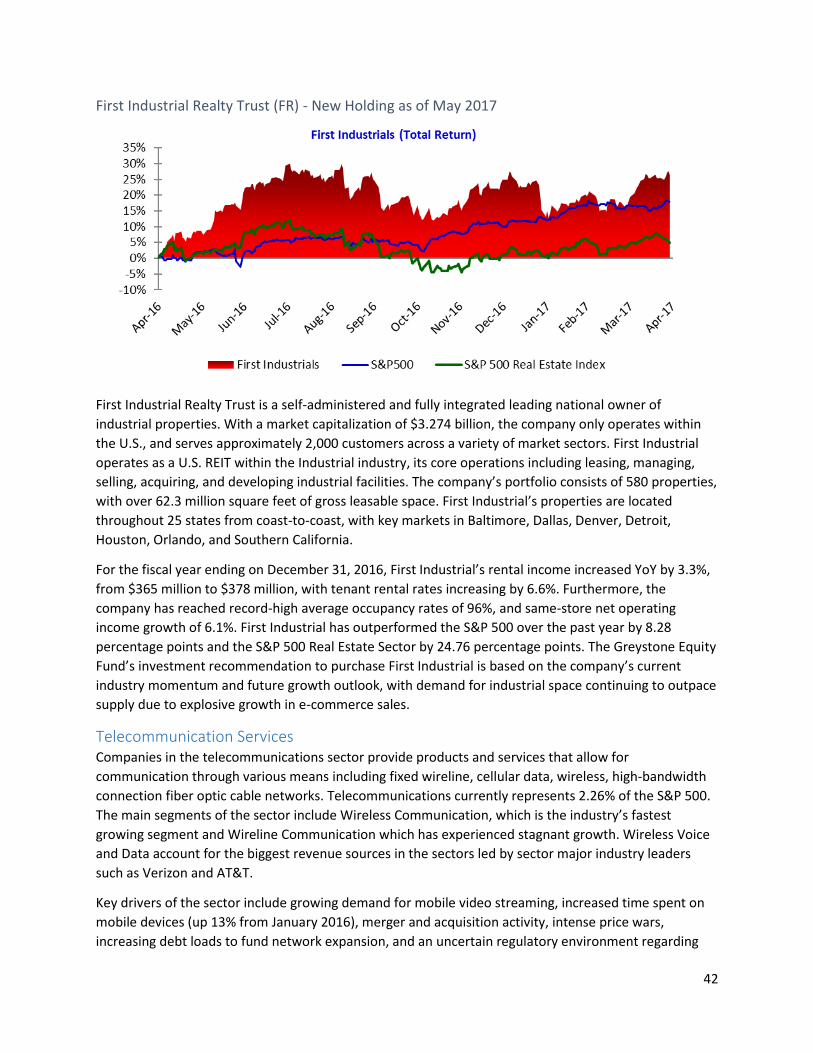
42
First Industrial Realty Trust (FR) - New Holding as of May 2017
First Industrial Realty Trust is a self-administered and fully integrated leading national owner of
industrial properties. With a market capitalization of $3.274 billion, the company only operates within
the U.S., and serves approximately 2,000 customers across a variety of market sectors. First Industrial
operates as a U.S. REIT within the Industrial industry, its core operations including leasing, managing,
selling, acquiring, and developing industrial facilities. The company’s portfolio consists of 580 properties,
with over 62.3 million square feet of gross leasable space. First Industrial’s properties are located
throughout 25 states from coast-to-coast, with key markets in Baltimore, Dallas, Denver, Detroit,
Houston, Orlando, and Southern California.
For the fiscal year ending on December 31, 2016, First Industrial’s rental income increased YoY by 3.3%,
from $365 million to $378 million, with tenant rental rates increasing by 6.6%. Furthermore, the
company has reached record-high average occupancy rates of 96%, and same-store net operating
income growth of 6.1%. First Industrial has outperformed the S&P 500 over the past year by 8.28
percentage points and the S&P 500 Real Estate Sector by 24.76 percentage points. The Greystone Equity
Fund’s investment recommendation to purchase First Industrial is based on the company’s current
industry momentum and future growth outlook, with demand for industrial space continuing to outpace
supply due to explosive growth in e-commerce sales.
Telecommunication Services Companies in the telecommunications sector provide products and services that allow for
communication through various means including fixed wireline, cellular data, wireless, high-bandwidth
connection fiber optic cable networks. Telecommunications currently represents 2.26% of the S&P 500.
The main segments of the sector include Wireless Communication, which is the industry’s fastest
growing segment and Wireline Communication which has experienced stagnant growth. Wireless Voice
and Data account for the biggest revenue sources in the sectors led by sector major industry leaders
such as Verizon and AT&T.
Key drivers of the sector include growing demand for mobile video streaming, increased time spent on
mobile devices (up 13% from January 2016), merger and acquisition activity, intense price wars,
increasing debt loads to fund network expansion, and an uncertain regulatory environment regarding
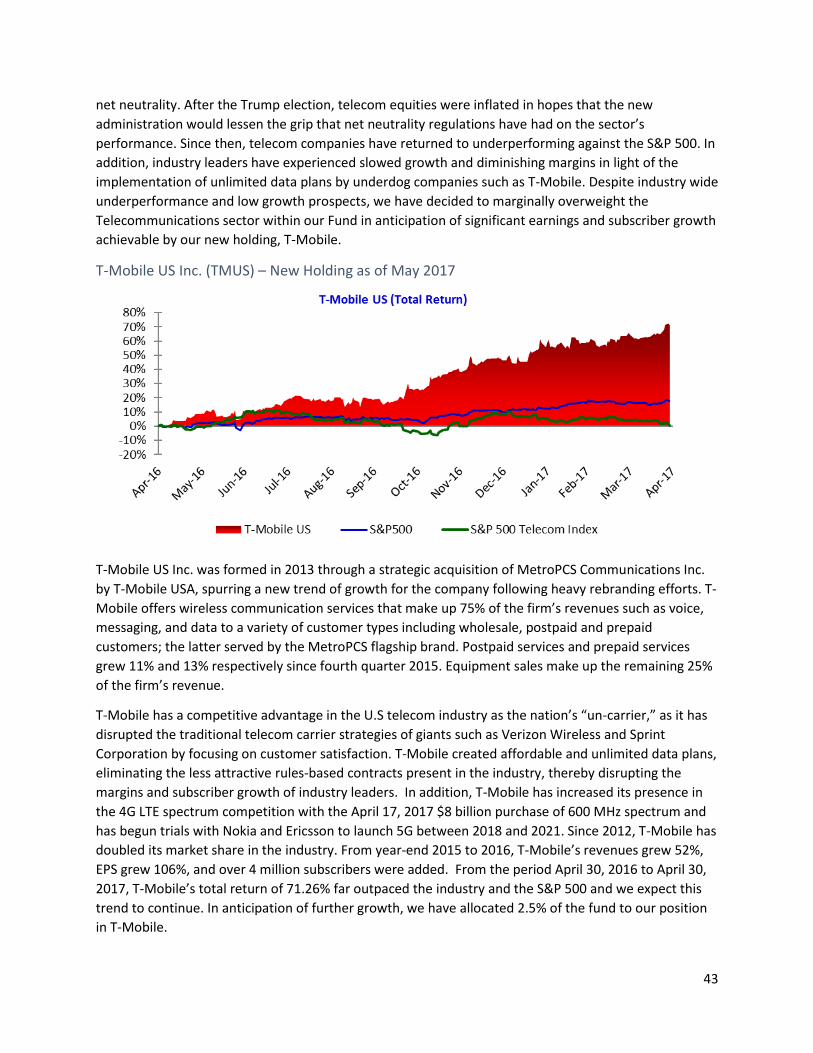
43
net neutrality. After the Trump election, telecom equities were inflated in hopes that the new
administration would lessen the grip that net neutrality regulations have had on the sector’s
performance. Since then, telecom companies have returned to underperforming against the S&P 500. In
addition, industry leaders have experienced slowed growth and diminishing margins in light of the
implementation of unlimited data plans by underdog companies such as T-Mobile. Despite industry wide
underperformance and low growth prospects, we have decided to marginally overweight the
Telecommunications sector within our Fund in anticipation of significant earnings and subscriber growth
achievable by our new holding, T-Mobile.
T-Mobile US Inc. (TMUS) – New Holding as of May 2017
T-Mobile US Inc. was formed in 2013 through a strategic acquisition of MetroPCS Communications Inc.
by T-Mobile USA, spurring a new trend of growth for the company following heavy rebranding efforts. T-
Mobile offers wireless communication services that make up 75% of the firm’s revenues such as voice,
messaging, and data to a variety of customer types including wholesale, postpaid and prepaid
customers; the latter served by the MetroPCS flagship brand. Postpaid services and prepaid services
grew 11% and 13% respectively since fourth quarter 2015. Equipment sales make up the remaining 25%
of the firm’s revenue.
T-Mobile has a competitive advantage in the U.S telecom industry as the nation’s “un-carrier,” as it has
disrupted the traditional telecom carrier strategies of giants such as Verizon Wireless and Sprint
Corporation by focusing on customer satisfaction. T-Mobile created affordable and unlimited data plans,
eliminating the less attractive rules-based contracts present in the industry, thereby disrupting the
margins and subscriber growth of industry leaders. In addition, T-Mobile has increased its presence in
the 4G LTE spectrum competition with the April 17, 2017 $8 billion purchase of 600 MHz spectrum and
has begun trials with Nokia and Ericsson to launch 5G between 2018 and 2021. Since 2012, T-Mobile has
doubled its market share in the industry. From year-end 2015 to 2016, T-Mobile’s revenues grew 52%,
EPS grew 106%, and over 4 million subscribers were added. From the period April 30, 2016 to April 30,
2017, T-Mobile’s total return of 71.26% far outpaced the industry and the S&P 500 and we expect this
trend to continue. In anticipation of further growth, we have allocated 2.5% of the fund to our position
in T-Mobile.
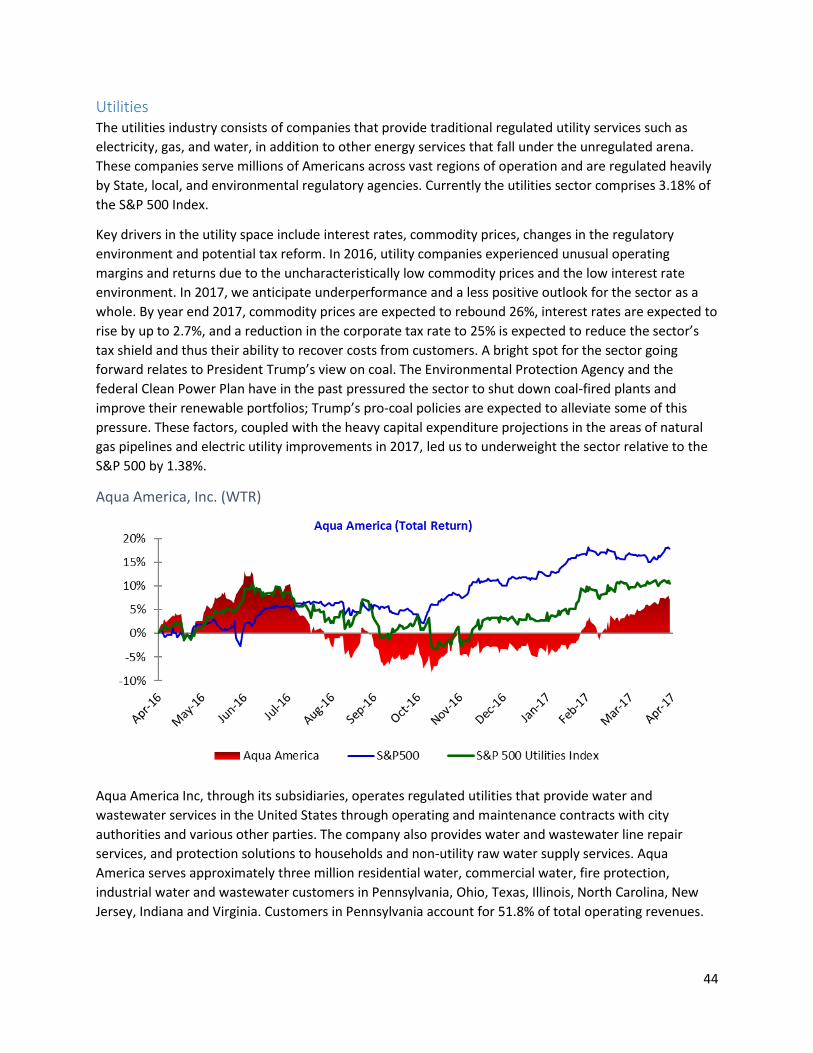
44
Utilities The utilities industry consists of companies that provide traditional regulated utility services such as
electricity, gas, and water, in addition to other energy services that fall under the unregulated arena.
These companies serve millions of Americans across vast regions of operation and are regulated heavily
by State, local, and environmental regulatory agencies. Currently the utilities sector comprises 3.18% of
the S&P 500 Index.
Key drivers in the utility space include interest rates, commodity prices, changes in the regulatory
environment and potential tax reform. In 2016, utility companies experienced unusual operating
margins and returns due to the uncharacteristically low commodity prices and the low interest rate
environment. In 2017, we anticipate underperformance and a less positive outlook for the sector as a
whole. By year end 2017, commodity prices are expected to rebound 26%, interest rates are expected to
rise by up to 2.7%, and a reduction in the corporate tax rate to 25% is expected to reduce the sector’s
tax shield and thus their ability to recover costs from customers. A bright spot for the sector going
forward relates to President Trump’s view on coal. The Environmental Protection Agency and the
federal Clean Power Plan have in the past pressured the sector to shut down coal-fired plants and
improve their renewable portfolios; Trump’s pro-coal policies are expected to alleviate some of this
pressure. These factors, coupled with the heavy capital expenditure projections in the areas of natural
gas pipelines and electric utility improvements in 2017, led us to underweight the sector relative to the
S&P 500 by 1.38%.
Aqua America, Inc. (WTR)
Aqua America Inc, through its subsidiaries, operates regulated utilities that provide water and
wastewater services in the United States through operating and maintenance contracts with city
authorities and various other parties. The company also provides water and wastewater line repair
services, and protection solutions to households and non-utility raw water supply services. Aqua
America serves approximately three million residential water, commercial water, fire protection,
industrial water and wastewater customers in Pennsylvania, Ohio, Texas, Illinois, North Carolina, New
Jersey, Indiana and Virginia. Customers in Pennsylvania account for 51.8% of total operating revenues.

45
The Fund’s position in Aqua America Inc. was initiated in December of 2015. Over the past year, Aqua
America has disappointed, underperforming not only the overall market, but also the S&P 500 Utilities
Index. Since April 2016, the S&P 500 and the S&P 500 Utilities Index are up 17.9% and 11.5%
respectively, while WTR has gained only 7.10%. Nevertheless, we chose to maintain our 1.80% due to
our expectations of growth for Aqua America Inc and the water utility segment.
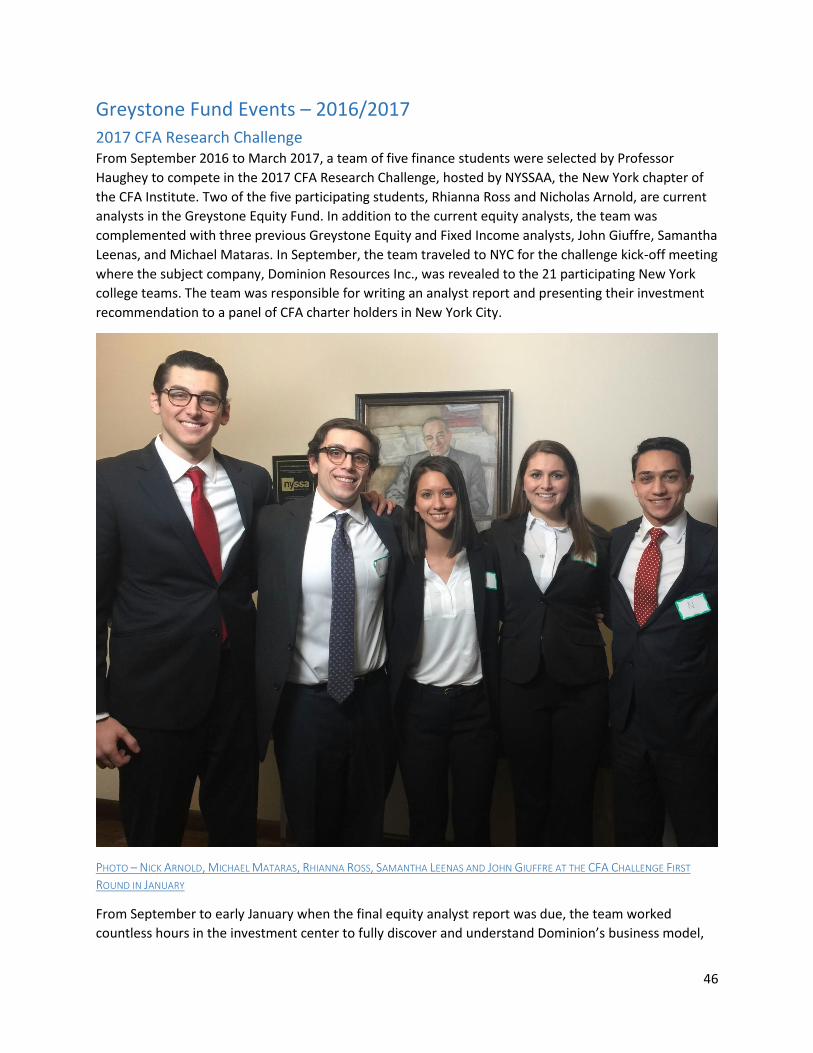
46
Greystone Fund Events – 2016/2017
2017 CFA Research Challenge From September 2016 to March 2017, a team of five finance students were selected by Professor
Haughey to compete in the 2017 CFA Research Challenge, hosted by NYSSAA, the New York chapter of
the CFA Institute. Two of the five participating students, Rhianna Ross and Nicholas Arnold, are current
analysts in the Greystone Equity Fund. In addition to the current equity analysts, the team was
complemented with three previous Greystone Equity and Fixed Income analysts, John Giuffre, Samantha
Leenas, and Michael Mataras. In September, the team traveled to NYC for the challenge kick-off meeting
where the subject company, Dominion Resources Inc., was revealed to the 21 participating New York
college teams. The team was responsible for writing an analyst report and presenting their investment
recommendation to a panel of CFA charter holders in New York City.
PHOTO – NICK ARNOLD, MICHAEL MATARAS, RHIANNA ROSS, SAMANTHA LEENAS AND JOHN GIUFFRE AT THE CFA CHALLENGE FIRST
ROUND IN JANUARY
From September to early January when the final equity analyst report was due, the team worked
countless hours in the investment center to fully discover and understand Dominion’s business model,
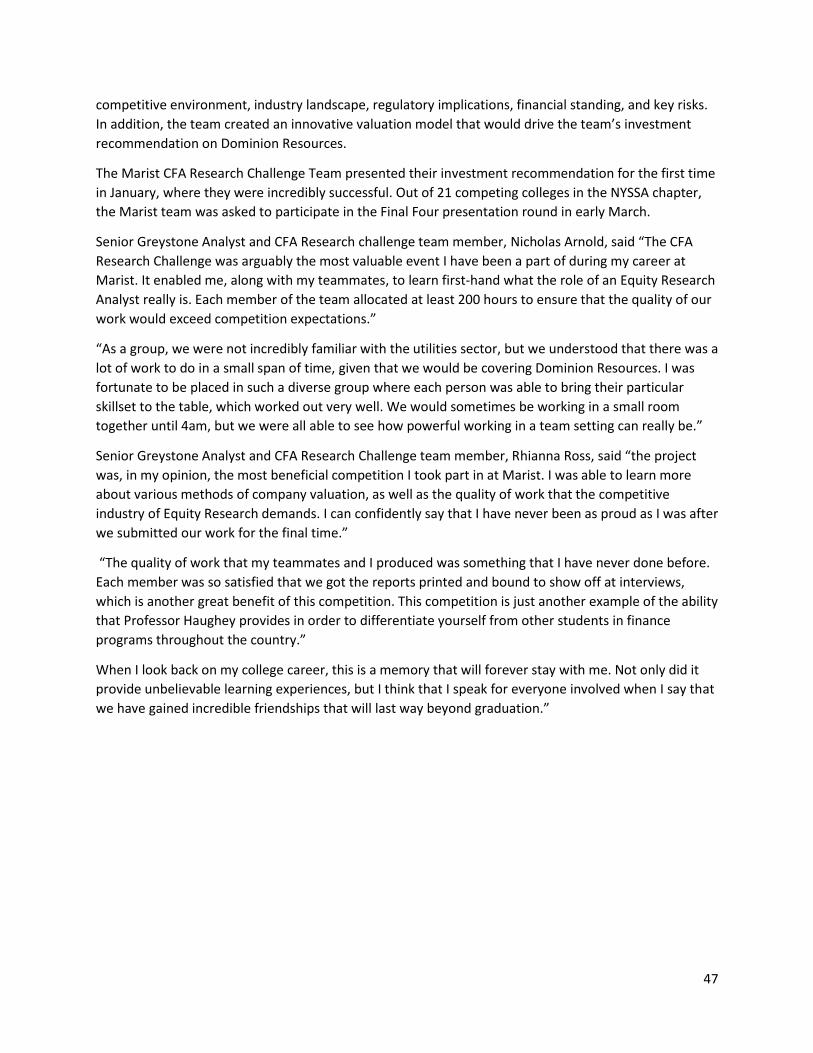
47
competitive environment, industry landscape, regulatory implications, financial standing, and key risks.
In addition, the team created an innovative valuation model that would drive the team’s investment
recommendation on Dominion Resources.
The Marist CFA Research Challenge Team presented their investment recommendation for the first time
in January, where they were incredibly successful. Out of 21 competing colleges in the NYSSA chapter,
the Marist team was asked to participate in the Final Four presentation round in early March.
Senior Greystone Analyst and CFA Research challenge team member, Nicholas Arnold, said “The CFA
Research Challenge was arguably the most valuable event I have been a part of during my career at
Marist. It enabled me, along with my teammates, to learn first-hand what the role of an Equity Research
Analyst really is. Each member of the team allocated at least 200 hours to ensure that the quality of our
work would exceed competition expectations.”
“As a group, we were not incredibly familiar with the utilities sector, but we understood that there was a
lot of work to do in a small span of time, given that we would be covering Dominion Resources. I was
fortunate to be placed in such a diverse group where each person was able to bring their particular
skillset to the table, which worked out very well. We would sometimes be working in a small room
together until 4am, but we were all able to see how powerful working in a team setting can really be.”
Senior Greystone Analyst and CFA Research Challenge team member, Rhianna Ross, said “the project
was, in my opinion, the most beneficial competition I took part in at Marist. I was able to learn more
about various methods of company valuation, as well as the quality of work that the competitive
industry of Equity Research demands. I can confidently say that I have never been as proud as I was after
we submitted our work for the final time.”
“The quality of work that my teammates and I produced was something that I have never done before.
Each member was so satisfied that we got the reports printed and bound to show off at interviews,
which is another great benefit of this competition. This competition is just another example of the ability
that Professor Haughey provides in order to differentiate yourself from other students in finance
programs throughout the country.”
When I look back on my college career, this is a memory that will forever stay with me. Not only did it
provide unbelievable learning experiences, but I think that I speak for everyone involved when I say that
we have gained incredible friendships that will last way beyond graduation.”
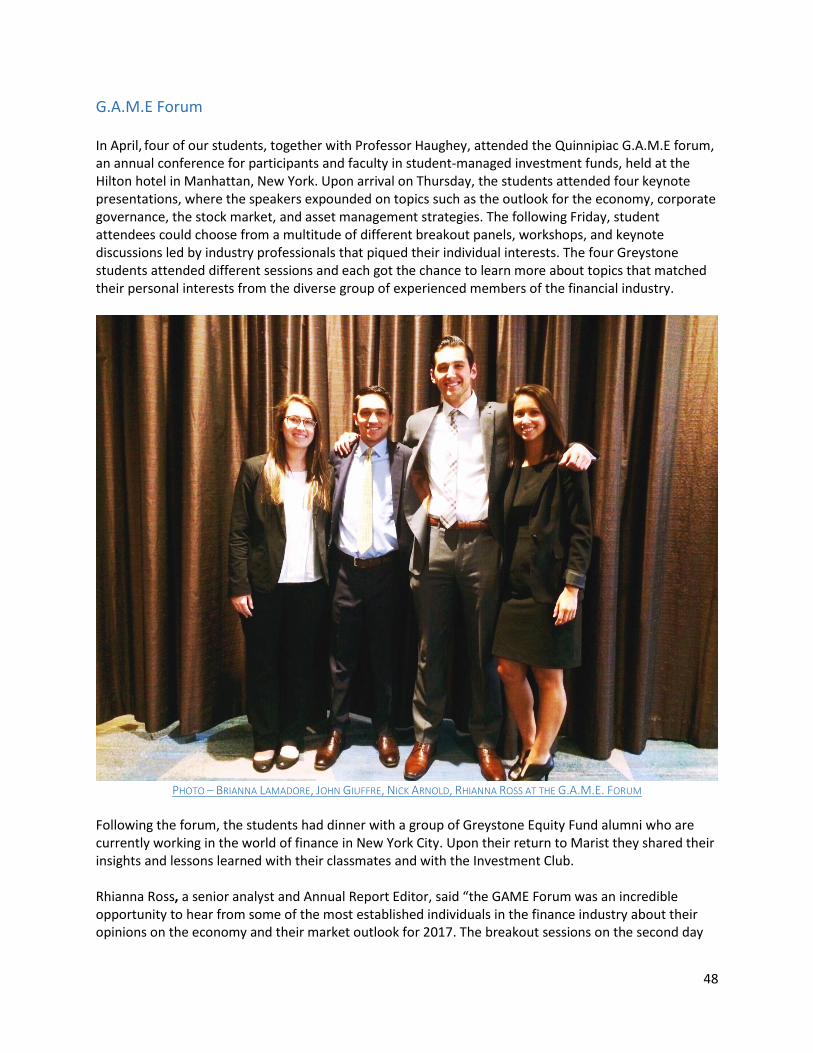
48
G.A.M.E Forum In April, four of our students, together with Professor Haughey, attended the Quinnipiac G.A.M.E forum, an annual conference for participants and faculty in student‐managed investment funds, held at the Hilton hotel in Manhattan, New York. Upon arrival on Thursday, the students attended four keynote presentations, where the speakers expounded on topics such as the outlook for the economy, corporate governance, the stock market, and asset management strategies. The following Friday, student attendees could choose from a multitude of different breakout panels, workshops, and keynote discussions led by industry professionals that piqued their individual interests. The four Greystone students attended different sessions and each got the chance to learn more about topics that matched their personal interests from the diverse group of experienced members of the financial industry.
PHOTO – BRIANNA LAMADORE, JOHN GIUFFRE, NICK ARNOLD, RHIANNA ROSS AT THE G.A.M.E. FORUM Following the forum, the students had dinner with a group of Greystone Equity Fund alumni who are currently working in the world of finance in New York City. Upon their return to Marist they shared their insights and lessons learned with their classmates and with the Investment Club. Rhianna Ross, a senior analyst and Annual Report Editor, said “the GAME Forum was an incredible opportunity to hear from some of the most established individuals in the finance industry about their opinions on the economy and their market outlook for 2017. The breakout sessions on the second day

49
of the forum were extremely informative and engaging. I really enjoyed a breakout discussion about the high yield market, led by a former minor league baseball player and current high yield trader on Wall Street. Beyond discussing the market, he led a Q&A where students had the opportunity to learn from an established professional about how to be successful on Wall Street. I am incredibly thankful to have been given the opportunity to participate in the forum.” Senior Analyst and President of the Greystone Fund, Nicholas Arnold, said “it was great to hear from incredibly established individuals from various backgrounds, which showed me, along with all of the other students, there how much opportunity there is after graduation. One of the best parts of this event was the second day, where there were dozens of different speakers. We were allowed to choose which speakers we would attend based on our personal interest. For example, I was able to attend a panel about establishing hedge funds, as well as the nature of ETF’s and how their popularity will impact the landscape of the financial markets. I am incredibly happy that I was able to take part in such a great event that allowed me to meet a wide array of new people, as well as learn from some of the most influential people in the financial markets.”
Marist Splash
PHOTO – MIDDLE AND HIGH-SCHOOL STUDENTS ARRIVING FOR MARIST SPLASH
On Saturday, April 1st, almost 200 students, grades 7 through 12, came to campus from around the Northeast for a day of learning in classes taught by Marist undergraduates as part of the inaugural Marist Splash. Classes were offered in an eclectic mix of subjects, ranging from origami and Chinese dynasties to electronic dance music and computer game design. The classes in personal finance, stock market investing (“Get Filthy Rich in the Stock Market”), and commodity trading were particularly popular.

50
Guest Speakers Professor Haughey organized a consistent stream of guest speakers throughout the year who spoke to the Greystone Equity and Fixed Income classes about the financial markets. Students heard from executives who worked in private equity, venture capital, rating agencies, electronic trading networks, and investment banks. These interactive discussions complemented the in‐class lectures and provided the students with useful and engaging real‐world stories, in addition to excellent networking opportunities. While the discussions alone were incredibly worthwhile, the students benefited tremendously from the
question‐and‐answer segment at the end of each presentation. This Q&A session allowed the students to ask questions that allowed the speakers to tailor each of their presentations toward the students’ interests. This helped the students further improve their analysis in the Greystone Equity class. We are very grateful to the speakers for contributing to our learning experience.
PHOTOS (CLOCKWISE FROM TOP LEFT) – GREYSTONE ALUMNAE MADELINE
KACHOU AND BRIANNA FERRENTINO WITH SENIOR BRIANNA LAMADORE; GUEST SPEAKER MR. GREG GARVILLE; GREYSTONE ALUMNUS MR. SEAN
SULLIVAN

51
Student Analysts
Spring 2017 Class
Nicholas Arnold Nicholas Arnold is a senior at Marist College studying Business Administration with a concentration in Finance, along with a double minor in Accounting and Economics. Nick served as the President of the Greystone Fund, as well as an analyst for the Materials and Real Estate sectors. After graduation, Nick will be working at Moody’s Investor Services, where he will be focusing on Primary Ratings of Structured Finance products.
Katelyn Boylan Katelyn Boylan is a senior business administration major with a concentration in finance and a minor in information systems. Katelyn focused on the Consumer Staples and Information Technology sectors during her time as a Greystone Equity analyst. After graduation, she will be starting her career at Northrop Grumman as a Business Analyst on its Pricing & Estimating team within Aerospace Systems in Melbourne, Florida.
Raymond Busch Raymond Busch is a senior at Marist College with a dual major in Business Administration, with a concentration in Finance, and Economics. Ray served as a Fund analyst for both the Financials and Industrial sectors where he assisted in making the decision to purchase Bank of the Ozarks. Upon graduation Ray hopes to work in the financial industry as a financial analyst.

52
Louis Epifania Louis Epifania is a graduating senior at Marist with a major in Business Finance and a minor in Economics. Within the Greystone Equity Fund, Louis focused on the Financials and Utilities sector, while also serving as one of the Fund’s economists for the semester. He also served as an analyst for the Greystone Fixed-Income Fund in the fall. Upon graduation, he will be pursuing a career as a financial analyst.
Joseph Guida Joseph Guida is a senior at Marist College majoring in Business Administration with a concentration in Finance and a minor in Accounting. Joseph served as a Greystone analyst for the Materials and Energy sector. He was involved in recommending the buy of Chase Corporation, which was ultimately approved for the Fund. After graduation, Joseph will join KPMG as a Regulatory Risk Associate in their Advisory Department in New York City.
Dana Klarer Dana Klarer is a senior at Marist College studying Business Administration with a concentration in Finance and a minor in Economics. Dana served as an analyst for the Consumer Discretionary and Real Estate sectors. She interned at Bloomberg L.P. in the Analytics and Sales rotational program last summer and will continue working at Bloomberg starting in September 2017.

53
Jeffrey Kortina Jeff Kortina is a graduating senior and a dual major in Economics and Business Administration with a concentration in Finance. He served as the economist for the Fund in addition to covering the Healthcare and Consumer Discretionary sectors. Following graduation, he will start work at Duff and Phelps as a Valuation Advisory Analyst.
Brianna Lamadore Brianna Lamadore is a graduating senior at Marist College with a major in Business Administration, concentration in Finance, and minors in Economics and Criminal Justice. She was an analyst in the Fund for the Energy and Materials sectors. After graduation, Brianna will be working at Ernst & Young in their Financial Services Office.
Juliette Loccisano Juliette Loccisano is a senior, graduating with a major in Business Administration with an emphasis in Finance and a minor in Accounting. Juliette served as an analyst for the Greystone Equity Fund in both the Real Estate and Utilities sectors.

54
Christina Manca Christina Manca is a graduating senior majoring in Business Administration with a concentration in Finance. Christina served as a research analyst for the Financial and Industrial sectors and was involved in the proposal to purchase shares of Bank of the Ozarks. Additionally, she was a member of the Greystone Fixed Income Fund this past fall. Upon graduation, Christina hopes to pursue a career in wealth management.
Sean Mullen Sean Mullen is a graduating senior majoring in Business Administration with a concentration in Finance. As an investment analyst within the Greystone Equity Fund, Sean covered the Energy and Consumer Staples sectors. Sean describes his experience in the Greystone Equity Fund as an invaluable learning opportunity and advises all finance students to apply. Upon graduation, Sean will be employed by Rocaton Investment Advisors as an investment analyst in Norwalk, Connecticut.
Anastasia Reilly
Anastasia Reilly is a senior at Marist and will be graduating with a major in Business Administration and an emphasis in Finance. Anastasia served as a sector analyst for the Consumer Staples and Information Technology sectors in the Greystone Equity Fund. She was also one of the Editors for the final Annual Report. Anastasia has also participated in the Greystone Fixed Income Fund where she focused on High-Yield bonds. After graduation, she will be working as a Financial Analyst at JPMorgan Chase & Co.

55
Rhianna Ross Rhianna Ross is a senior at Marist, graduating with a degree in Business Administration with a Finance emphasis and a minor in writing. Rhianna served as an analyst for the Utilities and Telecommunications sectors of the Greystone Equity Fund, as well as the lead Annual Report Editor. In addition to the Equity Fund, Rhianna was a High-Yield Analyst in the Greystone Fixed Income Fund in Spring of 2017. After graduation, Rhianna plans to pursue a career in Fixed Income Research in NYC.
Alexander Warfel Alexander Warfel is a senior business administration major with a concentration in finance and a minor in mathematics. In addition to serving as the Fund’s portfolio manager, he was responsible for the healthcare and information technology sectors. He was a member of the team that proposed the successful initiation of a position in LabCorp. Alex is also a Resident Assistant in Leo Hall and a member of Zeta Psi fraternity. He enjoys running, writing, and working on cars. He plans to pursue a career in corporate financial analysis after graduation.
Edward White Eddie White is currently a senior at Marist majoring in Mathematics as well as Business Administration with an emphasis in Finance. Eddie has taken part in both the Fixed Income and the Equities Funds and this past semester he was an analyst for the Industrials and Telecommunications sectors and worked on getting the Fund to acquire a position in T-Mobile. After graduation Eddie hopes to find a job in Quantitative Finance after graduation.
56
Disclaimer All information contained in this document is the opinion of, and the result of analysis by, one or more
Marist College students seeking academic credit. It is not intended, and should not be construed, as
offering investment advice. The analysis is not the work of professionals, is not a recommendation of
any particular security, strategy or investment product, and should in no way be used to make financial
decisions or investments. The opinions of the author(s) are subject to change without notice.
Information contained herein has been obtained from sources believed to be reliable, but is not
guaranteed to be accurate or complete.
This document has been prepared for The Greystone Fund’s internal educational purposes. Please
consult your financial and tax advisors before engaging in any transactions.
MARIST COLLEGE, MARIST COLLEGE SCHOOL OF MANAGEMENT, AND MARIST COLLEGE’S TRUSTEES,
FACULTY, STAFF, AND STUDENTS MAKE NO REPRESENTATIONS OR WARRANTIES, EXPRESS OR
IMPLIED, ABOUT THE ACCURACY OR SUITABILITY FOR ANY USE OF THIS REPORT, AND EXPRESSLY
DISCLAIM RESPONSIBILITY FOR ANY LOSS OR DAMAGE, DIRECT OR INDIRECT, CAUSED BY USE OF OR
RELIANCE ON THIS REPORT, OR FURTHER COMMUNICATION PROVIDED IN RELATION TO THIS
DOCUMENT.