Embed Size (px)
Citation preview

D e p ar t m e n t o f C i t y P l a n n i n g
April 2017
Data Book 2016

Raleigh Department of City Planning Data Book 2016 1
Chapter 1: Introduction The Raleigh Data Book is an annual publication of updated community information collected by City of Raleigh Department of City Planning staff. The Data Book builds upon the larger, more comprehensive “Community Inventory Report: Background Studies for the Comprehensive Plan” published in 2008. The Community Inventory Report remains the analytical basis for the City of Raleigh’s 2030 Comprehensive Plan and is accessible on-line: http://www.raleighnc.gov/cp
The City of Raleigh 2030 Comprehensive Plan, adopted in November 2009, provides implementation instructions regarding the monitoring of existing conditions (Action Item IM 3.3). More specifically, Action Item IM 3.4, “Data Book Updates”, states that data in the report will be updated every year.
The Raleigh Data Book is published online in late winter each year. It focuses on topical areas of the Community Inventory Report which have been reviewed through comprehensive planning initiatives during the previous calendar year, with a data benchmark point of December 31st
whenever possible. All figures and tables are for the city of Raleigh corporate limits unless otherwise specified.

Raleigh Department of City Planning Data Book 2016 2
Table of Contents
Chapter 1: Introduction .............................................................................................................. 1
Chapter 2: Demographics and Household Trends ......................................................................... 6
Chapter 3: Land Use & Zoning .................................................................................................. 18
Chapter 4: Economic Development & Employment Trends ......................................................... 25
Chapter 5: Housing and Neighborhoods .................................................................................... 40
Chapter 6: Transportation ........................................................................................................ 44
Chapter 7: Public Utilities ......................................................................................................... 47
Chapter 8: Environmental Resources ........................................................................................ 52
Chapter 9: Parks, Recreation and Cultural Resources .................................................................. 62
Chapter 10: Community Facilities ............................................................................................. 66
Chapter 11: Historic Resources ................................................................................................. 68

Raleigh Department of City Planning Data Book 2016 3
List of Tables and Figures
Chapter 2: Demographics and Household Trends ......................................................................... 6
Figure 2.1 Census Population Count ........................................................................................................... 6
Figure 2.2 Census Population Count and Estimates .................................................................................... 7
Figure 2.3 Population Density ..................................................................................................................... 7
Table 2.1 Population, Growth Rate, and Density ........................................................................................ 8
Table 2.2 Housing Units, Growth Rate, and Unit Density ........................................................................... 8
Figure 2.4 Dwelling Unit Densities, 1990 – 2015 ......................................................................................... 9
Figure 2.5 Raleigh Population Projections .................................................................................................. 9
Table 2.3 Total Housing Units by Number in Structure, 2015 .................................................................... 10
Figure 2.6 Housing Share by Building Type, 2015 ...................................................................................... 10
Table 2.4 Housing Units by Year Built, 2015 .............................................................................................. 11
Table 2.5 Occupancy by Tenure, 2015 ....................................................................................................... 11
Figure 2.7 Homeownership Rate ............................................................................................................... 11
Table 2.6 Housing Tenure for Occupied Units ........................................................................................... 12
Figure 2.8 Residential Units Permitted ...................................................................................................... 12
Table 2.7 Residential Units Permitted ....................................................................................................... 12
Figure 2.9 Population Distribution by Age Group in Raleigh and North Carolina, 2015 .............................. 14
Figure 2.10 Age Distribution...................................................................................................................... 14
Table 2.8 Population by Race .................................................................................................................... 15
Table 2.9 Growth in Hispanic Population .................................................................................................. 15
Table 2.10 Components of Hispanic Population, 2015 ............................................................................... 15
Table 2.11 Educational Attainment Population 25 and Over ..................................................................... 15
Table 2.12 Poverty, Income, and Employment Indicators ......................................................................... 16
Table 2.13 Household Trends .................................................................................................................... 16
Figure 2.11 Household Share by Type ....................................................................................................... 16
Table 2.14 Journey to Work, 2015 ............................................................................................................. 17
Figure 2.12 Journey to Work – Comparison with Similar Cities, 2015 ......................................................... 17

Raleigh Department of City Planning Data Book 2016 4
List of Tables and Figure (cont.)
Chapter 3: Land Use & Zoning .................................................................................................. 18
Table 3.2 Mixed-Use Zoning Allocation ..................................................................................................... 19
Table 3.3 Special Districts Zoning Allocation ............................................................................................ 20
Table 3.4 Overlay Zoning District Allocation ............................................................................................ 20
Figure 3.1 Generalized Zoning Allocation .................................................................................................. 21
Table 3.5 Land Use Allocation ................................................................................................................... 21
Table 3.6 Land Capacity Estimates by Zoning District ............................................................................... 23
Table 3.7 Annexation, Growth of the City of Raleigh ................................................................................ 24
Table 3.8 Future Growth Potential of Raleigh City Limits ......................................................................... 24
Chapter 4: Economic Development & Employment Trends ......................................................... 25
Table 4.1 Raleigh –Cary MSA Real GDP Growth ....................................................................................... 26
Table 4.2 Raleigh –Cary MSA Percentage Growth by Sector ..................................................................... 27
Table 4.3 Wake County Average Annual Employment by Industry ........................................................... 28
Table 4.4 Wake County Annual Average Employment by Industry ........................................................... 29
Figure 4.1 Jobs by Industry Comparison, 2015 ........................................................................................... 30
Figure 4.2 Average Annual Unemployment Rates ..................................................................................... 31
Table 4.5 Triangle Region Interim Employment Projections ..................................................................... 31
Figure 4.3 Triangle Region Employment Projections, 2010 and 2040 ........................................................ 32
Table 4.6 Sector Share of Projected New Jobs, 2010-2040........................................................................ 32
Figure 4.4 Largest 10 Employers located in Raleigh, 2015 ......................................................................... 33
Table 4.8 New & Expanding Companies Raleigh, 2016 .............................................................................. 34
Table 4.9 Raleigh Commercial Building Activity ........................................................................................ 36
Table 4.10 Raleigh Office Building Activity ................................................................................................ 36
Table 4.11 Raleigh Industrial Building Activity ........................................................................................... 37
Table 4.12 Raleigh Institutional Building Activity ...................................................................................... 37
Table 4.13 Raleigh Other* Building Activity .............................................................................................. 37
Table 4.14 Raleigh Total Building Activity ................................................................................................. 38
Figure 4.5 Raleigh All Non-Residential Building Activity ........................................................................... 38
Table 4.15 Metro Area Cost of Living Index Comparison, 2016 Annual Average Data................................ 39

Raleigh Department of City Planning Data Book 2016 5
List of Tables and Figures (cont.)
Chapter 5: Housing and Neighborhoods .................................................................................... 40
Table 5.1 Raleigh Households Below $50,000 Annual Income with 30%+ Cost Burden, 2015 ................... 40
Table 5.2 Comparison of Renter Household Income, Affordable Housing Costs, and Fair Market Rent ..... 41
Table 5.3 Number of Assisted Affordable Housing Units ........................................................................... 41
Table 5.4 Median Sales Price by Unit Type (in 2016 dollars) ..................................................................... 42
Table 5.5 Percent Change in Median Sales Price by Unit Type (in 2016 dollars) ........................................ 42
Table 5.6 Numbers of Residential Sales by Price Range and Type of Unit, 2016 ........................................ 43
Table 5.7 Raleigh Annual Median Gross Apartment Rent .......................................................................... 43
Table 5.8 Raleigh Residential Building Activity, 2016 ................................................................................ 43
Chapter 6: Transportation ........................................................................................................ 44
Table 6.1. Transportation Capital Improvement Program ......................................................................... 45
Table 6.2 Federal Grant Allocations for Transportation Projects, 2012 – 2017 .......................................... 46
Chapter 7: Public Utilities ......................................................................................................... 47
Table 7.1. Raw Water Supply and Demand for 2015 .................................................................................. 47
Figure 7.1. Water Supply and Demand Projections ................................................................................... 48
Figure 7.2 Daily Treated Water Demand Per Capita ................................................................................. 48
Table 7.2 Wastewater Treatment Capacity .............................................................................................. 49
Table 7.3 Wastewater Treatment Plant Average Daily Throughput by Year ............................................. 49
Table 7.4 SSO Count and Rate by Year ...................................................................................................... 50
Chapter 8: Environmental Resources ........................................................................................ 52
Table 8.1 Bioassessment for Streams in Wake County’s Portion of the Neuse River Subbasin .................. 52
Figure 8.1 Ozone Category Days ............................................................................................................... 54
Table 8.2 Number of Ozone Rating Days, Millbrook Monitor .................................................................... 54
Figure 8.2 Daily Water Consumption Aggregated by City Population ....................................................... 55
Figure 8.3 Reduction in structures and streets affected by excess runoff by fiscal year .............................56
Figure 8.4 Reduction in Total Nitrogen load by fiscal year ......................................................................... 58
Figure 8.3 Municipal Operations Greenhouse Gas Emissions ....................................................................59
Figure 8.4 Solid Waste Diversion Rate ...................................................................................................... 60
Figure 8.5 Solid Waste Collection Per Capita ............................................................................................. 61
Chapter 10: Community Facilities ............................................................................................. 66
Table 10.1 Raleigh Police Department Facilities ....................................................................................... 66
Table 10.2 Raleigh Fire Department Service Metrics ................................................................................ 66
Table 10.3 Solid Waste Services Equipment .............................................................................................. 67
Table 10.4 Solid Waste Collections in Tons ............................................................................................... 67

Raleigh Department of City Planning Data Book 2016 6
Chapter 2: Demographics and Household Trends With a population increase of 63% from 2000 to 2015, Raleigh is one of the fastest-growing cities in the country. This chapter provides the most up-to-date data available for understanding the characteristics of the individuals and households that make up the population of Raleigh. The data presented in this chapter have been drawn from a variety of sources. The decennial census count numbers provide the baseline for household and population estimates released in the intervening years. The American Community Survey (ACS) of the U.S. Census Bureau provides detailed demographics, summarized over time from sample data. The U.S. Census Bureau’s Population Estimates Program provides population estimates between the census years. ACS data is best used for obtaining population characteristic distributions (percentages, means, medians, and rates) while the decennial census and the Population Estimates Program is best for population totals and basic characteristics (sex, race, age, Hispanic origin, and homeowner status.) ACS data should only be compared with basic characteristics from the 2010 census since more detailed information was not asked. In addition to Census data, building permit data is also used to give an overview of recent trends in housing construction.
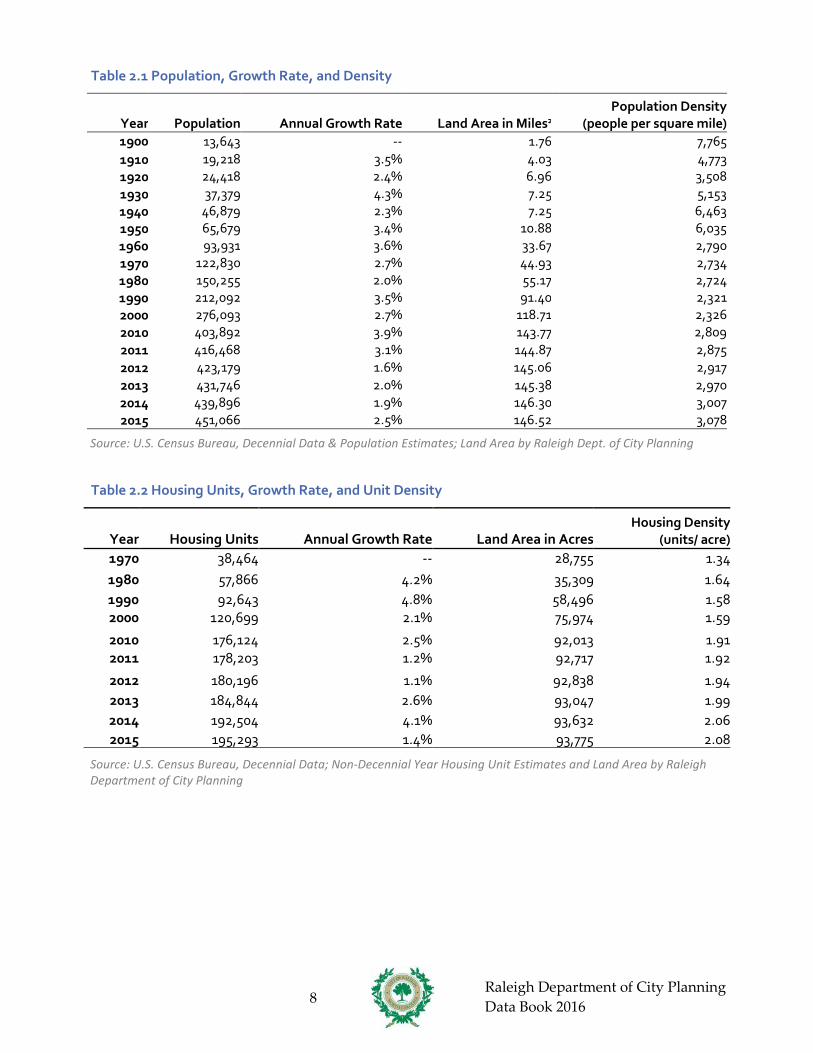
2.1 City Population & Household Trends The most recent Census population estimates reflect Raleigh’s continued growth (see Figures 2.1 and 2.2). In 2015 Raleigh was estimated to have a population of 451,066, a 2.5% increase from the previous year (see Table 2.1). The number of housing units has also grown in 2015, with an estimate of 195,293 units, representing an increase of 1.4% from 2014 (see Table 2.2). Population and housing unit density has also increased, slightly continuing the upward trend seen over the last few years (see Figure 2.4).
Figure 2.1 Census Population Count
Source: U.S. Census Bureau, Decennial Data
0
50
100
150
200
250
300
350
400
450
1900 1920 1940 1960 1980 2000 2020
Pop
ulat
ion
(tho
usan
ds)

Raleigh Department of City Planning Data Book 2016 7
Figure 2.2 Census Population Count and Estimates
Sources: U.S. Census Bureau, Decennial Data (1990, 2000, 2010), Population Estimates Program (July, 1991-2015) Figure 2.3 Population Density
Source: U.S. Census Bureau, Decennial Data; Raleigh Department of City Planning
250
300
350
400
450
500
2005 2006 2007 2008 2009 2010 2011 2012 2013 2014 2015 2016
Pers
ons (
thou
sand
s)
Year
0
1
2
3
4
5
6
7
8
9
1880 1900 1920 1940 1960 1980 2000 2020
Peop
le p
er S
quar
e M
ile (t
hous
ands
)
Year
Raleigh Department of City Planning Data Book 2016 8
Table 2.1 Population, Growth Rate, and Density
Year Population Annual Growth Rate Land Area in Miles2
Population Density (people per square mile)
1900 13,643 -- 1.76 7,765 1910 19,218 3.5% 4.03 4,773 1920 24,418 2.4% 6.96 3,508 1930 37,379 4.3% 7.25 5,153 1940 46,879 2.3% 7.25 6,463 1950 65,679 3.4% 10.88 6,035 1960 93,931 3.6% 33.67 2,790 1970 122,830 2.7% 44.93 2,734 1980 150,255 2.0% 55.17 2,724 1990 212,092 3.5% 91.40 2,321 2000 276,093 2.7% 118.71 2,326 2010 403,892 3.9% 143.77 2,809 2011 416,468 3.1% 144.87 2,875 2012 423,179 1.6% 145.06 2,917 2013 431,746 2.0% 145.38 2,970 2014 439,896 1.9% 146.30 3,007 2015 451,066 2.5% 146.52 3,078
Source: U.S. Census Bureau, Decennial Data & Population Estimates; Land Area by Raleigh Dept. of City Planning Table 2.2 Housing Units, Growth Rate, and Unit Density
Year Housing Units Annual Growth Rate Land Area in Acres Housing Density
(units/ acre) 1970 38,464 -- 28,755 1.34 1980 57,866 4.2% 35,309 1.64 1990 92,643 4.8% 58,496 1.58 2000 120,699 2.1% 75,974 1.59
2010 176,124 2.5% 92,013 1.91 2011 178,203 1.2% 92,717 1.92
2012 180,196 1.1% 92,838 1.94 2013 184,844 2.6% 93,047 1.99 2014 192,504 4.1% 93,632 2.06 2015 195,293 1.4% 93,775 2.08
Source: U.S. Census Bureau, Decennial Data; Non-Decennial Year Housing Unit Estimates and Land Area by Raleigh Department of City Planning

Raleigh Department of City Planning Data Book 2016 9
Figure 2.4 Dwelling Unit Densities, 1990 – 2015
Source: U.S. Census Bureau, Decennial Data; Raleigh Department of City Planning Figure 2.5 Raleigh Population Projections
Source: Capital Area Metropolitan Planning Organization (CAMPO); Raleigh Department of City Planning
0
0.5
1
1.5
2
2.5
3
1990 1995 2000 2005 2010 2015
Uni
ts/A
cre
P
erso
ns/U
nit
Year
Persons/ Unit Density (units/acre)
403,892
547,665
742,616
1,006,965
421,587 510,175
596,580
683,035
0
200,000
400,000
600,000
800,000
1,000,000
1,200,000
2010 2020 2030 2040
100-Year Trend CAMPO

Raleigh Department of City Planning Data Book 2016 10
2.2 Residential Development
Single family detached dwelling units comprise 47.4% of housing in Raleigh based on 2015 American Community Survey data (see Table 2.3). Multi-family apartments come in second at 36.4%, followed by townhouses (12.4%), duplexes (2.1%), and mobile homes (1.5%) (see Figure 2.6). From 2010 to 2016, apartments made up 62% of all issued residential building permits. In 2016, apartments comprised the largest share – 61.5% - of residential building permits issued in Raleigh (see Figure 2.8 and Table 2.7). Single family homes came in second at 22%.
Raleigh’s housing stock is relatively young, with approximately 84.7% of its housing units built in the last 45 years (see Table 2.4). The overall household vacancy rate (homeowners and renters) is 6.7%, which is down from a high of 11.3% in 2010. The homeownership rate stands at 51.4%, a slight decrease from 53.5% in 2010 (see Table 2.5 and Figure 2.7).
Table 2.3 Total Housing Units by Number in Structure, 2015
Units in Structure Number Percent 1-unit, detached 92,613 47.4% 1-unit, attached 24,410 12.4%
2 units 4,094 2.1% 3 or 4 units 8,828 4.5% 5 to 9 units 14,798 7.6%
10 to 19 units 23,242 11.9% 20 or more units 24,124 12.4%
Mobile home 3,033 1.5% 100% Total units 195,293
Source: U.S. Census Bureau, 2015 American Community Survey, 1-year Estimate
Figure 2.6 Housing Share by Building Type, 2015
Source: U.S. Census Bureau, 2015 American Community Survey, 1-year Estimate
Single Family 47.4%
Multi-familiy 36.4%
Townhouse 12.4% Duplex
2.1%
Mobile Home 1.5%

Raleigh Department of City Planning Data Book 2016 11
Table 2.4 Housing Units by Year Built, 2015
Year Built Number Percent
1939 or earlier 6,157 3.2% 1940 to 1949 4,126 2.1% 1950 to 1959 9,344 4.8% 1960 to 1969 15,639 8.0% 1970 to 1979 22,129 11.3% 1980 to 1989 33,410 17.1% 1990 to 1999 39,753 20.4% 2000 to 2009 52,929 27.1% 2010 or later 11,806 6.1%
Total 195,293 100.0%
Source: U.S. Census Bureau, 2015 American Community Survey, 1-year Estimate Table 2.5 Occupancy by Tenure, 2015
Total housing units 195,293 Occupied housing units 178,316
Vacant housing units 16,977 Overall vacancy rate 6.7%
Homeowner vacancy rate 1.3% Rental vacancy rate 5.4%
Source: U.S. Census Bureau, 2015 American Community Survey, 1-year Estimate Figure 2.7 Homeownership Rate
Source: U.S. Census Bureau, Decennial Data (1990, 2000, 2010); 2015 American Community Survey, 1-year Estimate
0%
10%
20%
30%
40%
50%
60%
70%
80%
1990 2000 2010 2015
Perc
enta
ge
Year

Raleigh Department of City Planning Data Book 2016 12
Table 2.6 Housing Tenure for Occupied Units 2000 2010 2015
Number Percent Number Percent Number Percent Owner-occupied 58,079 51.6% 87,284 53.5% 91,632 51.4% Renter-occupied 54,529 48.4% 75,715 46.5% 86,684 48.6%
Total occupied units 112,608 100.0% 162,999 100.0% 178,316 100.0%
Source: U.S. Census Bureau, Decennial Data (2000, 2010); 2015 American Community Survey, 1-year Estimates
Figure 2.8 Residential Units Permitted
Source: City of Raleigh Inspections Department and Department of City Planning *Refer to Table 5.8 for information on square feet and construction value of residential building activity
Table 2.7 Residential Units Permitteda
Year Single Family Townhouse Condominium
2-4 Attached Units Apartments Totals
2010 570 427 56 2 205 1,260 2011 592 405 0 20 1,299 2,316 2012 783 618 23 43 3,806 5,273 2013 909 750 80 8 2,096 3,843 2014 829 491 125 0 3,140 4,585 2015 965 308 42 49 2,723 4,087 2016 1,097 312 24 26 1,991 3,450
7-year total 5,745 3,311 350 149 15,260 24,814 Percent of Total 23.2% 13.3% 1.41% 0.6% 61.5% 100%
7-year average 957 552 58 25 2,543 4,135
Source: City of Raleigh Inspections Department and Department of City Planning a This includes all units from the specified calendar year that have been permitted; it does not indicate construction.
0
1000
2000
3000
4000
5000
6000
2010 2011 2012 2013 2014 2015 2016
Uni
ts P
erm
itted
Year
Single Family Townhouse Condominium 2-4 Attached Units Apartments
Raleigh Department of City Planning Data Book 2016 13
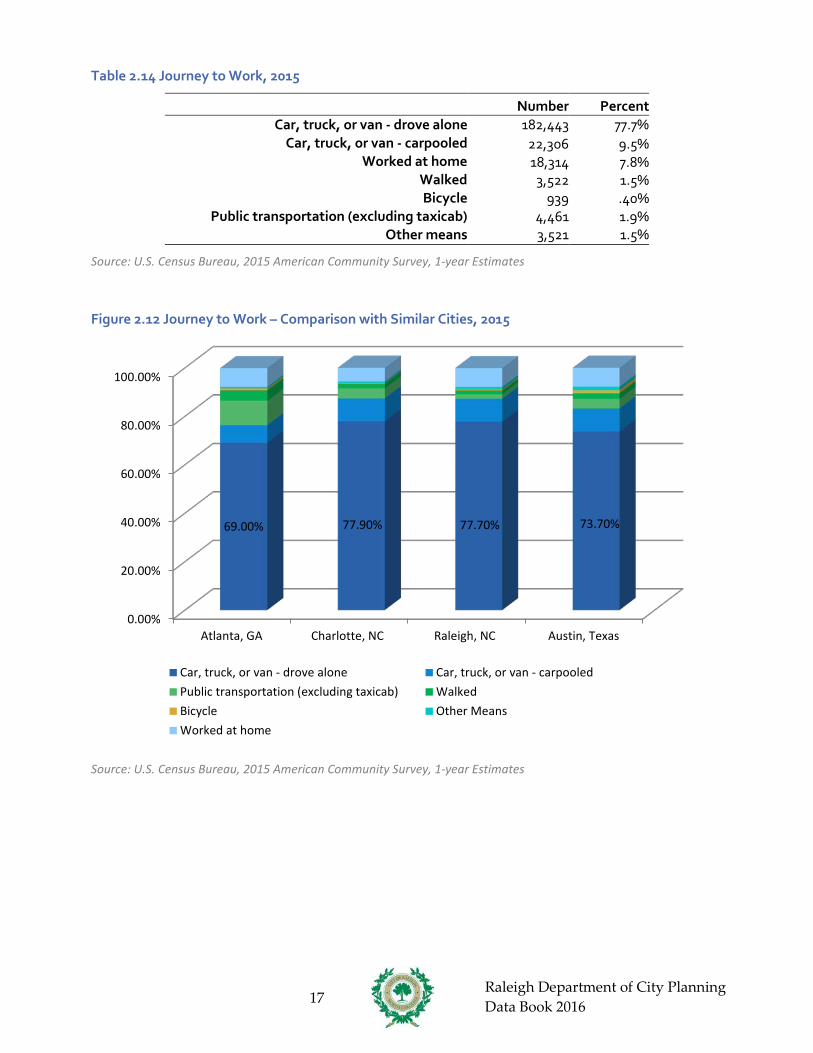
2.3 City Profile Looking at population distribution by age group, Raleigh is younger than North Carolina as a whole with higher percentages of children under 5 as well as 15 to 44 year-olds (see Figure 2.9). Raleigh’s age distribution has changed somewhat from 2000 to 2015 with the percentage of 20 to 44 year-olds declining as a share of the overall population. In contrast, the percentage of 45 to 84 year-olds has seen small but significant gains (see Figure 2.10). In terms of population by race, both the share of white and African-American populations has decreased from 2000 to 2015 (see Table 2.8). The Asian population has grown from 3.4% in 2000 to an estimated 4.6% in 2015. The Hispanic/Latino population defined by the census bureau as an ethnic group and not a race grew by 168% from 2000 to 2015, increasing its share of the total population from 7% to 11.4% (see Table 2.9). In terms of educational attainment, Raleigh has a higher percentage of residents with a high school degree or higher (90.9%) and residents with a bachelor’s degree or higher (49.1%) than the state of North Carolina and the nation (see Table 2.11). Approximately 1 in 6 people in Raleigh (17.4%) holds a graduate or professional degree, which is 70% higher than the statewide average. After peaking in 2010, the percentage of people and families living below the poverty level has dropped significantly (see Table 2.12). In 2010, the percentage of people in poverty peaked at an estimated 18.4% before falling to 15.6% in 2015. For families, the percentage decreased from 13.9% in poverty in 2010 to 11.5% in 2015. Median household incomes and per capita incomes have experienced converse trends during the last two decades. After peaking in 2000, median household incomes have seen a steady decline, reaching its lowest level of $53,475 in 2015 (see Table 2.12). While per capita incomes also peaked in 2000, and experienced a decline between 2000 and 2010, the most recent Census figures indicate they have increased slightly since then to $32,476 in 2015. The share of different types of households has also changed slightly during the last two decades (see Table 2.13 and Figure 2.11). Single parent households have increased the most (up approximately 3%), with other family households coming in second (up approximately 2%). Married couple households with children have decreased slightly (approximately 1%). Persons per household – as measured by the population in households divided by the total number of households – has trended upward from 2000 to 2015 (see Table 2.13). Commuting modes in Raleigh have remained steady over the past five years with a large majority of people driving to work alone (77.7% in 2015) and approximately 42.6% of the remainder that commutes carpooling to work (9.5%) (see Table 2.14). The rest either take public transit (1.9%), walk (1.5%), use other means (1.5%), or forgo a commute and work at home (6.7%). Raleigh’s rate of driving remains much higher than other comparable U.S. cities (see Figure 2.12).

Raleigh Department of City Planning Data Book 2016 14
Figure 2.9 Population Distribution by Age Group in Raleigh and North Carolina, 2015
Source: U.S. Census Bureau, 2015 American Community Survey, 1-year Estimates
Figure 2.10 Age Distribution
Source: U.S. Census Bureau Decennial Data (2000, 2010); 2015 American Community Survey, 1-year Estimates
0%2%4%6%8%
10%12%14%16%18%20%
Perc
enta
ge
Age Group
Raleigh North Carolina
0%
5%
10%
15%
20%
25%
Perc
enta
ge
Age Group
2000 2010 2015

Raleigh Department of City Planning Data Book 2016 15
Table 2.8 Population by Race
2000 2010 2015 Number % Number % Number %
White 174,786 63.3 225,705 59.0 264,843 58.6 Black or African American 76,756 27.8 111,948 29.5 133,153 29.5
American Indian & Alaska Native 981 0.4 1,114 0.3 1,681 0.4 Asian or Pacific Islander 9,445 3.4 16,935 4.4 20,499 4.6
Some other race 14,125 5.1 20,371 5.3 20,227 4.5
Source: U.S. Census Bureau Decennial Data (2000, 2010); 2015 American Community Survey, 1-year Estimates Table 2.9 Growth in Hispanic Population
Number Percent of Total Population 2000 Hispanic/Latino Population 19,308 7.0%
2015 Hispanic/Latino Population 51,786 11.4% Percent Increase 168.2%
Source: U.S. Census Bureau Decennial Data (2000); 2015 American Community Survey, 1-year Estimate
Table 2.10 Components of Hispanic Population, 2015
Number
Percent of Total Population
Percent of Hispanic Population
Mexican 26,972 6.0% 52.1% Puerto Rican 4,306 1.0 % 8.3%
Cuban 1,631 0.4% 3.2% Other Hispanic or Latino 18,877 4.2% 36.4%
Hispanic or Latino (of any race) 51,786 11.4% 100.0%
Source: U.S. Census Bureau Data; 2015 American Community Survey, 1-year Estimate Table 2.11 Educational Attainment Population 25 and Over
2000 2015
High School Grad or higher
Bachelor’s Degree or
higher
Graduate/ Professional
Degree High School
Grad or higher
Bachelor’s Degree or
higher
Graduate/ Professional
Degree
Raleigh 89% 45% 14% 90.9% 49.1% 17.4%
North Carolina 78% 23% 7% 86.5% 29.5% 10.6%
United States 79% 24% 9% 87.2% 30.6% 11.6%
Source: U.S. Census Bureau Decennial Data (2000); 2015 American Community Survey, 1-year Estimates

Raleigh Department of City Planning Data Book 2016 16
Table 2.12 Poverty, Income, and Employment Indicators
1990 2000 2010 2015 Percent of persons below poverty 11.8% 11.5% 18.4% 15.6% Percent of families below poverty 9.0% 7.1% 13.9% 11.5%
Median Household Income (2015 $) $59,916 $66,308 $54,208 $56,910 Median Per Capita Income (2015 $) $32,296 $35,730 $30,456 $32,635
Unemployment Rate 4.0% 3.8% 7.5% 4.9% Labor Force Participation Rate 66.4% 72.7% 69.9% 69.4%
Source: U.S. Census Bureau, Decennial Censuses (1990, 2000); 2010, 2015 American Community Survey 1-yr Est. Table 2.13 Household Trends
Number Percent 2000 2010 2015 2000 2010 2015
Family Households 61,327 91,186 101,127 54.5% 55.9% 56.7% Married couple with own
children under 18 years old 20,194 29,973 34,507 18.6% 18.4% 19.3%
Single parent with own children under 18 years old
11,122 17,245 18,154 9.9% 10.6% 10.2%
Other family households 29,291 41,077 48,466 26.0% 27.0% 27.2% Nonfamily Households 51,281 71,813 77,189 45.5% 44.1% 43.3%
Total Households 112,608 162,999 178,316 100.0% 100.0% 100.0%
Persons per Household 2.30 2.36 2.42
Source: U.S. Census Bureau Decennial Data (2000, 2010); 2015 American Community Survey 1-year Estimates
Figure 2.11 Household Share by Type
Source: U.S. Census Bureau Decennial Data (2000, 2010); 2015 American Community Survey, 1-year Estimates
0%
10%
20%
30%
40%
50%
60%
70%
80%
90%
100%
2000 2010 2015
Nonfamily Households
Other family Households
Single parent with ownchildren under 18 yearsold
Married couple with ownchildren under 18 yearsold
Raleigh Department of City Planning Data Book 2016 17
Table 2.14 Journey to Work, 2015
Number Percent 182,443 77.7%
22,306 9.5% 18,314 7.8%
3,522 1.5% 939 .40%
4,461 1.9%
Car, truck, or van - drove alone Car, truck, or van - carpooled
Worked at home Walked Bicycle
Public transportation (excluding taxicab) Other means 3,521 1.5%
Source: U.S. Census Bureau, 2015 American Community Survey, 1-year Estimates
Figure 2.12 Journey to Work – Comparison with Similar Cities, 2015
Source: U.S. Census Bureau, 2015 American Community Survey, 1-year Estimates
0.00%
20.00%
40.00%
60.00%
80.00%
100.00%
Atlanta, GA Charlotte, NC Raleigh, NC Austin, Texas
69.00% 77.90% 77.70% 73.70%
Car, truck, or van - carpooledWalkedOther Means
Car, truck, or van - drove alonePublic transportation (excluding taxicab) BicycleWorked at home

Raleigh Department of City Planning Data Book 2016 18
Chapter 3: Land Use & Zoning
Land use is fundamental to the physical form and function of the city. The Comprehensive Plan is the primary policy guide that municipalities use to guide land use and the physical development and growth of the city. As set forth in state enabling statute, the Comprehensive Plan is also the foundation for zoning.
While the Comprehensive Plan is a policy guide, the Unified Development Ordinance is law. This code provides the regulatory framework for particular land uses and how those uses interact with each other. It addresses not only the prescribed use of property, but also the scale, massing and placement of buildings, site design and landscaping, and the quantity of off-street parking required. Adopted in 2013, the Unified Development Ordinance (UDO) encourages mixed-use and pedestrian-friendly development. In order to fully implement the UDO, the city engaged in a multi- year remapping process whereby commercial and high-density residential districts were rezoned from the old code’s legacy districts to new UDO zoning districts. The vast majority of those properties were rezoned in November 2015 with an effective date February 14, 2016. Sixty-five parcels totaling approximately 490 acres were reviewed separately by City Council and rezoned to UDO zoning districts in April and May of 2016.
The City of Raleigh currently exercises planning and zoning authority within its incorporated limits (its taxing and service area) as well as its Extra-Territorial Jurisdiction (ETJ), an area outside of the incorporated limits where the City has been granted land use authority by Wake County for the purposes of providing for the orderly development of areas programmed for future annexation in the short term. This chapter primarily addresses the land area within the ETJ boundary (i.e. incorporated limits plus ETJ), as this is the area where the City currently has the power to plan and zone. It is also the area for which detailed land use data are available. All references to the ETJ in this chapter refer to the full area within the ETJ boundary line.
The City also has annexation agreements with Wake County and adjacent municipalities delineating areas outside the current ETJ that are programmed for eventual annexation. These are divided into Short- and Long-Range Urban Service Areas (USAs), depending upon the anticipated time horizon for utility extension. These areas, which will only be addressed generally in this chapter, currently consist primarily of undeveloped land, farm fields, and low- density residential uses.
For further information see:
The 2030 Comprehensive Plan for the City of Raleigh http://www.raleighnc.gov/cp
Raleigh Zoning http://www.raleighnc.gov/zoning
Raleigh Department of City Planning Data Book 2016 19
3.1 Land Use and Zoning Allocation
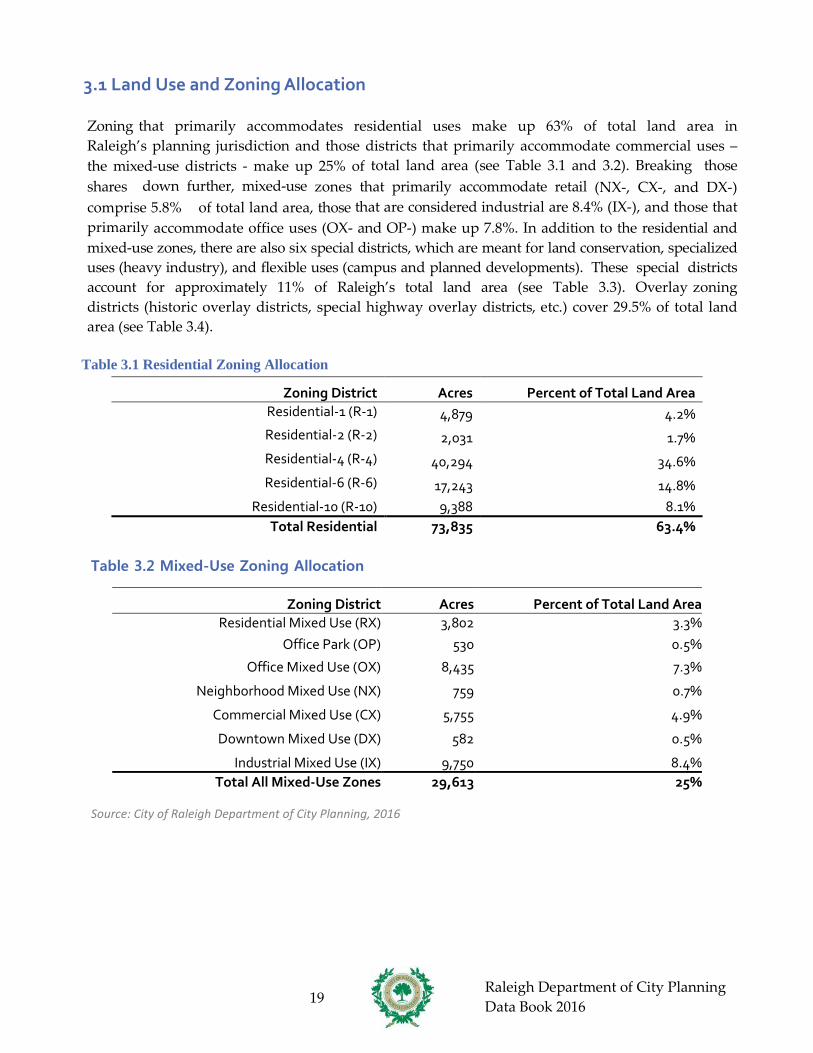
Zoning that primarily accommodates residential uses make up 63% of total land area in Raleigh’s planning jurisdiction and those districts that primarily accommodate commercial uses – the mixed-use districts - make up 25% of total land area (see Table 3.1 and 3.2). Breaking those shares down further, mixed-use zones that primarily accommodate retail (NX-, CX-, and DX-) comprise 5.8% of total land area, those that are considered industrial are 8.4% (IX-), and those that primarily accommodate office uses (OX- and OP-) make up 7.8%. In addition to the residential and mixed-use zones, there are also six special districts, which are meant for land conservation, specialized uses (heavy industry), and flexible uses (campus and planned developments). These special districts account for approximately 11% of Raleigh’s total land area (see Table 3.3). Overlay zoning districts (historic overlay districts, special highway overlay districts, etc.) cover 29.5% of total land area (see Table 3.4).
Table 3.1 Residential Zoning Allocation
Zoning District Acres Percent of Total Land Area Residential-1 (R-1) 4,879 4.2% Residential-2 (R-2) 2,031 1.7% Residential-4 (R-4) 40,294 34.6% Residential-6 (R-6) 17,243 14.8%
Residential-10 (R-10) 9,388 8.1% Total Residential 73,835 63.4%
Table 3.2 Mixed-Use Zoning Allocation
Zoning District Acres Percent of Total Land Area Residential Mixed Use (RX) 3,802 3.3%
Office Park (OP) 530 0.5%
Office Mixed Use (OX) 8,435 7.3%
Neighborhood Mixed Use (NX) 759 0.7%
Commercial Mixed Use (CX) 5,755 4.9%
Downtown Mixed Use (DX) 582 0.5%
Industrial Mixed Use (IX) 9,750 8.4% Total All Mixed-Use Zones 29,613 25%
Source: City of Raleigh Department of City Planning, 2016

Raleigh Department of City Planning Data Book 2016 20
Table 3.3 Special Districts Zoning Allocation
Zoning District Acres Percent of Total Land Area Conservation Management (CM) 2,072 1.8%
Agricultural Productive (AP) 1,959 1.7%
Heavy Industrial (IH) 3,281 2.8%
Manufactured Housing (MH) 820 0.7%
Campus (CMP) 0 0.0%
Planned Development (PD) 4,843 4.2% Total All Special District Zones 12,975 11.1%
Source: City of Raleigh Department of City Planning, 2016
Table 3.4 Overlay Zoning District Allocation
Acres Percent of Land Area
Airport Overlay District (AOD) 2,166 1.9%
Historic Overlay District (HOD) 393 0.3%
Metro-Park Protection Overlay District (MPOD) 1,450 1.3%
Neighborhood Conservation Overlay District (NCOD) 2,920 2.4%
Special Highway Overlay District 1 (SHOD-1) 7,989 6.9%
Special Highway Overlay District 2 (SHOD-2) 5,098 4.4%
Special Residential Parking Overlay District (SRPOD) 8,231 7.1%
Transit Oriented Development Overlay District (TOD) 0 0%
Watershed Protection Area Overlay District (WPOD) 9,534 8.2%
Total Overlay Districts (not accounting for overlap) 37,782 32.5% Total Overlay Districts (accounting for overlap) 34,382 29.5%
Source: City of Raleigh Department of City Planning, 2016

Raleigh Department of City Planning Data Book 2016 21
Figure 3.1 Generalized Zoning Allocation
Source: City of Raleigh Department of City Planning, 2016
A property’s zoning district controls for the range of uses that are allowable on the property. The table below shows the actual uses that properties in Raleigh exhibit. As can be seen in Table 3.5, parcels that account for 44.3% of total acreage in Raleigh have Residential as their primary use, and in particular Single-Unit Living is the predominant use in this category (34.4%). Other significant uses include Public and Institutional (18.2%), Commercial (10.6%), and Industrial (5.6%). Properties that account for approximately 20% of Raleigh’s land area are considered vacant, meaning that there is no discernible use of the property.
Table 3.5 Land Use Allocation
Land Use Category Parcels Acreage Percent
Residential 117,517 44,349.9 44.3% Household Living: Single-Unit Living 88,960 34,408.7 34.4%
Household Living: Townhouse Living 24,527 1,488.6 1.5%
Household Living: Two-Unit Living 1,922 714.8 0.7%
Household Living: Manufactured 24 429.4 0.4%
Household Living: Multi-Unit Living 1,979 6,464.6 6.5%
Group Living 71 213.1 0.2%
Social Service 34 630.7 0.6%
Public and Institutional 3,690 18,238.7 18.2% Civic 476 5,264.3 5.3%
Parks, Open Space, and Greenways 3,134 12,538.9 12.5%
Utilities 80 435.6 0.4%
63.4%
25.4%
11.1%
Residential Districts
Mixed Use Districts
Special Districts

Raleigh Department of City Planning Data Book 2016 22
Table 3.5 Land Use Allocation (cont.)
Land Use Category Parcels Acreage Percent
Commercial 3,509 10,662.3 10.6% Day Care 93 157.0 0.2%
Indoor Recreation 100 441.8 0.4%
Medical 135 365.4 0.4%
Office 1,240 3,779.0 3.8%
Outdoor Recreation 114 2,033.4 2.0%
Overnight Lodging 80 210.7 0.2%
Parking 313 343.3 0.3%
Passenger Terminal 10 15.1 0.0%
Personal Service 158 145.1 0.1%
Restaurant/Bar 348 310.1 0.3%
Retail Sales 762 2,371.4 2.4%
Vehicle Sales/Rental 156 489.9 0.5%
Industrial 1,421 5,637.7 5.6%
Heavy Industrial 133 1,800.4 1.8%
Light Industrial 296 690.2 0.7%
Light Manufacturing 68 146.7 0.1%
Research & Development 10 106.5 0.1%
Self-Service Storage 59 265.9 0.3%
Vehicle Service 333 365.8 0.4%
Warehouse & Distribution 294 1,230.2 1.2%
Waste-Related Service 6 424.0 0.4%
Wholesale Trade 222 607.9 0.6%
Open 18 1,473.9 1.5% Agriculture 14 1,084.4 1.1%
Resource Extraction 4 389.5 0.4%
Mixed Use 115 123.6 0.1%
Vacant 8,990 19,655.9 19.6%
Grand Total 135,260 100,142.0 100.0%
Source: City of Raleigh Department of City Planning, 2015

Raleigh Department of City Planning Data Book 2016 23
3.2 Land Capacity, Annexation, and Growth Potential
The last land capacity estimate was completed in 2014 and was based on Raleigh Code of Ordinances Part 10 zoning districts ("Part 10 Code") rather than the newly adopted Unified Development Ordinance (UDO) districts. With the implementation of the UDO in 2016, all Part 10 districts were rezoned to UDO districts. Because of this change, the estimates found in Table 3.6 do not reflect development entitlements presently in effect.
Table 3.6 Land Capacity Estimates by Zoning District
(For purpose of this analysis, general and conditional use districts have been treated the same, and are aggregated together in this table for simplicity.) *Totals do not include underdeveloped land.*Zoning Districts with residential and commercial types have been allocated at a 50/50 split.
Source: City of Raleigh Department of City Planning and GIS Division, 2014
Zone Total Acres of
Undeveloped Land Projected Square Feet
Non-Residential Projected Dwelling Units CM
AP
R1 853
R-2 613
R-4
R-6
R-10
R-15
R-20
SP R-30
R-30
MH
RB 21.265 12
O&I-1 4,603,033
O&I-2 4,723,683
O&I-3 516,841
BC 10 63,008
SC 2,644,192
NB 670,013
BUS 135,090
TD 9,945,877
IND-1 18,945,777
IND-2 3,172,522
Totals 16,671* 52,327,256

Raleigh Department of City Planning Data Book 2016 24
In 2015, the city added 343 acres through annexation (see Table 3.7). Changes in state laws restricting city-initiated annexations have resulted in petition-only annexations, usually of smaller parcels by individual owners. The total future annexation potential for Raleigh is 41,065 acres (see Table 3.8). This includes both ETJ areas and Urban Services Areas (USA). Combined with the city’s current acreage of 93,642, the total potential city limits acreage is 134,706 acres.
Table 3.7 Annexation, Growth of the City of Raleigh
Year Acres in City Limits Acres Added
1792 400 -
1857 1,124 724
1907 2,577 1,453
1920 4,455 1,878
1941 6,940 2,485
1951 6,974 34
1960 21,548 14,574
1970 28,755 7,207
1980 35,305 6,550
1990 58,493 23,188
2000 75,972 17,479
2010 92,435 16,463
2011 92,710 275
2012 92,838 129
2013 93,047 208
2014 93,306 262
2015 93,652 343
2016 93,775 123
Source: City of Raleigh Department of City Planning, 2016
Table 3.8 Future Growth Potential of Raleigh City Limits
Geography Acres
Current City Limits 93,775
Potential ETJ Growth Area 22,305
Potential USA Growth Area 18,649
Total Future Annexation Potential 40,955
Total Potential City Limits 134,730
Source: City of Raleigh Department of City Planning, 2016

Raleigh Department of City Planning Data Book 2016 25
Chapter 4: Economic Development & Employment Trends
One of the nation’s fastest growing regions, the Research Triangle is benefiting from its long-time investment in major educational and healthcare institutions as well as the Research Triangle Park. The expanding base of technology industries continues to generate new jobs and attract skilled workers to fill them. The area’s highly touted quality of life provides regional employers with a competitive advantage for attracting and retaining qualified workers. The Triangle’s jurisdictions are increasingly connected as employees cross-commute, new businesses develop to serve companies throughout the region, and existing industry spins off new businesses. In conjunction with the region as a whole, Raleigh’s employment base has shifted to one that is more technology-based and less reliant on government and manufacturing. Wake County has shared in the region’s economic health with a growing job base, aiding in the recovery from the 2008 recession. The county’s employment dichotomy is changing however, as technology, retail, and service jobs replace manufacturing and agricultural jobs that have declined as a share of the market historically. In 2000 there were 28,238 manufacturing jobs which contracted to 19,116 in 2010. Since 2010 the county has added back 5,876 additional manufacturing jobs, an important figure considering that this sector accounts for much of the county and region’s overall economic output. In terms of real Gross Domestic Product (GDP) growth, the Raleigh-Cary Metropolitan area grew by 7% ranking 7th in terms of growth out of the nation’s 382 metropolitan areas in 2015 (Table 4.1). The Finance, Insurance, and Real Estate sector contributed 31.7% to real GDP growth, and manufacturing accounted for 25.5% of real GDP growth. These two sectors accounted for more than half of the real GDP growth in the metropolitan area. Slight declines occurred in real GDP growth for Natural Resources and Mining, Transportation and Utilities, and the Public Administration Sectors. Within Raleigh, the state government, North Carolina State University, other educational institutions, and major health care centers have a higher proportion of the employment base. Job growth projections point to a major expansion of jobs in the city by 2040 with even faster growth in the balance of the county. University research and the growing technology sectors within Raleigh are supporting even greater business development in emerging industries. This section evaluates employment trends for the county, identifies key economic sectors and major employers, and provides projections for Raleigh’s future employment based on regional land use coordination efforts.

Raleigh Department of City Planning Data Book 2016 26
4.1 GDP Growth & Employment by Industry
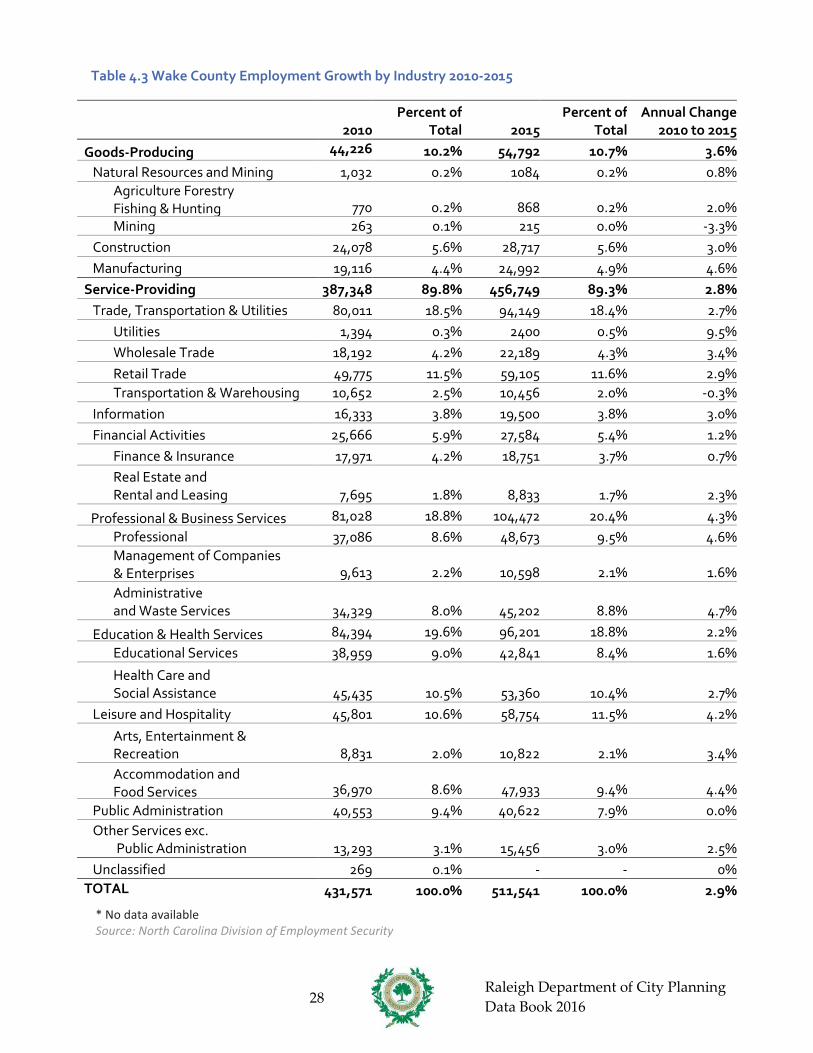
Overall, jobs in the service-providing sector account for a larger share of Wake County’s employment than the goods-producing sector. Currently roughly 9-in-10 jobs are service-providing versus only 1-in-10 in goods-producing industries. This is similar to the United States as a whole which has a slightly higher proportion of good producing jobs than Wake County. In the last 5 years goods-producing jobs – such as those in agriculture, construction, and manufacturing – have grown at a 3.6% annual rate versus 2.8% for service-providing industries (see Tables 4.1 and 4.2). Higher growth in the goods producing sector can be primarily attributed to jobs added in the manufacturing industry.
Despite that growth, the top three industries in terms of jobs in 2015 continue to be in the service- providing industry: Professional and Business Services; Leisure and Hospitality, and; Trade, Transportation, & Utilities. Utilities saw the largest annual percent change in employment (+9.5 %) from 2010-2015, other industries also saw large gains including Administrative and Waste Services (+4.7%), Professional and Technical Services (+4.6 %), and Manufacturing (+4.6 %).
Using the latest data from the 2010-2015 American Community Survey (ACS), Raleigh has a higher percentage of jobs in Arts/Entertainment, Accommodation, and; Finance, Insurance, and Real Estate than the percentages for Wake County, North Carolina, and the U.S (see Figure 4.1). Raleigh is also ahead of the state and the nation in percentage of public administration, professional, scientific, management, and administrative; and information jobs.
Table 4.1 Raleigh –Cary MSA Real GDP Growth
2011 2012 2013 2014 2015 GDP in Current Dollars
(Millions of Dollars) 59,734 60,640 61,374 63,631 68,087
Rank: GDP in current dollars Among Metro Areas
49 49 47 47 44
GDP Percentage Growth 2.7% 1.5% 1.2% 3.7% 7.0% Rank: GDP Percentage Growth
Among Metro Areas 93 144 159 55 7
Source: Bureau of Economic Analysis: GDP by Metropolitan Area 2015

Raleigh Department of City Planning Data Book 2016 27
Table 4.2 Raleigh –Cary MSA Percentage Growth by Sector
Goods Producing 2.09% Natural resources and mining -0.04%
Construction 0.34% Durable-goods manufacturing 1.74%
Nondurable- goods manufacturing 0.05% Service-Providing 4.91%
Trade 1.03% Transportation and utilities -0.26%
Information 0.82% Finance, insurance, real estate, rental, and
leasing 2.22%
Professional and business services 0.76% Educational services, health care, and
social assistance 0.22%
Arts, entertainment, recreation, accommodation, and food services
0.12%
Public Administration -0.05% Other services, except government 0.05%
Total GDP Growth by Percentage 7.00%
Source: Bureau of Economic Analysis: GDP by Metropolitan Area 2015
Raleigh Department of City Planning Data Book 2016 28
Table 4.3 Wake County Employment Growth by Industry 2010-2015
2010 Percent of
Total 2015 Percent of
Total Annual Change
2010 to 2015
Goods-Producing 44,226
10.2% 54,792 10.7% 3.6% Natural Resources and Mining 1,032 0.2% 1084 0.2% 0.8%
Agriculture Forestry Fishing & Hunting 770 0.2% 868 0.2% 2.0%
Mining 263 0.1% 215 0.0% -3.3% Construction 24,078 5.6% 28,717 5.6% 3.0% Manufacturing 19,116 4.4% 24,992 4.9% 4.6%
Service-Providing 387,348 89.8% 456,749 89.3% 2.8% Trade, Transportation & Utilities 80,011 18.5% 94,149 18.4% 2.7%
Utilities 1,394 0.3% 2400 0.5% 9.5% Wholesale Trade 18,192 4.2% 22,189 4.3% 3.4% Retail Trade 49,775 11.5% 59,105 11.6% 2.9% Transportation & Warehousing 10,652 2.5% 10,456 2.0% -0.3%
Information 16,333 3.8% 19,500 3.8% 3.0% Financial Activities 25,666 5.9% 27,584 5.4% 1.2%
Finance & Insurance 17,971 4.2% 18,751 3.7% 0.7% Real Estate and
Rental and Leasing 7,695 1.8% 8,833 1.7% 2.3%
Professional & Business Services 81,028 18.8% 104,472 20.4% 4.3% Professional
37,086 8.6% 48,673 9.5% 4.6%
Management of Companies & Enterprises 9,613 2.2% 10,598 2.1% 1.6%
Administrative and Waste Services 34,329 8.0% 45,202 8.8% 4.7%
Education & Health Services 84,394 19.6% 96,201 18.8% 2.2% Educational Services 38,959 9.0% 42,841 8.4% 1.6%
Health Care and Social Assistance 45,435 10.5% 53,360 10.4% 2.7%
Leisure and Hospitality 45,801 10.6% 58,754 11.5% 4.2%
Arts, Entertainment & Recreation 8,831 2.0% 10,822 2.1% 3.4%
Accommodation and Food Services 36,970 8.6% 47,933 9.4% 4.4%
Public Administration 40,553 9.4% 40,622 7.9% 0.0% Other Services exc.
Public Administration 13,293 3.1% 15,456 3.0% 2.5% Unclassified 269 0.1% - - 0%
TOTAL 431,571 100.0% 511,541 100.0% 2.9%
* No data available Source: North Carolina Division of Employment Security

Raleigh Department of City Planning Data Book 2016 29
Table 4.4 Wake County Employment by Industry by Year
2009 2010 2011 2012 2013 2014 2015 Goods-Producing 47,434 44,226 44,837 44,795 49,414 50,919 54,792
Natural Resources and
1,447 1,032 1,007 1,028 1126 1089 1084 Agriculture Forestry Fishing & Hunting
899 770 749 788 881 858 868
Mining 548 263 258 240 245 231 215 Construction 25,267 24,078 24,506 25,204 25,763 27,223 28,717 Manufacturing 20,720 19,116 19,324 18,563 22,525 22,607 24,99
Service-Providing 385,001 387,348 397,025 411,023 424,55
439,54
456, Trade, Transportation &
Utilities 80,066 80,011 82,110 84,710 84,631 89,439 94,149
Utilities 1,363 1,394 1,397 * * 2327 2400 Wholesale Trade 18,563 18,192 19,152 20,990 20,540 21,009 22,189 Retail Trade 49,435 49,775 51,037 52,040 53,622 56,105 59,105 Transportation and Warehousing
10,708 10,652 10,524 10,468 9,594 9,998 10,456
Information 16,461 16,333 16,963 17,447 17,664 18,433 19,500 Financial Activities 25,375 25,666 25,142 25,030 24,952 25,513 27,584
Finance & Insurance 17,250 17,971 17,463 17,298 17,010 17,373 18,751 Real Estate and Rental and Leasing
8,125 7,695 7,680 7,732 7,942 8,140 8,833
Professional and Business Services
78,473 81,028 85,987 91,441 99,455 102,826
104,472
Professional and Technical Services
36,852 37,086 39,563 42,177 45,296 47,185 48,673
Management of Companies & Enterprises
9,553 9,613 10,232 10,142 10,660 10,277 10,598
Administrative and Waste Services
32,068 34,329 36,192 39,122 43,499 45,364 45,202
Education & Health Services 85,467 84,394 85,780 88,177 90,081 92,437 96,201 Educational Services 39,575 38,959 39,388 40,420 40,715 42,062 42,841 Health Care and Social Assistance
46,989 45,435 46,392 47,758 49,366 50,375 53,360
Leisure and Hospitality 45,285 45,801 47,918 50,765 53,180 55,501 58,754 Arts, Entertainment & Recreation
8,847 8,831 9,105 9,293 9,892 9,973 10,822
Accommodation and Food Services
36,439 36,970 38,813 41,473 43,288 45,528 47,933
Public Administration 39,551 40,553 39,491 38,789 39,768 40,138 40,62 Other Services exc.
Public Administration 13,066 13,293 13,634 14,659 14,820 15,256 15,456
Unclassified 1257 269 * 5 * * * TOTAL 432,430 431,571 441,859 455,814 473,96
490,46
511,
* No data available Source: North Carolina Division of Employment Security

Raleigh Department of City Planning Data Book 2016 30
Figure 4.1 Jobs by Industry Comparison, 2015
Source: 2010 - 2015 American Community Survey, 5-year Estimates
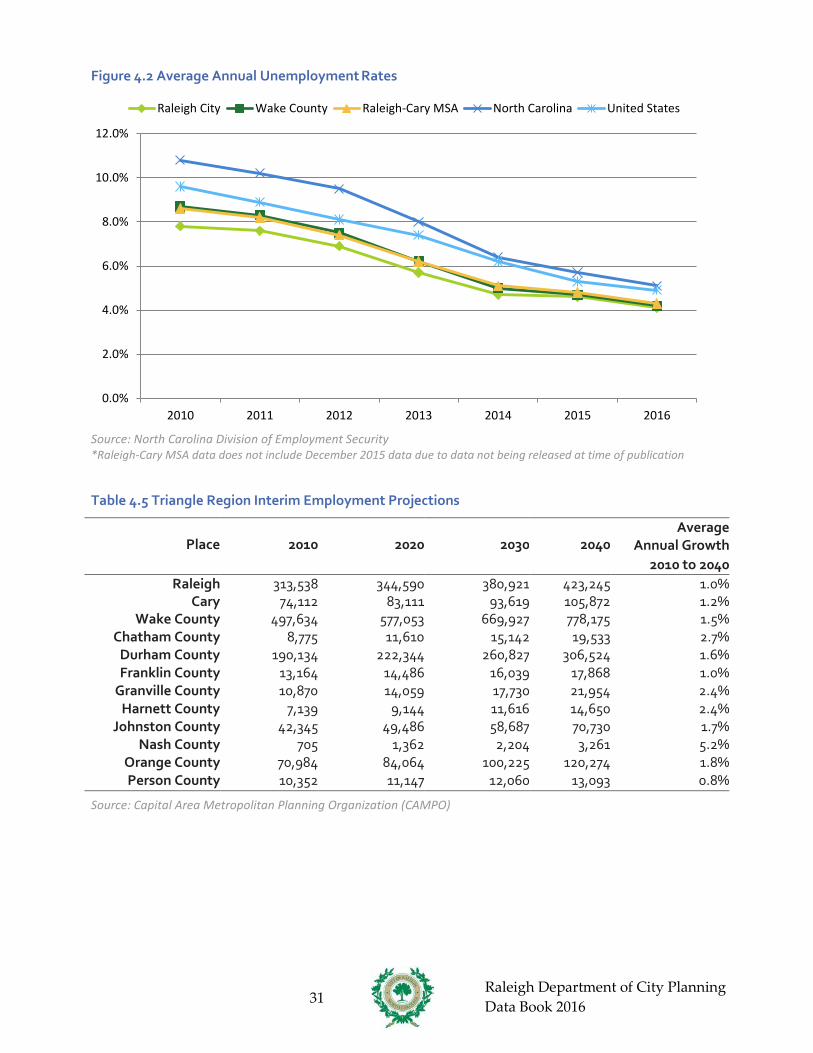
4.2 Unemployment Rates and Employment Projections In Raleigh, the unemployment rate peaked in 2010, reaching a high of 7.8%. Since then unemployment rates have steadily declined as economic recovery continues to take place after the Great Recession. The current unemployment rate is 4.1% for Raleigh, the lowest rate since 2007. From 2010 to 2016, Raleigh’s unemployment rate remained lower than Wake County, the Raleigh- Cary MSA, North Carolina, and the U.S. Over the last two years unemployment numbers within Raleigh, Wake County and the MSA differed by only a few tenths of a percentage point, indicating a healthy job market for the entire region (see Figure 4.2). According to a model created by the Capital Area Metropolitan Planning Organization (CAMPO) with input from municipalities across the Triangle region, Raleigh is expected to add over 100,000 jobs from 2010 to 2040, an average increase of 1% every year (see Table 4.4 and Figure 4.3). Wake County is expected to add the most jobs in the region in terms of raw numbers; however several exurban counties are projected to have higher annual job growth rates, including Chatham County, Granville County, Nash County, and Harnett County. Looking at the types of projected new jobs, the model shows the following breakdown for new jobs projected to be created in Raleigh during the 2010-2040 time period: 66% in the service sector, 16% in office, 7% in retail, 6% in industrial, and 5% in highway (see Table 4.6). More information on the employment projection model can be found here: http://www.campo- nc.us/planning-for-the-future.
0.0% 5.0% 10.0% 15.0% 20.0% 25.0%
Agriculture, forestry, mining, etc.
Construction
Manufacturing
Wholesale trade
Retail trade
Transportation and warehousing, and utilities
Information
Finance, insurance, and real estate
Professional, scientific, etc.
Educational and health services
Arts/entertainment, accommodation, etc.
Other services
Public administration
United States North Carolina Wake County Raleigh
Raleigh Department of City Planning Data Book 2016 31
Figure 4.2 Average Annual Unemployment Rates
Source: North Carolina Division of Employment Security *Raleigh-Cary MSA data does not include December 2015 data due to data not being released at time of publication Table 4.5 Triangle Region Interim Employment Projections
Place
2010
2020
2030
2040
Average Annual Growth
2010 to 2040 Raleigh 313,538 344,590 380,921 423,245 1.0%
Cary 74,112 83,111 93,619 105,872 1.2% Wake County 497,634 577,053 669,927 778,175 1.5%
Chatham County 8,775 11,610 15,142 19,533 2.7% Durham County 190,134 222,344 260,827 306,524 1.6% Franklin County 13,164 14,486 16,039 17,868 1.0%
Granville County 10,870 14,059 17,730 21,954 2.4% Harnett County 7,139 9,144 11,616 14,650 2.4%
Johnston County 42,345 49,486 58,687 70,730 1.7% Nash County 705 1,362 2,204 3,261 5.2%
Orange County 70,984 84,064 100,225 120,274 1.8% Person County 10,352 11,147 12,060 13,093 0.8%
Source: Capital Area Metropolitan Planning Organization (CAMPO)
0.0%
2.0%
4.0%
6.0%
8.0%
10.0%
12.0%
2010 2011 2012 2013 2014 2015 2016
Raleigh City Wake County Raleigh-Cary MSA North Carolina United States

Raleigh Department of City Planning Data Book 2016 32
Figure 4.3 Triangle Region Employment Projections, 2010 and 2040
450
400
350
300
250
200
150
100
2010
2040
50
0
Note: Remaining Wake County excludes Raleigh and Cary Source: Capital Area Metropolitan Planning Organization (CAMPO)
Table 4.6 Sector Share of Projected New Jobs, 2010-2040
Place Industrial Office Service Retail Highway Total Raleigh 6% 16% 66% 7% 5% 100%
Unincorporated Wake County 10% 9% 71% 4% 6% 100% Other jurisdictions 9% 11% 64% 7% 10% 100% Countywide Total 8% 13% 65% 7% 8% 100%
Source: Capital Area Metropolitan Planning Organization (CAMPO)
4.3 Major Employers and New & Expanding Companies The major employers in Wake County are concentrated in the following industries: public administration; education & health services; professional and business services; information, and; trade, transportation, and utilities. The ten largest individual employers in Raleigh include the State, Wake County Public Schools, and WakeMed Hospitals; together these ten organizations account for approximately 80,000 jobs. In 2016, 45 major companies announced either new operations or expansions of present operations in Raleigh creating 2,795 new jobs, and additional investment of 224 million dollars in capital costs, facilities, and payroll (see Table 4.8).

Raleigh Department of City Planning Data Book 2016 33
Table 4.7 Major Employers located in Raleigh, 2015
Rank
Name
Countywide Employment
(Approximate)
Industry
Location in Raleigh
1 State of North Carolina 24,083 Public Administration Yes
2 Wake County Public School System
18,554 Education & Health Services
Yes
3 WakeMed Health & Hospitals 8,422 Education & Health Services
Yes
4 North Carolina State University
7,876 Education & Health Services
Yes
5 Rex Healthcare 5,300 Education & Health Services
Yes
6 N.C. DHHS 3,800 Public Administration Yes
7 Duke Energy Progress 3,700 Trade, Transportation & Utilities
Yes
8 Wake County Government 3,692 Public Administration Yes
9 City of Raleigh 3,673 Public Administration Yes
10 Fidelity Investments 2,900 Financial Activities Yes
Source: Greater Raleigh Chamber of Commerce/Wake County Economic Development Figure 4.4 Largest 10 Employers located in Raleigh, 2015
Source: Greater Raleigh Chamber of Commerce/Wake County Economic Development
0 5,000 10,000 15,000 20,000 25,000 30,000
State of North Carolina
Wake County Public School System
WakeMed Health & Hospitals
North Carolina State University
Rex Healthcare
N.C. DHHS
Duke Energy Progress
Wake County Government
City of Raleigh
Fidelity Investments
Countywide Employment (approximate)

Raleigh Department of City Planning Data Book 2016 34
Table 4.8 New & Expanding Companies Raleigh, 2016
Name New Jobs Investment ($ millions)
New or Expanding
Industry
Acorn Applications 5 n/a Expanding Software/IT
Ateb n/a $3,000,000 Expanding Other
AX Control Inc. n/a n/a Expanding Software/IT
BDO 84 n/a Expanding Financial Services
Campbell University Law School
n/a n/a Expanding Educational
Citrix n/a n/a Expanding Software/IT
Cohera Medical 50 n/a New Advanced Medical
Distil Networks n/a n/a Expanding Software/IT
Do Supply Inc. n/a n/a Expanding Other
FilterEasy 20 n/a Expanding Start-up
First Tennessee Bank n/a n/a Expanding Financial Services
Foundation Medicine 170 $11,900,000 New Advanced Medical
FUJIFILM Diosynth Biotechnologies
n/a n/a Expanding Software/IT
Hall, Render, Killian, Health & Lyman
3 n/a New Law Firm
HomeTrust Bank n/a n/a Expanding Financial Services
Improved Nature 150 New $3,000,000 Food Processing
Industrious n/a n/a Expanding Co-Working Group
Inform Systems Technologies
n/a n/a New Software/IT
Infusion n/a n/a Expanding Software/IT
Kellogg's Snacks n/a $19,500,000 Expanding Food
La Farm Bakery n/a n/a Expanding Bakery
Lassiter Distilling Company n/a n/a New Beverage
Processing
LexisNexis 150 n/a Expanding Software/IT
Mann + Hummel n/a n/a Expanding Smart Grid
McGuireWoods 3 n/a Expanding Law Firm
MGA Business Consulting 9 n/a New Professional
Services
Microsoft n/a n/a New Software/IT
Netsertive n/a n/a Expanding Software/IT

Raleigh Department of City Planning Data Book 2016 35
Table 4.8 New & Expanding Companies Raleigh, 2016 (cont.)
Name New Jobs Investment ($ millions)
New or Expanding
Industry
North Carolina Department of Agriculture and
Consumer Services 200 $94,000,000 Expanding Life Sciences
Peak 10 Inc. n/a n/a Expanding Data/Call Centers
PeriGen 51 n/a New Advanced Medical
Relias Learning 450 $43,500,000 Expanding Software/IT
Scientific Games n/a n/a
New Interactive Digital
Media/Gaming
Sokal Media Group 80 n/a
Expanding Automotive Advertising
Southern First Bank n/a n/a New Financial Services
Strategic Behavioral Health, LLC
30 $2,200,000 Expanding Healthcare
Sugar Euphoria n/a n/a Expanding Bakery
TEKSystems n/a n/a Expanding Software/IT
The Sembler Co. n/a n/a New Developer
UNC Health Care 1,000 n/a Expanding Healthcare
Valencell 10 n/a Expanding Software/IT
Wake Technical Community College
n/a $47,000,000
Expanding Education
WalkMe 100 n/a New Software/IT
Source: Greater Raleigh Chamber of Commerce/Wake County Economic Development

Raleigh Department of City Planning Data Book 2016 36
4.4 Non-Residential Building Activity After a robust year of non-residential building in 2015, Raleigh continues to see strong activity in non- residential development. Permits issued are up by 201from the previous year. The amount of overall square footage permitted gained 340,820 sq ft year-to-year. The value of total construction decreased from the previous year by nearly $109 million or 26.2%. This can be mainly attributed to lower commercial and institutional building activity. Raleigh saw the lowest amount of commercial building activity in the last 10 years of building permit data. Office construction, on the other hand, saw the highest construction value since 2010 and the second highest amount of square footage permitted behind only the 2014 figures. The majority of this new office space is permitted for the Dillon, a new mixed-use development under construction in the Warehouse District downtown. Industrial building activity saw the highest square footage and construction value in the last 10 years, primarily from a flurry of new self-service storage construction. Table 4.9 Raleigh Commercial Building Activity
Year No. of Permits Square Feet Construction Value
2007 56 1,357,355 $190,443,492 2008 47 1,494,755 $150,132,467 2009 30 691,702 $101,233,024 2010 25 669,286 $99,136,446 2011 20 317,563 $30,390,667 2012 10 277,020 $28,680,914 2013 16 246,234 $27,798,301 2014 24 596,375 $65,179,067 2015 23 709,735 $100,908,455 2016 17 210,008 $21,380,365
TOTAL 268 6,570,033 $815,283,198 Source: City of Raleigh Inspections Department Table 4.10 Raleigh Office Building Activity
Year No. of Permits Square Feet Construction Value 2007 55 1,073,572 $81,385,165 2008 48 2,269,863 $178,803,437 2009 30 517,432 $44,230,191 2010 11 1,077,530 $237,682,996 2011 18 398,962 $38,756,590 2012 19 686,796 $52,249,057 2013 9 363,100 $26,180,658 2014 20 1,701,591 $109,896,279 2015 15 947,374 $123,938,256 2016 14 1,325,832 $133,437,403
TOTAL 239 10,362052 $1,025,560,032
Source: City of Raleigh Inspections Department

Raleigh Department of City Planning Data Book 2016 37
Table 4.11 Raleigh Industrial Building Activity
Year No. of Permits Square Feet Construction Value 2007 40 659,898 $37,177,945 2008 12 151,908 $9,270,036 2009 9 141,810 $7,789,500 2010 7 170,680 $10,182,575 2011 7 33,913 $1,276,400 2012 5 124,327 $5,485,533 2013 5 149,230 $7,017,000 2014 9 142,889 $8,609,361 2015 16 395,375 $20,555,006 2016 39 1,256,019 $56,523,605
TOTAL 149 3,226,038 $163,886,961 Source: City of Raleigh Inspections Department Table 4.12 Raleigh Institutional Building Activity
Year No. of Permits Square Feet Construction Value 2007 56 592,216 $80,695,549 2008 68 482,000 $158,807,201 2009 27 697,327 $59,053,672 2010 29 415,985 $49,697,344 2011 30 280,692 $72,245,736 2012 14 104,310 $13,953,376 2013 19 239,599 $26,949,240 2014 36 1,351,236 $273,003,337 2015 23 749,370 $121,194,803 2016 14 296,309 $21,368,840
TOTAL 316 5,209,044 $876,969,098 Source: City of Raleigh Inspections Department *Includes uses such as hospitals, schools, community centers, community clubhouses, and retirement homes Table 4.13 Raleigh Other* Building Activity
Year No. of Permits Square Feet Construction Value 2007 171 1,813,719 $65,301,239 2008 135 1,989,683 $166,667,759 2009 76 1,040,954 $31,560,301 2010 72 255,093 $8,686,844 2011 108 553,061 $24,449,866 2012 128 980,698 $59,194,918 2013 101 623,262 $31,359,616 2014 109 1,475,172 $125,935,249 2015 122 1,049,419 $49,226,608 2016 117 1,103,925 $74,132,590
TOTAL 1,139 10,884,986 $636514990
Source: City of Raleigh Inspections Department *Includes parking garages, out buildings, cell phone towers, etc

Raleigh Department of City Planning Data Book 2016 38
Table 4.14 Raleigh Total Building Activity
Year No. of Permits Square Feet Construction Value 2007 378 5,496,760 $455,003,390 2008 310 6,388,209 $663,680,900 2009 172 3,089,225 $243,866,688 2010 144 2,588,574 $405,386,205 2011 183 1,584,191 $167,119,259 2012 176 2,173,151 $159,563,798 2013 150 1,621,425 $119,304,815 2014 198 5,267,263 $582,623,293 2015 199 3,851,273 $415,822,608 2016 201 4,192,093 $306,842,803
TOTAL 2111 36,252,164 $3,619,213,759
Source: City of Raleigh Inspections Department Figure 4.5 Raleigh All Non-Residential Building Activity
Source: City of Raleigh Inspections Department
$0
$100
$200
$300
$400
$500
$600
$700
0
1
2
3
4
5
6
7
Dollars (in M
illions) Ar
ea
(Sq
Ft M
illio
ns)
Square Feet Construction Value

Raleigh Department of City Planning Data Book 2016 39
4.4 Cost of Living
Founded in 1961, the Council for Community and Economic Research (C2ER) has been conducting city-to-city cost-of-living comparisons for over 50 years. Their 2016 Cost of Living Index assessed Raleigh as having a lower composite cost of living score than peer cities such as Atlanta, GA, Charlotte, NC, and Austin, TX (see Table 4.13). Significantly, Raleigh had a very low cost of housing score as compared to the national average, and it ranked as the third lowest cost city among the country’s largest 40 metropolitan areas. Table 4.15 Metro Area Cost of Living Index Comparison, 2016 Annual Average Data
100% Composite
Index
Grocery Items
Housing
Utilities
Transportation
Health Care
Misc. Goods & Services
Raleigh, NC 92.7 109 67.6 96.5 93.6 102 104.7 Atlanta, GA 98.2 104.9 86.8 105.2 102.3 107.5 100.4
Austin, TX 94.3 86.3 92.7 99.5 95.4 102.3 95.7 Charlotte, NC 94.9 93.4 82.9 92.3 99 101.8 104.2
Nashville- Franklin, TN
93.5 95.0 84.5 91.6 91.9 82.7 103.1
Orlando, FL 93.8 101.0 88.2 96.4 96.5 86.3 94.8 Charleston, SC 104.3 102.6 97.5 123.6 93.5 101.0 108.7
Source: Council for Community and Economic Research (C2ER), Cost of Living Index, 2016 Annual Average Data Each quarter C2ER collects data and publishes cost of living information for participating Metro-Micro Urban Areas in the United States. To determine overall cost of living, the relative affordability of certain items (groceries, housing, utilities, transportation, health care, and miscellaneous goods and services) are indexed and a composite figure is calculated and then compared to the national average of 100. values lower than 100 indicate a lower cost living compared to the national average, and costs over 100 means the cost of living exceeds the national average. Since the index does not measure inflation and each quarterly report is a "snap shot" of a single point in time, index data from different quarters should not be compared.

Raleigh Department of City Planning Data Book 2016 40
Chapter 5: Housing and Neighborhoods The City of Raleigh administers several programs to increase the supply of affordable housing and to stabilize and improve older neighborhoods that need additional resources. Many of these programs have been successful due to the City’s partnership with other governmental entities, for-profit and nonprofit organizations, and local residents. The ultimate goal of housing programs is to increase housing opportunities for existing and future residents and to create diverse neighborhoods of choice that attract new investment and which do not exclude residents due to housing costs or discriminatory practices.
5.1 Housing Affordability
Based on the 2015 American Community Survey (ACS), 47% of Raleigh’s renter households pay more than 30% of their income in housing costs compared to 22% for owner households (see Table 5.1). Households with annual income of less than $50,000 – both renter and owner – are particularly burdened by housing costs. Comparing the fair market rent for a 1-bedroom apartment in the Raleigh metro area to affordable housing costs (30% of income) for renter households making less than $35,000 reveals affordability gaps of varying magnitude (see Table 5.2). The City of Raleigh funds and/or operates several programs to alleviate housing need in the community (Table 5.3).
Table 5.1 Raleigh Households Below $50,000 Annual Income with 30%+ Cost Burden, 2015
Renters Annual Income Category
Total Renter Households
Number of Burdened Households
Percent of Burdened Households
Less than $10,000 8,569 6,283 73% $10,000 to $19,999 10,569 9,131 86% $20,000 to $34,999 18,929 16,318 86% $35,000 to $49,999 16,319 6,133 38%
All Households <$50,000 54,386 37,865 70% $50,000 or more 32,298 3,091 10%
All Households 86,684 40,956 47%
Owners Annual Income Category
Total Owner Households
Number of Burdened Households
Percent of Burdened Households
Less than $20,000 4,310 3,919 91% $20,000 to $34,999 9,821 6,571 67% $35,000 to $49,999 10,250 4,576 45%
All Households <$50,000 24,381 15,066 62% $50,000 or more 66,880 5,031 8% All Households 91,261 20,097 22%
Source: 2015 American Community Survey 1-year Estimates, Table B25074, Household Income by Gross Rent as a Percentage of Household Income; Table B25106, Tenure by Housing Costs as a Percentage of Household Income

Raleigh Department of City Planning Data Book 2016 41
Table 5.2 Comparison of Renter Household Income, Affordable Housing Costs, and Fair Market Rent
Annual Income Category
Total Renter Households
Affordable Housing Costs at 30% of
Income
Fair Market Rent for 1 Bedroom
Apartment*
Affordability Gap Less than $10,000 8,569 $250
(based on $10,000) $774 ($524)
$10,000 to $19,999 10,569 $375 (based on $15,000)
$774 ($399)
$20,000 to $34,999 18,929 $687 (based on $27,500)
$774 ($87)
All Households ≤ $34,999 38,067
*This figure is for the Raleigh-Cary Metropolitan Statistical Area (MSA). Source: 2015 American Community Survey,1-year Estimates; U.S. Department of Housing and Urban Development, FY2015 Fair Market Rent Documentation System Table 5.3 Number of Assisted Affordable Housing Units
City of Raleigh Affordable Rental Units 195 Raleigh Housing Authority Units 1,444
Rental Units with Funding from HUD (HOME and CDBG) 1,133 Low-Income Housing Tax Credit (LIHTC) Units (no City funds) 3,164
Rental Units with Funding from City of Raleigh (Joint Venture) 3,380 Homeownership Units with Funding from City of Raleigh 498
Second Mortgages Provided by City of Raleigh 1,275 Raleigh Housing Authority Housing Choice Vouchers (Section 8) 3,869
Total 14,958
Source: City of Raleigh Department of Housing & Neighborhoods, 2016

Raleigh Department of City Planning Data Book 2016 42
5.2 Home Sales, Average Rent, Residential Building Activity In constant dollars, the median sales price for single-family detached units has increased from 2009 to 2016 with fluctuations in the intervening years (see Table 5.4). Median sales prices for townhouses and condominiums both decreased over this time period, although there were yearly fluctuations. Single-family detached homes and townhouses both saw marginal increases in median sales price from 2015 to 2016. The median sales price for condominiums increased by more than $10,000, recovering from the steep decline of the previous five years (see Table 5.5). Looking at residential sales by price range, the highest number of single-family homes sold during 2016 had a price tag of over $400,000, although sales of homes in the $150,001 to $200,000 and $201,000 to $250,000 ranges were not far behind (see Table 5.6). For townhouses, the price range with the highest number of sales was $150,001 to $200,000. Condominiums selling for $100,001 to $150,000 had the highest sales volume. For all residential units combined, the largest number of sales was in the $150,001 to $200,000 category. Cost of living data from the American Community Survey indicates that growth in median rents for the city of Raleigh has slowed moderately in 2015 after four years of slightly faster increase (see Table 5.7). In 2015, median gross rent in the city was estimated to be $926. Looking at residential permit activity for 2016, apartments represented the largest category in terms of dwelling unit numbers. There were 1,991 apartment units permitted, comprising 58% of all permitted dwelling units. Single family construction had the largest share of square footage, at 54%, and construction value, with 62% (see Table 5.8). The single-family share of dwelling units permitted increased from 24% to 32% between 2015 and 2016. This increase helps to explain why total dwelling units per year fell by 15.6%, yet the total value of permitted construction increased by 2.7% Table 5.4 Median Sales Price by Unit Type (in 2016 dollars)
2010 2011 2012 2013 2014 2015 2016 Single-Family Detached $245,187 $227,644 $240,174 $239,911 $236,727 $250,623 $254,000
Townhouse $178,118 $157,680 $163,945 $167,524 $165,252 $172,399 $175,000 Condominium $147,330 $140,449 $140,972 $125,385 $127,742 $125,565 $136,000
Source: Wake County Revenue Department Table 5.5 Percent Change in Median Sales Price by Unit Type (in 2016 dollars)
2010 to 2011
2011 to 2012
2012 to 2013
2013 to 2014
2014 to 2015
2015 to 2016
Single-Family Detached -7.2% 5.5% -0.1% -1.3% 5.9% 1.3% Townhouse -11.5% 4.0% 2.2% -1.4% 4.3% 1.5%
Condominium -4.7% 0.4% -11.1% 1.9% -1.7% 8.3%
Source: Wake County Revenue Department

Raleigh Department of City Planning Data Book 2016 43
Table 5.6 Numbers of Residential Sales by Price Range and Type of Unit, 2016
Price Range of Sales Single Family Townhouse Condo All Units $25,000 - $100,000 98 116 191 405
$100,001 - $150,000 544 679 309 1,532 $150,001 - $200,000 1,062 782 86 1,930 $200,001 - $250,000 921 367 72 1,360 $250,001 - $300,000 751 223 40 1,014 $300,001 - $350,000 479 72 73 624 $350,001 - $400,000 370 32 38 440
over $400,000 1,097 69 50 1,216
Total 5,322 2,340 859 8,521
Source: Wake County Revenue Department Table 5.7 Raleigh Annual Median Gross Apartment Rent
Year Gross Rent 2011 $855 2012 $875 2013 $897 2014 $914
2015 $926
Source: 2007-2011, 2008-2012, 2009-2013, 2010-2014, and 2011-2015 American Community Survey 5-year Estimates
Table 5.8 Raleigh Residential Building Activity, 2016
Residential Type No. of Units Permitted Square Feet Construction Value Single Family 1,097 3,737,651 $381,110,337
Townhouse 312 641,761 $36,898,697 2-4 Attached Units 26 45,167 $3,231,414
Condominium 24 47,115 $358,602 Apartment 1,991 2,477,700 $194,028,461
TOTAL 3,450 6,949,394 $615,627,511
Source: City of Raleigh Inspections Department *Refer to Figure 2.8 for a multi-year comparison of residential units permitted

Raleigh Department of City Planning Data Book 2016 44
Chapter 6: Transportation
This section provides an overview of existing and planned transportation investments and identifies the primary challenges facing the City of Raleigh’s transportation system within a regional context. 6.1 Context
The performance of the transportation system is a major factor impacting a community’s economic prosperity and quality of life. The transportation system provides for accessibility to employment, services, goods, entertainment, and other daily needs. It also provides longer-distance mobility of people and goods, and over the long term, it influences patterns of growth and the level of economic activity. The Comprehensive Plan as well as adopted specialized transportation plans and studies helps Raleigh guide future development of its streets and highways, public transportation systems, bicycle network, pedestrian network, and greenway trail network. Together, all of these modes of transportation provide accessibility and mobility in support of desired land use patterns, community form, and sense of place. The City of Raleigh depends on several organizations for transportation planning and implementation. The key organizations involved with transportation planning and implementation are:
• Capital Area Metropolitan Planning Organization (CAMPO): Long range regional planning, capital improvement planning
• North Carolina Department of Transportation (NCDOT): Long range planning on some major streets, capital improvement planning, construction/implementation on some major streets
• Raleigh Department of City Planning: Long range planning, capital improvement planning • City of Raleigh Public Works Department: Construction, implementation, and operation of
the transportation system • GoTriangle: Long range regional transit planning, capital improvement planning,
construction and implementation 6.2 Capital Improvement Program The following is excerpted from the City of Raleigh Capital Improvement Plan (CIP) for fiscal years 2015 through 2019:
“The transportation capital program includes major street construction, street improvements, pedestrian and bicycle projects, downtown parking improvements, and transit projects. Total proposed funding for the five-year program is $150.6 million with $53.3 million planned for FY2015. The CIP programs the $75 million transportation bond passed by voters in October 2013. The General Fund budget includes a 1.02 cent tax increase to fund the debt service and operating costs for the referendum. The CIP also programs the remaining budget from the 2011 transportation bond. All capital projects are consistent with the adopted goals of the

Raleigh Department of City Planning Data Book 2016 45
2030 Comprehensive Plan and incorporate "Complete Streets" principles, integrating bicycle, pedestrian and transit system elements into each project. The CIP includes matching city funds for several projects planned by the North Carolina Department of Transportation (NCDOT), which include two bridge replacements in 2016 (Wade Avenue and Peace Street bridge replacements on Capital Boulevard) and two highway improvement projects (widening of the I-440 Beltline in southwest Raleigh, and improvements to the US 70 Corridor from Duraleigh Road to I-540).
The CIP also invests $8.9 million in the city’s transit system, including facility maintenance and equipment replacement. This is roughly a 30% increase in planned investments in the transit system, allowing the city to leverage additional federal funds for transit improvements. The bicycle and pedestrian program includes $8.2 million for sidewalk construction, maintenance, repair, streetlight installations, and bicycle facility improvements. Lastly, the CIP includes $3.2 million for maintenance and improvements at downtown parking decks.”
Table 6.1 shows the allocation of CIP funds in greater detail. Table 6.1 Transportation Capital Improvement Program
Project Category FY2015 FY2016 FY2017 FY2018 FY2019 5 Year Total
Major Street Projects $26.2 M $23.5 M $17.4 M $500,000 $484,000 $68.1 M
Street Improvement Program $20.9 M $10 M $9.83 M $10.1 M $10 M $60.9 M
Bicycle and Pedestrian Improvements $3.25 M $2.73 M $740,000 $670,000 $826,000 $8.21 M
Studies and Planning Projects $335,000 $100,000 $500,000 $250,000 $100,000 $1.29 M
Transit $1.93 M $1.73 M $1.73 M $1.73 M $1.73 M $8.85 M
Parking $670,000 $630,000 $660,000 $640,000 $640,000 $3.24 M
Total Transportation Capital Improvement
Program
$53.3 M $38.8 M $30.9 M $13.9 M $13.8 M $150.6 M
The City of Raleigh’s fiscal year is from July 1 to June 30; FY2017 corresponds to the year beginning July 1,
Source: Raleigh Department of City Planning, Office of Transportation Planning

Raleigh Department of City Planning Data Book 2016 46
6.3 Federal Funding In addition to municipal bonds and the General Fund, federal grants are a significant source of funding for transportation improvements. These grants come from a variety of sources and serve distinct goals. City officials choose to accept federal grants based on their alignment with existing transportation policies and initiatives. Table 6.2 shows the amounts and uses of grants awarded for the period between 2012 and 2017. Table 6.2 Federal Grant Allocations for Transportation Projects, 2012 – 2017
Project Description STP-DA CMAQ TIGER
Wake Forest/Blount/Person Complete Streets $1.27 M
Walnut Creek Greenway Trail – Trailwood Segment $680,000
Crabtree Creek Greenway Trail West $1.55 M
Lake Wheeler Road Improvements $1.72 M
Creedmoor Road Sidewalk Improvements $1.20 M
I-40 Overpass Pedestrian Retrofits/Improvements $2.54 M
Capital Boulevard Improvements $860,000
Six Forks Road Sidewalk Improvements $510,000
Downtown Pedestrian Safety Improvements $0.12 M
Citywide Bicycle Improvement Projects $480,000
Union Station Phase 1 $38 M
Capital Boulevard/Peace Street Bridge Replacement $5 M
New Bern Avenue Pedestrian/Transit Improvements $1.75 M
Leesville Road Safe Routes to School $450,000
Raleigh Bikeshare Implementation $1.67 M STP-DA: Surface Transportation Program - Direct Allocation
CMAQ: EPA Congestion Mitigation and Air Quality Improvement Program
TIGER: USDOT Transportation Investment Generating Economic Recovery
Source: Raleigh Department of City Planning, Office of Transportation Planning Transportation Projects can be tracked with the Transportation Project Map, available in the Resources section on this page: http://www.raleighnc.gov/business/content/PlanDev/Articles/TransPlan/TransportationPlanning.html

Raleigh Department of City Planning Data Book 2016 47
Chapter 7: Public Utilities
The City’s public utilities are regional in nature. The City of Raleigh Public Utilities Department (CoRPUD) has merged with all the municipal utilities in eastern Wake County including Garner, Rolesville, Wake Forest, Knightdale, Wendell, and Zebulon. Furthermore, the Towns of Fuquay-Varina and Holly Springs periodically rely on the City for potable water supply. Planning the infrastructure of the entire water system must be with the perspective of the entire region.
7.1 Water Supply The majority of Raleigh’s water supply comes from Falls Lake in the northernmost part of Wake County. Lake Benson, which is just south of Garner, provides a secondary source of raw water for the Public Utilities Department. These two reservoirs combined can support up to 77.3 million gallons per day (MGD) of withdrawals. The available raw water supply from each of these sources is shown in Table 7.1 below.
Table 7.1 Raw Water Supply and Demand for 2015
Reservoir
Average Daily
Withdrawal (MGD)
Maximum Daily
Withdrawal (MGD)
Available Raw Water
Supply (MGD)
Falls Lake 40.5 62.9 66.1 Lake Benson 9.8 13.0 11.2
Source: NC Division of Water Resources
In 2015, the City used a little over 50 MGD to serve its regional customer base of around 180,000 metered customers. The demand for treated water is projected to exceed the existing raw water supply by the year 2030 (Figure 7.1). The City of Raleigh and Wake County are considering a series of options to expand the supply of raw water in time to meet the projected demand. These improvements, creating an estimated 27.7 MGD of new supply, will enable the City to meet demand until close to the year 2050. Treatment capacity is not expected to be a limiting factor as the E. M. Johnson treatment plant is currently permitted to treat up to 86 MGD. A planned expansion, to be completed by 2025, will increase capacity at E. M. Johnson to 120 MGD.

Raleigh Department of City Planning Data Book 2016 48
Figure 7.1 Water Supply and Demand Projections
Source: NC Division of Water Resources
Total water demand is growing in Wake County, but this increase is the result of population growth rather than greater demand per person. Daily water demand per capita in Raleigh has been on a downward trend for over 15 years (Figure 7.2). Figure 7.2 Daily Treated Water Demand Per Capita
Source: City of Raleigh Public Utilities Department
0
20
40
60
80
100
120
140
2010 2020 2030 2040 2050 2060
Mill
ion
Gal
lons
per
Day
Year
Total Available Supply(MGD)
Surface Water Demand
0
20
40
60
80
100
120
140
Gal
lons
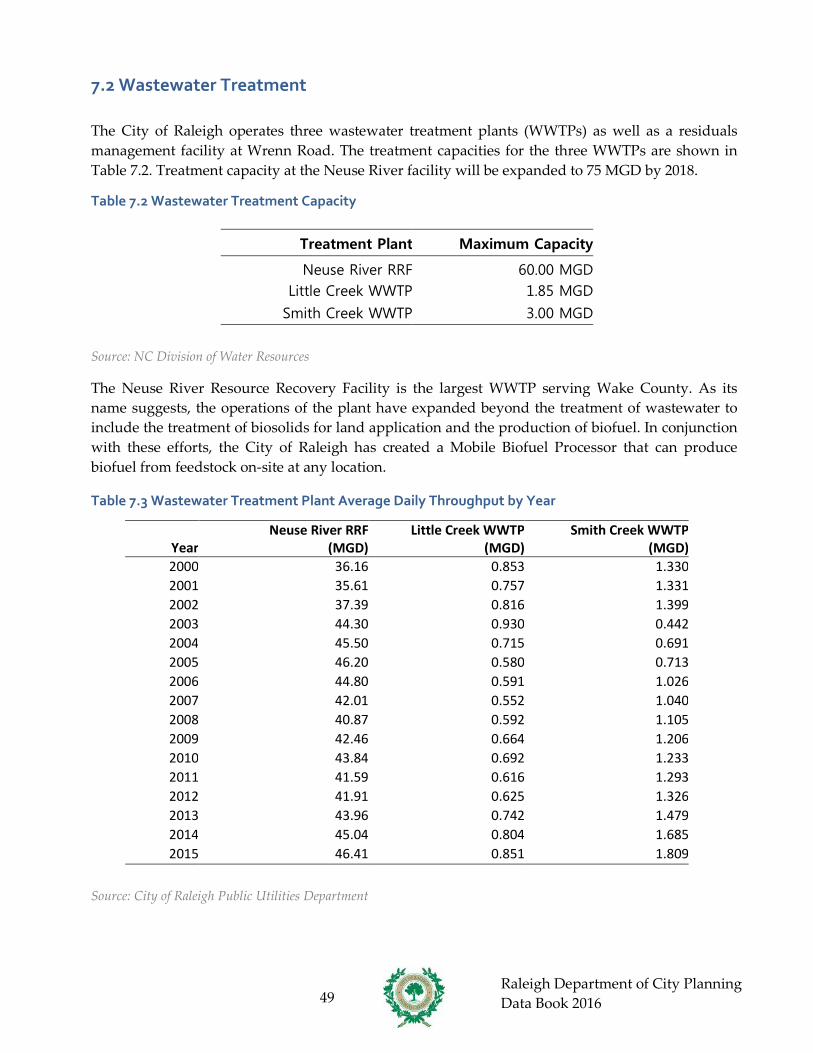
Raleigh Department of City Planning Data Book 2016 49
7.2 Wastewater Treatment
The City of Raleigh operates three wastewater treatment plants (WWTPs) as well as a residuals management facility at Wrenn Road. The treatment capacities for the three WWTPs are shown in Table 7.2. Treatment capacity at the Neuse River facility will be expanded to 75 MGD by 2018.
Table 7.2 Wastewater Treatment Capacity
Treatment Plant Maximum Capacity
Neuse River RRF 60.00 MGD Little Creek WWTP 1.85 MGD
Smith Creek WWTP 3.00 MGD
Source: NC Division of Water Resources
The Neuse River Resource Recovery Facility is the largest WWTP serving Wake County. As its name suggests, the operations of the plant have expanded beyond the treatment of wastewater to include the treatment of biosolids for land application and the production of biofuel. In conjunction with these efforts, the City of Raleigh has created a Mobile Biofuel Processor that can produce biofuel from feedstock on-site at any location. Table 7.3 Wastewater Treatment Plant Average Daily Throughput by Year
Year Neuse River RRF
(MGD) Little Creek WWTP
(MGD) Smith Creek WWTP
(MGD) 2000 36.16 0.853 1.330 2001 35.61 0.757 1.331 2002 37.39 0.816 1.399 2003 44.30 0.930 0.442 2004 45.50 0.715 0.691 2005 46.20 0.580 0.713 2006 44.80 0.591 1.026 2007 42.01 0.552 1.040 2008 40.87 0.592 1.105 2009 42.46 0.664 1.206 2010 43.84 0.692 1.233 2011 41.59 0.616 1.293 2012 41.91 0.625 1.326 2013 43.96 0.742 1.479 2014 45.04 0.804 1.685 2015 46.41 0.851 1.809
Source: City of Raleigh Public Utilities Department

Raleigh Department of City Planning Data Book 2016 50
The City of Raleigh Public Utilities served 169,277 sewer connections with 2,500 miles of wastewater pipeline and 113 public pumping stations in 2015. Table 7.3 on the preceding page shows the amount of wastewater being treated at the City’s three WWTPs. Throughput in 2015 was about 71% of the total capacity, and this figure has been stable or declining for over ten years. Even so, the City has been awarded a permit to expand the capacity at the Neuse River RRF by 15 MGD to 75 MGD. Expansion of the facility is in progress and is expected to be completed by 2018. Additional upgrades will enable the plant to produce methane for electricity generation, reducing its operating costs and environmental impact.
In addition to treating our water supply and wastewater, CoRPUD also maintains thousands of miles of pipes to transport each of these types of water. When wastewater pipes are used beyond their designed capacity or if they have a structural failure, a sanitary sewer overflow (SSO) can occur. SSOs can be dangerous and disruptive to human activities and environmental quality. If SSOs release a large enough volume of wastewater, the local utility may be fined by the state. For these reasons, CoRPUD carefully tracks SSOs and tries to minimize their frequency and magnitude. Figure 7.4 shows the annual number of SSOs for CoRPUD and the long term trend line of SSOs per 100 miles of pipe. Not only has the overall number of SSOs declined by over 50% in ten years, but also the rate of SSOs has dropped well below the national average. Raleigh’s rate of SSOs in 2015 was 1.3 compared to the national average of 4.5.
Table 7.4 Sanitary Sewer Overflow (SSO) Count and Rate by Year
Source: City of Raleigh Public Utilities Department
0
10
20
30
40
50
60
70
80
90
100
2006 2007 2008 2009 2010 2011 2012 2013 2014 2015
Yearly Total # SSO's Linear (SSO Rate)

Raleigh Department of City Planning Data Book 2016 51
7.3 Capital Improvement Program
The City has funded several capital projects to ensure that utility infrastructure continues to produce a high level of service as additional ratepayers are added to the system. The following is a selection of the utility projects funded in the 2015-2019 Capital Improvement Program:
• Begin construction of the Crabtree Basin Wastewater System Conveyance Improvement Project Phase II
• Begin construction of the Wake Forest Richland and Smith Creek Interceptor Improvements
• Continue construction of the Neuse River Resource Recovery Facility Expansion to 75 MGD Phase III and design and bidding of Phase IV.
• Complete the Dempsey E. Benton Water Treatment Plant Backwash Waste Recycle Facility project.
• Update the Water Distribution System Master Plan
• The addition of nearly $200M in water and wastewater asset management related projects. Projects include the assessment and rehabilitation/replacement of our water and sanitary sewer pipelines.
• Acceleration of design funds for the Neuse River Resource Recovery Facility Anaerobic Digester project.
• Addition of Big Branch Pump Station Improvements to address wet weather flow compliance.
• Addition of a Raw Water Reservoir at Dempsey E. Benton Water Treatment Plant.

Raleigh Department of City Planning Data Book 2016 52
Chapter 8: Environmental Resources This chapter addresses Raleigh’s natural and environmental resources and the challenges that need to be addressed to protect these resources. It begins with a look at watershed conditions and then provides a snapshot of air quality, water consumption and conservation, greenhouse gas emissions, and solid waste management. 8.1 Existing Watershed Conditions All of Raleigh's incorporated area, along with most of Wake County, is located in the Neuse River basin which includes Falls Lake. The Neuse River basin is the total land area that drains into the Neuse River. Within the Neuse River Basin there are tributaries that drain smaller areas called watersheds. Raleigh's watersheds are named after the creeks that collect their runoff. For example, the Walnut Creek watershed drains into Walnut Creek. Because watersheds collect rainwater from a large land area (as much as 20 square miles), any pollutants deposited in that area are likely to be transported by rainwater to the local creek and eventually to the Neuse River. If this pollution builds up, the health of local water bodies may be threatened. The health of our local streams is important for the living organisms in those streams. It also affects our recreational options like swimming, fishing, and other watersports. Finally, poor stream health can lead to increased water treatment costs for Raleigh as well as for other municipalities downstream. One way to judge the quality of local streams is through the presence of wildlife. Table 8.1 provides 2005, 2010, and 2016 bioassessment data for selected streams within Wake County. The NC Division of Water Resources assessed these sites based on the health of their fish populations. Overall, the bioassessment rating has declined throughout survey years for all streams except Smith Creek. The highest performing streams tend to be located in less urbanized areas on the Raleigh's periphery. Table 8.1 Bioassessment for Streams in Wake County’s Portion of the Neuse River Subbasin
Water Body Monitoring
Location 2005 2010 2016 Crabtree Creek Ebenezer Church Rd Excellent Excellent Fair
Little River SR 2224 Good Good Good-Fair Middle Creek SR 1375 Excellent Good-Fair Good-Fair
New Light Creek SR 1911 Good Good Good-Fair Richland Creek US 1 Excellent Good-Fair Good-Fair
Smith Creek SR 2045 Fair Good Fair Swift Creek SR 1152 Not Sampled Good-Fair Fair
Terrible Creek SR 2751 Good Good Fair Upper Barton Creek NC 50 Good Good-Fair Fair
Walnut Creek South State Not Sampled Fair Poor Walnut Creek SR 2544 Good-Fair Good-Fair Fair
Source: North Carolina Department of Environment and Natural Resources, Division of Water Resources

Raleigh Department of City Planning Data Book 2016 53
Fish populations are not the only measure of stream quality. The EPA requires states to monitor the concentrations of various pollutants in water bodies under federal jurisdiction. The most common pollutants in Raleigh’s streams are nutrients like nitrogen and phosphorous. Polychlorinated biphenyl (PCB) is a carcinogenic industrial chemical that is also found in streams in Raleigh. PCB concentrations in local waters tend to be very low. Danger may arise from consuming fish that has accumulated PCB during its lifetime in contaminated waters. A water body that has pollutant (usually nutrient) concentrations exceeding the statutory limit is placed on the 303(d) list, named after a section of the Clean Water Act. A consistently and acutely impaired stream can be assigned a total maximum daily load (TMDL) of pollutants which the local government is charged with enforcing. Figure 8.1 shows the streams in Raleigh that have been placed on the 303(d) list as well as those with TMDLs.
Source: City of Raleigh Stormwater Division

Raleigh Department of City Planning Data Book 2016 54
8.2 Air Quality
Two large air quality problems in North Carolina are ground-level ozone (the primary ingredient in "smog") and particulate matter. Both pollutants are caused by emissions from cars and trucks and from the fossil fuel burning power plants that supply most of our electricity. Air quality improved steadily from 2008 to 2015 only to return to 2008 levels in 2016 (see Figure 8.1 and Table 8.2). Raleigh’s streak of three consecutive years without recording a single day categorized as “unhealthy for Sensitive Groups” was broken in 2016. These readings are from the Millbrook Monitor, the only reporting station within the City of Raleigh. Figure 8.1 Ozone Category Days
Source: U.S. Environmental Protection Agency, NC Department of Environment and Natural Resources Table 8.2 Number of Ozone Rating Days, Millbrook Monitor
Good Moderate
Unhealthy for Sensitive Groups Unhealthy
2008 163 47 4 0 2009 198 16 0 0 2010 177 35 2 0 2011 176 35 3 0 2012 191 13 3 0 2013 207 7 0 0 2014 204 10 0 0 2015 203 10 0 0 2016 156 45 1 0
Source: U.S. Environmental Protection Agency, NC Department of Environment and Natural Resources *Data reported only during ozone forecast season, April-September
0%
20%
40%
60%
80%
100%
120%
2008 2009 2010 2011 2012 2013 2014 2015 2016
Perc
enta
ge
Year
Good Moderate Unhealthy for Sensitive Groups

Raleigh Department of City Planning Data Book 2016 55
8.3 Water Consumption and Conservation The City of Raleigh has initiated several programs to help educate customers about the most water-efficient technologies and to understand the City's mandatory conservation measures. These programs include water efficiency tips, showerhead swap-out program, water conservation kit, and educational presentations, including the Sustainable Home Raleigh program. Efficiently using natural resources makes environmental sense and provides economic benefits by reducing costs associated with the treating and distributing water. Water consumption as measured in daily gallons per capita (gpcd) trended downward from 116 gpcd to 92 gpcd between 2007 and 2013 and has stabilized at around 90 gpcd since then (see Figure 8.2). Figure 8.2 Daily Water Consumption Aggregated by City Population
Source: City of Raleigh Public Utilities Department
116
98 100 107 104
95 92 90 91 92
0
20
40
60
80
100
120
140
2007 2008 2009 2010 2011 2012 2013 2014 2015 2016
Daily
Gal
lons
per
Cap
ita (g
pcd)
Year

Raleigh Department of City Planning Data Book 2016 56
8.4 Stormwater Management Stormwater management must address the quantity as well as the quality of runoff water, commonly associated with rainwater falling and moving along impervious surfaces. The Stormwater Division manages stormwater services provided to the citizens of Raleigh through the City’s stormwater utility, which includes drainage and water quality assistance programs, capital stormwater projects, and the water quality program mandated by the Clean Water Act. In addition, they review and inspect private developments for conformance to stormwater, soil erosion, and floodplain requirements, maintain the drainage system inventory, and respond to citizen inquiries concerning these functions. The Stormwater Division has recently begun to aggressively monitor the results of its operations. While historic data is limited, evidence from recent years shows how investments in stormwater management are protecting life and property, reducing pollution, and beautifying local waterways. New construction on formerly natural areas increases the amount of runoff entering the drainage system. Regular improvements insure that this excess water does not have a chance to collect and threaten the safety and property of citizens. Potential risks of uncontrolled runoff include flooding and erosion. Stormwater projects completed in Fiscal Year 2016 reduced the risk posed by runoff for 63 structures and 23 streets, as shown in Figure 8.3. Figure 8.3 Reduction in structures and streets affected by excess runoff by fiscal year
Source: City of Raleigh Stormwater Division
FY14 FY15 FY16 (through Q3)Structures 8 9 63Streets 6 2 23
0102030405060708090
100

Raleigh Department of City Planning Data Book 2016 57
Stormwater management cannot eliminate the threat of dangerous floods. The National Flood Insurance Program (NFIP), run by the Federal Emergency Management Agency (FEMA), provides a way for homeowners in flood hazard areas to be better financially prepared if flood damage occurs. The Stormwater Division is responsible for informing homeowners of the risks they face and ways the NFIP can help them. In 2016, there were 1,728 NFIP policyholders in Raleigh insuring nearly $500 million in property. The combined premiums of these policyholders amount to $1.15 million per year. FEMA evaluates the quality of these educational efforts as well as overall floodplain management and awards points using the Community Rating System (CRS). Attainment of CRS points is rewarded with lower NFIP premiums for homeowners. Raleigh received the lowest CRS rating in 2016, a nine on a scale of one to nine. However, the Stormwater Division is actively assisting homeowners in the floodplain to acquire elevation certificates. The Division expects to have recorded the necessary certificates to achieve a rating of seven within the next year. Another goal of the Stormwater Division is to limit the amount of nutrients entering local waterways. The nutrients nitrogen and phosphorous are ingredients in most fertilizers used for lawn maintenance and landscaping. Fertilizer that isn’t absorbed by the soil is washed into stormdrains and can have negative impacts on stream ecosystems. Stormwater Control Measures (SCMs) are required for all commercial and multi-family residential developments in Raleigh. SCMs reduce the intensity of runoff leaving a site during a rain event by capturing it for a certain period of time. They also treat the runoff to remove nutrients. The City is augmenting the use of SCMs in private development with publicly funded control measures. Figure 8.4 shows the benefits in nutrient reduction that are being achieved through stormwater management. Stormwater management often takes the form of engineered infrastructure projects, but the natural world also gives us valuable resources for preventing floods and cleaning our water. Proper conservation of wetlands, streams, and riparian vegetation can generate a significant return on investment in terms of runoff control and water quality. As an added bonus, healthy waterways offer recreational, educational, and cultural benefits that can increase property values and make Raleigh a more desirable place to live. The Stormwater Division facilitates several popular volunteer programs for maintaining these valuable natural resources. For each of the past three years, individuals and organizations have given over 1,500 hours of volunteer labor to programs such as:
• Adopt-A-Stream • Foster-A-Stream • Stream monitoring • Storm drain marking
Not only do these efforts put tens of thousands of dollars of labor towards improving our infrastructure and environment, they also help citizens connect with each other and feel invested in their communities.
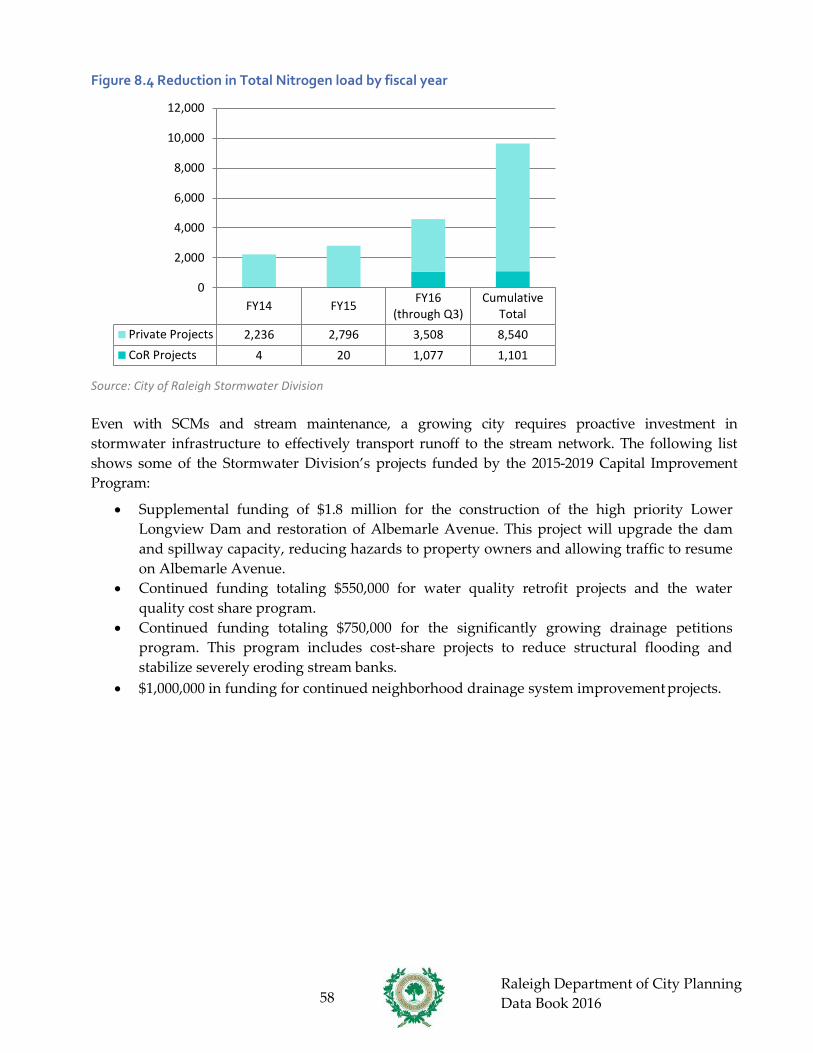
Raleigh Department of City Planning Data Book 2016 58
Figure 8.4 Reduction in Total Nitrogen load by fiscal year
Source: City of Raleigh Stormwater Division Even with SCMs and stream maintenance, a growing city requires proactive investment in stormwater infrastructure to effectively transport runoff to the stream network. The following list shows some of the Stormwater Division’s projects funded by the 2015-2019 Capital Improvement Program:
• Supplemental funding of $1.8 million for the construction of the high priority Lower Longview Dam and restoration of Albemarle Avenue. This project will upgrade the dam and spillway capacity, reducing hazards to property owners and allowing traffic to resume on Albemarle Avenue.
• Continued funding totaling $550,000 for water quality retrofit projects and the water quality cost share program.
• Continued funding totaling $750,000 for the significantly growing drainage petitions program. This program includes cost-share projects to reduce structural flooding and stabilize severely eroding stream banks.
• $1,000,000 in funding for continued neighborhood drainage system improvement projects.
FY14 FY15 FY16(through Q3)
CumulativeTotal
Private Projects 2,236 2,796 3,508 8,540CoR Projects 4 20 1,077 1,101
0
2,000
4,000
6,000
8,000
10,000
12,000

Raleigh Department of City Planning Data Book 2016 59
8.5 Greenhouse Gas Emissions The City of Raleigh conducted greenhouse gas emissions inventories for municipal operations in 2010 and 2014. The base year selected for this emissions inventory was 2007. In that year, City operations emitted 151,479 metric tons of carbon (MTCO2E) into the atmosphere. Through implementation of a number of programs and projects, it is estimated that between 2007 and 2010, greenhouse gas emissions per citizen from City operations decreased by 11.3%. Greenhouse emissions per citizen served drop another 19.7% between 2010 and 2014 (see Figure 8.3). The effect of this increase in efficiency is the equivalent of taking more than 1,600 cars off the road for every year of the interval 2007-2014. These reductions were accomplished with relatively low capital expenditures, few impacts on City or department operations or budgets, no increased cost to customers, and no reduction in level of service to customers. Many of the energy-saving projects were already underway prior to completion of the Greenhouse Gas Emissions Inventory for Municipal Operations. The City has built on this momentum by drafting a Clean Energy Action Plan to identify options for further reductions in GHG emissions. The plan evaluates a variety of actions across multiple City departments that have the potential to reduce GHG emissions per citizen served by an additional 20% over 2014 levels. The total costs of all actions in the plan is estimated at around $100 million, but individual components range in costs from those that pay for themselves through energy cost savings to more ambitious steps that require significant expenditures to achieve reductions.
Figure 8.3 Municipal Operations Greenhouse Gas Emissions
Source: City of Raleigh Greenhouse Gas Emissions Inventory: Years 2007, 2010, and 2014
151 147
131
0.41
0.36
0.29
0.00
0.10
0.20
0.30
0.40
0.50
0.60
0
20
40
60
80
100
120
140
160
2007 2010 2014
Met
ric to
ns o
f car
bon
per c
itize
n se
rved
(t
hous
ands
)
Met
ric to
ns o
f car
bon
(tho
usan
ds)

Raleigh Department of City Planning Data Book 2016 60
8.6 Solid Waste The City of Raleigh provides curbside pickup services to residential customers for garbage, recycling, and yard waste through the Solid Waste Services division. The recycling program began in 1989, and the yard waste program started three years later in 1992. Collected yard waste is converted into wood chips, mulch, and compost for sale to the public. Solid Waste Services has also been offering curbside pickup for recycling to downtown commercial customers since 2006. There are now more than 130 businesses participating in this program. Recycling and yard waste have become a regular and significant part of the city’s solid waste stream. City residents, with the help of Solid Waste Services, have maintained a diversion rate of about 30% for over ten years (Figure 8.4). Diverting solid waste to the recycling and yard waste programs keeps that waste out of landfills. This in turn saves money for Wake County by delaying expenditures on decommissioning a full landfill and establishing a new one. Those savings can be passed on to customers through reduced operating costs for Solid Waste Services. Recycling consumer products and repurposing yard waste also reduces our impact on the environment. Figure 8.4 Solid Waste Diversion Rate
Source: City of Raleigh Solid Waste Services Division
0%
5%
10%
15%
20%
25%
30%
35%
40%

Raleigh Department of City Planning Data Book 2016 61
In addition to diverting more waste, Raleigh citizens are also producing less waste per person (Figure 8.5). Between 2002 and 2015, garbage collection per resident dropped by more than 15%. Increased recycling accounts for almost half of this change, but the majority comes from residents simply throwing away less garbage. Figure 8.5 Solid Waste Collection Per Capita
Source: City of Raleigh Solid Waste Services Division
0
100
200
300
400
500
600
700
800
Poun
ds
Yard Waste
Recycling
Garbage

Raleigh Department of City Planning Data Book 2016 62
Chapter 9: Parks, Recreation and Cultural Resources
9.1 Existing PRCR System and Planning Framework
The City’s parks, greenways and cultural resources are invaluable assets for cultural pursuits, natural conservation and active and passive lifestyle activities. The Raleigh system of parks, recreational facilities, and cultural resources has 6,169 acres of park land and 3,868 acres of greenway property. These acres contribute to providing the residents of Raleigh parks, greenways and cultural resources experiences at 148 parks and along 117 miles of greenway trail.
In addition to providing parks and facilities the public is provided with a variety of programs to meet their household’s interests. The Parks, Recreation and Cultural Resources Department publishes the “Leisure Ledger” on a regular basis to provide a listing of the park, recreation and cultural resources program offerings and facilities available to the general public.
To ensure the public has a voice for the planning of new facilities and experiences, the City Council adopted the Department’s Public Participation Policy for Park Planning in 2012. This policy provides direction to ensure an effective and efficient process is used to fairly and equitably maximize citizen input and support for the planning and development of the park system.
The Parks, Recreation and Cultural Resources System Plan was adopted by City Council on May 6, 2014. The System Plan provides guidance on the design, development and delivery of facilities and services over the next 20 years. The System Plan supplements the City of Raleigh 2030 Comprehensive Plan.
Park and greenway planning and development projects can be tracked on-line through the following webpage: http://www.raleighnc.gov/home/content/PRecDesignDevelop/Articles/ParkAndGreenwayPlanningAndDevelopment.ht ml
9.2 Parks and Recreation Facilities
Raleigh has one of the most well developed park systems in the Southeastern United States. The City’s parks system consists of a variety of experiences to fit user needs and preferences. Initiated by public input into the System Plan and as Action Items for Implementation, the department is developing a new classification system based on experiences.
During the System Plan process the public identified core neighborhood-based experiences desired within a walkable distance from their home. The activities in the core neighborhood-based experiences or all “at-will” activities include:
• Sitting outside, reading, contemplating, meeting friends (socializing);• Going to a playground;• Open play (may include and open lawn; and• Walking or Riding a bike in a park or on a greenway trail.

Raleigh Department of City Planning Data Book 2016 63
Regional experiences were also identified during the System Plan process. These experiences are typically found at a larger park facility or are resource based. These experiences may require planning to attend or registering for a program, as well as, traveling out of your neighborhood to the experience. The activities included in the regional experiences include:
• Playing on an athletic field or court; • Enjoying the outdoors or nature; • Aquatic recreation; • River or lake-related activities; • Fitness; • Enjoying cultural opportunities.
Additionally, parks and recreation needs are met on a regional basis by Wake County, with several county parks located within Raleigh: Historic Oak View Park, Historic Yates Mill Park, and North Wake Landfill District Park.
9.3 Greenways
The Capital Area Greenway corridor system is supported by the 2030 Comprehensive Plan through the Future Land Use Map and other policies. It is generally based on the Neuse River and its watersheds, including the following creek systems: Crabtree, Walnut, Richland, and Harris. The City of Raleigh currently provides approximately 3,868 acres of greenway land through its community wide, Capital Area Greenway System. On January 6, 2015, the City Council adopted a new Capital Area Greenway Planning and Design Guide. The new guide incorporates existing City procedures with the standards and best practices of public agencies is designed to ensure that the Capital Area Greenway System continues to be a safe and accessible multi-use trail system providing recreation and transportation opportunities, while preserving thousands of acres of natural areas.
Although not part of the City’s parks system, the 5,577-acre William B. Umstead State Park is a local and regional park resource that is managed by the North Carolina Division of Parks & Recreation. Residents from Triangle communities use the park for hiking, viewing wildlife, off-road biking, and other recreational pursuits. This park includes a 500 acre lake and 215 upland acres with an extensive trail system. Greenway trail access from Raleigh to Umstead Park also connects with the Town of Cary’s greenway system and Lake Crabtree County Park. More information is available at the following webpage: http://www.raleighnc.gov/home/content/PRecDesignDevelop/Articles/CapitalAreaGreenwayTrailSystem.html

Raleigh Department of City Planning Data Book 2016 64
9.4 Future Park and Open Space Needs The Parks, Recreation and Cultural Resources Department developed a new model for evaluating access to experiences provided by parks and open space. The Experience-Based System model uses distance based on the street network and demographics in the community to evaluate access to the closest park experience. Historically, the City of Raleigh has acquired and planned parks and recreation facilities according to the National Recreation and Parks Association’s (NRPA) Level of Service (LOS) Standard, which include:
• Acres per Population, • Facilities per Population, • Quality of the Facilities, and • Availability of Programs.
Equitable access to inherent experiences is not measured with these techniques. Incorporating a fifth measurement technique—Access Distance or Travel Time—can help progress the simple idea that every citizen should be able to access an inherent park, recreation or cultural experience within similar walking, bicycling, and/or driving distance. The creation of an experience-based model helps to better evaluate how parks, recreation, and cultural resource experiences offered by the City of Raleigh actually function as a dynamic system. The specific metrics used for the Experience-Based System evaluation include distance to closest park, accessible parks per person, and accessible acres per person. The evaluation also calls for the use of census block centroids, park access points, and the Wake County road network. This model first identifies all parks offering core experiences, which includes opportunities for socializing, going to a playground, informal open play, and walking or riding a bike in a park or on a greenway trail. The Experienced-Based System model then uses the following measures to evaluate accessibility to the parks providing a core experience:
• The distance to the closest park measures the distance from each Census Block centroid to the closest park access point. This distance is calculated using the Wake County road network and does not take into account sidewalks, trails, walking paths, greenways, or any other connection type. Using this methodology, core experiences are accessible to a census block when the distance is less than or equal to 1.29 miles.
• The number of accessible parks per person is calculated by dividing each park by the total population of all of the surrounding Census Blocks within a distance of 1.29-miles to determine parks/person. Each Census Block receives the sum of the calculated number of parks/person for all parks within the 1.29-mile distance.
• The number of accessible park acres per person is calculated by dividing the park’s acreage by the total population of all Census Blocks within a distance of 1.29-miles to determine acres/person. Each Census Block gets the sum of the acres/person values of all parks within a 1.29-mile distance.
• Once these three metrics are calculated, they are combined for each census block. The census block values are then aggregated up to census block groups and those values are weighted by population.

Raleigh Department of City Planning Data Book 2016 65
The Experience-Based System model will be used for targeting connections to existing parks and greenway trails, determining where to add amenities and identifying areas for land acquisition. As a first step to improving access the department is currently developing a new Neighborhood and Community Connections (N&CC) Program and Policy to identify areas of the city where communities are close to a park but have difficulty accessing it with the existing transportation networks. Using the existing experience-based system model, the N&CC Program will compare current service to potential service levels to assess which parks have the greatest need for accessibility improvements.

Raleigh Department of City Planning Data Book 2016 66
Chapter 10: Community Facilities
A community facility is established primarily for the benefit and service of the population of the community in which it is located. Uses include but are not limited to schools, community centers, libraries, police protection, fire stations, or government buildings.
The tables captured below represent data collected through comprehensive planning efforts that occurred during the past calendar year. Table 10.1 Raleigh Police Department Facilities
Police Facility
Number of Staff
Number of Vehicles
Facility Sq. Ft.
Address
Headquarters and North 160 110 45,900 6716 Six Forks Road, 27615 Downtown 82 59 33,700 218 W. Cabarrus Street, 27602
Front Street 92 100 48,000 1221 Front Street, 27609 Southeast 93 100 10,594 1601-30 Cross Link Road, 27610
Southwest 72 75 14,400 601-104 Hutton Street, 27606 Atlantic Avenue 153 180 16,165 4501 Atlantic Avenue, 27604
Northeast 96 75 13,851 5220 Greens Dairy Road, 27616 Northwest 52 50 11,000 8016 Glenwood Avenue, 27612
The Academy 52 12 12,416 4205 Spring Forest Road, 27616
The Range 9 21 9,260 8401 Battle Bridge Road
(Total of all buildings) The Range 7,000 Range Road (New Building) The Range 1,280 2 old trailers (Used as office space) The Range 260 Old cinder block range house The Range 400 (4) storage sheds on property The Range 320 Range 2-story garage
Interact 10 0 0 1012 Oberlin Rd Total: 871 782 224,546
Source: City of Raleigh Police Department Table 10.2 Raleigh Fire Department Service Metrics
Performance Measures
Actual FY 2013
Actual FY 2014
Actual FY 2015
Actual FY 2016
Projected FY 2017
Fire calls answered 1,077 1,133 1,227 1,079 1,200 Rescue and EMS calls answered 21,951 23,119 22,356 24,047 24,500
Fires investigated 258 265 251 291 290 Permits issued 1,272 1,738 1,730 2,961 2,650
Average hours per fire call (hrs) 0.92 0.55 0.57 1.05 1 Average hours per EMS call (hrs) 0.33 0.20 0.20 0.33 0.25
Average response time to emergency calls (min)
4.43 4.43 4.44 4.46 4.4
Percent citizens reached by public fire education
10% 10% 10% 9% 10%
Source: City of Raleigh Fire Department

Raleigh Department of City Planning Data Book 2016 67
Table 10.3 Solid Waste Services Equipment Number Type
100 Large vehicles 53 Automated refuse collectors 40 Rear loader garbage and yard waste collectors
3 Split body rear loaders (collect garbage and recycling at same time)
2 Rollout trucks (for recycling drop offs) 2 Knuckle Boom trucks (for bulky item and appliance pickup)
Source: City of Raleigh Solid Waste Services Department
Table 10.4 Solid Waste Collections in Tons
Source: City of Raleigh Solid Waste Services Department
0
20,000
40,000
60,000
80,000
100,000
120,000
FY00
FY01
FY02
FY03
FY04
FY05
FY06
FY07
FY08
FY09
FY10
FY11
FY12
FY13
FY14
FY15
FY16
Garbage
Recycling
Yard Waste
Raleigh Department of City Planning Data Book 2016 68
Chapter 11: Historic Resources
The City of Raleigh has a unique heritage. It was established in 1792 as the planned site for the capital city of North Carolina. Through more than two centuries of growth, Raleigh’s capital city status has shaped its evolution. As a seat of biennial legislative government, growth was slow during the city’s first one hundred fifty years. Raleigh’s primary economic driver for decades was state government and the services needed to support it. Raleigh came late to industrial development, and then only on a small scale. Having escaped destruction during the closing days of the Civil War, the city still enjoys the visual aspect of its original plan, parks, and built environment. 11.1 The City’s Historic Preservation Program The Raleigh City Council has supported historic preservation activities in the city through an appointed citizen committee since 1961—five years before the passage of the National Historic Preservation Act. The Raleigh Historic Development Commission (RHDC) is the successor organization to that committee. The RHDC assists in the planning and implementation of appropriate changes to Raleigh Historic Landmarks and local historic district properties through the Certificates of Appropriateness (COA) process. In 2016, preservation planning staff and the RHDC processed 191 COAs.
Raleigh currently has a total of 164 Local Historic Landmarks, 29 National Register Historic Districts, 7 Historic Overlay Districts, and 3 National Historic Landmarks. RHDC is Raleigh City Council's official historic preservation advisory body to identify, preserve, protect, and promote Raleigh’s historic resources.