Embed Size (px)
Citation preview

www.lmc‐auto.com© 2016 LMC Automotive Limited, All Rights Reserved.
Automotive Outlook:From Plateau to Uncertainty – Where is the Industry Headed?
Jeff Schuster ‐ Senior Vice President, Global ForecastingSeptember 15th, 2016

www.lmc‐auto.com© 2016 LMC Automotive Limited, All Rights Reserved. 2
Outline
• Global Automotive Backdrop
• North America Demand Environment and Trends
• North American Production Outlook and Sourcing Trends
• Summary
www.lmc‐auto.com© 2016 LMC Automotive Limited, All Rights Reserved. 3
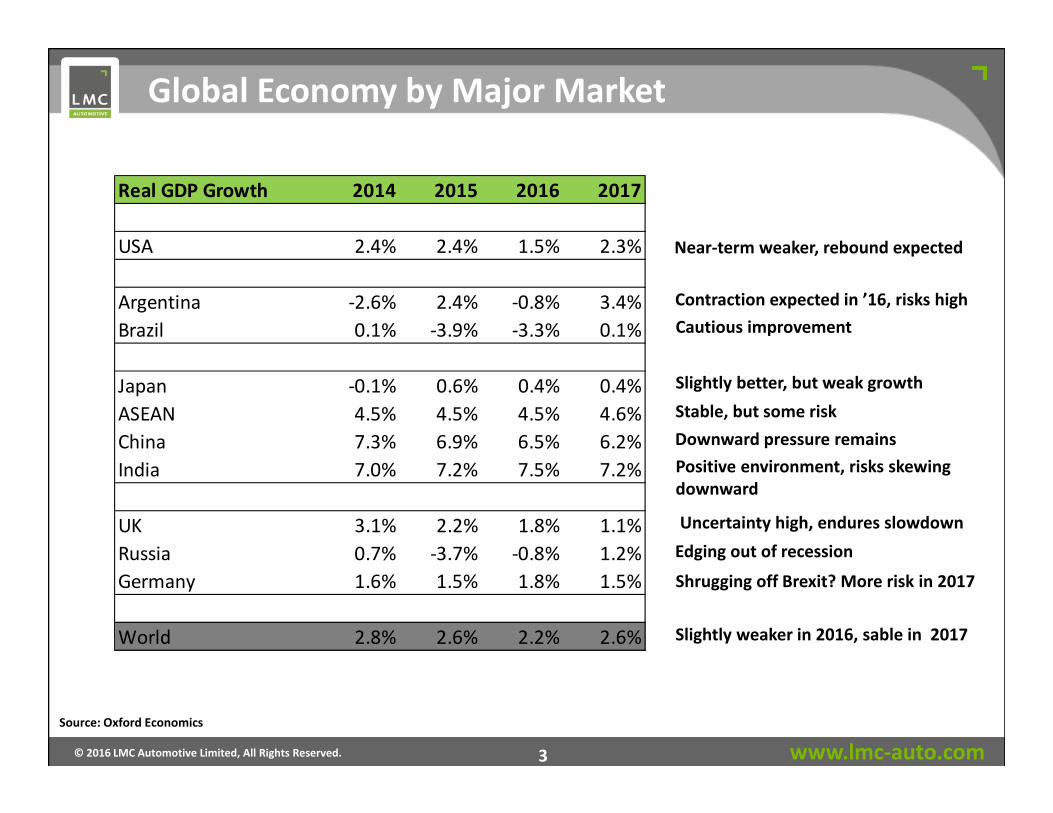
Global Economy by Major Market
Real GDP Growth 2014 2015 2016 2017
USA 2.4% 2.4% 1.5% 2.3%
Argentina ‐2.6% 2.4% ‐0.8% 3.4%Brazil 0.1% ‐3.9% ‐3.3% 0.1%
Japan ‐0.1% 0.6% 0.4% 0.4%ASEAN 4.5% 4.5% 4.5% 4.6%China 7.3% 6.9% 6.5% 6.2%India 7.0% 7.2% 7.5% 7.2%
UK 3.1% 2.2% 1.8% 1.1%Russia 0.7% ‐3.7% ‐0.8% 1.2%Germany 1.6% 1.5% 1.8% 1.5%
World 2.8% 2.6% 2.2% 2.6%
Near‐term weaker, rebound expected
Cautious improvement
Slightly better, but weak growthStable, but some riskDownward pressure remainsPositive environment, risks skewing downward
Uncertainty high, endures slowdown Edging out of recession
Shrugging off Brexit? More risk in 2017
Slightly weaker in 2016, sable in 2017
Source: Oxford Economics
Contraction expected in ’16, risks high

www.lmc‐auto.com© 2016 LMC Automotive Limited, All Rights Reserved. 4
26.4
17.4
4.8
3.3
3.4
China
US
Japan
Germany
India
World 2016 forecast: 91.9 mn, up 2.4 mn units (+2.7%)
6% 6%1%
5%9%
6%
‐8%
‐13%
‐2%
‐11%
‐21%
‐13%
5% 3% 4%
North America
Asia Pacific
C&E EuropeWestern Europe
South America
14 15 16F
4% 2% 3%
World
Global LV sales – Current Environment
2016 Top 5 CountriesLV Sales (Mn)
14 15 16F
14 15 16F
14 15 16F
14 15 16F
14 15 16F
Source: LMC Automotive
89.591.9
93.2
96.4
84
88
92
96
100
2015 2016 2017 2018
Global LV Short‐term

www.lmc‐auto.com© 2016 LMC Automotive Limited, All Rights Reserved. 5
Global LV Production – Contribution to Growth
88.791.2 92.7
82848688909294
1.6
• Volume expected to be up 2.8% from 2015, 2017 expected to increase 2% with demand.
• Western Europe still up 3% this year but next year expected to increase only 1% with some Brexituncertainty focused more in 2nd half of 2017 and into 2018. Bexit
• Russia and Brazil remain as volume decliners. Russia expected to be off by 110,000 units from 2015 and Brazil’s now down by nearly 300,000 units.
millions
0.5 0.5 0.3 0.0 ‐0.4
Source: LMC Automotive

www.lmc‐auto.com© 2016 LMC Automotive Limited, All Rights Reserved. 6
‐6%
‐4%
‐2%
0%
2%
4%
6%
8%
VW
Toyota
Ren‐Nis
Hyund
ai/Kia
GM Ford
Hon
da FCA
PSA
Suzuki/M
aruti
Daimler
BMW
SAIC
Global OEMs ‐ Short‐term Outlook
2016F Global LV Production Growth from 2015
• Global OEM leads mixed but up 3%. 3 groups dip into negative growth.
• VW diesel scandal risk ‐ China growth and US prod. stability driving pace
• Toyota improves some as Japan is stable ‐ RAV4 and C‐HR in EE doing well.
• R‐N growth with new product barrage ‐Lannia in China, Kwid in India
•• GM up with expansion in China (Cadillac)
• Ford slightly negative with weakness across Europe and exposure in BR/AR
• Honda tops growth – Fit/Freed MPV in Japan and CR‐V/Ridgeline in NA.
• FCA gains with Alfa expansion and Fiat Egea in EE, but falls in NA/SA
• Suzuki transition in Asia – ceases in Malaysia, down in Japan, growth in India
Note: GM does not include Wuling, Baojun, Jiefang
Source: LMC Automotive

www.lmc‐auto.com© 2016 LMC Automotive Limited, All Rights Reserved. 7
1.0
1.5
2.0
2.5
3.0
3.5
1996
1998
2000
2002
2004
2006
2008
2010
2012
2014
2016
2018
2020
2022
LMC Automotive New Baseline UK Forecast
• New baseline forecast for UK Light Vehicle Sales adopted following EU referendum result.
• Volume loss, relative to pre‐Brexit forecast, rises to just over 400k units by 2018.
• With imports at approximately 90% of sales, most of the lost volume impact is felt outside the UK, in terms of lost production.
Pre‐Brexit Vote
New baseline
UK LV sales, mn units
Source: LMC Automotive
46%
32%28%
24%22%20%17%17%16%14%13%13%13%12% 9% 8%
0%
10%
20%
30%
40%
50%• The importance of the UK market
varies substantially by OEM.• JLR, Honda and Ford share relatively
high exposure to risks in the market.• But JLR and Honda may gain
competitive advantage, as a result of their manufacturing in the UK, if sterling weakness leads to price increases for competitors – their prices may not need to rise as much.
2016 (estimated) UK share of Pan‐European Light Vehicle sales

www.lmc‐auto.com© 2016 LMC Automotive Limited, All Rights Reserved. 8
Brexit Direct Impact on Production Volume
Source: LMC Automotive
2.40
2.50
2.60
2.70
2.80
2.90
3.00
UK Sales LV Vo
lume (m
n)
Impact on EU LV production: 300K
Total UK LV market falls by 400K against ‘pre‐Brexit’
Impact on UK LV production: 25KImpact on Non‐EU production: 75K
181920212223242526
2013
2014
2015
2016
2017
2018
2019
2020
2021
2022
2023
European LV production, mn units
May‐16 Forecast
Aug‐16 Forecast
• Impact on production in Europe is noticeable, but not disastrous, with 2018 forecast cut by 2% or 500k.
• Ongoing year‐on‐year gains still look likely (CAGR 2%), as long as the effects of Brexit remain mostly contained within the UK. Some insulation with export demand.
• UK production expected to fall by 25k in 2018.
• Over 300k of losses concentrated within the EU countries with Germany, as a large exporter to the UK, seeing the biggest volume of lost output (160k units).
• Volume outside Europe and UK expected to be <100k.
• Japan/Korea – 50k• NA – 25k

www.lmc‐auto.com© 2016 LMC Automotive Limited, All Rights Reserved. 9
China PV Sales Outlook Near‐term volatility/risk caused by tax change, ownerships restrictions, possible hits to confidence – but longer‐term potential remains
Source: LMC Automotive; CAAM Wholesales; Vehicle Registrations

www.lmc‐auto.com© 2016 LMC Automotive Limited, All Rights Reserved. 10
Will Global Growth be Sustained?
Source: LMC Automotive, Oxford Economics
‐10%
‐5%
0%
5%
10%
15%19
9920
0020
0120
0220
0320
0420
0520
0620
0720
0820
0920
1020
1120
1220
1320
1420
1520
1620
1720
1820
1920
2020
2120
2220
23
LV Sales
GDP
Year‐on‐year growth, World
Average historical growth ratesLV Sales: 3.1%GDP: 2.9%
2016:92 mn
2023:110 mn
Average 2015‐2023 growth ratesLV Sales: 2.7%GDP: 2.7%

www.lmc‐auto.com© 2016 LMC Automotive Limited, All Rights Reserved. 11
Outline
• Global Automotive Backdrop
• North America Demand Environment and Trends
• North American Production Outlook and Sourcing Trends
• Summary

www.lmc‐auto.com© 2016 LMC Automotive Limited, All Rights Reserved. 12
North America Economic Outlook
Source: LMC Automotive
Overall Outlook Trending Lower
• US – We maintain our cautious view for real GDP growth in 2016, expecting 1.6%, followed by a modest rebound to 2.3% in 2017. Importantly, weak business investment is expected to constrain capital accumulation and productivity growth over the medium to long run.
• Canada – The pace of growth in H2 is unlikely to be particularly robust, averaging just under 2.5% annualized. One problem is that non‐energy exports have struggled to gain any momentum, falling back sharply in Q2. Overall, we forecast real GDP growth of 1.2% on average in 2016, followed by a modest acceleration to around 2% next year.
• Mexico – Following a downward revision to Q1 data and tighter than expected 2017 budget, we have lowered our GDP growth forecasts to 2.0% in 2016 and 2.6% in 2017. The 0.2% q/q fall in Q2 GDP was expected, but the revision of Q1 data of a 0.5% quarterly rise was an unwelcome surprise.
0%
1%
2%
3%
4%
5%
2014 2015 2016 2017 2018
US Canada Mexico
GDP Growth:

www.lmc‐auto.com© 2016 LMC Automotive Limited, All Rights Reserved. 13
16.5 17.4 17.4 17.4 17.5
1.91.9 1.9 2.0 2.01.11.3 1.6 1.6 1.6
0
5
10
15
20
25
2014 2015 2016 2017 2018
Millions
North America Light Vehicle Sales Outlook
+1.1% +0.4%
Source: LMC Automotive
+6.2%
• Slowing growth picture solidifying with recent performance, but stable outlook in near‐term is holding. Interest rates and political uncertainty are risks.
• 2017/2018 growth halts across the board with all three countries growth expected under 0.5%.
+0.3%

www.lmc‐auto.com© 2016 LMC Automotive Limited, All Rights Reserved. 14
89
1011121314151617181920
2000
2001
2002
2003
2004
2005
2006
2007
2008
2009
2010
2011
2012
2013
2014
2015
2016
SAAR Moving Average Annual
US LV sales – Monthly Selling Rate (SAAR) Trend
• Sales pace at beginning of year started off ahead of expectations but have leveled off. YTD August is clinging to a Y‐on‐Y gain of 0.7%, with the SAAR averaging just under 17.3mn
• H2 poses challenge to meet or exceed 2015, given current slowing trend and 17.9mn average in H2 2015 – now expect H2 2016 to be solid but track at 17.5mn average, a risk as the July/August pace is 17.4mn.
Source: LMC Automotive

www.lmc‐auto.com© 2016 LMC Automotive Limited, All Rights Reserved. 15
FICO <650 Mix
16.0%‐0.9ppts
84mo + Loan Mix
5.3%+1.2ppts
Incentive % of MSRP
9.6%+0.5ppts
Lease Maturities
2.1mn+37%
Used Price Index
118.6‐3.6ppts
Loan To Value Ratio
101.2+1.5ppts
Lease Mix
30.7%+3.1ppts
FleetMix
20.3%+1.6ppts
Light Vehicle Volume +0.7% YTD Aug16, but Retail Sales Volume ‐1.3%YTD16 Vs. YTD15 – Indicators showing potential risk ahead!
How Healthy is the Auto Industry?

www.lmc‐auto.com© 2016 LMC Automotive Limited, All Rights Reserved. 16
Fleet sales + “Fleetail” Has Masked Demand Slowing
Retail has outpaced non‐retail only 4x since 2015
Source: JDP PIN, LMC Automotive

www.lmc‐auto.com© 2016 LMC Automotive Limited, All Rights Reserved. 17
14.2mn
13.6mn
2014 2015 1.DisposableIncome
2.Unemp. Stock
Market
4.3.HousingMarket
5.FuelPrices
6.Credit/Terms
10.ProductActivity
7.VehicleEquity
2016F
Volume
VehiclePrice
8. 9.IncentiveActions
Total Sales16.5mn
14.0mn
13.8mn
Risk
‐1.8% YoY
17.4mnTotal Sales
Macro Factors Consumer Internals & OEM Drivers
US LV Sales Driven by Multitude of Factors
Source: LMC Automotive, Oxford Economics, JDP PIN, Industry Sources
Total Sales17.4mn
Growth in Fleet/Contraction in Retail – Fleet at 20%, up from 18% in 2015

www.lmc‐auto.com© 2016 LMC Automotive Limited, All Rights Reserved. 18
Incentive Spen
d % M
SRP
8mo Avg: 10.9%
8moAvg: 9.6%
≈1.3ppts to peak recession level
≈0.9 pptsin last year
Incentive Levels in US on Watch
August incentives ended at $3,657, 7% Y‐on‐Y gain with % of MSRP hitting post‐recession high of 10.2%

www.lmc‐auto.com© 2016 LMC Automotive Limited, All Rights Reserved. 19
2016 US Sales Segment Share Movement
38.8% share
1.8% SUV growth slows from very strong 2015, but gains on small/compact demand, expanded lineups, favorable fuel prices.
15.0% share
0.5% Pickups continue to gain ground given low gas prices and new products.
13.8% share
After falling 1 ppt. in 2015, D Segment Cars continue to lose share to SUV demand.
0.5%
1.4%
0.1% SUVs gain, but lower compact car demand hurts Premium.
0.2%
12.3% share
7.1% share
Vans gain from new Pacifica, Metris, plus Transit. SUVs cut into personal MPV market.
Source: LMC Automotive
0.0%

www.lmc‐auto.com© 2016 LMC Automotive Limited, All Rights Reserved. 20
17.4 17.4
17.517.7
17.9
15.4
17.9
14
15
16
17
18
19
202012
2013
2014
2015
2016
2017
2018
2019
2020
2021
2022
2023
• Baseline US LV topline is expected to grow at a CAGR of just 0.4% from 2015‐2023 with slow (2%) economic growth supporting long run in autos! Risks to baseline include lease maturities (used car substitute) and tighter credit.
• Negative bias with recession scenario ‐mild with short duration as volume falls to 15.4mn in 2019, a 12% drop from baseline. Recovery may be hampered by lower density growth, car sharing and regulations impact.
• Outperform scenario – Near‐term up from VW buyback and lease maturities followed by technology driven increase as market transitions. CAGR sill only 0.8%.
Source: LMC Automotive
US Demand Still Expected Grow?

www.lmc‐auto.com© 2016 LMC Automotive Limited, All Rights Reserved. 21
16.517.4 17.4 17.4 17.5 17.5 17.6
US Product Activity Remains High
• Fragmentation and competition increases exponentially going forward – along with SUVs, dedicated HEVs, EVs are a priority.
• 92 new entries from 2016 forward, with 186 redesigns planned.
2014 2015 2016 2017 2018 2019 2020New Entry 18 14 19 15 22 23 13Redesign 32 28 27 38 35 45 41Facelift 27 30 46 37 29 35 49Drop 8 8 28 12 5 6 4
Source: LMC Automotive
US ‐ Flat Demand!

www.lmc‐auto.com© 2016 LMC Automotive Limited, All Rights Reserved. 22
0
20
40
60
80
100
120
140
Price of Oil to 2025
• Regulation coming tougher on cars to hit milestones
• Expected price of oil will not drive push toward compact car Evs
• SUVs continue to grow –but will likely need stronger EV penetration
• Pickups have place in future, share expected to hold at 15%
Collision Course?
Consumers want SUVs!Hybrid/EV Sales are Down!
29%36% 38% 40%+
YTDAug10
YTDAug15
YTDAug16
2020F
US Sales – SUV share
0
100
200
300
400
500
Thou
sand
s YTD Aug – Hybrid/EV Sales
YTD Aug16 ‐4%
Source: LMC Automotive

www.lmc‐auto.com© 2016 LMC Automotive Limited, All Rights Reserved. 23
17
13
18
14
19
15
22 23
13
0%5%10%15%20%25%30%35%40%45%50%
0
5
10
15
20
25
2012 2013 2014 2015 2016 2017 2018 2019 2020
Num
ber o
f New
Entrie
s
New SUV Entries SUV Mix of Majors/Minors
More SUVs are Coming!
24.9%7.7%
38.9% 50.0% 31.6%60.0% 50.0% 73.9%
30.8%
150 New Entries/Majors/Minors!
Source: LMC Automotive

www.lmc‐auto.com© 2016 LMC Automotive Limited, All Rights Reserved. 24
Electrification by Regulation
0%
2%
4%
6%
8%
10%
12%
14%
0
0.5
1
1.5
2
2.5
2013 2014 2015 2016 2017 2018 2019 2020 2021 2022 2023
Millions
PHEV
EREV
MHEV
FHEV
FCEV
BEV
Share of TLV
• The full range of electrification is expected to accelerate from 2016, despite fuel prices.
• Significant expansion of the number of product offerings combined with improvements in technology as the industry grapples with regulation will drive share to more than 12% when including mild hybrids.
• We expect full hybrid to remain dominate but share of electrification expected to fall from 70% in 2016 to <50% by 2023 as BEV, PHEV and Mild growth accelerates.
Source: LMC Automotive

www.lmc‐auto.com© 2016 LMC Automotive Limited, All Rights Reserved. 25
Outline
• Global Automotive Backdrop
• North America Demand Environment and Trends
• North American Production Outlook and Sourcing Trends
• Summary

www.lmc‐auto.com© 2016 LMC Automotive Limited, All Rights Reserved. 26
Short‐Term NA Production Outlook• 2016 volume up 3% with as launch activity remains strong – 16 new production entries or
in first full year. Volume reduced slightly in 2016 (25k) on flattening demand.
• 2017 outlook remains solid but lower growth rate of 1.1%. As demand is on watch so will be production but most risk is beyond 2017.
17.45 m0.28 mDrops
0.34m
New Entries
0.44m
AdditionalGrowth
17.95m18.16
14.0
15.0
16.0
17.0
18.0
19.0
2015 2016 2017
Millions
Source: LMC Automotive

www.lmc‐auto.com© 2016 LMC Automotive Limited, All Rights Reserved. 27
Inventory is In Check
0
10
20
30
40
50
60
70
80
90
2.9
3.0
3.1
3.2
3.3
3.4
3.5
3.6
3.7
3.8
3.9
4.0
Aug‐14 Nov‐14 Feb‐15 May‐15 Aug‐15 Nov‐15 Feb‐16 May‐16 Aug‐16
Days’ Sup
ply
Inventory (m
illions)
• Inventory very stable and in good shape through August at a 61‐day supply – suggesting industry has not started an overbuild as demand flattens out though there are some trouble spots in certain vehicle types
• Interplay between inventory levels and incentives will be key indicator!
Source: LMC Automotive

www.lmc‐auto.com© 2016 LMC Automotive Limited, All Rights Reserved. 28
NA Production Trend by Month
Source: LMC Automotive
• NA up nearly 2.6% or 200k in 2H16 after 3.1% growth in 1H16, but build plans not aligned with our expectation for reduced demand suggesting volume risk in 4Q, mainly in Nov/Dec, but currently projected at 4% increase.
• Expecting slightly different pattern in 2017, with 3.1% growth in 1H17 and slight contraction in 2H17. Given the current strong monthly growth rates through June and demand uncertainty, risk is concentrated in 1H.
‐8%‐6%‐4%‐2%0%2%4%6%8%10%12%
1.0
1.2
1.4
1.6
1.8
Jan Feb Mar Apr May Jun Jul Aug Sep Oct Nov Dec
Prod
uctio
n Vo
lume (M
illions)
% YoY Change 16‐17 2015 2016 2017

www.lmc‐auto.com© 2016 LMC Automotive Limited, All Rights Reserved. 29
• Volume growth slows through ‘17 –investment help offset slowing US demand
• Hyundai/Kia localizing at Monterrey plant drives growth, Montgomery adds Santa Fe
• Daimler in ‘16 benefits from full year of GLE Coupe and Metris van; ‘17 pullback with aging GLE/GLS, R‐Class exit
• GM ‘16 gains on strong SUV and Pickup volume and new CT6/Bolt; ‘17 falls on lower Car and Large PU/SUV output
• Ford F‐150, new Midsize SUV’s drive growth ‘16; ‘17 slight growth with new Continental
• VW for ‘16 under pressure, offset by new Audi capacity; ‘17 adds needed SUVs
• FCA ‘16 off with Toluca and Sterling Heights downtime; ‘17 falls on sourcing shifts/changeovers
• Toyota decline in ‘17 on Camry changeover, Venza and GCC Sequoia end
• Subaru continues expansion with Legacy/Outback growth and adds Impreza
NA Short‐Term Production by OEM Group
Source: LMC Automotive

www.lmc‐auto.com© 2016 LMC Automotive Limited, All Rights Reserved. 30
NA Production and Capacity Long‐term Trend
• Localization and exports production expansion strongest through 2019. Utilization settling in above 85% but some risks with new capacity remain.
• Demand flattening impacts production levels in longer‐term but to lesser extent due to resourcing trends. Stability with sales expectations does help to maintain volume levels, risk grows post 2017/18.
Millions
Utilization %
Source: LMC Automotive

www.lmc‐auto.com© 2016 LMC Automotive Limited, All Rights Reserved. 31
NA Production by OEM Grouping
Detroit 3
2015‐2020CAGR: 0.1%
New Entries/Redesigns: 83
Asian OEMs
2015‐2020CAGR: 1.8%
New Entries/Redesigns: 82
European OEMs
2015‐2020CAGR: 5.5%
New Entries/Redesigns: 26
Prod
uctio
n (m
illions of u
nits)
Capa
city Utilization %
Source: LMC Automotive

www.lmc‐auto.com© 2016 LMC Automotive Limited, All Rights Reserved. 32
• Mexico gains 7 new plants with 3 others getting investment to account for 55% of new capacity in region is in Mexico – FTA’s, incentives and low costs work in favor. Push for B‐and C‐ segment vehicles.
• US aided initially by weaker dollar, now currency hedge (but some risk now) adds 5 new plants (3 low volume) and 10+ with capacity investment.
• Costs and lack of incentives hurt Canada as GM is expected to shutter Oshawa by 2017 but some boost to Ingersoll to offset.
Source: LMC Automotive
North America Capacity and Sourcing Movement
www.lmc‐auto.com© 2016 LMC Automotive Limited, All Rights Reserved. 33
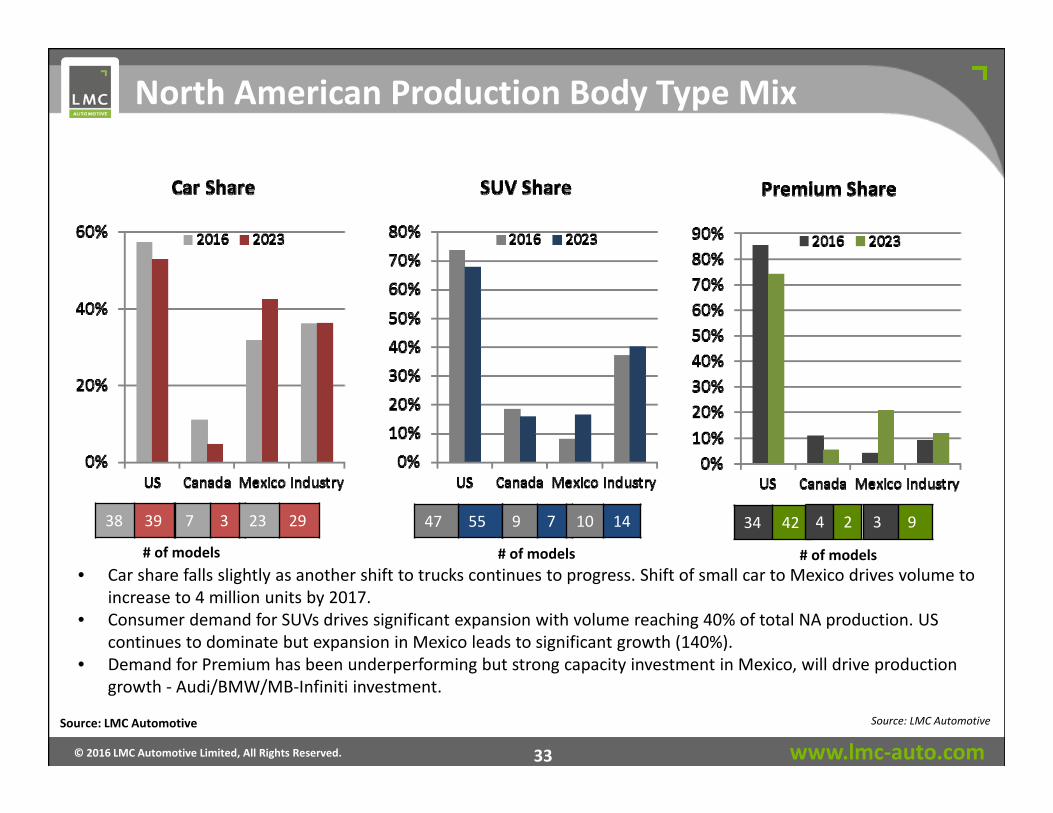
North American Production Body Type Mix
• Car share falls slightly as another shift to trucks continues to progress. Shift of small car to Mexico drives volume to increase to 4 million units by 2017.
• Consumer demand for SUVs drives significant expansion with volume reaching 40% of total NA production. US continues to dominate but expansion in Mexico leads to significant growth (140%).
• Demand for Premium has been underperforming but strong capacity investment in Mexico, will drive production growth ‐ Audi/BMW/MB‐Infiniti investment.
47 5538 39 34 427 3 23 29 9 7 10 14 4 2 3 9
# of models # of models # of models
Source: LMC AutomotiveSource: LMC Automotive

www.lmc‐auto.com© 2016 LMC Automotive Limited, All Rights Reserved. 34
Small/Compact Cars and SUVs Move to Mexico…
Source: LMC Automotive
2015
2023
Mexico segment type mix ~30% of Small/Compact build is in Mexico…
…which grows to ~47% by 2023Mexico segment type mix
Small/Compact77%
Midsize13%
Large10%
0.0
0.5
1.0
1.5
2.0
Small/CompactCar
Small/CompactMPV
Small/CompactSUV
0.0
0.5
1.0
1.5
2.0
2.5
3.0
Small/CompactCar
Small/CompactMPV
Small/CompactSUV

www.lmc‐auto.com© 2016 LMC Automotive Limited, All Rights Reserved. 35
While SUVs Continue to Gain Ground in the US
US SUV Size Growth
• SUV production in the US surpasses 5 million units, driven by Midsize and Compact entries as margins help business case in the US
• 11 new Midsize SUV entries as OEMs fill whitespaces and expand their showrooms
• Compact gains on new Premium entries
Source: LMC Automotive
2015‐2023

www.lmc‐auto.com© 2016 LMC Automotive Limited, All Rights Reserved. 36
Outline
• Global Automotive Backdrop
• North America Demand Environment and Trends
• North American Production Outlook and Sourcing Trends
• Summary

www.lmc‐auto.com© 2016 LMC Automotive Limited, All Rights Reserved. 37
Summary
• Globally, the auto market is stable at topline with marginal growth, but with risks in both emerging and mature markets.
• Brexit, Emerging market economic stability and US/WE/Japan leveling off dominate risks.
• US demand growth appears to be coming to a halt, with some risk in the second half of 2016. No evidence of major contraction coming, but long‐term growth expected to average less than 0.5%.
• North American production outpaces demand, investment still pouring in with volume into the 19 mn unit range. Launch activity is strong, though some risk with new plants being underutilized if demand slows further.
• Number of entries increase, adding opportunity but also complexity and risk, with SUV production leading growth.

www.lmc‐auto.com© 2016 LMC Automotive Limited, All Rights Reserved. 38
Thank You
BRinna@lmc‐auto.com