Embed Size (px)
Citation preview

1
HONG KONG ASSOCIATION FOR SCIENCE AND MATHEMATICS EDUCATION
REPORT ON SCIENCE ASSESSMENT TEST 2016
INTRODUCTION
The Science Assessment Test (SAT) was developed by the Hong Kong Association for
Science and Mathematics Education (HKASME) for evaluating the ability of students in
Hong Kong, as well as those in nearby regions, in learning science at Junior Secondary level.
It was first implemented in 2014, and thereafter improvements have been made to the design
of the test and to the analysis of the results. The test consists of a 1-hour test paper
comprising 24 multiple-choice questions in Section A and 2 short-response questions in
Section B. With the SAT, the HKASME hope to provide feedback to schools and to the
education administration on the strengths and weaknesses of our students in learning science
at Junior Secondary level.
In order to keep the SAT to be in line with the most up-to-date approach of science learning,
the questions are so set that participants are not required to recall a lot of scientific facts.
Instead, the SAT questions aim at testing students’ scientific understanding as well as science
process skills, namely observing, classifying, planning and designing, experimenting,
interpreting and communicating. In fact, many of the SAT questions were set to help
students appreciate the relevancy of science to daily life.
THE PARTICIPANTS
In 2016 SAT, the total number of participants was 1842, with 1608 from the Hong Kong SAR
and 234 from the Macau SAR. The table below lists the breakdown of the 1842 participants
according the class attended and sex:
Participants Secondary 2 (S2) Secondary 3 (S3) Total
Boys 498 421 919
Girls 470 453 923
Total 968 874 1842

2
PARTICIPANTS’ PERFORMANCE
Section A
The mean score and the standard deviation of the 1842 participants in the 24 multiple-choice
questions were 13.1 and 3.47 respectively. Readers can refer to Appendix I for an analysis
of participants’ responses to the multiple-choice questions.
As revealed from the item analysis, participants showed weaknesses in the areas outlined
below. For each of these areas, a few items were selected to help illustrate the participants’
weaknesses. In these items, the key is marked with an asterisk (*) and the popularities of the
options are shown in parenthesis.
(1) Planning and designing of experiments, hypothesising
Q.1 Alan carried out an experiment to study the behaviour of living things. He put a
tortoise in a box and observed it for a few days. Which of the following is NOT a precaution of the experiment?
*A. cleaning the box with bleach solution before putting the tortoise into it (36%)
B. feeding the tortoise regularly (34%)C. wearing gloves when touching the tortoise (6%) D. washing hands thoroughly with soap solution after the experiment (24%)
The participants probably had very little experience in handling living things in the laboratory. More than 60% of the participants were unable to choose the key A. Many probably did not know that bleach solution contains chlorine and may cause harm to the tortoise if the box is first cleaned with bleach solution. They should realise that experimentation is a very important experience in learning science. Q.10 A class of students carried out an experiment to study how different liquids affect the
browning of apples. They put apple slices in different liquids and recorded the time
taken for browning to occur. The bar chart below shows the results obtained in the
experiment.
0 10 20 30 40
noliquidadded
distilledwater
saltwater
lemonjuice
Liq
uid
used
Time for browning to occur (min)

3
Which of the following statements can be a hypothesis/hypotheses of this experiment?
(1) Different liquids have different effects on the browning of apples. (2) Among the three liquids, salt water can best be used to inhibit the browning of
apples.
A. (1) only (67%)B. (2) only (5%)
*C. Both (1) and (2) (15%)D. None of them (13%)
Students should appreciate that a hypothesis constitutes a very important part of a scientific investigation. In Q.10, both statements (1) and (2) can be proved true or false using scientific methods, and thus both of them can be a hypothesis of the investigation. The unsatisfactory performance of the participants might indicate that they had very little training on how to carry out scientific investigations. Q.22 Edmund carried out an experiment to find the greatest mass of sugar that dissolves in
100 cm3 of water at different temperatures. Which of the following statements about the experiment is/are correct?
(1) The mass of sugar dissolved is the dependent variable of the experiment. (2) Temperature is a controlled variable of the experiment. (3) It is necessary to stir the sugar and water mixtures.
A. (1) only (17%)B. (2) only (24%)
*C. (1) and (3) only (31%)D. (2) and (3) only (28%)
It was surprising that more than 50% of the participants had wrongly considered temperature to be a controlled variable of the experiment. The participants probably had confused understanding about the three kinds of variables, namely independent variable, dependent variable and controlled variable. (2) Understanding of abstract scientific concepts Q.4 The diagram below shows a vertical section of a human eye.
Pupil
Lens

4
Which of the following combinations correctly describes the size of our pupil and the
thickness of our lens when we look at distant objects under bright sunlight?
Size of our pupil Thickness of our lens
A. becomes larger becomes thicker (6%)
B. becomes larger becomes thinner (14%)
C. becomes smaller becomes thicker (38%)
*D. becomes smaller becomes thinner (42%) Students should appreciate that under strong sunlight our pupil will contract to reduce the amount of light entering into our eyes, and when we look at a distant object our ciliary muscles will pull our lens thin in order that a sharp image can be formed onto our retina. However, quite a number of participants wrongly thought that our lens would become thicker when we look at distant objects. Q.6 It is known that all matters are made up of particles. Which of the following
descriptions about these particles is correct?
A. These particles can be seen under an optical microscope. (15%)B. These particles expand upon heating. (30%)
*C. For a given substance, the particles in the liquid state and those in the gas state are identical.
(37%)
D. The particles of a substance in its solid state are at rest. (18%) Q.6 is about the particle model of matters. Participants who had wrongly chosen option B probably did not realise that there are empty spaces between the particles in a substance, and that the expansion of a substance upon heating is due to an increase in volume of these empty spaces. Students should appreciate that scientists often solve problems by proposing models. (3) Interpretation of graphical and tabulated information Q.5 The graph below shows the global consumption of different types of energy from
1970 to 2015.
Year
Glo
bal c
onsu
mpt
ion
(in
arbi
trar
y un
its)
Oil
Natural Gas
Coal Renewables
Nuclear

5
Which of the following statements can be directly inferred from the graph?
*A. The consumption of nuclear power has almost flattened in the 21st
century. (34%)
B. A large number of natural gas fields have been explored from 1970 to 2015.
(39%)
C. The reserve of oil in the Earth’s crust is greater than that of coal. (24%)D. The consumption of renewable energy is likely to surpass that of oil in
20 years after 2015. (3%)
Q.5 was set on the interpretation of graphical information. Only about a third of the
participants were able to choose the key A. Quite a number of participants failed to realise
that options B and C could not be directly inferred from the graph.
Q.13 The information below was extracted from a water bill:
Water charge $
23/10/2014 – 25/02/2015
12.331 m3 @ $0.00 0.00
31.857 m3 @ $4.16 132.52
19.525 m3 @ $6.45 125.93
4.287 m3 @ $9.05 38.79
Subtotal 297.24 Which of the following statement can be deduced from the above information?
A. Consumers need to pay a minimum charge even if they do not use any water.
(4%)
B. The water charge is proportional to the volume of water used. (16%)*C. In general, the water charge per unit volume increases with the amount
of water used. (55%)
D. In general, the water charge per unit volume decreases with the amount of water used.
(25%)
In Q.13, participants who wrongly chose option D might probably have only looked at the
data in the right column of the table, and wrongly thought that the water charge decreases
with the amount of water used. For improvement, students should be trained to study
information/data in greater detail.
It should be emphasised that graphs and tables provide a very effective means for the
communication of scientific information. In this information age, students should have
better training on the interpretation of graphical and tabulated data.

6
Section B
In Section B, Q.1 was set to test participants’ data-handling skills, including graph-plotting
skill. In Q.2, participants were required to read a short passage (in this year the passage was
about the lead-water incident in Hong Kong in 2015), and to answer a few questions set on
the passage. The maximum marks for Q.1 and Q.2 were 10 and 8 respectively. The table
below lists the mean score and standard deviation for the whole group. The test statistics
showed that the participants performed better in data-handling questions than in
comprehension type questions.
Question No. Mean S.D.
1 6.8 (68%) 2.50 (25.0%)
2 3.0 (38%) 1.79 (22.4%)
Overall 9.8 (55%) 3.59 (19.9%)
Participants’ performance in the two short-response questions in Section B is outlined below:
Q.1 (a) Excellent performance. Most participants were able to correctly transcribe
the circuit into a circuit diagram.
(b) Unsatisfactory performance. Less than 50% of the participants were able to
suggest varying the resistance of the rheostat could change the voltage across
the light bulb.
(c) Fair performance. Most participants were able to draw a straight-line curve
passing through the origin of the graph. The following are some mistakes
made:
the failure to use a linear scale for the x-axis and/or the y-axis, and
drawing a histogram instead of a line graph for the I-V relationship.
(d) Well answered.
(e) Fair performance. Most participants were able to read from the curve that
the current is about 0.9 A when the voltage across the bulb is 2.8 V.
Q.2 (a) Fair performance. Students who used to read extensively or those who paid
attention to the news should realise that lead is toxic to humans.
(b) (i) This question was set to address the mathematics strand of STEM
education. However, less than 40% of participants were able to
correctly choose 0.000 000 01 g/L as the answer. It is worth
mentioning that the ability to appreciate the relative magnitudes of
physical quantities is important in the study of science.
(ii) Fair performance. About half of the participants knew that it is
technically not possible to remove all impurities from a sample.
7
(c) Unsatisfactory performance. This question was set to address the
engineering strand of STEM education. It may take a very long time for a
country, which originally has a high lead concentration in its water supply, to
reduce its lead concentration in water supply to the WHO guideline value as
the move may involve a lot of procedures including: legislation, replacing all
lead-containing water pipes to lead-free ones etc.
(d) Unsatisfactory performance. Less than 40% of the participants were able to
suggest that a blind test should be performed or performing the test on a
greater number of samples could help improve the reliability of the results.
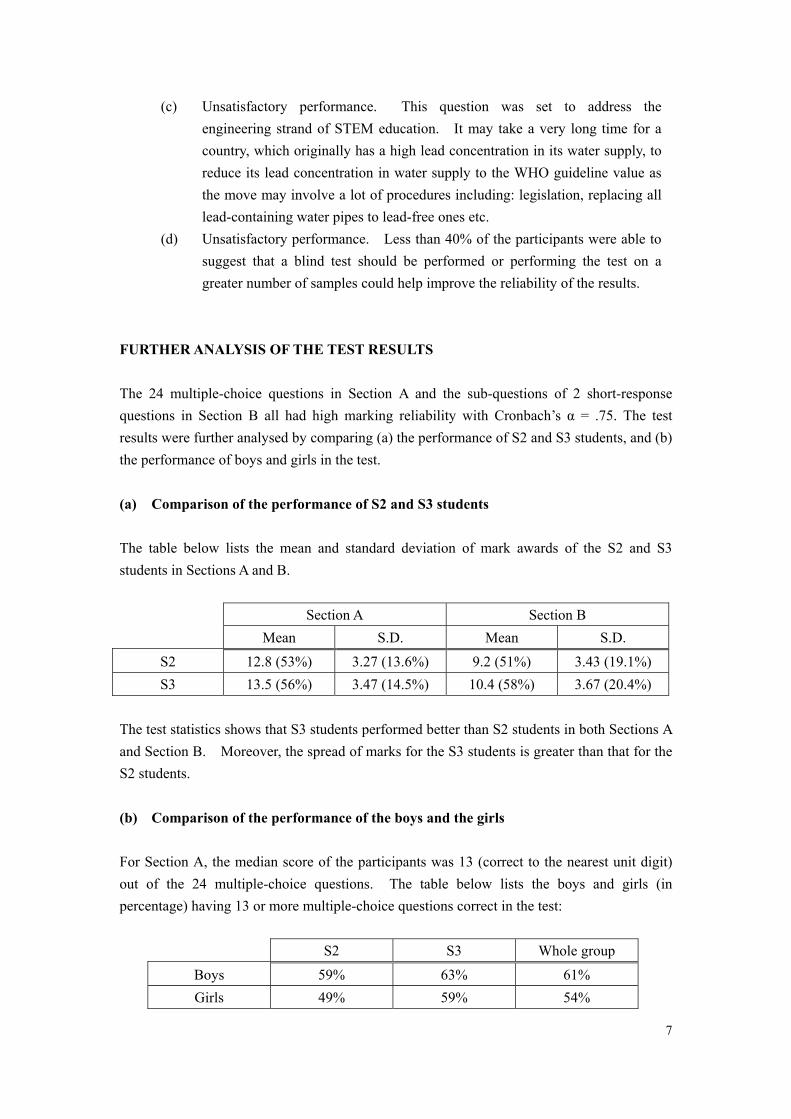
FURTHER ANALYSIS OF THE TEST RESULTS
The 24 multiple-choice questions in Section A and the sub-questions of 2 short-response
questions in Section B all had high marking reliability with Cronbach’s α = .75. The test
results were further analysed by comparing (a) the performance of S2 and S3 students, and (b)
the performance of boys and girls in the test.
(a) Comparison of the performance of S2 and S3 students
The table below lists the mean and standard deviation of mark awards of the S2 and S3
students in Sections A and B.
Section A Section B
Mean S.D. Mean S.D.
S2 12.8 (53%) 3.27 (13.6%) 9.2 (51%) 3.43 (19.1%)
S3 13.5 (56%) 3.47 (14.5%) 10.4 (58%) 3.67 (20.4%)
The test statistics shows that S3 students performed better than S2 students in both Sections A
and Section B. Moreover, the spread of marks for the S3 students is greater than that for the
S2 students.
(b) Comparison of the performance of the boys and the girls
For Section A, the median score of the participants was 13 (correct to the nearest unit digit)
out of the 24 multiple-choice questions. The table below lists the boys and girls (in
percentage) having 13 or more multiple-choice questions correct in the test:
S2 S3 Whole group
Boys 59% 63% 61%
Girls 49% 59% 54%

8
Appendix III shows the distribution of marks in Section A for the boys and girls in S2, S3 and
the whole group. As revealed from the test statistics, the boys performed better than the girls
(for both S2 and S3) in Section A. This difference was more significant in S2.
THE AWARD SCHEME
Participants who demonstrate competency in science learning will be given an award. There
are four levels of awards in the 2016 SAT, namely Diamond (highest), Gold, Silver and
Bronze awards. The HKASME has set up an expert group to decide on the cut-off criteria,
based on the performance of the participants, for each of these awards. In order to receive
an award, a participant needs to get a minimum overall mark as well as to demonstrate a
balanced performance in Sections A and B.
For 2016 SAT, about 5% of the best-performed participants were given the Diamond award.
The table below lists the criteria for participants to receive the Diamond, Gold, Silver and
Bronze awards in 2016 SAT:
Diamond Gold Silver Bronze
Paper score (1) / marks ≥ 42.0 36.5 – 41.5 32.0 – 36.0 24.5 – 31.5
Score in Section A / MCQs ≥ 9 ≥ 9 ≥ 9 ≥ 9
Score in Section B / marks ≥ 5 ≥ 5 ≥ 5 ≥ 5 (1) In SAT, the paper score = 1.5 × score in Section A + score in Section B
Readers can refer to Appendix IV for the awards given out in the 2016 SAT. It is worth
mentioning that the purpose of SAT is not for the discrimination of the participants and/or
their schools according to their achievement in the SAT. It aims at helping teachers/schools
to identify the strengths and weaknesses of students in learning science, and as such
appropriate means can be implemented to help students make improvements in their learning.

9
Appendix I
Analysis of Participants’ Responses to the Multiple-choice Questions (MCQs)
Performance of the whole group in Section A of 2016 SAT
Q. No Skills assessed Key correct %Strength
/ weakness
1 Planning & Designing A 37 -
2 Inferring & Predicting B 35 -
3 Classifying A 62 -
4 Comprehension,
Inferring & Predicting D 42 -
5 Interpreting graph, Inferring
& Predicting A 34 -
6 Comprehension,
Inferring & Predicting C 36 -
7 Comprehension,
Knowledge B 70 -
8 Comprehension,
Inferring & Predicting B 51 -
9 Comprehension,
Inferring & Predicting B 68 -
10 Making hypothesis,
Planning & Designing C 15 D
11 Identifying variables,
Planning & Designing A 47 -
12 Inferring & Predicting C 79 -
13 Interpreting data, Inferring &
Predicting C 55 -
14 Inferring & Predicting D 69 -
15 Comprehension, Inferring &
Predicting D 53 -
16 Comprehension,
Inferring & Predicting C 76 -
17 Measuring D 63 -
18 Measuring,
Choosing apparatus D 82 -
19 Comprehension,
Inferring & Predicting B 57 -

10
Q. No Skills assessed Key correct %Strength
/ weakness
20 Comprehension,
Knowledge B 73 -
21 Knowledge, Comparing A 58 -
22 Identifying variables,
Planning & Designing C 31 D
23 Inferring & Predicting D 46 -
24 Interpreting data, Inferring A 76 -
Note:
(1) Questions that are poorly answered by the whole group (1/3 correct) are represented by “D”.

11
Appendix II
Double-digit Coding Marking System in 2016 SAT
In Section B, a double-digit coding system was adopted in marking the short-response
questions. During marking, two digits were used to represent the performance of a
participant in each part/sub-part of a question. The first digit indicates the correctness level
of the answer while the second identifies the approaches used in answering the questions or
the types of errors made. Shown below are the coding scheme adopted in marking Q.1(c) of
the 2016 SAT and some common mistakes found.
Double-digit coding system for Q1(c)
Q1(c) Using the experimental results, plot a graph to show the I-V relationship.
CODE ITEM Number of Response
Correct Responses : 594
30 Correct curve (a straight line) plotted with the x and y
axes correctly labeled and using appropriate scales. 591
39 Others 3
Partially Correct Responses (a) (b) due to : 1334
x0 As in code 30/39, but with inappropriate scale 274
x1 As in code 30/39, but with missing label of axis 152
x2 As in code 30/39, but with missing unit 313
x3 As in code 30/39, but showing a ‘histogram’ or ‘bar
chart’ 6
x4 As in code 30/39, but some parts of the ‘LINE’ incorrect 563
x5 As in code 30/39, but showing the POINTS only 23
x9 Others 3
Nil Response/Irrelevant 388
91 Irrelevant (V-curve and I-curve in a SINGLE graph) 54
92 Irrelevant (V-curve and I-curve in TWO separate graphs) 9
93 Irrelevant (V-bar and I-bar charts) 13
94 Irrelevant (others) 88
99 Nil Response 224 (a) x : score 2 for maximum of 2 mistakes; score 1 for more than 2 mistakes (b) multiple responses

12
Common Mistakes of Participants in Plotting Graphs (Shown below are some partially
correct responses.)
Code x0
Code x2
Code x4
Code 91

13
Appendix III
Performance of Boys and Girls in Section A of 2016 SAT

14
Appendix IV
Diamond, Gold, Silver and Bronze Awards given out in 2016 SAT
Award type Number
Diamond 85 (4.6%)
Gold 295 (16.0%)
Silver 375 (20.4%)
Bronze 638 (34.6%)