Embed Size (px)
Citation preview

2017 ANNUAL FINANCIAL RESULTS13 FEBRUARY 2018

1
Certain statements made in this presentation constitute forward-looking statements. Forward-looking
statements are typically identified by the use of forward-looking terminology such as ‘believes’, ‘expects’,
‘may’, ‘will’, ‘could’, ‘should’, ‘intends’, ‘estimates’, ‘plans’, ‘assumes’ or ‘anticipates’ or the negative thereof or
other variations thereon or comparable terminology, or by discussions of, e.g. future plans, present or future
events, or strategy that involve risks and uncertainties. Such forward-looking statements are subject to a
number of risks and uncertainties, many of which are beyond the company's control and all of which are
based on the company's current beliefs and expectations about future events. Such statements are based
on current expectations and, by their nature, are subject to a number of risks and uncertainties that could
cause actual results and performance to differ materially from any expected future results or performance,
expressed or implied, by the forward-looking statement. No assurance can be given that such future results
will be achieved; actual events or results may differ materially as a result of risks and uncertainties facing the
company and its subsidiaries. The forward-looking statements contained in this presentation speak only as
of the date of this presentation and the company undertakes no duty to, and will not necessarily, update any
of them in light of new information or future events, except to the extent required by applicable law or
regulation.
DISCLAIMER

2
IMPRESSIVE PERFORMANCE ACROSS THE BOARD
Safety:
fatality free and
improvement across
all metrics
Operations:
increased productivity
and efficiency
Financials:
benefit from
performance and price
Capital allocation:
strong
balance sheet
Strategy:
transformation to
full potential
Outlook:
delivering
stakeholder value

3
TRCFR improvement from 0.78
0.65
Total recordable cases
20%
Lost time injuries
0.17LTIFR improvement from 0.28
43%
High potential incidents
FATALITY FREE
Fatalities
0
46%
FY17FY16

4
EBITDA
R19.6bn
6%
Production
45Mt
8%
SOLID OPERATING AND FINANCIAL PERFORMANCE
FY17FY16
HEPS
R30.47
12%
Attributable free
cash flow
R12.3bn
10%

5
EBITDA IMPROVEMENT DUE TO EFFICIENCY AND PRODUCTIVITY GAINS
18 410 18 275
19 5584 985 (4 063)
(1 073)(272) 288
2 133(850)
FY16 Price Currency Inflation Royalties Shipping Total afternon-controllables
Volume Opex FY17
Operational performance
(135) 1 283
Rm
(1%) 7%

6
Communities
R107mdirect social
investment
SIGNIFICANT VALUE SHARED
Suppliers
R520mhost community
suppliers
R9.4bnprocurement from
HDSA businesses
Government
R5.9bnincome tax
R1.2bnroyalties
Employees
R4.2bnsalaries and
benefits
Shareholders
R10bnowners of Kumba
R3.1bnempowerment
partners

MARKET OVERVIEW
8
0
200
400
600
800
1000
1200
1400
1600
1800
2011 2012 2013 2014 2015 2016 2017
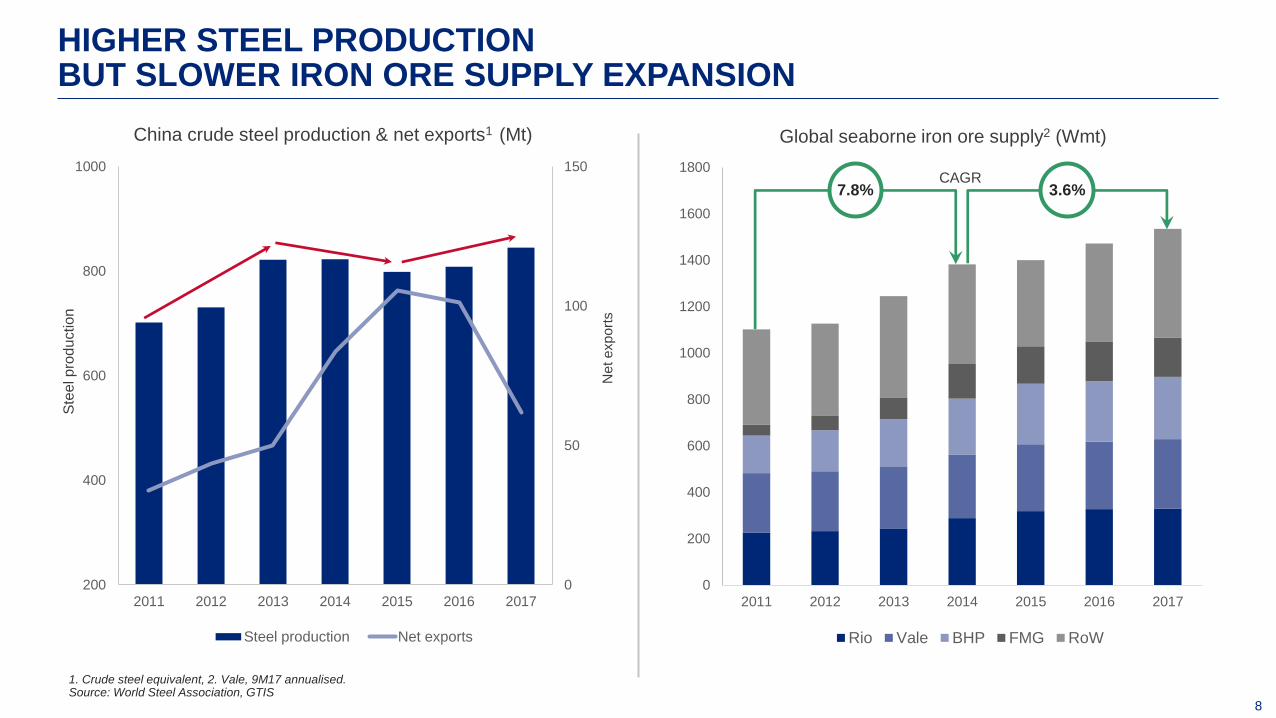
Global seaborne iron ore supply2 (Wmt)
Rio Vale BHP FMG RoW
CAGR
0
50
100
150
200
400
600
800
1000
2011 2012 2013 2014 2015 2016 2017N
et e
xp
ort
s
Ste
el p
rod
uction
China crude steel production & net exports1 (Mt)
Steel production Net exports
1. Crude steel equivalent, 2. Vale, 9M17 annualised.Source: World Steel Association, GTIS
HIGHER STEEL PRODUCTIONBUT SLOWER IRON ORE SUPPLY EXPANSION
7.8% 3.6%
9
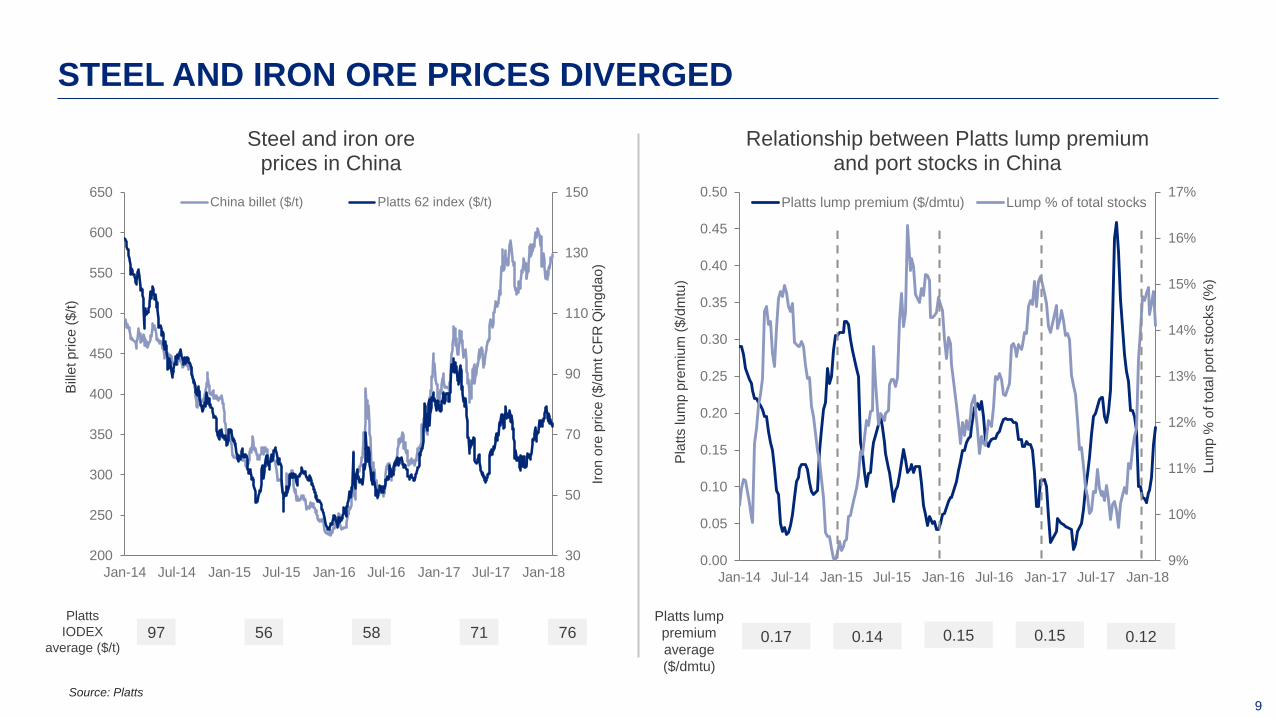
STEEL AND IRON ORE PRICES DIVERGED
30
50
70
90
110
130
150
200
250
300
350
400
450
500
550
600
650
Jan-14 Jul-14 Jan-15 Jul-15 Jan-16 Jul-16 Jan-17 Jul-17 Jan-18
Iro
n o
re p
rice
($
/dm
t C
FR
Qin
gd
ao
)
Bill
et p
rice
($
/t)
Steel and iron oreprices in China
China billet ($/t) Platts 62 index ($/t)
Source: Platts
Platts
IODEX
average ($/t)97 56 58 71 76
9%
10%
11%
12%
13%
14%
15%
16%
17%
0.00
0.05
0.10
0.15
0.20
0.25
0.30
0.35
0.40
0.45
0.50
Jan-14 Jul-14 Jan-15 Jul-15 Jan-16 Jul-16 Jan-17 Jul-17 Jan-18
Lu
mp
% o
f to
tal p
ort
sto
cks (
%)
Pla
tts lu
mp
pre
miu
m (
$/d
mtu
)
Relationship between Platts lump premium and port stocks in China
Platts lump premium ($/dmtu) Lump % of total stocks
Platts lump
premium
average
($/dmtu)
0.17 0.14 0.15 0.15 0.12

10
(20)
(15)
(10)
(5)
-
5
10
15
20
25
30
Jan-15 Jun-15 Nov-15 Apr-16 Sep-16 Feb-17 Jul-17 Dec-17
$/t
Platts index premium and discount ($/dmt)
Platts 65/Platts 62 premium Platts 58 (low Al)/Platts 62 discount
0
5
10
15
20
25
30
150
200
250
300
350
400
450
500
550
600
650
Jan-15 Jun-15 Nov-15 Apr-16 Sep-16 Feb-17 Jul-17 Dec-17
P6
5/P
62
diffe
ren
tial (
$/t)
Bill
et p
rice
($
/t)
China steel price and high grade premiums
China billet ($/t) Platts 65/Platts 62 differential ($/t)
Source: Platts
RECORD MILL PROFITABILITY BUOYING DEMAND FOR PREMIUM ORES

11
71
(12)
59
3
7
2
71
Platts 62 indexCFR China
Saldanha -Qingdao freight
Platts 62 indexFOB Saldanha
Fe premium Lump premium Marketingpremium
AchievedFOB 2017 price
$/dmt
REALISED FOB PRICE AT US$71/t
Source: Kumba Marketing
2%
China
63%
Japan &
Korea
17%
EU/MENA
18%
Export sales geographical split
India &
other Asia
13.9
15.2
2016 2017
Ex-China sales (Mt)

12
5
2925
2
66
Peer 1 Peer 2 Peer 3 Peer 4 Kumba
2017 Lump:Fine (%), Peer comparison
Source: Market Intelligence, Company Reports, Woodmac
63.9
60.8 60.7
57.7
64.1
Peer 1 Peer 2 Peer 3 Peer 4 Kumba
2017 average Fe content (%), Peer comparison
71
58 (est)
65
64
41
Kumba
Peer 1
Peer 2
Peer 3
Peer 4
2017 achieved price ($/dmt, FOB), Peer comparison
KUMBA’S COMPETITIVE ADVANTAGE

OPERATIONAL OVERVIEW
14
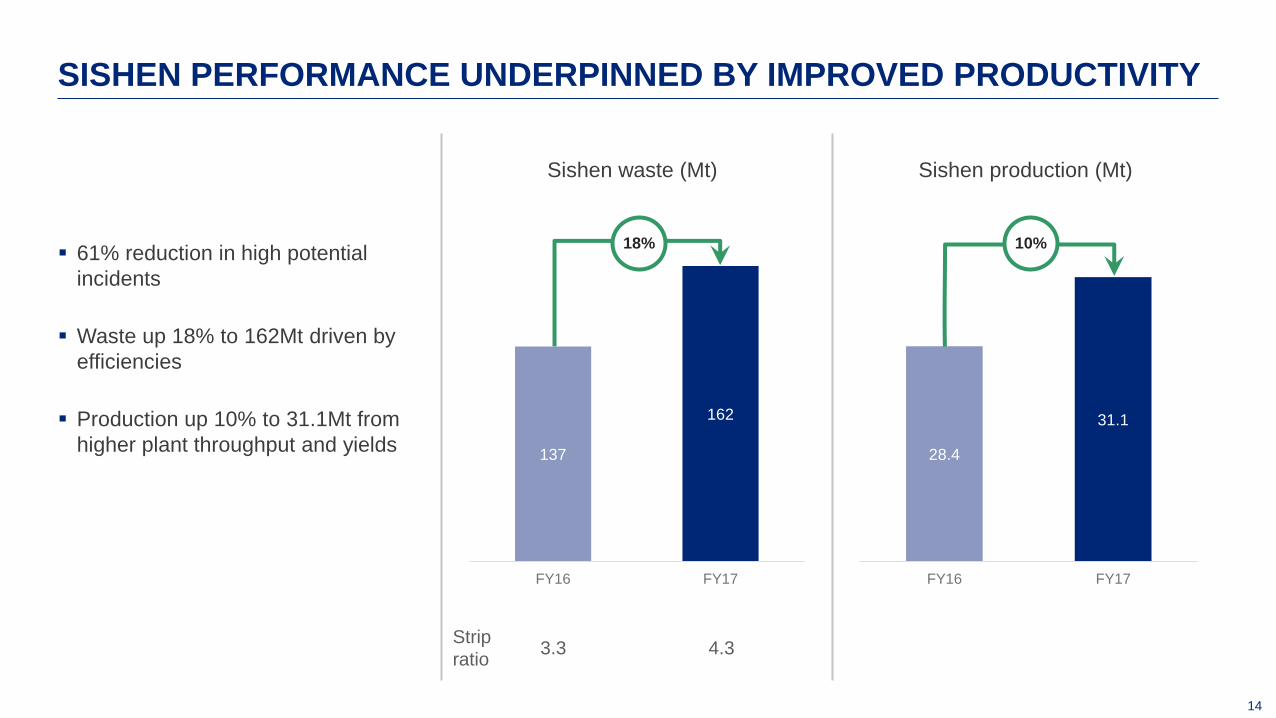
SISHEN PERFORMANCE UNDERPINNED BY IMPROVED PRODUCTIVITY
61% reduction in high potential
incidents
Waste up 18% to 162Mt driven by
efficiencies
Production up 10% to 31.1Mt from
higher plant throughput and yields28.4
31.1
FY16 FY17
Sishen production (Mt)
137
162
FY16 FY17
Sishen waste (Mt)
10%18%
Strip
ratio3.3 4.3

15
OPERATING MODEL – STRUCTURED APPROACH FOR IMPROVEMENT
Highlights
62% productivity improvement on Sishen fleet
31% increase in direct operating hours
4100 shovels tempo up 63% from 1H16
Effective planning and scheduling
80% improvement in sequencing of activities
Each task planned and scheduled in detail
Use data to improve scheduling and execution capability
(schedule effectiveness)
Work management - controlled execution
Monitor schedule completion per task
Measuring scheduled work vs unscheduled work
Sishen fleet productivity (kt/day)
379 474 529
613
1H16 2H16 1H17 2H17
3.0 3.5 4.04.9
1H16 2H16 1H17 2H17
Sishen pre-strip shovel tempo (kt/h)
62%
63%

16
KOLOMELA CONTINUES STRONG PERFORMANCE
154 days of zero harm
Waste increased 11% to 55.6Mt
Production up 9% to 13.9Mt
Improved performance due to plant
and equipment efficiencies 12.7
13.9
FY16 FY17
Kolomela production (Mt)
50.2
55.6
FY16 FY17
Kolomela waste (Mt)
9%11%
Strip
ratio3.7 3.4

17
36.7 40.5 38.145.3
1H16 2H16 1H17 2H17
14.015.7 15.9 16.5
1H16 2H16 1H17 2H17
1. Truck direct operating hours (DOH): Time equipment is operational, performing production and non-production activities
Significant improvement from 1H16 to 2H17
23% increase in DSO plant production
− Improved DOH and tempo
− Improved reliability
18% increase in truck DOH
Strategy in place to achieve further improvements
OPERATIONAL EFFICIENCIES FROM OPERATING MODEL
18%
Kolomela DSO product (kt/day)
Truck DOH1 performance (hours/day)
Operating Model “go-live” APC roll-out
23%

18
LOGISTICS PERFORMANCE REFLECTS HIGHER PRODUCTION
39.8
42.0
FY16 FY17
Railed to port (Mt)
38.7
41.6
FY16 FY17
Total shipped (Mt)
42.5
44.9
FY16 FY17
Total sales (Mt)
6% 7% 6%

FINANCIAL OVERVIEW

20
Revenue increased 14% to R46bn
EBITDA of R19.6bn up 6%
Headline earnings of R9.7bn up 12%
Capex of R3.1bn supports production
Attributable free cash flow of R12.3bn up 10%
2017 dividend of R30.97 per share
− Final: R15.00 per share
− Interim: R15.97 per share
FINANCIAL PERFORMANCE HIGHLIGHTS
11.82
27.3030.47
FY15 FY16 FY17
HEPS (R/share)
11.9
18.4 19.6
FY15 FY16 FY17
EBITDA (Rbn)1
1. Excluding impairment reversal/charges
65%
158%

21
REVENUE GROWTH FROM STRONGER PRICES AND HIGHER VOLUMES
Revenue increased by 14%
Realised average FOB export price rose 11% to $71/t (FY16: $64/t)
9% stronger average R/$ exchange rate of R13.30 (FY16: R14.69)
Total sales up 6% to 44.9Mt: export sales up 2.5Mt, domestic sales down 0.1Mt
38 020
41 975
2 747
4 404 5 930 2 133 1 657
(4 108)
FY16 Price Currency Volume Shipping FY17
Rm
Mining operations Shipping
46 379
40 767

22
16 3
30 (28)
(30)
296 287
FY16 Inflation Costescalation
Miningvolume
Productionvolume
Deferred stripping FY17
R/t
Unit cash cost
6% (9%)
1
SISHEN: IMPROVED UNIT COST THROUGH OPERATING EFFICIENCIES
CPI of 5.3%
Cost escalation due to higher diesel price
Mining cost driven by increased volumes
Higher capitalisation of deferred stripping cost driven by increased strip ratio
1. Excluding impact of deferred stripping on unit cost FY17: R30/t (FY16: R3/t)

23
11 5
43 (21)
(2)
201
237
FY16 Inflation Costescalation
Miningvolume
Productionvolume
Deferred stripping FY17
R/t
Unit cash cost
8% 9%
1
KOLOMELA: UNIT COST DRIVEN BY PLANT FEEDSTOCK
CPI of 5.3%
Cost escalation due to higher fuel prices
Increased mining cost due to higher volumes and modular plant feedstock
1. Excluding impact of deferred stripping on unit cost FY17: R18/t (FY16: R18/t)

24
29
40
1 15
4
FY16 Controllable costs Price impact Freight Currency FY17
Non-controllable costs up $10/t
− Freight rates up $5/t
− Stronger currency adding $4/t
− Lower market premium of $1/t
BREAKEVEN - CONTROLLABLE COSTS CONTAINED
Breakeven price up $11/t from FY16 average
Controllable costs up $1/t driven by:
− higher mining volumes, increased deferred
stripping and cost escalation
− offset by improved efficiencies, overhead savings
and higher production
Platts 62% Breakeven Price ($/t)
$1 $10
Controllables Non-controllables
25
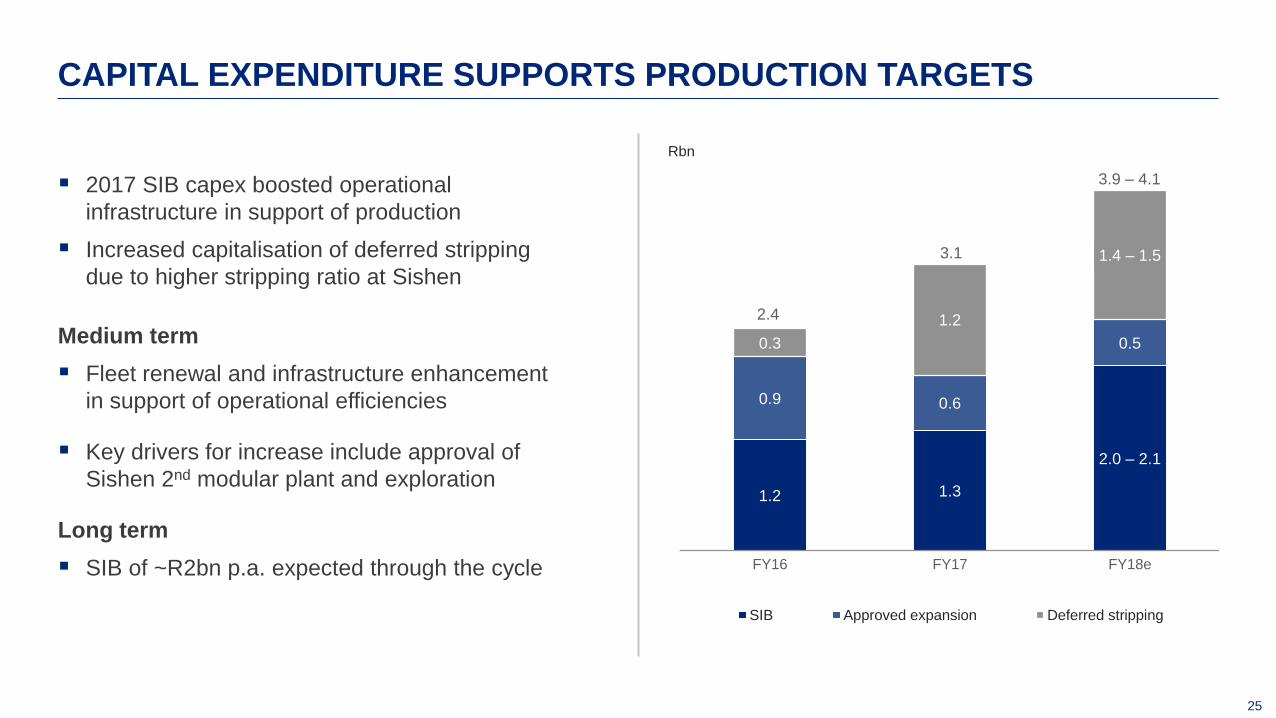
1.2 1.3
2.0 – 2.1
0.9 0.6
0.50.3
1.2
1.4 – 1.5
FY16 FY17 FY18e
Rbn
SIB Approved expansion Deferred stripping
2017 SIB capex boosted operational
infrastructure in support of production
Increased capitalisation of deferred stripping
due to higher stripping ratio at Sishen
Medium term
Fleet renewal and infrastructure enhancement
in support of operational efficiencies
Key drivers for increase include approval of
Sishen 2nd modular plant and exploration
Long term
SIB of ~R2bn p.a. expected through the cycle
CAPITAL EXPENDITURE SUPPORTS PRODUCTION TARGETS
3.9 – 4.1
2.4
3.1

26
13 874
7 5426 165
22 432
461
(5 883)
(3 074) 516
(5 114)
(4 831)
(1 559)
(1 502)
2016 Cash generatedfrom operations
Net financeincome
Tax paid Capex Other Interim2017 dividend
(incl. minorities)
2017 Final 2017dividend
(incl. minorities)
Pro-formacash retained
Rm
Kumba shareholders Minorities
(6 743)
(6 333)
Strong cash generation of R22.4bn
Cash balance of R13.9bn at 31 Dec 2017
STRONG, FLEXIBLE BALANCE SHEET
Final dividend R15.00 per share
Returning R13.1bn to shareholders
125%

27
ENHANCING RETURNS FOR ALL STAKEHOLDERS
Additional margin
extraction from entire
value chain
Free cash flow
generation after
sustaining capex
Disciplined capital
allocation to sustain
and grow core assets
Return of excess
capital unless value
accretive investment
opportunities identified
Strict cost stewardship
across the business

STRATEGY
29
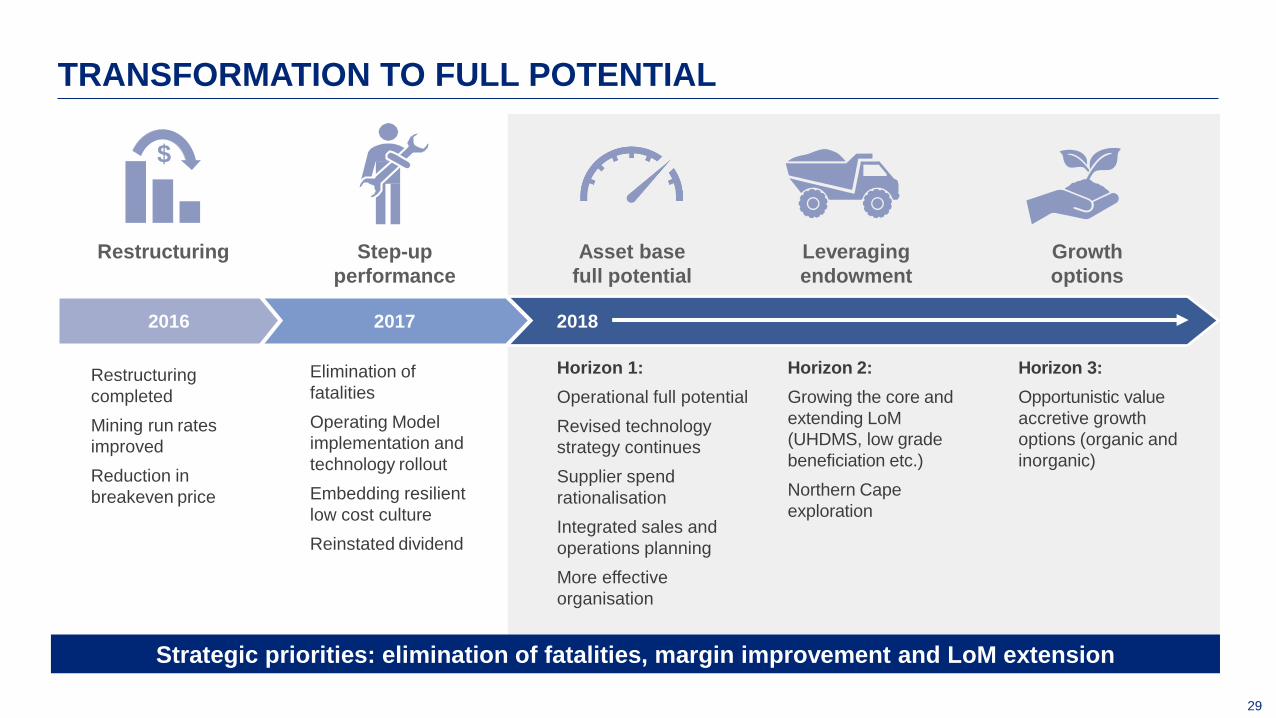
TRANSFORMATION TO FULL POTENTIAL
Step-up
performance
Asset base
full potential
Leveraging
endowment
Horizon 1:
Operational full potential
Revised technology
strategy continues
Supplier spend
rationalisation
Integrated sales and
operations planning
More effective
organisation
Restructuring
completed
Mining run rates
improved
Reduction in
breakeven price
Elimination of
fatalities
Operating Model
implementation and
technology rollout
Embedding resilient
low cost culture
Reinstated dividend
Horizon 2:
Growing the core and
extending LoM
(UHDMS, low grade
beneficiation etc.)
Northern Cape
exploration
Horizon 3:
Opportunistic value
accretive growth
options (organic and
inorganic)
Restructuring
2018
$
20172016
Strategic priorities: elimination of fatalities, margin improvement and LoM extension
Growth
options

30
HORIZON 1: OPTIMISING OUR ASSETS
OEEs1 still below best
practices (e.g. 40-60%
gap on shovels tempos)
Focusing on specific
efficiency drivers
Total expenditure ~R28bn
(over 1 500 suppliers and
service providers to be
consolidated)
Recent step change in the
predictability of production
Leaner organisation post 2016
restructurings
Improvements in safety
Continued focus on loading
and hauling practices and
tempos
Processing throughput and
quality (Fe content and
lump:fine ratio)
Supplier consolidation and
terms negotiations
Closer partnerships with
strategic suppliers
Demand controls and
development of tools to
analyse and reduce further
consumption
Specifications review with
TCO2 approach
Continued efforts to improve
operations and ensure
consistent product quality
Greater integration of sales
and operations planning to
respond to market dynamics
Curr
ent
situation
2018 p
riorities
Reinforce core skills and
capabilities
Fit-for-purpose and effective
organisation
Greater agility to accelerate
decision-making and execution
Strong leadership and winning
culture
Operationalfull potential
Externalspend
Integrated sales & operations planning
More effective organization
1. OEE: Overall Equipment Effectiveness
2. TCO: Total Cost of Ownership

31
HORIZON 2: INVESTING TO GROW THE CORE
Northern Cape
full potential
Conceptual3-10 years
Pre-feasibility2–3 years
ConstructionCompleted
Sishen
DMS upgrade to UHDMS
Leveraging proven UHDMS
technology
~2Mtpa over LoM
Low capex
High margin
Sishen
2nd Modular UHDMS plant
Reprocessing of remaining JIG
discard stream material
~0.6Mtpa over LoM
Low capex
High margin
Sishen and Kolomela
UHDMS modular plants
Sishen:
Reprocessing of JIG
discard material
~0.7Mtpa product
Low opex
High margin
Kolomela:
Processing of B grade material
~0.7Mtpa product
Low grade beneficiation options
On mine exploration
Near mine exploration potential
LoM extension, maintaining high returns and product quality

GUIDANCE

33
Production: 30 – 31Mt in 2018
Waste: 170 – 180Mt in 2018
Unit costs: R295 to R305 in 2018
Strip ratio: to exceed 4 in 2018, LoM ~4
LoM: 13 years
Production: ~14Mt in 2018
Waste: 55 – 57Mt in 2018
Unit costs: R240 to R250 in 2018
Strip ratio: to exceed 3.5 in 2018, LoM ~4
LoM: 14 years
GUIDANCE
Sishen Kolomela
Total production (Mt)
44 – 45Total sales (Mt)
44 – 45Capex (Rbn)
3.9 – 4.1

34
UNLOCKING FULL POTENTIAL
Safe, efficient
and productive
operations
Sound
financial
discipline
Well positioned
for long term
sustainability

QUESTIONS

ANNEXURES

37
Mt FY17 FY16 % change 2H17 1H17 % change
Railed to port (incl. Saldanha Steel) 42.0 39.8 6 21.2 20.8 2
Sishen mine (incl. Saldanha Steel) 28.5 26.8 6 14.1 14.4 (2)
Kolomela mine 13.5 13.0 4 7.1 6.4 11
Total sales 44.9 42.5 6 23.7 21.2 12
Export 41.6 39.1 6 22.1 19.5 13
Domestic 3.3 3.4 (3) 1.6 1.7 (6)
Total ore shipped 41.6 38.7 7 22.1 19.5 13
CFR (shipped by Kumba) 28.6 27.3 5 15.9 12.7 25
FOB (shipped by customers) 13.0 11.4 14 6.2 6.8 (9)
Finished product inventory 4.3 3.5 23 4.3 4.4 (2)
ANNEXURE 1:LOGISTICS PERFORMANCE REFLECTS HIGHER PRODUCTION

38
1. Including Thabazimbi2. Excluding the impairment reversal in 2017/charge in 2016
ANNEXURE 2:ROBUST OPERATING MARGIN AND HEALTHY CASH GENERATION
Rm FY171 FY161 % change 2H171 1H171 % change
Revenue 46 379 40 767 14 24 879 21 500 16
Operating expenses (25 058) (25 451) 2 (11 205) (13 853) 19
Operating profit 21 321 15 316 39 13 674 7 647 79
Operating margin (%)2 36 38 (2) 36 36 -
Profit for the period 16 133 11 144 45 10 135 5 998 69
Equity holders of Kumba 12 335 8 621 43 7 749 4 586 69
Non-controlling interest 3 798 2 523 51 2 386 1 412 69
Effective tax rate (%) 25 26 (1) 27 23 4
Cash generated from operations 22 432 17,218 30 10 706 11 726 (9)
39
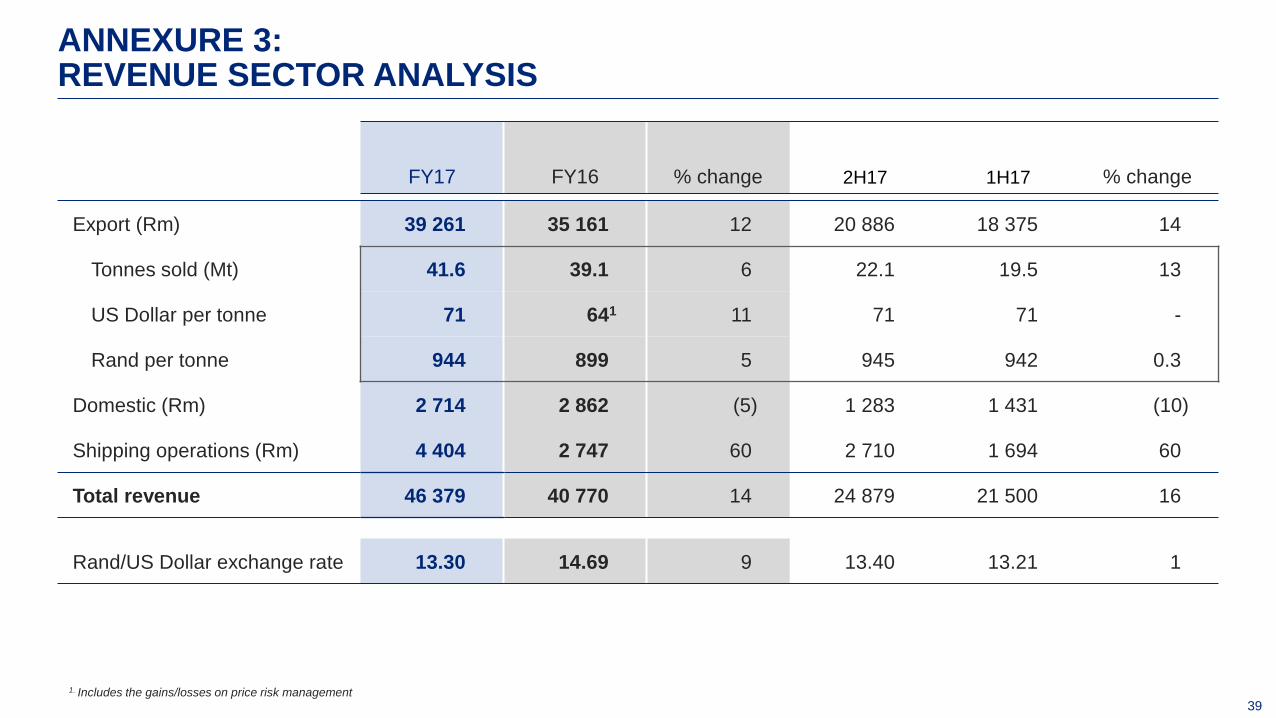
FY17 FY16 % change 2H17 1H17 % change
Export (Rm) 39 261 35 161 12 20 886 18 375 14
Tonnes sold (Mt) 41.6 39.1 6 22.1 19.5 13
US Dollar per tonne 71 641 11 71 71 -
Rand per tonne 944 899 5 945 942 0.3
Domestic (Rm) 2 714 2 862 (5) 1 283 1 431 (10)
Shipping operations (Rm) 4 404 2 747 60 2 710 1 694 60
Total revenue 46 379 40 770 14 24 879 21 500 16
Rand/US Dollar exchange rate 13.30 14.69 9 13.40 13.21 1
ANNEXURE 3:REVENUE SECTOR ANALYSIS
1. Includes the gains/losses on price risk management

40
15 965
18 307
3 117
4 486
1 206470 1 505
1 369436
(839)
5 379
5 815
FY16 Mining operations Stockmovement
Deferred stripping Escalation,non-cash and forex
Shipping Selling anddistribution
FY17
Rm
Mining operations Shipping Selling and distribution
24 461
1
Mining
2 342Logistics
1 805
28 608
1. Excluding the mineral royalty, impairment reversal
ANNEXURE 4:OPERATING EXPENDITURE DRIVEN BY VOLUME GROWTH

41
ANNEXURE 5:AGGREGATE OPERATING EXPENDITURE
Rm FY17 FY16 % change 2H17 1H17 % change
Cost of goods sold 18 306 15 965 15 9 521 8 785 8
Cost of goods produced 16 588 15 160 9 8 435 8 153 3
Production costs 16 360 15 470 6 8 704 7 656 14
Sishen mine 11 164 11 372 (2) 5 828 5 336 9
Kolomela mine 4 708 3 888 21 2 597 2 111 23
Thabazimbi mine 94 195 (52) (10) 104 (110)
Other 394 15 2 527 289 105 175
Inventory movement WIP 228 (310) 174 (269) 497 154
A grade (69) 118 (158) (69) - 100
B grade 297 (428) 169 (200) 497 (140)
Inventory movement finished product 231 300 (23) 215 16 1 244
Corporate support and studies 1 123 1 074 5 673 450 50
Forex and other 364 (569) 164 198 166 19
Mineral royalty 1 239 986 26 591 648 (9)
Impairment charge/(reversal) (4 789) 4 100 (4 789) - 100
Selling and distribution 5 816 5 379 8 3 157 2 659 19
Shipping operations 4 486 3 117 44 2 725 1 761 55
Operating expenses 25 058 25 451 (2) 11 205 13 853 (19)

42
(3)(30) (18) (18)
46 53 32 31
10 10
4 4
12 13
14 15
44 58
28 27
64
59
68 96
43
50
26
30
80
74
47
52
Sishen mineFY16
Sishen mineFY17
Kolomela mineFY16
Kolomela mineFY17
Deferred stripping Other Energy Drilling and blasting Maintenance Outside services Fuel Labour
296
287
201
237
ANNEXURE 6:SISHEN AND KOLOMELA MINES’ UNIT CASH COST STRUCTURE (R/t)

43
16 17 15 12
3 3 2 2
4 4 66
15 1813
10
21 19 31 38
14 1612 12
27 23 21 20
Sishen mineFY16
Sishen mineFY17
Kolomela mineFY16
Kolomela mineFY17
Other Energy Drilling and blasting Maintenance Outside services Fuel Labour
ANNEXURE 7:SISHEN AND KOLOMELA MINES’ UNIT CASH COST STRUCTURE (%)

44
Rm 2016 2017
12 months
31 Dec 2018
Forecast
Approved expansion 856 575 ~500
Deferred stripping 321 1 194 1 400 – 1 500
Sishen 88 942 1 200 – 1 300
Kolomela 233 252 ~200
SIB Sishen 875 793 1 300 – 1 400
SIB Kolomela 301 507 ~700
Total capital expenditure 2 353 3 069 3 900 – 4 100
ANNEXURE 8:CAPITAL EXPENDITURE ANALYSIS

45
Change per unit of key operational drivers, each tested independently
Sensitivity analysis Unit change EBITDA impact
Currency (Rand/US$) R0.10/US$ R300m
Export Price (US$/t) US$1.00/t R535m
Volume (kt) 100kt R65m
Breakeven price impact
Currency (Rand/US$) R1.00/US$ US$2.75/t
(400)
(380)
(265)
400
380
265
-500 -400 -300 -200 -100 0 100 200 300 400 500
Currency
Export price
Export volume
Sensitivity analysis (1% change) – EBITDA impact (Rm)
Source: WSA, Kumba market intelligence, GTIS Based on 4M16 data
ANNEXURE 9:SENSITIVITY ANALYSIS
1% change to key operational drivers, each tested independently