Embed Size (px)
Citation preview

INTERIM REPORT 中期報告書
2017/2018
for the six months ended 30 September 2017截至二零一七年九月三十日止六個月
HKSE 303
23rd Floor, Tai Ping Industrial Centre, Block 157 Ting Kok Road, Tai Po, New Territories, Hong KongTel: (852) 2680 1000 Fax: (852) 2680 1300Email: [email protected]
(Incorporated in Bermuda with limited liability)
香港新界大埔汀角路 57 號
( 於百慕達註冊成立之有限公司 )
太平工業中心第 1 期 23 樓電話:(852) 2680 1000 傳真:(852) 2680 1300電郵:[email protected]

Chairman’s Statement
VTech Holdings Limited 2017/2018 Interim Report 1
The first six months of the financial year 2018 saw further progress at VTech. Revenue and profit increased as the Group reaped the benefit of its successful consolidation of the operations of LeapFrog Enterprises, Inc. (LeapFrog) and Snom Technology GmbH (Snom). The growth of electronic learning products, however, was impacted by Toys“R”Us, which filed for bankruptcy protection in the US and Canada on 18 September 2017.
Results and Dividend
Group revenue for the six months ended 30 September 2017 increased by 5.8% to US$1,039.7 million, supported by higher sales in North America, Europe and Asia Pacific.
Profit attributable to shareholders of the Company increased by 45.1% to US$103.6 million. The rise in profit was due to higher revenue, product mix improvement, the absence of the one-off costs associated with the integration of LeapFrog and the contribution from the Snom business.
Basic earnings per share rose by 45.1% to US41.2 cents, compared to US28.4 cents in the first six months of the previous financial year.
The Board of Directors has declared an interim dividend of US17.0 cents per ordinary share, unchanged from the interim dividend declared in the corresponding period last year.
Costs and Operations
The Group’s gross profit margin in the first six months of the financial year 2018 rose from 31.9% to 32.3%. The improvement was mainly due to a more favourable product mix, a positive currency impact and productivity gains, despite an increase in materials prices. During the period, the Group has successfully brought most of the LeapFrog and Snom products in-house for manufacture.
Segment Results
North AmericaGroup revenue in North America increased by 5.3% to US$499.7 million in the first six months of the financial year 2018. Sales of electronic learning products (ELPs) and contract manufacturing services (CMS) were higher, offsetting lower sales from telecommunication (TEL) products. North America was VTech’s largest market, accounting for 48.0% of Group revenue.
ELPs revenue in North America rose by 2.6% to US$192.4 million, driven by higher sales of both standalone and platform products. For the first nine months of the calendar year 2017, the Group maintained its position as the number one manufacturer of electronic learning toys from infancy through toddler and preschool in the US1.
Revenue growth was negatively impacted by the filing for bankruptcy protection by Toys“R”Us. VTech’s sales to the retailer up to the date of the filing were covered by credit insurance. After the filing, shipments were no longer covered, and hence were temporarily suspended, pending negotiation of new terms. The Group makes every effort to support its long-term business partners and has worked closely with Toys“R”Us to ensure the right products are delivered to consumers in the run-up to the holiday season.
One of the Group’s strategies in the financial year 2018 has been to grow the LeapFrog standalone toy business. By launching more learning toys under the LeapFrog brand, this strategy has seen initial success in the first half, with rising sales of the brand’s standalone products. A number of the infant and preschool products performed particularly well, including both new and classic items, namely 2-in-1 LeapTop Touch™, Mr Pencil’s Scribble & Write™, Scoop & Learn Ice Cream Cart™, as well as My Pal Scout and Violet. Scoop & Learn Ice Cream Cart was featured in The Toy Insider’s “Hot 20” list of the hottest toys of the season.
In VTech standalone products, there were higher sales of preschool products and the Kidizoom® Camera range, which offset declines in the infant category and the Go! Go! Smart family of products. Among the successes, Pop-a-Balls™ Drop & Pop Ball Pit™ was included in Walmart’s “Chosen by Kids” Top Toys List. The all-weather Kidizoom Action Cam 180 was named in The Toy Insider’s 12th annual Holiday Gift Guide, alongside the new GearZooz™ Roll & Roar Animal Train™. Despite a decline in overall Go! Go! Smart sales, several new products were well received by the market, with Go! Go! Smart Wheels® Race & Play Adventure Park™ making the elite “Hot 20” list at The Toy Insider. During the period, the Group also brought its product innovation to the outdoor tricycle category, with the “grow-with-me” 4-in-1 Stroll & Grow Tek Trike™.
Among platform products, the Kidizoom Smartwatch range remains a growth driver. The older models continued to sell well, while the launch of the third generation Kidizoom Smartwatch DX2 featuring dual cameras, and a new Star Wars™ themed version, added to the momentum. Touch and Learn Activity Desk™ Deluxe and the LeapStart™ Interactive Learning System, which were both launched in August last year, continued to perform well. In August 2017, the Group introduced an updated LeapStart system, with an enhanced stylus and additional titles, including licensed books. This product was included in The Toy Insider’s 12th annual Holiday Gift Guide. A new children’s communication device called KidiBuzz™ also hit the US shelves. During the period, the Group launched LeapPad™ Ultimate to replace LeapPad Platinum, while LeapFrog Epic™ was updated with the new Academy Edition. Despite these new launches, sales of children’s educational tablets decreased in line with the overall market decline.
1 Source: NPD Group, Retail Tracking Service. Ranking based on total retail sales of VTech and LeapFrog products in the combined toy categories of early electronic learning, other infant toys, bath toys, electronic entertainment (excluding tablets) and preschool electronic learning for the calendar year ending September 2017
Chairman’s Statement
2 VTech Holdings Limited 2017/2018 Interim Report
2 Source: MarketWise Consumer Insights, LLC3 Source: NPD Group, Retail Tracking Service
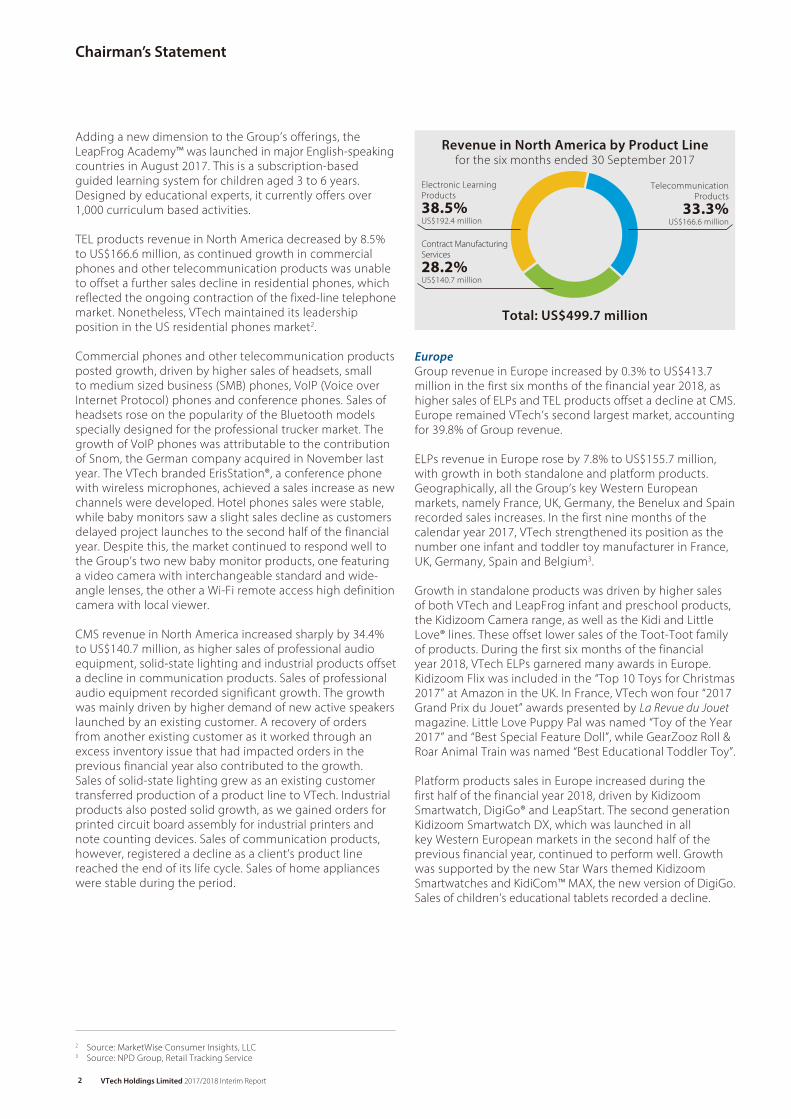
Adding a new dimension to the Group’s offerings, the LeapFrog Academy™ was launched in major English-speaking countries in August 2017. This is a subscription-based guided learning system for children aged 3 to 6 years. Designed by educational experts, it currently offers over 1,000 curriculum based activities.
TEL products revenue in North America decreased by 8.5% to US$166.6 million, as continued growth in commercial phones and other telecommunication products was unable to offset a further sales decline in residential phones, which reflected the ongoing contraction of the fixed-line telephone market. Nonetheless, VTech maintained its leadership position in the US residential phones market2.
Commercial phones and other telecommunication products posted growth, driven by higher sales of headsets, small to medium sized business (SMB) phones, VoIP (Voice over Internet Protocol) phones and conference phones. Sales of headsets rose on the popularity of the Bluetooth models specially designed for the professional trucker market. The growth of VoIP phones was attributable to the contribution of Snom, the German company acquired in November last year. The VTech branded ErisStation®, a conference phone with wireless microphones, achieved a sales increase as new channels were developed. Hotel phones sales were stable, while baby monitors saw a slight sales decline as customers delayed project launches to the second half of the financial year. Despite this, the market continued to respond well to the Group’s two new baby monitor products, one featuring a video camera with interchangeable standard and wide-angle lenses, the other a Wi-Fi remote access high definition camera with local viewer.
CMS revenue in North America increased sharply by 34.4% to US$140.7 million, as higher sales of professional audio equipment, solid-state lighting and industrial products offset a decline in communication products. Sales of professional audio equipment recorded significant growth. The growth was mainly driven by higher demand of new active speakers launched by an existing customer. A recovery of orders from another existing customer as it worked through an excess inventory issue that had impacted orders in the previous financial year also contributed to the growth. Sales of solid-state lighting grew as an existing customer transferred production of a product line to VTech. Industrial products also posted solid growth, as we gained orders for printed circuit board assembly for industrial printers and note counting devices. Sales of communication products, however, registered a decline as a client’s product line reached the end of its life cycle. Sales of home appliances were stable during the period.
Revenue in North America by Product Line
Total: US$499.7 million
for the six months ended 30 September 2017
Telecommunication Products
33.3%US$166.6 million
Electronic Learning Products
38.5%US$192.4 million
Contract Manufacturing Services
28.2%US$140.7 million
EuropeGroup revenue in Europe increased by 0.3% to US$413.7 million in the first six months of the financial year 2018, as higher sales of ELPs and TEL products offset a decline at CMS. Europe remained VTech’s second largest market, accounting for 39.8% of Group revenue.
ELPs revenue in Europe rose by 7.8% to US$155.7 million, with growth in both standalone and platform products. Geographically, all the Group’s key Western European markets, namely France, UK, Germany, the Benelux and Spain recorded sales increases. In the first nine months of the calendar year 2017, VTech strengthened its position as the number one infant and toddler toy manufacturer in France, UK, Germany, Spain and Belgium3.
Growth in standalone products was driven by higher sales of both VTech and LeapFrog infant and preschool products, the Kidizoom Camera range, as well as the Kidi and Little Love® lines. These offset lower sales of the Toot-Toot family of products. During the first six months of the financial year 2018, VTech ELPs garnered many awards in Europe. Kidizoom Flix was included in the “Top 10 Toys for Christmas 2017” at Amazon in the UK. In France, VTech won four “2017 Grand Prix du Jouet” awards presented by La Revue du Jouet magazine. Little Love Puppy Pal was named “Toy of the Year 2017” and “Best Special Feature Doll”, while GearZooz Roll & Roar Animal Train was named “Best Educational Toddler Toy”.
Platform products sales in Europe increased during the first half of the financial year 2018, driven by Kidizoom Smartwatch, DigiGo® and LeapStart. The second generation Kidizoom Smartwatch DX, which was launched in all key Western European markets in the second half of the previous financial year, continued to perform well. Growth was supported by the new Star Wars themed Kidizoom Smartwatches and KidiCom™ MAX, the new version of DigiGo. Sales of children’s educational tablets recorded a decline.

Chairman’s Statement
VTech Holdings Limited 2017/2018 Interim Report 3
Revenue from TEL products in Europe increased by 10.3% to US$69.5 million. Higher sales of commercial phones and other telecommunication products offset lower sales of residential phones.
Growth in VoIP phones was the main reason for the sales increase as the Group consolidated the first full six months sales of the Snom business. Baby monitors were another factor behind the growth, due to good sell-through and increased orders from existing and new customers. Sales of CAT-iq (Cordless Advanced Technology — internet and quality) handsets also rose as the Group secured more orders from an existing customer and began to sell VTech branded CAT-iq handsets into the Swiss market. Integrated access devices (IADs) saw sales increase to existing and new customers, while hotel phones achieved good growth. Sales of residential phones continued to decline as the fixed-line telephone market contracted further.
CMS revenue in Europe decreased by 8.1% to US$188.5 million. The decrease was mainly due to a fall in sales of switching mode power supplies, as a change in ownership led a customer to begin moving production back in-house. Sales of professional audio equipment and hearables retreated slightly. The decline in sales of professional audio equipment was due to a product being phased out by an existing customer. Keen competition in the wireless headset market explained lower sales of hearables. Despite this, sales of industrial products and medical and health products saw increases. Growth of industrial products was led by smart meters for the UK market. Utility suppliers are encouraging households to install the devices to track their energy consumption, supported by Government policy. Meanwhile, the Group ramped up orders of hearing aids to a European customer, driving growth in medical and health products.
Revenue in Europe by Product Line
Total: US$413.7 million
for the six months ended 30 September 2017
Telecommunication Products
16.8%US$69.5 million
Electronic Learning Products
37.6%US$155.7 million
Contract Manufacturing Services
45.6%US$188.5 million
Asia PacificGroup revenue in Asia Pacific rose by 43.9% to US$100.6 million in the first six months of the financial year 2018, with higher sales in all three product lines. Asia Pacific represented 9.7% of Group revenue.
Revenue from ELPs in Asia Pacific rose by 43.4% to US$35.0 million, led by growth in mainland China, Australia, Hong Kong and South Korea. In mainland China, the Group benefited from new product launches, channel expansion and increased marketing efforts. In Australia and South Korea, the Group’s products achieved broader listings, while more promotions drove sales higher in Hong Kong. Increased sales of LeapFrog branded products in other Asia Pacific markets also contributed to overall growth.
TEL products revenue in Asia Pacific rose by 30.7% to US$21.7 million, driven by higher sales in Japan and Hong Kong. In Japan, the Group secured more projects and orders from an existing customer. In Hong Kong, VTech supplied telecommunication devices to a leading local broadband service provider, driving sales of IADs and CAT-iq handsets. Sales in Australia saw a decline despite increased sales of baby monitors, which were insufficient to offset lower sales of residential phones.
CMS revenue in Asia Pacific increased by 51.9% to US$43.9 million. Higher sales of medical and health products, professional audio equipment, hearables and communication products offset lower sales of solid-state lighting and home appliances. The sales contribution from the newly acquired high precision metal parts business added to growth.
Medical and health products gained momentum as the Group ramped up shipments of diagnostic ultrasound systems to its Japanese customer. Professional audio equipment posted higher sales as the Group’s existing customers sold more products to mainland China. Sales growth in hearables was driven by orders from a new customer. Communication products performed well as VTech started producing the digital version of a marine radio for an existing customer. Sales of solid-state lighting and home appliances, however, recorded declines as customers faced keen competition.
Revenue in Asia Pacific by Product Line
Total: US$100.6 million
for the six months ended 30 September 2017
Telecommunication Products
21.6%US$21.7 million
Electronic Learning Products
34.8%US$35.0 million
Contract Manufacturing Services
43.6%US$43.9 million
Other RegionsGroup revenue in Other Regions, comprising Latin America, the Middle East and Africa, decreased by 1.2% to US$25.7 million in the first six months of the financial year 2018. Lower sales of TEL products in Other Regions offset higher sales of ELPs and CMS. Other Regions accounted for 2.5% of Group revenue.

Chairman’s Statement
4 VTech Holdings Limited 2017/2018 Interim Report
ELPs revenue in Other Regions rose by 12.8% to US$10.6 million for the period, as higher sales in the Middle East compensated for lower sales in Latin America and Africa.
TEL products revenue in Other Regions decreased by 10.5% to US$14.5 million. The decline was attributable to lower sales in Latin America, offsetting growth in the Middle East and Africa.
CMS revenue in Other Regions was US$0.6 million in the first six months of the financial year 2018, as compared to US$0.4 million in the corresponding period of the last financial year.
Revenue in Other Regions by Product Line
Total: US$25.7 million
for the six months ended 30 September 2017
Telecommunication Products
56.4%US$14.5 million
Electronic Learning Products
41.3%US$10.6 million
Contract Manufacturing Services
2.3%US$0.6 million
Outlook
Group revenue for the financial year 2018 is expected to increase. Sales of TEL products are anticipated to pick up in the second half, while the good momentum behind CMS is forecast to continue. For ELPs, sales for the full financial year are difficult to gauge, as there is uncertainty regarding the level of shipments in the second half to Toys“R”Us, one of the Group’s top five customers. Consequently, the trend in gross margin is also difficult to predict.
Despite the near-term uncertainty, the Group is experiencing good demand for its ELPs. In standalone products, the LeapFrog portfolio is being strengthened by the introduction of more new learning toys, while VTech infant and toddler products, as well as the Kidizoom Camera range, are gaining market share. Platform products will benefit from the strong sell-through of Kidizoom Smartwatch, LeapStart and the newly introduced children’s communication devices KidiBuzz and KidiCom MAX. Subscriptions to the LeapFrog Academy are expected to grow in the second half as more marketing efforts come on stream and more LeapFrog Epic Academy Editions are sold through during the holiday seasons. Geographically, Asia Pacific will continue to outperform. The relaxation of the one child policy in mainland China is increasing the size of the Group’s target market for baby and infant products. In Australia and South Korea, broader listings will continue to drive sales growth in these two key regional markets.
Sales of TEL products are expected to recover in the second half resulting in full-year growth, as sales of commercial phones and other telecommunication products continue to improve, offsetting a further decline in sales of residential phones. Two key new VoIP phones have been introduced by Snom, one features a large, full-colour LCD screen and the other has a high resolution second screen for programmable function keys. Conference phones will also benefit from new Snom models and the development of additional sales channels. Hotel phones will grow as previously delayed projects come on-stream and a new Boutique range catering to the demand for smaller handsets is launched. The strong momentum in headsets for the professional trucker market is expected to continue. Additionally, VTech will launch two new headset models for the business market later in the financial year. The popular VTech baby monitors will see growth due to increased retail shelf placement. Sales of CAT-iq handsets and IADs will grow as a result of increasing orders from both existing and new customers.
VTech CMS is forecast to achieve solid growth for the full year, despite a slow EMS market in the first six months of the calendar year 20174. Sales are expected to rise on the back of increasing orders from existing customers in professional audio, hearables, industrial products, solid-state lighting as well as medical and health products, offsetting a further decline in switching mode power supplies. There will also be a full-year sales contribution from the high precision metal parts business. To position CMS for further growth, the Group plans to migrate towards “Industry 4.0”, in which machines are augmented with web connectivity and connected to a system that can visualise the entire production chain and make autonomous decisions. VTech believes that by embracing this concept it will continue to achieve excellence in manufacturing, thereby lowering costs, increasing productivity and improving time to market for its customers.
VTech has had a solid first half despite near-term uncertainties. With strength in product innovation, market leadership and operational excellence, we are confident in the Group’s long-term outlook. VTech is well-positioned to achieve further growth and deliver sustainable returns to shareholders.
Allan WONG Chi YunChairman
Hong Kong, 9 November 2017
4 Source: Manufacturing Market Insider, August 2017

Management Discussion and Analysis
VTech Holdings Limited 2017/2018 Interim Report 5
Financial Overview
Six months ended 30 September2017 2016 Change
For the six months ended 30 September 2017 US$ million US$ million US$ million
Revenue 1,039.7 982.9 56.8 Gross profit 335.4 313.8 21.6Gross profit margin 32.3% 31.9%
Total operating expenses (220.6) (234.5) 13.9Total operating expenses as a percentage of revenue 21.3% 23.8% Operating profit 114.8 79.3 35.5Operating profit margin 11.0% 8.1%
Net finance income – 0.2 (0.2) Profit before taxation 114.8 79.5 35.3
Taxation (11.2) (8.1) (3.1)Effective tax rate 9.8% 10.2% Profit for the period and attributable to shareholders
of the Company 103.6 71.4 32.2
Revenue
Group revenue for the six months ended 30 September 2017 rose by 5.8% over the same period of the previous financial year to US$1,039.7 million. The increase in revenue was largely driven by the higher sales in North America, Europe and Asia Pacific, which offset the decrease in revenue in other regions.
Six months ended 30 September 2017
Six months ended 30 September 2016 Increase/(decrease)
US$ million % US$ million % US$ million %
North America 499.7 48.0% 474.4 48.3% 25.3 5.3%Europe 413.7 39.8% 412.6 42.0% 1.1 0.3%Asia Pacific 100.6 9.7% 69.9 7.1% 30.7 43.9%Other regions 25.7 2.5% 26.0 2.6% (0.3) -1.2%
1,039.7 100.0% 982.9 100.0% 56.8 5.8%
Group Revenuefor the six months ended 30 September
US$ million
2016 2017
1,200
1,000
600
800
200
400
0
982.9 1,039.7
Gross Profit/Margin
Gross profit for the six months ended 30 September 2017 was US$335.4 million, an increase of US$21.6 million or 6.9% compared with the same period last year. Gross profit margin for the period also increased from 31.9% to 32.3%. The increase in gross profit and gross profit margin was mainly attributable to the gross profit contribution from LeapFrog and Snom, and the depreciation of Renminbi against the US dollar during the period. Cost of materials as percentage
of Group revenue was also lower than the same period last year, which was mainly due to the change in product mix offsetting the higher material prices. As for the direct labour costs and manufacturing overheads as percentage of Group revenue, they were also lower than the same period last year as the Group continued to reduce workforce through automation and process improvement.
Operating Profit/Margin
Operating profit for the six months ended 30 September 2017 was US$114.8 million, an increase of US$35.5 million or 44.8% compared with the same period of the previous financial year. Operating profit margin also increased from 8.1% to 11.0%. The improvement in operating profit and operating profit margin was primarily due to the increase in gross profit and gross profit margin, and the reduction in operating expenses as the restructuring costs arising from the integration of LeapFrog were incurred in the same period last year.
Total operating expenses decreased from US$234.5 million to US$220.6 million compared with the same period last year. Total operating expenses as a percentage of Group revenue also decreased from 23.8% to 21.3%.

Management Discussion and Analysis
6 VTech Holdings Limited 2017/2018 Interim Report
Selling and distribution costs decreased from US$145.2 million to US$138.1 million, a decrease of 4.9% compared with the same period last year. It was mainly attributable to the reduced spending on advertising and promotional activities. As a percentage of Group revenue, selling and distribution costs also decreased from 14.7% to 13.3%.
Administrative and other operating expenses decreased from US$50.7 million to US$43.3 million compared with the same period last year. It was mainly due to the decrease in employee related costs as the restructuring costs associated with the consolidation of LeapFrog were incurred in the same period last year. The net exchange loss arising from the Group’s global operations in the ordinary course of business was US$0.2 million, as compared with an exchange gain of US$0.1 million in the corresponding period of last year. Administrative and other operating expenses as a percentage of Group revenue also decreased from 5.2% to 4.2%.
During the first half of the financial year 2018, the research and development expenses were US$39.2 million, an increase of 1.6% compared with the same period last year. Research and development expenses as a percentage of Group revenue reduced from 3.9% to 3.8%.
Profit Attributable to Shareholders and Earnings per Share
Profit attributable to shareholders of the Company for the six months ended 30 September 2017 was US$103.6 million, an increase of US$32.2 million or 45.1% compared with the same period last year. Net profit margin also increased from 7.3% to 10.0%.
Basic earnings per share for the six months ended 30 September 2017 were US41.2 cents as compared to US28.4 cents in the first half of the previous financial year.
Profit Attributable to Shareholders of the Companyfor the six months ended 30 September
US$ million
2016 2017
120
100
80
60
40
20
0
71.4
103.6
Dividends
Since the end of the relevant financial period, the directors of the Company (the “Directors”) have declared an interim dividend of US17.0 cents per share, which is estimated to be US$42.7 million.
Liquidity and Financial ResourcesThe Group’s financial resources remain strong. As of 30 September 2017, the Group had net cash of US$89.7 million which included a bank loan of US$1.6 million acquired from Snom. The Group also has adequate liquidity to meet its current and future working capital requirements.
Working CapitalStocks as of 30 September 2017 were US$456.9 million, increased from US$324.9 million as of 31 March 2017 with turnover days of 96 days. The higher stock level was primarily due to the seasonality of most of the Group’s businesses. Furthermore, we had arranged early production of the Group’s products in order to better utilise the Group’s production capacities. As compared to the corresponding period of last financial year, stocks increased by US$66.4 million or 17.0%, and turnover days also increased from 110 days to 128 days. The higher stock level compared with the same period last year was mainly due to the higher demand of the Group’s products in the second half of the financial year, increase in in-house production after the acquisition of LeapFrog and Snom, and the temporary suspension of shipments to Toys“R”Us after its bankruptcy protection filing in the US and Canada.
Trade debtors as of 30 September 2017 were US$462.9 million, increased from US$275.4 million as of 31 March 2017 with turnover days of 64 days. This was mainly due to the growth in revenue in the first half of the financial year and the seasonal nature of most of the Group’s businesses. As compared to the corresponding period of last financial year, trade debtors increased by US$39.8 million or 9.4%, and turnover days also increased from 60 days to 64 days. The increase in trade debtors was mainly due to the increase in sales in the first half of the financial year compared with the same period last year.
Trade creditors as of 30 September 2017 were US$356.6 million, increased from US$227.2 million as of 31 March 2017 with turnover days of 93 days. As compared to the corresponding period of last financial year, trade creditors increased by US$77.4 million or 27.7%, and turnover days also increased from 79 days to 94 days.
Treasury PoliciesThe Group’s treasury policies are designed to mitigate the impact of fluctuations in foreign currency exchange rates arising from the Group’s global operations. The Group principally use forward foreign exchange contracts as appropriate to hedge the foreign exchange risks in the ordinary course of business. It is the Group’s policy not to enter into derivative transactions for speculative purposes.
Capital Expenditure and ContingenciesFor the six months ended 30 September 2017, the Group invested US$23.6 million in the purchase of tangible assets including machinery and equipment, leasehold improvements, office equipment, as well as the improvement of manufacturing working environment. All of these capital expenditures were financed from internal resources.
As of 30 September 2017, the Group had no material contingencies.

Interim Financial Report
VTech Holdings Limited 2017/2018 Interim Report 7
Consolidated Statement of Profit or LossFor the six months ended 30 September 2017
Six months ended 30 September
Year ended 31 March
2017 2016 2017(Unaudited) (Unaudited) (Audited)
Note US$ million US$ million US$ million
Revenue 3 1,039.7 982.9 2,079.3Cost of sales (704.3) (669.1) (1,389.9) Gross profit 335.4 313.8 689.4 Selling and distribution costs (138.1) (145.2) (319.0)Administrative and other operating
expenses (43.3) (50.7) (93.2)Research and development
expenses (39.2) (38.6) (77.2) Operating profit 3&4 114.8 79.3 200.0Net finance income – 0.2 0.1 Profit before taxation 114.8 79.5 200.1Taxation 5 (11.2) (8.1) (21.1) Profit for the period/year and
attributable to shareholders of the Company 103.6 71.4 179.0
Earnings per share (US cents) 7– Basic 41.2 28.4 71.3– Diluted 41.2 28.4 71.3
Condensed Consolidated Statement of Cash FlowsFor the six months ended 30 September 2017
Six months ended 30 September
Year ended 31 March
2017 2016 2017(Unaudited) (Unaudited) (Audited)US$ million US$ million US$ million
Operating activitiesCash (used in)/generated from
operations (31.8) (57.1) 202.0Interest received – 0.2 0.1Tax paid (6.7) (7.0) (16.8) Net cash (used in)/generated
from operating activities (38.5) (63.9) 185.3 Investing activitiesPurchase of tangible assets (23.6) (19.1) (35.7)Proceeds from disposal of
tangible assets 0.1 0.3 1.5Payment for acquisition of
subsidiaries (net of cash and cash equivalents acquired) – (16.4) (28.2)
Net cash used in investing activities (23.5) (35.2) (62.4) Financing activitiesDividends paid (133.2) (62.8) (105.5)Repayment of bank loans arising from
acquisition of Snom (0.1) – (2.0)Other cash flows arising from
financing activities (1.8) (1.8) (5.3) Net cash used in financing activities (135.1) (64.6) (112.8) Effect of exchange rate changes 19.6 (4.9) (14.3) Decrease in cash and
cash equivalents (177.5) (168.6) (4.2)Cash and cash equivalents at
the beginning of period/year 268.8 273.0 273.0 Cash and cash equivalents at
the end of period/year 91.3 104.4 268.8
The notes on pages 9 to 15 form part of this Interim Financial Report. Details of dividends payable to shareholders of the Company attributable to the profit for the period are set out in note 6.
Consolidated Statement of Profit or Loss and Other Comprehensive IncomeFor the six months ended 30 September 2017
Six months ended 30 September
Year ended 31 March
2017 2016 2017(Unaudited) (Unaudited) (Audited)US$ million US$ million US$ million
Profit for the period/year 103.6 71.4 179.0 Other comprehensive income
for the period/year
Item that will not be reclassified to profit or loss:
Effect of remeasurement of net liability of defined benefit scheme, net of deferred tax – – 2.7
– – 2.7 Items that may be reclassified
subsequently to profit or loss:Fair value (losses)/gains on hedging,
net of deferred tax (7.0) – 5.2Realisation of hedging reserve (1.9) (2.5) (4.8)Exchange translation differences 18.9 (7.8) (17.2)
10.0 (10.3) (16.8) Other comprehensive income for
the period/year 10.0 (10.3) (14.1) Total comprehensive income
for the period/year 113.6 61.1 164.9
Consolidated Statement of Financial PositionAs at 30 September 2017
30 September 31 March2017 2016 2017
(Unaudited) (Unaudited) (Audited)Note US$ million US$ million US$ million
Non-current assetsTangible assets 79.6 69.3 72.1Leasehold land payments 4.6 4.6 4.5Intangible assets 19.9 20.0 20.5Deposits for acquisition of
tangible assets – 3.3 –Investments 3.1 3.1 3.1Goodwill 31.1 23.2 31.1Deferred tax assets 11.7 9.4 7.0
150.0 132.9 138.3 Current assetsStocks 8 456.9 390.5 324.9Debtors, deposits and prepayments 9 539.1 467.8 325.6Taxation recoverable 2.8 3.7 2.4Deposits and cash 91.3 104.4 268.8
1,090.1 966.4 921.7 Current liabilitiesCreditors and accruals 10 (611.1) (513.3) (422.2)Provisions for defective goods
returns and other liabilities (35.6) (44.3) (34.9)Taxation payable (20.4) (10.6) (10.8)Secured bank loans (1.1) – (0.7)
(668.2) (568.2) (468.6) Net current assets 421.9 398.2 453.1 Total assets less current liabilities 571.9 531.1 591.4 Non-current liabilitiesSecured bank loans (0.5) – (1.0)Net obligations on defined
benefit scheme (2.7) (5.3) (2.5)Deferred tax liabilities (2.9) (2.9) (3.2)
(6.1) (8.2) (6.7) Net assets 565.8 522.9 584.7 Capital and reservesShare capital 11(a) 12.6 12.5 12.5Reserves 553.2 510.4 572.2 Total equity 565.8 522.9 584.7

Interim Financial Report
8 VTech Holdings Limited 2017/2018 Interim Report
Consolidated Statement of Changes in EquityFor the six months ended 30 September 2017 – unaudited
Attributable to shareholders of the Company
Sharecapital
Sharepremium
Shares heldfor Share Purchase
SchemeExchange
reserveHedging
reserveRevenue
reserveTotal
equityNote US$ million US$ million US$ million US$ million US$ million US$ million US$ million
At 1 April 2017 12.5 148.8 (0.2) (33.8) 5.2 452.2 584.7Changes in equity for the six months ended
30 September 2017Comprehensive incomeProfit for the period – – – – – 103.6 103.6 Other comprehensive incomeFair value loss of hedging reserve,
net of deferred tax – – – – (7.0) – (7.0)Realisation of hedging reserve – – – – (1.9) – (1.9)Exchange translation differences – – – 18.9 – – 18.9 Other comprehensive income for the period – – – 18.9 (8.9) – 10.0 Total comprehensive income for the period – – – 18.9 (8.9) 103.6 113.6 Dividends approved and paid during the period 6(b) – – – – – (133.2) (133.2)Shares issued under Share Purchase Scheme 11(c) 0.1 3.0 (3.1) – – – –Shares purchased for Share Purchase Scheme 11(c) – – (1.8) – – – (1.8)Vesting of shares of Share Purchase Scheme 11(c) – – 2.5 – – – 2.5 At 30 September 2017 12.6 151.8 (2.6) (14.9) (3.7) 422.6 565.8
Attributable to shareholders of the Company
Sharecapital
Sharepremium
Shares heldfor Share Purchase
SchemeExchange
reserveHedging
reserveRevenue
reserveTotal
equityNote US$ million US$ million US$ million US$ million US$ million US$ million US$ million
At 1 April 2016 12.5 148.8 (0.5) (16.6) 4.8 376.0 525.0Changes in equity for the six months ended
30 September 2016Comprehensive incomeProfit for the period – – – – – 71.4 71.4 Other comprehensive incomeRealisation of hedging reserve – – – – (2.5) – (2.5)Exchange translation differences – – – (7.8) – – (7.8) Other comprehensive income for the period – – – (7.8) (2.5) – (10.3) Total comprehensive income for the period – – – (7.8) (2.5) 71.4 61.1 Dividends approved and paid during the period 6(b) – – – – – (62.8) (62.8)Shares purchased for Share Purchase Scheme 11(c) – – (1.8) – – – (1.8)Vesting of shares of Share Purchase Scheme 11(c) – – 1.4 – – – 1.4 At 30 September 2016 12.5 148.8 (0.9) (24.4) 2.3 384.6 522.9
The notes on pages 9 to 15 form part of this Interim Financial Report.

Notes to the Unaudited Interim Financial Report
VTech Holdings Limited 2017/2018 Interim Report 9
1 Basis of Preparation
The Directors are responsible for preparing the Interim Financial Report in accordance with applicable law and regulations. This unaudited Interim Financial Report has been prepared in accordance with the applicable disclosure provisions of the Rules Governing the Listing of Securities (the “Listing Rules”) on The Stock Exchange of Hong Kong Limited (the “Stock Exchange”) including compliance with International Accounting Standard 34 (“IAS 34”), Interim Financial Reporting, issued by the International Accounting Standards Board (the “IASB”).
The Interim Financial Report has been prepared in accordance with the same accounting policies adopted in the 2017 annual consolidated financial statements, except for the accounting policies changes that are expected to be reflected in the 2018 annual consolidated financial statements. Details of any changes in accounting policies are set out in note 2.
The preparation of an Interim Financial Report in conformity with IAS 34 requires management to make judgements, estimates and assumptions that affect the application of policies and reported amounts of assets and liabilities, income and expenses on a year to date basis. Actual results may differ from these estimates.
The Interim Financial Report contains condensed consolidated financial statements and selected explanatory notes. The notes include an explanation of events and transactions that are significant to an understanding of the changes in financial position and performance of the Group since the 2017 annual consolidated financial statements. The condensed consolidated interim financial statements and notes thereto do not include all of the information required for a full set of financial statements prepared in accordance with International Financial Reporting Standards (“IFRSs”).
The Interim Financial Report has not been audited or reviewed by the auditors pursuant to International Standards on Auditing or International Standards on Review Engagements.
The financial information relating to the financial year ended 31 March 2017 that is included in the Interim Financial Report as comparative information does not constitute the Company’s annual consolidated financial statements for that financial year but is derived from those financial statements. The annual consolidated financial statements for the year ended 31 March 2017 are available from the Company’s registered office. The auditors have expressed an unqualified opinion on those financial statements in their report dated 16 May 2017.
2 Changes in Accounting Policies
The IASB has issued several amendments to IFRSs that are first effective for the current accounting period of the Group. None of these developments has had a material effect on how the Group’s results and financial position for the current or prior periods have been prepared or presented in this interim financial report.
The Group has not applied any new standard or interpretation that is not yet effective for the current accounting period.
3 Segment Information
The Group manages its businesses by divisions, which are organised by geography. In accordance with IFRS 8, Operating segments and in a manner consistent with the way in which information is reported internally to the Group’s most senior executive management for the purposes of resource allocation and performance assessment, the Group has presented the following reportable segments.
• North America (including the United States and Canada)• Europe• Asia Pacific• Others, which covers sales of electronic products to the
rest of the world
The Company is domiciled in Bermuda. The results of its revenue from external customers located in North America, Europe, Asia Pacific and elsewhere are set out in the table below.
Each of the above reportable segments primarily derives its revenue from the sale of telecommunication products, electronic learning products and products from contract manufacturing services to customers in the relevant geographical region.
All of these products are manufactured in the Group’s manufacturing facilities located primarily in the People’s Republic of China under the Asia Pacific segment.
For the purposes of assessing segment performance and allocating resources between segments, the Group’s senior executive management monitors the results and assets attributable to each reportable segment on the following bases:
(a) Segment revenues and results
Revenue is allocated to the reportable segments based on the location of external customers. Expenses are allocated to the reportable segments with reference to sales generated by those segments and the expenses incurred by those geographical locations or which otherwise arise from the depreciation or amortisation of assets attributable to those segments.
The measure used for reporting segment profit is operating profit.
In addition to receiving segment information concerning operating profit, management is provided with segment information concerning revenue and depreciation and amortisation.
(b) Segment assets and liabilities
Segment assets include all non-current and current assets with the exception of deferred tax assets, taxation recoverable and other corporate assets including intangible assets, goodwill and investments.
Segment liabilities include creditors and accruals, provisions for defective goods returns and other liabilities, secured bank loans and net obligations on defined benefit scheme with the exception of taxation payable and deferred tax liabilities.

Notes to the Unaudited Interim Financial Report
10 VTech Holdings Limited 2017/2018 Interim Report
3 Segment Information (continued)
(b) Segment assets and liabilities (continued)
Segment information regarding the Group’s revenue, results, assets and liabilities by geographical market is presented below:
Reportable segment revenueSix months ended
30 September
Reportable segment profitSix months ended
30 September2017 2016 2017 2016
(Unaudited) (Unaudited) (Unaudited) (Unaudited)US$ million US$ million US$ million US$ million
North America 499.7 474.4 53.9 30.0Europe 413.7 412.6 37.3 35.3Asia Pacific 100.6 69.9 18.6 9.5Others 25.7 26.0 5.0 4.5
1,039.7 982.9 114.8 79.3
Reportable segment assets Reportable segment liabilities30 September 31 March 30 September 31 March
2017 2017 2017 2017(Unaudited) (Audited) (Unaudited) (Audited)US$ million US$ million US$ million US$ million
North America 267.2 175.2 (87.1) (71.6)Europe 249.6 119.2 (47.6) (32.9)Asia Pacific 654.7 701.5 (516.2) (356.7)Others – – (0.1) (0.1) 1,171.5 995.9 (651.0) (461.3)
(c) Reconciliation of reportable segment assets and liabilities
30 September 2017
31 March 2017
(Unaudited) (Audited)US$ million US$ million
AssetsReportable segment assets 1,171.5 995.9Intangible assets 19.9 20.5Investments 3.1 3.1Goodwill 31.1 31.1Taxation recoverable 2.8 2.4Deferred tax assets 11.7 7.0 Consolidated total assets 1,240.1 1,060.0 LiabilitiesReportable segment liabilities (651.0) (461.3)Taxation payable (20.4) (10.8)Deferred tax liabilities (2.9) (3.2) Consolidated total liabilities (674.3) (475.3)
4 Operating Profit
Operating profit is arrived at after charging/(crediting) the following:
Six months ended 30 September2017 2016
(Unaudited) (Unaudited)US$ million US$ million
Cost of inventories 704.3 669.1Depreciation of tangible assets 18.0 16.8Amortisation of intangible assets 0.6 –Write-down of inventories,
net of reversals 5.0 4.3Impairment loss of trade
debtors, net of reversals 1.4 0.2Interest income from
bank deposits – (0.2)Net foreign exchange
loss/(gain) 0.2 (0.1)

Notes to the Unaudited Interim Financial Report
VTech Holdings Limited 2017/2018 Interim Report 11
5 Taxation
Six months ended 30 September2017 2016
(Unaudited) (Unaudited)US$ million US$ million
Current tax– Hong Kong 11.8 10.7– Overseas 3.6 2.2
Deferred tax– Origination and reversal of
temporary differences (4.2) (4.8) 11.2 8.1
Current tax 15.4 12.9Deferred tax (4.2) (4.8)
11.2 8.1
Provision for Hong Kong Profits Tax and overseas taxation has been calculated at tax rates prevailing in the jurisdictions in which the Group operates.
6 Dividends
(a) Dividend attributable to the period:
Six months ended 30 September2017 2016
(Unaudited) (Unaudited)US$ million US$ million
Interim dividend of US17.0 cents (2016: US17.0 cents) per share declared 42.7 42.7
The interim dividend was proposed after the end of the relevant financial period and has not been recognised as liabilities at the end of the relevant financial period.
(b) At a meeting held on 16 May 2017, the Directors proposed a final dividend of US53.0 cents (2016: US25.0 cents) per ordinary share for the year ended 31 March 2017, which was estimated to be US$133.1 million at the time calculated on the basis of the ordinary shares in issue as at 31 March 2017. The final dividend was approved by shareholders at the annual general meeting on 24 July 2017. The final dividend paid in respect of the year ended 31 March 2017 totaled US$133.2 million (2016: US$62.8 million).
7 Earnings per Share
The calculations of basic and diluted earnings per share are based on the Group’s profit attributable to shareholders of the Company of US$103.6 million (2016: US$71.4 million).
The calculation of basic earnings per share is based on the weighted average of 251.2 million (2016: 251.1 million) ordinary shares in issue during the period after adjusting for shares held for Share Purchase Scheme.
No adjustment has been made to the basic earnings per share presented for the periods ended 30 September 2016 and 30 September 2017 as the Company did not have any significant dilutive potential ordinary shares during the periods.
8 Stocks
Stocks in the consolidated statement of financial position at 30 September 2017 comprised mainly finished goods of US$315.0 million (31 March 2017: US$183.8 million, 30 September 2016: US$255.8 million).
9 Debtors, Deposits and Prepayments
Debtors, deposits and prepayments of US$539.1 million (31 March 2017: US$325.6 million, 30 September 2016: US$467.8 million) include trade debtors of US$462.9 million (31 March 2017: US$275.4 million, 30 September 2016: US$423.1 million).
An ageing analysis of net trade debtors by transaction date is as follows:
30 September 2017
31 March 2017
(Unaudited) (Audited)US$ million US$ million
0-30 days 279.2 144.731-60 days 133.3 92.061-90 days 46.5 30.6>90 days 3.9 8.1 Total 462.9 275.4
The majority of the Group’s sales are on letters of credit and on open credit with varying terms of 30 to 90 days. Certain open credit sales are covered by credit insurance or bank guarantees.
10 Creditors and Accruals
Creditors and accruals of US$611.1 million (31 March 2017: US$422.2 million, 30 September 2016: US$513.3 million) include trade creditors of US$356.6 million (31 March 2017: US$227.2 million, 30 September 2016: US$279.2 million).
30 September 2017
31 March 2017
(Unaudited) (Audited)US$ million US$ million
Trade creditors 356.6 227.2Other creditors and accruals 239.4 194.5Forward foreign exchange
contracts held as cash flow hedging instruments 15.1 0.5
611.1 422.2
An ageing analysis of trade creditors by transaction date is as follows:
30 September 2017
31 March 2017
(Unaudited) (Audited)US$ million US$ million
0-30 days 98.1 81.731-60 days 108.8 59.861-90 days 84.7 44.7>90 days 65.0 41.0 Total 356.6 227.2

Notes to the Unaudited Interim Financial Report
12 VTech Holdings Limited 2017/2018 Interim Report
11 Share Capital, Share Options and Share Purchase Scheme
(a) Share Capital
30 September 2017
31 March 2017
(Unaudited) (Audited)US$ million US$ million
AuthorisedOrdinary shares: 400,000,000 (31 March 2017: 400,000,000) of US$0.05 each 20.0 20.0
30 September 2017 (Unaudited)
31 March 2017 (Audited)
No. of shares US$ million No. of shares US$ million
Issued and fully paidOrdinary shares of US$0.05 each:
At the beginning of period/year 251,182,133 12.5 251,182,133 12.5Issue of new shares under general mandate
pursuant to the Share Purchase Scheme 190,000 0.1 – – At the end of period/year 251,372,133 12.6 251,182,133 12.5
The Company’s issued and fully paid shares as at 30 September 2017 included 180,800 shares (31 March 2017: 384,500 shares) held in trust by the trustee under a share purchase scheme (the “Share Purchase Scheme”) and 10,600 shares (31 March 2017: 8,700 shares) held in trust by the trustee under an Addendum to the Share Purchase Scheme for the eligible French employees of the Group (the “French Subplan”) which were granted to the eligible French employees and remain unvested, details of which are set out in note 11(c).
(b) Share Options
The Company operates a share option scheme (the “Scheme”) approved on 22 July 2011 for the purpose of providing incentives and rewards to eligible participants who contribute to the success of the Group’s operations. Eligible participants of the Scheme include employees and officers of any member of the Group. The maximum number of shares which may be issued upon exercise of all options to be granted under the Scheme or the previous share option scheme adopted by the Company is 24,938,913 shares. Under the Scheme, the Directors may, at their discretion, at any time during 10 years from the date of adoption of the Scheme, invite employees and officers of any member of the Group to subscribe for shares of the Company in accordance with the terms of the Scheme. During the financial period and since the adoption of the Scheme, no options were granted, exercised, cancelled or lapsed under the Scheme. The new shares, when issued and fully paid, will rank pari passu among themselves and with the shares currently in issue, pursuant to the Scheme.
(c) Share Purchase Scheme
On 30 March 2011 (the “Adoption Date”), the Company adopted the Share Purchase Scheme, which is a share incentive award scheme for the purpose of incentivising employees and attracting suitable personnel for the continuous development of the Group. Eligible participants of the Share Purchase Scheme include Directors, officers and employees of any member of the Group as the Remuneration Committee may determine or approve. The shares to be awarded pursuant to the Share Purchase Scheme (the “Awarded Shares”) will be the existing shares, which will be purchased on the Stock Exchange by the independent trustee with funds provided by the Company, and will be awarded in such manner as the Remuneration Committee may determine or approve. The maximum number of shares that can be held by the trustee under the Share Purchase Scheme is limited to 3% of the issued share capital of the Company from time to time (excluding shares which have already been transferred to employees on vesting). The Share Purchase Scheme shall be valid and effective for a term of 20 years from the Adoption Date. The Awarded Shares will be granted to the eligible participants at no consideration subject to the applicable conditions and vesting period as determined by the Remuneration Committee. The new shares, when issued and fully paid, will rank pari passu among themselves and with the shares currently in issue, pursuant to the Share Purchase Scheme.

Notes to the Unaudited Interim Financial Report
VTech Holdings Limited 2017/2018 Interim Report 13
11 Share Capital, Share Options and Share Purchase Scheme (continued)
(c) Share Purchase Scheme (continued)
On 26 March 2013, the Company adopted the French Subplan. The Awarded Shares will be granted to the eligible French employees of the Group pursuant to the Share Purchase Scheme and the French Subplan. The vesting period applicable under the French Subplan shall not be less than 2 years following the date of the award and a further 2 years sales restriction period as calculated from the date of the Awarded Shares being transferred to the eligible French employees.
On 19 May 2015, the Company further amended and extended the Share Purchase Scheme such that the Company may furnish the trustee of the Share Purchase Scheme with cash to subscribe for new shares under the general mandate of the Company (as approved by the annual general meeting of the Company from time to time) and hold such new shares in trust for the selected participants (not being connected persons of the Company) under the Share Purchase Scheme. The new shares, when issued and fully paid, will rank pari passu among themselves and with the shares currently in issue. During the six months ended 30 September 2017, 190,000 new shares (31 March 2017: Nil) were issued under the general mandate of the Company pursuant to the Share Purchase Scheme.
During the six months ended 30 September 2017, 129,200 shares (30 September 2016: 157,800 shares) were purchased on the Stock Exchange pursuant to the Share Purchase Scheme. The total amount paid to purchase such shares during the financial period was approximately US$1.8 million (30 September 2016: US$1.8 million).
Details of the Awarded Shares (including those awarded pursuant to the French Subplan) which have been granted to the executive Directors, senior management and eligible employees during each of the six months ended 30 September 2016 and 30 September 2017, respectively, are as follows:
Date of award (Note 1)
Average purchase cost per Awarded
Share
Number of Awarded
Shares granted (Note 4)
Cost of related
Awarded Shares
Vesting Period for Awarded
Shares granted under Share
Purchase Scheme
Vesting Period for Awarded
Shares grantedunder French
Subplan
Period ended 30 September 2017
23 June 2017 HK$116.20 191,900 US$2.9 million 23 June 2017 to 29 June 2017
23 June 2019 to 29 June 2019
Period ended 30 September 2016
20 June 2016 HK$90.30 122,500 US$1.4 million 20 June 2016 to 26 June 2016
20 June 2018 to 26 June 2018
Notes:(1) The date of award refers to the date on which the Company issued the letter of award to the eligible participants for the entitlement to the Awarded Shares.(2) No Awarded Shares were granted to executive Directors or non-executive Directors during the financial period.(3) No Awarded Shares lapsed or were cancelled during the financial period.(4) These Awarded Shares included 6,200 Awarded Shares (30 September 2016: 4,400 Awarded Shares) granted under the French Subplan during the
financial year.
As at 30 September 2017, a total of 180,800 shares (31 March 2017: 384,500 shares) were held in trust by the trustee under the Share Purchase Scheme and 10,600 shares (31 March 2017: 8,700 shares) were held in trust by the trustee under the French Subplan which were granted to the eligible French employees and remain unvested. The trustee can exercise the voting rights of the shares held in trust in any general meetings as shareholder as it sees fit (and the Company has no power to influence how the trustee should exercise this discretion). Dividends derived from the shares held under the said trust will be reinvested to acquire further shares.
During the six months ended 30 September 2017, share-based payment expenses of US$2.5 million (30 September 2016: US$1.4 million) in respect of the Awarded Shares were charged to the consolidated statement of profit or loss.

Notes to the Unaudited Interim Financial Report
14 VTech Holdings Limited 2017/2018 Interim Report
12 Fair Value Measurements of Financial Instruments
The Group’s financial instruments are measured at fair value at the end of the relevant financial period on a recurring basis, categorised into the three-level fair value hierarchy as defined in IFRS 13, Fair Value Measurement. The level into which a fair value measurement is classified and determined with reference to the observability and significance of the inputs used in the valuation technique as follows:-
• Level 1 valuations: Fair values measured using only Level 1 inputs i.e. unadjusted quoted prices in active markets for identical assets or liabilities at the measurement date
• Level 2 valuations: Fair values measured using Level 2 inputs i.e. observable inputs which fail to meet Level 1, and not using significant unobservable inputs. Unobservable inputs are inputs for which market data are not available
• Level 3 valuations: Fair values measured using significant unobservable inputs
At 30 September 2017, the fair values of the forward foreign exchange contracts included in financial assets and liabilities were US$8.8 million (31 March 2017: US$6.2 million) and US$15.1 million (31 March 2017: US$0.5 million) respectively. At 30 September 2017 and 31 March 2017, the fair values of all forward foreign exchange contracts were categorised as Level 2.
During the six months ended 30 September 2017, there were no transfers between Level 1 and Level 2, or transfers into or out of Level 3 of the fair value hierarchy classifications.
The fair value of forward foreign exchange contracts in Level 2 is determined by discounting the difference between the forward exchange rates at the end of the reporting period and the contractual forward exchange rates.
13 Capital Commitments
30 September 2017
31 March 2017
(Unaudited) (Audited)US$ million US$ million
Capital commitments for property, plant and equipmentAuthorised but not
contracted for 11.2 32.8Contracted but not
provided for 4.1 6.1 15.3 38.9
14 Contingent Liabilities
(a) Certain subsidiaries of the Group are involved in litigation arising in the ordinary course of their respective business and are involved in certain accusations of infringements of patents, trademarks and tradenames. Having reviewed outstanding claims and taking into account legal advice received, the Directors are of the opinion that even if the claims are found to be valid, there will be no material adverse effect on the financial position of the Group.
(b) In November 2015, the Company experienced a cyber attack in which an intruder gained unauthorised access to some of our databases and servers and stole certain personal data of our customers around the world. The Company immediately took the affected databases and servers offline to ensure that our customer data was safe from further attack. In addition the Company has taken steps to report the incidents to a number of governmental authorities and law enforcement authorities in various jurisdictions.
The Company has subsequently recovered the personal data of customers and taken steps to ensure that copies of information that were disseminated to two other third parties (a journalist and a cyber-security consultant) have been destroyed or taken off-line, held securely and not disseminated further.
The Company has since then been subject to class action litigation in the US and governmental investigations in various jurisdictions. Certain governmental investigations have been resolved. As the class action litigation and some of the investigations are still ongoing and taking into account legal advice received, adequate provisions have been made only to the extent that the amounts can be reliably estimated.

Notes to the Unaudited Interim Financial Report
VTech Holdings Limited 2017/2018 Interim Report 15
15 Possible Impact of Amendments, New Standards and Interpretations Issued but not yet effective for the Annual Accounting period ending 31 March 2018
A number of amendments and new standards are effective for annual periods beginning after 1 April 2017 and earlier application is permitted; however, the Group has not early adopted any new or amended standards in preparing this Interim Financial Report.
The Group has the following updates to the information provided in the latest annual financial statements about the possible impacts of the new standards issued but not yet effective which may have a significant impact on the Group’s consolidated financial statements. The adoption of IFRS 15 is unlikely to have a significant impact on the Group’s financial performance and financial position.
IFRS 9, Financial Instruments
(i) Classification and measurement
IFRS 9, Financial Instruments, is relevant to the Group and will become effective for accounting periods beginning on or after 1 January 2018. IFRS 9 contains three principal classification categories for financial assets: measured at (a) amortised cost, (b) fair value through profit or loss and (c) fair value through other comprehensive income. If an equity security is designated as fair value through other comprehensive income, then only dividend income on that security will be recognised in profit or loss. Gains, losses and impairments on that security will be recognised in other comprehensive income without recycling. Based on the preliminary assessment, the group expects that its financial assets currently measured at fair value through profit or loss will continue with its classification and measurements upon the adoption of IFRS 9.
(ii) Impairment
The new impairment model in IFRS 9 replaces the “incurred loss” model in IAS 39 with an “expected credit loss” model. Under the expected credit loss model, it will no longer be necessary for a loss event to occur before an impairment loss is recognised. Instead, an entity is required to recognise and measure expected credit losses as either 12-month expected credit losses or lifetime expected credit losses, depending on the asset and the facts and circumstances. This new impairment model may result in an earlier recognition of credit losses on the Group’s trade debtors and other financial assets. However, a more detailed analysis is required to determine the extent of the impact.
(iii) Hedge accounting
IFRS 9 does not fundamentally change the requirements relating to measuring and recognising ineffectiveness under IAS 39. However, greater flexibility has been introduced to the types of transactions eligible for hedge accounting. The Group preliminarily assesses that its current hedge relationships will qualify as continuing hedges upon the adoption of IFRS 9 and therefore it expects that the accounting for its hedging relationships will not be significantly impacted.
IFRS 16, Leases
IFRS 16, Leases, is relevant to the Group and will become effective for accounting periods beginning on or after 1 January 2019. The standard eliminates the lessee’s classification of leases as either operating leases or finance leases and, instead, introduces a single lease accounting model. Applying that model, a lessee is required to recognise assets and liabilities for all leases with a term of more than 12 months, unless the underlying asset is of low value, and depreciation of lease assets separately from interest on lease liabilities in the statement of profit or loss. IFRS 16 will primarily affect the Group’s accounting as a lessee of leases for land and buildings which are currently classified as operating leases. The application of the new accounting model is expected to lead to an increase in both assets and liabilities and to impact on the timing of the expense recognition in the statement of profit or loss over the period of the lease. At 30 September 2017 the Group’s future minimum lease payments under non-cancellable operating leases amount to US$123.3 million for land and buildings, the majority of which is payable between one and five years after the reporting date. Some of these amounts may therefore need to be recognised as lease liabilities, with corresponding right-of-use assets, once IFRS 16 is adopted. The Group will need to perform a more detailed analysis to determine the amounts of new assets and liabilities arising from operating lease commitments on adoption of IFRS 16, after taking into account the applicability of the practical expedient and adjusting for any leases entered into or terminated between now and the adoption of IFRS 16 and the effects of discounting.
16 Approval of Interim Financial Report
The Interim Financial Report was approved by the Board on 9 November 2017.

Disclosure of Interests
16 VTech Holdings Limited 2017/2018 Interim Report
Directors’ Interests and Short Positions in Shares, Underlying Shares and Debentures
As at 30 September 2017, the interests and short positions of the Directors and chief executives of the Company in the shares, underlying shares and debentures of the Company or any of its associated corporations (within the meaning of Part XV of the Securities and Futures Ordinance (the “SFO”)) as recorded in the register required to be kept by the Company pursuant to Section 352 of the SFO or otherwise notified to the Company and the Stock Exchange pursuant to the Model Code for Securities Transactions by Directors of Listed Issuers (the “Model Code”) set out in Appendix 10 to the Listing Rules as adopted by the Company, were as follows:
Number of ordinary shares Approximate
Name of DirectorPersonalinterest
Familyinterest
Otherinterest
Equityderivatives Total
percentage ofshareholding
Allan WONG Chi Yun 9,654,393 3,968,683 74,101,153(Note 1)
– 87,724,229 34.90%
PANG King Fai 151,500 – – – 151,500 0.06%Andy LEUNG Hon Kwong 198,000 – – – 198,000 0.08%William FUNG Kwok Lun 449,430 – 592,200
(Note 2)– 1,041,630 0.41%
Patrick WANG Shui Chung 162,000 – – – 162,000 0.06%
Notes:
(1) The shares were beneficially owned as to 1,416,325 shares by Honorex Limited (“Honorex”), as to 65,496,225 shares by Conquer Rex Limited (“Conquer Rex”)
and as to 7,188,603 shares by Twin Success Pacific Limited (“Twin Success”). Conquer Rex was wholly owned by Honorex. Each of Conquer Rex, Honorex and
Twin Success was wholly owned by Surplus Assets Limited (“Surplus Assets”). Surplus Assets was wholly owned by Credit Suisse Trust Limited as the trustee
of The Allan Wong 2011 Trust, a discretionary trust of which Dr. Allan WONG Chi Yun, a Director, was the founder. Surplus Assets was therefore deemed to
have an aggregate indirect interest in 74,101,153 shares and Honorex was also deemed to have an indirect interest in the 65,496,225 shares. Surplus Assets
was wholly owned by Credit Suisse Trust Limited which was deemed to be interested in such shares by virtue of the SFO.
(2) The shares were held by Golden Step Limited which was beneficially owned by Dr. William FUNG Kwok Lun.
(3) All the interests stated above represented long positions.
(4) The approximate percentage of shareholding is calculated based on 251,372,133 shares of the Company in issue as at 30 September 2017.
Save as disclosed above, as at 30 September 2017, none of the Directors and chief executives of the Company had any interest or short positions in the shares, underlying shares and debentures of the Company or any of its associated corporations (within the meaning of Part XV of the SFO) which were recorded in the register required to be kept by the Company pursuant to Section 352 of the SFO or otherwise notified to the Company and the Stock Exchange pursuant to the Model Code.

Disclosure of Interests
VTech Holdings Limited 2017/2018 Interim Report 17
Substantial Shareholdings
As at 30 September 2017, other than the interests of the Directors and chief executives of the Company as disclosed above, shareholders who had interests or short positions in the shares or underlying shares of the Company of 5% or more which fell to be disclosed to the Company under Part XV of the SFO or which were recorded in the register required to be kept by the Company pursuant to Section 336 of the SFO, were as follows:
Name of shareholder CapacityNumber of
shares held
Approximatepercentage ofshareholding
Long PositionCredit Suisse Trust Limited Interest of controlled corporation (Note 1) 74,101,153 29.48%Surplus Assets Limited Interest of controlled corporation (Note 1) 74,101,153 29.48%Honorex Limited Interest of controlled corporation (Note 1) 65,496,225 26.06%
Beneficial owner (Note 1) 1,416,325 0.56%Conquer Rex Limited Beneficial owner (Note 1) 65,496,225 26.06%The Capital Group Companies, Inc. Interest of controlled corporation 38,699,947 15.40%JPMorgan Chase & Co. Beneficial owner (Note 2) 537,221 0.21%
Investment manager (Note 2) 1,478,500 0.59%Custodian (Note 2) 15,541,968 6.18%
Templeton Asset Management Limited Investment manager 12,593,300 5.01%BlackRock, Inc. Interest of controlled corporation (Note 3) 13,034,563 5.19%
Short PositionJPMorgan Chase & Co. Beneficial owner (Note 2) 253,880 0.10%BlackRock, Inc. Interest of controlled corporation (Note 3) 252,200 0.10%
Lending PoolJPMorgan Chase & Co. Custodian (Note 2) 15,541,968 6.18%
Notes:
(1) The shares were beneficially owned as to 1,416,325 shares by Honorex, as to 65,496,225 shares by Conquer Rex and as to 7,188,603 shares by Twin Success.
Conquer Rex was wholly owned by Honorex. Each of Conquer Rex, Honorex and Twin Success was wholly owned by Surplus Assets. Surplus Assets was
wholly owned by Credit Suisse Trust Limited as the trustee of The Allan Wong 2011 Trust, a discretionary trust of which Dr. Allan WONG Chi Yun, a Director,
was the founder. Surplus Assets was therefore deemed to have an aggregate indirect interest in 74,101,153 shares and Honorex was also deemed to have
an indirect interest in the 65,496,225 shares. Surplus Assets was wholly owned by Credit Suisse Trust Limited which was deemed to be interested in such
shares by virtue of the SFO. Dr. Allan WONG Chi Yun’s founder interests in the 74,101,153 shares of the Company has also been disclosed under the section
headed “Directors’ Interests and Short Positions in Shares, Underlying Shares and Debentures” in this Interim Report.
(2) The capacities of JPMorgan Chase & Co. in holding the 17,557,689 shares (long position) and 253,880 shares (short position) were as to (i) 537,221 shares
(long position) and 253,880 (short position) as beneficial owner, (ii) 1,478,500 shares (long position) as investment manager, and 15,541,968 shares
(long position) in the lending pool as custodian. The long position includes derivative interests of 80 shares derived from unlisted and physically settled
derivatives and 41,600 shares derived from unlisted and cash settled derivatives respectively. The short position includes 80 shares derived from unlisted
and physically settled derivatives and 135,100 shares derived from unlisted and cash settled derivatives respectively. The interest of JPMorgan Chase & Co.
was attributable on account through a number of entities directly or indirectly controlled by JPMorgan Chase & Co.
(3) The long position includes derivative interests of 110,200 shares derived from unlisted and cash settled derivatives. The short position includes 11,800
shares derived from unlisted and cash settled derivatives.
(4) The approximate percentage of shareholding is calculated based on 251,372,133 shares of the Company in issue as at 30 September 2017.
Save as disclosed above, as at 30 September 2017, the Company had not been notified by any person (other than the Directors and chief executives of the Company) who had interests or short positions in shares and underlying shares of the Company which fell to be disclosed to the Company under Part XV of the SFO or which were recorded in the register to be kept by the Company pursuant to Section 336 of the SFO.

Corporate Governance
18 VTech Holdings Limited 2017/2018 Interim Report
Corporate Governance Practices
VTech Holdings Limited is incorporated in Bermuda and has its shares listed on the Stock Exchange. The corporate governance rules applicable to the Company are the Corporate Governance Code (the “Code”) set out in Appendix 14 to the Listing Rules. Throughout the six months ended 30 September 2017, the Company has complied with all the code provisions of the Code and to a large extent the recommended best practices in the Code, except for the deviations from code provisions A.2.1 and A.6.7 of the Code as described below.
Under code provision A.2.1 of the Code, the roles of chairman and chief executive should be separate and should not be performed by the same individual. Dr. Allan WONG Chi Yun has the combined role of Chairman and Group Chief Executive Officer. The Board of Directors (the “Board”) considers that this structure will not impair the balance of power and authority between the Board and the management of the Company and its subsidiaries (the “Group”) as half of the Board members are independent non-executive Directors. The Board believes the appointment of Dr. Allan WONG Chi Yun to the combined role of Chairman and Group Chief Executive Officer is beneficial to the Group as he has considerable industry experience.
Under code provision A.6.7 of the Code, independent non-executive directors should attend general meetings and develop a balanced understanding of the views of shareholders. Mr. WONG Kai Man was unable to attend the 2017 annual general meeting of the Company held on 24 July 2017 due to his other prior business engagement. However, the Board believes that the presence of the other independent non-executive Directors at such general meeting has allowed the Board to develop a balanced understanding of the views of shareholders.
The Board has established an Audit Committee, a Nomination Committee, a Remuneration Committee, and a Risk Management and Sustainability Committee, each with defined terms of reference which are no less exacting than those set out in the Code. Corporate governance practices adopted by the Company during the six months ended 30 September 2017 are in line and consistent with those practices set out in the Company’s 2017 Annual Report.
Model Code for Securities Transactions
The Company has adopted the Model Code set out in Appendix 10 to the Listing Rules regarding securities transactions by Directors and senior management. After specific enquiry, all Directors confirmed that they have complied with the required standard of dealings set out in the Model Code throughout the six months ended 30 September 2017.
Audit Committee
The Audit Committee is chaired by Mr. WONG Kai Man with Dr. William FUNG Kwok Lun and Dr. Patrick WANG Shui Chung as members. All of the members are independent non-executive Directors. It has been established to assist the Board in fulfilling its overseeing responsibilities for financial reporting, risk management, corporate governance functions and evaluation of internal control and auditing processes. It also ensures that the Group complies with all applicable laws and regulations.
Mr. WONG Kai Man, as the chairman of the Audit Committee, has the appropriate financial management expertise as required under the Listing Rules. The Audit Committee has held two meetings during the financial period and up to the date of this Interim Report. In addition to the Audit Committee members, the meetings were attended by the Group Chief Executive Officer, the Company Secretary and Group Chief Compliance Officer, the Group Chief Financial Officer and the external auditor. The work performed by the Audit Committee during the financial period and up to the date of this Interim Report included, but is not limited to, reviewing the following:
– audited Group’s consolidated financial statements and reports for the year ended 31 March 2017;
– report from the external auditor for the year ended 31 March 2017;
– corporate governance report in the 2017 Annual Report;– unaudited Group Interim Financial Report for the six
months ended 30 September 2017;– report from the external auditor based on limited
agreed-upon procedures on the unaudited Group Interim Financial Report for the six months ended 30 September 2017;
– corporate governance section in the 2017/2018 Interim Report;
– accounting principles and practices adopted by the Group;
– appointment of the external auditor and its remuneration;
– the fee level and nature of non-audit work performed by external auditor;
– significant findings by the Internal Audit Department and recommendations for corrective actions;
– reports made under the Whistleblowing Policy;– respective audit plans of the internal and external
auditors;– training and continuous professional development of the
Directors and senior management;– 2017 Sustainability Report;– adequacy of resources, staff qualifications and
experience, training programmes and budget of the Group’s accounting, financial reporting and internal audit functions.
In addition to the above, the Audit Committee assisted the Board in meeting its responsibilities for maintaining an effective system of internal control during the financial period. It reviewed the process by which the Group evaluates its control environment and risk assessment procedures, and the way in which business and control risks are managed on a regular basis.
It should be noted that a system of internal control, no matter how well it is designed and operated, can only provide reasonable but not absolute assurance that the objectives of the system of internal control, such as safeguarding assets from inappropriate use or ensuring compliance with regulations, are met. As a result, it should not be expected that a system of internal control will prevent or detect all errors and frauds.

Corporate Governance
VTech Holdings Limited 2017/2018 Interim Report 19
Based on the information received from the management, the external auditor and the Internal Audit Department, the Audit Committee is satisfied that the overall financial and operational controls, and the internal audit function of the Group continued to be effective and adequate.
The Audit Committee has also been given the responsibility to oversee the effectiveness of formal procedures for employees to raise any matters of serious concerns and is required to review any reports made by the Internal Audit Department regarding this.
Risk Management and Sustainability Committee
The Risk Management and Sustainability Committee is chaired by Dr. Allan WONG Chi Yun with Dr. PANG King Fai, Mr. Andy LEUNG Hon Kwong, Mr. WONG Kai Man, Ms. Shereen TONG Ka Hung and Mr. CHANG Yu Wai as members. It comprises executive Directors, an independent non-executive Director, the Group Chief Financial Officer, and the Company Secretary and Group Chief Compliance Officer. It is responsible for monitoring and reviewing the risk management and sustainability strategies of the Group on a regular basis, and reports to the Audit Committee on a biannual basis of any significant findings.
The Risk Management and Sustainability Committee has held two meetings during the financial period and up to the date of this Interim Report to review the Group’s risk management and internal control system, and sustainability strategies, policies and improvement activities.
The Risk Management and Sustainability Committee has developed a framework for the management and control of risks in the Group. Risks are being more formally identified and recorded in a risk register (the “Risk Register”) for key operations. This Risk Register is updated regularly and the major risks are being reviewed from time to time by the Risk Management and Sustainability Committee. The major risks in this Risk Register include:
– staff and supplier integrity;– product design, quality and safety;– sales and receivable management, and marketing and
promotion;– procurement and supplier management;– compliance with patents and intellectual property rights
requirements;– cybersecurity and information technology risks;– physical security and risk of fire;– human resources, employee compensation and safety;
and– compliance with the relevant laws and regulations that
have a significant impact on the Group.
In addition, the Risk Management and Sustainability Committee also reviewed the financial risks of the Group, the details of which are set out in note 23 to the financial statements for the year ended 31 March 2017.
The Risk Management and Sustainability Committee ensures that any new and emerging risks are promptly identified, evaluated and appropriate actions are taken by the management. This requires the active and frequent participation by the process owner of each function in identifying risks affecting its business and implementing measures to reduce such risks, as well as the active monitoring on the progress of the improvement in internal control procedures.
The Data Security Governance Board was established in January 2016 with defined terms of reference reporting to the Risk Management and Sustainability Committee. The Data Security Governance Board is chaired by the Group Chief Executive Officer and comprises the Group President, the CMS Chief Executive Officer, the TEL President, the Group Chief Financial Officer, the Company Secretary and Group Chief Compliance Officer, and the Group Chief Information Officer. It is responsible for the decision-making, implementation, enforcement, oversight, compliance and periodic review of the Data Security Policy. During the financial period and up to the date of this Interim Report, the Risk Management and Sustainability Committee has reviewed the meeting minutes of the Data Security Governance Board.
The Risk Management and Sustainability Committee also provides vision and strategic direction for our sustainability activities, reviews our sustainability strategies and improvement activities, assesses how the policies are implemented in achieving the sustainability goals and targets, and monitors the performance progress on a biannual basis. During the financial period and up to the date of this Interim Report, it has determined the scope of the Company’s annual Sustainability Report and reviewed the Company’s 2017 Sustainability Report, which informs our stakeholders of our sustainability strategies and activities, and the performance progress against our sustainability targets.

Other Information
20 VTech Holdings Limited 2017/2018 Interim Report
Interim Dividend
The Board has declared an interim dividend (the “Interim Dividend”) of US17.0 cents per ordinary share in respect of the six months ended 30 September 2017, payable on 15 December 2017 to shareholders whose names appear on the register of members of the Company as at the close of business on 6 December 2017.
The Interim Dividend will be payable in United States dollars save that those shareholders with a registered address in Hong Kong will receive an equivalent amount in Hong Kong dollars which will be calculated at the rate of exchange as quoted to the Company by The Hongkong and Shanghai Banking Corporation Limited at its middle rate of exchange prevailing on 6 December 2017.
Closure of Register of Members
The register of members of the Company will be closed on 6 December 2017, during which no transfer of shares will be effected.
In order to qualify for the Interim Dividend, all transfer documents, accompanied by the relevant share certificates, must be lodged with the share registrars of the Company for registration no later than 4:30 p.m. (the local time of the relevant share registrar) on Tuesday, 5 December 2017.
The principal registrar is MUFG Fund Services (Bermuda) Limited, The Belvedere Building, 69 Pitts Bay Road, Pembroke HM08, Bermuda and the branch registrar in Hong Kong is Computershare Hong Kong Investor Services Limited, Shops 1712-16, 17th Floor, Hopewell Centre, 183 Queen’s Road East, Wan Chai, Hong Kong.
Review of Interim Report
The Group’s Interim Financial Report for the six months ended 30 September 2017 has been reviewed by the Audit Committee.
Purchase, Sale or Redemption of Listed Shares
The Company and its subsidiaries have not redeemed any of its shares during the six months ended 30 September 2017. Neither the Company nor any of its subsidiaries has purchased or sold any of the Company’s shares during the financial period, except that the trustee of the Share Purchase Scheme, pursuant to the rules and trust deed of the Share Purchase Scheme, purchased on the Stock Exchange a total of 129,200 Company’s shares at a consideration of approximately US$1.8 million.
Changes to Information in respect of Directors
In accordance with Rule 13.51B(1) of the Listing Rules, the changes to information required to be disclosed by Directors pursuant to paragraphs (a) to (e) and (g) of Rule 13.51(2) of the Listing Rules are set out below:
– Dr. William FUNG Kwok Lun retired as an independent non-executive director of Singapore Airlines Limited on 28 July 2017.

Corporate Information
VTech Holdings Limited 2017/2018 Interim Report 21
Board of Directors
Executive Directors
Allan WONG Chi Yun(Chairman and Group Chief Executive Officer)PANG King FaiAndy LEUNG Hon Kwong
Independent Non-executive Directors
William FUNG Kwok LunPatrick WANG Shui ChungWONG Kai Man
Audit Committee
WONG Kai Man (Chairman)William FUNG Kwok LunPatrick WANG Shui Chung
Nomination Committee
William FUNG Kwok Lun (Chairman)Patrick WANG Shui ChungWONG Kai ManAllan WONG Chi Yun
Remuneration Committee
Patrick WANG Shui Chung (Chairman)William FUNG Kwok LunWONG Kai Man
Risk Management and Sustainability Committee
Allan WONG Chi Yun (Chairman)PANG King FaiAndy LEUNG Hon KwongWONG Kai ManShereen TONG Ka HungCHANG Yu Wai
Company Secretary
CHANG Yu Wai
Registered Office
Clarendon House2 Church StreetHamilton HM 11Bermuda
Principal Office
23rd Floor, Tai Ping Industrial Centre, Block 157 Ting Kok RoadTai Po, New TerritoriesHong Kong
Principal Bankers
The Hongkong and Shanghai Banking Corporation LimitedStandard Chartered Bank (Hong Kong) LimitedThe Bank of East Asia, Limited
Auditor
KPMGCertified Public Accountants

Information for Shareholders
22 VTech Holdings Limited 2017/2018 Interim Report
Listing
Shares of VTech Holdings Limited are listed on The Stock Exchange of Hong Kong Limited. It is a constituent of the Hang Seng High Dividend Yield Index, Hang Seng SCHK (Stock Connect Hong Kong) High Dividend Low Volatility Index, Hang Seng Corporate Sustainability Benchmark Index and FTSE4Good Global Index.
Stock Code
The Stock Exchange of Hong Kong Limited: 303
Financial Calendar
Closure of Register of Members: 6 December 2017
Payment of Interim Dividend: 15 December 2017
FY2018 Annual Results Announcement: May 2018
Share Information
Board lot: 100 shares
Issued shares as at 30 September 2017: 251,372,133 shares
Dividend
Dividend per ordinary share for the six months ended 30 September 2017: US17.0 cents per share
Share Registrars
PrincipalMUFG Fund Services (Bermuda) LimitedThe Belvedere Building69 Pitts Bay RoadPembroke HM08Bermuda
Hong Kong BranchComputershare Hong Kong Investor Services LimitedShops 1712-16, 17th Floor, Hopewell Centre183 Queen’s Road East, Wan ChaiHong KongTel: (852) 2862 8555Fax: (852) 2865 0990Email: [email protected]
Investor Relations Contact
Corporate Marketing Department23rd Floor, Tai Ping Industrial Centre, Block 157 Ting Kok RoadTai Po, New TerritoriesHong KongTel: (852) 2680 1000Fax: (852) 2680 1788Email: [email protected]
Website
www.vtech.com/en/investors

INTERIM REPORT 中期報告書
2017/2018
for the six months ended 30 September 2017截至二零一七年九月三十日止六個月
HKSE 303
23rd Floor, Tai Ping Industrial Centre, Block 157 Ting Kok Road, Tai Po, New Territories, Hong KongTel: (852) 2680 1000 Fax: (852) 2680 1300Email: [email protected]
(Incorporated in Bermuda with limited liability)
香港新界大埔汀角路 57 號
( 於百慕達註冊成立之有限公司 )
太平工業中心第 1 期 23 樓電話:(852) 2680 1000 傳真:(852) 2680 1300電郵:[email protected]