Embed Size (px)
Citation preview

1
2019 Rwanda Voluntary National Review (VNR)
Report
June 2019
2
Table of Contents
Opening Statement ................................................................................................................................................. 9
Chapter 1. Introduction....................................................................................................................................... 10
1.1. Structure of the report........................................................................................................... 10
1.2. Country Profile and Context ............................................................................................... 10
1.3. Objective of the review .......................................................................................................... 12
1.4. Scope of the Review ................................................................................................................. 12
1.5. Methodology and Process ..................................................................................................... 12
1.6. Data Collection .......................................................................................................................... 13
Chapter II. Policy Environment and Institutional arrangement ..................................................... 14
2.1. Ownership of SDGs in Rwanda ........................................................................................... 14
2.2. SDGs Domestication in Rwanda ........................................................................................ 14
2.3. Institutional mechanisms ...................................................................................................... 17
2.4. Leaving No One Behind ......................................................................................................... 19
2.5. National validation process .................................................................................................. 23
Chapter III. Review of SDG Implementation in Rwanda .................................................................... 24
3.1. Human Capital Development ............................................................................................. 24
3.1.1. Overview of Rwanda’ Human Capital Development Status ................................. 24
3.1.2. SDG 2 – End hunger, achieve food security and improved nutrition and
promote sustainable agriculture ............................................................................................................ 25
3.2. Inclusive Economic Growth ................................................................................................. 34
3.2.1. SDG 8 Promote sustained, inclusive and sustainable economic growth, full
and productive employment and decent work for all ................................................................. 34
3.2.2. SDG 10 Reduce inequality within and among countries ......................................... 37
3.3. Climate Change ......................................................................................................................... 40
SDG 13Take urgent action to combat climate change and its impacts ............................ 40
3.4. Governance and Justice for all ............................................................................................ 45
SDG16 Promote peaceful and inclusive societies for sustainable development,
provide access to justice for all and build effective, accountable and inclusive
institutions at all levels................................................................................................................................ 45
3.5. Global partnership and Data for SDGs ........................................................................... 49
SDG 17Strengthen the means of implementation and revitalize the Global
Partnership for Sustainable Development........................................................................................ 49
3.6. Progress Against Selected Goals ....................................................................................... 54
3.6.1. SDG1 Ending Poverty in all its forms and everywhere ............................................ 54

3
3.6.2. SDG3 Ensure healthy lives and promote well-being for all at all ages ............. 56
3.6.3. SDG 5 Achieve gender equality and empower all women and girls .................. 60
3.6.4 SDG 9. Build resilient infrastructure, promote sustainable industrialization
and foster innovation ................................................................................................................................... 64
Chapter IV. Means of Implementation ........................................................................................................ 68
Chapter V. Conclusion ......................................................................................................................................... 75
References .................................................................................................................................................................. 77
Annex 1: List of Rwanda SDG Indicators .................................................................................................... 79

4
List of tables
TABLE 1: LINKS BETWEEN NST1 PRIORITY AREAS AND SDGS 15
TABLE 2: INSTITUTIONAL FRAMEWORK 18
TABLE 3: UPPER SECONDARY STUDENTS ENROLLED IN 2018 BY LEARNING AREAS 29
TABLE 4: TERTIARY STUDENT FROM 2016 TO 2018 30
TABLE 5: LEARNING ACHIEVEMENT IN RWANDAN SCHOOLS (LARS) 2 (2014) RESULTS (AVERAGE
SCORES) BY LEVEL, SCHOOL TYPE AND LOCATION 31
TABLE 6: CONSUMPTION PER ADULT EQUIVALENT FRW ‘000, 2011-2017 38
TABLE 7: VUP BENEFICIARIES BY CATEGORY 39
TABLE 8: DISASTER EFFECTS IN RWANDA (2016-2018) 41
TABLE 9: FONERWA KEY ACHIEVEMENTS 43
TABLE 10: COVERAGE FOR PENSION, MEDICAL AND MATERNITY LEAVE 54
TABLE 11: ESTIMATED SPENDING NEEDS IN RWANDA 70

5
List of Figures
FIGURE 1:PROPORTION OF WOMEN IN SELECTED DECISION-MAKING ORGANS 19
FIGURE 2: TRENDS IN RWANDA‘S HDI COMPONENT INDICES 1990-2017 (UNDP, 2018) 24
FIGURE 3: MALNUTRITION AMONG CHILDREN UNDER 5 YEARS COMPARED TO THE WHO SEVERITY
THRESHOLD 25
FIGURE 4: YIELD GAPS FOR PRIORITY CROPS UNDER THE CROP INTENSIFICATION PROGRAM 26
FIGURE 5: UNEMPLOYMENT RATE (%) 35
FIGURE 6: INVESTMENT SHARE OF GDP (%) 35
FIGURE 7: FISCAL TRENDS 50
FIGURE 8: REMITTANCES (USD MILLIONS) 51
FIGURE 9: REMITTANCES AS A SHARE OF GDP 51
FIGURE 10: MATERNAL MORTALITY RATIO FOR THE PERIOD 0-4 YEARS PRIOR TO THE 2000, 2005,2010 AND
2014/15 RDHS 56
FIGURE 11: TRENDS IN CHILDHOOD MORTALITY RATES 57
FIGURE 12: LAND OWNERSHIP 62
FIGURE 13: MOBILE TELEPHONE SUBSCRIPTION PER 100 INHABITANTS 62
FIGURE 14: INDUSTRY AND MANUFACTURING VALUE ADDED AS A SHARE OF GDP 66
FIGURE 15: EDUCATION SPENDING NEEDS – COMPARISON OF AUTHORITIES AND IMF ESTIMATES 71
FIGURE 16: HEALTH PUBLIC SPENDING NEEDS* – COMPARISON OF AUTHORITIES AND IMF ESTIMATES 72
FIGURE 17: ROAD SPENDING NEEDS – COMPARISON OF AUTHORITIES AND IMF ESTIMATES 73
FIGURE 18: WATER AND SANITATION SPENDING NEEDS- COMPARISON OF AUTHORITIES AND IMF (% OF GDP)
73

6
ACRONYMS
AfCFTA Africa Continental Free Trade Area
PwDs People with Disabilities
TVET Technical and Vocational Education and Training
CAADP Comprehensive African Agriculture Development Program
CFSVA Comprehensive Food Security and Vulnerability Analysis
CHW Community Health Worker
CIP Crop Intensification Program
CPD Continuing Professional Development
CRVS Civil Registration and Vital Statistics
CSO Civil Society Organization
DDS District Development Strategies
DFID Department For International Development
DHS Demographic Health Survey
DPs Development Partners
DPCG Development Partners Coordination Group
DS Direct Support
EAC East African Community
EDPRS Economic Development and Poverty Reduction Strategies
EIA Environmental Impact Assessment
EICV Households Living Conditions Survey
ENABEL Belgium Development Cooperation
ENR Environment Natural Resources
ESSP Education Sector Strategic Plan
ESSP Education Sector Strategic plan
EWS Early Warning System
FAO Food Agriculture Organization
FONERWA National Climate and Environment Fund
Frw Rwanda Francs
GBV Gender Based Violence
GBS Gender Budget Statement
GDP Growth Domestic Product
GEWE Gender Equality and Women Empowerment
GGCRS Green Growth and Climate Resilience Strategy
GGGI Global Green Growth Institute
GMO Gender Monitoring Office
GNI Growth National Income
GoR Government of Rwanda
7
GRB Gender Responsive Budgeting
HCI Human Capital Index
HDI Human Development Index
HIV/AIDS Human Immunodeficiency Virus/Acquired Immunodeficiency
Syndrome
HSSP Health Sector Strategic plan
ICT Information Communication Technology
IFPRI International Food Policy Research Institute
IMF International Monetary Fund
IOSC Isange One Stop Centres
JADF Joint Action Development Forums
JRLO Justice Reconciliation Law and Order
LFS Labour force Surveys
LIC Low-Income Country
MDG Millennium Development Goal
MICE Meetings, Incentives, Conferences and Events
MIDIMAR Ministry of Disaster Management and Refugees Affairs
MINAGRI Ministry of Agriculture and Animal Resources
MINECOFIN Ministry of Finance and Economic Planning
MINEDUC Minstry of Education
MINEMA Ministry of Emergency Management
MINISANTE Ministry of Health
MNO Mobile Network Operators
MT Metric Tonnes
MTO Money Transfer Operators
NCA Natural Capital Accounting
NDC Nationally Determined Contribution
NECDP National Early Childhood Development Programme
NEP National Employment Program
NISR National Institute of Statistics of Rwanda
NTD Neglected Tropical Diseases
NRAR National Risk Atlas of Rwanda
NST1 The first National Strategy for Transformation
ODA Official Development Assistance
PDNA Post Disaster Needs Assessment
PRSP Poverty Reduction Strategy Paper
PSDYES Private Sector Development and Youth Employment Strategy
PSF Private Sector Federation
PSTA Strategic Plan for Agriculture Transformation
PW Public Works
8
RCWE Rwanda Chamber of Women Entrepreneurs
RDHS Rwanda Demographic and Health Survey
RDRC Rwanda Demobilisation and Reintegration Commission
REB Rwanda Education Board
REMA Rwanda Envoronment Management Authority
RLTSS Rwanda Long Term Saving Scheme
RPHC Rwanda Population and Housing Census
RWF Rwanda Franc
SDGs Sustainable Development Goals
SEZ Special Economic Zones
SSP Sector Strategic Plans
STEM Science, Technology, Engineering, and Mathematics
TVET Technical and Vocational Education Training
TVET Technical Vocation Education and Training
UN United Nations
UNDP United Nations Development
UNFCCC United Nations Framework Convention on Climate Change
UNICEF United Nations Children’s Fund
USD United States Dollar
VNR Voluntary National Review
VUP Vision 2020 Umurenge Program
WB World Bank
WHO World Health Organization
WMO World Meteorological Organization
9
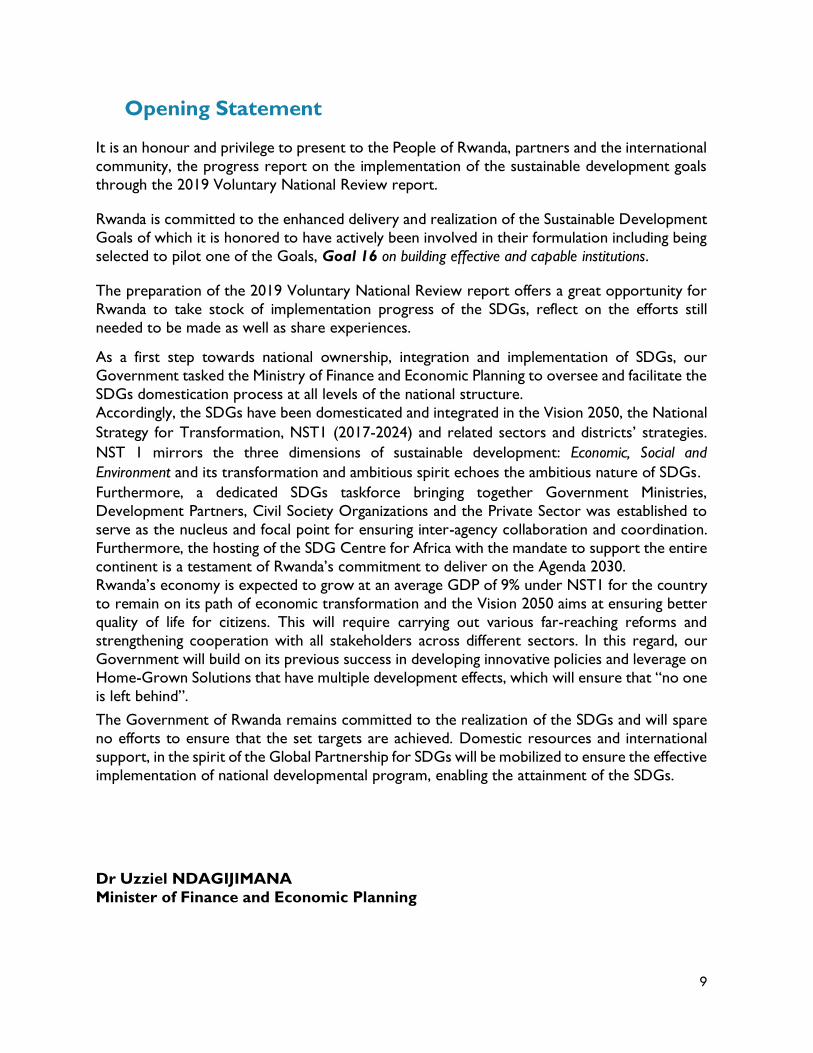
Opening Statement
It is an honour and privilege to present to the People of Rwanda, partners and the international
community, the progress report on the implementation of the sustainable development goals
through the 2019 Voluntary National Review report.
Rwanda is committed to the enhanced delivery and realization of the Sustainable Development
Goals of which it is honored to have actively been involved in their formulation including being
selected to pilot one of the Goals, Goal 16 on building effective and capable institutions.
The preparation of the 2019 Voluntary National Review report offers a great opportunity for
Rwanda to take stock of implementation progress of the SDGs, reflect on the efforts still
needed to be made as well as share experiences.
As a first step towards national ownership, integration and implementation of SDGs, our
Government tasked the Ministry of Finance and Economic Planning to oversee and facilitate the
SDGs domestication process at all levels of the national structure.
Accordingly, the SDGs have been domesticated and integrated in the Vision 2050, the National
Strategy for Transformation, NST1 (2017-2024) and related sectors and districts’ strategies.
NST 1 mirrors the three dimensions of sustainable development: Economic, Social and
Environment and its transformation and ambitious spirit echoes the ambitious nature of SDGs.
Furthermore, a dedicated SDGs taskforce bringing together Government Ministries,
Development Partners, Civil Society Organizations and the Private Sector was established to
serve as the nucleus and focal point for ensuring inter-agency collaboration and coordination.
Furthermore, the hosting of the SDG Centre for Africa with the mandate to support the entire
continent is a testament of Rwanda’s commitment to deliver on the Agenda 2030.
Rwanda’s economy is expected to grow at an average GDP of 9% under NST1 for the country
to remain on its path of economic transformation and the Vision 2050 aims at ensuring better
quality of life for citizens. This will require carrying out various far-reaching reforms and
strengthening cooperation with all stakeholders across different sectors. In this regard, our
Government will build on its previous success in developing innovative policies and leverage on
Home-Grown Solutions that have multiple development effects, which will ensure that “no one
is left behind”.
The Government of Rwanda remains committed to the realization of the SDGs and will spare
no efforts to ensure that the set targets are achieved. Domestic resources and international
support, in the spirit of the Global Partnership for SDGs will be mobilized to ensure the effective
implementation of national developmental program, enabling the attainment of the SDGs.
Dr Uzziel NDAGIJIMANA
Minister of Finance and Economic Planning
10
Chapter 1. Introduction
1.1. Structure of the report
This report provides information on the progress and status of implementation of Sustainable
Development Goals (SDGs) in Rwanda. It describes the Government of Rwanda’s efforts to
mainstream SDGs into policy, strategies and programs at national and sub-national levels. This
report is structured around four main chapters. The first chapter presents the country’s profile,
the objectives, scope, methods and approach used to collect and analyze data for this review.
The second chapter emphasizes policy environment and institutional arrangement to deliver
SDGs. It specifically describes the SDGs ownership and domestication and what Rwanda is
doing to ensure that no one is left behind. The third chapter highlights progress on SDGs
implementation under five thematic areas as detailed in the scope of the review, while the fourth
chapter presents the conclusions and key lessons learnt.
1.2. Country Profile and Context
The Republic of Rwanda is a landlocked country situated in Central and Eastern Africa, in the
Great Lakes Region. Surrounded by the Democratic Republic of Congo, Uganda, Tanzania and
Burundi, it covers 26,338 Km2 of a very diverse landscape, ranging from dense equatorial forest
on the volcanic slopes of the north-west of the country to tropical savannah in the east, along
the Kagera river. Also known as the ‘Land of a thousand hills’, Rwanda is situated at an altitude
ranging between 1,000 m above sea level in the eastern part to 4,500 m of the Karisimbi, the
country’s highest mountain near the border with the Democratic Republic of the Congo. With
an estimated population of about 12 million people (NISR, 2019 estimates), 52% of which are
women, Rwanda has one of highest population densities in Africa (458.75/Km2). With over 40%
of the population under the age of 30 (RPHC, 2012), Rwanda also boasts of one of the most
youthful populations on the continent.
The watershed in the history of independent Rwanda is 1994, when the Genocide against the
Tutsis took lives of more than a million people in mere three months and left the socio-
economic fabric of the country destroyed. Any account of the progress of the country in the
past years cannot ignore the extent of the destruction and challenges brought by the bad
governance leading to the 1994 Genocide against the Tutsi and the national recovery effort that
followed. The Post-genocide Rwanda sought to promote the security, welfare and dignity of
citizens, harmonizing these values with modern principles of pluralistic democracy, human rights
and equality as enshrined in the country’s constitution. Following the finalisation of the nation-
wide multi-stakeholder consultations, these values were enshrined in the Vision 2020, the
country’s masterplan for the period 2000-2020.
Rwanda pursued the Vision 2020 objectives through the successful implementation of medium-
term successive strategies; the Poverty Reduction Strategy Paper (PRSP I, 2002-2006) and the
Economic Development and Poverty Reduction Strategies (EDPRS I and II, 2007-2012 and 2013-
2018). In 2018, Rwanda started implementing its fourth medium-term strategy, the National

11
Strategy for Transformation (NST1). NST1 is conceived as the bridge between the finalization
of the Vision 2020 and the beginning of the Vision 2050, Rwanda’s roadmap towards becoming
a high-income country.
The results recorded since 2000, in terms of social and economic recovery and development
have been impressive. GDP Per capita more than tripled between 2000 and 2018, from USD
225 to USD 787. Poverty levels reduced at a fast pace falling from 60.4% to 38.2% between
2001 and 2017 and the country was able to reverse the trend in inequality levels that peaked in
2005 reaching 0.52 to then decrease to 0.429 in 2017. Similar achievements were scored in
terms of human development, with the HDI value increasing more than 100% between 1990
and 2018, from 0.250 to 0.524 (UNDP, 2018).
Rwanda has achieved all but one Millenium Development Goals, marking progression in several
indicators such as life expectancy which increased from 49 to 67 years of age between 2000
and 2018, maternal and child mortality and access to affordable healthcare. The country also
made significant gains in education, increasing the years of free education up to 12 and improving
the enrolment rates for primary education. Whilst rebuilding its human capital, Rwanda has also
massively invested in its infrastructure to sustain the fast pace of social and economic
development and leveraged extensively on endogenous policy solutions. Also known as home-
grown solutions, these policies are rooted in Rwandan culture and history and have proven to
be well suited to respond to development challenges in a locally adapted way. Despite the
registered achievements, the country still faces some challenges, including high poverty levels.
Nutrition indicators are slow to improve, and particularly stunting levels remain high at 38%
(DHS, 2015) hampering early childhood development and in turn affecting the learning
outcomes.
Nevertheless, a number of opportunities also exist and will be leveraged to achieve the desired
socio-economic transformation. The youthful population (62% of Rwandans are under the age
of 25 and 41% are under the age of 15, RPHC 2012) of the country will allow reaping the
demographic dividend. The increasing integration in the global value chains, the investments in
manufacturing, ICT, tourism and the active participation in regional integration initiatives at EAC
and continental level (with the Africa Contitental Free Trade Area) will open new market
opportunities. The continuous engagement in the international arena, supporting, shaping and
championing regional and global agendas, such as Agenda 2063 and Agenda 2030 will help
Rwanda achieve its ambitions and better position globally.
The preparation and adoption of SDGs came at an opportune moment when the country
started to develop its new long-term vision and medium-term plan (NST1) as well as related
sector and district strategies. As such, the Agenda 2030 has been fully domesticated and
integrated in the national planing framework.

12
1.3. Objective of the review
Rwanda volunteered to conduct and present for the first time its Voluntary National Review
(VNR) report on implementation of the SDGs scheduled in July 2019 at the High-Level Political
Forum on Sustainable Development. This is in line with the country’s global commitment to
carry out regular, voluntary and inclusive reviews of progress on the implementation of the
Agenda 2030.
More specifically, this review report provides:
(i) SDGs domestication process and extent of integration in the national planning and
development framework, including the integration of the principle of leaving no one
behind,
(ii) SDGs implementation progress and good practices,
(iii) Challenges encountered and measures put in place to address them,
(iv) Institutional capacities to coordinate and monitor as well as engagement of different
stakeholders.
This report also shares key innovations and lessons learned from SDGs integration and
implementation process as well as areas requiring more support for taking forward the agenda
2030.
1.4. Scope of the Review
Rwanda’s VNR report is centered on the proposed 2019 global theme of "Empowering people
and ensuring inclusiveness and equality” and is reflected throughout the document. This report
provides an in-depth analysis of the seven SDGs (SDG 2, 4, 8, 10, 13, 16 & 17) proposed for
the 2019 in-depth review across countries. The review is structured around five thematic areas,
namely: (i) Human capital development (ii) Inclusive Economic Growth, (iii) Justice and Good
Governance, (iv) Environment and Climate Change, (v) Strengthening the Means of
Implementation, Global partnership and Data for SDGs. The report also covers other important
components such as the principle of Leaving No One Behind and SDGs means of
implementation. In addition, four more goals (SDG 1,3,5, and 9) are discussed.
1.5. Methodology and Process
Rwanda has established a steering committee for SDGs including, key Government Ministries
and agencies, One UN, Development Partners (DPs), Civil Society Organizations (CSOs)
represented by the Rwanda Civil Society Platform and the Private Sector Federation. In addition
to overseeing the overall implementation of SDGs in Rwanda, the SDGs taskforce played a vital
role in providing technical guidance and quality assurance during the VNR report preparation.

13
Focal points across Ministries and Agencies were designated and tasked to provide necessary
information from their respective sectors for the preparation of the review report. Details
about the required data and processes for enabling an inclusive and participatory VNR
preparation were provided in a kick-off meeting, bringing together representatives of all the
planning departments from different ministries and agencies.
The validation of indicators and data quality assurance followed a rigorous process, undergoing
a series of validation steps by the various technical teams and later validated by permanent
secretaries and Ministers.
1.6. Data Collection
Required information for this VNR were gathered through extensive desk review of all relevant
documents such as Regional and National Visions, National Strategy for Transformation (NST1),
Policy documents, budget and legal frameworks, Sectoral strategies, plans and programmes,
District Development Strategies etc. Secondary data from existing surveys including the
Integrated Households Living Conditions Surveys (EICVs), the Demographic and Health Survey
(DHS), Labour Force Survey (LFS), Population and Housing Census, Sectorial Annual Statistical
Reports and other relevant surveys were analyzed. In addition, an online survey questionnaire
was completed by all relevant Government Ministries and Agencies, as well as Development
Partners, CSOs and the private sector.
Additional information and clarifications were obtained through consultative meetings and
round table discussions with key sectors, especially with CSOs platform, the private sector
federation and key sectors in Government including: social protection, environment and natural
resources as well as governance among others. Furthermore, a series of stakeholder meetings
were held to discuss and validate the fully contextualized list of SDGs indicators. Consultations
with the CSOs were conducted during the drafting process of their position paper on SDGs.
14
Chapter II. Policy Environment and Institutional arrangement
2.1. Ownership of SDGs in Rwanda
Rwanda is strongly committed to ensuring that SDGs are understood and owned both at
national and local levels and across stakeholders. The Ministry of Finance and Economic Planning
(MINECOFIN) is mandated to facilitate the ownership process at all levels of the national
structures.
The widely consultative process followed during the elaboration of the National Strategy for
Transformation (NST1, 2017-2024), sectors and districts’ development strategies offered a
unique opportunity to create SDGs ownership and awareness from central to local levels.
More specifically, an SDGs guide was prepared in English, translated in the local language
(Kinyarwanda) and widely disseminated in hard copies and accessible online via the
MINECOFIN website (www.minecofin.gov.rw). The National Institute of Statistics of Rwanda
(NISR) has also launched an online SDGs portal containing latest data available on Rwanda SDG
indicators (https://sustainabledevelopment-rwanda.github.io/sdg-indicators/2-2-1/). Furthermore,
Rwanda SDGs METADATA handbook was developed, providing definitions and methodology
among others, to ensure data sharing and reporting.
Mainstreaming and creating SDGs awareness at different levels and amongst different
stakeholders will however be a continuous process. Going forward, annual national planning
and budget consultations will continue to deepen the ownership and awareness among wider
stakeholders.
2.2. SDGs Domestication in Rwanda
The integration of the SDGs into the national development framework was guided by the
Government of Rwanda’s domestication roadmap approved in December 2015. The process
was consultative and informed by lessons learnt from MDGs, an initial SDGs gap and data
readiness analysis and the review of the Economic Development and Poverty Reduction
Strategy (EDPRS 2) as well as 14 sector strategic plans. The gap analysis informed a detailed
SDGs domestication plan and prioritization of new aspects brought by the adoption of the
agenda 2030.
The three SDGs dimensions, namely, Economic, Social and Environmental are comprehensively
integrated in the NST1 pillars: “Economic Transformation, Social Transformation and
Transformational Governance”. The strategy emphasizes the transformation principle across all
the three pillars and resonates with the ambitious and integrated nature of the SDGs. Table1
below establishes the links between the NST1 priority areas and SDGs.

15
Table 1: Links between NST1 priority areas and SDGs
NST1 pillar NST1 Priority Linkage with SDGs
Economic
Transformation
Pillar
Create 1,500,000 (214,000 annually) decent and productive jobs SDG8, SDG1,
Accelerate sustainable urbanization from 18.4% (2016/17) to 35% by
2024
SDG 11, SDG 8, SDG 7
Establish Rwanda as a globally competitive knowledge-based
economy
SDG 8, SDG4, SDG9
Promote industrialization and attain a structural shift in the export base to high-value goods and services with the aim of growing
exports by 17% annually
SDG 8 , SDG 9
Increase domestic savings and position Rwanda as a hub for financial services to promote investments.
SDG 8, SDG17
Modernize and increase the productivity of agriculture and livestock SDG 2, SDG1
Promote sustainable management of the environment and natural resources to transition Rwanda towards a Green Economy.
SDG15, SDG8, SDG 12
Social
Transformation Pillar
Promote resilience to shocks and enhance Graduation from Poverty and extreme Poverty through improving and scaling up core and complementary social protection programs
SDG1, SDG 10, SDG2
Eradicate Malnutrition through enhanced prevention and management of all forms of malnutrition
SDG2, SDG1
Enhance the Demographic Dividend through ensuring access to quality health for all. Focus will be on improving health care services at all levels, strengthening financial sustainability of the health sector,
and enhancing capacity of health workforce.
SDG3
Enhance the Demographic Dividend through Improved access to quality education. Focus will be on strategic investments in all levels
of education (pre-primary, basic and tertiary), and improved teachers' welfare.
SDG4,
Move Towards a Modern Rwandan Household through ensuring
universal access to affordable and adequate infrastructure and services.
SDG 6, SDG 7, SDG 11
Transformational Governance
Pillar
Reinforce Rwandan Culture and Values as a Foundation for Peace
and Unity
SDG16
Ensure Safety and Security of Citizens and Property SDG16
Strengthen Diplomatic and International Cooperation to Accelerate
Rwanda and Africa’s Development.
SDG17
Strengthen Justice, Law and Order SDG16
Strengthen Capacity, Service Delivery and Accountability of Public Institutions.
SDG 16
Increase Citizens’ Participation and Engagement in Development SDG16
Cross-cutting areas
Capacity Development SDG4, SDG 9
HIV/AIDS and Non-Communicable Diseases SDG 3
Disability and Social Inclusion SDG1, SDG10, SDG2, SDG 4, SDG 8, SDG 5, SDG 3
Environment and Climate Change Goal 13, SDG 15
Disaster Management Goal 13
Regional Integration and International Positioning SDG 17
Gender and Family Promotion Goal 5, SDG 3, SDG8, SDG1, SDDG 10, SDG 2, SDG 4

16
In addition to integrating SDGs into the national planning framework, specific goals are being
and will continue to be integrated into sector policies and strategies. Some examples in selected
areas are given below to showcase the integration of SDGs into national policies and strategies:
• Ministry of Gender and Family Promotion is proactively engaging citizens on Gender
Equality and Women's Empowerment issues. Gender Equality and women's
empowerment is reflected in the Constitution of the Republic of Rwanda of 2003
revised in 2015 and in other gender sensitive laws that have been enacted. In terms of
policy and programs, the National Gender Policy 2010 under review and its strategic
plan (2016-2020) provide principal guidelines on which sectoral policies and programs
should integrate gender issues in their respective political, social, cultural and economic
planning and programming. As of now gender was mainstreamed into all 16 NST1 sector
strategic plans, while among them 11 sectors have gender sector mainstreaming
strategies. Gender Equality promotion is also emphasized in District Development
Strategies (DDSs) and Sector Strategic Plans (SSPs). For example, from January to May
2018, was a period for DDSs and SSPs development where technical assistance was
provided to districts and Sectors for Gender mainstreaming as a cross cutting area of
NST1.
• Through HeForShe outreach campaigns, today, Rwanda is ranked 2nd globally with over
206,442 signups for both men and women committed to promote Gender Equality and
Women's empowerment; Umugoroba w’Ababyeyi (parent's evening forum) – has also
been used as a platform for promotion of Gender Equality and Women's Empowerment
initiatives; Conduct annual advocacy & awareness raising dialogues & campaigns on
women’s rights & Gender Based Violence (GBV) prevention through Governance and
family welfare campaign, Gender accountability day among others; Furthermore, the
introduction of Gender equality seal certification programme to enhance gender
accountability in the private sector is another important initiative to promote SDG5.
• In agriculture, the Ministry of Agriculture and Animal resources developed a new
strategic plan for agriculture transformation (PSTA 4), which was approved by the
Cabinet in June 2018 and is fully aligned to SDGs. As articulated in the strategy and
captured in the results framework, the agriculture sector will contribute directly to SDG
2. The goal will be achieved through the successful implementation of the 4 priorities of
PSTA 4: 1) Innovation and extension; 2) productivity and resilience; 3) inclusive markets
and value addition; 4) enabling environment and responsive institutions. The agriculture
sector will also contribute to the achievement of other SDGs, particularly: SDG 1 (end
extreme poverty), SDG 8 (descent work and economic growth), SDG 12 (Ensure
sustainable consumption and production patterns), SDG 13 (climate action), and SDG
15 (terrestrial ecosystems, forests, and land).
• The Justice sector responds to goal 16: Promote peaceful and inclusive societies for
sustainable development, provide access to Justice for all and build effective, accountable
and inclusive institutions at all levels. To respond to this goal, the Ministry of Justice has

17
recently adopted Justice Sector Strategic plan spanning from 2018 to 2024. This strategy
aims at enhancing rule of law to promote accountable governance and a culture of peace
for poverty reduction. In order to translate the interventions defined by sector strategic
plan into the practical setting, each Justice Sector institution, including the Ministry of
Justice are developing their own strategic plan, integrating SDGs indicators while also
identifying strategic interventions necessary to deliver to the targets under the SDG16.
• Education Sector Strategic Plan (ESSP 2018/19 to 2023/24) was elaborated guided by
global, continental, regional and national planning commitments, for instance the SDGs.
The central policy proposition for this ESSP is to ensure that Rwandan citizens have
sufficient and appropriate competencies (skills, knowledge and attitudes) to drive the
continued socio-economic development of the country. Key sector priorities include:
Enhanced quality of learning outcomes, equitable opportunities for all Rwandans and
more innovative and responsive research and development.
Despite clear alignments between the national development strategies at central and district
levels and SDGs, the domestication process in Rwanda still faces a number of challenges,
including:
− The gap between the ambition of the SDGs and available resources (both financial and
human) calls for more consolidated efforts among stakeholders to increase resource
mobilization and capacity development.
− Until recently, there is lack of clarity in the methodology and measurement of some
SDGs indicators. The ongoing updates of the global indicator framework will help to
resolve this issue There is need for more investment and partnerships to further develop
capacities to produce required data for effective monitoring of SDGs.
In addition to the SDGs, NST1 also embraced the far-sighted, long-term continental and
regional commitments. That is, the NST1 harmonizes the national development priorities and
the African Union Agenda 2063 and its First 10-Year Implementation Plan 2014- 2023, which is
dedicated to the building of an integrated, prosperous and peaceful Africa, driven by its own
citizens and representing a dynamic force in the international arena.
NST1 also incorporates the East African Community Vision 2050, which focuses on initiatives
for job creation and employment by prioritizing development enablers which are integral to
long-term transformation, value addition and acceleration of sustained growth. NST1 further
aligns with the Paris Agreement on Climate Change and other related agreements by treating
environment and climate change as cross-cutting across all government interventions and
sectors.
2.3. Institutional mechanisms
Rwanda has a strong and efficient institutional framework streamlining SDGs from national to
local levels and involving a range of stakeholders. Table 2 below describes the institutional
framework supporting the implementation of SDGs in Rwanda;

18
Table 2: Institutional framework
Role Organ Function
Oversight and Accountability
Parliament (Chamber of Deputies and Senate)
Endorsing plans and budgets, demanding accountability
Strategic Orientation Cabinet Approval of financing and implementation plans, strategic guidance
Strategic Monitoring National Leadership Retreat & National Umushyikirano (Dialogue) Council
Annual Monitoring and Accountability
Technical Advice Development Partners Coordination Group (DPCG) and SDGs taskforce
Technical Advice and support to implementation
National Technical Coordination
Ministry of Finance and Economic Planning
Integrating SDGs in plans and budgets, Monitoring and evaluation of progress,
Sector Coordination Ministerial Clusters Addressing Cross Sectoral issues
Technical Consultations
Sector Working Groups Forum for engaging all stakeholders, monitoring SDGs implementation at sector levels
Districts coordination
District Councils, Districts Joint Action Development Forums
(JADFs)
Forum for engaging all stakeholders, monitoring of SDGs implementation at
District level
Community Outreach through UMUGANDA and Districts
administrative organs e.g. Sectors, Cells, Villages
Citizen Participation and engagement forums
As part of efforts to
reconstruct Rwanda and
nurture a shared national
identity, the Government of
Rwanda drew on aspects of
Rwandan culture and
traditional practices to enrich
and adapt its development
programs to the country’s needs
and context. The result is a set
of Home-Grown Solutions - culturally owned practices
translated into sustainable
development programs. One of
these Home-Grown Solutions is
Imihigo or Performance
Contracts. Imihigo is a
planning, Monitoring and
Evaluation tool used by the
central and district levels to set
delivery targets, assess progress
against agreed upon annual development targets, including SDGs.
-Imihigo (Performance Contract) Home -grown Solution)
Imihigo is the plural Kinyarwanda word of Umuhigo, which means
to vow to deliver. Imihigo also includes the concept of
Guhiganwa, which means to compete among one another. Imihigo
describes the pre-colonial cultural practice in Rwanda where an
individual sets targets or goals to be achieved within a specific
period of time. The person must complete these objectives by
following guiding principles and be determined to overcome any
possible challenges that arise.
In 2000, a shift in the responsibilities of all levels of government
as a result of a decentralization program required a new approach
to planning, monitoring and evaluation. Local levels of government
were now responsible for implementing development programs,
which meant that the central government and people of Rwanda
needed a way to ensure accountability. Currently, Imihigo covers
both central and district levels.
19
2.4. Leaving No One Behind
The Government of Rwanda is strongly committed to promoting equality and equity amongst all
categories of Rwandans by ensuring that socially and historically disadvantaged as well as
vulnerable people are the main beneficiaries of its pro-poor programs. Article 16 of the
Constitution of the Republic of Rwanda of 2003 with Amendments through 2015 stipulates that
“All Rwandans are born and remain equal in rights and freedoms”, discrimination based on ethnic
origin, skin colour or race, sex, economic categories, economic status, physical or mental disability…are
prohibited and punishable by law”. In this regard, the Constitution guarantees representation in
the parliament for special categories of Rwandans including youth, women, people with
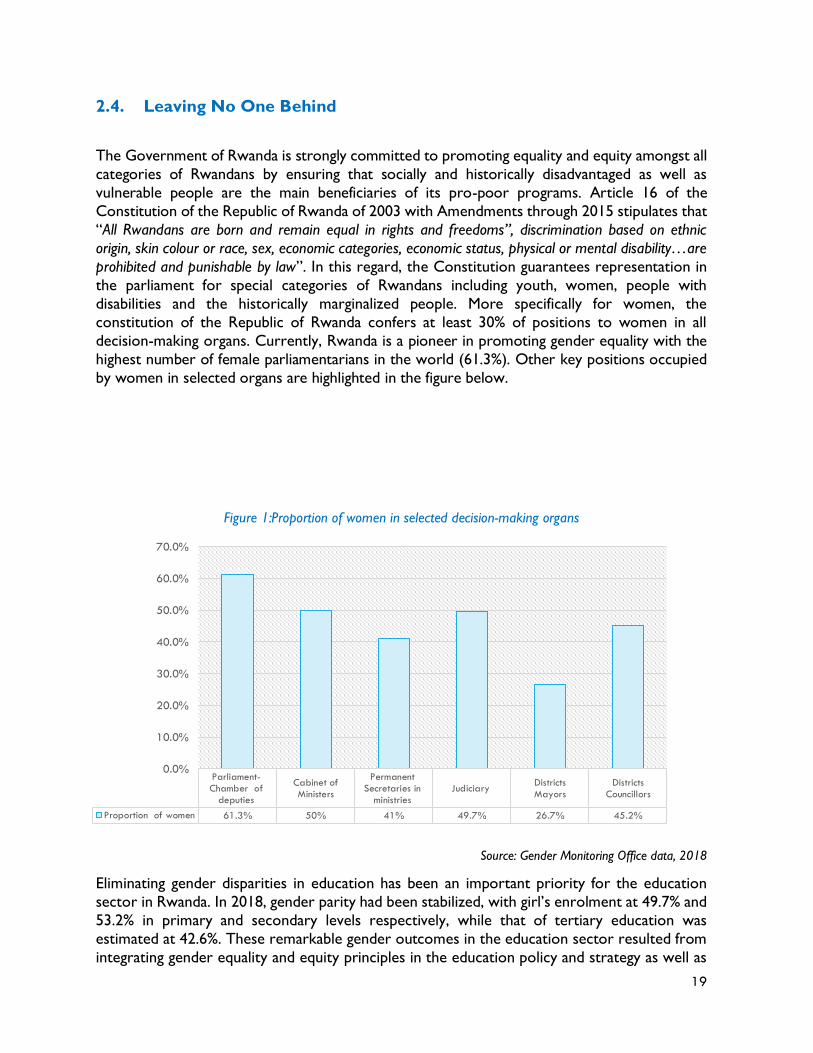
disabilities and the historically marginalized people. More specifically for women, the
constitution of the Republic of Rwanda confers at least 30% of positions to women in all
decision-making organs. Currently, Rwanda is a pioneer in promoting gender equality with the
highest number of female parliamentarians in the world (61.3%). Other key positions occupied
by women in selected organs are highlighted in the figure below.
Figure 1:Proportion of women in selected decision-making organs
Source: Gender Monitoring Office data, 2018
Eliminating gender disparities in education has been an important priority for the education
sector in Rwanda. In 2018, gender parity had been stabilized, with girl’s enrolment at 49.7% and
53.2% in primary and secondary levels respectively, while that of tertiary education was
estimated at 42.6%. These remarkable gender outcomes in the education sector resulted from
integrating gender equality and equity principles in the education policy and strategy as well as
Parliament-
Chamber of
deputies
Cabinet of
Ministers
Permanent
Secretaries in
ministries
JudiciaryDistricts
MayorsDistricts
Councillors
Proportion of women 61.3% 50% 41% 49.7% 26.7% 45.2%
0.0%
10.0%
20.0%
30.0%
40.0%
50.0%
60.0%
70.0%

20
the adoption of a gender progressive education curriculum. Other positive gender related
outcomes in the education include an increase in the female representation in ICT education
from 32.3% in 2015/16 to 41.8% and a 46% increase of female students in Science, Technology,
Engineering, and Math (STEM) from 43,770 in 2014 to 63,915 in 2018.
In an effort to increase women’s employability skills, Rwanda has continuously strengthened
demand driven Technical and Vocational Education Training (TVET) programs, increasing female
enrolment from 41.8% in 2015 to 43.8% in 2018. Furthermore, measures have also been put in
place to promote jobs creation for women and youth, including (i) the establishment of Business
Development Fund with priority to women and youth (ii) the adoption of a strategy for women
and youth access to finance (2016-2020) and (iii) empowering women in informal cross-border
trade by building their capacities and helping them access finance and markets.
Rwanda sees the role of the private sector and that of women entrepreneurs in particular, as
vital for the country to achieve its long-term development objectives. In this context, the
Rwanda Chamber of Women Entrepreneurs (RCWE) was established as an integral part of the
Private Sector Federation (PSF). The RCWE dedicates efforts in improving the business climate
and removing obstacles for women entrepreneurs to effectively play their role in the national
development and job creation.
Financing gender equality and empowerment of women has been and remains a priority for the
Government of Rwanda. This is materialized by the Organic Law N° 12/2013/OL of 12/09/2013
on State Finances and Property that was adopted to enforce Gender Responsive Budgeting (GRB).
Gender Budget Statement (GBS) is a mandatory annex to the budget framework paper by all
budget agencies, allowing them to ensure that their formulated budgets incorporate a gender
analysis that identifies the implications and impacts of the budget for both women and men.
Rwanda has also put in place mechanisms for preventing and eliminating all forms of gender-
based violence (GBV) and Child abuse. In this regard, Isange One Stop Centre was established in
2009 and later scaled-up in all district hospitals to provide timely and free of charge
comprehensive services to victims of GBV and Child abuse. Furthermore, with regard to
reproductive health, more women (53%) are taking own or shared (with their partners)
decisions on the use of any contraceptive methods.
In Rwanda, Youth is regarded as a dividend to drive an inclusive economic growth. The overall
goal is to enhance growth and competitiveness of Rwanda’s youth and enabling them to
contribute to Rwanda’s medium and long-term development goals. Job Creation is among
Government of Rwanda’s key priorities. As such, a number of initiatives have been put in place
to support youth entrepreneurship and job creation, including the establishment of the National
Employment Program (NEP) focusing on strengthening youth entrepreneurship, access to
finance, skills development and access to technology. Further, PSF has established a special
chamber for youth – the Chamber of Young Entrepreneurs to support and facilitate youth
entrepreneurship in doing business. Furthermore, in the recent Government restructuring, a
standalone Ministry of youth was created.
Improving the welfare of people with disabilities, indigents, elderly and other vulnerable groups
is at the center of the Government of Rwanda’s interventions. Article 51 of the Constitution
of the Republic of Rwanda; stipulates that the “State has the duty within its means, to undertake

21
special actions aimed at improving the welfare of persons with disabilities, indigent, the elderly and
other vulnerable groups”. In the context of inclusive education, the Government of Rwanda is
committed to ensuring that people with disabilities have access to meaningful learning
opportunities as provided by the Law No 71/2018 of 31/08/2018 relating to the protection of
a child. Rwanda has also put measures in place to ensure that all public buildings such as schools,
markets and administrative offices are built in a way that guarantees easy access for people with
disabilities.
In 2016, the Government of Rwanda conducted a nationwide categorization exercise for people
with disabilities with the aim to classify people with disabilities based on their levels and types
of disabilities and therefore design interventions and deliver services that fit the needs of each
category of disabilities.
The Government of Rwanda has since 2007 implemented the Vision 2020 Umurenge program
– an integrated local development program to accelerate poverty eradication and social
Protection. From its inception, the VUP program was made of three main components, namely,
Public Works for people in Ubudehe category 1 and 2 (bottom two income categories) capable
of working, the Direct Support for elderly, children headed households and people with
disabilities who are unable to work and Financial Services for people willing to start small income
generating activities. However, in 2017, a fourth component – the Expanded Public Works was
introduced to provide consumption smoothing employment and promoting sustained
graduation from extreme poverty among labour-constrained households, especially those caring
for young children. In 2017/18, a total of 94,912 (29,531 males and 65,381 females) elderly and
vulnerable people benefited from direct support for a budget of Frw12,867,647,5501.
Beneficiaries of public works were estimated at 134,993 (66,489 males and 68,504 females) for
an estimated budget of Frw 14,523,428,144. In 2018, the Government developed a new social
protection policy that aims to ensure universal access to Social Security and Social Care Services
for all Rwandans. Linked to this is the National Elderly Policy that currently is in process of
validation. Furthermore, in order to address the issue of a limited proportion of Rwandan
workforce covered by social security the Government of Rwanda has established the “Rwanda
Long Term Saving Scheme (LTSS)”, known as “Ejo Heza” to give an opportunity to non-salaried
workers who are currently excluded from formal pension and social security arrangements.
To fully understand the current situation of vulnerable and marginalized groups, Rwanda
conducted in 2018 the Multidimensional Poverty Index and Multiple Overlapping Deprivation
Analysis of child poverty that will inform appropriate policy actions. These assessments look
beyond income and provide an understanding of how vulnerable groups are being left behind
across three key dimensions: health, education and standard of living. In 2018, the Government
of Rwanda also conducted a profiling exercise for people living in extreme poverty (Ubudehe
category 1 and 2), which led to the adoption of a National Strategy for the Eradication of
Extreme Poverty which called for a multi-sectoral approach to supporting households to
sustainably graduate from extreme poverty.
In line with improving the welfare of the refugees’ community, Rwanda is also one of the pilot
countries implementing the comprehensive refugees’ response framework for enabling socio-
1 1USD = Frw 896

22
economic inclusion of refugees. This is part of the Global Impact on Refugees that seeks to foster
the resilience and self-reliance of refugees in a manner that also benefits host communities.
This includes facilitating access to livelihood opportunities and services that empowering
refugees to be less dependent on aid while giving them an opportunity to undertake income
generating activities. Refugees in Rwanda are granted the right to work and the government has
a policy of progressively integrating refugees into national system for health and education.
More specifically, 19,000 Burundian refugees’ students have joined the Rwanda national school
system.
Areas of improvement for Leaving No One Behind
Gender equality and women empowerment
Despite remarkable progress as described above, a number of challenges still impede full
attainment of Gender equality and empowerment of women in Rwanda, including:
− Poverty among women: Female headed households (39.5%) are more likely to be poor than
male headed households (37.6%) and adult women are more likely to be living in poverty
(34.8%) than adult males (31.6%).
− Limited control over productive resources: There is still need to ensure that more women
in Rwanda have access to off-farm employment opportunities and increased control
over productive resources to fully participate in the national development.
− Gender Based Violence: More efforts are still required to ensure that women are freed
from negative social norms and the culture of silence about GBV affecting timely
reporting, prevention and effective legal assistance.
Children with Disabilities
− Standard Operating Procedures: There is still need for establishing Standard Operating
Procedures at all centers caring for children with disabilities;
− Capacity Development: There is need for a comprehensive capacity building program to
address capacity need in the center caring for children with disabilities

23
2.5. National validation process
The VNR report was validated through a four-step process. The first step of the validation
consisted of a review of the first draft of the main report by directors of planning from different
government ministries and agencies related to data and information concerning their respective
sectors. The second step of the VNR report validation was through the SDGs Steering
Committee (bringing together Government officials from different ministries, the development
partners, civil society organizations and the private sector) and which mainly focused on quality
assurance of the content. The third step of the validation was done by the forum of Permanent
Secretaries followed by the approval of the final VNR report by Ministers. Feedback and inputs
provided during the various meetings and review processes were incorporated in the final
document.

24
Chapter III. Review of SDG Implementation in Rwanda
As mentioned earlier, this review mainly provides an in-depth analysis of the six SDGs (SDGs
4, 8, 10, 13, 16 & 17) proposed for the 2019 in-depth review. However, the analysis also
discussed other SDGs, namely SDGs 1, 2, 5 and 9 linking to the thematic areas analysis provided
below.
3.1. Human Capital Development
3.1.1. Overview of Rwanda’ Human Capital Development Status
The Government of Rwanda has made
significant progress in its Human
Development Index (HDI) between
1990 and 2017, increasing HDI by
109.6% from 0.250 to 0.524. Rwanda’s
life expectancy at birth increased by 18
years, from 49 years (2000) to 67
years (2018). The living standard of
Rwandans increased by about 108.4%
expressed in terms of GNI per capita,
from USD 869 to USD 1,811 over
1990 to 2017.
Similar progress has also been noted in
the access to knowledge dimension
with mean years of schooling
increased by 2.3 years and expected
years of schooling increased by 5.5 years in the same period (Figure 2). Nonetheless, Rwanda’s
HDI value of 0.524 put the country in the low human development category.
Furthermore, according to the 2018 World Bank Human Capital Index, positive trends have also
been observed in most dimensions especially in the healthy life. However, Rwanda ranks in HCI
142 out of 157 countries. The HCI measures the amount of human capital that a child born
today can expect to attain by age 18. Therefore, a child born in Rwanda today will be 37% as
productive as s/he could be if s/he enjoyed complete education and full health. In this respect, Rwanda
faces important challenges in chronic malnutrition with the under-five stunting of 38% (DHS
2015), early childhood development and quality education. The following sub-sections covers
SDG 2 focusing on nutrition and food security, and provides an in-depth analysis on SDG 4 (as
part of VNR proposed goal).
Figure 2: Trends in Rwanda‘s HDI component Indices
1990-2017 (UNDP, 2018)

25
3.1.2. SDG 2 – End hunger, achieve food security and improved
nutrition and promote sustainable agriculture
Status and Trends
Rwanda has developed comprehensive policies and strategies that contribute to ending hunger,
achieve food security and improve nutrition. It has been progressing steadily in its fight against
hunger and malnourishment. Rwanda has put in place a monitoring process including conducting
Comprehensive Food Security and Vulnerability Analysis (CFSVA), which was produced for the
fifth time in 2018, to assess food security and vulnerability under the overall leadership of the
National Institute of Statistics of Rwanda. The results of this CFSVA highlight the continuing
positive trends from previous assessment since 2006. Rwanda has taken great strides in
reducing poverty and malnutrition in the country. Agriculture, the main sector that contributes
to the progress in improving food security has been growing on average by 6% over the last
decade.. According to the CFSVA (2018) report, 81.3% of all households (about 2,034,942
households) are food secure (i.e., they are able to meet essential food and non-food needs
without engaging in atypical coping strategies), have an acceptable diet, and use a low share of
their budget to cover food needs.
According to the 2014/15 Rwanda DHS, chronic malnutrition (stunting or low height for age)
affects 38% of children under 5, reducing good health and affecting mental and developmental
growth. Underweight (low weight for age) affects 9% of children under 5 while wasting, (acute
malnutrition or low weight for height) which is associated with a high death rate, affects 2.2%
of children under 5 (wasting rates <5% are considered within an acceptable range) (Figure 3).
Figure 3: Malnutrition among children under 5 years compared to the WHO severity threshold
Source: Rwanda DHS 2014/15
Map- Food insecurity by Livelihood zones

26
Food access in Rwanda is mainly determined by seasonal patterns, commodity prices and
people’s purchasing power. For instance, accessing adequate amounts of food becomes more
complicated during the lean seasons. These periods are generally coupled with an increase in
food prices, which in turn lead to food inflation, thus reducing a household’s purchasing power.
According to the International Food Policy Research Institute (IFPRI) report of 2019, Rwanda
scored of 6.1 in agricultural transformation. In addition, Rwanda was ranked the 2017 best
performing country (AU, 2017) and is considered among those on track to fulfill the Malabo
commitment by 2025 (as a part of the Comprehensive Africa Agriculture Development
Program, CAADP).
Rwanda’s agriculture is exposed to climate effects, such as droughts and floods, and crop yield
levels are still below the potential levels, as indicated in figure 4.
Figure 4: Yield gaps for priority crops under the Crop Intensification Program
Interventions and opportunities for accelerating progress
Under the framework of the fourth Strategic Plan for Agriculture Transformation (PSTA-4), the
Government of Rwanda’s priorities for agriculture include (i) irrigation (including small scale),
(ii) Crop Intensification Program (CIP) focusing mainly on farmers’ access to agriculture inputs,
extension services and land use consolidation, (iii) erosion control, and (iv) livestock
development program. Furthermore, the Government of Rwanda has established an ICT
platform–E-Soko, aiming at providing agricultural market pricing information to farmers,
enabling them to make informed decisions.
In addition, the Government of Rwanda recognizes the key role played by Women in the
agriculture sector, producing for both home consumption and the market. The government of
Source: MINAGRI, 2017
27
Rwanda has developed an agriculture gender mainstreaming strategy to guide the integration of
gender in agriculture sector. Despite the high representation of women in the agriculture
sector, challenges like more women still engaged in the production part of the value chain and
less in agro-processing, marketing and export. This highlights the need to scale-up household
based approaches that promote equitable household decision-making in regard to agriculture
produce and other household resources.
The current PSTA-4 considers that “accessibility of food will be enhanced through higher
household incomes combined with greater resilience to market and production shocks.”
Factors that influence food accessibility and resilience to production and market risks include
improved storage capabilities, early warning and market information systems and insurance
schemes. The new strategy recognizes that country-wide access to food will be achieved when
all households have sufficient resources to obtain appropriate food (through production,
purchase, and/or direct support under social protection) for a nutrient-rich diet.
The government recognizes the urgency of protecting children from 0-6 years from the effect
of poverty and its implications on human capital and has put in place a multi-sectoral programme,
the National Early Childhood Development Programme (NECDP) (2016-2021). NECDP is set
to eradicate child malnutrition and calls for all partners to work in a harmonized and integrated
manner with the leadership of the Ministry of Gender and Family Promotion (MIGEPROF). The
ECD policy and strategic plan have further been informed by and aligned to Vision 2020, Revised
Family Policy, National Gender Policy and the National Integrated Child Rights Policy (ICRP).
The Government of Rwanda in partnership with DPs provides regularly micronutrient powder
(Ongera Intungamubiri) in all 30 districts to children aged 6-23 months and pregnant and lactating
women in vulnerable households. The local Kinyarwanda name, Ongera Intungamubiri, which
means “increase nutrients” is a powdered blend of 15 essential vitamins and minerals that can
be added to semi-solid or mashed food just before the child eats. Packaged in single serving
sachets, it allows families to fortify food for their young child with the safe and appropriate level
of vitamins and minerals important for their growth and development. To widen its coverage
the Fortified Blended Food (FBF) is also distributed to health facilities. In addition, milk is
distributed to under 5 children with acute malnutrition. Moreover, the school feeding program,
which aims at preventing and reducing malnutrition among School going Children in ECE & ECD
are being strengthened. The One Cup of Milk per Child, which is run under the school feeding
program, is preventing and reducing malnutrition among School goers. So far, 431,348 children
were reached. This program is said to have boosted enrollment rate of children under 6 years.
With regards to scaling up ECD interventions, to date 4,139 ECDs have been established
including model ECDs Centers and community based ECDs such as the village kitchen –cooking
demonstration kitchens through which parents, especially those with malnourished children are
shown how to prepare balanced diet using locally produced food.
Increasing the knowledge and the skill of Parents have been prioritized by the NECDP on the
conviction that the family is the primary institution through which quality optimal care and early
stimulation can be provided and as a result 15,000 parents have been trained nationwide.

28
Furthermore, the knowledge and capacity of health care providers and community health
workers on screening, growth monitoring and overall ECD, has improved.
SDG 4 –Ensure inclusive and equitable quality education and promote
lifelong public learning opportunities for all
Status and Trends
Rwanda has achieved significant success in providing universal access to primary education, with
a net enrolment rate (NER) of 98.30% (MINEDUC, 2018). In 2011, only two public pre-schools
existed in Rwanda, today the country has 3,210 nursery schools. However, that enrolment in
pre-primary education is still low but increasing. It was at 28.3% in 2017/18 (indicator 4.2.2). On
the other hand, with regard to assessing the number of children under 5 years who are
developmentally on track (indicator 4.2.1) according to the 2014/15 DHS, 6 in 10 Rwandan
children under the age 36-59 months (63 %) are set to be developmentally on track (i.e., on track in
at least three of the four domains).
When it comes to closing the gender gap in education (Indicator 4.5.1), there are approximately
an equal number of boys and girls attending both pre-primary (Gender Parity Index (GPI) 1.02)
and primary education (GPI, 0.98), showing gender parity at these levels (MINEDUC, 2018). On
the other hand, there have consistently been slightly more girls than boys enrolled at secondary
level, with girls increasing from 52.9% in 2016 to 53.2 % in 2018 compared to boys decreasing
from 47.1% boys to 46.8% (MINEDUC, 2018). There are more girls than boys enrolled in all
fields of upper secondary education (science, languages, humanities, teacher education), except
technical secondary education, which has a higher rate of boys (MINEDUC, 2018) as shown in
table 3.

29
Table 3: Upper secondary students enrolled in 2018 by learning areas
Learning areas Number of students
Percentage by
Sex
Male Female Total Male Female
Total Students in
upper secondary
schools
114,053 122,139 236,192 48.30% 51.70%
Sciences 38,022 46,620 84,642 44.9% 55.1%
Humanities 15,267 16,633 31,900 47.9% 52.1%
Languages 13,705 17,371 31,076 44.1% 55.9%
TTC 3,474 5,712 9,186 37.8% 62.2%
TVET 43,585 35,803 79,388 54.9% 45.1%
Students in Public
schools 37,797 35,971 73,768 51.2% 48.8%
Sciences 13,601 14,873 28,474 47.8% 52.2%
Humanities 5,280 5,245 10,525 50.2% 49.8%
Languages 5,237 5,818 11,055 47.4% 52.6%
TTC 830 1,321 2,151 38.6% 61.4%
TVET 12,849 8,714 21,563 59.6% 40.4%
Students in
Government aided
schools
46,731 58,705 105,436 44.3% 55.7%
Sciences 20,042 27,133 47,175 42.5% 57.5%
Humanities 9,103 10,242 19,345 47.1% 52.9%
Languages 8,347 11,364 19,711 42.3% 57.7%
TTC 2,644 4,391 7,035 37.6% 62.4%
TVET 6,595 5,575 12,170 54.2% 45.8%
Students in Private
schools 29,525 27,463 56,988 51.8% 48.2%
Sciences 4,379 4,614 8,993 48.7% 51.3%
Humanities 884 1,146 2,030 43.5% 56.5%
Languages 121 189 310 39.0% 61.0%
TTC - - - 0.0% 0.0%
TVET 24,141 21,514 45,655 52.9% 47.1%
Source: Education Statistics 2018

30
Table 4 below shows that in 2017/18 males in higher education were 57.3%.
Table 4: Tertiary student from 2016 to 2018
Indicator/Year 2015/16 2016/17 2017/18
Total students 90,803 91,193 89,160
Male 52,297 49,908 51,119
Female 38,506 41,285 38,041
% of Male 57.60% 54.7% 57.3%
% of Female 42.40% 45.3% 42.7%
Students in Public Tertiary institutions 39,208 38,595 38,338
Male 27,451 25,518 26,247
Female 11,757 13,077 12,091
% of Male 70.00% 66.1% 68.5%
% of Female 30.00% 33.9% 31.5%
Students in Private Tertiary institutions 51,595 52,598 50,822
Male 24,846 24,390 24,872
Female 26,749 28,208 25,950
% of Male 48.20% 46.4% 48.9%
% of Female 51.80% 53.6% 51.1%
Source: Education Statistics 2018
The assessment of the learning achievements (indicator 4.1.1) in Rwandan schools for 2014
showed 45.3% of P2 students achieved the grade-level competency in literacy and 32.9% in
numeracy (Table 5). There was no significant difference at P5, with 44.1% achieving literacy and
38.3% being competent in numeracy. Furthermore, the school completion and learning quality
are low evidenced by learning test score of 358 on a scale where minimum attainment represents
300 and an average completion rate of only 3.8 years of school against a global average of 9 years
(2018 WB, HCI).

31
Table 5: Learning Achievement in Rwandan Schools (LARS) 2 (2014) results (average scores) by level,
school type and location
Type of school P2
Literacy
P2
Numeracy
P5
Literacy
P5
Numeracy
All schools 45.3% 32.9% 44.1% 38.3%
All urban schools 58.2% 40.7% 67.7% 57.9%
All rural schools 43.7% 31.9% 40.9% 35.6%
Private schools (urban) 72.9% 46.7% 85.6% 75.5%
Government-aided (urban) 50.7% 37.9% 56.4% 46.7%
Government-aided (rural) 44.8% 32.2% 39.2% 35.1%
Public (rural) 41.6% 31.2% 44.1% 36.3%
Source: Rwanda Education Bureau (2016)
At present, the Adult Literacy rate (indicator 4.6.1) is at 73.2% and the Numeracy rate is at
73.4% (EICV5 -2016/17).
The proportion of primary schools that are connected to electricity both on-grid and off-grid
(indicator 4.a.1) has significantly increased from 52.4% in 2016 to 79.2 % in 2018 (MINEDUC
2018). Similarly, the proportion of secondary schools with access to electricity has increased
from 65.2 % to 92.5% in the same year. Access to basic drinking water has improved from 45.5%
to 53.6% in primary and 58.5% to 71.9% between 2016 and 2017. The ratio of toilet per users
improved from 57 to 54 for primary students. The total number of toilets in secondary has
increased to 37226 in 2018. This is an increase of 2,710 toilets built in 2017. Furthermore, the
proportion of primary and secondary schools having an Internet connection is 30 % and 52.9 %
respectively (MINEDUC, 2018). It is estimated that about 21% of primary schools, 17.8% of
secondary schools and 22.9% of TVET institutions have Smart Classrooms (MINEDUC, 2016).
Interventions and opportunities for accelerating progress
In order to address the underlying challenges in line with the Vision 2020 and fully integrating
the SDG 4 focus on ensuring inclusive and equitable quality of education and learning, the
Education Sector Strategic Plan (ESSP 2018-2024) is centered on: (i) increasing access to
education programs, especially pre-primary enrolment; (ii) enhancing quality learning outcomes;
(iii) enhancing use of ICT to transform teaching and learning; (iv) equitable opportunities for all
Rwandan children and young people; (v) strengthening STEM across all levels of education; (vi)
strengthened modern school infrastructure and facilities across all levels of education(vii)
strengthening Continuing Professional Development (CPD) and management of teachers across
all levels of education; (viii) More innovative and responsive research and development in relation
to community challenges and (iv) Strengthened governance and accountability across all levels of
education in Rwanda.

32
Furthermore, numerous education-related policies and strategic plans have been developed or
revised over the recent years to support the effective operationalization of the new ESSP and
ultimately contributing to the achievement of the objectives of the NST1 and the SDGs. Among
these are (i) Special Needs and Inclusive Education Policy (2017) and Strategic Plan (2018/19-
2023/24), (ii) Competence-based Curriculum Framework (2015), (iii) 9 years Basic education
strategy(2008) extended to 12 years Basic Education Policy (2012), (iv) Adult Education policy ,
(v) Technical and Vocational Education and Training (TVET) Policy (2015) and accompanying
Strategic Plan (vi)Science, Technology and Innovation Policy (2005, reviewed in 2013/14 to also
include a five-year strategic plan and (vii) the National Research and Innovation Fund managed
by the National Council for Science and Technology (2018).
In addition, the Government continues to steadily increase the budget allocated to the education
sector. In 2017/18 the sector received an estimated budget of 241 billion Rwandan francs (RWF)
and in 2018/19 the sector received 340 billion RWF, an increase of 41%.
The introduction of the Competence-Based Curriculum over three years from 2016 is expected
to meet the needs of a more diverse school population, rather than an academic elite, and has
been designed to be responsive to the needs of the learners, society and the labour market.
With a holistic, learner-centered approach, the curriculum demands major changes in teaching
methodology and the use of a wider range of assessment techniques, including more of a focus
on formative or ongoing continuous assessment. This has implications for all teacher trainings,
and the necessary provision of support and guidance provided to schools to ensure the
implementation.
In addition, activities geared towards improving teachers training including in English language
proficiency and numeracy skills are being implemented supported by innovative use of mobile
phone technology as a tool for teacher development to deliver audio, video and text materials.
Improving teacher management practices have also been prioritized which includes deployment,
staffing norms, transfers, retention and incentive strategies (providing loan facility and increase
of salary).
Educating and training all vulnerable children and youths is gaining momentum in Rwanda.
Nonetheless, the number of students with disabilities enrolled in all remains low. Similarly, trends
are also observed in secondary school. To address all issues related to education and inclusion
of all categories of disadvantaged learners, the Government of Rwanda has put in place strategies
such as the development of the national inclusive education guide which is enabling schools to
effectively implement inclusive education as a cross-cutting theme in the national curriculum. As
a result, 2,528 teachers, one from each Rwandan public school have increased their capacity to
implement inclusive education and deliver inclusive pedagogical approaches. 6,227 pre-service
teachers (3,105 in 2018 and 3,122 in 2019) were trained on inclusive education and inclusive
pedagogical approaches before starting their teaching career and being appointed to primary
schools countrywide.

33
The Special Educational Needs Coordinator
(SNECO) is a new position in the education sector.
The SNECOs will be responsible to coordinate the
assessment of children with disabilities at schools.
During regular school visits, SNECOs will also
provide technical support to teachers on their
identification of children with difficulties and on
inclusive teaching. SNECOs will also work with one
teacher per school who has the capability and
commitment to help other teachers with
identification and development of inclusive classroom practice.
Enrolment of girls in STEM, digital fluency and literacy are being reinforced by innovative
initiatives for STEM awareness campaigns like Teck Women, MISS GEEK, Techkobwa and
WeCode programs. Furthermore, the Government has introduced scholarships targeting
students pursuing STEM subjects especially for girls. Based on merit, full scholarships will be
awarded to the identified needy students, and girls, to promote their enrolment in STEM
programs in higher education. In addition, HEIs will increasingly specialize in STEM-related
research and will support a range of school-based initiatives that promote STEM at an early age,
identify and nurture students with special talents and incentivize performance through awards.
Technology Engineering, Mathematics and ICT are the core GoR’s priorities for improving the
relevance of education. An ICT in Education Policy (MINEDUC, 2016d) was adopted in 2016,
which focuses on developing digital content aligned to the curriculum; increased ICT
penetration and usage in education through ‘smart’ classrooms; the development of education
leadership and training courses for teachers in and through ICT; and enhanced teaching, learning
and research through ICT. In addition, an ICT center of excellence was established with the
aim to build capacity of the workforce with highly sought skills and contribute to the national
and regional development.
The current ESSP is also targeting to strengthen the adult literacy programs and drive demand
through an intensified awareness-raising campaign to re-engage communities and increase
enrolment in literacy programs. Libraries and resources to provide reading materials for neo-
literates to continue their learning and to develop literate environments will also be established
in every sector. The professional competence of the existing teachers will be improved through
appropriate CPD programs. Additional instructors will also be recruited and trained, to match
the increased focus on adult education.
Challenges
Financing the rapid expansion of SMART classrooms, education infrastructure and needs will
require significant investments and resources.
Widgit software is deployed in 18
Rwandan inclusive model schools: schools
are provided with tablets to support
learners with communication challenges
to learn how to read and write.

34
3.2. Inclusive Economic Growth
The inclusive economic growth thematic area describes the Rwanda’s performance in economic
growth, employment creation (SDG 8) and reduction in inequality (SDG10). However, due to
strong links between inequality and poverty, a highlight of SDG1 was also included in the
analysis.
3.2.1. SDG 8 Promote sustained, inclusive and sustainable
economic growth, full and productive employment and
decent work for all
Status and trends
Rwanda has scored sustained economic growth rates since the year 2000. Between then and
2018, GDP grew at an average of 7.9% a year and GDP per capita increased from 225 USD in
2000 to 787 USD in 2018 (target 8.1/ Indicator 8.1.1). In 2018, Rwanda’s economy grew at 8.6%
thanks to good performance of the Agriculture sector, which grew at 6%, industry, which grew
at 10% (mainly due to high growth in construction and manufacturing sectors), and Services
sector, which grew at 9%.
The labour force surveys (LFSs) show that the unemployment rates have been decreasing for
all categories. In fact, between 2016 and 2019, the overall unemployment rate decreased from
18.8% to 14.5%; male unemployment decreased from 15.7% to 13.8%, and female
unemployment decreased from 22.7% to 15.4% over the same period. Youth unemployment
remains higher than average, at 19.3% in 2019 (down from 21.5% in 2016). The overall labour
force participation decreased from 54% in 2017 to 52.5% in 2019, with that of male decreasing
from 62.7% to 61.9% and female from 46.4% to 44.2%.

35
Figure 5: Unemployment Rate (%)
Source: NISR, LFS 2018
Interventions and Opportunities for Accelerating Progress
Ensuring that the sustained levels of growth are inclusive and sustainable and that the jobs
created are quality jobs is the key challenge facing Rwanda on its journey towards upper middle
and high-income status by 2035 and 2050 respectively. Government estimates that to be able
to reach these goals, Rwanda will have to grow at an average rate of 9% between 2017 and
2024 and then accelerate to at least 12% a year until 2035. The economy will have to generate
214,000 new jobs every year and private investment will need to grow from the current 14.4%
of GDP to 21.2% by 2024 (figure 6). This entails a growing participation of the private sector in
the economy, especially in those sectors with high job-creation potential to reduce the
dependency of growth on public sector investments.
Figure 6: Investment share of GDP (%)
Source: Minecofin, 2018
18.8%
15.7%
22.7%21.5%
14.5% 13.8%15.4%
19.3%
0.0%
5.0%
10.0%
15.0%
20.0%
25.0%
Overall Unemployment Male Female Youth
2016 2019 (Q1)
14.4%17.2% 18.6% 17.6% 18.8% 18.9%
20.8% 21.2%18.4%
8.3%
8.0%8.2% 8.6%
8.9% 9.0%9.3% 9.9%
8.8%
22.7%
25.2%26.8% 26.2%
27.7% 27.9%
30.1%31.1%
0%
5%
10%
15%
20%
25%
30%
35%
2017 2018 2019 2020 2021 2022 2023 2024 Average
Private investment Public investment Total investment

36
The National Employment Program (NEP, 2014-2019) was established to cover a range of
interventions focusing on empowering youth and women through entrepreneurship, access to
finance such as the Business Development Fund that provides guarantee especially to women
and youth, skills development and access to technology and employment services in partnership
with private sector. In additional, employment gender mainstreaming strategy (2018-24) was
developed to promote gender sensitive employment strategic actions aimed at bridging gender
gaps in employment sector. Furthermore, in 2017, Rwanda launched the Private Sector
Development and Youth Employment Strategy (PSDYES) for the 2018-2024, specifically
targeting youth employment. The Government of Rwanda has also approved a number of
policies and strategies aiming at promoting employment in Rwanda, including: the National Skills
Development and Employment Promotion Strategy (2019), National Employment Policy and its
implementation plan (2019) and the National Mobility Policy (2019).
Rwanda is already setting up social safety nets for the informal sector (such as a long-term
savings scheme that will function as a pension).
Specific measures directed to increase female and youth employment such as Business
Guarantee fund mainly supporting youth and women and NEP are also meant to promote the
formalization of their businesses.
The Government of Rwanda is also committed to improving the performance of key sectors
linking to the intended socio-economic transformation. In agriculture sector, focus is put on
continuous modernization of agriculture and ensuring access to subsidized inputs and quality
extension services to all farmers for increasing productivity of agriculture and livestock.
In order to harness the country’s efforts to reduce its trade deficit and upscale local
manufacturing, the Government of Rwanda in partnership with private sector launched Made
in Rwanda’ brand in 2015 and adopted made in Rwanda policy in 2018. The policy provides a
holistic roadmap aimed at increasing competitiveness by enhancing Rwanda’s domestic market
through value chain development, and increasing and diversifying Rwanda’s exports. Further,
efforts will continue to be dedicated to constructing and developing industrial parks in provinces
and expand the Kigali Special Economic Zone with capacity of 350 companies operating therein
by 2024.
Another strategic intervention will be the mobilization of the financial sector in increasing the
availability of credit to the economy, leveraging on the growing levels of savings and on the
comparatively high levels of financial inclusion. The integration of informal mechanisms into the
formal financial sector, through the saving cooperatives and even the banks will be pursued to
foster the financial intermediation capacity of the system and increase the availability of capital
for investments.
Challenges
In order to ensure that the country’s aspirations for inclusive and sustainable growth as well as
creation of descent and productive jobs are met, Rwanda will need to address the following
challenges:
37
− In order to meet its growth objectives, Rwanda will need to raise its domestic savings
rate to at least 23% from current 10%.
− Labour productivity (output per worker) is still low in Rwanda. While resources have
increasingly moved from agriculture to other sectors, between 2001 and 2016, labour
productivity either fell or rose only slightly across most sectors.
− The private sector remains a relatively weak; it lacks the economies of scale that are
crucial for productivity. The private sector also faces challenges related to high costs of
finance and transport costs.
− The country still faces deficiencies in its human capital, and more investment is needed
in this crucial area.
3.2.2. SDG 10 Reduce inequality within and among countries
Status and Trends
Rwanda has made significant strides in reducing inequality while concurrently reducing poverty.
Embedding the equality agenda at the heart of its national policies, Rwanda has put in place
programs to ensure social mobility, address vulnerability and enhance social integration. The
development policies and programs pursued allowed for broad-based improvement in
Rwandans’ well-being regardless of gender, origin, religion, and economic status. Inequality as
measured by Gini Coefficient declined significantly over time. Based on 2016/17 household
survey data, Gini coefficient declined from 0.522 in 2005 to 0.429 in 2016. Inequality manifests
itself in geographical divide as well as by gender where female- headed households are still poorer
at 39.5% compared to 37.6% of male-headed households (EICV-5 - 2016/17). The latest data
confirms that inequality is highest in urban areas and lowest in rural areas. In terms of household
income per capita using expenditure per adult equivalent (Target 10.1), income increased for the
bottom two quintiles by 0.6 % and by 1.4 % respectively during 2014 and 2017, as shown in table
6. Thus, based on this data relative to the national average, the bottom 40% of the population in
Rwanda has improved their income levels.
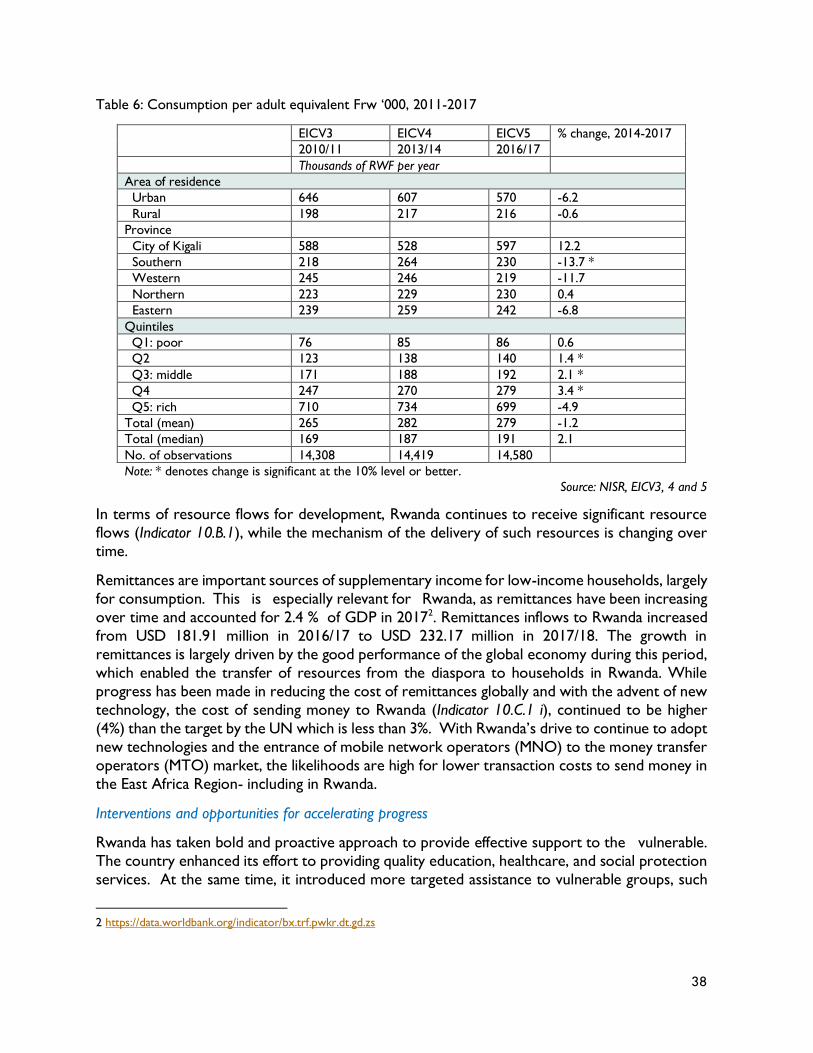
38
Table 6: Consumption per adult equivalent Frw ‘000, 2011-2017
EICV3 EICV4 EICV5 % change, 2014-2017
2010/11 2013/14 2016/17
Thousands of RWF per year
Area of residence
Urban 646 607 570 -6.2
Rural 198 217 216 -0.6
Province
City of Kigali 588 528 597 12.2
Southern 218 264 230 -13.7 *
Western 245 246 219 -11.7
Northern 223 229 230 0.4
Eastern 239 259 242 -6.8
Quintiles
Q1: poor 76 85 86 0.6
Q2 123 138 140 1.4 *
Q3: middle 171 188 192 2.1 *
Q4 247 270 279 3.4 *
Q5: rich 710 734 699 -4.9
Total (mean) 265 282 279 -1.2
Total (median) 169 187 191 2.1
No. of observations 14,308 14,419 14,580
Note: * denotes change is significant at the 10% level or better.
Source: NISR, EICV3, 4 and 5
In terms of resource flows for development, Rwanda continues to receive significant resource
flows (Indicator 10.B.1), while the mechanism of the delivery of such resources is changing over
time.
Remittances are important sources of supplementary income for low-income households, largely
for consumption. This is especially relevant for Rwanda, as remittances have been increasing
over time and accounted for 2.4 % of GDP in 20172. Remittances inflows to Rwanda increased
from USD 181.91 million in 2016/17 to USD 232.17 million in 2017/18. The growth in
remittances is largely driven by the good performance of the global economy during this period,
which enabled the transfer of resources from the diaspora to households in Rwanda. While
progress has been made in reducing the cost of remittances globally and with the advent of new
technology, the cost of sending money to Rwanda (Indicator 10.C.1 i), continued to be higher
(4%) than the target by the UN which is less than 3%. With Rwanda’s drive to continue to adopt
new technologies and the entrance of mobile network operators (MNO) to the money transfer
operators (MTO) market, the likelihoods are high for lower transaction costs to send money in
the East Africa Region- including in Rwanda.
Interventions and opportunities for accelerating progress
Rwanda has taken bold and proactive approach to provide effective support to the vulnerable.
The country enhanced its effort to providing quality education, healthcare, and social protection
services. At the same time, it introduced more targeted assistance to vulnerable groups, such
2 https://data.worldbank.org/indicator/bx.trf.pwkr.dt.gd.zs
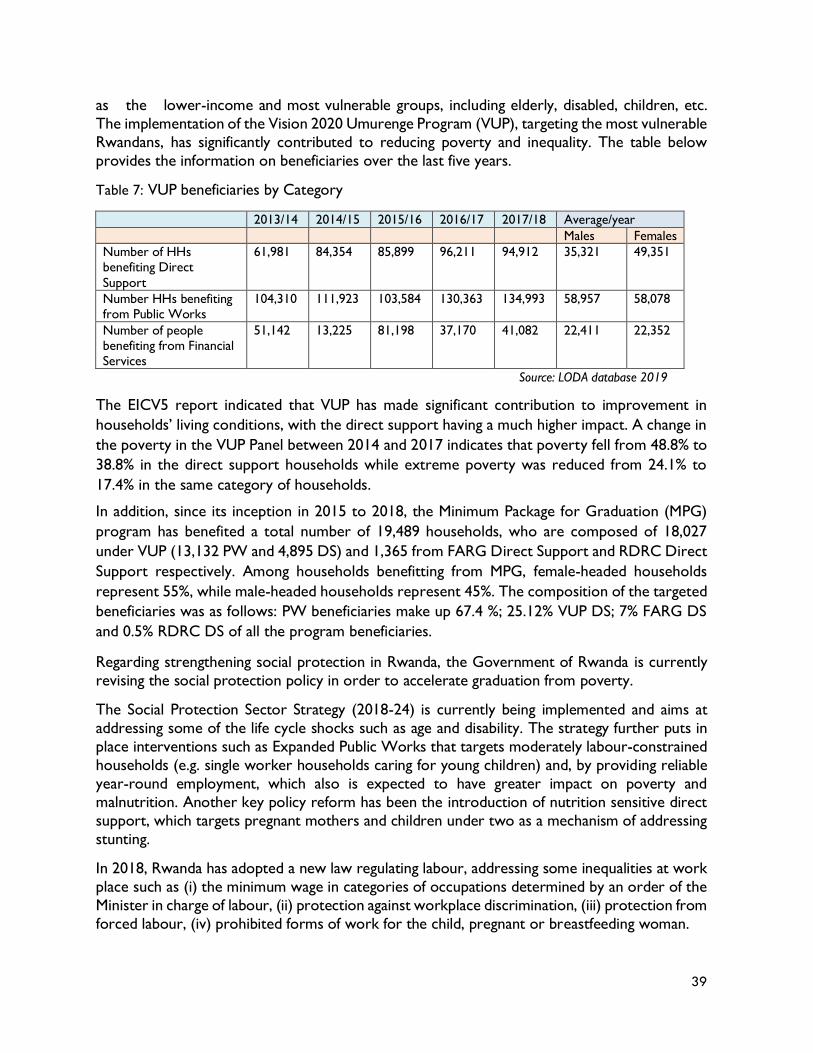
39
as the lower-income and most vulnerable groups, including elderly, disabled, children, etc.
The implementation of the Vision 2020 Umurenge Program (VUP), targeting the most vulnerable
Rwandans, has significantly contributed to reducing poverty and inequality. The table below
provides the information on beneficiaries over the last five years.
Table 7: VUP beneficiaries by Category
2013/14 2014/15 2015/16 2016/17 2017/18 Average/year
Males Females
Number of HHs benefiting Direct
Support
61,981 84,354 85,899 96,211 94,912 35,321 49,351
Number HHs benefiting from Public Works
104,310 111,923 103,584 130,363 134,993 58,957 58,078
Number of people benefiting from Financial Services
51,142 13,225 81,198 37,170 41,082 22,411 22,352
Source: LODA database 2019
The EICV5 report indicated that VUP has made significant contribution to improvement in
households’ living conditions, with the direct support having a much higher impact. A change in
the poverty in the VUP Panel between 2014 and 2017 indicates that poverty fell from 48.8% to
38.8% in the direct support households while extreme poverty was reduced from 24.1% to
17.4% in the same category of households.
In addition, since its inception in 2015 to 2018, the Minimum Package for Graduation (MPG)
program has benefited a total number of 19,489 households, who are composed of 18,027
under VUP (13,132 PW and 4,895 DS) and 1,365 from FARG Direct Support and RDRC Direct
Support respectively. Among households benefitting from MPG, female-headed households
represent 55%, while male-headed households represent 45%. The composition of the targeted
beneficiaries was as follows: PW beneficiaries make up 67.4 %; 25.12% VUP DS; 7% FARG DS
and 0.5% RDRC DS of all the program beneficiaries.
Regarding strengthening social protection in Rwanda, the Government of Rwanda is currently
revising the social protection policy in order to accelerate graduation from poverty.
The Social Protection Sector Strategy (2018-24) is currently being implemented and aims at
addressing some of the life cycle shocks such as age and disability. The strategy further puts in
place interventions such as Expanded Public Works that targets moderately labour-constrained
households (e.g. single worker households caring for young children) and, by providing reliable
year-round employment, which also is expected to have greater impact on poverty and
malnutrition. Another key policy reform has been the introduction of nutrition sensitive direct
support, which targets pregnant mothers and children under two as a mechanism of addressing
stunting.
In 2018, Rwanda has adopted a new law regulating labour, addressing some inequalities at work
place such as (i) the minimum wage in categories of occupations determined by an order of the
Minister in charge of labour, (ii) protection against workplace discrimination, (iii) protection from
forced labour, (iv) prohibited forms of work for the child, pregnant or breastfeeding woman.

40
Challenges
Despite Rwanda’s reduction in poverty and achievements about human development indicators,
much scope remains to reduce income inequality and address regional disparities as well as
gender disparities. Rwanda has a very comprehensive policy framework to address inequalities,
however the scale of implementation of these policies requires huge resources.. Rwanda will
continue to make growth inclusive, as the structural transformation process deepens. The
country will require to further mobilize the necessary resources, both human and financial, to
enhance the impact of the existing social protection policies as well as to invest on human
development, leveraging also on its fiscal policies.
Rwanda’s drive to self-reliance combined with the support of partners to strengthen its capacity,
is yielding significant result. Increasingly the country is financing its own development through
domestic resources. However, in the context of declining ODA, increasing domestic resource
mobilization will be critical. Rwanda’s unwavering effort to attract private capital through foreign
direct investment and increased facilitation by using innovative financing options such as blended
finance requires further partnerships.
3.3. Climate Change
SDG 13Take urgent action to combat climate change
and its impacts
Status and Trends
The Government of Rwanda (GoR) is among the countries, which have ratified the United
Nations Framework Convention on Climate Change (UNFCCC), and one among the first
countries to sign and ratify the Paris Agreement COP21 as well as the Kigali amendment to the
Montreal protocol. This demonstrates its willingness, being a responsible member of the global
community, to seek and achieve global solutions on climate change.
Climate change is expected to result in increased temperatures, intensified rainfall, and
prolonged dry seasons. Temperatures have increased by 1.4°C between 1970 and 2010 and may
further increase by up to 2.5°C by 2050 (from 1970 levels) and by 1-6°C by 2100. The average
annual rainfall is expected to increase by 20% by 2050 from the 1970 levels.
Rwanda’s strong reliance on rain-fed agriculture both for livelihoods and exports translates into
vulnerability to climate change. An evaluation of social vulnerability conducted in 2011 to climate
change ranks Rwanda first among all African countries in terms of natural resource dependency,
which it considers to be one of three indicators for social vulnerability to climate change.
The analysis of rainfall trends shows that rainy seasons are becoming shorter and more intense,
especially in the northern and western provinces, increasing erosion risks in these mountainous
parts of the country. The Eastern region has experienced serious rainfall deficits in a number of

41
years over previous decades, alternated with rainfall excesses in other years. As noted in the
National Green Growth and Climate Resilience Strategy, the cost of climate change in Rwanda
was estimated at 1% of GDP per year by 2030.
Some climate change effects, such as severe droughts and floods, famine, population
displacement, the lowering level of lakes and water flows, forest degradation and biodiversity
loss are expected to occur more frequently. In the past three years, Rwanda has experienced
a series of disasters that have killed hundreds and wounded many Rwandans and damaged basic
infrastructures and crops as detailed below.
Table 8: Disaster effects in Rwanda (2016-2018)
Disaster effects 2016 2017 2018
Deaths 183 82 254
Injured 172 151 346
Houses damaged 5,821 5,802 15,910
Crops (Ha) 7,449 5,277.1 13,337.21
Live stock 932 590 815
Class rooms 82 203 73
Health centers 2 3 3
Roads 2 13 32
Churches 6 37 27
Bridges 40 49 64
Admin offices 13 18 12
Water supply 39 10 1
Transmission lines 2 79 26
Source: Ministry of Emergency Management, annual reports (2016-2018)
The 2018 Post Disaster Needs Assessment (PDNA) shows that about 2,730,554 people were
affected and 31,580 temporarily displaced in 15 districts (Table 8). The PDNA also revealed
that the total damage and loss in 2018 was estimated at US$ 236 million, and the total cost of
recovery and reconstruction- at US$ 336 million.
Interventions and opportunities for accelerating progress
Rwanda ratified the Kigali amendment to the Montreal protocol, the Paris Agreement on Climate
Change. Rwanda also submitted its Nationally Determined Contribution (NDC) to UNFCCC
and developed NDC Partnership with key identified priorities to fast-track implementation. To
supplement existing efforts in protecting the environment, the Rwandan parliament also adopted
a law in June 2019 to ban single use plastics and encourage more recycling.
Rwanda’s vision is to become a developed, climate resilient and low carbon economy by 2050.
An initial stage towards the vision has been the development and implementation of the first
Green Growth and Climate Resilience Strategy (GGCRS) which focuses on: (i) achieving energy
security and a low carbon energy supply that supports the development of green industry and
services, (ii) achieving sustainable land use and water resource management that results in food
security, appropriate urban development and preservation of biodiversity and ecosystem
services and (iii) achieving social protection and disaster risk reduction in order to reduce

42
vulnerability to climate change impacts. The Government of Rwanda also recently approved a
Revised National Environment and Climate Change Policy (2019) and the Revised National Land
Policy (2019) that aim at emphasizing on greening economic transformation, enhancing
functional natural ecosystems and managing biosafety and promoting climate change adaptation,
mitigation and response among others. The Government further approved the Revised National
Land Policy (2019) aiming at strengthening land administration and management to ensure
optimal allocation and use of land. More specifically, the revised land policy addresses the
existing gaps in the land use planning and mapping, land utilization by various sectors as well as
in land administration and management. .
Environment and climate change remains one of the cross-cutting areas in the national
development framework and is mainstreamed in sector specific strategies and districts’
strategies, plans and Imihigo (performance contracts).
Rwanda is strongly committed to strengthening its climate change resilience and adaptation
capacity as manifested through the establishment of policies and strategies related to disaster
management. The National Disaster Management Policy was adopted in 2012, providing an
overarching framework for decision-making and coordination across disaster management
sectors and actors, including government ministries, civil society organizations, international
organizations and the private sector. A Disaster Management Plan to implement the policy was
developed in 2013. The Ministerial Order No.011/MIDIMAR/2012 of 24/05/2013 determining
construction modalities for preventing disaster caused by thunderstorms, rain and windstorms
and the Prime Minister’s Instruction No.001/3 of 11/7/2014 are some of the legal instruments
used in disaster reduction and management in Rwanda. Other policies and strategies linked to
disaster management adopted by the Government of Rwanda include the National Housing
Policy (2015), Green Growth and Resilience Strategy (2011), the National Food and Nutrition
Policy (2014), the National Urbanization Policy (2015) and the National Land Policy (2018).
The National Environment and Climate Change Policy adopted in 2019 reiterates government
commitments to promote:
− A green economy that is resource efficient, low-carbon and climate resilient,
− A circular economy to advance sustainable consumption and production patterns,
− Green technologies and procurement,
− Green urbanization and green rural settlements, and
− Green mobility.
In order to sustain progress and strengthen national capacities for disaster management, NST1
focuses on: (i) strengthening capacities for weather forecasting and early warning systems to
increase reliability and accuracy of information for informed decision making, (ii) improving
coordination and engagement of all stakeholders to enhance information sharing, timely
response and joint delivery of interventions; and (iii) continuing implementation of the disaster
management plans and tools including district disaster management plans and other contingency
plans.

43
Other Government Initiatives
FONERWA
The National Climate and Environment Fund (FONERWA), was created in the 2012 to respond
to Rwanda’s current and future needs for environment and climate change related financing, to
further support and accelerate goals of sustainable economic development. The creation of
FONERWA was recommended by the environmental law of 2005. Furthermore, law nº 39/2017
of 16/08/2017 establishing the national fund for environment and determining its mission,
organization and functioning was enacted.
Since its establishment, investment by FONERWA have resulted in creation of green jobs, areas
of land protected against soil erosion, households with improved access to off-grid clean energy
and more funds mobilized in strategic climate resilience investments among others as
summarized in Table 9 below;
Table 9: FONERWA key achievements
Area Achievement
Hectares of land protected against soil erosion 19,642
Hectares of forest and agro forest coverage 42,016
Hectares of watersheds and water bodies protected 21,145
Green jobs created 137,785
Households with improved access to off-grid clean energy 61,592
People supported to cope with effects of climate change 106,980
Tons of carbon dioxide equivalent emissions avoided 18,500
Resources mobilized by the fund for strategic climate resilience
investments
USD 172M
Source: FONERWA website, June 2019
Some of the successful development projects funded by FONERWA include: (i) Public-Private
Partnership on electronic waste management, implemented in partnership with the Ministry of
Trade and Industry to establish an e-waste recycling facility, (ii) Zero carbon affordable housing
project aiming at developing flexible single and multi-storied housing solutions that can be pre-
fabricated, mass-produced and constructed in a way that satisfies the low carbon demands of
the GGCRS and (iii) Rice husk power generation technology converting and producing 70 Kw from
biomass (rice husks) into electricity.
Guideline on Gender in Disaster Management
The guideline aims to provide the Ministry in charge of disaster management and its main
partners with guidance concerning gender analysis, planning and actions to ensure that the
needs, contributions and capacities of women, girls, men and boys are considered in all aspects
of disaster management and disaster risk reduction processes.

44
The guidelines focus on major cross-cutting issues in all phases of disaster management,
including preparedness, response and recovery. The guidelines offer a useful tool to make sure
gender issues are included in needs assessments, vulnerability and capacity analysis, contingency
planning and evaluations.
Natural Capital Accounting Initiative
Rwanda was one of the first African countries to sign the Gaborone Declaration in 2012
announcing its need to apply Natural Capital Accounting (NCA) as a tool to inform national
policies on sustainable development. Currently, the NCA informs the planning processes for
different strategies and policies by considering the important contribution of natural resources
sectors in the economy. In 2013, Rwanda also joined the WAVES (Wealth Accounting and the
Valuation of Ecosystem Services) global partnership to support its NCA efforts.
Environmental Impact Assessment
The Organic law No. 04/2005 of 08/04/2005 determining the modalities of protection,
conservation and promotion of the environment in Rwanda and law N°48/2018 of 13/08/2018
on environment made Environmental Impact Assessment (EIA) mandatory for approval of major
development projects, activities and programs in the Republic of Rwanda. A full list types of of
projects requiring EIA is provided in the 2009 Ministerial order relating to the above law. In
2006, the Government issued the general guidelines and procedure for environment impact
assessment in Rwanda. The guidelines are meant to:
− Enable the incorporation of environmental considerations in design and site selection
for projects or development activities;
− Enhance responsibilities of relevant parties in the development process;
− Mitigate and minimize environmental damage;
− Avoid costs and delays in implementation of projects that would arise from
unanticipated environmental problems;
− Make development projects more financially and economically efficient;
− Make an active contribution to sustainable development.\
The National Risk Atlas of Rwanda
The Government of Rwanda produced the National Risk Atlas of Rwanda (NRAR) in 2015 with
the main objective of conducting a comprehensive and nationwide assessment of the existing
risks in order to develop a comprehensive disaster risk profiles for Rwanda. The NRAR covers
five main hazards mostly impacting Rwanda namely: droughts, floods, landslides, earthquakes
and windstorms, selected based on their negative socioeconomic impacts on the development
of Rwanda. The NRAR forms a basis for decision making and mainstreaming disaster risk
reduction in the Government´s sectoral planning process.

45
Result Based Monitoring Framework for the Environment Natural Resources (ENR) sector
As part of effective monitoring and evaluation mechanism of SDGs ENR related indicators, the
Ministry of Environment initiated and implemented a web-based results monitoring system to
enhance cross-sectoral coordination and track progress of the implementation.
Challenges
Rwanda faces a number of persisting challenges in managing disasters in Rwanda including:
Land scape and settlement: The landscape and the settlement in high risk zones put the population
at high risk of landslide and flooding
Disaster Risk Management Capacities: Institutional capacities for disaster risk management needs
to be strengthened.
High cost of disaster mitigation and disaster management: Current settlement in high risk
zones requires huge financial resources to relocate the population to new sites, and to
restore the previously occupied zones.
3.4. Governance and Justice for all
SDG16 Promote peaceful and inclusive societies for
sustainable development, provide access to justice for
all and build effective, accountable and inclusive
institutions at all levels
Status and trends
Over the last two decades, Rwanda has spearheaded governance reforms to consolidate peace,
build strong and accountable public institutions and create a safe, stable environment conducive
to investment and growth. Rwanda’s experience of deploying Home-Grown Solutions (HGS)
to address governance and
development challenges has been a
bedrock of the Rwandan
reconstruction and transformation
journey. The HGS approach
provides a continued significant
opportunity to develop sustainable
solutions to development
challenges, as it combines the
elements of culturally owned
Rwanda Governance Scorecard (RGS)
The RGS is a home-grown quantifiable instrument that
monitors the progress of governance in the country. It places global governance
standards and home-grown indicators at the center of its method which makes it
uniquely relevant to both the international and national contexts

46
historical practices and the innovative element of effectively adapting them to current contexts.
According to the 5th edition of the Rwanda Governance Scorecard (RGS 2018), the safety and
security performance indicators have been steadily increasing, scoring 94.97% in terms of being
trusted by citizens. Rwanda’s investment in reconciliation and social healing has made the
related indicator increase substantially from 80.58% in 2014 to 93.95% in 2018 (RGS 2014-16).
In addition, Rwanda has developed a National Action Plan (NAP) 2009-2012 and 2018-2022 to
implement the United Nations Security Council Resolution 1325 (UNSCR 1325) on women
peace and security, as a practical step to sustain and expand registered gains in the women,
peace and security agenda.
The Gallup’s Law and Order Index 2018, which gauges people’s sense of personal security and
their personal experiences with crime and law enforcement in Rwanda indicated that 83% of
Rwandan residents have confidence in the local police force and that they feel safe walking alone
at night positioning Rwanda as the second safest place in Africa3.. Access to justice has been
subject to a decline followed by a stable rating since 2014 (80.25%) to 76.4% in 2016 and 77%
in 2018. However, the overall pillar of rule of law (including access to justice) recorded a sharp
increase from 67.7% in the 1st edition of the RGS (2010) to 84.5% in 2018 (RGS).
The 2018 Corruption Perceptions Index by Transparency International rated Rwanda as the
48th least corrupt nation globally, 4th in Africa, and the 1st in East Africa.
Although consistently increasing over time, the quality of service delivery pillar remains the least
performing pillar in the Rwanda Governance Scorecard over time. Service delivery in local
administration increased significantly from 71.1% in 2014 to 85.6% in 2018.
The level of citizen satisfaction with their participation in decision-making processes is at 45.5%
(Citizen Report Card, (CRC), 2017). Satisfaction with participation in the elaboration of district
budgets and plans is 47.7% (CRC, 2017). Vibrancy of Civil Society Organizations in Policy
formulation increased from 59.7% in 2014 to 67.33% in 2018 (RGS, 2018).
A lot of progress has been recorded in birth registration both in terms of the legal and policy
framework but also in terms of building capacities and raising awareness for increased birth
registration in Rwanda. The Civil Registration and Vital Statistics (CRVS) development was a
central focus under the previous National Strategy for the Development Statistics, with
significant successes on piloting the web- based CRVS registration system. These together with
the shift from paper-based to web-based birth registration will increase birth registration from
56% in 2015 (DHS 2014-2015) to 89% (CRVS 2019).
Rwanda has put in place appropriate legislation and policies to guarantee access to public
information. Additionally, media reform laws initiated in 2013 has helped strengthen media
3 Gallup Global Law and Order Report, 2018
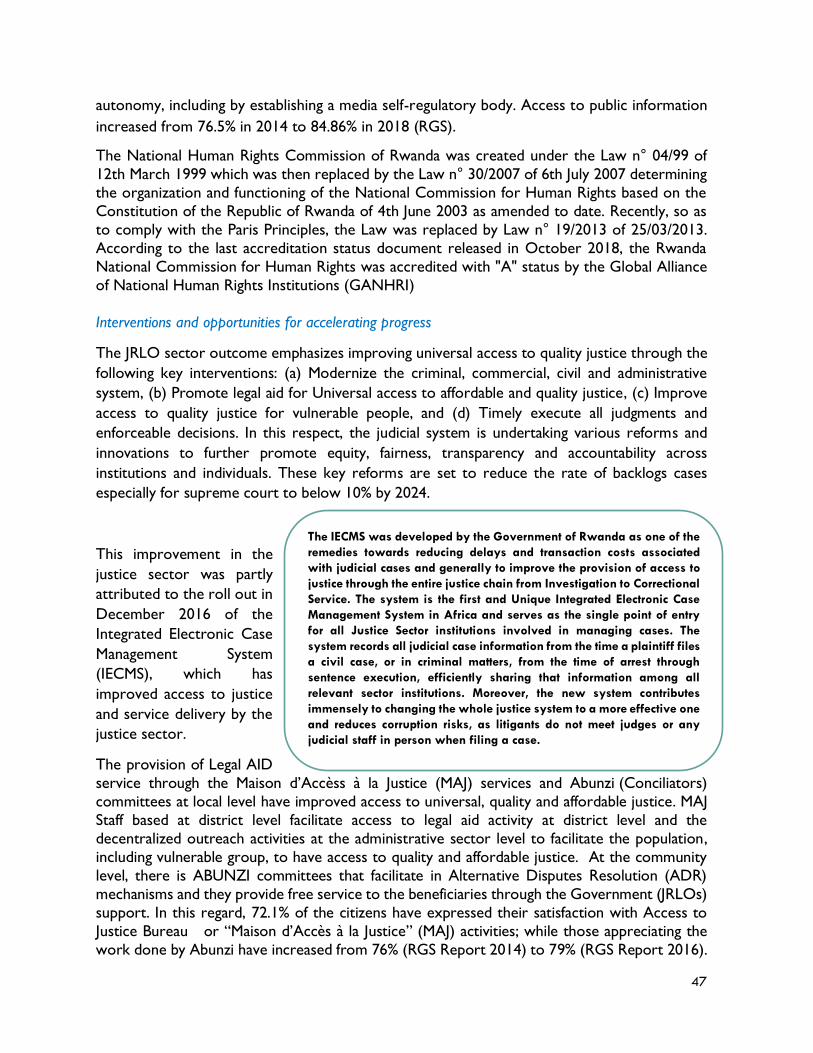
47
autonomy, including by establishing a media self-regulatory body. Access to public information
increased from 76.5% in 2014 to 84.86% in 2018 (RGS).
The National Human Rights Commission of Rwanda was created under the Law n° 04/99 of
12th March 1999 which was then replaced by the Law n° 30/2007 of 6th July 2007 determining
the organization and functioning of the National Commission for Human Rights based on the
Constitution of the Republic of Rwanda of 4th June 2003 as amended to date. Recently, so as
to comply with the Paris Principles, the Law was replaced by Law n° 19/2013 of 25/03/2013.
According to the last accreditation status document released in October 2018, the Rwanda
National Commission for Human Rights was accredited with "A" status by the Global Alliance
of National Human Rights Institutions (GANHRI)
Interventions and opportunities for accelerating progress
The JRLO sector outcome emphasizes improving universal access to quality justice through the
following key interventions: (a) Modernize the criminal, commercial, civil and administrative
system, (b) Promote legal aid for Universal access to affordable and quality justice, (c) Improve
access to quality justice for vulnerable people, and (d) Timely execute all judgments and
enforceable decisions. In this respect, the judicial system is undertaking various reforms and
innovations to further promote equity, fairness, transparency and accountability across
institutions and individuals. These key reforms are set to reduce the rate of backlogs cases
especially for supreme court to below 10% by 2024.
This improvement in the
justice sector was partly
attributed to the roll out in
December 2016 of the
Integrated Electronic Case
Management System
(IECMS), which has
improved access to justice
and service delivery by the
justice sector.
The provision of Legal AID
service through the Maison d’Accèss à la Justice (MAJ) services and Abunzi (Conciliators)
committees at local level have improved access to universal, quality and affordable justice. MAJ
Staff based at district level facilitate access to legal aid activity at district level and the
decentralized outreach activities at the administrative sector level to facilitate the population,
including vulnerable group, to have access to quality and affordable justice. At the community
level, there is ABUNZI committees that facilitate in Alternative Disputes Resolution (ADR)
mechanisms and they provide free service to the beneficiaries through the Government (JRLOs)
support. In this regard, 72.1% of the citizens have expressed their satisfaction with Access to
Justice Bureau or “Maison d’Accès à la Justice” (MAJ) activities; while those appreciating the
work done by Abunzi have increased from 76% (RGS Report 2014) to 79% (RGS Report 2016).
The IECMS was developed by the Government of Rwanda as one of the
remedies towards reducing delays and transaction costs associated
with judicial cases and generally to improve the provision of access to
justice through the entire justice chain from Investigation to Correctional
Service. The system is the first and Unique Integrated Electronic Case
Management System in Africa and serves as the single point of entry
for all Justice Sector institutions involved in managing cases. The
system records all judicial case information from the time a plaintiff files
a civil case, or in criminal matters, from the time of arrest through
sentence execution, efficiently sharing that information among all
relevant sector institutions. Moreover, the new system contributes
immensely to changing the whole justice system to a more effective one
and reduces corruption risks, as litigants do not meet judges or any
judicial staff in person when filing a case.

48
Furthermore, according to the State of Gender Equality Gender Report (2019) and Beijing +25
Rwanda Country Report (2019), at the grass root level, women are playing a visible role in
conflict management and justice structures. They represent 44.3% of community mediators
(Abunzi) and 48% of the access to Justice Bureaus (MAJ). They also contribute to providing free
legal services to citizens, including victims of GBV and child abuse. Women in security organs
actively participate in peace building initiatives at both regional and international levels. In 2015,
Rwanda was the second highest contributor of female police peace-keepers. This sends a
positive message to the communities especially on the capacities and professionalism of women
in peace and security affairs.
Rwanda continues to be among the
leading nations on the fight against
corruption. A new law on anti-
corruption (2018) was ratified,
representing Rwanda’s more
aggressive step to achieve good
governance through preventing and
fighting corruption.
Challenges
Media availability and access to information for citizens is still low at 65.8%, although increased
from 55.2% in 2013(Rwanda Media Barometer 2013 and 2016). Limited profitability of the media
sector, poor retention of best journalists, lack of media capacity building and lack of journalists'
commitment to media professional codes of conduct have been cited by the Rwanda media
barometer as being major challenges to media sector development in Rwanda.
The online public procurement system:
‘UMUCYO’
The ministry of justice started ensuring the quality of
public contract signed through an online e-
procurement system. This system has enabled the
full compliance of public contracts as it is not
possible to sign online without the legal opinion and
permission of the Ministry of Justice

49
3.5. Global partnership and Data for SDGs
SDG 17Strengthen the means of implementation and revitalize
the Global Partnership for Sustainable Development
Status and Trends
Rwanda has for long time recognized the importance of effective partnerships for sustainable
development. It has not only created inclusive partnerships that delivered visible changes on the
ground, but has also proactively taken leadership role to promote such partnerships within the
region and beyond. At country level, partnerships between governments, the private sector and
civil society as well as development partners are thoughtfully created to foster development in
the country based on its medium-term plan and long-term Vision. With the drawing up of the
most ambitious transformation plan- NST I, anchored on Vision 2050; Rwanda more than any
time ever, emphasized the very important role of the private sector beyond traditional
partnerships in the decades to come. It is proactively pursuing innovative partnership with
development partners to move beyond traditional financing and consider new and innovative
ways to finance the private sector. The country has pursued relentlessly self-reliance approach
that is yielding significant results, while leveraging effective partnerships. These inclusive and
innovative partnerships are built and guided by international principles as well as national vision.
The country has development aid policy, which was recently revised in 2018.
Rwanda has developed policies that guide its domestic resource mobilization effort, including
through introducing new excise and royalty taxes as well as revenue administration measures to
increase compliance. While broadly the country registered encouraging results (Indicator
17.1.1), total government revenue as a proportion of GDP, reaching a peak of 24.1 % in 2017/18.
Rwanda recognizes the need to enhance domestic resource mobilization and sustain progress in
the medium and long term.
Further to mobilizing resources, Rwanda continued to implement its policy of self-reliance by
financing large share of its budget from domestic resources (Indicator 17.1.2). The proportion
of domestic budget funded by domestic taxes and loans increased from 55% in 2005 to 84% in
2018/19. On the other hand, the share of external grants to finance budget declined from a high
of 44.3% in 2005 to 16% in 2017/18. This effort was complemented by aid policy that encouraged
partners to effectively support Rwanda by using country system to disburse money as well as
report its progress using country own result frameworks. In the use of country systems, 78.0%
of ODA disbursements were delivered by GoR agencies in 2017/18, slightly higher than 2016/17
(73.0%), and 71.1% of ODA disbursements used public financial management and procurement
systems in 2017/18, also slightly higher than in 2016/17 (66.3%). The overall use of country
results frameworks in development co-operation (Indicator 17.15.1), is 67.5%, which reflects

50
potential for improvement in the short and medium terms4. This trend is extremely important
for a country to be able to sustainably finance its own development and to avoid fragmentation
and duplication of efforts.
Figure 7: Fiscal trends
Furthering its domestic resource mobilization efforts, Rwanda is encouraging its citizens living
abroad to contribute to their national development process (Indicator 17.3.2). As a result,
the volume of remittances (in United States dollars) as a proportion of total GDP continued to
increase, despite the global economic uncertainties. Remittances have reached a peak of above
3 percent of GDP before financial crisis of 2008.
4 GPEDC Monitoring profile – October 2016.

51
Figure 8: Remittances (USD millions)
Figure 9: Remittances as a share of GDP
Source: External Development Finance Report (2017/2018) and World Development Indicators
As a result of prudent macro-economic management and sustained effort to mobilize resources,
Rwanda maintained stable and healthy debt levels (Indicator 17.4.1). Debt service as a
proportion of exports of goods and services remained below 4% as at 2017. With prudent
borrowing for investment, sustainable debt levels have been maintained. Present Value of debt
to GDP in 2019 stands at 30%.
To strengthen the south-south cooperation, the Government of Rwanda established and
operationalized a private company, the Rwanda Cooperation Initiative in September 2018
whose mandate is to promote Home Grown solutions and coordinate peer learning related
to country experiences and progress in areas such as doing business reforms, public finance
management, unity and reconciliation and strengthening governance systems, among others.
Data for SDGs monitoring and Reporting
The 3rd National Strategy for the Development of Statistics, NSDS3 is Rwanda’s first NSDS
designed for alignment with the SDG agenda, leveraging the global mandate to expand data
supply, mobilize resources and strengthen the National Statistical Systems. Objectives to
improve coverage, frequency and granularity in data production — and for other key initiatives
outlined in this chapter — are motivated by a nationally-led and owned approach to SDG
monitoring and reporting. The National Institute of Statistics of Rwanda (NISR) led an extensive
0
50
100
150
200
250
2012/13 2013/14 2014/15 2014/15 2015/16 2016/17
0
0.5
1
1.5
2
2.5
3
3.5

52
consultative process under NSDS 2 to develop an official national list of SDG indicators. As a
result, during NSDS 3 implementation, the NSS will aim to fulfill all relevant SDG indicator
requirements for a total of 150 priority indicators assigned to NST1 sectors. To implement a
national approach to SDG measurement, NSDS 3 will operationalize the 6 strategic areas
outlined in the Cape Town Action Plan in the Rwandan context:
Strategic Area 1: Coordination and strategic leadership on data for sustainable
development. Rwanda pursued a strategy of early intervention to respond to emerging SDG
data requirements. NISR assumed a lead role in this process, identifying where indicators were
fully, partially, or not currently reflected in official statistics.
Strategic Area 2: Innovation and modernization of national statistical systems. The
launch of the DRP (Section 3.4) and improvements in statistical governance (Section 3.7.3) are
strongly tied to the 2030 Agenda, providing frameworks to expand data access, facilitate dialogue
and introduce the NSS to new data, technologies and techniques.
Strategic Area 3: Strengthening of basic statistical activities and programs, with a
particular focus on the monitoring needs of the 2030 Agenda. NISR adopted a proactive
approach to SDG measurement, adapting key surveys to close SDG data gaps during NSDS 2.
With over 40% of indicators linked to administrative sources (Abdella, 2017), the SDGs also
motivate the design of sector statistical plans (Section 3.2).
Strategic Area 4: Dissemination and use of sustainable development data in addition
to ongoing efforts to improve data dissemination at NISR (Section 3.6), the
development of the NDP and a specialized SDG reporting platform under the DRP (Box 4) will
make SDG data and evidence more accessible to decision-makers and the public.
Strategic Area 5: Multi-stakeholder partnerships for sustainable development data:
Rwanda’s decentralized approach to SDG monitoring provides an opportunity to strengthen
sector ownership in data production and plans for DRP implementation open new partnerships
with NSOs, academia and the private sector.
Strategic Area 6: Mobilize resources and coordinate efforts for statistical capacity
building. The new NISR Training Center (Section 3.5) will be the central hub of DRP
implementation and a comprehensive capacity building program. The facility positions NISR to
lead efforts to modernize the NSS and equip MDAs to measure national progress toward the
SDGs.
Meeting the SDGs data demand requires to also foster a more innovative approach in addition
to strengthening traditional data source. Hence, In April 2017, the GoR released an innovative
policy designed to facilitate a national data revolution, designating NISR as the lead implementing
institution. The DRP (FY2017/18- FY2021/22) aims to 'build an innovation [and] data-enabled
industry to harness rapid social and economic development' (The Republic of Rwanda, 2017). As
declared during the 5th UN International Conference on Big Data for Official Statistics, which
took in Kigali from 29th April to 3rd May 2019, The Government of Rwanda has offered to host
a hub of the UN Global Platform in Rwanda at the National Institute of Statistics of Rwanda
Training Centre and Data Science Campus. The hub will support capability development work

53
of international and regional agencies in Africa in Big Data for official statistics and respond to
SDG data needs.
Rwanda is also hosting the SDG Centre for Africa (SDGC/A) in support of continental efforts
to deliver on the SDGs. The Centre has been publishing the Africa SDG Index and Dashboards
Report since 2017. Relatedly, the Center has designed and developed an SDG Monitoring and
Reporting (MR) system to be rolled out in African countries. Furthermore, numerous
assessment and studies have also been commissioned by the center including specific case studies
for African countries, and SDG costing estimates for Education and health sector found in the
Center’s 2017 Africa 2030 report.
The Center is also involved a wide ranging set of other initiatives inter alia to harmonization of
monitoring systems for both 2030 agenda and the AU 2063 agenda, development initiatives for
financing in part through reforming National Development Banks and carrying out tax reforms,
enhancing the quality of tertiary education (has prepared and started implementing the road map
for Kigali initiative which aims to transform at least 25 universities in Africa), designing an
Accountability Framework for Health Systems in Africa, De-carbonization Pathways Project for
Africa and Enhancing Adaptation and Resilience to Climate Change in Africa.
Interventions and opportunities to accelerating progress
Vision 2050 and NST 1 lay the foundation to help meet the SDGs and propel Rwanda to middle-
income and to high-income status over the longer term. However, available resources fall far
short of what will be needed to realize the longer-term development objectives. Fiscal discipline
has been complemented by efforts to bolster domestic revenue mobilization and improve fiscal
transparency, but there is ample scope for additional progress. Furthermore, Weak domestic
saving is a constraint on the domestic capacity to generate financing for private sector
investment. Low mobilization of domestic savings at 10% of GDP in 2018 is a concern. It is well
below the target of 22.8% of GDP projected for 2024, a level consistent with domestic savings
rates in successful emerging economies. In terms of enhancing effective use of external resources
more could also be done to leverage these resources to attract large private sector resources
and the ensuing technology transfer that come with private sector investments.
Rwanda has started developing an inclusive finance strategy and roll out innovative mechanisms
to promote domestic savings. NST I aim at increasing the level of domestic savings as a
foundation for investment; attracting foreign and local investment to improve competitiveness
as well as using public private partnerships to unlock business potential. The country also aims
at broadening its tax base and enhancing economic activities in the formal economy. Its drive to
create cashless economy and promote digitalization will enhance its success in promoting
effective and innovative partnerships with private sector.
Challenges
As with other countries, gaps exist in data for effective monitoring of SDGs, the current national
statistical system produces 60% of the SDGs applicable to Rwanda that have internationally
established methodology.

54
3.6. Progress Against Selected Goals
In addition to the SDGs proposed for 2019 VNR in-depth analysis, this report also briefly
highlights progress against five more SDGs, namely: SDG1, SDG3, SDG5 and SDG9 as detailed
below. Details of the status for all the SDGs are summarized in the table in the annex.
3.6.1. SDG1 Ending Poverty in all its forms and everywhere
Status and trends
Rwanda’s progress towards ending poverty has been marked by remarkable progress in the
period 2000 to 2014, but somewhat registered small reductions between 2014 and 2017. In
terms of indicators, this trend is summarized by the proportion of population living below the
national poverty line that was of 60.4% in 2000/01 to then reach 38.2% in 2017 (Indicator 1.2.1).
However, considering the international poverty line is considered (USD 1.90/day), 56.8% of the
Rwandan population fell below the threshold in 2013 against 55.5% in 20165 (Target 1.1/ Indicator
1.1.1). Further measures that consider poverty in all its dimensions, such as the Multi-
dimensional Poverty Index, also showed a slight improvement passing from 0.17 in 2014 to 0.15
in 2017 (Indicator 1.2.2).
Indicators related to social protection coverage (Target 1.3), showed mixed progress against the
baseline (2014). Core social protection programmes covered 6.5% of the population in 2018
(Indicator 1.3.1), however the contributing members into pension funds grew from 465,579 to
539,219 and pension beneficiaries from 18,856 to 21,550. The same progression can be seen in
the participation into medical schemes that increased from 133,415 active members (affiliates)
to 147,170; the number of dependents passed from 243,421 to 285,280. Participation into the
Community-Based Health Insurance scheme is at 83.3% of the population (2018), A net
progress was recorded in terms of access to maternity leave benefits that grew from 0 to
164,601 women.
Table 10: Coverage for pension, medical and maternity leave
Source: RSSB annual report, 2018
5 https://data.worldbank.org/indicator/SI.POV.DDAY?contextual=aggregate&end=2016&locations=RW&start=1984&view=chart
Baseline (2016/17 ) Progress (2017/18)
Members of pension and occupational hazards schemes , 465,579 539,219
Members of medical schemes 133,415 147,170
Beneficiaries of Maternity Leaves Benefits - 164,601

55
The impact of disasters on poverty (Target 1.5), is measured, amongst others, by the number of
deaths, missing persons, and directly affected persons attributed to disasters per 100,000 people
(Indicator 1.5.1). These rose in Rwanda from 183 deaths and 16,645 afflicted people in 2014 to
273 deaths and 80,164 afflicted people in 2017. Against this background, the number of local
government entities that adopt and implement local disaster risk reduction strategies in line
with national disaster risk reduction strategies passed from 22 to 29 (over a total of 30 districts)
between 2014 and 2017 (Indicator 1.5.3).
Challenges and opportunities for accelerating progress
The overview provided above suggests a number of outstanding challenges that go well beyond
poverty eradication. About 25% of the working age population, majority being women, is still
engaged exclusively in subsistence agriculture and the sector contributed to about 30% of the
gross domestic product.
The number of newly created jobs is not meeting the pace of entrants into the labour market
making it more complicated to reap the demographic dividend. Furthermore, the quality and
value added of the available jobs is low; people working in elementary occupations consistently
make up over 50% of the total employed.
The country’s exposure to climate change, and its negative impact further detailed under Goal
13, puts a strain on its efforts to tackle poverty as climate related-shocks such as droughts and
flooding impact on the livelihoods of the rural population, disrupt the production of staple
goods, weigh in on the balance of payment, increase inflation and damage infrastructure.
Ensuring economic growth is inclusive and broad-based is the first priority when it comes to
tackle poverty eradication. The second is the capacity of the economy to continuously deliver
quality jobs by increasing value addition and pursuing integration in the global value chains. This
cannot be achieved without strong investments in human capital to ensure the availability of
skilled labour force and the closing of the current skills gap. In turn, providing the entrants to
the labour market with the skills required will help the country manage the demographic
transition and exploit the demographic dividend by absorbing the new labour force. In parallel,
gender sensitive social protection mechanisms will continue to be stepped up, increasing
healthcare coverage and extending the reach of insurances and pension schemes to shield
people from catastrophic events and expenditures that could push them back into poverty. The
development of a climate smart agriculture and other investments in climate change adaptation
will help shielding the more vulnerable population from the weather excesses and cushion their
impact on the economy.

56
3.6.2. SDG3 Ensure healthy lives and promote well-
being for all at all ages
Status and Trends
Rwanda has made impressive gains in health, placing the country as one of the few in Africa to
achieve the MDGs health targets with a steady decline in maternal mortality falling from
1,071/100,000 (in 2000) to 210 (in 2014/15) (figure 10). The achieved results are primarily due
to the Government concerted investment towards building a comprehensive health system.
Consequently, the coverage of the first visit to antenatal care is now almost universal (99%, DHS
2015) and over 90 % of women have skilled assistance during delivery. Fertility rate has declined
significantly from 6.1 births per woman of childbearing age in 2005 to 4.2 in 2014/15 with rural
women having almost one child more than urban women (4.3 and 3.6 respectively) (DHS).
Figure 10: Maternal mortality ratio for the period 0-4 years prior to the 2000, 2005,2010 and 2014/15 RDHS
Source: Demographic Health Survey 2014/15
Furthermore, Infant mortality has declined substantially in the past 10 years, from 86 deaths per
1,000 live births in 2005 to 62 per 1,000 live births in 2007-08, 50 per 1,000 live births in 2010,
and 32 per 1,000 live births in 2014-15. Under-5 mortality also declined during this period, from
152 deaths per 1,000 live births in 2005 to 76 per 1,000 live births in 2010 and 50 per 1,000 live
births in 2015 (figure 11). Child immunization coverage has steadily improved over the last 10
years: 93 % of children aged 12 to 23 months have received all basic vaccines and 89.4 % have
vaccination cards, with no significant variation between boys and girls or between rural and urban
locations (DHS 2014/15). Rwanda Vaccination program generally follows the World Health
Organization (WHO, February 2015) recommended vaccines for routine immunization, and all
required vaccines now are given in routine immunization. Each child who is vaccinated receives
an immunization card on which all of the vaccines received are recorded.
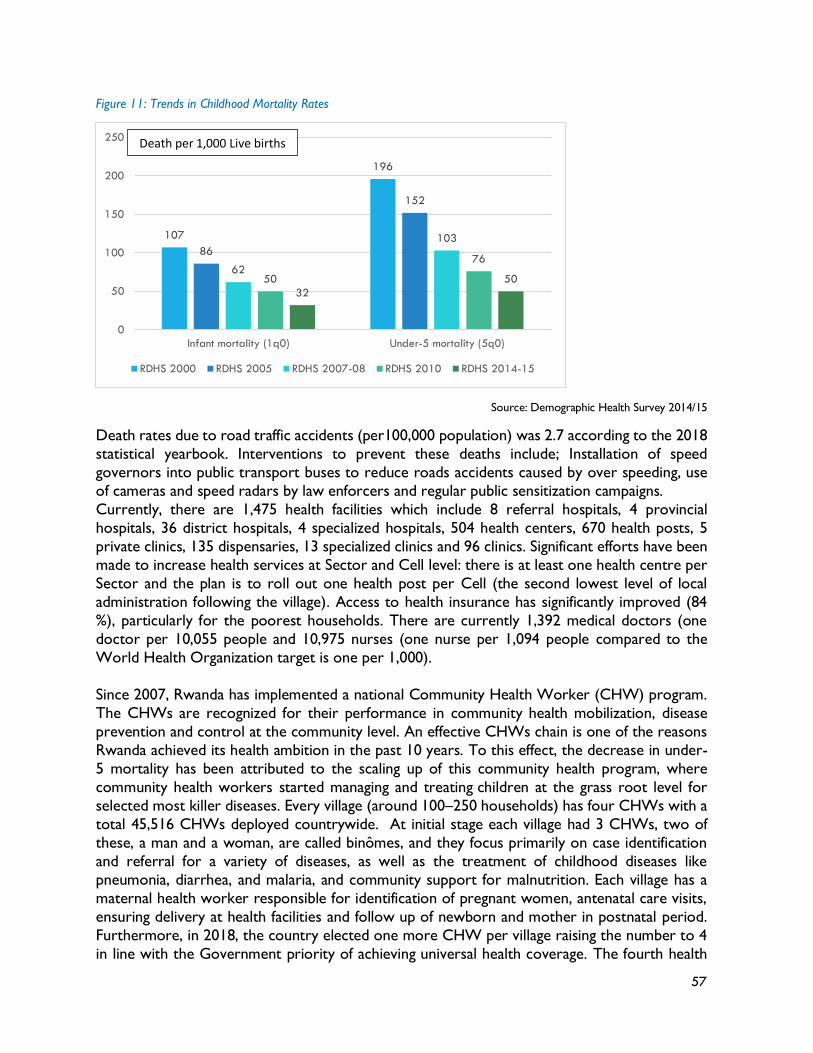
57
Figure 11: Trends in Childhood Mortality Rates
Source: Demographic Health Survey 2014/15
Death rates due to road traffic accidents (per100,000 population) was 2.7 according to the 2018
statistical yearbook. Interventions to prevent these deaths include; Installation of speed
governors into public transport buses to reduce roads accidents caused by over speeding, use
of cameras and speed radars by law enforcers and regular public sensitization campaigns.
Currently, there are 1,475 health facilities which include 8 referral hospitals, 4 provincial
hospitals, 36 district hospitals, 4 specialized hospitals, 504 health centers, 670 health posts, 5
private clinics, 135 dispensaries, 13 specialized clinics and 96 clinics. Significant efforts have been
made to increase health services at Sector and Cell level: there is at least one health centre per
Sector and the plan is to roll out one health post per Cell (the second lowest level of local
administration following the village). Access to health insurance has significantly improved (84
%), particularly for the poorest households. There are currently 1,392 medical doctors (one
doctor per 10,055 people and 10,975 nurses (one nurse per 1,094 people compared to the
World Health Organization target is one per 1,000).
Since 2007, Rwanda has implemented a national Community Health Worker (CHW) program.
The CHWs are recognized for their performance in community health mobilization, disease
prevention and control at the community level. An effective CHWs chain is one of the reasons
Rwanda achieved its health ambition in the past 10 years. To this effect, the decrease in under-
5 mortality has been attributed to the scaling up of this community health program, where
community health workers started managing and treating children at the grass root level for
selected most killer diseases. Every village (around 100–250 households) has four CHWs with a
total 45,516 CHWs deployed countrywide. At initial stage each village had 3 CHWs, two of
these, a man and a woman, are called binômes, and they focus primarily on case identification
and referral for a variety of diseases, as well as the treatment of childhood diseases like
pneumonia, diarrhea, and malaria, and community support for malnutrition. Each village has a
maternal health worker responsible for identification of pregnant women, antenatal care visits,
ensuring delivery at health facilities and follow up of newborn and mother in postnatal period.
Furthermore, in 2018, the country elected one more CHW per village raising the number to 4
in line with the Government priority of achieving universal health coverage. The fourth health
107
196
86
152
62
103
50
76
32
50
0
50
100
150
200
250
Infant mortality (1q0) Under-5 mortality (5q0)
RDHS 2000 RDHS 2005 RDHS 2007-08 RDHS 2010 RDHS 2014-15
Death per 1,000 Live births

58
worker is in charge of social affairs in the community and is responsible for the compilation of
performance-based financing reports. CHWs receive performance-based financing through
cooperatives.
Based on its past success, the Health Sector under the new Strategic plan (4th HSSP 2018/19-
2023/24) is proposing new priority orientation taking into account important changes in
epidemiology, maternal and child health, Human Resources for health , infrastructure and service
delivery linking it with Rwanda’s National Constitution and Vision 2050, NST 1, the Health
Sector Policy 2015, Universal Health Coverage (UHC) principles and the Sustainable
Development Goals (SDGs).The Objective is to ensure universal accessibility (in geographical
and financial terms) of equitable and affordable quality health services (preventative, curative,
rehabilitative and promotional services) .
Interventions and opportunities for accelerating progress
HSSP 4 will continue to ensure that all persons in Rwanda have access to equitable and quality
Maternal, Neonatal, Child & Community Health (MCCH) services; immunization coverage will
be consistently maintained around 95% (or more) with the Government meeting at least 30% of
the full cost of vaccines. Stunting will be reversed by implementing multi-sectoral interventions
described in SDG2; uptake of long-term methods in FP services will be increased by targeted
promotion activities; palliative services and health needs of the elderly are mainstreamed in the
essential package of care at the different levels, including the package at household level.
In tackling communicable and non-communicable diseases, emphasis will be to reduce prevalence
and incidence in morbidity / mortality through expanded, responsive and client centered
services; improved diagnostic capacity; control of risk factors and scaling up preventive efforts
related to life-style interventions (nutrition, sugar, exercise, alcohol, smoking). In health security,
HSSP 4 seeks to ensure that Rwanda is free of epidemic-prone diseases and public health threats
through building a sustainable, effective and efficient national surveillance, response and recovery
system.
The cost of implementing HSSP 4 has been computed using the OneHealth tool. At the end of
the period, the mean per capita cost would be 60 USD per capita, up from per capita in 2018 or
36 USD per capita during the last health sector strategic plan.
Innovations
Rwanda lifesaving blood and medicines deliveries using drones
Rwanda delivers lifesaving blood and medicines to about 21 regional hospitals
launching more than 50 drones daily for on-demand deliveries. Remote clinics can
now place orders for lifesaving blood via text message, with drones dispatched from
fulfillment centers dotted around the country to deliver it. Since its launch, drones
have flown over 300,000 miles on more than 10,000 flights, delivering thousands of
units of blood.

59
Challenges
One serious drawback over the last years was the upsurge of Malaria cases that started in the
end of 2012 and continues till today. Malaria incidence rate stands at 308 to 1,000 people (Malaria
Annual Report 2015-2016). Experts attribute this upsurge to several factors occurring not only
in Rwanda, but also wider in the sub-region, such as vector density and resistance, climate change
(increase in temperature and rainfall), human behaviour and non-universal coverage of effective
interventions, despite a sustained and intensive effort by the Government. By 2024, the target is
to decrease Malaria incidence from 308/1,000 to 122/1,000 population and the mortality due to
malaria in health facilities to decrease by 40%. The Government will ensure sustained universal
coverage of Long Lasting Insecticide Nets (LLNs): UHC (1 net per 2 people), improve malaria
vector control through implementation of Indoor Residual Spraying in high burden districts and
early diagnosis and treatment. Furthermore, the HSSP4 targets to reduce the prevalence of Soil
Transmitted Helminthiasis (STH) from 45% to less than 20% by 2024. Meeting these targets
requires strengthening inter-sectoral collaboration and partnership for effective Malaria and
Neglected Tropical Diseases (NTDs) prevention and control interventions.
Under-five mortality remains high at 50 deaths per 1,000 live births compared to the SDG target
of 25 deaths per 1,000 live births. Moreover, the Under-five mortality is twice as high in the
poorest quintile than in the richest (84 per 1,000 live births compared to 40 per 1,000 live births, respectively). Declines in neonatal mortality have been only modest, indicating that further
investment in neonatal and antenatal care is required as well as strengthening the quality of
assisted delivery services.
After increasing from 17 % in 2005 to 52% in 2010, the use of any method for family planning
only changed slightly in 2014-15 (53 %). Use of any modern method for family planning also
increased dramatically between 2005 and 2010 (from 10 % to 45 %) and then rose slightly in
2014-15 (48 %). To address the slowing adoption of contraceptive use, the government will
continue to implement community peer education system promoting the continuous use of long-
acting and permanent methods of FP services and emergency contraceptives.
Specialized physicians represent a small portion (24%) in 2015 of the total physicians in clinical
practice in the country. Additionally, specialized physicians are mainly located in and around
Kigali City whereas 76% of general practitioners are distributed in district hospitals in the rural
areas. The process for continuous learning of the graduates to have specialization at all levels of
health professional cadres is still low (A0/A1 nurses represent 31% of all nurses, and specialized
physicians 24% of all physicians). The HRH quality improvement targets both health care
providers and health managers and is conducted in close collaboration with the Ministry of
Education, in charge of overseeing the content of curricula. In parallel, collaboration with various
top international universities, which provide every year professors to teach and train Rwandan
doctors at specialization level has been initiated in order to increase the number of qualified and
specialized doctors.

60
3.6.3. SDG 5 Achieve gender equality and empower all
women and girls
Status and trend
Gender Equality and Women Empowerment (GEWE) is one of the areas in which Rwanda is
globally recognized for its outstanding progress. In Rwanda, promoting gender equality and
empowerment of women is primarily a human right issue, encompassing women and girls' equal
rights, combatting discriminatory practices and challenging the roles and stereotypes that
propagate inequalities and exclusion.
The Rwanda’s strong political will to mainstream gender into Government programs is
underpinned by institutional and policy frameworks that have been key to Rwanda’s progress
in addressing gender inequalities. Over the past two decades, socio-economic outcomes have
improved significantly and the country has emerged as a regional and global leader in advancing
gender equality. With regard to legal framework (Indicator 5.1.1), the Constitution of the
Republic on Rwanda enshrines the principles of gender equality and women’s rights and
provides for a minimum of 30% quota for women in all decision-making organs. Rwanda has
also enacted a number of legal instruments for strengthening GEWE, including: the Organic Law
N° 12/2013/OL of 12/09/2013 on State Finances and Property, the Law N° 43/2013 of
16/06/2013 Governing Land in Rwanda and the Law Nº27/2016 of 08/07/2016 Governing
Matrimonial Regimes, Donations and Successions. Furthermore, gender equality is a cross-
cutting area across Government policies and strategies at national and sub-national levels.
With regard to violence (Indicators: 5.2.1), GBV has been criminalized and is therefore
punishable under Law No 68/2018 of 30/08/2018 determining offenses and penalties for child
defilement, marital rape, sexual violence and harassment of a spouse. Data from the DHS
2014/15 shows that the proportion of ever-partnered women and girls aged 15 years and older
subjected to violence in 12 months preceding the survey are still high, 17.6% physical, 8.3%
sexual and 18.5% emotional violence by a current or former intimate partner. In addition, 7.6%
of women were victim of sexual violence from a person other than intimate partner (Indicator
5.2.2). Health wise, 83% of women reported that they alone or with their spouses take decision
on their reproductive health, while 48% use a modern method of contraception. These statistics
call for more efforts to address sexual gender based violence (SGBV) in both public and private
spaces, which the Government of Rwanda together with partners are striving to solve.
The Government of Rwanda has continued to strengthen systems providing integrated services
for victims of SGBV through Isange One Stop Centres (IOSCs), which have been increased
from 23 to 44 over the last three years of SDGs implementation. IOSC provide comprehensive
services to victims of GBV under the same roof free of charge on a 24 hours 7 days basis. These
services include medical care, psychosocial support, legal services, relief, temporary shelter and
re-integration. Following a successful scale up of IOSCs services to District hospital level in
attempt to bring IOSC services closer to the community, the Government has started to

61
implement the scale up plan of IOSC services to at least Health Centre level. Once completed,
the number of IOSC is estimated to increase to close to 500.
At the community level, there are structures like “Umugoroba W’Ababyeyi“(Parents
Evening), “Inshuti z’Umuryango“(Friends of the Family) that gather on a day to day basis to
discuss the wellbeing of families where GBV and child abuse issues are addressed among other
issues. With regard to GBV data collection, an integrated Gender Based Violence Information
Management System (GBVIMS) is under elaboration to regularly generate GBV data for
evidence-based decision making and quality service delivery to GBV and child abuse victims.
Women’s empowerment and participation in decision-making is mainly captured by the ratios
of women in parliament, ministerial positions, and other positions in various structures of
governance both in public, private, and civil society entities. Further, the Government of
Rwanda has established the National Women Council with structures from national to village
level and over 122,059 committee members to mobilize and empower women to participate in
all national development programs. Women’s representation in the Cabinet has reached 50%
(2019) from 36.8% in 2014. In the on-going term of 2018-2023, women parliamentarians stand
at 61.3% in the lower chamber and 38% in the Senate. At decentralized levels, women’s share
in the leadership has improved during the period 2016-2018 from 16.7% to 26.7% among
District Mayors and 45.2% in District Councils. According to the 2018 LFS, the proportion of
women in managerial positions (Indicator 5.5.2) represented 34% with 33.5% of Chief executives,
senior officials and legislators and 34.5% Administrative and commercial managers.
DHS5 also suggests that the proportion of women aged 15–49 years who make their own
informed decisions regarding the use of any contraceptive methods was estimated at 53%
(Indicator 5.6.1).
With regard to land ownership (indicator 5.a.2), article 4 of Law N° 43/2013 of 16/06/2013
governing land in Rwanda, guarantees equal right to land and stipulates that all forms of
discrimination, such as that based on sex or origin, in relation to access to land and the enjoyment
of real rights shall be prohibited. The right to land for a man and a woman lawfully married shall
depend on the matrimonial regime they opted for. In this regard, data from the Rwanda Natural
Resources Authority shows that married couples represent 58.3% of the land owners, while
women owning land alone represent 24% of land owners, and men owning land alone represent
14%.

62
Figure 12: Land Ownership
Source: RNRA, Administrative Data, 2019
The ownership of mobile phones has improved in Rwanda with 67% of the households owning
at least one mobile phone in 2016/17 compared to 64% in 2013/14. Mobile telephone
subscription reached 77% as of end March 2019.
Figure 13: Mobile telephone subscription per 100 inhabitants
Source: SDG tracer and Monthly RURA statistics
Rwanda developed a Women Empowerment through ICT (WEM-TECH) strategy to increase
women’s access and usage of technologies. Initiatives were put in place to set up a friendly
business environment including ICT tax exemption, which contributed to phone and Internet
penetration, 76% and 45.5% respectively and also increased women’s access to mobile phones
from 35.1% in 2010 to 84%6 in 2016. ICT awareness campaigns, mentorship, coaching programs
and career guidance increased female upper secondary school students in Sciences from 53.7
6 Finscope 2016
24%
14%58.30%
Owned by women only Owned by men only Owned by married couples
34.6
42.3
52.7
60.5
68.375.3 74.9 72.2
77.1
0.0
10.0
20.0
30.0
40.0
50.0
60.0
70.0
80.0
90.0
2010 2011 2012 2013 2014 2015 2016 2017 Mar-19

63
% in 2014 to 55.2 % in 2017. Initiatives such as Viziyo, Digital Ambassadors program, ICT Bus,
Service Access Points, Smart Village, TechKobwa7, Miss Geek competition, Girls in ICT, and
STEM Camps helped women to join and embrace digital skills and access different opportunities
including education, health and financial services among others. The HeForShe national impact
commitments to bridge the gender digital divide and attain parity in ICT access, usage and
innovation and tripling girls’ enrolment in TVET to advance women’s employment opportunities
by 2020 has been mainstreamed and catered for in national plans and budget.
With regards to financing for gender equality, the Government of Rwanda in partnership with
other stakeholders has institutionalized Gender Responsive Budgeting (GRB) programme that
constitutes a mandatory annex (Gender Budget Statement) to the budget framework paper by
all budget agencies and annually submitted to the Ministry of Finance and Economic Planning
and the Parliament for budget negotiations and approval. This has enabled public institutions to
use public resources in a manner that benefits both men and women and boys and girls.
With regards to gender mainstreaming, collection of gender statistics and disaggregated data,
through GRB programme, the Government of Rwanda in partnership with the University of
Rwanda and other stakeholders established a Gender Economic Policy Management course to
enhance skills of experts and policy makers in gender economic policy management and analysis.
Furthermore, 11 out of 16 sectors have developed and implemented gender sector
mainstreaming strategies. NISR in collaboration with the National Gender Machinery and other
partners regularly generate gender statistics for evidence-based policy and decision making. The
3 - year regular household and living conditions survey (EICV) has a specific Gender Thematic
Report on relevant gender statistics. Other sources of gender disaggregated data include among
others the Gender Management Information System (GMIS), Gender Sector Profiles as well as
administrative data from institutions and organizations’ reports with inclusion of relevant
gender specific information needed to inform policy and decision makers on issues of gender
equality and empowerment of women. Gender mainstreaming initiatives under private sector
have been undertaken through the gender equality seal.
7 Kobwa means girl in Kinyarwanda

64
Challenges and opportunities for accelerating progress
Furthermore, capacity for collecting sex-disaggregated data and conducting gender analysis at
various levels and across sectors to inform policy and program design and implementation needs
to be strengthened.
Increasing opportunities for women to access and use financial schemes and strengthening
women’ employability skills will continue to be promoted to improve women’s role in the
national socio-economic transformation.
The strong engagement of men in gender equality dialogues and participation in activities
traditionally seen as women’ issues such as family planning, child care etc., will continue to play
an important role in accelerating implementation of gender equality in Rwanda.
Ensuring that gender equality dimensions are systematically mainstreamed in different
accountability mechanisms such as IMIHIGO (performance contracts), public hearings, etc., will
ensure ownership and gender responsiveness by different implementing agencies.
3.6.4 SDG 9. Build resilient infrastructure, promote
sustainable industrialization and foster innovation
Status and Trends
Rwanda has a Vision of becoming an upper middle-income country by 2035 and high-income
country by 2050 through transforming its economy from agrarian base to a more industrial,
diversified and knowledge-based economy. The medium-term plans and sector policies
prioritize economic transformation as an important strategic pillar. This objective means that
The Gender Equality Seal for private and public institutions
Rwanda is recognized as one of the global champions in gender equality as confirmed by the global gender gap report 2018,
which ranked Rwanda number 6 globally. While a lot of progress was recorded particularly in the public sector, there are persisting
challenges particularly in the private sector. Evidence shows that women are paid 13 % lower than men, partly resulting from the
fact that men spend more time on economic activities and less time on domestic activities compared to women. As a matter of
fact, according to EICV 4, women spend 25 hours per week on domestic duties and 28 hours per week on economic activities
while men spend only 8 hours per week on domestic duties and 35 hour per week on economic activities. In 2017, Rwanda
launched the Gender equality Seal certification initiative, which enhances the capacities of private companies and public institutions
in gender analysis and gender mainstreaming to ensure they duly implement gender equality commitments. It seeks to support
the private sector to achieve sustainable development by reducing gender gaps and promoting both gender equality in the
workplace and women’s economic empowerment. Giving equal opportunities to both men and women is a good strategy to increase
productivity and sustain economic returns for participating companies and institutions.
The initiative is implemented by the Gender Monitoring Office (GMO) in partnership with the United Nations Development (UNDP)
and the Private Sector Federation (PSF). 36 private sector companies and 2 public institutions have joined the initiative. It supports participating institutions in their efforts to mainstream gender equality and women empowerment along the six key pillars of the Gender Equality Seal:
✓ Eliminating gender-based pay gaps; ✓ Increasing women’s role in decision-making; ✓ Enhancing work-life balance;
✓ Enhancing women’s/men’s access to non-traditional jobs; ✓ Eradicating sexual harassment at work; and ✓ Using inclusive non-sexist communication.

65
significant infrastructure development is needed to propel the economy to higher value sectors.
Within this strategic policy framework, Rwanda has been pursuing investments to increase the
domestic connectivity of the Rwandan economy through investments in hard and soft
infrastructure; increase the external connectivity of Rwanda’s economy and boosting exports;
increasing investment in priority sectors; facilitating urbanization and promoting secondary
cities; and pursuing a ‘green economy’ approach to economic transformation.
Recognizing the central role infrastructure plays in economic transformation, Rwanda made
continuous investments to unlock constraints for economic transformation, mainly in energy,
transport and logistics and services. While enhancing the efficiency of its transportation and
logistics services, the country invested jointly with the private sector to building a strong
information and communication infrastructure. Furthermore, to fill the immediate need to
create appropriate infrastructure for industrialization, Rwanda is developing Special Economic
Zones (SEZs) and industrial parks as an economic policy tool that promotes private investment,
industry and export growth. The country also set a target for creating job opportunities outside
the agriculture sector with special focus on creating decent and productive jobs (1.5 million
jobs between 2017 and 2024). It also coupled its efforts to develop infrastructure with creating
conducive environment for business. Rwanda has made steady progress in implementing
reforms aimed at minimizing regulatory hurdles for business start-ups, guiding and mentoring
entrepreneurs through the start-up administrative process, as well as building entrepreneurs’
confidence in the regulatory environment. Rwanda promotes access to finance to
entrepreneurs through innovative mechanisms. As a result, Rwanda was ranked second in Africa
in the World Bank Doing Business Report of 2017and has maintained such a position over the
last few years. The economic transformation effort is further facilitated by an ambitious policy
of ‘Made in Rwanda’ that seeks to improve perceptions of Rwandan products within Rwanda,
promote nascent industries, and boost productivity of exporting sectors across regional value
chains. Thus, the progress made in this goal is at large positive and encouraging.
Rwanda has been experiencing impressive economic growth in the last decade, primarily driven
by the service, agriculture and mining sectors. Underlying such impressive growth, concerted
effort to connect the majority of the Rwandan population living in rural areas to markets and
major cities is yielding significant results. In 2016, the proportion of the rural population who
live within 2 km of an all-season road (Indicator 9.1.1) reached 63%. Recently completed impact
evaluation shows that investments in rural roads are extremely beneficial to households who
are poor with an estimated increase in incomes of nearly 20% in the most remote villages.
Encouraged by the significant progress, the Government of Rwanda is engaged in an ambitious
rural road improvement program targeting 21 districts across all 4 provinces. The program aims
to bring a motorable road within 2 km of all farms in Rwanda by 2025.
In further improving infrastructure service, Rwanda has invested heavily in developing its air
transport infrastructure services. As a result, Rwanda has made significant progress towards
the target of increasing passenger and freight volumes (Indicator 9.1.2), with RwandAir’s
passenger numbers increasing from 377,327 in 2012 to 926,571 as of 2017/18. The airline has
increased its fleet size while its network destinations have increased to 27. RwandAir seeks to
further increase its network across Africa and beyond. Furthermore, visible progress has been

66
registered in developing its air transport infrastructure. Kigali International Airport has been
upgraded and renovated to accommodate traffic growth; Kamembe airport was also upgraded
with the extension and resurfacing of the runaway; the construction and enabling works for the
new Bugesera Airport is underway. Similarly, the country is strategically investing in railway to
promote connectivity and overcome the significant challenge of being landlocked. In this
regards, Dar-es-Salaam-Isaka- Kigali/Keza-Musongati (DIKKM) Railway Project jointly
implemented by the governments of Tanzania, Rwanda and Burundi is still underway.
In close collaboration with private sector, Rwanda invested significantly to promote universal
and affordable access to Information, Communication and Technology (ICT). Rwanda aims at
scaling up broadband coverage to all citizens through the roll out of the 4G network, promoting
internet of things and increase smart devices penetration as part of the National Strategy for
Transformation (NST I). The ICT sector in Rwanda recorded a general growth in terms of
subscriptions, revenues and investments since its liberalization. The percentage of the
population covered by a mobile cellular network (indicator 9.c.1) has expanded rapidly reaching
96.6 % in 2018/19 for 4G technology from 89% in 2017. The country has reached 99 % for
the 2G and 3G technologies.
Internet subscriptions reached 6,149,425 (close to 50% of the population) as at December 2018.
Mobile-broadband internet subscriptions reached 28 per100 in 2017.
Building on progress so far, Rwanda is promoting industrialization and attaining a structural shift
in the export base to high-value goods and services with the aim of growing exports by 17%
annually by 2024. Rwanda made some progress in bringing structural transformation, with
manufacturing value added as a proportion of GDP (Indicator 9.2.1) reaching 6% in 2017/18;
while industry sector contribution to GDP reached 17.0 % in the same period. In connection
to this, the contribution of manufacturing employment as a proportion of total employment
(Indicator 9.2.2) reached 6.4% in 2017/18. In terms of promoting research and development as
a key to fast-tracking Rwanda’s economic transformation especially in technology for industrial
development, increasingly significant resources are being allocated.
Figure 14: Industry and Manufacturing Value Added as a share of GDP
Source: NISR: National Accounts Data, 2018
0%
2%
4%
6%
8%
10%
12%
14%
16%
18%
2006-07 2007-08 2008-09 2009-10 2010-11 2011-12 2012-13 2013-14 2014-15 2015-16 2016-17 2017-18
INDUSTRY TOTAL MANUFACTURING

67
With the development of industrial parks and Special Economic Zones (SEZs), Rwanda aims at
developing selected priority value chains including agro-processing, construction materials, light
manufacturing, meat and dairy, leather, textiles and garments, horticulture, tourism (including
MICE tourism), knowledge-based services, logistics and transport. By 2024, Rwanda aims at
creating 1,500,000 (over 214,000 annually) decent and productive jobs; of which significant
share will be manufacturing employment.
Challenges and Opportunities to accelerate Progress
While Rwanda has made significant progress in developing its infrastructure for economic
transformation, challenges remain. Limited physical infrastructure – exacerbated by hilly and
mountainous topography - remains a major constraint for smallholder farmers to increasing
their access to markets, enhancing their competitiveness and improving their incomes and
livelihoods. This is also affecting the pace of structural transformation.
While strategic focus is being accorded to expand export-oriented industrialization; the pace
of growth in this sector is yet to reach the desired levels. This is largely due to low levels of
productivity in agriculture; comparable production capabilities within the East African region
that constrain the competitiveness of Rwandan products, recent global commodity price
fluctuations and the limited capabilities for rapid industrialization both at private and public
sector levels.
To further accelerate progress in this Goal, Rwanda will need to sustain the investment in
infrastructure while balancing the investment needs with stable macroeconomic framework. In
addition, there will be need to attract additional investments, largely from private sector in
manufacturing and high value-added service sector. Rwanda will further need to exploit
untapped regional and global market potential through economic specialization and economies
of scale. Enhancing labor productivity across sectors is key for rapid transformation of the
economy. In this regard, leveraging investments in social sectors, particularly investments on
human development will be fundamental.
Rwanda is positioning itself to benefit from new technologies associated with the fourth
industrial revolution by preparing its population to tap into the opportunities this new wave
presents and manage associated risks. Rwanda will seize regional trade opportunities through
intraregional trade and participation in regional value chains connected to the global market.

68
Chapter IV. Means of Implementation
To meet the ambitious goals of NST1 and SDGs in a meaningful way will not be without its
challenges. Achieving the SDG will depend on Rwanda’s ability to meet annual growth rate of
above 10% according to the DFID assessment on mobilizing new resources for Development
finance (NST1 growth rate target is 9.1 %), which will require investment rates between 35%
and 40% of GDP. This represents a substantial increase from Rwanda’s current investment rate
of approximately 26%. Public revenues in Rwanda have mainly been driving the economic
growth in the past two decades. Various reforms were implemented to build the country tax
system including the creation of Rwanda Revenue Authority (RRA) in 1998, replacement of an
inefficient sales tax with a more modern value-added tax (VAT) in 2001, increasing taxpayer
outreach and raising the number of registered taxpayers, providing better services, enhanced
use of information technology (IT) and improving the use of risk management in conducting
taxpayer audits.
Furthermore, recent tax policy changes involving the ‘Electronic Billing Machine (EBM) for all’
an internet based electronic billing machine client software offered for free to all VAT registered
taxpayers, the enactment of the law amending excise duties and amendments to taxes on
income involving capping of management fees to 2 %, excluding liberal professionals from lump-
sum/flat regime and the implementation of the transfer pricing guidelines which will help the
Rwanda Revenue Authority conduct proper audits of multinational companies ( banks,
telecoms, insurance and mining companies) are expected to boost the revenue collections in
2018/19. The proportion of domestic budget funded by domestic taxes have increase from
62.6% in 2016/17 reaching 67% in 2018/19 (indicator 17.1.2)
Attracting the private sector investments in critical development sectors is expected to have a
pivotal role in the delivery of the SDGs through promoting the Public Private Partnership (PPP)
and joint venture modalities. Consequently, the government of Rwanda enacted the PPP LAW
Nº14/2016 of 02/05/2016 and in 2018 the PPP guideline was developed to facilitate its smooth
implementation. The private sector is still small and predominantly dominated by micro, small
and medium size enterprises and accounts for 93% average capital employed of RwF 16.3 million
(USD 26,080), (AfDB, 2013). Although, the volume of FDI have seen increase from USD 342.3
million in 2016 to USD 356.4 million in 2017, nevertheless FDI contribution to GDP still remains
low at 3%. Therefore, the government is considering the partnerships, including public, public-
private and multi-stakeholder modalities as an effective vehicle to appeal to the Foreign
investors as well as boosting the private sector to achieve Rwanda’s vision of becoming a strong
private led economy in 2030.
Furthermore, the Government is leveraging on various other financing mechanisms to raise
additional public and private finance such as the Green Financing and Climate change financing,
remittances and blended Finance.

69
Rwanda is one of the few countries that have managed to establish a specific fund for
Environment and Natural Resources. The government of Rwanda created the Environmental
Law in 2005 that provided for the creation of FONERWA. In 2012, the government created
the Green Fund (FONERWA) as a tool to implement the GGCRS. Rwanda's Green Fund
(FONERWA) is a ground-breaking environment and climate change fund. Its purpose is to be
the engine for the next 50 years of
green growth in Rwanda, while serving
as a touchstone for Africa and the rest
of the world. Its strategy is to provide
unheralded technical and financial
support to the best public and private
projects that align with Rwanda’s
commitment to a green economy.
FONERWA provides loans and grants
to government institutions, private
sector and civil society organizations
for green projects. Since its creation,
FONERWA has mobilized more than
170.1 million USD from its
development partners and financed 33
green projects.
FONERWA in partnership with UNDP
launched Online Centre of Excellence
tool for knowledge sharing which
gathers knowledge products from
agencies under Ministry of
Environment and FONERWA
stakeholders as well as partners. In
addition, FONERWA through the
South-south cooperation hosted and shared its experiences with countries that intend to
replicate the FONERWA model in Uganda, Ethiopia, South Sudan, Malawi, Burkina Faso and
Zimbabwe.
Remittances can constitute an important source of finance for private sector, especially as they
may be available in the local currency. World Bank (2010) recognized that in 2010 the stock of
emigrants was 263.4 thousand (2.6% of total population) and increased to 345.8 thousand in
2013. Also, according to the National Bank of Rwanda (BNR), in 2017 the remittance inflows
accounted for 207.6 million of USD compared to 166.2 million USD in 2011. The Government
of Rwanda has demonstrated to have clearly acknowledged the role and the potential of
Diaspora, first of all by sanctioning some inviolable rights of Rwandans emigrants (articles 7,
23 and 24 of the Rwandan Constitution) and also by developing a defined Diaspora Policy
(Ministry of Foreign Affairs, 2009).
Public-Private Partnership on
electronic waste management creating
job and protecting the environment
In 2014, in partnership with the Ministry of
Trade and Industry, FONERWA invested
close to USD 1.5 million to establish an e-
waste recycling facility, which was later on
leased out to EnviroServe Rwanda. Apart
from reducing issues related to e-waste to
the country, the company creates green jobs
and injects 5% of its revenue in FONERWA.
EnviroServe Rwanda has the capacity to
employ more than 1,000 people- making
it the second state-of-the-art e-waste
dismantling and recycling facility in Africa.
Since it began operations, the e-waste
recycling facility has processed more than
434 tons of materials and prevented 870 tons
of carbon dioxide equivalent emissions from
entering the atmosphere.

70
AGDF Corporate Trust limited (previously Agaciro Fund) has raised RwF 62 billion since its
creation in 2012 and is Rwanda’s first sovereign wealth fund. It currently invests in government
bonds and short-term bank deposits (earning 8-12 per cent interest).
Spending Needs to Reach the SDGs goals
The total costs to deliver on NST1 which covers part of the first 7 years of the SDGs period is
estimated to range from 43 percent of GDP in FY16/17 to 47 percent of GDP in FY23/24. The
International Monetary Fund in joint collaboration with AFR – FAD conducted a costing
assessment on the SDGs selected sectors with the involvement of stakeholders from the
government (Education, Health, Infrastructure and Finance Ministries) and DPs (UNDP, World
Bank, UK DFID, USAID, SDG Center for Africa, Enabel, UNICEF). All line ministries have
already produced sectoral strategies and preliminary estimates of sectoral spending needs for
achieving the NST1. Several other costing exercises have been conducted by individual line
ministries with the support of the DPs such as the Onehealth for the Ministry of Health,
Education budgeting and WASH costing among others.
According to the same IMF assessment, the overall additional spending needs that was estimated
to achieve a higher SDG implementation by 2030 for these selected sectors are substantial and
reach about 20 % of GDP. The breakdown of costing per each selected sector is provided under
table 11. Furthermore, in the following sub- section details are provided tallying both NST1
preliminary costing and the IMF costing exercise.
Table 11: Estimated Spending Needs in Rwanda
(Additional percent of GDP per year)

71
Education
The education sector budget for the year 2017/18 is estimated to be 13.1% (241 billion RWF) of the
Government’s national budget which is slightly under the international guideline of 15 -20%. Out of this
budget the biggest share is allocated to primary education with 40% followed by 30% for secondary
education, 12% for higher education and TVET and 1.7% for pre-primary level.
By 2030, the Rwandan government plans to double current spending in education, to reach 6.3 % of
GDP from 3.2 % (2017). The additional spending will be earmarked for hiring more qualified teachers
to reduce the student-to-teacher ratio, especially at the primary level, where repetition rates are higher.
However, according to the 2017 IMF study on SDGs spending needs, Rwanda requires 4% of GDP in
addition to the set 6.3% reaching at level of 10.7% of GDP if it is to attain the level of peer countries
with better performance by 2030 (figures 15). Hence the overall education spending would need to
increase by 7% of GDP.
Figure 15: Education Spending Needs – Comparison of Authorities and IMF Estimates
(current USD per student and percent of GDP)
Source: IMF staff calculations on Authorities’ NST and World Bank and UN data.
Note: Blue bars are IMF estimates of what Rwanda would need to spend in order to achieve a high performance in education,
either as early as 2024 or in 2030. They show two point-estimates of spending needs and do not illustrate a spending path.
Health
Rwanda’s health sector budget has increased from 157.5 billion RWF in 2013/14 to 193.6 billion
RWF in 2017/18. The government has attained the Abuja declaration of allocating 15% of the
national budget to health sector (HSSP 4)8. Moreover, the use of home-grown approaches using
health clinics as the first line for service delivery in rural areas and the introduction of
technology including the use of drones to deliver lifesaving blood in remote and inaccessible
8 Data source: The 4th Health Sector Strategic Plan

72
areas have enabled the sector to efficiently use public resources to improve access and quality
of healthcare. The cost of implementing HSSP4 has been projected to reach RWF 4,290,170.71
million (4.29 trillions) for the 7 years of the NST1 period. The mean per capita spending is
expected to reach 60 USD per capita at the end of year 7 from 36 USD per capita in 2018.
According to the IMF analyses the required per capita spending should double to 73 USD
instead of 60 USD as estimated in NST1 (figure 16) if Rwanda is to achieve its health ambition.
Figure 16: Health Public Spending Needs* – Comparison of Authorities and IMF Estimates
(current USD per capita and percent of GDP)
Source: IMF staff calculations on authorities’ NST and WHO and UN data.
Note: Blue bars are IMF estimates of what Rwanda would need to spend in order to achieve a high performance in health, either as early as
in 2024, or in 2030. They show two point-estimates of spending needs and do not illustrate a spending path.
*: IMF Estimates are given for the public health sector only.
Road: The overall cost of the transport sector under the NST1 period is projected to reach
RWF 2,408,587.14 million. The Transport Sector proposed budget exceeds the estimated IMF
budget by 1% of GDP per year.

73
Figure 17: Road Spending Needs – Comparison of Authorities and IMF Estimates
Water and Sanitation (WATSAN):
The total cost to deliver the WATSAN 7 years program under NST1 is estimated at 795 billion
Frw, which corresponds to approximately 935 $USD millions and the higher share of spending
(26%) is allocated towards improving and sustained urban and rural households’ access to safe
drinking water. Based on the World Bank WASH costing model, Rwanda would need to spend
4.5% (figure 18) of GDP per year to safely provide water to all households and provide fixed-
point latrines to all. The large share of spending is accounted for a growing urban population
with increased water demand.
Figure 18: Water and Sanitation spending Needs- comparison of Authorities and IMF (% of GDP)
Source: IMF staff calculations on World Bank Global WASH Cost and authorities’ data.

74
Electricity
The total cost for the Energy Sector under the NSTI period is estimated at $3.3 billion for the
three subsectors: electricity, biomass and petroleum with the largest expenditure ($2.8 billion)
going towards electrification. The large cost attached to Electricity is due to the government
plan to building new power stations and transmission lines. NST 1 and Energy Sector Strategic
Plan estimates 52% on-grid and 48% off-grid, and the IMF projects that electricity will increase
at the annual rate of (reaching 730 kWh in 2030 from an average of 238 kWh in 2016), universal
access cost is estimated at 2% of GDP.
Challenges
Mobilizing commercial investment in Rwanda including Foreign Direct Investment is hampered
by the fact that the country is landlocked presenting challenges due to the high cost of transport
and longer time required both at the importation of raw materials as well as exports of finished
goods.

75
Chapter V. Conclusion
The Government of Rwanda has taken important steps towards an effective domestication of
the Agenda 2030 by integrating and localizing the SDGs in the Vision 2050, the medium-term
development strategy, the National Strategy for Transformation, NST 1 (2017-2024) and
related sector and district strategies following the roadmap approved by the Cabinet in
December 2015.
Accordingly, the ambitious nature of SDGs is fully reflected in the transformational spirit of
NST 1 across all its three pillars (economic, social and transformational Governance) that
mirror the three dimensions of sustainable development.
The Ministry of Finance and Economic Planning is mandated to coordinate SDGs
implementation and is supported by a multi-stakeholder structure that not only allows for an
all government approach but also encompasses other players such as development partners,
civil society, private sector, citizens among others.
This VNR highlights challenges, lessons learned and emerging issues in order to guide policy and
program direction for accelerated implementation of SDGs in Rwanda.
The VNR findings underscore the commitment of the Government of Rwanda to implementing
the SDGs taking into account key principles such as leaving no one behind and gender
mainstreaming. The SDGs indicators are mainstreamed in the mid-term strategies at national
and subnational levels, which requires an overarching approach to address the interlinkages and
enhance cooperation among stakeholders.
This VNR also suggests that sustained inclusive economic growth and human development are
and will remain at the center of the Government of Rwanda’s interventions aiming at
accelerating the implementation of SDGs. In this regard, the incorporation of SDG indicators
into the home-grown planning and implementation tools, such as the Imihigo (performance
contracts) at national and district levels will strength ownership and enhance fast delivery of
the Agenda 2030.
The review also highlights pivotal role of civil society organizations, private sector players and
the development partners in delivering SDGs and other national priorities. This is in addition
to the continued need for innovative approaches and strategies for resource mobilization
(domestic and external) for the implementation of the SDGs.
More efforts are still needed to strengthen coordination, monitoring and evaluation system for
SDGs and in addressing the prevailing data gaps across sectors. In addition, addressing child
malnutrition, poverty eradication and provision of decent and productive jobs especially for
youth and women will continue to be the focus of NST 1.
Rwanda will build on its previous success in developing innovative policies and leverage on
Home-Grown Solutions that have multiple development effects while “leaving no one behind”.
The Agenda 2030 requires strong and committed leadership and it is in this same spirit that

76
Rwanda renews its commitments to accelerating progress through carrying out various far-
reaching reforms and strengthening cooperation with all stakeholders. The hosting of the SDG
Center for Africa with the mandate to support the entire continent is testament to this political
commitment to deliver on the Agenda 2030.
Lessons learnt
1. Visionary and committed leadership is an important driver of the intended socio-
economic transformation and the delivery of the Agenda 2030.
2. Rwanda has learnt that adopting an integrated approach for planning, delivering and
monitoring of interventions is pivotal for addressing poverty and malnutrition related
challenges. The establishment of NECDP and the multi-sectoral strategy for eliminating
extreme poverty are evidence of how different sectors have come together to address
issues of malnutrition and extreme poverty.
3. Rwanda has also learnt that building on the Home-Grown Solutions, rooted in the
Rwandan culture, resource-efficient and adapted to the national context allows popular
ownership and participation and ensures effective and faster delivery of development
and strengthens accountability.

77
References 1. African Union, Bi-annual Review for transformation of agriculture, 2017
2. Iinternational Monetary Fund (IMF)-Spending Needs for Reaching the SDGs, 2018
3. Ministry of Finance and Economic Planning: Poverty Reduction Strategy Paper I, (2002-
2006), 2002
4. Ministry of Finance and Economic Planning: Rwanda Private Sector Financing Map
5. Ministry of Finance and Economic Planning: Rwanda Philanthropy Partnerships and
Outreach Strategy Report
6. Ministry of Finance and Economic Planning: Economic Development and Poverty
Reduction Strategies (EDPR1), 2007
7. Ministry of Finance and Economic Planning: Economic Development and Poverty
Reduction Strategies (EDPR2), 2013
8. Ministry of Finance and Economic Planning: External Development Finance Report
(2017/18)
9. Ministry of Finance and Economic Planning: Budget Framework Paper 2019/20-2021/22
10. Ministry of Agriculture and Animal resources: Strategic Plan for Agriculture
Transformation IV, 2018
11. Ministry of Agriculture and Animal Resources & National Institute of Statistics of Rwanda,
Comprehensive Food Security & Vulnerability Analysis,2018
12. Ministry of Education: Education Sector Strategic Plan (2018/19-2023/24), 2018
13. Ministry of Education: Education Statistics (2016,2017,2018)
14. Ministry of Education: Revised Special Needs and Inclusive Education Policy, 2017
15. Ministry of Public Service and Labour: National Employment Program, 2014
16. Ministry of Public Service and Labour: Revised National Employment Policy, 2019
17. Ministry of Environment: Green Growth and Climate Resilient Strategy, 2014
18. Ministry of Environment: National Land Policy, 2019
19. Ministry of Environment: Revised National Environment and Climate Change Policy, 2019
20. Ministry of Environment: National Strategy for Climate change and Low Carbon
Development, 2011
21. Ministry of Gender and Family Promotion: Rwanda Country Strategic Review of Food and
Nutrition Security, 2018 22. Ministry of Gender and Family Promotion: National Early Childhood Development Policy
Strategic Plan (2016-2021)
23. Ministry of Gender and Family Promotion: Minimum Standards, Norms and Guidelines for
Early Childhood Development Services In Rwanda, 2018
24. Ministry of Emergency Management, annual reports (2016-2018)
25. Ministry of Health: Health Sector Strategic Plan (2018/19-2023/24), 2018
26. Ministry of Health: Health Information Management System, 2016
27. Ministry of Health: Health Sector Policy, 201
28. Ministry of Health: Rwanda National Malaria progress Annual Report (2017-2018), 2017
29. Ministry of Infrastructure: National Urbanization Policy, 2015
30. Ministry of Infrastructure: National Housing Policy, 2015
31. Nabalamba, A., Mubila, M., Alexander, P. Climate Change, Gender and Development in
Africa. African Development Bank, 2011.
32. National Institute of Statistics of Rwanda: Statistical yearbook 2015, 2015
33. National Institute of Statistics of Rwanda: Statistical yearbook 2017, 2017

78
34. National Institute of Statistics of Rwanda: Integrated Households Living Conditions
Survey-3, 2010/11
35. National Institute of Statistics of Rwanda: Integrated Households Living Conditions
Survey-4, 2013/14
36. National Institute of Statistics of Rwanda: Integrated Households Living Conditions
Survey-5, 2018
37. National Institute of Statistics of Rwanda: Demographic and Health Survey, 2015
38. National Institute of Statistics of Rwanda: Labor Force Survey, 2018
39. National Institute of Statistics of Rwanda: Population and Housing Census, 2012
40. National Institute of Statistics of Rwanda: The Third National Strategy for the
Development of Statistics of Rwanda (2019/20-2023/24)
41. National Institute of Statistics of Rwanda: National Account, 2019
42. Netherlands Commission for Environmental Assessment: Climate Change Profile Rwanda,
2015
43. Republic of Rwanda: Rwanda Vision 2020, 2020
44. Republic of Rwanda: Vision 2020 Umurenge Program: EDPRS Flagship Program
Document, 2007
45. Republic of Rwanda: National Strategy of Transformation, 2018
46. Republic of Rwanda Future Drivers of Growth in Rwanda, 2019
47. Republic of Rwanda: Civil Registration and Vital Statistics National Strategic Plan (2017/18-
2021/22)
48. Republic of Rwanda: Public Private Partnership, 2018
49. Rwanda Education Board: Learning Achievement in Rwandan Schools (LARS) 2 (2014)
50. Rwanda Governance Board: Rwanda Governance Score Card (2016, 2018)
51. Rwanda Governance Board: Piloting Post 2015 Sustainable Development Goals on
Governance and Rule of Law (2015)
52. Rwanda Governance Board: Citizen Report Card (2018)
53. United Nations Development Program: Human Development Indices and Indicators, 2018
54. World Bank: Human Capital Report, 2018

79
Annex 1: List of Rwanda SDG Indicators
L# SDGI official code (2017)
Indicators Baseline value
Progress value
Progress year
Data Source
Goal 1. End poverty in all its forms everywhere
1.1 By 2030, eradicate extreme poverty for all people everywhere, currently measured as people living on less than $1.25 a day
1. 1.1.1 Proportion of population below the international poverty line, by sex, age, employment status and geographical location (urban/rural)
All individuals 56.8% 2013 All individuals 55.2%
2016 World bank Database
1.2 By 2030, reduce at least by half the proportion of men, women and children of all ages living in poverty in all its dimensions according to national definitions
2. 1.2.1 Proportion of population living below the national poverty line, by sex and age
All individuals 39.10% Adult males 33.2 % Adult females 35.9% Boys (age < 16) 44.7% Girls (age < 16) 44.6%
2013-14 All individuals 38.20% Adult males 31.6% Adult females 34.8% Boys (age < 16) 44.2% Girls (age < 16) 44.8%
2016-17 EICV 4 & 5 EICV4 Poverty Profile EICV5 Poverty Profile (NISR)
3. 1.2.2 Proportion of men, women and children of all ages living in poverty in all its dimensions according to national definitions
MPI = 0.17 (Proxy) GNI = 0.448 Headcount: 32.9% Intensity: 51.7% Multidimensional Poverty Headcount Children =29.2 (5-14 y.o.), 44.2 % (15-17 y.o.)
2013-14 MPI = 0.15 GNI = 0.429 Headcount: 28.9% Intensity: 51.5% Multidimensional Poverty Headcount (children 5-14 years) =25.3 (children 15-17 yrs ) = 41.1
2016-17 EICV 4 & 5, EICV 5 Thematic Report on MPI/(NISR)

80
L# SDGI official code (2017)
Indicators Baseline value
Progress value
Progress year
Data Source
1.3 Implement nationally appropriate social protection systems and measures for all, including floors, and by 2030 achieve substantial coverage of the poor and the vulnerable
4. 1.3.1 Proportion of population covered by social protection floors/systems, by sex, distinguishing children, unemployed persons, older persons, persons with disabilities, pregnant women, newborns, work-injury victims and the poor and the vulnerable
1.Core SP programmes: 6.5% (of national population) 2.Member of Pension and occupational Hazards: There were 465,579 active contributing members and 18,856 retirees 3. Medical scheme: There were 133,415 active members (affiliates) and 243,421 dependents 4. Community-Based Health Insurance - CBHI: Coverage rate was at 84.2% (of national population) 5.Health insurance: All individuals: 70% Urban: 73.8% Rural: 69.2% Male: 69.4% Female: 70.5%
2016/17 1.Core SP programmes: 6.5% (of national population) 2 Member of. Pension and Occupational hazards: There were 539,219 active contributing members and 21,550 retirees 3. Medical scheme: There were 147,170 active members (affiliates) and 285,280 dependents 4. Community-Based Health Insurance - CBHI: Coverage rate was at 83.3% (of national population) 5. Maternity Leave Benefits: There were 164,601 actively contributing women 6.Health insurance: all individuals: 73.9% Urban: 79.5%
2017/18 Database and Report of Ministry of Local Government (MINALOC) 2. Rwanda Social Security Board (RSSB), 3. Ministry of Gender and Family Promotion (MIGEPROF), 4. Ministry of Health (MOH), 5. Ministry of Agriculture (MINAGRI) 6.Ministry of Education (MINEDUC) 7.NISR , EICV

81
L# SDGI official code (2017)
Indicators Baseline value
Progress value
Progress year
Data Source
Rural: 72.7% Male: 73.4% Female: 74.5%
1.4 By 2030, ensure that all men and women, in particular the poor and the vulnerable, have equal rights to economic resources, as well as access to basic services, ownership and control over land and other forms of property, inheritance, natural resources, appropriate new technology and financial services, including microfinance
5. 1.4.1 Proportion of population living in households with access to basic services (Proxy)
Food market: 51.6 (min) Primary school: 25.6 (min) Secondary school: 38.3 (min) Health center: 56.9(min)
2013/2014 Food market: 50.0(min) Primary school: 25.4 (min) Secondary school: 35.7 (min) Health center: 49.9(min)
2016/17 EICV 4 & 5 (NISR)
6. 1.4.2 Proportion of total adult population with secure tenure rights to land, with legally recognized documentation and who perceive their rights to land as secure, by sex and by type of tenure
86% of parcels owned by natural persons have a woman either as sole (25%) or co-owner (61%) and only 14% of these parcels are registered exclusively with male claimants.
2016
By sex Men 2,010,860 Women 2,079,909 By type of tenure Full Ownership 418 559 parcels Condominium 59 parcels Emphyteutic Lease 11,067,490
2018
LIAS report (RLMUA)
1.5 By 2030, build the resilience of the poor and those in vulnerable situations and reduce their exposure and vulnerability to climate-related extreme events and other economic, social and environmental shocks and disasters
7.
1.5.1 Number of deaths, missing persons, and directly affected persons attributed to disasters per 100,000 people
Total Number of deaths = 183
Affected = 16,645
2016 Total Number of Deaths = 254
Affected = 80,164
2018 Report of Ministry in Charge of Emergency Management (MINEMA)
8.
1.5.2 Direct disaster economic loss in relation to global gross domestic product (GDP)a/ (Proxy)
Houses damaged: 5802 crops Ha: 5277 Live stocks: 590
Class rooms: 203 Health center: 3
Road: 13 Churches: 37 Bridges: 49
2017 Houses damaged: 15910 crops Ha: 13337.21
Live stocks: 815 Class rooms: 73 Health center: 3
Road: 32 Churches: 27 Bridges: 64
2018 MINEMA- Disaster effects report 2017 Disaster effects report 2018

82
L# SDGI official code (2017)
Indicators Baseline value
Progress value
Progress year
Data Source
Administrative Building: 18 Water supply: 10 Transm lines: 79
Administrative Building: 12 Water supply: 1
Transm lines: 26
9. 1.5.3 Number of countries that adopt and implement national disaster risk reduction strategies in line with the Sendai Framework for Disaster Risk Reduction 2015-2030/a
1 (Rwanda is implementing national disaster risk reduction strategies in line with
Sendai Framework for DRR such as DRR
mainstreaming strategies, National Risk
Atlas for Rwanda and DDMPs among others.
2019 MIDIMAR Report
10. 1.5.4 Proportion of local governments that adopt and implement local disaster risk reduction strategies in line with national disaster risk reduction strategies
22 2017 29 2018 MIDIMAR Report
1.a Ensure significant mobilization of resources from a variety of sources, including through enhanced development cooperation, in order to provide adequate and predictable means for developing countries, in particular least developed countries, to implement programmes and policies to end poverty in all its dimensions
11. 1.a.2 Proportion of total government spending on essential services (education, health and social protection)/ (Proxy)
Health (RWF):204,024,372,542
Education (RWF):220,651,941,795
Social Protection (RWF):74,731,877,174
2015/16 Health (RWF):197,351,473,973
Education (RWF):240,486,878,694
Social Protection (RWF):91,075,669,292
2017/18 Budget Finance law (MINECOFIN)
1.b Create sound policy frameworks at the national, regional and international levels, based on pro-poor and gender-sensitive development strategies, to support accelerated investment in poverty eradication actions

83
L# SDGI official code (2017)
Indicators Baseline value
Progress value
Progress year
Data Source
12. 1.b.1 Proportion of government recurrent and capital spending to sectors that disproportionately benefit women, the poor and vulnerable groups/ (Proxy)
Social Protection (RWF):74,731,877,174
2015/16 Social Protection (RWF):91,075,669,292
Budget Finance law 2018-2019
Budget Finance law (MINECOFIN)
Goal 2. End hunger, achieve food security and improved nutrition and promote sustainable agriculture
13. 2.1.2 Prevalence of moderate or severe
food insecurity in the population, based on the Food Insecurity Experience Scale (FIES)
19.4 % of the total HHs in Rwanda- 16.8% are
moderately food insecure and 2.6 % are severely
food insecure
2015 All type 18.7 %: 17% of HHs are moderately food
insecure and 1.7% of HHs are severely food
insecure
2018 CFSVA 2015 CFSVA 2018/(NISR &MINAGRI)
2.2 By 2030, end all forms of malnutrition, including achieving, by 2025, the internationally agreed targets on stunting and wasting in children under 5 years of age, and address the nutritional needs of adolescent girls, pregnant and lactating women and older persons
14. 2.2.1 Prevalence of stunting (height for age <-2 standard deviation from the median of the World Health Organization (WHO) Child Growth Standards) among children under 5 years of age
38% 2014-15 34.9% 2018 DHS 2014/15 CFSVA 2018 (NISR &MINAGRI)
15. 2.2.2 Prevalence of malnutrition (weight for height >+2 or <-2 standard deviation from the median of the WHO Child Growth Standards) among children under 5 years of age, by type (wasting and overweight)
weight for height <-2 = 2.2%
weight for height <+2 =7.7
2014-15 2.0 2018 DHS 2014/15 CFSVA 2018 (NISR &MINAGRI)
2.5 By 2020, maintain the genetic diversity of seeds, cultivated plants and farmed and domesticated animals and their related wild species, including through soundly managed and diversified seed and plant banks at the national, regional and international levels, and promote access to and fair and equitable sharing of benefits arising from the utilization of genetic resources and associated traditional knowledge, as internationally agreed

84
L# SDGI official code (2017)
Indicators Baseline value
Progress value
Progress year
Data Source
16. 2.5.1 Number of plant and animal genetic resources for food and agriculture secured in either medium or long-term conservation facilities
(1) passport data for 43 collected plant genetic resources were entered into computer for better management, (2) 48 accessions of different plant
genetic resources (2 accessions of rice; 2 for maize; 2 for wheat; 2 for sorghum; 20 for beans and 10 for taro), were explored and collected , (3)
19 identified plant genetic resources were planted in their appropriate chosen sites at Rubona; Karama and Rwerere for characterization, seeds increase and regeneration, (4) 104 accessions of banana; 24
accessions of horticulture crops; 171 accessions of sweet potato and 201 of coffee were maintained as field genebanks, (5) 192 and 209
different plant genetic resources were respectively tested for moisture content and germination rate. For forest genetic resources conservation (FGRs), 15 forest genetic resources were collected and conserved. For animal genetic resources conservation (AnGRs), 37 inkungu (traditional
cows without horns) and 145 "Inyambo" (traditional cows with long horns) were kept for conserving traditional cow breeds and two
“Inyambo” young bulls were acquired, cared for and trained for semen production in replacement of the previous old ones.
2017/18 Report MINAGRI/Rwanda National Gene bank (RNGB)
Goal 3. Ensure healthy lives and promote well-being for all at all ages 3.1 By 2030, reduce the global maternal mortality ratio to less than 70 per 100,000 live births
17. 3.1.1 Maternal mortality ratio 210 2014-15 DHS 2014/15(NISR)
18. 3.1.2 Proportion of births attended by skilled health personnel
91% 2014-15 DHS 2014/15(NISR)
3.2 By 2030, end preventable deaths of newborns and children under 5 years of age, with all countries aiming to reduce neonatal mortality to at least as low as 12 per 1,000 live births and under‑5 mortality to at least as low as 25 per 1,000 live births
19. 3.2.1 Under-five mortality rate 50 2014-15 DHS 2014/15(NISR)
20. 3.2.2 Neonatal mortality rate 20 2014-15 DHS 2014/15(NISR)
3.3 By 2030, end the epidemics of AIDS, tuberculosis, malaria and neglected tropical diseases and combat hepatitis, water-borne diseases and other communicable diseases
21. 3.3.1 Number of new HIV infections per 1,000 uninfected population, by sex, age and key populations
2.7 RAIHIS 0.58 (New HIV cases identified in routine HIV
testing services)
2018 HMIS 2018

85
L# SDGI official code (2017)
Indicators Baseline value
Progress value
Progress year
Data Source
22. 3.3.2 Tuberculosis incidence per 100,000 population
98 2008 50 2017 RBC, (WHO Global TB Report 2017)
23. 3.3.3 Malaria incidence per 1,000 population
348 2015-16 308 2017-18 RBC
3.6 By 2020, halve the number of global deaths and injuries from road traffic accidents
24. 3.6.1 Death rate due to road traffic injuries
3.1 2017 2.7 2018 Statistical Year Book/ (NISR)
3.7 By 2030, ensure universal access to sexual and reproductive health-care services, including for family planning, information and education, and the integration of reproductive health into national strategies and programmes
25. 3.7.1 Proportion of women of reproductive age (aged 15-49 years) who have their need for family planning satisfied with modern methods
48%(married women) 2014-15 DHS 2014/15(NISR)
26. 3.7.2 Adolescent birth rate (aged 10-14 years; aged 15-19 years) per 1,000 women in that age group
7.3% for aged 15-19 years 2014-15 DHS 2014/15(NISR)
3.a Strengthen the implementation of the World Health Organization Framework Convention on Tobacco Control in all countries, as appropriate
27. 3.a.1 Age-standardized prevalence of current tobacco use among persons aged 15 years and older
Percentage of Men aged 15-59 who smoke
cigarettes = 10.25% Percentage of Men aged 15-59 who smoke pipes =
3.5% Percentage of Men aged 15-59 who smoke other tobacco products = 1% Percentage of Women aged 15-49 who smoke
cigarettes = 0.4%
2014-15 DHS 2014/15(NISR)

86
L# SDGI official code (2017)
Indicators Baseline value
Progress value
Progress year
Data Source
Percentage of Women aged 15-49 who smoke
pipes = 0.7% Percentage of Women aged 15-49 who smoke
other tobacco products = 1.2%
3.b Support the research and development of vaccines and medicines for the communicable and non‑communicable diseases that primarily affect developing countries, provide access to affordable essential medicines and vaccines, in accordance with the Doha Declaration on the TRIPS Agreement and Public Health, which affirms the right of developing countries to use to the full the provisions in the Agreement on Trade-Related Aspects of Intellectual Property Rights regarding flexibilities to protect public health, and, in particular, provide access to medicines for all
28. 3.b.1 Proportion of the target population covered by all vaccines included in their national programme
93% 2014-15 DHS 2014/15(NISR)
3.c Substantially increase health financing and the recruitment, development, training and retention of the health workforce in developing countries, especially in least developed countries and small island developing States
29. 3.c.1 Health worker density and distribution
Doctors = 1/10,055 Nurses = 1/1,094
Midwives = 1/4,064 Pharmacist = 1/16,871
Lab Technicians = 1/10,500
2016-17 Health Sector Strategic Plan (2018-2024)
3.d Strengthen the capacity of all countries, in particular developing countries, for early warning, risk reduction and management of national and global health risks
30. 3.d.1 International Health Regulations (IHR) capacity and health emergency preparedness
66% (International Health Regulations (2005)
Monitoring Framework Country Profiles)
MINSANTE
Goal 4. Ensure inclusive and equitable quality education and promote lifelong learning opportunities for all
4.1 By 2030, ensure that all girls and boys complete free, equitable and quality primary and secondary education leading to relevant and effective learning outcomes

87
L# SDGI official code (2017)
Indicators Baseline value
Progress value
Progress year
Data Source
31. 4.1.1 Proportion of children and young people: (a) in grades 2/3; (b) at the end of primary; and (c) at the end of lower secondary achieving at least a minimum proficiency level in (i) reading and (ii) mathematics, by sex
i) P2 Literacy: 45.3%, P2 Numeracy:32.9%
ii) P5 Literacy:44.1%, P5 Numeracy:38.3%
2014 P3 (Grade 3) Literacy: 54.9% (boys: 52.2%,
girls: 56.4%) P3 Numeracy: 40.7% (boys: 40.3%, girls:
41.3%)
2018 LARS (III) Learning Achievement in Rwanda schools (2016 through LARS II & 2018)/REB
4.2 By 2030, ensure that all girls and boys have access to quality early childhood development, care and pre‑primary education so that they are ready for primary education
32. 4.2.1 Proportion of children under 5 years of age who are developmentally on track in health, learning and psychosocial well-being, by sex
1) Early Child Development index score (aged 36-59 months) =
63.1%
2014/15 DHS 2014/15(NISR)
33. 4.2.2 Participation rate in organized learning (one year before the official primary entry age), by sex
Male:46.8% Female:47.4%
2016/17 Male: 52% Female:53.1%
2018 Education Statistics 2018 (MINEDUC)
4.3 By 2030, ensure equal access for all women and men to affordable and quality technical, vocational and tertiary education, including university
34. 4.3.1 Participation rate of youth9 and adults in formal and non-formal education and training in the previous 12 months, by sex
Youth = 3.1 Adults = 1.9
2016/17 EICV 5 (NISR)
4.4 By 2030, substantially increase the number of youth and adults who have relevant skills, including technical and vocational skills, for employment, decent jobs and entrepreneurship
9 Youth age group in Rwanda is (16-30 years)

88
L# SDGI official code (2017)
Indicators Baseline value
Progress value
Progress year
Data Source
35. 4.4.1 Proportion of youth and adults with information and communications technology (ICT) skills, by type of skill
1) Copying or moving a file or a folder = 4.6%
2) Using copy and paste =
4.3%
3) Sending e-mails with attached files = 2.8%
4) Using basic arithmetic
formulae in a spreadsheet = 2.6%
5) Connecting and
installing new devices = 2.6%
6) Finding, downloading installing and configuring
software = 1.6%
7) Creating electronic presentations with
presentation software = 0.9%
8) Transferring files
between a computer and other devices = 1.8%
9) Writing a computer
program = 1.8%
2016/17 1) Copying or moving a file or a folder = 6.3%
2) Using copy and paste
= 6.1%
3) Sending e-mails with attached files = 4.4%
4) Using basic arithmetic
formulae in a spreadsheet = 3.8%
5) Connecting and
installing new devices = 4.1%
6) Finding, downloading installing and configuring
software = 2.2%
7) Creating electronic presentations with
presentation software = 1.5%
8) Transferring files
between a computer and other devices = 3.0%
9) Writing a computer
program = 3.0%
2017/18 Reports from Ministry of Youth & ICT (MYICT); NISR
4.5 By 2030, eliminate gender disparities in education and ensure equal access to all levels of education and vocational training for the vulnerable, including persons with disabilities, indigenous peoples and children in vulnerable situations

89
L# SDGI official code (2017)
Indicators Baseline value
Progress value
Progress year
Data Source
36. 4.5.1 Parity indices (female/male, rural/urban, bottom/top wealth quantile and others such as disability status, indigenous peoples and conflict-affected, as data become available) for all education indicators on this list that can be disaggregated
Gender Parity Index Nursery =1.03
Primary education = 1.004 GPI in Secondary =1.12 GPI in Higher Education
=0.73
2016 Gender Parity Index in
Nursery =1.02
Primary = 0.98 Lower Secondary= 1.17
Upper Secondary =1.07 GPI in Higher Education
=0.74
2018 Education Statistics 2016 and 2018 (MINEDUC)
4.6 By 2030, ensure that all youth and a substantial proportion of adults, both men and women, achieve literacy and numeracy
37. 4.6.1 Proportion of population in a given age group achieving at least a fixed level of proficiency in functional (a) literacy and (b) numeracy skills, by sex
Literacy = 73.2% (Proxy) Numeracy = 73.5%
(Proxy)
(2016/17) Literacy Youth rate among youth population (Male:84.2% & Female:85%) Numeracy rate among youth population (Male:84.7% & Female:84.9%)
2017/18 EICV5, Education Statistics 2018 (MINEDUC)
4.a Build and upgrade education facilities that are child, disability and gender sensitive and provide safe, non-violent, inclusive and effective learning environments for all
38. 4.a.1 Proportion of schools with access to: (a) electricity; (b) the Internet for pedagogical purposes; (c) computers for pedagogical purposes; (d) adapted infrastructure and materials for students with disabilities; (e) basic drinking water; (f) single-sex basic sanitation facilities; and (g) basic hand-washing facilities (as per the WASH indicator definitions)
(a)Electricity on grid and off grid: Nursery: 14.9% Primary = 52.4% Secondary = 65.2% (b) Internet for pedagogical purposes : Primary = 9.8% Secondary = 35.4% (c) Computers for pedagogical purposes: Primary =65.8% Secondary = 77.3% (d) Adapted infrastructure
2016 (a) Electricity on grid and off grid : Nursery: 45.8% Primary =79% Secondary =92.5.% (b) Internet for pedagogical purposes : Primary = 30.0% Secondary = 52.9% (c) Computers for pedagogical purposes: Primary = 75.5% Secondary = 84.26% (d) Adapted infrastructure
2018 Education Statistics 2018 (MINEDUC)

90
L# SDGI official code (2017)
Indicators Baseline value
Progress value
Progress year
Data Source
and materials for students with disabilities: Nursery:5.7% (2017) Primary = 18% (2017) Secondary = 23.5% (2017) (e) Basic drinking water: Nursery= 19.0% (2017) Primary = 45.5%/Improved (2017) Secondary = 58.5% (2017) (g) Basic handwashing facilities Nursery= 19.95% Primary=45.3%
(h)Toilets ratio= Primary = 57
and materials for students with disabilities: Nursery:5.7% Primary = 24% Secondary = 28.5% (2017) (e) Basic drinking water: Nursery= 27.5% Primary = 53.6%/Improved(2017) Secondary = 71.9% (2017) (g) Basic handwashing facilities Nursery= 28.6% Primary=66.0%
(h)Toilets ratio= Primary = 54
39. 4.C.1 Proportion of teachers in: (a) pre-primary; (b) primary; (c) lower secondary; and (d) upper secondary education who have received at least the minimum organized teacher training (e.g. pedagogical training) pre-service or in-service required for teaching at the relevant level in a given country/ (Proxy)
Trained Teachers (a) Nursery= 52.7
(b) Primary = 92.5%
(c) Secondary = 53.3%
2016 Trained Teachers (a) Nursery= 47.3% (b) (b) Primary =
93.6% (c) Secondary = 59.7%
2018
Goal 5. Achieve gender equality and empower all women and girls
5.1 End all forms of discrimination against all women and girls everywhere

91
L# SDGI official code (2017)
Indicators Baseline value
Progress value
Progress year
Data Source
40.
5.1.1 Whether or not legal frameworks are in place to promote, enforce and monitor equality and non-discrimination on the basis of sex
Existing legal framework : *CEDAW, *Maputo Protocol,
*AU solemn Declaration on gender equality
in Africa, *Beijing
Declaration (1995)
*2015 revised constitution, *New 2016
succession law, *Land Law
(2013), *Penal code
(2012) *Anti-GBV Law
(2008), *Family policy
(2005) *Labor Law
(2009), *Gender Policy
(2010) *Anti GBV Policy
(2011)
Existing legal framework : - The Constitution of Republic of Rwanda of 2003 revised in
2015 enshrines the principle of Gender equality and women’s rights and provides the minimum 30% quota for women in all
decision making positions and Prohibits all kind of discrimination;
- Organic law No 001/2018. OR of 25/03/2018 governing elections was enacted as an additional legislation promoting
gender parity in decision making structures of the government. Article 91 of this law relates to the composition of the chamber of deputies and provides for 24 seats reserved for women (this
is the equivalent of 30%); - The Law Nº68/2018 of 30/08/2018 determining offences and
penalties in general provide punishment of Gender-Based Violence (GBV) addresses GBV in all its forms;
- The Law No 32/2016 of 28/08/2016 governing Persons and Family, Men and women have equal right to enter marriage
where by today the minimum legal age; - Law Nº27/2016 of 08/07/2016 Governing Matrimonial
Regimes, Donations and Successions: In 1999, a gender revolution especially in terms of equal accessibility to and
management of family patrimony was realized through the law on matrimonial regimes, donations and successions which were later revised in 2016. The law provides that both boys and girls have the same rights to inherit properties from their
parents; - Law N° 43/2013 OF 16/06/2013 Governing Land in Rwanda: The same as inheritance, Land reform in Rwanda supported
women and men to have equal rights and enjoyment over their land properties. From this, both men and women have land
titles registered on their names and this has facilitated especially women to access loans from financial institutions
and engage in income generating activities; - The Law N° 66/2018 of 30/08/2018 regulating labour in
Rwanda, in its Article 9 states that, an employer is prohibited from discriminating employees on basis of sex, or any other
form of discrimination. A female employee who has given birth is entitled to a maternity leave paid of at least twelve (12)
MIGEPROF/MINIJUST

92
L# SDGI official code (2017)
Indicators Baseline value
Progress value
Progress year
Data Source
consecutive weeks; -The Organic Law No. 12/2013/OL of 12/09/2013 on state finance and property enforces accountability to all public
Institutions through Gender Budget Statement as a mandatory annex to the Budget Framework Paper to be submitted to the
Parliament. - Law No 32/2016 of 28/08/2016 governing Persons and Family stipulates that the spouses have equal rights on
Management of the household.
5.2 Eliminate all forms of violence against all women and girls in the public and private spheres, including trafficking and sexual and other types of exploitation
41. 5.2.1 Proportion of ever-partnered women and girls aged 15 years and older subjected to physical, sexual or psychological violence by a current or former intimate partner in the previous 12 months, by form of violence and by age
Physical Violence for those aged 15-49 years
(Women: 17.6%, Men :6.5 %)
Sexual Violence for those aged 15-49 years (Women : 8.3 %, Men :
1.2 %) Emotional Violence for those aged 15-49 years (Women :18.5 %, Men :
14 %)
2014-15 DHS(NISR)
42. 5.2.2 Proportion of women and girls aged 15 years and older subjected to sexual violence by persons other than an intimate partner in the previous 12 months, by age and place of occurrence
Sexual Violence for those aged 15 and older
- Women: 7.6 %
2014-15 DHS(NISR)
5.3 Eliminate all harmful practices, such as child, early and forced marriage and female genital mutilation

93
L# SDGI official code (2017)
Indicators Baseline value
Progress value
Progress year
Data Source
43. 5.3.1 Proportion of women aged 20-24 years who were married or in a union before age 15 and before age 18
At age 15: 0.4% At age 18: 6.8%
2014-15 DHS (NISR)
5.4 Recognize and value unpaid care and domestic work through the provision of public services, infrastructure and social protection policies and the promotion of shared responsibility within the household and the family as nationally appropriate
44. 5.4.1 Proportion of time spent on unpaid domestic and care work, by sex, age and location/ Proxy
Average Time Spend per week Total 24.7 hours Female = 31 hours
Male =16 hours
2016 Average Time Spend per week Total 20.6 hours Female = 25.3 hours Male =13.5 hours
2018 LFS (NISR)
5.5 Ensure women’s full and effective participation and equal opportunities for leadership at all levels of decision-making in political, economic and public life
45. 5.5.1 Proportion of seats held by (a) women in national parliaments and (b) local governments
1) Members of Parliament (Chamber of Deputies) =
64%
2) Districts Mayors = 16.7%
3) Member of Districts Consultative Council =
45.2%
2016 1) Members of Parliament
(Chamber of Deputies) = 61.3%
2) Districts Mayors =
26.7%
3) Member of Districts Consultative Council =
45.2%
2018 Report of MIGEPROF; GMO
46. 5.5.2 Proportion of women in managerial positions
38.60% 2017 34.10% 2018 Report of MIGEPROF; GMO ((NISR) LFS 2017, 2018
5.6 Ensure universal access to sexual and reproductive health and reproductive rights as agreed in accordance with the Programme of Action of the International Conference on Population and Development and the Beijing Platform for Action and the outcome documents of their review conferences

94
L# SDGI official code (2017)
Indicators Baseline value
Progress value
Progress year
Data Source
47. 5.6.1 Proportion of women aged 15-49 years who make their own informed decisions regarding sexual relations, contraceptive use and reproductive health care
83% 2014-15 DHS(NISR)
48. 5.6.2 Number of countries with laws and regulations that guarantee full and equal access to women and men aged 15 years and older to sexual and reproductive health care, information and education
N° 21/2016 of 20/05/2016 Law relating to human
reproductive health
5.a Undertake reforms to give women equal rights to economic resources, as well as access to ownership and control over land and other forms of property, financial services, inheritance and natural resources, in accordance with national laws
49. 5.a.1 (a) Proportion of total agricultural population with ownership or secure rights over agricultural land, by sex; and (b) share of women among owners or rights-bearers of agricultural land, by type of tenure
By sex 631,719 women with
1,642,580 parcels (18%) 529,607 men with
910,833 parcels (16%) 2,261,843 co-owner ( spouses 66%) with 4,795,766 parcels Others 75,722 with 299,720 (no nature
person ( and parcels owner by more than 2
persons)
MINAGRI ; Report Rwanda Land Management and Use Authority,

95
L# SDGI official code (2017)
Indicators Baseline value
Progress value
Progress year
Data Source
50. 5.a.2 Proportion of countries where the legal framework (including customary law) guarantees women’s equal rights to land ownership and/or control
LEGAL INSTRUMENTS IN PLACE: - The Law No 32/2016 of 28/08/2016 governing Persons and Family, Men and women have equal right to enter marriage where by today the minimum legal age - Law Nº27/2016 of 08/07/2016 Governing Matrimonial Regimes, Donations and Successions: In 1999, a gender revolution especially in terms of equal accessibility to and management of family patrimony was realized through the law on matrimonial regimes, donations and successions which were later revised in 2016. The law provides that both boys and girls have the same rights to inherit properties from their parents; - Law N° 43/2013 OF 16/06/2013 Governing Land in Rwanda: The same as inheritance, Land reform in Rwanda supported women and men to have equal rights and enjoyment over their land properties. From this, both men and women have land titles registered on their names and this has facilitated especially women to access loans from financial institutions and engage in income generating activities; - The National Land Policy (2018)
GMO
5.b Enhance the use of enabling technology, in particular information and communications technology, to promote the empowerment of women
51. 5.b.1 Proportion of individuals who own a mobile telephone, by sex
64% (Here we considered percentage of households owning mobile phones.)
2013-14 67% 2016-17 EICV5(NISR)
Goal 6. Ensure availability and sustainable management of water and sanitation for all
6.1 By 2030, achieve universal and equitable access to safe and affordable drinking water for all
52. 6.1.1 Proportion of population using safely managed drinking water services
84.80% 2013-14 87.40% 2016-17 EICV5(NISR) DHS4
6.2 By 2030, achieve access to adequate and equitable sanitation and hygiene for all and end open defecation, paying special attention to the needs of women and girls and those in vulnerable situations
53. 6.2.1 Proportion of population using safely managed sanitation services, including a hand-washing facility with soap and water
63.5% (Here we considered households
using improved sanitation type not shared with other
households.)
2013-14 66.20% 2016-17 DHS, EICV 5(NISR)

96
L# SDGI official code (2017)
Indicators Baseline value
Progress value
Progress year
Data Source
6.3 By 2030, improve water quality by reducing pollution, eliminating dumping and minimizing release of hazardous chemicals and materials, halving the proportion of untreated wastewater and substantially increasing recycling and safe reuse globally
54. 6.3.2 Proportion of bodies of water with good ambient water quality
15% 2019 Water quality
Monitoring status in Rwanda /National University of Rwanda (NUR)
6.5 By 2030, implement integrated water resources management at all levels, including through transboundary cooperation as appropriate
55. 6.5.2 Proportion of transboundary basin area with an operational arrangement for water cooperation
100% (Nile Basin Initiative and Congo Basin have
operational arrangement for water cooperation
(Admin data)
Report (RWFA)
Goal 7. Ensure access to affordable, reliable, sustainable and modern energy for all 7.1 By 2030, ensure universal access to affordable, reliable and modern energy services
56. 7.1.1 Proportion of population with access to electricity
26.9% 2016 46.7% 2018 Admin report (MININFRA)
57. 7.1.2 Proportion of population with primary reliance on clean fuels and technology
0.7% 2013-14 1.2% 2016/17 Admin (MININFRA)
7.2 By 2030, increase substantially the share of renewable energy in the global energy mix
58. 7.2.1 Renewable energy share in the total final energy consumption
53% (Proxy: Renewable energy share in the total final electricity generation)
2018 Admin Report (MININFRA)
Goal 8. Promote sustained, inclusive and sustainable economic growth, full and productive employment and decent work for all
8.1 Sustain per capita economic growth in accordance with national circumstances and, in particular, at least 7 per cent gross domestic product growth per annum in the least developed countries
59. 8.1.1 Annual growth rate of real GDP per capita
6.6% (2015) 2017 8.50% (average 2015-2018)
National Accounts (NISR)

97
L# SDGI official code (2017)
Indicators Baseline value
Progress value
Progress year
Data Source
8.3 Promote development-oriented policies that support productive activities, decent job creation, entrepreneurship, creativity and innovation, and encourage the formalization and growth of micro-, small- and medium-sized enterprises, including through access to financial services
60. 8.3.1 Proportion of informal employment in non-agriculture employment, by sex
Male = 66.4% Female = 33.6%
2017 Male = 66.3% Female = 33.7%
2018 LFS(NISR)
8.5 By 2030, achieve full and productive employment and decent work for all women and men, including for young people and persons with disabilities, and equal pay for work of equal value
61. 8.5.2 Unemployment rate, by sex, age and persons with disabilities
Unemployment rate = 18.8 %
Male = 15.7 %
Female = 22.7%
Youth = 21.5% Adults = 16.3%
Disabilities = 20.8%
2016 Unemployment rate = 15.1% Male = 13.5 % Female = 17.1 % Youth = 18.7% Adults = 12.3% Disabilities = 14.1 %
2018 LFS(NISR)
8.6 By 2020, substantially reduce the proportion of youth not in employment, education or training
62. 8.6.1 Proportion of youth (aged 15-24 years)
Aged of 16- 30 = 36.4 % 2016 Aged of 16- 24 = 30.7% Aged of 16-30 = 32.7%
2018 LFS(NISR)
8.7 Take immediate and effective measures to eradicate forced labour, end modern slavery and human trafficking and secure the prohibition and elimination of the worst forms of child labour, including recruitment and use of child soldiers, and by 2025 end child labour in all its forms
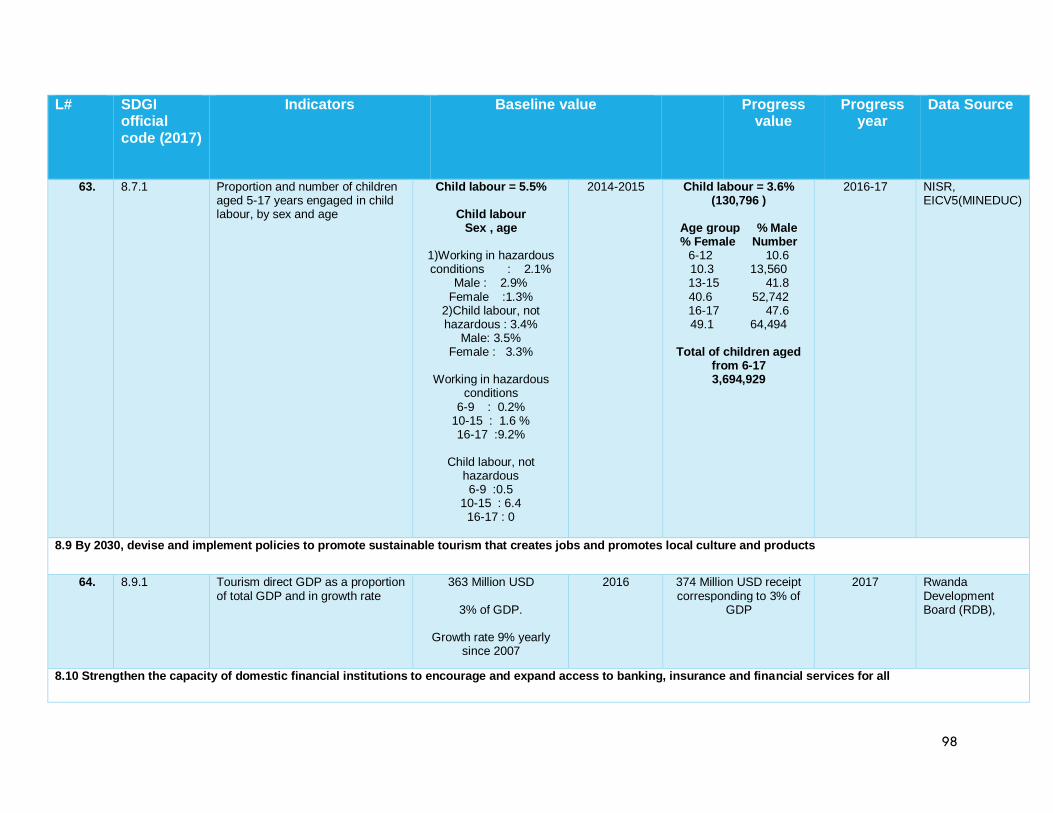
98
L# SDGI official code (2017)
Indicators Baseline value
Progress value
Progress year
Data Source
63. 8.7.1 Proportion and number of children aged 5-17 years engaged in child labour, by sex and age
Child labour = 5.5%
Child labour Sex , age
1)Working in hazardous conditions : 2.1%
Male : 2.9% Female :1.3%
2)Child labour, not hazardous : 3.4%
Male: 3.5% Female : 3.3%
Working in hazardous
conditions 6-9 : 0.2%
10-15 : 1.6 % 16-17 :9.2%
Child labour, not
hazardous 6-9 :0.5
10-15 : 6.4 16-17 : 0
2014-2015 Child labour = 3.6% (130,796 )
Age group % Male % Female Number
6-12 10.6 10.3 13,560 13-15 41.8 40.6 52,742 16-17 47.6 49.1 64,494
Total of children aged
from 6-17 3,694,929
2016-17 NISR, EICV5(MINEDUC)
8.9 By 2030, devise and implement policies to promote sustainable tourism that creates jobs and promotes local culture and products
64. 8.9.1 Tourism direct GDP as a proportion of total GDP and in growth rate
363 Million USD
3% of GDP.
Growth rate 9% yearly since 2007
2016 374 Million USD receipt corresponding to 3% of
GDP
2017 Rwanda Development Board (RDB),
8.10 Strengthen the capacity of domestic financial institutions to encourage and expand access to banking, insurance and financial services for all
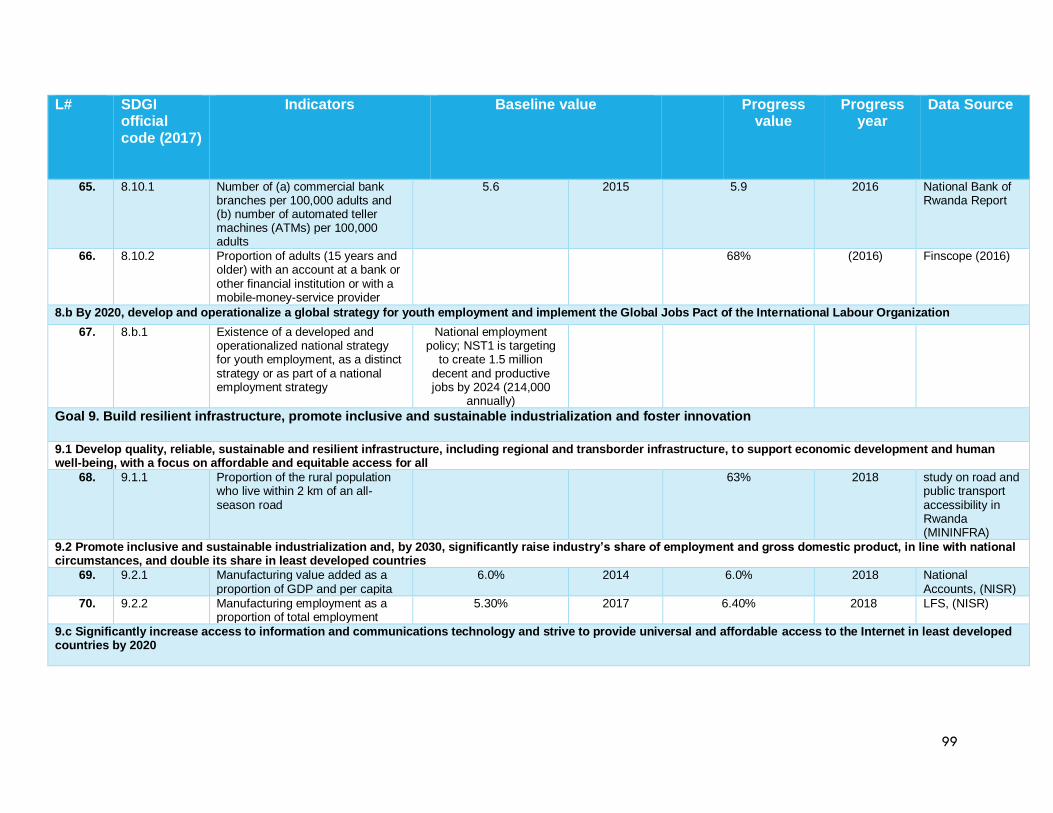
99
L# SDGI official code (2017)
Indicators Baseline value
Progress value
Progress year
Data Source
65. 8.10.1 Number of (a) commercial bank branches per 100,000 adults and (b) number of automated teller machines (ATMs) per 100,000 adults
5.6 2015 5.9 2016 National Bank of Rwanda Report
66. 8.10.2 Proportion of adults (15 years and older) with an account at a bank or other financial institution or with a mobile-money-service provider
68% (2016) Finscope (2016)
8.b By 2020, develop and operationalize a global strategy for youth employment and implement the Global Jobs Pact of the International Labour Organization
67. 8.b.1 Existence of a developed and operationalized national strategy for youth employment, as a distinct strategy or as part of a national employment strategy
National employment policy; NST1 is targeting
to create 1.5 million decent and productive jobs by 2024 (214,000
annually)
Goal 9. Build resilient infrastructure, promote inclusive and sustainable industrialization and foster innovation
9.1 Develop quality, reliable, sustainable and resilient infrastructure, including regional and transborder infrastructure, to support economic development and human well-being, with a focus on affordable and equitable access for all
68. 9.1.1 Proportion of the rural population who live within 2 km of an all-season road
63% 2018 study on road and public transport accessibility in Rwanda (MININFRA)
9.2 Promote inclusive and sustainable industrialization and, by 2030, significantly raise industry’s share of employment and gross domestic product, in line with national circumstances, and double its share in least developed countries
69. 9.2.1 Manufacturing value added as a proportion of GDP and per capita
6.0%
2014 6.0% 2018 National Accounts, (NISR)
70. 9.2.2 Manufacturing employment as a proportion of total employment
5.30% 2017 6.40% 2018 LFS, (NISR)
9.c Significantly increase access to information and communications technology and strive to provide universal and affordable access to the Internet in least developed countries by 2020

100
L# SDGI official code (2017)
Indicators Baseline value
Progress value
Progress year
Data Source
71. 9.c.1 Proportion of population covered by a mobile network, by technology
2 G = 99.92%, 3G = 93.37%
4G= 89%
December-17 2 G = 99.92%, 3G = 92.37% 4G= 96.6%
Mar-19 Statistics Report For Telecom, Media And Postal Sector As Of The First Quarter Of The Year 2019, RURA
Goal 10. Reduce inequality within and among countries
10.5 Improve the regulation and monitoring of global financial markets and institutions and strengthen the implementation of such regulations
72. 10.5.1 Financial Soundness Indicator CAR :23.34% June 2016 CAR: 25.5% December 2018 ANNUAL FINANCIAL STABILITY REPORT, BNR
CAR Tier1: 20.68% CAR Tier1: 20.84%
NPLs Net of Provisions to Capital: 17.05%
NPLs Net of Provisions to Capital: 10.97%
NPLs to Total Gross Loans: 7.56%
NPLs to Total Gross Loans: 6.4%
Return on Assets: 2.62% Return on Assets: 2.80%
Liquid Assets to Short Term Liabilities: 111.87%
Liquid Assets to Short Term Liabilities: 129.55%
Net Open Position in Foreign Exchange to
Capital: -1.61%
Net Open Position in Foreign Exchange to Capital: -9.09%
10.7 Facilitate orderly, safe, regular and responsible migration and mobility of people, including through the implementation of planned and well-managed migration policies
73. 10.7.2 Number of countries that have implemented well-managed migration policies
LAW N° 04/2011 OF 21/03/2011 ON
IMMIGRATION AND EMIGRATION IN
RWANDA
10.c By 2030, reduce to less than 3 per cent the transaction costs of migrant remittances and eliminate remittance corridors with costs higher than 5 per cent
74. 10.c.1 Remittance costs as a proportion of the amount remitted
4% 2017 Records of BNR
Goal 11. Make cities and human settlements inclusive, safe, resilient and sustainable

101
L# SDGI official code (2017)
Indicators Baseline value
Progress value
Progress year
Data Source
11.1 By 2030, ensure access for all to adequate, safe and affordable housing and basic services and upgrade slums
75. 11.1.1 Proportion of urban population living in slums, informal settlements or inadequate housing/ Proxy
62.6% 2013-14 52.5% 2016-17 EICV-4, EICV- 5 (NISR)
11.5 By 2030, significantly reduce the number of deaths and the number of people affected and substantially decrease the direct economic losses relative to global gross domestic product caused by disasters, including water-related disasters, with a focus on protecting the poor and people in vulnerable situations
76. 11.5.1 Number of deaths, missing persons and persons affected by disaster per 100,000 people
1) Deaths = 183 2) Affected = 16,645
2017 1) Deaths = 273 2) Affected = 80,164
Report of MINEMA
11.b By 2020, substantially increase the number of cities and human settlements adopting and implementing integrated policies and plans towards inclusion, resource efficiency, mitigation and adaptation to climate change, resilience to disasters, and develop and implement, in line with the Sendai Framework for Disaster Risk Reduction 2015–2030, holistic disaster risk management at all levels
77. 11.b.1 Proportion of local governments that adopt and implement local disaster risk reduction strategies in line with Sendai Framework for Disaster Risk Reduction 2015-2030a
2017 1 (Rwanda is implemeting national disaster risk reduction strategies in line with Sendai Framework for
DRR such as DRR maintreaming strategies,
National isk Atlas for Rwanda and DDMPs
among others.
Report of MINEMA
78. 11.b.2 Number of countries with national and local disaster risk reduction strategies
22/30 Districts 2017 29/30 MINEMA
Goal 12. Ensure sustainable consumption and production patterns
12.4 By 2020, achieve the environmentally sound management of chemicals and all wastes throughout their life cycle, in accordance with agreed international frameworks, and significantly reduce their release to air, water and soil in order to minimize their adverse impacts on human health and the environment

102
L# SDGI official code (2017)
Indicators Baseline value
Progress value
Progress year
Data Source
79. 12.4.1 Number of parties to international multilateral environmental agreements on hazardous waste, and other chemicals that meet their commitments and obligations in transmitting information as required by each relevant agreement
Rwanda is party to the following MEAs: * Basel Convention on the Control of Trans-boundary Movements of
Hazardous Wastes and their Disposal signed on 7/6/2004, * Bamako Convention on the Ban of the Import into Africa and the
Control of Trans-boundary Movement and Management of Hazardous Wastes within Africa signed on 26/08/1991
* Minamata Convention to protect people and the environment from the harm caused by exposure to mercury signed on 29/06/2017
12.5 By 2030, substantially reduce waste generation through prevention, reduction, recycling and reuse
80. 12.5.1 Number of companies publishing sustainability reports (These include efficient use of energy, water use).
. An estimate of 25 fully complying industries have saved about Rwf1 billion between 2013 and 2014, and cut about 1,290 tonnes of carbon
emissions per year. In the same way, over 70 industries are in the process of addressing the industrial pollution challenges and low
productivity by embracing clean production practices.
12.7 Promote public procurement practices that are sustainable, in accordance with national policies and priorities
81. 12.7.1 Number of countries implementing sustainable public procurement policies and action plans
Public Procurement User Guide / Law on public
procurement 12/2007 of 29/03/2007
MINECOFIN
12.b Develop and implement tools to monitor sustainable development impacts for sustainable tourism that creates jobs and promotes local culture and products

103
L# SDGI official code (2017)
Indicators Baseline value
Progress value
Progress year
Data Source
82. 12.b.1 Number of sustainable tourism strategies or policies and implemented action plans with agreed monitoring and evaluation tools
11 strategies and policies
(Adventure tourism masterplan, Kivu-Belt, Eastern Province MP, Heritage Corridor MP, Sustainable Tourism
Master-Plan, Concession policy, Twin Lakes,
Adventure-tourism, MICE strategy, Tourism policy
and Tourism bill)
RDB
Goal 13. Take urgent action to combat climate change and its impacts
13.1 Strengthen resilience and adaptive capacity to climate-related hazards and natural disasters in all countries
83. 13.1.1 Number of deaths, missing persons, and directly affected persons attributed to disasters per 100,000 people
1) Deaths = 183 2) Affected = 16,645
2017 1) Deaths = 273 2) Affected = 80,164
MINEMA Report (2017)
84. 13.1.2 Number of countries that adopt and implement national disaster risk reduction strategies in line with the Sendai Framework for Disaster Risk Reduction 2015-2030/a
Rwanda is implementing national disaster risk
reduction strategies in line with Sendai Framework for DRR such as DRR
mainstreaming strategies, National Risk Atlas for Rwanda and DDMPs
among others.
2017 MINEMA Report (2017)
85. 13.1.3 Proportion of local governments that adopt and implement local disaster risk reduction strategies in line with national disaster risk reduction strategies
22/30 Districts 2017 29/30 Districts MINEMA Report (2017)
13.2 Integrate climate change measures into national policies, strategies and planning
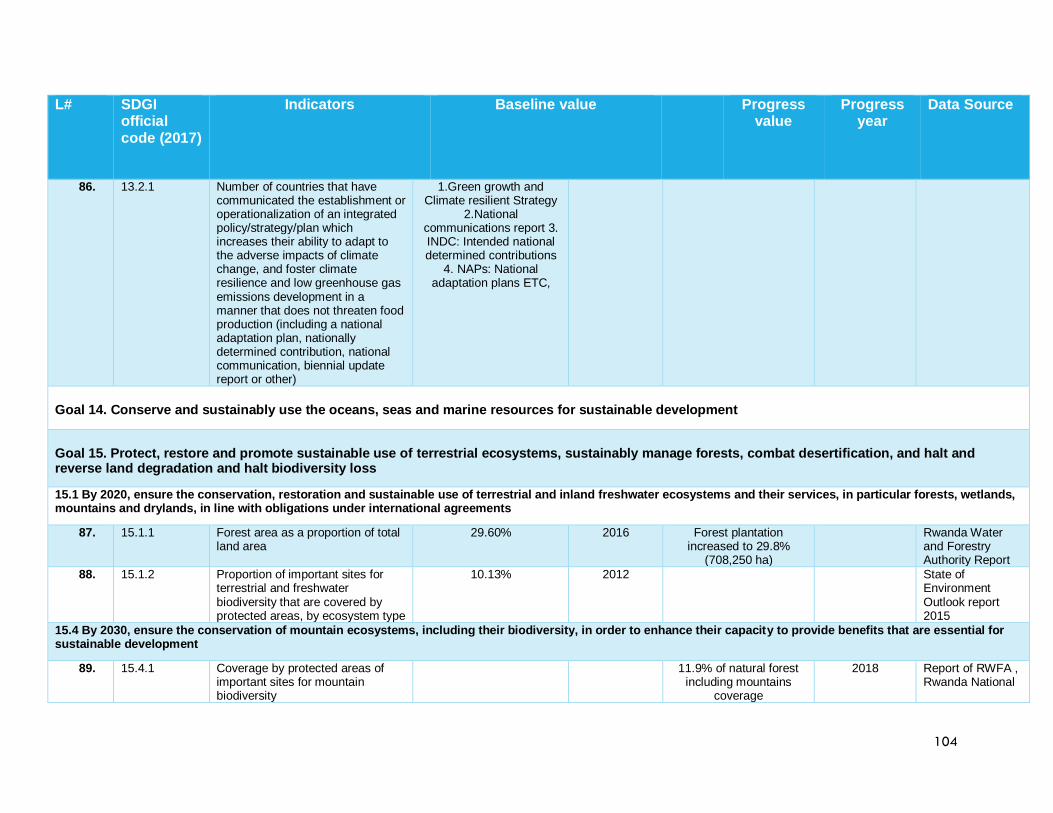
104
L# SDGI official code (2017)
Indicators Baseline value
Progress value
Progress year
Data Source
86. 13.2.1 Number of countries that have communicated the establishment or operationalization of an integrated policy/strategy/plan which increases their ability to adapt to the adverse impacts of climate change, and foster climate resilience and low greenhouse gas emissions development in a manner that does not threaten food production (including a national adaptation plan, nationally determined contribution, national communication, biennial update report or other)
1.Green growth and Climate resilient Strategy
2.National communications report 3. INDC: Intended national determined contributions
4. NAPs: National adaptation plans ETC,
Goal 14. Conserve and sustainably use the oceans, seas and marine resources for sustainable development
Goal 15. Protect, restore and promote sustainable use of terrestrial ecosystems, sustainably manage forests, combat desertification, and halt and reverse land degradation and halt biodiversity loss
15.1 By 2020, ensure the conservation, restoration and sustainable use of terrestrial and inland freshwater ecosystems and their services, in particular forests, wetlands, mountains and drylands, in line with obligations under international agreements
87. 15.1.1 Forest area as a proportion of total land area
29.60% 2016 Forest plantation increased to 29.8%
(708,250 ha)
Rwanda Water and Forestry Authority Report
88. 15.1.2 Proportion of important sites for terrestrial and freshwater biodiversity that are covered by protected areas, by ecosystem type
10.13% 2012 State of Environment Outlook report 2015
15.4 By 2030, ensure the conservation of mountain ecosystems, including their biodiversity, in order to enhance their capacity to provide benefits that are essential for sustainable development
89. 15.4.1 Coverage by protected areas of important sites for mountain biodiversity
11.9% of natural forest including mountains
coverage
2018 Report of RWFA , Rwanda National

105
L# SDGI official code (2017)
Indicators Baseline value
Progress value
Progress year
Data Source
Forest Policy 2018
15.9 By 2020, integrate ecosystem and biodiversity values into national and local planning, development processes, poverty reduction strategies and accounts
90. 15.9.1 Progress towards national targets established in accordance with Aichi Biodiversity Target 2 of the Strategic Plan for Biodiversity 2011-2020
Fifth National Report to the Convention on Biological Diversity (CBD); Records of the Ministry of Agriculture and Natural Resources
15.a Mobilize and significantly increase financial resources from all sources to conserve and sustainably use biodiversity and ecosystems
91. 15.a.1 Official development assistance and public expenditure on conservation and sustainable use of biodiversity and ecosystems
$86M mobilised by FONERWA to support
environment and climate change related projects
$71.1 M 2017/18 FONERWA
Goal 16. Promote peaceful and inclusive societies for sustainable development, provide access to justice for all and build effective, accountable and inclusive institutions at all levels
16.1 Significantly reduce all forms of violence and related death rates everywhere
92. 16.1.1 Number of victims of intentional homicide per 100,000 population, by sex and age
0.0003 2014 3.9 2018 RGS and Rwanda National Police Report
93. 16.1.3 Proportion of population subjected to physical, psychological or sexual violence in the previous 12 months
•Fourteen percent of women and 11 % of men,
age 15-49 have experienced physical violence within the 12 months preceding the
survey. • Thirty-five percent of
women and 39 percent of men age 15-49 have ever
2014/15 12% of females and 5% of males aged 13-17 had experienced sexual violence in the 12 months prior the survey Of females aged 13-17 who ever had sexual intercourse, 46% indicated that their first incident of sexual
2015/16 DHS 2014/15 VACYS 2015/16

106
L# SDGI official code (2017)
Indicators Baseline value
Progress value
Progress year
Data Source
experienced physical violence at least once
since age 15. • Eight percent of women and 1 percent of men age
15-49 report having experienced sexual
violence at least once in the past 12 months.
intercourse was unwanted. 27% of females and 42% of males aged 13-17 had experienced physical violence in the past 12 months prior to the survey 8% of females and 13% of males aged 13-17 reported experiencing emotional violence by a parent or caregiver in the past 12 months prior to survey. Among them, all females and 96% of males had experienced multiple incidents.
94. 16.1.4 Proportion of population that feel safe walking alone around the area they live
88% 2018 Gallup 2018 Global
Law and Order Report
16.2 End abuse, exploitation, trafficking and all forms of violence against and torture of children
95. 16.2.2 Number of victims of human trafficking per 100,000 population, by sex, age and form of exploitation
35 2015/16 Administrative data from the (Justice, Reconciliation, Law and Orders Sector) JRLOS
16.3 Promote the rule of law at the national and international levels and ensure equal access to justice for all
96. 16.3.2 Unsentenced detainees as a proportion of overall prison population
2,994(5.53%) on overall prison population of
54,185 as on 31 August 2016.
Records of the JLROS
4,846 detainees over 67,124 prison population were in pre-trial category
equivalent to 7%.
2018 Admin data from JRLOS, RNP
16.5 Substantially reduce corruption and bribery in all their forms

107
L# SDGI official code (2017)
Indicators Baseline value
Progress value
Progress year
Data Source
97. 16.5.1
Proportion of persons who had at least one contact with a public official and who paid a bribe to a public official, or were asked for a bribe by those public officials, during the previous 12 months/ Proxy:
% of citizens who have encountered corruption while interacting with
service providers: 81.9%
2016 75.60% 2018 Rwanda Governance Score Card (Rwanda Governance Board)
16.6 Develop effective, accountable and transparent institutions at all levels
98. 16.6.1 Primary government expenditures as a proportion of original approved budget, by sector (or by budget codes or similar)
47.2% 2016/17 49% 2017/18 Budget Finance law 2017-2018 (MINECOFIN)
99. 16.6.2 Proportion of population satisfied with their last experience of public services/ citizens’ satisfaction with service delivery in all the 15 sectors in the 30 districts of Rwanda/ Proxy
74.30% 2015 69.3% 2018 Rwanda Citizen Report Card (Rwanda Governance Board)
16.9 By 2030, provide legal identity for all, including birth registration
100. 16.9.1 Proportion of children under 5 years of age whose births have been registered with a civil authority, by age
56% 2014/15 89% 2019 DHS (2014/15) Web based Registration ,CRVS July/2018-May 2019)
16.10 Ensure public access to information and protect fundamental freedoms, in accordance with national legislation and international agreements
101. 16.10.2 Number of countries that adopt and implement constitutional, statutory and/or policy guarantees for public access to information
Rwanda Access to Information ACT, 2013
16.a Strengthen relevant national institutions, including through international cooperation, for building capacity at all levels, in particular in developing countries, to prevent violence and combat terrorism and crime

108
L# SDGI official code (2017)
Indicators Baseline value
Progress value
Progress year
Data Source
102. 16.a.1 Existence of independent national human rights institutions in compliance with the Paris Principles
Rwanda National Commission for Human Rights
Goal 17. Strengthen the means of implementation and revitalize the Global Partnership for Sustainable Development
17.1 Strengthen domestic resource mobilization, including through international support to developing countries, to improve domestic capacity for tax and other revenue collection
103. 17.1.1 Total government revenue as a proportion of GDP, by source
Total revenue as proportion of GDP 22.9% (Tax+ Non Tax+Grant)
2016 Total revenue as proportion of GDP 24.1
% (Tax+ Non-Tax+Grant)
2017/18 Report of MINECOFIN
104. 17.1.2 Proportion of domestic budget funded by domestic taxes
62.40% 2016/17 67.00% 2018/19 Report of MINECOFIN
17.3 Mobilize additional financial resources for developing countries from multiple sources
105. 17.3.1 Foreign direct investments (FDI), official development assistance and South-South Cooperation as a proportion of total domestic budget
FDI/GDP 4.0% 2016 FDI/GDP: 4.1% Report of, MINECOFIN
17.4 Assist developing countries in attaining long-term debt sustainability through coordinated policies aimed at fostering debt financing, debt relief and debt restructuring, as appropriate, and address the external debt of highly indebted poor countries to reduce debt distress
106. 17.4.1 Debt service as a proportion of exports of goods and services/ (External Debt in nominal terms)/ Proxy
7% 2016 8% 2018 National Bank of Rwanda Report
17.8 Fully operationalize the technology bank and science, technology and innovation capacity-building mechanism for least developed countries by 2017 and enhance the use of enabling technology, in particular information and communications technology
107. 17.8.1 Proportion (%) of Households with internet access(proxy)
9% 2013-14 17.2 2016-17 NISR
17.11 Significantly increase the exports of developing countries, in particular with a view to doubling the least developed countries’ share of global exports by 2020
108. 17.11.1 Developing countries and least developed countries share of global
Rwanda's Exports stand at USD 1534.4M
2016 USD2039.2 M 2018 MACRO/MINECOFIN

109
L# SDGI official code (2017)
Indicators Baseline value
Progress value
Progress year
Data Source
exports/ (Exports goods and services in Million USD(proxy)
17.18 By 2020, enhance capacity-building support to developing countries, including for least developed countries and small island developing States, to increase significantly the availability of high-quality, timely and reliable data disaggregated by income, gender, age, race, ethnicity, migratory status, disability, geographic location and other characteristics relevant in national contexts
109. 17.18.2 Number of countries that have national statistical legislation that complies with the Fundamental Principles of Official Statistics
National Institute of Statistics of Rwanda has legal framework aligned to International standards.
NISR
110. 17.18.3 Number of countries with a national statistical plan that is fully funded and under implementation, by source of funding
National Institute of Statistics of Rwanda has a 5-years strategic plan called National Strategy for Development of Statistics, third generation.
Its implantation is funded by GoR and Development Partners
NISR
17.19 By 2030, build on existing initiatives to develop measurements of progress on sustainable development that complement gross domestic product, and support statistical capacity-building in developing countries
111. 17.19.2 Proportion of countries that (a) have conducted at least one population and housing census in the last 10 years; and (b) have achieved 100 per cent birth registration and 80 per cent death registration
In 2012, a population and housing census was
conducted
2012 The preparation for 2022 Population and housing
census are ongoing
NISR