Embed Size (px)
Citation preview
Kim
co Realty • 2015 A
nn
ual R
eport
3333 New Hyde Park Road
New Hyde Park, NY 11042
Tel: 516-869-9000
kimcorealty.com / blog.kimcorealty.com
R E A L T Y
R E A L T Y
PM S 2945
R E A L T YRGB
CMYK
2020 VISION2020 VISION
2 015 A NNUA L REP OR T
R E A L T Y
R E A L T Y
PM S 2945
R E A L T YRGB
CMYK
299287_Kimco_CVR_R2.indd 1 3/16/16 2:43 AM
Board of Directors
Milton CooperExecutive ChairmanKimco Realty Corporation
Philip E. Coviello (1v)(2)(3)
Partner *Latham & Watkins LLP
Richard G. Dooley (1)(2)(3v)
Lead Independent DirectorExecutive Vice President & Chief Investment Officer *Massachusetts Mutual Life Insurance Company
Joe Grills (1)(2v)(3)
Chief Investment Officer *IBM Retirement Fund
Conor C. FlynnPresident & Chief Executive OfficerKimco Realty Corporation
Frank Lourenso (1)(2)(3)
Executive Vice President *JPMorgan Chase & Co.
Colombe M. Nicholas (2)(3)
ConsultantFinanco Global Consulting
Richard Saltzman (2)(3)
Chief Executive Officer, President & member of the Board of DirectorsColony Capital, Inc.
* Retired(1) Audit Committee(2) Executive Compensation
Committee(3) Nominating and Corporate
Governance Committee(v) Chairman
Executive Management
Milton CooperExecutive Chairman
Conor C. FlynnPresident & Chief Executive Officer
Glenn G. CohenExecutive Vice President Chief Financial Officer & Treasurer
Ross CooperExecutive Vice President Chief Investment Officer
David Jamieson Executive Vice President Asset Management and Operations
Bruce RubensteinExecutive Vice President General Counsel and Secretary
U.S. Regional Management
Robert NadlerPresident Central Region
Paul D. PumaPresident Southern Region
Wilbur “Tom” Simmons IIIPresidentMid-Atlantic Region
Armand VasquezPresident Western Region
Josh WeinkranzPresident Northeast Region
Corporate Management
James J. Bruin Senior Vice President Portfolio Management
David F. Bujnicki Senior Vice President Investor Relations &Corporate Communications
Raymond EdwardsVice PresidentRetailer Services
Geoff GlazerSenior Vice PresidentNational Development
Leah LandroVice President Human Resources
Thomas TaddeoSenior Vice President Chief Information Officer
Dana ValentiVice President Risk Management
Harvey WeinrebVice President Tax
Paul WestbrookVice President Chief Accounting Officer
Corporate Directory
Kimco Realty Corporation (NYSE: KIM) is a real estate investment
trust (REIT) headquartered in New Hyde Park, N.Y., that is North
America’s largest publicly traded owner and operator of open-air
shopping centers. As of December 31, 2015, the company owned
interests in 564 open-air shopping centers comprising 90 million
square feet of leasable space across 38 U.S. states and Puerto Rico.
Letter from the Chairman 2 2015 Operating Review 4Form 10-K 21 Shareholder Information 128 Corporate Directory IBC
A BOU T THE COMPA N Y
299287_Kimco_CVR_R2.indd 2 3/16/16 2:43 AM
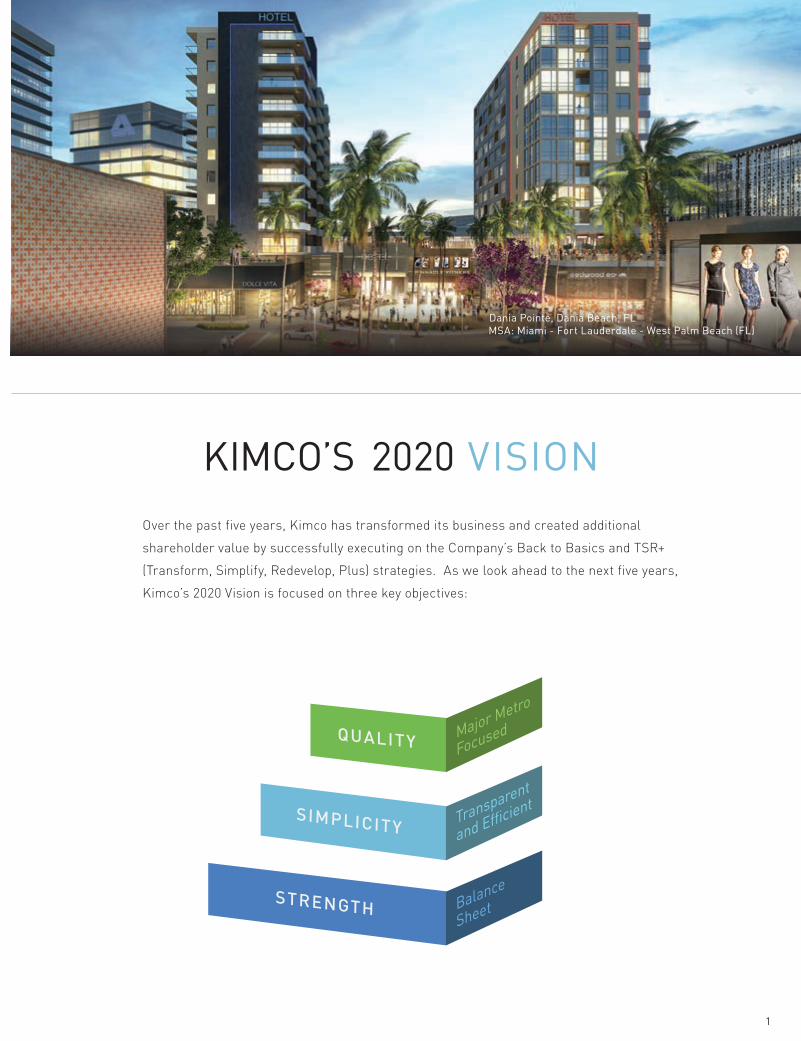
Over the past five years, Kimco has transformed its business and created additional
shareholder value by successfully executing on the Company’s Back to Basics and TSR+
(Transform, Simplify, Redevelop, Plus) strategies. As we look ahead to the next five years,
Kimco’s 2020 Vision is focused on three key objectives:
KIMCO’S 2020 VISION
1
QUALITY
SIMPLICITY
STRENGTH
Major Metro
Focused
Transparent
and Efficient
Balance
Sheet
MSA: Miami - Fort Lauderdale - West Palm Beach (FL)Dania Pointe, Dania Beach, FL
During this past winter when a record-breaking storm ren-dered me snowbound for a few days, I had a chance to reflect on our sector and our Company. I loved the open air shopping center business when I started Kimco in the 1950s with Marty Kimmel and I still love it today with my new part-ner Conor Flynn. When I look at all that has transpired over the last five years, it is clear that when it comes to retail real estate, our transformation back to our bread and but-ter neighborhood and community shopping center business was the right decision at the right time. I like to say that we are in the sweet spot in the ownership of retail real estate. Shopping centers anchored by grocers and/or national dis-counters, complemented by value and service-oriented ten-ants and located in high-quality demographic markets make us ideally situated to implement our 2020 Vision over the next five years.
Let me be a little more specific. History teaches us that in the retail real estate space a critical component of success is the ability to withstand economic change and downturns. As a result of our Back to Basics and TSR+ (Transformation, Simplification, Redevelopment and Plus business) strate-gies, we have become a resilient, safe, opportunistic retail real estate company. First, our real estate. We have trans-formed and simplified the footprint of our portfolio, trim-ming the number of assets from over 900 down to 600 (564 in the US, the remaining assets either under contract or earmarked for sale). These assets are predominantly located in major US metro markets with wonderful popula-tion and income demographics. They are simple and effi-cient to operate. This enables us to keep our operating costs down and pass these efficiencies on to our tenants.
Second, our tenants. Let’s take a closer look at our tenant base, and how that base drives traffic and contributes to our
resiliency. Many of our top tenants are grocers and off-price retailers, and over 85% of our Annualized Base Rent comes from sites anchored by one or more of these operators. Why is this so critical? As a basic necessity, the grocer has by definition an advantage over a traditional retailer of dis-cretionary items. This advantage translates into drawing power for the center, and a quality grocer will generate con-sistent traffic in any economic cycle. Similarly, off-price retailers, with their constantly changing merchandise and appeal to treasure hunting consumers, dominate the retail landscape today and drive traffic to our centers. Traffic drives sales for the other tenants in the center, particularly the small shops, which in turn allows us to demand higher rents. And when it comes to generating traffic, off-price retailers and grocers often have higher per square foot sales than department stores. And the good news is that many of our top grocers and off-price retailers are seeking to expand their operations.
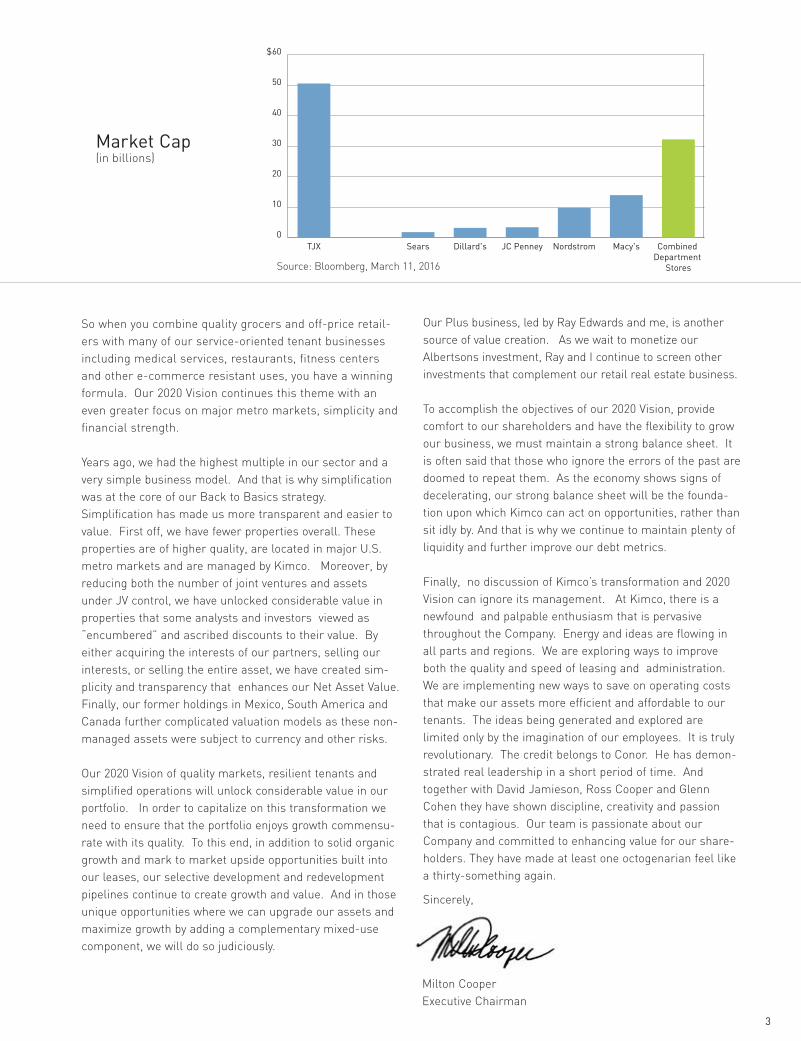
TJX Companies (“TJX”) and Ross Stores are two of our larg-est tenants. When you compare the market cap of TJX and Ross Stores from 10 years ago and today, the increase of 4-5x is nothing short of astonishing. In contrast, the mar-ket cap of traditional department store retailers during the same period experienced either a dramatic decline or remained stagnant. And today, the market cap of TJX alone is greater than the combined market cap of many major department stores. As for resiliency over varying economic cycles, TJX produced positive annual comp stores sales through the last four recessions. And in a slow growth envi-ronment for many retailers, TJX and Ross Stores recently reported comparable store sales of 5% and 4%, respectively, over the previous year. We believe our continued focus on top-quality operators such as Royal Ahold, Albertson’s, Kroger, Sprouts Farmers Market, Trader Joe’s, Home Depot, TJX, Ross Stores and Burlington Coat will continue to set us apart from our peers.
So when you combine quality grocers and off-price retail-ers with many of our service-oriented tenant businessesincluding medical services, restaurants, fitness centersand other e-commerce resistant uses, you have a winningformula. Our 2020 Vision continues this theme with aneven greater focus on major metro markets, simplicity andfinancial strength.
Years ago, we had the highest multiple in our sector and a very simple business model. And that is why simplification was at the core of our Back to Basics strategy. Simplification has made us more transparent and easier to value. First off, we have fewer properties overall. These properties are of higher quality, are located in major U.S. metro markets and are managed by Kimco. Moreover, by reducing both the number of joint ventures and assets under JV control, we have unlocked considerable value in properties that some analysts and investors viewed as “encumbered” and ascribed discounts to their value. By either acquiring the interests of our partners, selling our interests, or selling the entire asset, we have created sim-plicity and transparency that enhances our Net Asset Value. Finally, our former holdings in Mexico, South America and Canada further complicated valuation models as these non-managed assets were subject to currency and other risks.
Our 2020 Vision of quality markets, resilient tenants and simplified operations will unlock considerable value in our portfolio. In order to capitalize on this transformation we need to ensure that the portfolio enjoys growth commensu-rate with its quality. To this end, in addition to solid organic growth and mark to market upside opportunities built into our leases, our selective development and redevelopment pipelines continue to create growth and value. And in those unique opportunities where we can upgrade our assets and maximize growth by adding a complementary mixed-use component, we will do so judiciously.
CH A IRM A N’S LE T TER
Dear Fellow Shareholders and Associates
Our talented team has managed the successful transformation of our business
with a clear and focused vision on future growth.
2
resiliency. Many of our top tenants are grocers and off-price retailers, and over 85% of our Annualized Base Rent comes from sites anchored by one or more of these operators. Why is this so critical? As a basic necessity, the grocer has by definition an advantage over a traditional retailer of dis-cretionary items. This advantage translates into drawing power for the center, and a quality grocer will generate con-sistent traffic in any economic cycle. Similarly, off-price retailers, with their constantly changing merchandise and appeal to treasure hunting consumers, dominate the retail landscape today and drive traffic to our centers. Traffic drives sales for the other tenants in the center, particularly the small shops, which in turn allows us to demand higher rents. And when it comes to generating traffic, off-price retailers and grocers often have higher per square foot sales than department stores. And the good news is that many of our top grocers and off-price retailers are seeking to expand their operations.
TJX Companies (“TJX”) and Ross Stores are two of our larg-est tenants. When you compare the market cap of TJX and Ross Stores from 10 years ago and today, the increase of 4-5x is nothing short of astonishing. In contrast, the mar-ket cap of traditional department store retailers during the same period experienced either a dramatic decline or remained stagnant. And today, the market cap of TJX alone is greater than the combined market cap of many major department stores. As for resiliency over varying economic cycles, TJX produced positive annual comp stores sales through the last four recessions. And in a slow growth envi-ronment for many retailers, TJX and Ross Stores recently reported comparable store sales of 5% and 4%, respectively, over the previous year. We believe our continued focus on top-quality operators such as Royal Ahold, Albertson’s, Kroger, Sprouts Farmers Market, Trader Joe’s, Home Depot, TJX, Ross Stores and Burlington Coat will continue to set us apart from our peers.
So when you combine quality grocers and off-price retail-ers with many of our service-oriented tenant businesses including medical services, restaurants, fitness centers and other e-commerce resistant uses, you have a winning formula. Our 2020 Vision continues this theme with an even greater focus on major metro markets, simplicity and financial strength.
Years ago, we had the highest multiple in our sector and a very simple business model. And that is why simplification was at the core of our Back to Basics strategy. Simplification has made us more transparent and easier to value. First off, we have fewer properties overall. These properties are of higher quality, are located in major U.S. metro markets and are managed by Kimco. Moreover, by reducing both the number of joint ventures and assets under JV control, we have unlocked considerable value in properties that some analysts and investors viewed as “encumbered” and ascribed discounts to their value. By either acquiring the interests of our partners, selling our interests, or selling the entire asset, we have created sim-plicity and transparency that enhances our Net Asset Value. Finally, our former holdings in Mexico, South America and Canada further complicated valuation models as these non-managed assets were subject to currency and other risks.
Our 2020 Vision of quality markets, resilient tenants and simplified operations will unlock considerable value in our portfolio. In order to capitalize on this transformation we need to ensure that the portfolio enjoys growth commensu-rate with its quality. To this end, in addition to solid organic growth and mark to market upside opportunities built into our leases, our selective development and redevelopment pipelines continue to create growth and value. And in those unique opportunities where we can upgrade our assets and maximize growth by adding a complementary mixed-use component, we will do so judiciously.
Our Plus business, led by Ray Edwards and me, is another source of value creation. As we wait to monetize our Albertsons investment, Ray and I continue to screen other investments that complement our retail real estate business.
To accomplish the objectives of our 2020 Vision, provide comfort to our shareholders and have the flexibility to grow our business, we must maintain a strong balance sheet. It is often said that those who ignore the errors of the past are doomed to repeat them. As the economy shows signs of decelerating, our strong balance sheet will be the founda-tion upon which Kimco can act on opportunities, rather than sit idly by. And that is why we continue to maintain plenty of liquidity and further improve our debt metrics.
Finally, no discussion of Kimco’s transformation and 2020 Vision can ignore its management. At Kimco, there is a newfound and palpable enthusiasm that is pervasive throughout the Company. Energy and ideas are flowing in all parts and regions. We are exploring ways to improve both the quality and speed of leasing and administration. We are implementing new ways to save on operating costs that make our assets more efficient and affordable to our tenants. The ideas being generated and explored are limited only by the imagination of our employees. It is truly revolutionary. The credit belongs to Conor. He has demon-strated real leadership in a short period of time. And together with David Jamieson, Ross Cooper and Glenn Cohen they have shown discipline, creativity and passion that is contagious. Our team is passionate about our Company and committed to enhancing value for our share-holders. They have made at least one octogenarian feel like a thirty-something again.
Sincerely,
Milton CooperExecutive Chairman
3
0
10
20
30
40
50
60
Combined Department
Stores
Macy'sNordstromJC PenneyDillard'sSearsTJX
50.5
1.8 3.2 3.4
9.813.9
32.2
$
Market Cap (in billions)
Source: Bloomberg, March 11, 2016
Dear Fellow Shareholders and Associates:
Five years ago, Kimco embarked on a mission to
create additional shareholder value by refocusing
on our core market of premier open-air shopping
centers in the U.S. By successfully executing on
our Back to Basics strategy, whereby we disposed
of non-retail assets, and our TSR+ strategy, which
simplified our business model and dramatically
transformed our portfolio, Kimco has reemerged
as the leader in our industry. We streamlined our
portfolio from a scattered collection of assets
across the U.S., Mexico, South America and
Canada, into a tightly concentrated footprint of
high-quality asset clusters in major metro markets
in the U.S. We believe our focused, simplified port-
folio provides the greatest opportunity to increase
Net Asset Value (NAV) and meet our primary
objective of driving Total Shareholder Return
(TSR). Indeed, since 2010, we have achieved
Total Shareholder Return of 79.8 percent,
including TSR of 9.4 percent in 2015 despite a
volatile market environment.
In 2015, Kimco’s Transform, Simplify, Redevelop,
Plus (TSR+) initiatives produced solid results:
improved occupancy, double-digit leasing spreads
and continued same-site growth in Net Operating
Income (NOI) for our U.S. properties. We sold non-
core assets in the U.S., exited Mexico and South
America, and sharply reduced our investments in
joint ventures and in Canada. Our redevelopment
and development projects contributed to higher
NOI in 2015 while laying the groundwork for
future growth.
Our team spent considerable time during 2015
developing plans for our future, under the direction
of newly appointed Chief Executive Officer, Conor
Flynn. At our Investor Day in December, our man-
agement team presented our 2020 Vision, a five-
year plan designed to propel our business to new
heights. The essence of the plan is to enhance our
2015 OPER ATING RE V IE W
4
A Clear and Focused Vision
We believe our focused, simplified
portfolio provides the greatest
opportunity to increase Net Asset
Value (NAV) and meet our primary
objective of driving Total Shareholder
Return (TSR).
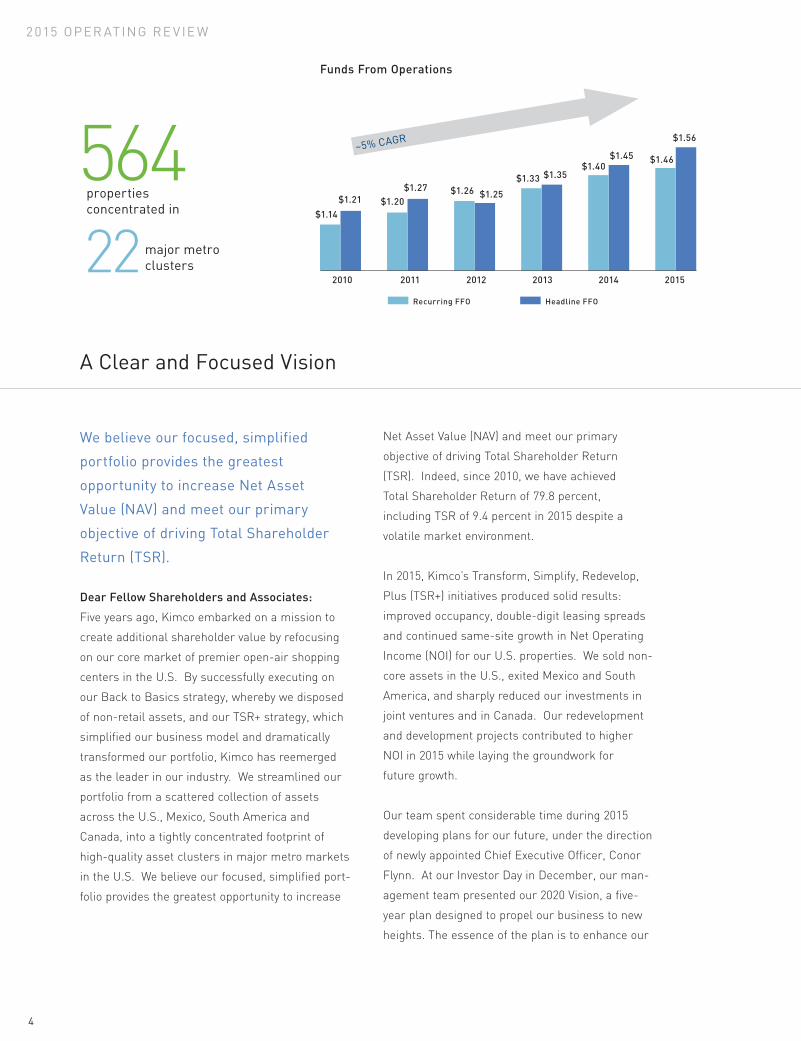
$1.56
$1.46$1.45$1.40
$1.35
$1.25$1.26$1.27$1.20$1.21
$1.14
2010 2011
Recurring FFO Headline FFO
2012 2013 2014 2015
Funds From Operations
~5% CAGR
properties concentrated in
564major metro clusters22
$1.33
portfolio quality, simplify our business and
strengthen our balance sheet. We believe our
2020 Vision will enable us to capitalize on favorable
trends in our industry and deliver additional value
for our shareholders.
TSR+ Drives Strong Results
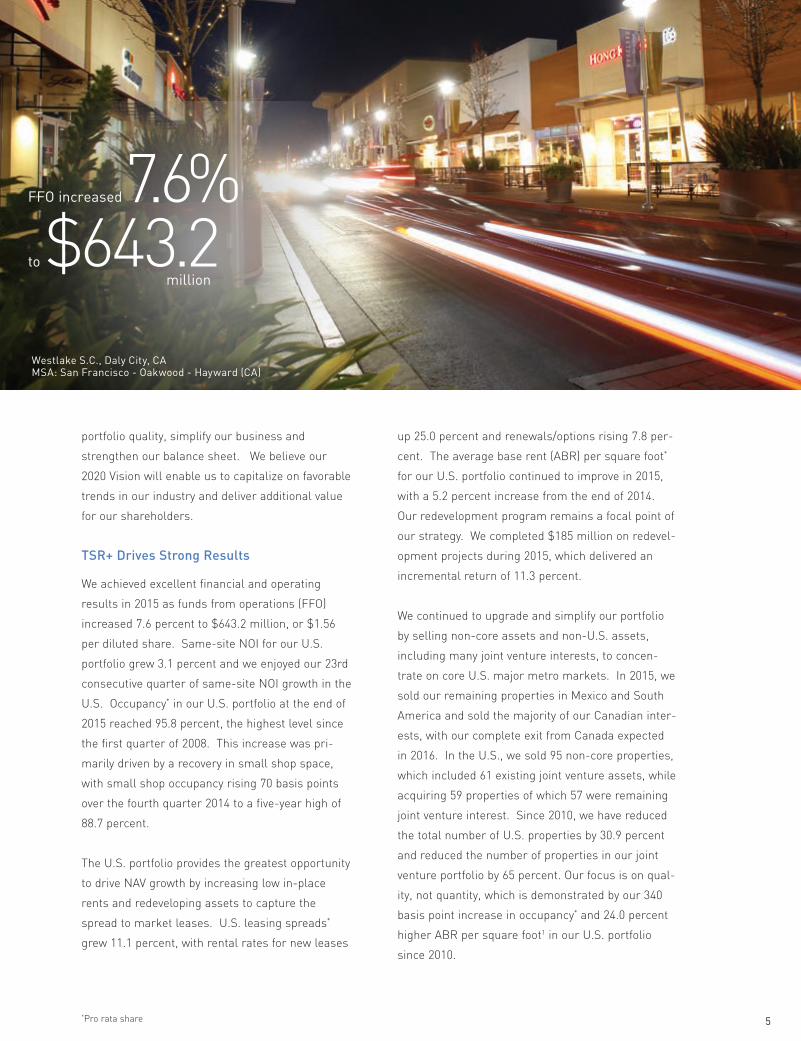
We achieved excellent financial and operating
results in 2015 as funds from operations (FFO)
increased 7.6 percent to $643.2 million, or $1.56
per diluted share. Same-site NOI for our U.S.
portfolio grew 3.1 percent and we enjoyed our 23rd
consecutive quarter of same-site NOI growth in the
U.S. Occupancy* in our U.S. portfolio at the end of
2015 reached 95.8 percent, the highest level since
the first quarter of 2008. This increase was pri-
marily driven by a recovery in small shop space,
with small shop occupancy rising 70 basis points
over the fourth quarter 2014 to a five-year high of
88.7 percent.
The U.S. portfolio provides the greatest opportunity
to drive NAV growth by increasing low in-place
rents and redeveloping assets to capture the
spread to market leases. U.S. leasing spreads*
grew 11.1 percent, with rental rates for new leases
up 25.0 percent and renewals/options rising 7.8 per-
cent. The average base rent (ABR) per square foot*
for our U.S. portfolio continued to improve in 2015,
with a 5.2 percent increase from the end of 2014.
Our redevelopment program remains a focal point of
our strategy. We completed $185 million on redevel-
opment projects during 2015, which delivered an
incremental return of 11.3 percent.
We continued to upgrade and simplify our portfolio
by selling non-core assets and non-U.S. assets,
including many joint venture interests, to concen-
trate on core U.S. major metro markets. In 2015, we
sold our remaining properties in Mexico and South
America and sold the majority of our Canadian inter-
ests, with our complete exit from Canada expected
in 2016. In the U.S., we sold 95 non-core properties,
which included 61 existing joint venture assets, while
acquiring 59 properties of which 57 were remaining
joint venture interest. Since 2010, we have reduced
the total number of U.S. properties by 30.9 percent
and reduced the number of properties in our joint
venture portfolio by 65 percent. Our focus is on qual-
ity, not quantity, which is demonstrated by our 340
basis point increase in occupancy* and 24.0 percent
higher ABR per square foot1 in our U.S. portfolio
since 2010.
*Pro rata share
FFO increased7.6%to $643.2
million
5
Westlake S.C., Daly City, CAMSA: San Francisco - Oakwood - Hayward (CA)
Following the success of Kimco’s TSR+ strategy,
our team challenged itself to design a growth
strategy that builds on our accomplishments and
continues to create additional value for our share-
holders. Our 2020 Vision provides just that
strategy for the next five years. It begins with our
portfolio of high-quality assets located in major
metro markets in the U.S. It is in these markets
where we will continue to seek opportunities to
acquire and develop assets.
Kimco’s high-quality portfolio provides unique
opportunities for driving future NAV growth. Our
564 properties are now concentrated in 22 major
metro area clusters across the U.S. These mar-
kets share a number of attractive demographic
characteristics, including the highest population
density and growth rates and above-average levels
of household income and education. These demo-
graphics translate into greater traffic and sales
volumes for our retailers. There are also signifi-
cant barriers to entry in many of these markets
due to high land values and zoning restrictions.
Also, our strongest retailers continue to grow
store count and we are starting to see activity pick
up in every category size. Big box retailers are
back looking for space, junior box players continue
to be the most aggressive, traditional and specialty
grocery store chains are active, and our small
shop leasing trends are positive. The result is a
healthy market environment for open-air shopping
centers, with rising asset values in these major
metro markets.
Our largest centers continue to provide the domi-
nant share of NOI, with roughly half of the total NOI
coming from our top 100 properties and 85 percent
coming from our top 300 properties in 2015. We
expect this trend to accelerate as our 2020 Vision
focuses our redevelopment and development
efforts in our most attractive metro markets.
In addition to favorable demographics, Kimco’s
properties benefit from having high-quality tenants,
with over half of our tenants having investment
grade credit ratings. Over 70 percent of our
properties are grocery anchored, which drives
increased traffic and sales volumes and translates
into higher occupancy and ABR.
In the next five years, the 2020 Vision showcases the trajectory of
the high-quality portfolio.
2020 Vision - High-Quality Portfolio
6
7
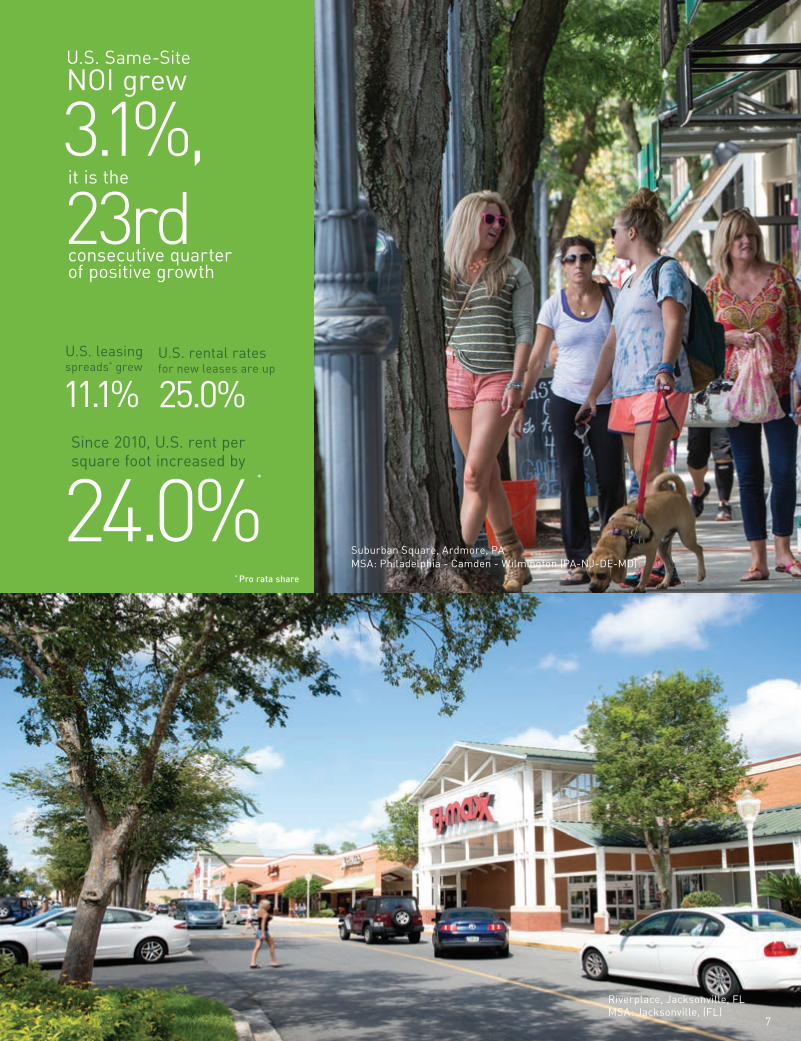
Since 2010, U.S. rent persquare foot increased by
24.0%
U.S. leasing spreads* grew
11.1%
U.S. Same-Site NOI grew
3.1%,
TSR
TOTAL SHAREHOLDER RETURNSince IPO1 11/29/91-11/30/15
(1) Source: Bloomberg
23rd
MSA: Philadelphia - Camden - Wilmington (PA-NJ-DE-MD)Suburban Square, Ardmore, PA
Riverplace, Jacksonville, FL MSA: Jacksonville, (FL)
* Pro rata share
*
U.S. rental rates for new leases are up
25.0%
it is the
consecutive quarter of positive growth
7
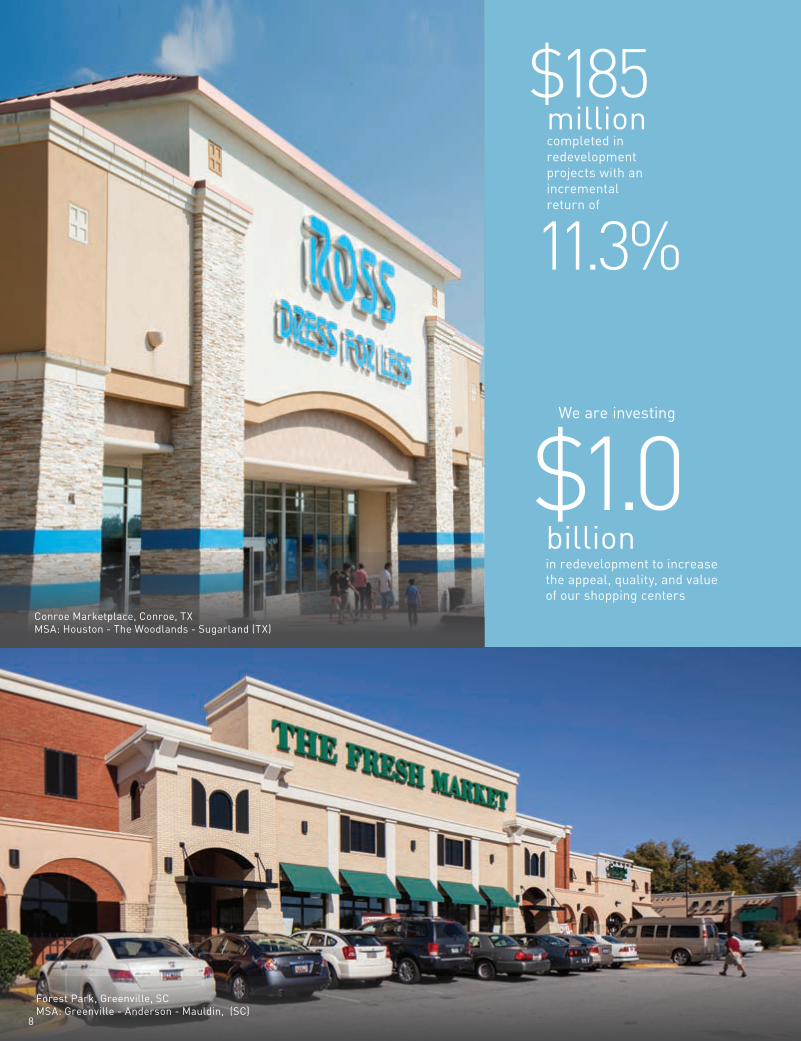
We are investing
$1.0 in redevelopment to increase the appeal, quality, and value of our shopping centers
Conroe Marketplace, Conroe, TX MSA: Houston - The Woodlands - Sugarland (TX)
$185completed in redevelopment projects with an incremental return of
11.3%
million
billion
Forest Park, Greenville, SC MSA: Greenville - Anderson - Mauldin, (SC)
8
We are focused on generating NOI growth from multiple sources,
both internal and external, that are transparent and easy for
investors to quantify.
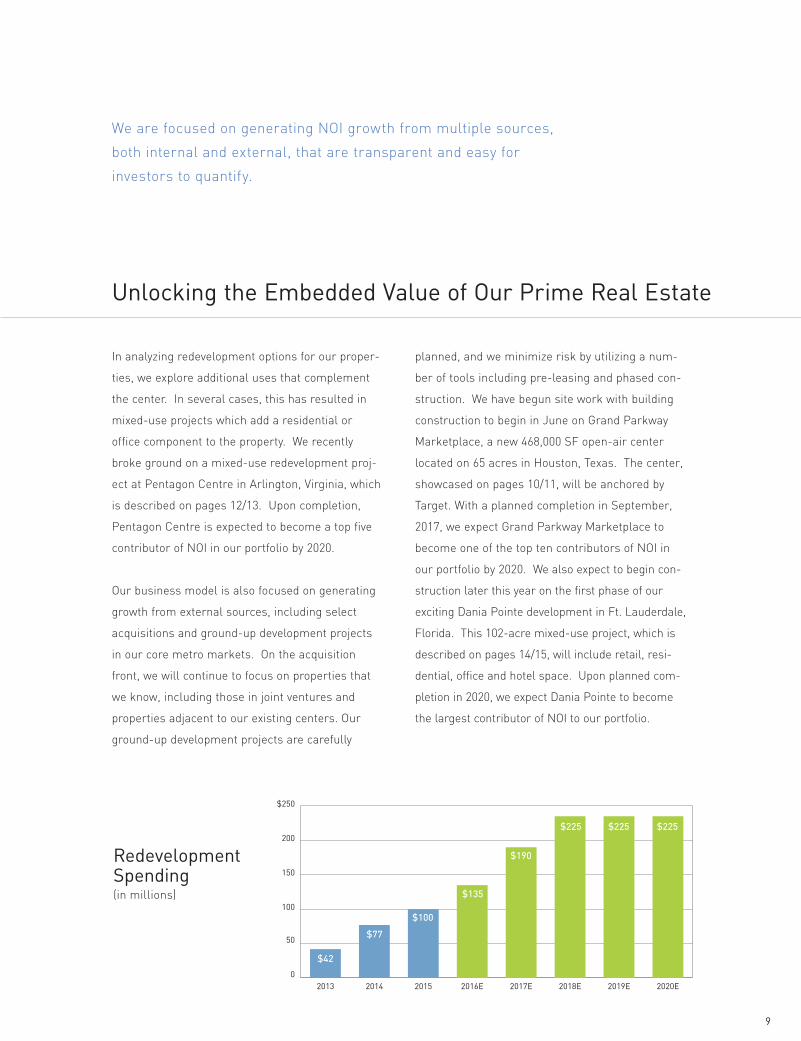
In analyzing redevelopment options for our proper-
ties, we explore additional uses that complement
the center. In several cases, this has resulted in
mixed-use projects which add a residential or
office component to the property. We recently
broke ground on a mixed-use redevelopment proj-
ect at Pentagon Centre in Arlington, Virginia, which
is described on pages 12/13. Upon completion,
Pentagon Centre is expected to become a top five
contributor of NOI in our portfolio by 2020.
Our business model is also focused on generating
growth from external sources, including select
acquisitions and ground-up development projects
in our core metro markets. On the acquisition
front, we will continue to focus on properties that
we know, including those in joint ventures and
properties adjacent to our existing centers. Our
ground-up development projects are carefully
planned, and we minimize risk by utilizing a num-
ber of tools including pre-leasing and phased con-
struction. We have begun site work with building
construction to begin in June on Grand Parkway
Marketplace, a new 468,000 SF open-air center
located on 65 acres in Houston, Texas. The center,
showcased on pages 10/11, will be anchored by
Target. With a planned completion in September,
2017, we expect Grand Parkway Marketplace to
become one of the top ten contributors of NOI in
our portfolio by 2020. We also expect to begin con-
struction later this year on the first phase of our
exciting Dania Pointe development in Ft. Lauderdale,
Florida. This 102-acre mixed-use project, which is
described on pages 14/15, will include retail, resi-
dential, office and hotel space. Upon planned com-
pletion in 2020, we expect Dania Pointe to become
the largest contributor of NOI to our portfolio.
Unlocking the Embedded Value of Our Prime Real Estate
0
50
100
150
200
$250
2020E2019E2018E2017E2016E201520142013
$42
$77
$100
$135
$190
$225 $225 $225
Redevelopment Spending (in millions)
9

Grand Parkway MarketplaceSpring, TX
MSA: Houston-The Woodlands-Sugar Land (TX)
CA SE S TUDY 1
10
$30 millionRetail Sq. Ft. 468,000Cost $86M Anticipated Stabilization 2Q 2018
The Project
value creation
Phase I
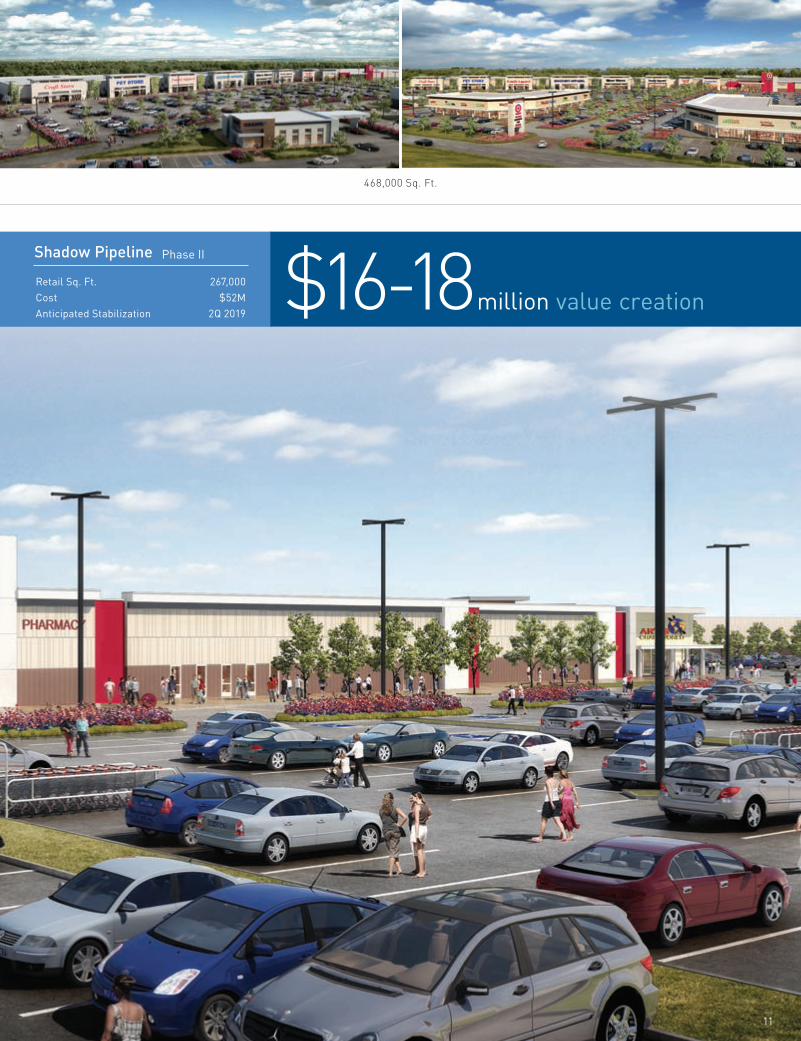
Shadow Pipeline
Retail Sq. Ft. 267,000Cost $52M Anticipated Stabilization 2Q 2019
$16-18 million value creation
Phase II
468,000 Sq. Ft.
11

Pentagon CentrePentagon City, VA
MSA: Washington-Arlington-Alexandria (DC-VA-MD-WV)
CA SE S TUDY 2
Retail / Residential / Parking GaragePhase I Cost $250MEstimated Completion 3Q 2020 value creation~$100 million
The Project
12
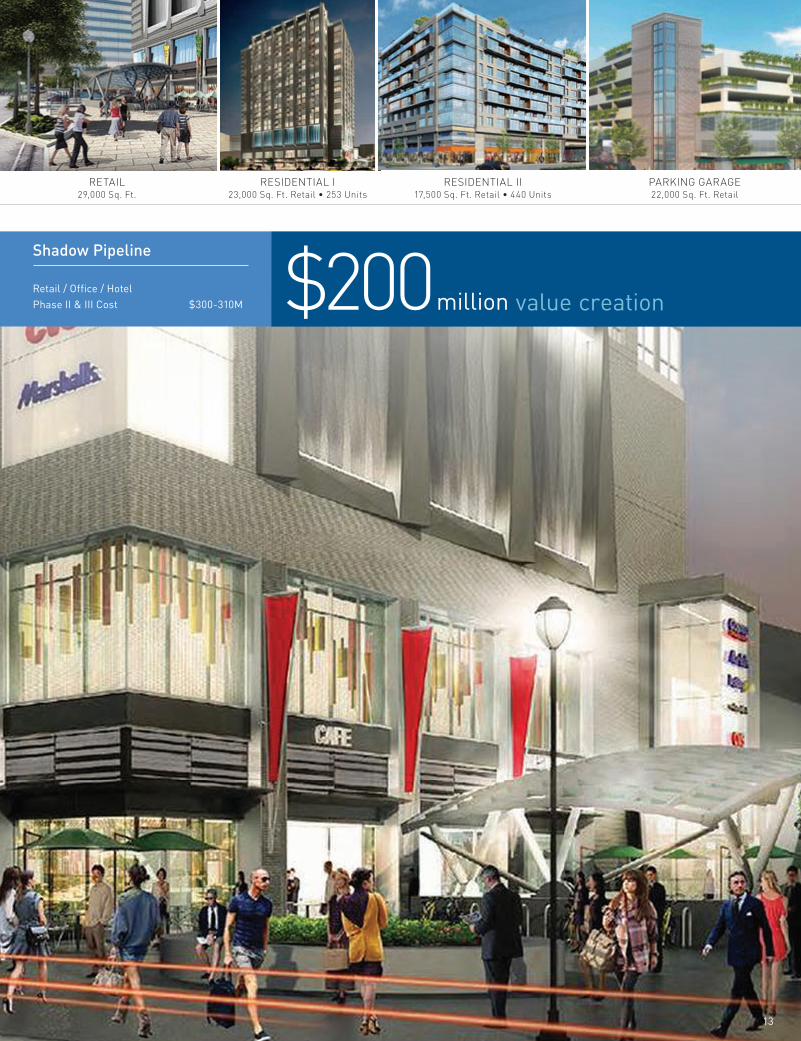
RETAIL29,000 Sq. Ft.
RESIDENTIAL I23,000 Sq. Ft. Retail • 253 Units
RESIDENTIAL II 17,500 Sq. Ft. Retail • 440 Units
PARKING GARAGE22,000 Sq. Ft. Retail
Retail / Office / HotelPhase II & III Cost $300-310M $200 million
Shadow Pipeline
13
value creation
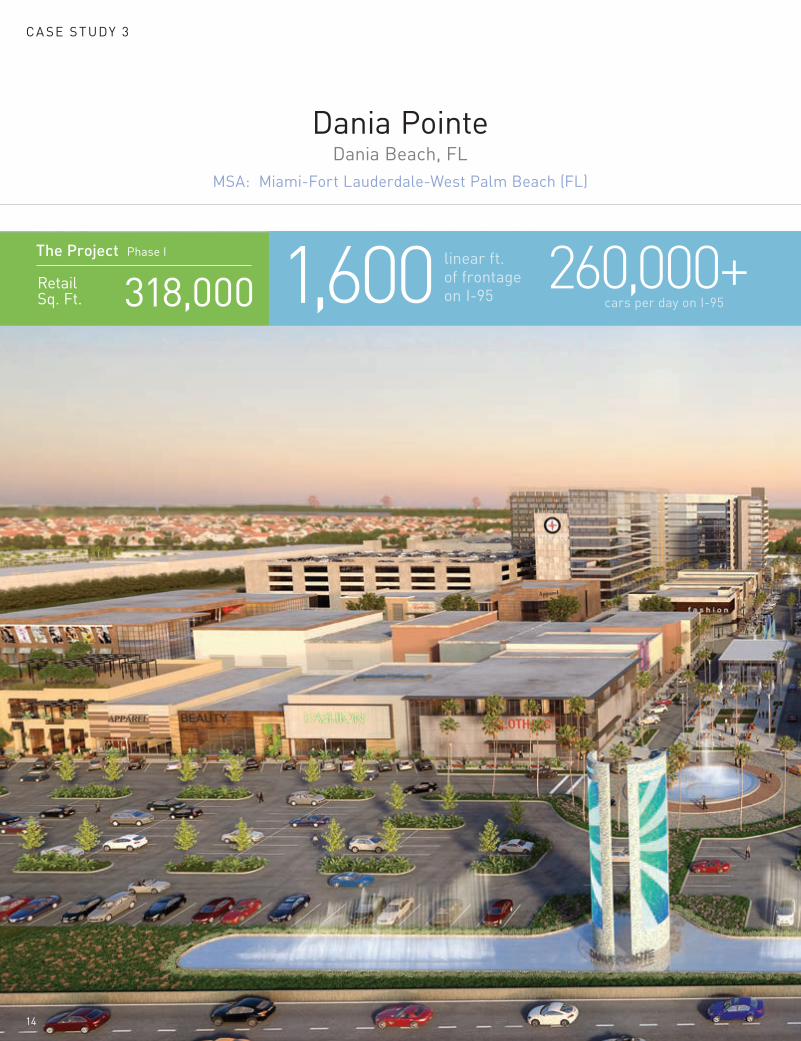
Dania PointeDania Beach, FL
MSA: Miami-Fort Lauderdale-West Palm Beach (FL)
CA SE S TUDY 3
1,600
linear ft. of frontage on I-95 cars per day on I-95
260,000+RetailSq. Ft. 318,000The Project Phase I
14

RETAIL RESIDENTIAL • HOTEL • OFFICE350 Units • 200,000 Sq. Ft. Office • 300 Hotel Rooms
2.5 million sq. ft. of mixed-use
more than 10,000 hotel rooms
within a 5-mile radius
The Project Phase II
RetailSq. Ft. 574,000
15
Going forward with our 2020 Vision, we are extending these goals of simplicity and efficiency to encompass our entire business model.
One of the hallmarks of our TSR+ strategy was to
simplify the ownership structure of our properties
by reducing our participation in joint ventures and
make our operations more efficient. Going forward
with our 2020 Vision, we are extending these goals
of simplicity and efficiency to encompass our entire
business model. We are focused on generating
annual NOI growth in a range of 4.50-6.25 percent
from both internal and external sources that are
transparent and easy for investors to quantify.
We expect the majority of our NOI growth over the
next five years to come from internal sources,
taking advantage of organic rent increases, lease
up in small shop space and value creation
opportunities from expiring below-market leases.
Our large portfolio of high-quality assets also
provides numerous opportunities for redevelopment
to create value and increase NOI. These opportunities
include demolishing and rebuilding centers,
repositioning anchor tenant spaces and building
stand-alone stores on outparcels.
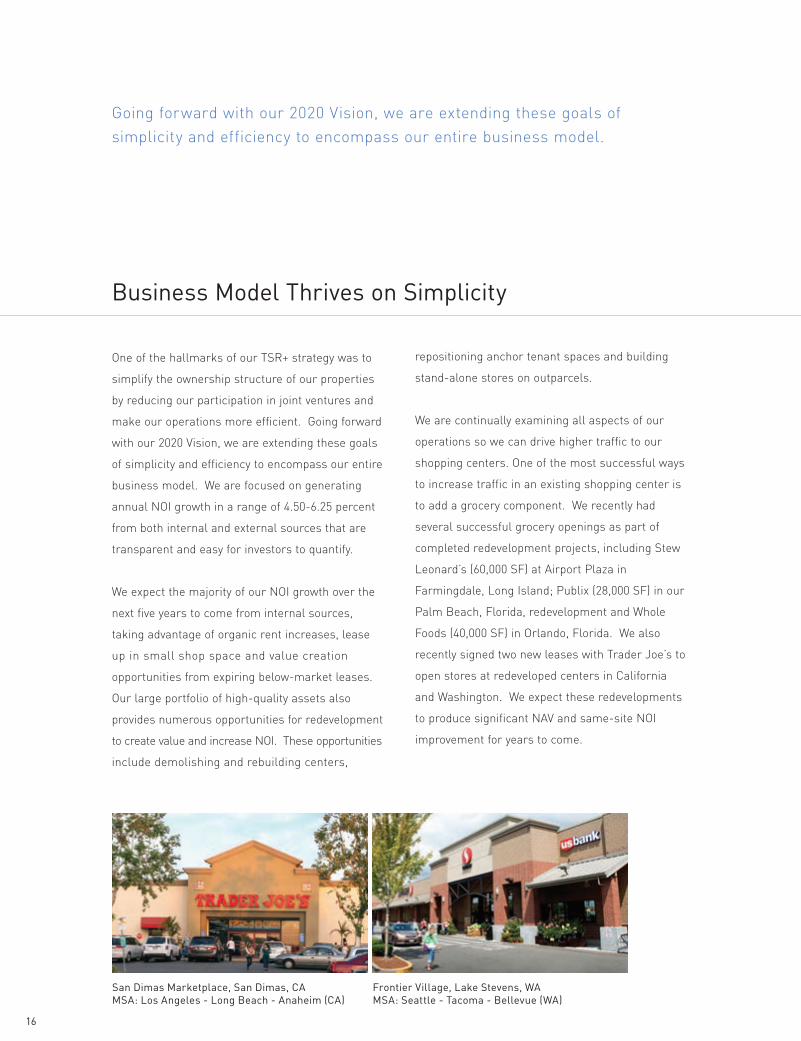
We are continually examining all aspects of our
operations so we can drive higher traffic to our
shopping centers. One of the most successful ways
to increase traffic in an existing shopping center is
to add a grocery component. We recently had
several successful grocery openings as part of
completed redevelopment projects, including Stew
Leonard’s (60,000 SF) at Airport Plaza in
Farmingdale, Long Island; Publix (28,000 SF) in our
Palm Beach, Florida, redevelopment and Whole
Foods (40,000 SF) in Orlando, Florida. We also
recently signed two new leases with Trader Joe’s to
open stores at redeveloped centers in California
and Washington. We expect these redevelopments
to produce significant NAV and same-site NOI
improvement for years to come.
Business Model Thrives on Simplicity
Frontier Village, Lake Stevens, WA MSA: Seattle - Tacoma - Bellevue (WA)
San Dimas Marketplace, San Dimas, CAMSA: Los Angeles - Long Beach - Anaheim (CA)
16
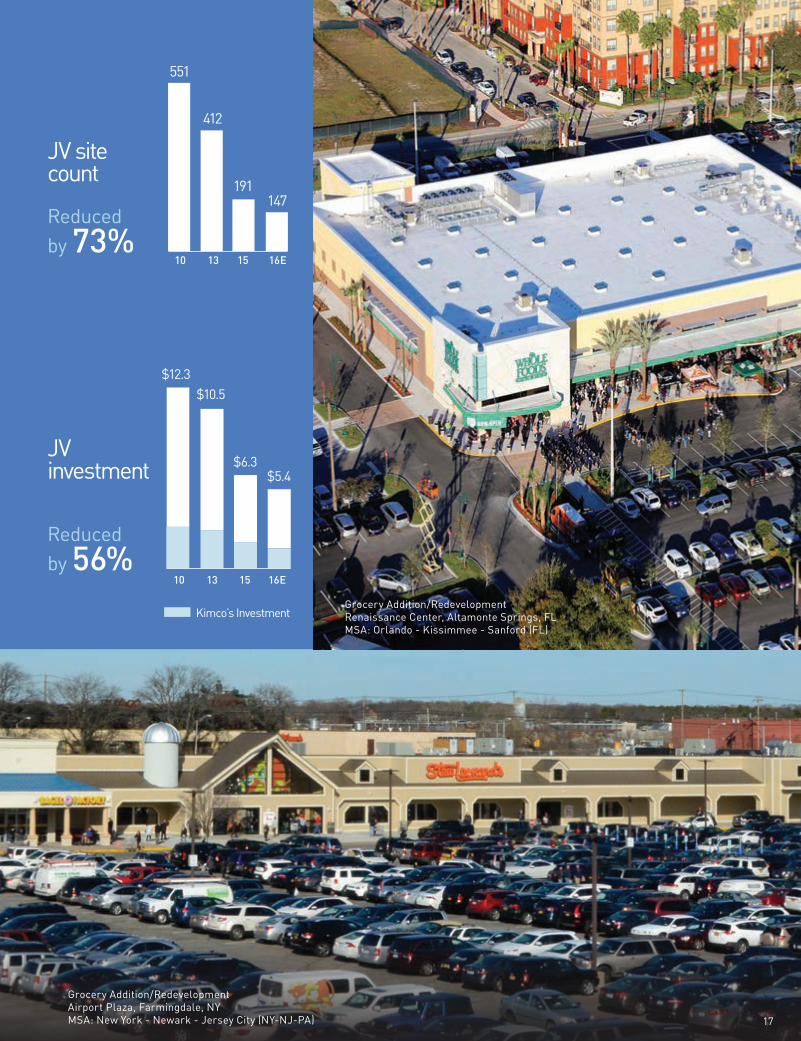
JV site count
JV investment
Grocery Addition/RedevelopmentRenaissance Center, Altamonte Springs, FL MSA: Orlando - Kissimmee - Sanford (FL)
10 13 15 16E
551
412
191147
Reduced by 73%
Reduced by 56%
$12.3
$4.0 $3.8 $2.2 $1.7
$10.5
$6.3$5.4
10 13 15 16E
Kimco’s Investment
Grocery Addition/Redevelopment Airport Plaza, Farmingdale, NY MSA: New York - Newark - Jersey City (NY-NJ-PA) 17
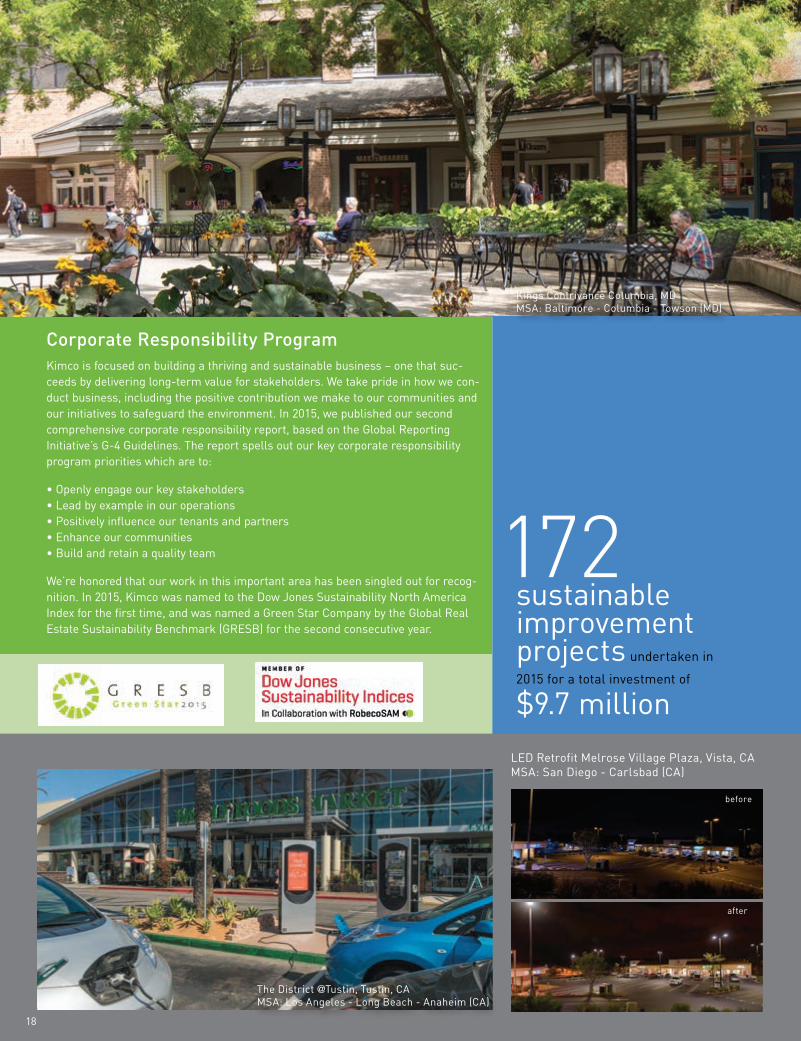
172sustainable improvement
projects undertaken in
2015 for a total investment of
$9.7 million
Corporate Responsibility ProgramKimco is focused on building a thriving and sustainable business – one that suc-ceeds by delivering long-term value for stakeholders. We take pride in how we con-duct business, including the positive contribution we make to our communities and our initiatives to safeguard the environment. In 2015, we published our second comprehensive corporate responsibility report, based on the Global Reporting Initiative’s G-4 Guidelines. The report spells out our key corporate responsibility program priorities which are to:
• Openly engage our key stakeholders• Lead by example in our operations• Positively influence our tenants and partners • Enhance our communities • Build and retain a quality team
We’re honored that our work in this important area has been singled out for recog-nition. In 2015, Kimco was named to the Dow Jones Sustainability North America Index for the first time, and was named a Green Star Company by the Global Real Estate Sustainability Benchmark (GRESB) for the second consecutive year.
18
before
after
LED Retrofit Melrose Village Plaza, Vista, CA MSA: San Diego - Carlsbad (CA)
Kings Contrivance Columbia, MD MSA: Baltimore - Columbia - Towson (MD)
The District @Tustin, Tustin, CA MSA: Los Angeles - Long Beach - Anaheim (CA)
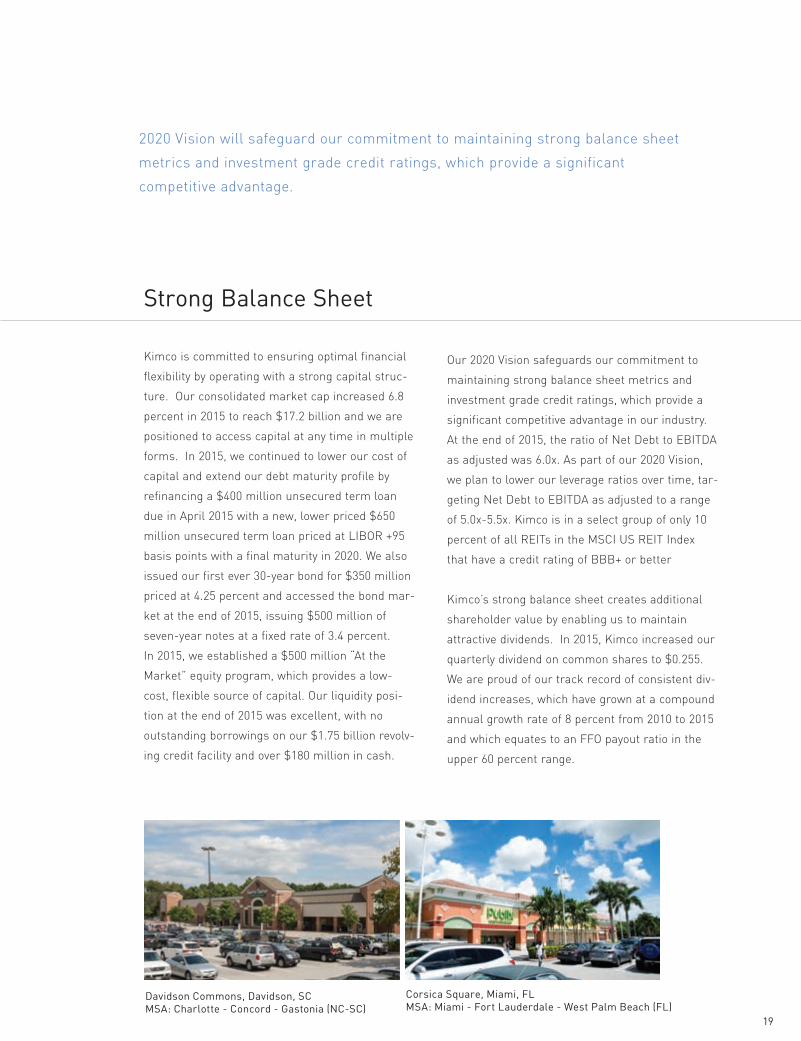
Kimco is committed to ensuring optimal financial
flexibility by operating with a strong capital struc-
ture. Our consolidated market cap increased 6.8
percent in 2015 to reach $17.2 billion and we are
positioned to access capital at any time in multiple
forms. In 2015, we continued to lower our cost of
capital and extend our debt maturity profile by
refinancing a $400 million unsecured term loan
due in April 2015 with a new, lower priced $650
million unsecured term loan priced at LIBOR +95
basis points with a final maturity in 2020. We also
issued our first ever 30-year bond for $350 million
priced at 4.25 percent and accessed the bond mar-
ket at the end of 2015, issuing $500 million of
seven-year notes at a fixed rate of 3.4 percent.
In 2015, we established a $500 million “At the
Market” equity program, which provides a low-
cost, flexible source of capital. Our liquidity posi-
tion at the end of 2015 was excellent, with no
outstanding borrowings on our $1.75 billion revolv-
ing credit facility and over $180 million in cash.
Our 2020 Vision safeguards our commitment to
maintaining strong balance sheet metrics and
investment grade credit ratings, which provide a
significant competitive advantage in our industry.
At the end of 2015, the ratio of Net Debt to EBITDA
as adjusted was 6.0x. As part of our 2020 Vision,
we plan to lower our leverage ratios over time, tar-
geting Net Debt to EBITDA as adjusted to a range
of 5.0x-5.5x. Kimco is in a select group of only 10
percent of all REITs in the MSCI US REIT Index
that have a credit rating of BBB+ or better
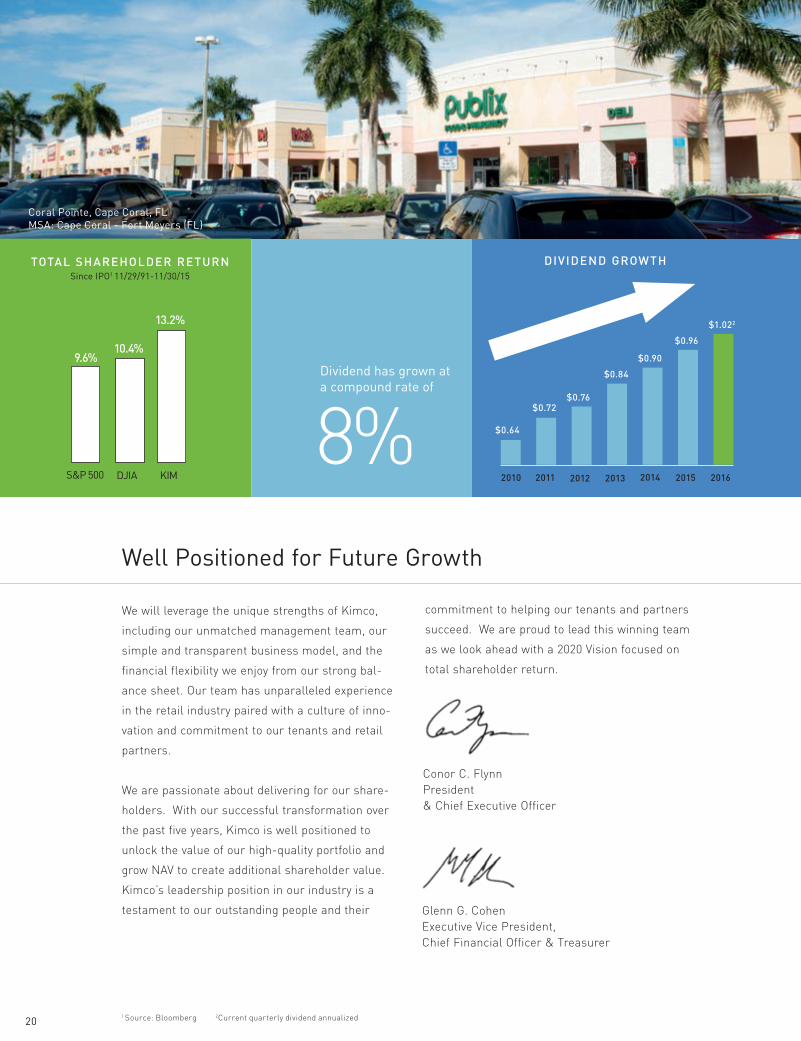
Kimco’s strong balance sheet creates additional
shareholder value by enabling us to maintain
attractive dividends. In 2015, Kimco increased our
quarterly dividend on common shares to $0.255.
We are proud of our track record of consistent div-
idend increases, which have grown at a compound
annual growth rate of 8 percent from 2010 to 2015
and which equates to an FFO payout ratio in the
upper 60 percent range.
Strong Balance Sheet
2020 Vision will safeguard our commitment to maintaining strong balance sheet
metrics and investment grade credit ratings, which provide a significant
competitive advantage.
Corsica Square, Miami, FL MSA: Miami - Fort Lauderdale - West Palm Beach (FL)
Davidson Commons, Davidson, SC MSA: Charlotte - Concord - Gastonia (NC-SC)
19
We will leverage the unique strengths of Kimco,
including our unmatched management team, our
simple and transparent business model, and the
financial flexibility we enjoy from our strong bal-
ance sheet. Our team has unparalleled experience
in the retail industry paired with a culture of inno-
vation and commitment to our tenants and retail
partners.
We are passionate about delivering for our share-
holders. With our successful transformation over
the past five years, Kimco is well positioned to
unlock the value of our high-quality portfolio and
grow NAV to create additional shareholder value.
Kimco’s leadership position in our industry is a
testament to our outstanding people and their
commitment to helping our tenants and partners
succeed. We are proud to lead this winning team
as we look ahead with a 2020 Vision focused on
total shareholder return.
Well Positioned for Future Growth
Conor C. Flynn President & Chief Executive Officer
Glenn G. CohenExecutive Vice President, Chief Financial Officer & Treasurer
Dividend has grown at a compound rate of
8%
20
Coral Pointe, Cape Coral, FL MSA: Cape Coral - Fort Meyers (FL)
9.6%10.4%
13.2%
S&P 500 DJIA KIM
TOTAL SHAREHOLDER RETURNSince IPO1 11/29/91-11/30/15
1 Source: Bloomberg
$1.022
$0.96
$0.90
$0.84
$0.76$0.72
$0.64
2010 2011 2012 2013 2014 2015 2016
DIVIDEND GROWTH
~8% CAGR
2Current quarterly dividend annualized

Form 10-KR E A L T Y
R E A L T Y
PM S 2945
R E A L T YRGB
CMYK

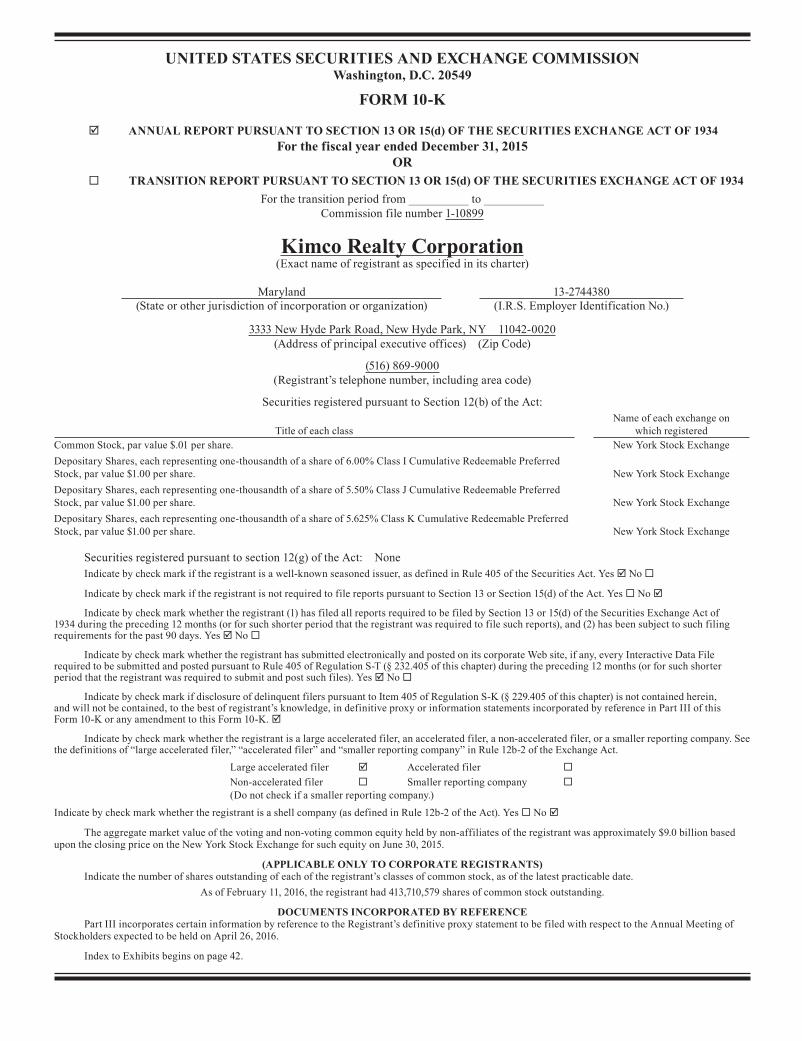
UNITED STATES SECURITIES AND EXCHANGE COMMISSIONWashington, D.C. 20549
FORM 10-K
ANNUAL REPORT PURSUANT TO SECTION 13 OR 15(d) OF THE SECURITIES EXCHANGE ACT OF 1934For the fiscal year ended December 31, 2015
OR TRANSITION REPORT PURSUANT TO SECTION 13 OR 15(d) OF THE SECURITIES EXCHANGE ACT OF 1934
For the transition period from __________ to __________ Commission file number 1-10899
Kimco Realty Corporation(Exact name of registrant as specified in its charter)
Maryland 13-2744380(State or other jurisdiction of incorporation or organization) (I.R.S. Employer Identification No.)
3333 New Hyde Park Road, New Hyde Park, NY 11042-0020 (Address of principal executive offices) (Zip Code)
(516) 869-9000 (Registrant’s telephone number, including area code)
Securities registered pursuant to Section 12(b) of the Act:
Title of each className of each exchange on
which registeredCommon Stock, par value $.01 per share. New York Stock ExchangeDepositary Shares, each representing one-thousandth of a share of 6.00% Class I Cumulative Redeemable Preferred Stock, par value $1.00 per share. New York Stock ExchangeDepositary Shares, each representing one-thousandth of a share of 5.50% Class J Cumulative Redeemable Preferred Stock, par value $1.00 per share. New York Stock ExchangeDepositary Shares, each representing one-thousandth of a share of 5.625% Class K Cumulative Redeemable Preferred Stock, par value $1.00 per share. New York Stock Exchange
Securities registered pursuant to section 12(g) of the Act: NoneIndicate by check mark if the registrant is a well-known seasoned issuer, as defined in Rule 405 of the Securities Act. Yes No
Indicate by check mark if the registrant is not required to file reports pursuant to Section 13 or Section 15(d) of the Act. Yes No
Indicate by check mark whether the registrant (1) has filed all reports required to be filed by Section 13 or 15(d) of the Securities Exchange Act of 1934 during the preceding 12 months (or for such shorter period that the registrant was required to file such reports), and (2) has been subject to such filing requirements for the past 90 days. Yes No
Indicate by check mark whether the registrant has submitted electronically and posted on its corporate Web site, if any, every Interactive Data File required to be submitted and posted pursuant to Rule 405 of Regulation S-T (§ 232.405 of this chapter) during the preceding 12 months (or for such shorter period that the registrant was required to submit and post such files). Yes No
Indicate by check mark if disclosure of delinquent filers pursuant to Item 405 of Regulation S-K (§ 229.405 of this chapter) is not contained herein, and will not be contained, to the best of registrant’s knowledge, in definitive proxy or information statements incorporated by reference in Part III of this Form 10-K or any amendment to this Form 10-K.
Indicate by check mark whether the registrant is a large accelerated filer, an accelerated filer, a non-accelerated filer, or a smaller reporting company. See the definitions of “large accelerated filer,” “accelerated filer” and “smaller reporting company” in Rule 12b-2 of the Exchange Act.
Large accelerated filer Accelerated filer
Non-accelerated filer Smaller reporting company (Do not check if a smaller reporting company.)
Indicate by check mark whether the registrant is a shell company (as defined in Rule 12b-2 of the Act). Yes No
The aggregate market value of the voting and non-voting common equity held by non-affiliates of the registrant was approximately $9.0 billion based upon the closing price on the New York Stock Exchange for such equity on June 30, 2015.
(APPLICABLE ONLY TO CORPORATE REGISTRANTS)Indicate the number of shares outstanding of each of the registrant’s classes of common stock, as of the latest practicable date.
As of February 11, 2016, the registrant had 413,710,579 shares of common stock outstanding.
DOCUMENTS INCORPORATED BY REFERENCEPart III incorporates certain information by reference to the Registrant’s definitive proxy statement to be filed with respect to the Annual Meeting of
Stockholders expected to be held on April 26, 2016.
Index to Exhibits begins on page 42.
JOB TITLE Kimco AR REVISION 1 SERIAL DATE Wednesday, March 16, 2016 JOB NUMBER 279628 TYPE PAGE NO. 1 OPERATOR JIOMERD
<12345678>
2
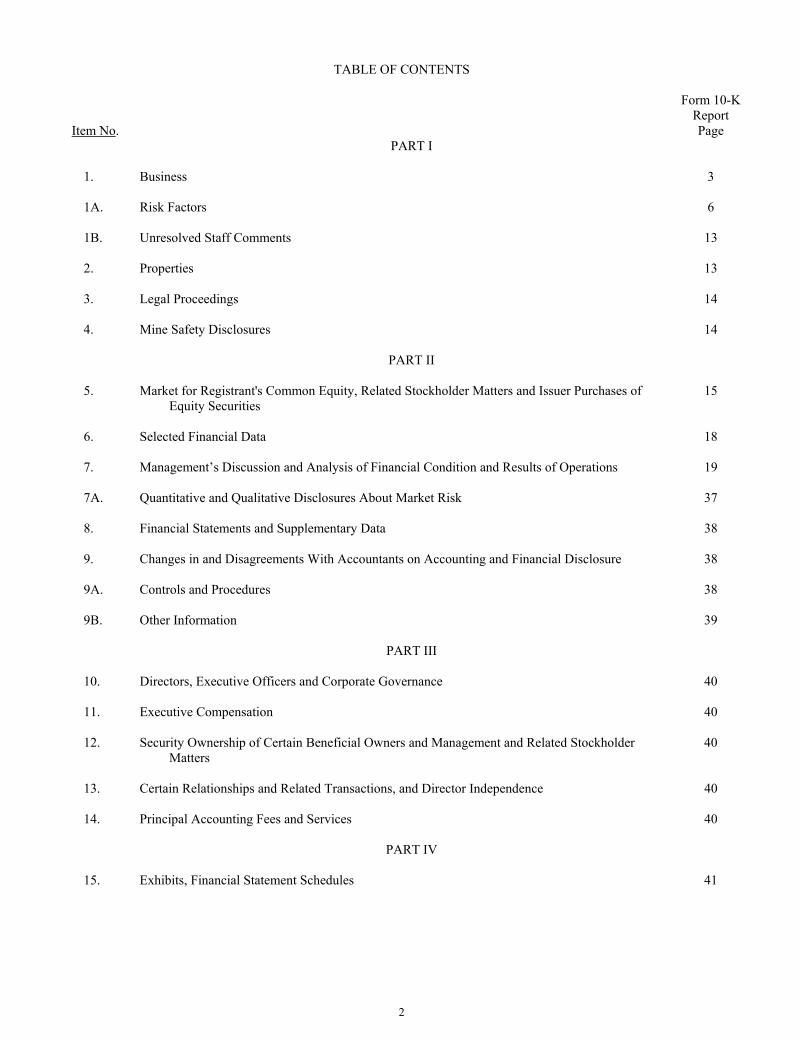
TABLE OF CONTENTS
Item No.
Form 10-KReport Page
PART I
1. Business 3
1A. Risk Factors 6
1B. Unresolved Staff Comments 13
2. Properties 13
3. Legal Proceedings 14
4. Mine Safety Disclosures 14
PART II
5. Market for Registrant's Common Equity, Related Stockholder Matters and Issuer Purchases of Equity Securities
15
6. Selected Financial Data 18
7. Management’s Discussion and Analysis of Financial Condition and Results of Operations 19
7A. Quantitative and Qualitative Disclosures About Market Risk 37
8. Financial Statements and Supplementary Data 38
9. Changes in and Disagreements With Accountants on Accounting and Financial Disclosure 38
9A. Controls and Procedures 38
9B. Other Information 39
PART III
10. Directors, Executive Officers and Corporate Governance 40
11. Executive Compensation 40
12. Security Ownership of Certain Beneficial Owners and Management and Related Stockholder
Matters 40
13. Certain Relationships and Related Transactions, and Director Independence 40
14. Principal Accounting Fees and Services 40
PART IV
15. Exhibits, Financial Statement Schedules 41
3
FORWARD-LOOKING STATEMENTS
This annual report on Form 10-K (“Form 10-K”), together with other statements and information publicly disseminated by Kimco Realty Corporation (the “Company”) contains certain forward-looking statements within the meaning of Section 27A of the Securities Act of 1933, as amended, and Section 21E of the Securities Exchange Act of 1934, as amended. The Company intends such forward-looking statements to be covered by the safe harbor provisions for forward-looking statements contained in the Private Securities Litigation Reform Act of 1995 and includes this statement for purposes of complying with the safe harbor provisions. Forward-looking statements, which are based on certain assumptions and describe the Company’s future plans, strategies and expectations, are generally identifiable by use of the words “believe,” “expect,” “intend,” “anticipate,” “estimate,” “project,” “will,” “target,” “forecast” or similar expressions. You should not rely on forward-looking statements since they involve known and unknown risks, uncertainties and other factors which are, in some cases, beyond the Company’s control and could materially affect actual results, performances or achievements. Factors which may cause actual results to differ materially from current expectations include, but are not limited to (i) general adverse economic and local real estate conditions, (ii) the inability of major tenants to continue paying their rent obligations due to bankruptcy, insolvency or a general downturn in their business, (iii) financing risks, such as the inability to obtain equity, debt or other sources of financing or refinancing on favorable terms to the Company, (iv) the Company’s ability to raise capital by selling its assets, (v) changes in governmental laws and regulations, (vi) the level and volatility of interest rates and foreign currency exchange rates and managements’ ability to estimate the impact thereof, (vii) risks related to the Company’s international operations, (viii) the availability of suitable acquisition, disposition, development and redevelopment opportunities , and risks related to acquisitions not performing in accordance with our expectations, (ix) valuation and risks related to the Company’s joint venture and preferred equity investments, (x) valuation of marketable securities and other investments, (xi) increases in operating costs, (xii) changes in the dividend policy for the Company’s common stock, (xiii) the reduction in the Company’s income in the event of multiple lease terminations by tenants or a failure by multiple tenants to occupy their premises in a shopping center, (xiv) impairment charges, (xv) unanticipated changes in the Company’s intention or ability to prepay certain debt prior to maturity and/or hold certain securities until maturity and (xvi) the risks and uncertainties identified under Item 1A, “Risk Factors” and elsewhere in this Form 10-K and in the Company’s other filings with the Securities and Exchange Commission (“SEC”). Accordingly, there is no assurance that the Company’s expectations will be realized. The Company disclaims any intention or obligation to update the forward-looking statements, whether as a result of new information, future events or otherwise. You are advised to refer to any further disclosures the Company makes or related subjects in the Company’s quarterly reports on Form 10-Q and current reports on Form 8-K that the Company files with the SEC.
PART I
Item 1. Business Background Kimco Realty Corporation, a Maryland corporation, is one of the nation's largest owners and operators of open-air
shopping centers. The terms "Kimco," the "Company," "we," "our" and "us" each refer to Kimco Realty Corporation and our subsidiaries, unless the context indicates otherwise. The Company is a self-administered real estate investment trust ("REIT") and has owned and operated open-air shopping centers for more than 50 years. The Company has not engaged, nor does it expect to retain, any REIT advisors in connection with the operation of its properties. As of December 31, 2015, the Company had interests in 605 shopping center properties (the “Combined Shopping Center Portfolio”), aggregating 96.0 million square feet of gross leasable area (“GLA”), located in 38 states, Puerto Rico and Canada. In addition, the Company had 446 other property interests, primarily through the Company’s preferred equity investments and other real estate investments, totaling 7.3 million square feet of GLA. The Company’s ownership interests in real estate consist of its consolidated portfolio and portfolios where the Company owns an economic interest, such as properties in the Company’s investment real estate management programs, where the Company partners with institutional investors and also retains management. The Company believes its portfolio of open-air shopping center properties is the largest (measured by GLA) currently held by any publicly traded REIT.
The Company's executive offices are located at 3333 New Hyde Park Road, New Hyde Park, New York 11042-0020
and its telephone number is (516) 869-9000. Nearly all operating functions, including leasing, legal, construction, data processing, maintenance, finance and accounting are administered by the Company from its executive offices in New Hyde Park, New York and supported by the Company’s regional offices. As of December 31, 2015, a total of 546 persons were employed by the Company.
4
The Company’s Web site is located at http://www.kimcorealty.com. The information contained on our Web site does not constitute part of this Form 10-K. On the Company’s Web site you can obtain, free of charge, a copy of our Form 10-K, quarterly reports on Form 10-Q, current reports on Form 8-K and amendments to those reports filed or furnished pursuant to Section 13(a) or 15(d) of the Exchange Act of 1934, as amended, as soon as reasonably practicable, after we file such material electronically with, or furnish it to, the SEC. The public may read and copy any materials we file with the SEC at the SEC's Public Reference Room at 100 F Street, NE, Washington, DC 20549. The public may obtain information on the operation of the Public Reference Room by calling the SEC at 1-800-SEC-0330. The SEC also maintains an Internet site that contains reports, proxy and information statements, and other information regarding issuers that file electronically with the SEC at http://www.sec.gov.
The Company began operations through its predecessor, The Kimco Corporation, which was organized in 1966 upon the contribution of several shopping center properties owned by its principal stockholders. In 1973, these principals formed the Company as a Delaware corporation, and, in 1985, the operations of The Kimco Corporation were merged into the Company. The Company completed its initial public stock offering (the "IPO") in November 1991, and, commencing with its taxable year which began January 1, 1992, elected to qualify as a REIT in accordance with Sections 856 through 860 of the Internal Revenue Code of 1986, as amended (the "Code"). If, as the Company believes, it is organized and operates in such a manner so as to qualify and remain qualified as a REIT under the Code, the Company generally will not be subject to federal income tax, provided that distributions to its stockholders equal at least the amount of its REIT taxable income, as defined under the Code. In 1994, the Company reorganized as a Maryland corporation. In March 2006, the Company was added to the S & P 500 Index, an index containing the stock of 500 Large Cap companies, most of which are U.S. corporations. The Company's common stock, Class I Depositary Shares, Class J Depositary Shares and Class K Depositary Shares are traded on the New York Stock Exchange (“NYSE”) under the trading symbols “KIM”, “KIMprI”, “KIMprJ” and “KIMprK”, respectively.
The Company’s initial growth resulted primarily from ground-up development and the construction of shopping
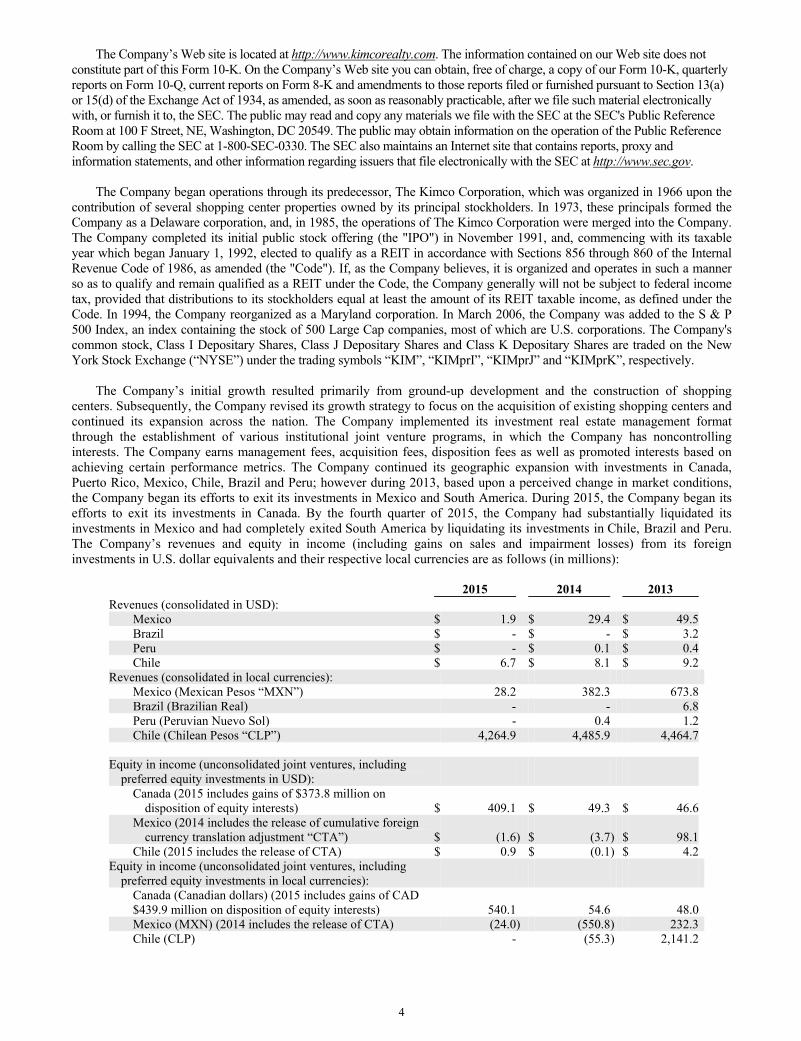
centers. Subsequently, the Company revised its growth strategy to focus on the acquisition of existing shopping centers and continued its expansion across the nation. The Company implemented its investment real estate management format through the establishment of various institutional joint venture programs, in which the Company has noncontrolling interests. The Company earns management fees, acquisition fees, disposition fees as well as promoted interests based on achieving certain performance metrics. The Company continued its geographic expansion with investments in Canada, Puerto Rico, Mexico, Chile, Brazil and Peru; however during 2013, based upon a perceived change in market conditions, the Company began its efforts to exit its investments in Mexico and South America. During 2015, the Company began its efforts to exit its investments in Canada. By the fourth quarter of 2015, the Company had substantially liquidated its investments in Mexico and had completely exited South America by liquidating its investments in Chile, Brazil and Peru. The Company’s revenues and equity in income (including gains on sales and impairment losses) from its foreign investments in U.S. dollar equivalents and their respective local currencies are as follows (in millions):
2015 2014 2013 Revenues (consolidated in USD):
Mexico $ 1.9 $ 29.4 $ 49.5 Brazil $ - $ - $ 3.2 Peru $ - $ 0.1 $ 0.4 Chile $ 6.7 $ 8.1 $ 9.2
Revenues (consolidated in local currencies): Mexico (Mexican Pesos “MXN”) 28.2 382.3 673.8 Brazil (Brazilian Real) - - 6.8 Peru (Peruvian Nuevo Sol) - 0.4 1.2 Chile (Chilean Pesos “CLP”) 4,264.9 4,485.9 4,464.7
Equity in income (unconsolidated joint ventures, including
preferred equity investments in USD):
Canada (2015 includes gains of $373.8 million on disposition of equity interests) $ 409.1 $ 49.3 $ 46.6
Mexico (2014 includes the release of cumulative foreign currency translation adjustment “CTA”) $ (1.6) $ (3.7) $ 98.1
Chile (2015 includes the release of CTA) $ 0.9 $ (0.1) $ 4.2 Equity in income (unconsolidated joint ventures, including
preferred equity investments in local currencies):
Canada (Canadian dollars) (2015 includes gains of CAD $439.9 million on disposition of equity interests) 540.1 54.6 48.0 Mexico (MXN) (2014 includes the release of CTA) (24.0) (550.8) 232.3 Chile (CLP) - (55.3) 2,141.2
5
The Company, through its taxable REIT subsidiaries (“TRS”), as permitted by the Tax Relief Extension Act of 1999, has previously engaged in various retail real estate related opportunities, including (i)ground-up development of open-air shopping centers and the subsequent sale thereof upon completion, (ii) retail real estate management and disposition services, which primarily focused on leasing and disposition strategies for real estate property interests of both healthy and distressed retailers and (iii) the Company’s investment in AB Acquisition, LLC, which consists of grocers Safeway, Albertsons, Vons and other banners (collectively “Albertsons”). The Company may consider other investments through its TRS should suitable opportunities arise.
In addition, the Company has capitalized on its established expertise in retail real estate by establishing other ventures in which the Company owns a smaller equity interest and provides management, leasing and operational support for those properties. The Company has also provided preferred equity capital in the past to real estate entrepreneurs and, from time to time, provides real estate capital and management services to both healthy and distressed retailers. The Company has also made selective investments in secondary market opportunities where a security or other investment is, in management’s judgment, priced below the value of the underlying assets, however these investments are subject to volatility within the equity and debt markets.
Operating and Investment Strategy The Company’s strategy is to be the premier owner and operator of open-air shopping centers through investments
primarily in the U.S.. To achieve this strategy the Company is (i) continuing to transform the quality of its portfolio by disposing of lesser quality assets and acquiring larger higher quality properties in key markets identified by the Company, (ii) simplifying its business by (a) reducing the number of joint venture investments and (b) exiting Mexico, South America and Canada, for which the exit of South America has been completed and Mexico has been substantially completed, (iii) pursuing redevelopment opportunities within its portfolio to increase overall value and (iv) selectively acquiring land parcels for ground-up development projects, consisting of retail and/or mixed use centers, for long-term investment. In addition, the Company may consider other opportunistic investments related to retailer controlled real estate such as, repositioning underperforming retail locations, retail real estate financing and bankruptcy transaction support. The Company has an active capital recycling program which provides for the disposition of certain U.S. properties. If the Company accepts sales prices for any of these assets that are less than their net carrying values, the Company would be required to take impairment charges and such amounts could be material. In order to execute the Company’s strategy, the Company intends to continue to strengthen its balance sheet by pursuing deleveraging efforts over time, providing it the necessary flexibility to invest opportunistically and selectively, primarily focusing on U.S. open-air shopping centers.
The Company's investment objective is to increase cash flow, current income and, consequently, the value of its
existing portfolio of properties and to seek continued growth in desirable demographic areas with successful retailers through (i) the retail re-tenanting, renovation and expansion of its existing centers and (ii) the selective acquisition of established income-producing real estate properties and properties requiring significant re-tenanting and redevelopment, primarily in open-air shopping centers in geographic regions in which the Company presently operates. The Company may consider investments in other real estate sectors and in geographic markets where it does not presently operate should suitable opportunities arise.
The Company's open-air shopping center properties are designed to attract local area customers and are typically
anchored by a national or regional discount department store, supermarket or drugstore tenant offering day-to-day necessities rather than high-priced luxury items. The Company may either purchase or lease income-producing properties in the future and may also participate with other entities in property ownership through partnerships, joint ventures or similar types of co-ownership. Equity investments may be subject to existing mortgage financing and/or other indebtedness. Financing or other indebtedness may be incurred simultaneously or subsequently in connection with such investments. Any such financing or indebtedness would have priority over the Company’s equity interest in such property. The Company may make loans to joint ventures in which it may or may not participate.
The Company seeks to reduce its operating and leasing risks through diversification achieved by the geographic
distribution of its properties and a large tenant base. As of December 31, 2015, no single open-air shopping center accounted for more than 1.8% of the Company's annualized base rental revenues, including the proportionate share of base rental revenues from properties in which the Company has less than a 100% economic interest, or more than 1.5% of the Company’s total shopping center GLA. At December 31, 2015, the Company’s five largest tenants were TJX Companies, The Home Depot, Bed Bath & Beyond, Royal Ahold and Albertsons which represented 3.2%, 2.4%, 2.1%, 1.9% and 1.9%, respectively, of the Company’s annualized base rental revenues, including the proportionate share of base rental revenues from properties in which the Company has less than a 100% economic interest.
6
As one of the original participants in the growth of the shopping center industry and one of the nation's largest owners and operators of open-air shopping centers, the Company has established close relationships with a large number of major national and regional retailers and maintains a broad network of industry contacts. Management is associated with and/or actively participates in many shopping center and REIT industry organizations. Notwithstanding these relationships, there are numerous regional and local commercial developers, real estate companies, financial institutions and other investors who compete with the Company for the acquisition of properties and other investment opportunities and in seeking tenants who will lease space in the Company’s properties.
Item 1A. Risk Factors We are subject to certain business and legal risks including, but not limited to, the following: Loss of our tax status as a real estate investment trust or changes in federal tax laws, regulations, administrative
interpretations or court decisions relating to real estate investment trusts could have significant adverse consequences to us and the value of our securities.
We have elected to be taxed as a REIT for federal income tax purposes under the Code. We believe that we have
operated so as to qualify as a REIT under the Code and that our current organization and method of operation comply with the rules and regulations promulgated under the Code to enable us to continue to qualify as a REIT. However, there can be no assurance that we have qualified or will continue to qualify as a REIT for federal income tax purposes.
Qualification as a REIT involves the application of highly technical and complex Code provisions, for which there are
only limited judicial and administrative interpretations. The determination of various factual matters and circumstances not entirely within our control may affect our ability to qualify as a REIT. New legislation, regulations, administrative interpretations or court decisions could significantly change the tax laws with respect to qualification as a REIT, the federal income tax consequences of such qualification or the desirability of an investment in a REIT relative to other investments.
In order to qualify as a REIT, we must satisfy a number of requirements, including requirements regarding the
composition of our assets and a requirement that at least 95% of our gross income in any year be derived from qualifying sources, such as “rents from real property.” Also, we must make distributions to stockholders aggregating annually at least 90% of our REIT taxable income, excluding net capital gains. Furthermore, we own a direct or indirect interest in certain subsidiary REITs which elected to be taxed as REITs for federal income tax purposes under the Code. Provided that each subsidiary REIT qualifies as a REIT, our interest in such subsidiary REIT will be treated as a qualifying real estate asset for purposes of the REIT asset tests. To qualify as a REIT, the subsidiary REIT must independently satisfy all of the REIT qualification requirements. The failure of a subsidiary REIT to qualify as a REIT could have an adverse effect on our ability to comply with the REIT income and asset tests, and thus our ability to qualify as a REIT.
If we lose our REIT status, we will face serious tax consequences that will substantially reduce the funds available to
pay dividends to stockholders for each of the years involved because:
● we would not be allowed a deduction for distributions to stockholders in computing our taxable income and we would be subject to federal income tax at regular corporate rates;
● we could be subject to the federal alternative minimum tax and possibly increased state and local taxes;
● unless we were entitled to relief under statutory provisions, we could not elect to be taxed as a REIT for four taxable years following the year during which we were disqualified; and
● we would not be required to make distributions to stockholders. As a result of all these factors, our failure to qualify as a REIT or changes in federal tax laws with respect to
qualification as a REIT or the tax consequences of such qualification could also impair our ability to expand our business or raise capital and materially adversely affect the value of our securities.
To maintain our REIT status, we may be forced to borrow funds on a short-term basis during unfavorable
market conditions. To qualify as a REIT, we generally must distribute to our stockholders at least 90% of our REIT taxable income each year,
excluding capital gains, and we will be subject to regular corporate income taxes on the amount we distribute that is less than 100% of our net taxable income each year. In addition, we will be subject to a 4% nondeductible excise tax on the amount, if any, by which distributions paid by us in any calendar year are less than the sum of 85% of our ordinary income, 95% of our capital gain net income and 100% of our undistributed income from prior years. While we have historically satisfied these
7
distribution requirements by making cash distributions to our stockholders, a REIT is permitted to satisfy these requirements by making distributions of cash or other property, including, in limited circumstances, its own stock. Assuming we continue to satisfy these distributions requirements with cash, we may need to borrow funds to meet the REIT distribution requirements even if the then prevailing market conditions are not favorable for these borrowings. These borrowing needs could result from differences in timing between the actual receipt of cash and inclusion of income for federal income tax purposes, or the effect of non-deductible capital expenditures, the creation of reserves or required debt or amortization payments.
Adverse global market and economic conditions may impede our ability to generate sufficient income and
maintain our properties. The economic performance and value of our properties is subject to all of the risks associated with owning and
operating real estate, including:
● changes in the national, regional and local economic climate; ● local conditions, including an oversupply of, or a reduction in demand for, space in properties like those that we own; ● trends toward smaller store sizes as retailers reduce inventory and new prototypes; ● increasing use by customers of e-commerce and online store sites; ● the attractiveness of our properties to tenants; ● the ability of tenants to pay rent, particularly anchor tenants with leases in multiple locations; ● tenants who may declare bankruptcy and/or close stores; ● competition from other available properties to attract and retain tenants; ● changes in market rental rates; ● the need to periodically pay for costs to repair, renovate and re-let space; ● changes in operating costs, including costs for maintenance, insurance and real estate taxes;
● the expenses of owning and operating properties, which are not necessarily reduced when circumstances such as market factors and competition cause a reduction in income from the properties;
● changes in laws and governmental regulations, including those governing usage, zoning, the environment and taxes; ● acts of terrorism and war, acts of God and physical and weather-related damage to our properties; and ● the potential risk of functional obsolescence of properties over time.
Competition may limit our ability to purchase new properties or generate sufficient income from tenants and
may decrease the occupancy and rental rates for our properties. Our properties consist primarily of open-air shopping centers and other retail properties. Our performance, therefore, is
generally linked to economic conditions in the market for retail space. In the future, the market for retail space could be adversely affected by:
● weakness in the national, regional and local economies; ● the adverse financial condition of some large retailing companies; ● the impact of internet sales on the demand for retail space; ● ongoing consolidation in the retail sector; and ● the excess amount of retail space in a number of markets.
In addition, numerous commercial developers and real estate companies compete with us in seeking tenants for our
existing properties and properties for acquisition. New regional malls, open-air lifestyle centers or other retail shopping centers with more convenient locations or better rents may attract tenants or cause them to seek more favorable lease terms at or prior to renewal. Retailers at our properties may face increasing competition from other retailers, e-commerce, outlet malls, discount shopping clubs, catalog companies, direct mail, telemarketing or home shopping networks, all of which could (i) reduce rents payable to us; (ii) reduce our ability to attract and retain tenants at our properties; or (iii) lead to increased vacancy rates at our properties. We may fail to anticipate the effects of changes in consumer buying practices, particularly of growing online sales and the resulting retailing practices and space needs of our tenants or a general downturn in our tenants’ businesses, which may cause tenants to close stores or default in payment of rent.
Our performance depends on our ability to collect rent from tenants, including anchor tenants, our tenants’
financial condition and our tenants maintaining leases for our properties. At any time our tenants, particularly small local stores, may experience a downturn in their business that may
significantly weaken their financial condition. As a result, our tenants may delay a number of lease commencements, decline to extend or renew leases upon expiration, fail to make rental payments when due, close stores or declare
8
bankruptcy. Any of these actions could result in the termination of tenants’ leases and the loss of rental income attributable to these tenants’ leases. In the event of a default by a tenant, we may experience delays and costs in enforcing our rights as landlord under the terms of the leases.
In addition, multiple lease terminations by tenants, including anchor tenants, or a failure by multiple tenants to occupy
their premises in a shopping center could result in lease terminations or significant reductions in rent by other tenants in the same shopping centers under the terms of some leases. In that event, we may be unable to re-lease the vacated space at attractive rents or at all, and our rental payments from our continuing tenants could significantly decrease. The occurrence of any of the situations described above, particularly if it involves a substantial tenant with leases in multiple locations, could have a material adverse effect on our financial condition, results of operations and cash flows.
A tenant that files for bankruptcy protection may not continue to pay us rent. A bankruptcy filing by, or relating to, one
of our tenants or a lease guarantor would bar all efforts by us to collect pre-bankruptcy debts from the tenant or the lease guarantor, or their property, unless the bankruptcy court permits us to do so. A tenant or lease guarantor bankruptcy could delay our efforts to collect past due balances under the relevant leases and could ultimately preclude collection of these sums. If a lease is rejected by a tenant in bankruptcy, we would have only a general unsecured claim for damages. As a result, it is likely that we would recover substantially less than the full value of any unsecured claims we hold, if at all.
We may be unable to sell our real estate property investments when appropriate or on terms favorable to us. Real estate property investments are illiquid and generally cannot be disposed of quickly. In addition, the Code
restricts a REIT’s ability to dispose of properties that are not applicable to other types of real estate companies. Therefore, we may not be able to vary our portfolio in response to economic or other conditions promptly or on terms favorable to us within a time frame that we would need.
We may acquire or develop properties or acquire other real estate related companies, and this may create risks. We may acquire or develop properties or acquire other real estate related companies when we believe that an
acquisition or development is consistent with our business strategies. We may not succeed in consummating desired acquisitions or in completing developments on time or within budget. When we do pursue a project or acquisition, we may not succeed in leasing newly developed or acquired properties at rents sufficient to cover the costs of acquisition or development and operations. Difficulties in integrating acquisitions may prove costly or time-consuming and could divert management’s attention from other activities. Acquisitions or developments in new markets or industries where we do not have the same level of market knowledge may result in poorer than anticipated performance. We may also abandon acquisition or development opportunities that management has begun pursuing and consequently fail to recover expenses already incurred and will have devoted management’s time to a matter not consummated. Furthermore, our acquisitions of new properties or companies will expose us to the liabilities of those properties or companies, some of which we may not be aware of at the time of the acquisition. In addition, development of our existing properties presents similar risks.
Newly acquired or re-developed properties may have characteristics or deficiencies currently unknown to us that affect
their value or revenue potential. It is also possible that the operating performance of these properties may decline under our management. As we acquire additional properties, we will be subject to risks associated with managing new properties, including lease-up and tenant retention. In addition, our ability to manage our growth effectively will require us to successfully integrate our new acquisitions into our existing management structure. We may not succeed with this integration or effectively manage additional properties, particularly in secondary markets. Also, newly acquired properties may not perform as expected.
Unsuccessful ground-up development activities or a slowdown in ground-up development activities could have a
direct impact on our growth, results of operations and cash flows. Property ground-up development is a component of our operating and investment strategy. We intend to continue
pursuing select ground-up development opportunities for long-term investment and construction of retail and/or mixed use properties as opportunities arise. We expect to phase in construction until sufficient preleasing is reached. Our ground-up development and construction activities include the following risks:
● We may abandon ground-up development opportunities after expending resources and could lose all or part of our investment in such opportunities, including loss of deposits or failure to recover expenses already incurred;
● Development, construction or operating costs, including increased interest rates and higher materials, transportation, labor, leasing or other costs, may exceed our original estimates;
9
● Occupancy rates and rents at a newly completed property may not meet our expectations and may not be sufficient to make the property profitable;
● Construction or permanent financing may not be available to us on favorable terms or at all;
● We may not complete construction and lease-up on schedule due to a variety of factors including construction delays
or contractor changes, resulting in increased expenses and construction costs or tenants or operators with the right to terminate pre-construction leases; and
● We may not be able to obtain, or may experience delays in obtaining, necessary zoning, land use, building, occupancy and other required governmental permits and authorizations.
Additionally, new ground-up development activities typically require substantial time and attention from management,
and the time frame required for development, construction and lease-up of these properties could require several years to realize any significant cash return. The foregoing risks could cause the development of properties to hinder the Company’s growth and have an adverse effect on its results of operations and cash flows.
We face competition in pursuing acquisition or development opportunities that could increase our costs. We face competition in the acquisition, development, operation and sale of real property from others engaged in real
estate investment that could increase our costs associated with purchasing and maintaining assets. Some of these competitors may have greater financial resources than we do. This could result in competition for the acquisition of properties for tenants who lease or consider leasing space in our existing and subsequently acquired properties and for other real estate investment opportunities.
We do not have exclusive control over our joint venture and preferred equity investments, such that we are
unable to ensure that our objectives will be pursued. We have invested in some properties as a co-venturer or partner, instead of owning directly. In these investments, we
do not have exclusive control over the development, financing, leasing, management and other aspects of these investments. As a result, the co-venturer or partner might have interests or goals that are inconsistent with ours, take action contrary to our interests or otherwise impede our objectives. These investments involve risks and uncertainties. The co-venturer or partner may fail to provide capital or fulfill its obligations, which may result in certain liabilities to us for guarantees and other commitments, conflicts arising between us and our partners and the difficulty of managing and resolving such conflicts, and the difficulty of managing or otherwise monitoring such business arrangements. The co-venturer or partner also might become insolvent or bankrupt, which may result in significant losses to us.
In addition, joint venture arrangements may decrease our ability to manage risk and implicate additional risks, such as:
● potentially inferior financial capacity, diverging business goals and strategies and the need for our venture partner’s continued cooperation;
● our inability to take actions with respect to the joint venture activities that we believe are favorable to us if our joint venture partner does not agree;
● our inability to control the legal entity that has title to the real estate associated with the joint venture;
● our lenders may not be easily able to sell our joint venture assets and investments or may view them less favorably as collateral, which could negatively affect our liquidity and capital resources;
● our joint venture partners can take actions that we may not be able to anticipate or prevent, which could result in negative impacts on our debt and equity; and
● our joint venture partners’ business decisions or other actions or omissions may result in harm to our reputation or adversely affect the value of our investments.
Our joint venture and preferred equity investments generally own real estate properties for which the economic
performance and value is subject to all the risks associated with owning and operating real estate as described above. We intend to continue to sell our non-strategic assets and may not be able to recover our investments, which
may result in significant losses to us. There can be no assurance that we will be able to recover the current carrying amount of all of our non-strategic
properties and investments and those of our unconsolidated joint ventures in the future. Our failure to do so would require us to recognize impairment charges for the period in which we reached that conclusion, which could materially and adversely affect our business, financial condition, operating results and cash flows.
10
We have certain international operations, which may be affected by economic, political and other risks associated with international operations, and this could adversely affect our business.
The risks we face in international business operations include, but are not limited to:
● currency risks, including currency fluctuations;
● unexpected changes in legislative and regulatory requirements, including changes in applicable laws and regulations in the United States that affect foreign operations;
● potential adverse tax burdens;
● burdens of complying with different accounting and permitting standards, labor laws and a wide variety of foreign laws;
● obstacles to the repatriation of earnings and cash; ● regional, national and local political uncertainty; ● economic slowdown and/or downturn in foreign markets; ● difficulties in staffing and managing international operations;
● difficulty in administering and enforcing corporate policies, which may be different than the normal business practices of local cultures; and
● reduced protection for intellectual property in some countries. Each of these risks might impact our cash flow or impair our ability to borrow funds, which ultimately could adversely
affect our business, financial condition, operating results and cash flows. In order to operate internationally, we must overcome cultural and language barriers and assimilate different business
practices. In addition, we are required to create compensation programs, employment policies and other administrative programs that comply with laws of multiple countries. We also must communicate and monitor standards and directives in our international locations. Our failure to successfully manage our geographically diverse operations could impair our ability to react quickly to changing business and market conditions and to enforce compliance with standards and procedures. Since a portion of our revenues are generated internationally, we must devote an appropriate level of resources to managing our international operations.
Our future success will be influenced by our ability to anticipate and effectively manage these and other risks
associated with our international operations. Any of these factors could, however, materially adversely affect our international operations and, consequently, our financial condition, results of operations and cash flows.
We cannot predict the impact of laws and regulations affecting our international operations nor the potential
that we may face regulatory sanctions. Our international operations included properties in Canada, Mexico, Chile, Brazil and Peru and are subject to a variety
of United States and foreign laws and regulations, including the United States Foreign Corrupt Practices Act (“FCPA”). We have policies and procedures designed to promote compliance with the FCPA and other anti-corruption laws, but we cannot assure you that we will continue to be found to be operating in compliance with, or be able to detect violations of, any such laws or regulations. In addition, we cannot predict the nature, scope or effect of future regulatory requirements to which our international operations might be subject, the manner in which existing laws might be administered or interpreted, or the potential that we may face regulatory sanctions.
We cannot assure you that our employees will adhere to our Code of Conduct or any other of our policies, applicable
anti-corruption laws, including the FCPA, or other legal requirements. Failure to comply or violations of any applicable policies, anti-corruption laws, or other legal requirements may subject us to legal, regulatory or other sanctions, including criminal and civil penalties and other remedial measures. We have received a subpoena from the Enforcement Division of the SEC in connection with the SEC’s investigation, In the Matter of Wal-Mart Stores, Inc. (FW-3678), that the SEC Staff is currently conducting with respect to possible violations of the FCPA. We are cooperating with the SEC investigation and a parallel investigation by the U.S. Department of Justice (“DOJ”). See “Item 3. Legal Proceedings,” below. The DOJ and the SEC have a broad range of civil and criminal sanctions under the FCPA and other laws and regulations, which they may seek to impose against corporations and individuals in appropriate circumstances including, but not limited to, injunctive relief, disgorgement, fines, penalties and modifications to business practices and compliance programs. Any of these remedial measures, if applicable to us, could have a material adverse impact on our business, results of operations, financial condition and liquidity.
11
We face risks relating to cybersecurity attacks, loss of confidential information and other business disruptions. Our business is at risk from and may be impacted by cybersecurity attacks, including attempts to gain unauthorized
access to our confidential data and other electronic security breaches. Such cyber-attacks can range from individual attempts to gain unauthorized access to our information technology systems to more sophisticated security threats. There is no guarantee that the measures we employ to prevent, detect and mitigate these threats will be successful in preventing a cyber-attack. Cybersecurity incidents could compromise the confidential information of our tenants, employees and third party vendors and disrupt and effect the efficiency of our business operations.
We may be unable to obtain financing through the debt and equities market, which would have a material
adverse effect on our growth strategy, our results of operations and our financial condition. We cannot assure you that we will be able to access the credit and/or equity markets to obtain additional debt or equity
financing or that we will be able to obtain financing on terms favorable to us. The inability to obtain financing on a timely basis could have negative effects on our business, such as:
● we could have great difficulty acquiring or developing properties, which would materially adversely affect our business strategy;
● our liquidity could be adversely affected; ● we may be unable to repay or refinance our indebtedness;
● we may need to make higher interest and principal payments or sell some of our assets on terms unfavorable to us to fund our indebtedness; or
● we may need to issue additional capital stock, which could further dilute the ownership of our existing shareholders. Adverse changes in our credit ratings could impair our ability to obtain additional debt and equity financing on terms
favorable to us, if at all, and could significantly reduce the market price of our publicly traded securities. We are subject to financial covenants that may restrict our operating and acquisition activities. Our revolving credit facility, term loan and the indentures under which our senior unsecured debt is issued contain
certain financial and operating covenants, including, among other things, certain coverage ratios and limitations on our ability to incur debt, make dividend payments, sell all or substantially all of our assets and engage in mergers and consolidations and certain acquisitions. These covenants may restrict our ability to pursue certain business initiatives or certain acquisition transactions that might otherwise be advantageous. In addition, failure to meet any of the financial covenants could cause an event of default under our revolving credit facility, term loan and the indentures and/or accelerate some or all of our indebtedness, which would have a material adverse effect on us.
Changes in market conditions could adversely affect the market price of our publicly traded securities. The market price of our publicly traded securities depends on various market conditions, which may change from time-
to-time. Among the market conditions that may affect the market price of our publicly traded securities are the following:
● the extent of institutional investor interest in us; ● the reputation of REITs generally and the reputation of REITs with portfolios similar to ours;
● the attractiveness of the securities of REITs in comparison to securities issued by other entities, including securities issued by other real estate companies;
● our financial condition and performance; ● the market’s perception of our growth potential, potential future cash dividends and risk profile;
● an increase in market interest rates, which may lead prospective investors to demand a higher distribution rate in relation to the price paid for our shares; and
● general economic and financial market conditions. We may change the dividend policy for our common stock in the future. The decision to declare and pay dividends on our common stock in the future, as well as the timing, amount and
composition of any such future dividends, will be at the sole discretion of our Board of Directors and will depend on our earnings, operating cash flows, liquidity, financial condition, capital requirements, contractual prohibitions or other limitations under our indebtedness including preferred stock, the annual distribution requirements under the REIT provisions of the Code, state law and such other factors as our Board of Directors deems relevant or are requirements under
12
the Code or state or federal laws. Any negative change in our dividend policy could have a material adverse effect on the market price of our common stock.
We may not be able to recover our investments in marketable securities, mortgage receivables or other investments, which may result in significant losses to us.
Our investments in marketable securities are subject to specific risks relating to the particular issuer of the securities,
including the financial condition and business outlook of the issuer, which may result in significant losses to us. Marketable securities are generally unsecured and may also be subordinated to other obligations of the issuer. As a result, investments in marketable securities are subject to risks of:
● limited liquidity in the secondary trading market; ● substantial market price volatility, resulting from changes in prevailing interest rates; ● subordination to the prior claims of banks and other senior lenders to the issuer; ● the possibility that earnings of the issuer may be insufficient to meet its debt service and distribution obligations; and
● the declining creditworthiness and potential for insolvency of the issuer during periods of rising interest rates and economic downturn.
These risks may adversely affect the value of outstanding marketable securities and the ability of the issuers to make
distribution payments. In the event of a default by a borrower, it may be necessary for us to foreclose our mortgage or engage in costly
negotiations. Delays in liquidating defaulted mortgage loans and repossessing and selling the underlying properties could reduce our investment returns. Furthermore, in the event of default, the actual value of the property securing the mortgage may decrease. A decline in real estate values will adversely affect the value of our loans and the value of the mortgages securing our loans.
Our mortgage receivables may be or become subordinated to mechanics' or materialmen's liens or property tax liens. In
these instances we may need to protect a particular investment by making payments to maintain the current status of a prior lien or discharge it entirely. Where that occurs, the total amount we recover may be less than our total investment, resulting in a loss. In the event of a major loan default or several loan defaults resulting in losses, our investments in mortgage receivables would be materially and adversely affected.
The economic performance and value of our other investments which we do not control and are in retail operations, are
subject to risks associated with owning and operating retail businesses, including:
● changes in the national, regional and local economic climate; ● the adverse financial condition of some large retailing companies; ● increasing use by customers of e-commerce and online store sites; and ● ongoing consolidation in the retail sector,
A decline in the value of our other investments may require us to recognize an other-than-temporary impairment
(“OTTI”) against such assets. When the fair value of an investment is determined to be less than its amortized cost at the balance sheet date, we assess whether the decline is temporary or other-than-temporary. If we intend to sell an impaired asset, or it is more likely than not that we will be required to sell the impaired asset before any anticipated recovery, then we must recognize an OTTI through charges to earnings equal to the entire difference between the assets amortized cost and its fair value at the balance sheet date. When an OTTI is recognized through earnings, a new cost basis is established for the asset and the new cost basis may not be adjusted through earnings for subsequent recoveries in fair value.
We may be subject to liability under environmental laws, ordinances and regulations. Under various federal, state, and local laws, ordinances and regulations, we may be considered an owner or operator of
real property and may be responsible for paying for the disposal or treatment of hazardous or toxic substances released on or in our property, as well as certain other potential costs relating to hazardous or toxic substances (including governmental fines and injuries to persons and property). This liability may be imposed whether or not we knew about, or were responsible for, the presence of hazardous or toxic substances.
13
Item 1B. Unresolved Staff Comments None Item 2. Properties Real Estate Portfolio. As of December 31, 2015, the Company had interests in 605 shopping center properties
aggregating 96.0 million square feet of GLA located in 38 states, Puerto Rico and Canada. In addition, the Company had 446 other property interests, primarily through the Company’s preferred equity investments and other real estate investments, totaling 7.3 million square feet of GLA. The Company’s portfolio includes noncontrolling interests. Open-air shopping centers comprise the primary focus of the Company's current portfolio. As of December 31, 2015, the Company’s Combined Shopping Center Portfolio was 95.0% leased.
The Company's open-air shopping center properties, which are generally owned and operated through subsidiaries or joint ventures, had an average size of 158,686 square feet as of December 31, 2015. The Company generally retains its shopping centers for long-term investment and consequently pursues a program of regular physical maintenance together with major renovations and refurbishing to preserve and increase the value of its properties. This includes renovating existing facades, installing uniform signage, resurfacing parking lots and enhancing parking lot lighting. During 2015, the Company capitalized $156.0 million in connection with these property improvements and expensed to operations $38.5 million.
The Company's management believes its experience in the real estate industry and its relationships with numerous
national and regional tenants gives it an advantage in an industry where ownership is fragmented among a large number of property owners. The Company's open-air shopping centers are usually "anchored" by a national or regional discount department store, supermarket or drugstore. As one of the original participants in the growth of the shopping center industry and one of the nation's largest owners and operators of shopping centers, the Company has established close relationships with a large number of major national and regional retailers. Some of the major national and regional companies that are tenants in the Company's shopping center properties include TJX Companies, The Home Depot, Bed Bath & Beyond, Royal Ahold, Albertsons, Wal-Mart, Kohl’s, Petsmart and Ross Stores.
A substantial portion of the Company's income consists of rent received under long-term leases. Most of the leases
provide for the payment of fixed-base rentals monthly in advance and for the payment by tenants of an allocable share of the real estate taxes, insurance, utilities and common area maintenance expenses incurred in operating the shopping centers. Although many of the leases require the Company to make roof and structural repairs as needed, a number of tenant leases place that responsibility on the tenant, and the Company's standard small store lease provides for roof repairs to be reimbursed by the tenant as part of common area maintenance.
Minimum base rental revenues and operating expense reimbursements accounted for 98% and other revenues,
including percentage rents, accounted for 2% of the Company's total revenues from rental property for the year ended December 31, 2015. The Company's management believes that the base rent per leased square foot for many of the Company's existing leases is generally lower than the prevailing market-rate base rents in the geographic regions where the Company operates, reflecting the potential for future growth.
Approximately 31.1% of the Company's leases of consolidated properties also contain provisions requiring the payment of additional rent calculated as a percentage of tenants’ gross sales above predetermined thresholds. Percentage rents accounted for less than 1% of the Company's revenues from rental property for the year ended December 31, 2015. Additionally, a majority of the Company’s leases have provisions requiring contractual rent increases. The Company’s leases may also include escalation clauses, which provide for increases based upon changes in the consumer price index or similar inflation indices.
As of December 31, 2015, the Company’s consolidated operating portfolio, comprised of 60.5 million square feet of GLA, was 95.7% leased. The consolidated operating portfolio consists entirely of properties located in the U.S., inclusive of Puerto Rico. For the period January 1, 2015 to December 31, 2015, the Company increased the average base rent per leased square foot, which includes the impact of tenant concessions, in its U.S. consolidated portfolio of open-air shopping centers from $13.50 to $14.36, an increase of $0.86. This increase primarily consists of (i) a $0.24 increase relating to acquisitions, (ii) a $0.40 increase relating to dispositions, and (iii) a $0.22 increase relating to new leases signed net of leases vacated and rent step-ups within the portfolio.
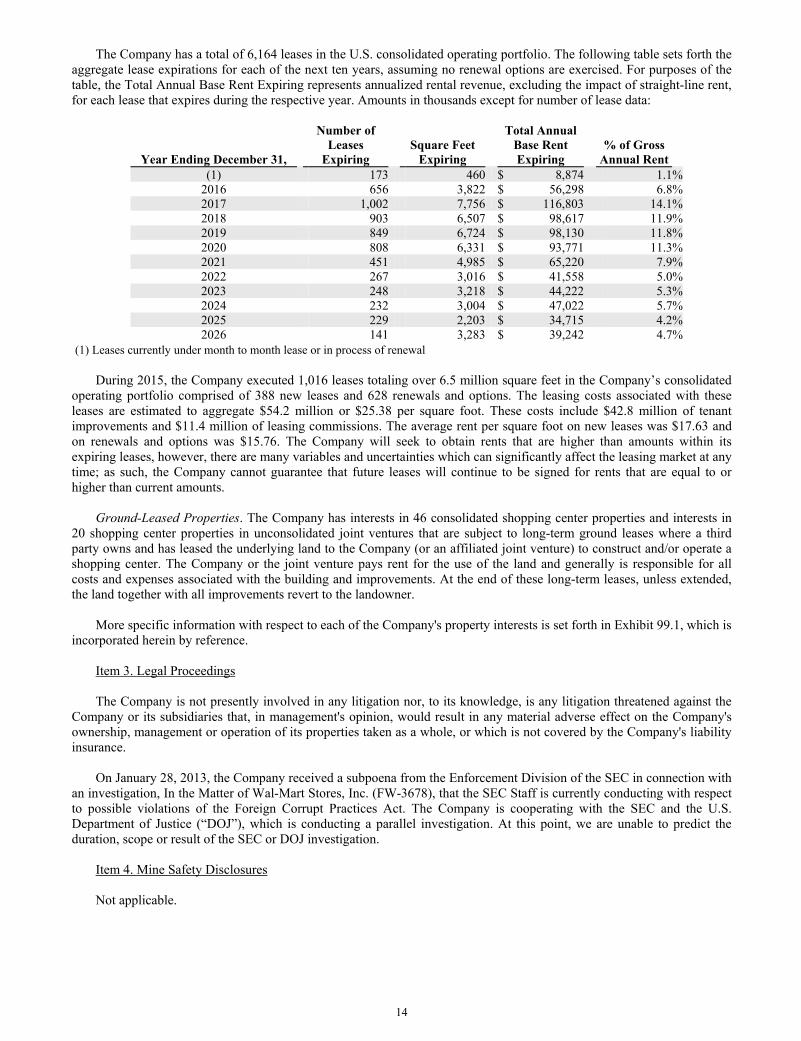
14
The Company has a total of 6,164 leases in the U.S. consolidated operating portfolio. The following table sets forth the aggregate lease expirations for each of the next ten years, assuming no renewal options are exercised. For purposes of the table, the Total Annual Base Rent Expiring represents annualized rental revenue, excluding the impact of straight-line rent, for each lease that expires during the respective year. Amounts in thousands except for number of lease data:
Year Ending December 31,
Number of Leases
Expiring Square Feet
Expiring
Total Annual Base Rent Expiring
% of Gross Annual Rent
(1) 173 460 $ 8,874 1.1 %2016 656 3,822 $ 56,298 6.8%2017 1,002 7,756 $ 116,803 14.1%2018 903 6,507 $ 98,617 11.9%2019 849 6,724 $ 98,130 11.8%2020 808 6,331 $ 93,771 11.3%2021 451 4,985 $ 65,220 7.9%2022 267 3,016 $ 41,558 5.0%2023 248 3,218 $ 44,222 5.3%2024 232 3,004 $ 47,022 5.7%2025 229 2,203 $ 34,715 4.2%2026 141 3,283 $ 39,242 4.7%
(1) Leases currently under month to month lease or in process of renewal
During 2015, the Company executed 1,016 leases totaling over 6.5 million square feet in the Company’s consolidated operating portfolio comprised of 388 new leases and 628 renewals and options. The leasing costs associated with these leases are estimated to aggregate $54.2 million or $25.38 per square foot. These costs include $42.8 million of tenant improvements and $11.4 million of leasing commissions. The average rent per square foot on new leases was $17.63 and on renewals and options was $15.76. The Company will seek to obtain rents that are higher than amounts within its expiring leases, however, there are many variables and uncertainties which can significantly affect the leasing market at any time; as such, the Company cannot guarantee that future leases will continue to be signed for rents that are equal to or higher than current amounts.
Ground-Leased Properties. The Company has interests in 46 consolidated shopping center properties and interests in
20 shopping center properties in unconsolidated joint ventures that are subject to long-term ground leases where a third party owns and has leased the underlying land to the Company (or an affiliated joint venture) to construct and/or operate a shopping center. The Company or the joint venture pays rent for the use of the land and generally is responsible for all costs and expenses associated with the building and improvements. At the end of these long-term leases, unless extended, the land together with all improvements revert to the landowner.
More specific information with respect to each of the Company's property interests is set forth in Exhibit 99.1, which is
incorporated herein by reference. Item 3. Legal Proceedings The Company is not presently involved in any litigation nor, to its knowledge, is any litigation threatened against the
Company or its subsidiaries that, in management's opinion, would result in any material adverse effect on the Company's ownership, management or operation of its properties taken as a whole, or which is not covered by the Company's liability insurance.
On January 28, 2013, the Company received a subpoena from the Enforcement Division of the SEC in connection with
an investigation, In the Matter of Wal-Mart Stores, Inc. (FW-3678), that the SEC Staff is currently conducting with respect to possible violations of the Foreign Corrupt Practices Act. The Company is cooperating with the SEC and the U.S. Department of Justice (“DOJ”), which is conducting a parallel investigation. At this point, we are unable to predict the duration, scope or result of the SEC or DOJ investigation.
Item 4. Mine Safety Disclosures Not applicable.
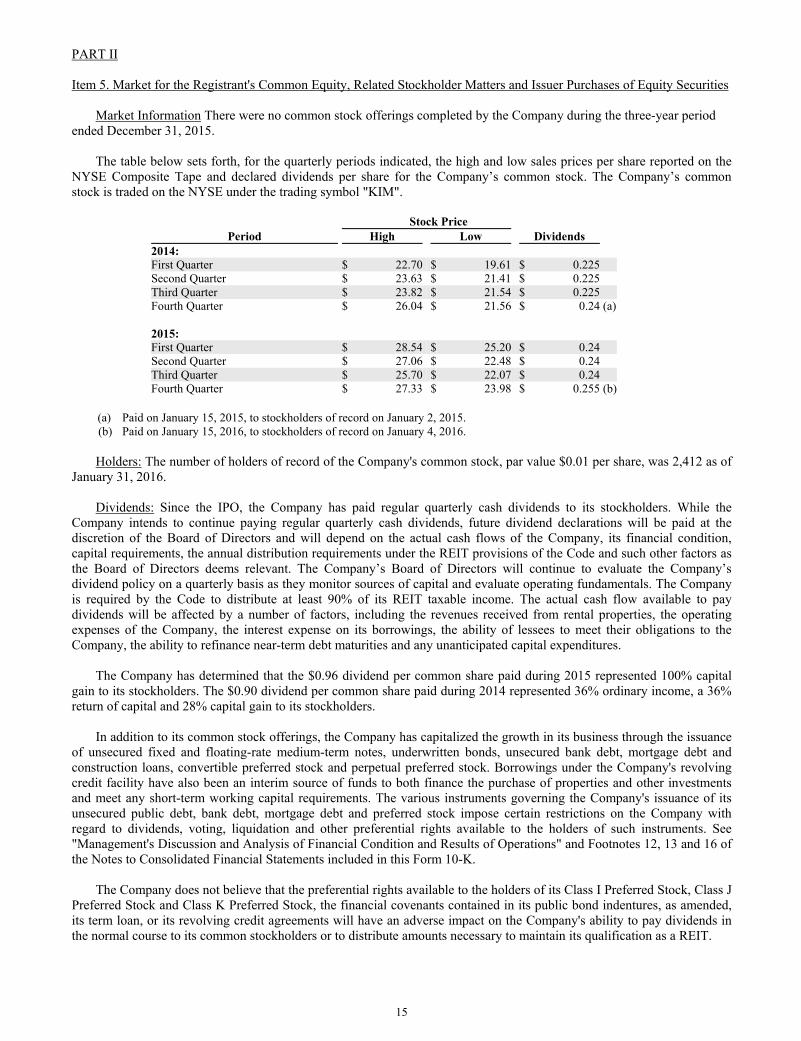
15
PART II
Item 5. Market for the Registrant's Common Equity, Related Stockholder Matters and Issuer Purchases of Equity Securities Market Information There were no common stock offerings completed by the Company during the three-year period
ended December 31, 2015. The table below sets forth, for the quarterly periods indicated, the high and low sales prices per share reported on the
NYSE Composite Tape and declared dividends per share for the Company’s common stock. The Company’s common stock is traded on the NYSE under the trading symbol "KIM".
Stock Price
Period High Low Dividends 2014: First Quarter $ 22.70 $ 19.61 $ 0.225 Second Quarter $ 23.63 $ 21.41 $ 0.225 Third Quarter $ 23.82 $ 21.54 $ 0.225 Fourth Quarter $ 26.04 $ 21.56 $ 0.24 (a) 2015: First Quarter $ 28.54 $ 25.20 $ 0.24 Second Quarter $ 27.06 $ 22.48 $ 0.24 Third Quarter $ 25.70 $ 22.07 $ 0.24 Fourth Quarter $ 27.33 $ 23.98 $ 0.255 (b)
(a) Paid on January 15, 2015, to stockholders of record on January 2, 2015. (b) Paid on January 15, 2016, to stockholders of record on January 4, 2016.
Holders: The number of holders of record of the Company's common stock, par value $0.01 per share, was 2,412 as of
January 31, 2016. Dividends: Since the IPO, the Company has paid regular quarterly cash dividends to its stockholders. While the
Company intends to continue paying regular quarterly cash dividends, future dividend declarations will be paid at the discretion of the Board of Directors and will depend on the actual cash flows of the Company, its financial condition, capital requirements, the annual distribution requirements under the REIT provisions of the Code and such other factors as the Board of Directors deems relevant. The Company’s Board of Directors will continue to evaluate the Company’s dividend policy on a quarterly basis as they monitor sources of capital and evaluate operating fundamentals. The Company is required by the Code to distribute at least 90% of its REIT taxable income. The actual cash flow available to pay dividends will be affected by a number of factors, including the revenues received from rental properties, the operating expenses of the Company, the interest expense on its borrowings, the ability of lessees to meet their obligations to the Company, the ability to refinance near-term debt maturities and any unanticipated capital expenditures.
The Company has determined that the $0.96 dividend per common share paid during 2015 represented 100% capital
gain to its stockholders. The $0.90 dividend per common share paid during 2014 represented 36% ordinary income, a 36% return of capital and 28% capital gain to its stockholders.
In addition to its common stock offerings, the Company has capitalized the growth in its business through the issuance
of unsecured fixed and floating-rate medium-term notes, underwritten bonds, unsecured bank debt, mortgage debt and construction loans, convertible preferred stock and perpetual preferred stock. Borrowings under the Company's revolving credit facility have also been an interim source of funds to both finance the purchase of properties and other investments and meet any short-term working capital requirements. The various instruments governing the Company's issuance of its unsecured public debt, bank debt, mortgage debt and preferred stock impose certain restrictions on the Company with regard to dividends, voting, liquidation and other preferential rights available to the holders of such instruments. See "Management's Discussion and Analysis of Financial Condition and Results of Operations" and Footnotes 12, 13 and 16 of the Notes to Consolidated Financial Statements included in this Form 10-K.
The Company does not believe that the preferential rights available to the holders of its Class I Preferred Stock, Class J
Preferred Stock and Class K Preferred Stock, the financial covenants contained in its public bond indentures, as amended, its term loan, or its revolving credit agreements will have an adverse impact on the Company's ability to pay dividends in the normal course to its common stockholders or to distribute amounts necessary to maintain its qualification as a REIT.
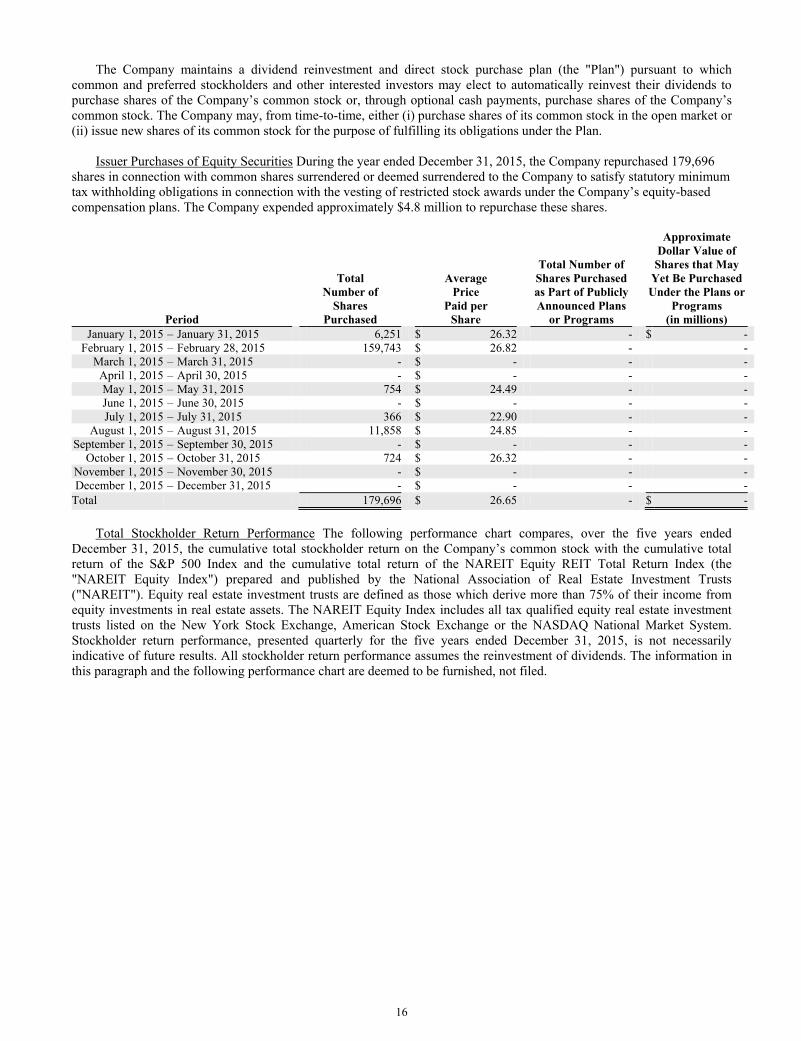
16
The Company maintains a dividend reinvestment and direct stock purchase plan (the "Plan") pursuant to which
common and preferred stockholders and other interested investors may elect to automatically reinvest their dividends to purchase shares of the Company’s common stock or, through optional cash payments, purchase shares of the Company’s common stock. The Company may, from time-to-time, either (i) purchase shares of its common stock in the open market or (ii) issue new shares of its common stock for the purpose of fulfilling its obligations under the Plan.
Issuer Purchases of Equity Securities During the year ended December 31, 2015, the Company repurchased 179,696
shares in connection with common shares surrendered or deemed surrendered to the Company to satisfy statutory minimum tax withholding obligations in connection with the vesting of restricted stock awards under the Company’s equity-based compensation plans. The Company expended approximately $4.8 million to repurchase these shares.
Period
Total Number of
Shares Purchased
Average Price
Paid per Share
Total Number of Shares Purchased as Part of Publicly Announced Plans
or Programs
Approximate Dollar Value of Shares that May
Yet Be Purchased Under the Plans or
Programs (in millions)
January 1, 2015 – January 31, 2015 6,251 $ 26.32 - $ - February 1, 2015 – February 28, 2015 159,743 $ 26.82 - -
March 1, 2015 – March 31, 2015 - $ - - - April 1, 2015 – April 30, 2015 - $ - - - May 1, 2015 – May 31, 2015 754 $ 24.49 - - June 1, 2015 – June 30, 2015 - $ - - - July 1, 2015 – July 31, 2015 366 $ 22.90 - -
August 1, 2015 – August 31, 2015 11,858 $ 24.85 - - September 1, 2015 – September 30, 2015 - $ - - -
October 1, 2015 – October 31, 2015 724 $ 26.32 - - November 1, 2015 – November 30, 2015 - $ - - - December 1, 2015 – December 31, 2015 - $ - - -
Total 179,696 $ 26.65 - $ -
Total Stockholder Return Performance The following performance chart compares, over the five years ended December 31, 2015, the cumulative total stockholder return on the Company’s common stock with the cumulative total return of the S&P 500 Index and the cumulative total return of the NAREIT Equity REIT Total Return Index (the "NAREIT Equity Index") prepared and published by the National Association of Real Estate Investment Trusts ("NAREIT"). Equity real estate investment trusts are defined as those which derive more than 75% of their income from equity investments in real estate assets. The NAREIT Equity Index includes all tax qualified equity real estate investment trusts listed on the New York Stock Exchange, American Stock Exchange or the NASDAQ National Market System. Stockholder return performance, presented quarterly for the five years ended December 31, 2015, is not necessarily indicative of future results. All stockholder return performance assumes the reinvestment of dividends. The information in this paragraph and the following performance chart are deemed to be furnished, not filed.
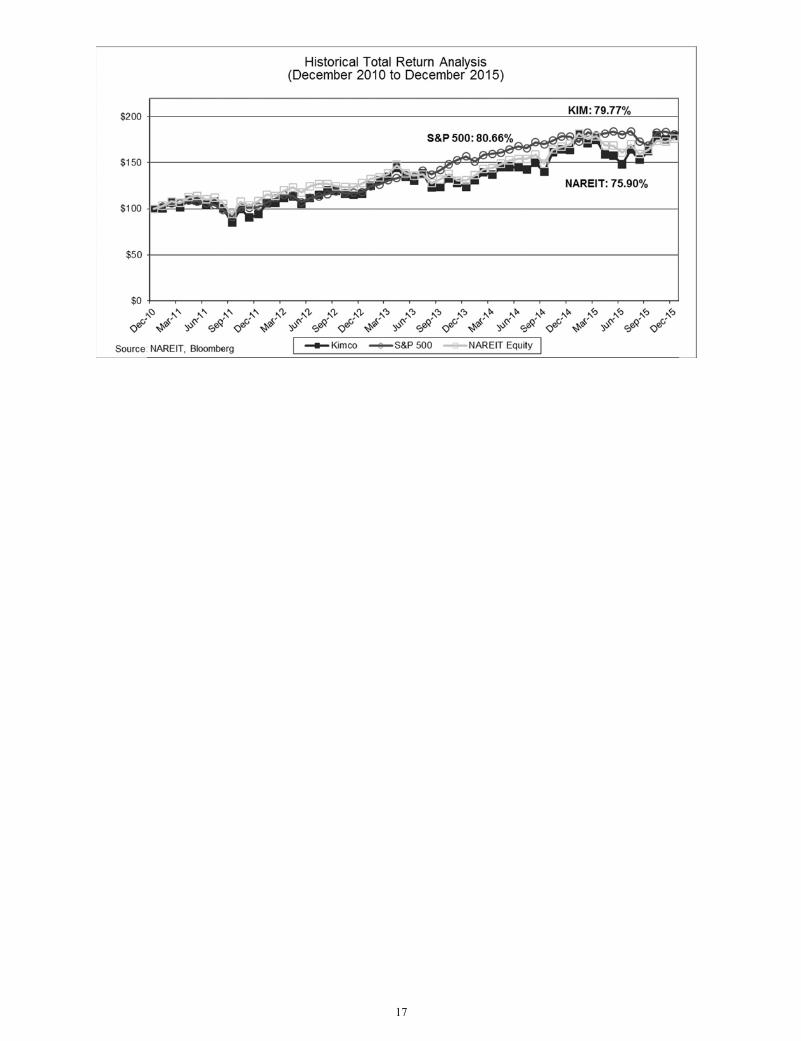
17
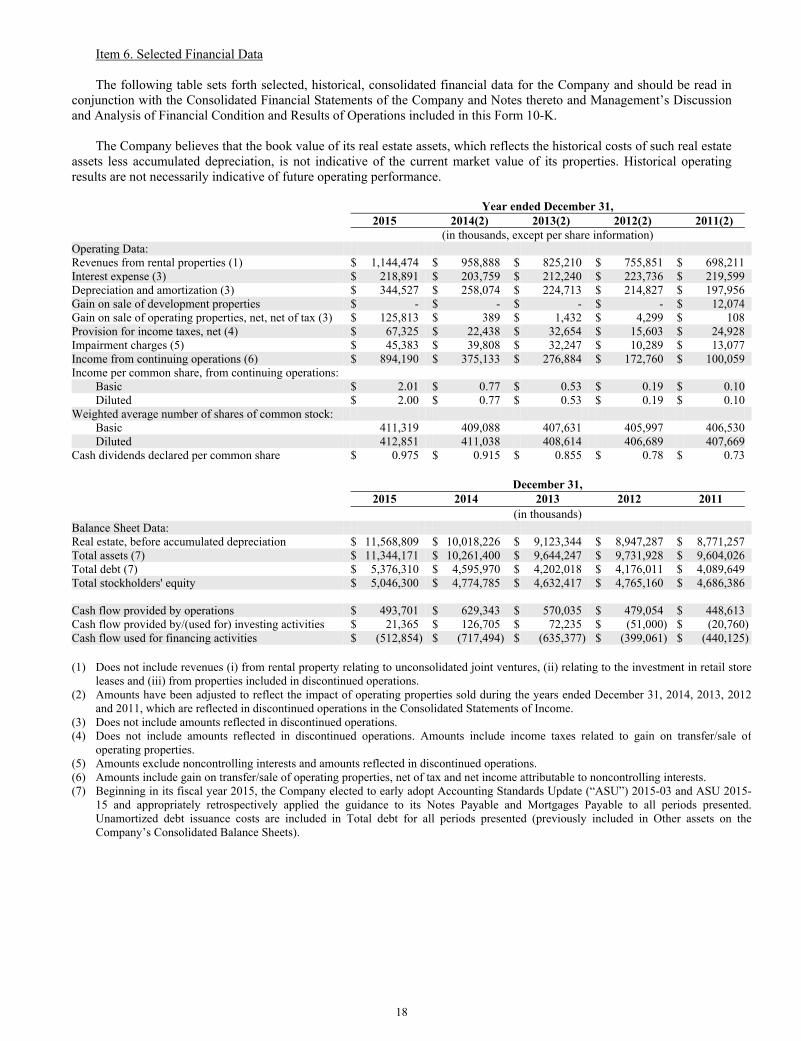
18
Item 6. Selected Financial Data The following table sets forth selected, historical, consolidated financial data for the Company and should be read in
conjunction with the Consolidated Financial Statements of the Company and Notes thereto and Management’s Discussion and Analysis of Financial Condition and Results of Operations included in this Form 10-K.
The Company believes that the book value of its real estate assets, which reflects the historical costs of such real estate
assets less accumulated depreciation, is not indicative of the current market value of its properties. Historical operating results are not necessarily indicative of future operating performance.
Year ended December 31, 2015 2014(2) 2013(2) 2012(2) 2011(2) (in thousands, except per share information) Operating Data: Revenues from rental properties (1) $ 1,144,474 $ 958,888 $ 825,210 $ 755,851 $ 698,211 Interest expense (3) $ 218,891 $ 203,759 $ 212,240 $ 223,736 $ 219,599 Depreciation and amortization (3) $ 344,527 $ 258,074 $ 224,713 $ 214,827 $ 197,956 Gain on sale of development properties $ - $ - $ - $ - $ 12,074 Gain on sale of operating properties, net, net of tax (3) $ 125,813 $ 389 $ 1,432 $ 4,299 $ 108 Provision for income taxes, net (4) $ 67,325 $ 22,438 $ 32,654 $ 15,603 $ 24,928 Impairment charges (5) $ 45,383 $ 39,808 $ 32,247 $ 10,289 $ 13,077 Income from continuing operations (6) $ 894,190 $ 375,133 $ 276,884 $ 172,760 $ 100,059 Income per common share, from continuing operations:
Basic $ 2.01 $ 0.77 $ 0.53 $ 0.19 $ 0.10 Diluted $ 2.00 $ 0.77 $ 0.53 $ 0.19 $ 0.10
Weighted average number of shares of common stock: Basic 411,319 409,088 407,631 405,997 406,530 Diluted 412,851 411,038 408,614 406,689 407,669
Cash dividends declared per common share $ 0.975 $ 0.915 $ 0.855 $ 0.78 $ 0.73
December 31, 2015 2014 2013 2012 2011 (in thousands) Balance Sheet Data: Real estate, before accumulated depreciation $ 11,568,809 $ 10,018,226 $ 9,123,344 $ 8,947,287 $ 8,771,257 Total assets (7) $ 11,344,171 $ 10,261,400 $ 9,644,247 $ 9,731,928 $ 9,604,026 Total debt (7) $ 5,376,310 $ 4,595,970 $ 4,202,018 $ 4,176,011 $ 4,089,649 Total stockholders' equity $ 5,046,300 $ 4,774,785 $ 4,632,417 $ 4,765,160 $ 4,686,386 Cash flow provided by operations $ 493,701 $ 629,343 $ 570,035 $ 479,054 $ 448,613 Cash flow provided by/(used for) investing activities $ 21,365 $ 126,705 $ 72,235 $ (51,000) $ (20,760)Cash flow used for financing activities $ (512,854) $ (717,494) $ (635,377) $ (399,061) $ (440,125)
(1) Does not include revenues (i) from rental property relating to unconsolidated joint ventures, (ii) relating to the investment in retail store
leases and (iii) from properties included in discontinued operations. (2) Amounts have been adjusted to reflect the impact of operating properties sold during the years ended December 31, 2014, 2013, 2012
and 2011, which are reflected in discontinued operations in the Consolidated Statements of Income. (3) Does not include amounts reflected in discontinued operations. (4) Does not include amounts reflected in discontinued operations. Amounts include income taxes related to gain on transfer/sale of
operating properties. (5) Amounts exclude noncontrolling interests and amounts reflected in discontinued operations. (6) Amounts include gain on transfer/sale of operating properties, net of tax and net income attributable to noncontrolling interests. (7) Beginning in its fiscal year 2015, the Company elected to early adopt Accounting Standards Update (“ASU”) 2015-03 and ASU 2015-
15 and appropriately retrospectively applied the guidance to its Notes Payable and Mortgages Payable to all periods presented. Unamortized debt issuance costs are included in Total debt for all periods presented (previously included in Other assets on the Company’s Consolidated Balance Sheets).
19
Item 7. Management's Discussion and Analysis of Financial Condition and Results of Operations
The following discussion should be read in conjunction with the Consolidated Financial Statements and Notes thereto included in this Form 10-K. Historical results and percentage relationships set forth in the Consolidated Statements of Income contained in the Consolidated Financial Statements, including trends, should not be taken as indicative of future operations.
Executive Summary Kimco Realty Corporation is one of the nation’s largest publicly-traded owners and operators of open-air shopping
centers. As of December 31, 2015, the Company had interests in 605 shopping center properties, aggregating 96.0 million square feet of GLA located in 38 states, Puerto Rico and Canada. In addition, the Company had 446 other property interests, primarily through the Company’s preferred equity investments and other real estate investments, totaling 7.3 million square feet of GLA.
The executive officers are engaged in the day-to-day management and operation of real estate exclusively with the
Company, with nearly all operating functions, including leasing, asset management, maintenance, construction, legal, finance and accounting, administered by the Company.
The Company’s strategy is to be the premier owner and operator of open-air shopping centers through investments
primarily in the U.S.. To achieve this strategy the Company is (i) continuing to transform the quality of its portfolio by disposing of lesser quality assets and acquiring larger higher quality properties in key markets identified by the Company, (ii) simplifying its business by (a) reducing the number of joint venture investments and (b) exiting Mexico, South America and Canada, for which the exit of South America has been completed and Mexico has been substantially completed, (iii) pursuing redevelopment opportunities within its portfolio to increase overall value and (iv) selectively acquiring land parcels in our key markets for ground-up development projects, consisting of retail and/or mixed use centers, for long-term investment. In addition, the Company may consider other opportunistic investments related to retailer controlled real estate such as, repositioning underperforming retail locations, retail real estate financing and bankruptcy transaction support. The Company has an active capital recycling program which provides for the disposition of certain U.S. properties. If the Company accepts sales prices for any of these assets that are less than their net carrying values, the Company would be required to take impairment charges and such amounts could be material. In order to execute the Company’s strategy, the Company intends to continue to strengthen its balance sheet by pursuing deleveraging efforts over time, providing it the necessary flexibility to invest opportunistically and selectively, primarily focusing on U.S. open-air shopping centers.
The following highlights the Company’s significant transactions, events and results that occurred during the year
ended December 31, 2015:
Portfolio Information:
● Net income available to common shareholders increased by $465.5 million to $831.2 million for the year endedDecember 31, 2015, as compared to $365.7 million for the corresponding period in 2014.
● Funds from operations (“FFO”) increased from $596.2 million or $1.45 per diluted share for the year ended December
31, 2014, to $643.2 million or $1.56 per diluted share for the year ended December 31, 2015 (see additional disclosureon FFO beginning on page 34).
● FFO as adjusted increased from $576.9 million or $1.40 per diluted share for the year ended December 31, 2014, to
$603.4 million or $1.46 per diluted share for the year ended December 31, 2015 (see additional disclosure on FFObeginning on page 34).
● U.S. same property net operating income (“U.S. Same Property NOI”) increased 3.1% for the year ended December
31, 2015, as compared to the corresponding period in 2014 (see additional disclosure on U.S. Same Property NOI beginning on page 36).
● U.S. pro-rata occupancy rose from 95.7% at December 31, 2014, to 95.8% at December 31, 2015.
● Executed 1,016 new leases, renewals and options totaling approximately 6.5 million square feet in the CombinedShopping Center Portfolio.
Acquisition Activity (see Footnotes 3 and 7 of the Notes to Consolidated Financial Statements included in this Form 10-K):
● Acquired 48 shopping center properties, nine out-parcels and three land parcels comprising an aggregate 7.5 million
square feet of GLA, for an aggregate purchase price of $1.8 billion including the assumption of $807.6 million of non-recourse mortgage debt encumbering 38 of the properties. The Company acquired 43 of these properties for an
20
aggregate sales price of $1.6 billion from joint ventures in which the Company previously held noncontrollingownership interests and recognized an aggregate gain on change in control of interests of $149.2 million from the fairvalue adjustment.
● Additionally, during the year ended December 31, 2015, the Company acquired $20.7 million in land related to two
existing development projects which will be held as long-term investments. The Company anticipates completing these projects over the next four years.
Disposition Activity (see Footnotes 4, 5, and 6 of the Notes to Consolidated Financial Statements included in this Form 10-K):
● During 2015, the Company disposed of 90 consolidated operating properties and eight out-parcels, including its remaining property in Chile, in separate transactions, for an aggregate sales price of $543.9 million. Thesetransactions resulted in an aggregate net gain of $125.8 million, after income tax expense, foreign currency translationloss of $19.6 million related to the sale of the remaining Chile property and aggregate impairment charges of $10.2million, before income tax expense of $2.3 million.
Capital Activity (for additional details see Liquidity and Capital Resources below):
● During January 2015, the Company entered into a new $650.0 million unsecured term loan (“Term Loan”) which hasan initial maturity date in January 2017 (with three one-year extension options at the Company’s discretion) and accrues interest at a spread (currently 95 basis points) to LIBOR or at the Company’s option at a base rate as definedper the agreement (1.37% at December 31, 2015). The proceeds from the Term Loan were used to repay theCompany’s $400.0 million term loan, which was scheduled to mature in April 2015 (with two additional one-year extension options) and bore interest at LIBOR plus 105 basis points, and for general corporate purposes.
● During March 2015, the Company issued $350.0 million of 30-year Senior Unsecured Notes at an interest rate of 4.25% payable semi-annually in arrears which are scheduled to mature in April 2045.
● During October 2015, the Company issued $500.0 million of seven-year Senior Unsecured Notes at an interest rate of 3.40% payable semi-annually in arrears which are scheduled to mature in November 2022.
● During November 2015, the Company redeemed all of its outstanding 7,000,000 depositary shares of the Company’s6.90% Class H Cumulative Redeemable Preferred Stock (the “Class H Preferred Stock”) resulting in an aggregatepayment of $175.0 million. In connection with this redemption the Company recorded a non-cash charge of $5.8 million resulting from the difference between the redemption amount and the carrying amount of the Class HPreferred Stock on the Company’s Consolidated Balance Sheets.
● During 2015, the Company repaid (i) its $100.0 million 4.904% medium term notes, which matured in February 2015,
(ii) its $100.0 million 5.250% senior unsecured notes, which matured in September 2015 and (iii) its $150.0 million5.584% medium term notes, which matured in November 2015.
● Also during 2015, the Company paid off $557.0 million of mortgage debt (including fair market value adjustment of$1.4 million) that encumbered 27 operating properties.
Critical Accounting Policies
The Consolidated Financial Statements of the Company include the accounts of the Company, its wholly-owned subsidiaries and all entities in which the Company has a controlling interest, including where the Company has been determined to be a primary beneficiary of a variable interest entity in accordance with the consolidation guidance of the FASB Accounting Standards Codification (“ASC”). The Company applies these provisions to each of its joint venture investments to determine whether the cost, equity or consolidation method of accounting is appropriate. The preparation of financial statements in conformity with accounting principles generally accepted in the United States requires management to make estimates and assumptions in certain circumstances that affect amounts reported in the accompanying Consolidated Financial Statements and related notes. In preparing these financial statements, management has made its best estimates and assumptions that affect the reported amounts of assets and liabilities. These estimates are based on, but not limited to, historical results, industry standards and current economic conditions, giving due consideration to materiality. The most significant assumptions and estimates relate to revenue recognition and the recoverability of trade accounts receivable, depreciable lives, valuation of real estate and intangible assets and liabilities, valuation of joint venture investments and other investments, realizability of deferred tax assets and uncertain tax positions. Application of these assumptions requires the exercise of judgment as to future uncertainties, and, as a result, actual results could materially differ from these estimates.
21
The Company is required to make subjective assessments as to whether there are impairments in the value of its real estate properties, investments in joint ventures, marketable securities and other investments. The Company’s reported net earnings are directly affected by management’s estimate of impairments and/or valuation allowances.
Revenue Recognition and Accounts Receivable Base rental revenues from rental property are recognized on a straight-line basis over the terms of the related leases.
Certain of these leases also provide for percentage rents based upon the level of sales achieved by the lessee. These percentage rents are recorded once the required sales level is achieved. Operating expense reimbursements are recognized as earned. Rental income may also include payments received in connection with lease termination agreements. In addition, leases typically provide for reimbursement to the Company of common area maintenance, real estate taxes and other operating expenses.
The Company makes estimates of the uncollectability of its accounts receivable related to base rents, straight-line rent,
expense reimbursements and other revenues. The Company analyzes accounts receivable and historical bad debt levels, customer credit-worthiness and current economic trends when evaluating the adequacy of the allowance for doubtful accounts. In addition, tenants in bankruptcy are analyzed and estimates are made in connection with the expected recovery of pre-petition and post-petition claims. The Company’s reported net earnings are directly affected by management’s estimate of the collectability of accounts receivable.
Real Estate The Company’s investments in real estate properties are stated at cost, less accumulated depreciation and amortization.
Expenditures for maintenance and repairs are charged to operations as incurred. Significant renovations and replacements, which improve and extend the life of the asset, are capitalized.
Upon acquisition of real estate operating properties, the Company estimates the fair value of acquired tangible assets
(consisting of land, building, building improvements and tenant improvements) and identified intangible assets and liabilities (consisting of above and below-market leases, in-place leases and tenant relationships, where applicable), assumed debt and redeemable units issued at the date of acquisition, based on evaluation of information and estimates available at that date. Fair value is determined based on an exit price approach, which contemplates the price that would be received to sell an asset or paid to transfer a liability in an orderly transaction between market participants at the measurement date. If, up to one year from the acquisition date, information regarding fair value of the assets acquired and liabilities assumed is received and estimates are refined, appropriate adjustments, if material, are made to the purchase price allocation on a retrospective basis. The Company expenses transaction costs associated with business combinations in the period incurred.
Depreciation and amortization are provided on the straight-line method over the estimated useful lives of the assets, as
follows:
Buildings and building improvements 15 to 50 years Fixtures, leasehold and tenant improvements Terms of leases or useful
(including certain identified intangible assets) lives, whichever is shorter The Company is required to make subjective assessments as to the useful lives of its properties for purposes of
determining the amount of depreciation to reflect on an annual basis with respect to those properties. These assessments have a direct impact on the Company’s net earnings.
On a continuous basis, management assesses whether there are any indicators, including property operating
performance, changes in anticipated holding period and general market conditions, that the value of the real estate properties (including any related amortizable intangible assets or liabilities) may be impaired. A property value is considered impaired only if management’s estimate of current and projected operating cash flows (undiscounted and unleveraged) of the property over its anticipated hold period is less than the net carrying value of the property. Such cash flow projections consider factors such as expected future operating income, trends and prospects, as well as the effects of demand, competition and other factors. To the extent impairment has occurred, the carrying value of the property would be adjusted to reflect the estimated fair value of the property.
22
When a real estate asset is identified by management as held-for-sale, the Company ceases depreciation of the asset and estimates the sales price of such asset net of selling costs. If, in management’s opinion, the net sales price of the asset is less than the net book value of such asset, an adjustment to the carrying value would be recorded to reflect the estimated fair value of the property.
Investments in Unconsolidated Joint Ventures The Company accounts for its investments in unconsolidated joint ventures under the equity method of accounting as
the Company exercises significant influence, but does not control, these entities. These investments are recorded initially at cost and are subsequently adjusted for cash contributions and distributions. Earnings for each investment are recognized in accordance with each respective investment agreement and, where applicable, are based upon an allocation of the investment’s net assets at book value as if the investment was hypothetically liquidated at the end of each reporting period.
The Company’s joint ventures and other real estate investments primarily consist of co-investments with institutional
and other joint venture partners in open-air shopping center properties, consistent with its core business. These joint ventures typically obtain non-recourse third-party financing on their property investments, thus contractually limiting the Company’s exposure to losses to the amount of its equity investment, and, due to the lender’s exposure to losses, a lender typically will require a minimum level of equity in order to mitigate its risk. The Company’s exposure to losses associated with its unconsolidated joint ventures is primarily limited to its carrying value in these investments.
On a continuous basis, management assesses whether there are any indicators, including property operating
performance and general market conditions, that the value of the Company’s investments in unconsolidated joint ventures may be impaired. An investment’s value is impaired only if management’s estimate of the fair value of the investment is less than the carrying value of the investment and such difference is deemed to be other-than-temporary. To the extent impairment has occurred, the loss shall be measured as the excess of the carrying amount of the investment over the estimated fair value of the investment.
The Company’s estimated fair values are based upon a discounted cash flow model for each joint venture that includes
all estimated cash inflows and outflows over a specified holding period and, where applicable, any estimated debt premiums. Capitalization rates, discount rates and credit spreads utilized in these models are based upon rates that the Company believes to be within a reasonable range of current market rates.
Realizability of Deferred Tax Assets and Uncertain Tax Positions The Company is subject to federal, state and local income taxes on the income from its activities relating to its TRS
activities and subject to local taxes on certain non-U.S. investments. The Company accounts for income taxes using the asset and liability method, which requires that deferred tax assets and liabilities be recognized based on future tax consequences of temporary differences between the financial statement carrying amounts of existing assets and liabilities and their respective tax basis. Deferred tax assets and liabilities are measured using enacted tax rates expected to apply in the years in which temporary differences are expected to be recovered or settled. The effect on deferred tax assets and liabilities of a change in tax rates is recognized in earnings in the period when the changes are enacted.
A reduction of the carrying amounts of deferred tax assets by a valuation allowance is required, if based on the
evidence available, it is more likely than not (a likelihood of more than 50 percent) that some portion or all of the deferred tax assets will not be realized. The valuation allowance should be sufficient to reduce the deferred tax asset to the amount that is more likely than not to be realized.
The Company considers all available evidence, both positive and negative, to determine whether, based on the weight
of that evidence, a valuation allowance is needed. Information about an enterprise's current financial position and its results of operations for the current and preceding years is supplemented by all currently available information about future years. The Company must use judgment in considering the relative impact of negative and positive evidence.
The Company believes, when evaluating deferred tax assets within its taxable REIT subsidiaries, special consideration
should be given to the unique relationship between the Company as a REIT and its taxable REIT subsidiaries. This relationship exists primarily to protect the REIT’s qualification under the Code by permitting, within certain limits, the REIT to engage in certain business activities in which the REIT cannot directly participate. As such, the REIT controls which and when investments are held in, or distributed or sold from, its taxable REIT subsidiaries. This relationship distinguishes a REIT and taxable REIT subsidiary from an enterprise that operates as a single, consolidated corporate taxpayer.
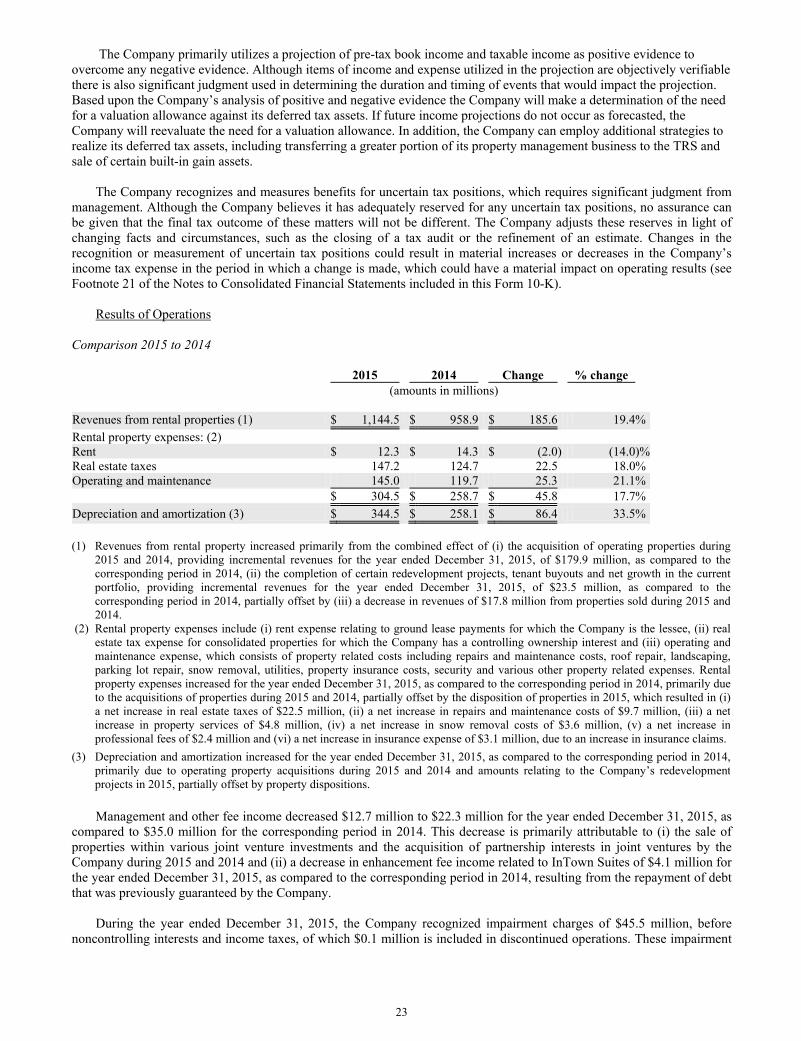
23
The Company primarily utilizes a projection of pre-tax book income and taxable income as positive evidence to overcome any negative evidence. Although items of income and expense utilized in the projection are objectively verifiable there is also significant judgment used in determining the duration and timing of events that would impact the projection. Based upon the Company’s analysis of positive and negative evidence the Company will make a determination of the need for a valuation allowance against its deferred tax assets. If future income projections do not occur as forecasted, the Company will reevaluate the need for a valuation allowance. In addition, the Company can employ additional strategies to realize its deferred tax assets, including transferring a greater portion of its property management business to the TRS and sale of certain built-in gain assets.
The Company recognizes and measures benefits for uncertain tax positions, which requires significant judgment from
management. Although the Company believes it has adequately reserved for any uncertain tax positions, no assurance can be given that the final tax outcome of these matters will not be different. The Company adjusts these reserves in light of changing facts and circumstances, such as the closing of a tax audit or the refinement of an estimate. Changes in the recognition or measurement of uncertain tax positions could result in material increases or decreases in the Company’s income tax expense in the period in which a change is made, which could have a material impact on operating results (see Footnote 21 of the Notes to Consolidated Financial Statements included in this Form 10-K).
Results of Operations Comparison 2015 to 2014 2015 2014 Change % change (amounts in millions) Revenues from rental properties (1) $ 1,144.5 $ 958.9 $ 185.6 19.4% Rental property expenses: (2) Rent $ 12.3 $ 14.3 $ (2.0) (14.0)%Real estate taxes 147.2 124.7 22.5 18.0% Operating and maintenance 145.0 119.7 25.3 21.1% $ 304.5 $ 258.7 $ 45.8 17.7% Depreciation and amortization (3) $ 344.5 $ 258.1 $ 86.4 33.5% (1) Revenues from rental property increased primarily from the combined effect of (i) the acquisition of operating properties during
2015 and 2014, providing incremental revenues for the year ended December 31, 2015, of $179.9 million, as compared to thecorresponding period in 2014, (ii) the completion of certain redevelopment projects, tenant buyouts and net growth in the currentportfolio, providing incremental revenues for the year ended December 31, 2015, of $23.5 million, as compared to thecorresponding period in 2014, partially offset by (iii) a decrease in revenues of $17.8 million from properties sold during 2015 and2014.
(2) Rental property expenses include (i) rent expense relating to ground lease payments for which the Company is the lessee, (ii) realestate tax expense for consolidated properties for which the Company has a controlling ownership interest and (iii) operating andmaintenance expense, which consists of property related costs including repairs and maintenance costs, roof repair, landscaping,parking lot repair, snow removal, utilities, property insurance costs, security and various other property related expenses. Rentalproperty expenses increased for the year ended December 31, 2015, as compared to the corresponding period in 2014, primarily dueto the acquisitions of properties during 2015 and 2014, partially offset by the disposition of properties in 2015, which resulted in (i)a net increase in real estate taxes of $22.5 million, (ii) a net increase in repairs and maintenance costs of $9.7 million, (iii) a netincrease in property services of $4.8 million, (iv) a net increase in snow removal costs of $3.6 million, (v) a net increase inprofessional fees of $2.4 million and (vi) a net increase in insurance expense of $3.1 million, due to an increase in insurance claims.
(3) Depreciation and amortization increased for the year ended December 31, 2015, as compared to the corresponding period in 2014,primarily due to operating property acquisitions during 2015 and 2014 and amounts relating to the Company’s redevelopmentprojects in 2015, partially offset by property dispositions. Management and other fee income decreased $12.7 million to $22.3 million for the year ended December 31, 2015, as
compared to $35.0 million for the corresponding period in 2014. This decrease is primarily attributable to (i) the sale of properties within various joint venture investments and the acquisition of partnership interests in joint ventures by the Company during 2015 and 2014 and (ii) a decrease in enhancement fee income related to InTown Suites of $4.1 million for the year ended December 31, 2015, as compared to the corresponding period in 2014, resulting from the repayment of debt that was previously guaranteed by the Company.
During the year ended December 31, 2015, the Company recognized impairment charges of $45.5 million, before
noncontrolling interests and income taxes, of which $0.1 million is included in discontinued operations. These impairment
24
charges consist of (i) $30.3 million related to adjustments to property carrying values, (ii) $9.0 million relating to a cost method investment, (iii) $5.3 million related to certain investments in other real estate investments and (iv) $0.8 million related to marketable debt securities investments. During the year ended December 31, 2014, the Company recognized impairment charges of $217.8 million, of which $178.0 million, before income tax benefits of $1.7 million, is included in discontinued operations. These impairment charges consist of (i) $118.4 million related to adjustments to property carrying values, (ii) the release of a cumulative foreign currency translation loss of $92.9 million relating to the substantial liquidation of the Company’s investment in Mexico, (iii) $4.8 million related to a cost method investment and (iv) $1.6 million related to a preferred equity investment. The adjustments to property carrying values were recognized in connection with the Company’s efforts to market certain properties and management’s assessment as to the likelihood and timing of such potential transactions and the anticipated hold period for such properties. Certain of the calculations to determine fair value utilized unobservable inputs and as such are classified as Level 3 of the fair value hierarchy. Certain of the calculations to determine fair value utilized unobservable inputs and as such are classified as Level 3 of the fair value hierarchy. For additional disclosure, see Footnote 15 of the Notes to Consolidated Financial Statements included in this Form 10-K.
Interest, dividends and other investment income increased $38.1 million to $39.1 million for the year ended December
31, 2015, as compared to $1.0 million for the corresponding period in 2014. This increase is primarily due to the sale of certain marketable securities during 2015, which resulted in an aggregate gain of $39.9 million.
Other income/(expense), net changed $10.7 million to income of $2.2 million for the year ended December 31, 2015,
as compared to an expense of $8.5 million for the corresponding period in 2014. This change is primarily due to (i) the release of contingent liabilities related to potential earn-out payments, for which the Company ultimately was not required to pay of $5.8 million, (ii) a decrease in acquisition related costs of $2.3 million and (iii) an increase in gains on land sales of $0.8 million.
Interest expense increased $15.1 million to $218.9 million for the year ended December 31, 2015, as compared to
$203.8 million for the corresponding period in 2014. This increase is primarily the result of higher levels of borrowings during 2015, as compared to 2014, primarily relating to the acquisition of operating properties during 2015 and 2014.
Provision for income taxes, net increased $37.8 million to $60.2 million for the year ended December 31, 2015, as
compared to $22.4 million for the corresponding period in 2014. This increase is primarily due to (i) an increase in foreign tax expense of $33.6 million primarily resulting from the sale of certain Canadian investments during 2015, as compared to 2014 and (ii) an increase in tax expense of $4.3 million relating to equity in income recognized in connection with the Company’s Albertson’s investment during 2015, as compared to 2014.
Equity in income of joint ventures, net increased $320.8 million to $480.4 million for the year ended December 31,
2015, as compared to $159.6 million for the corresponding period in 2014. This increase is primarily due to (i) an increase in gains of $316.1 million resulting from the sale of properties and sale of interests within various joint venture investments during the year ended December 31, 2015, as compared to the corresponding period in 2014 and (ii) the release of cumulative foreign currency translation loss of $47.3 million relating to the substantial liquidation of the Company’s investment in Mexico during 2014, partially offset by (iii) a decrease in equity in income of $15.6 million resulting from a cash distribution received in excess of the Company’s carrying basis in 2014, (iv) an increase in impairment charges of $14.9 million recognized during the year ended December 31, 2015, as compared to the corresponding period in 2014 and (v) lower equity in income resulting from the sales of properties within various joint venture investments and the acquisition of partnership interests in joint ventures by the Company during 2015 and 2014.
During 2015, the Company acquired 43 properties from joint ventures in which the Company had noncontrolling interests. The Company recorded a net gain on change in control of interests of $149.2 million related to the fair value adjustment associated with its previously held equity interests in these properties.
During 2014, the Company acquired 34 properties from joint ventures in which the Company had noncontrolling
interests. The Company recorded an aggregate net gain on change in control of interests of $107.2 million related to the fair value adjustment associated with its original ownership of these properties.
During 2015, the Company disposed of 89 consolidated operating properties and eight out-parcels, in separate
transactions, for an aggregate sales price of $492.5 million. These transactions resulted in an aggregate gain of $143.6 million, after income tax expense, and aggregate impairment charges of $10.2 million, before income tax expense of $2.3 million. Additionally, during 2015, the Company disposed of its remaining operating property in Chile for a sales price of $51.3 million. This transaction resulted in the release of a cumulative foreign currency translation loss of $19.6 million due
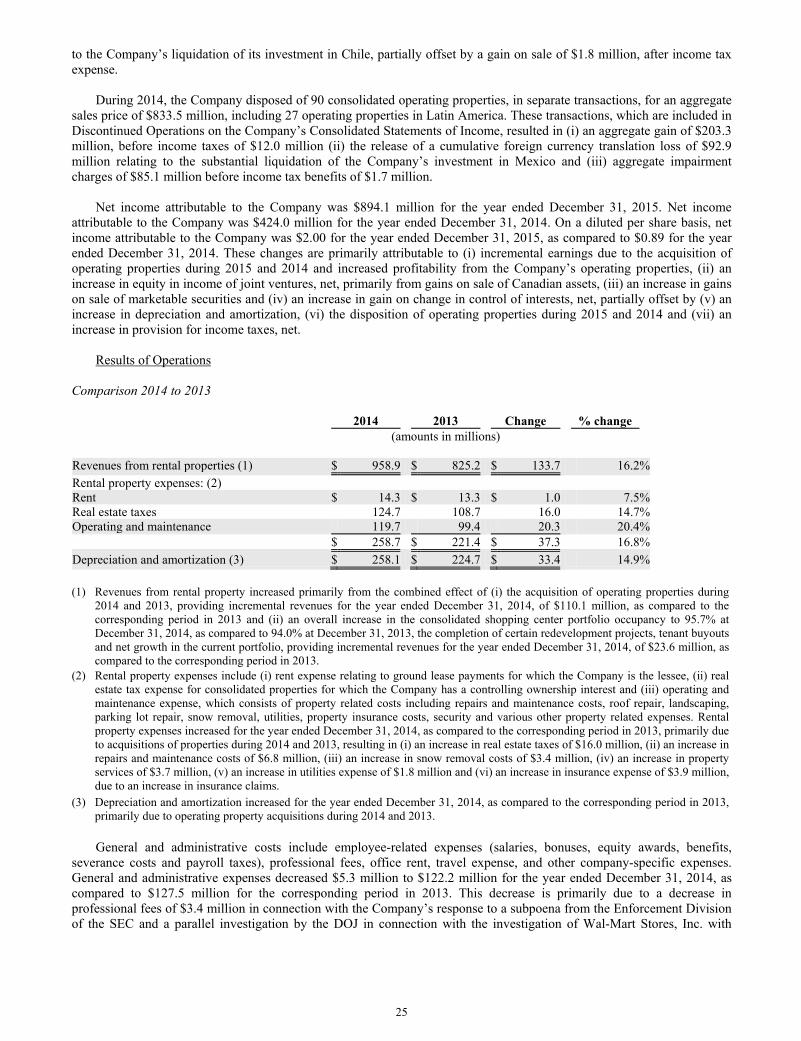
25
to the Company’s liquidation of its investment in Chile, partially offset by a gain on sale of $1.8 million, after income tax expense.
During 2014, the Company disposed of 90 consolidated operating properties, in separate transactions, for an aggregate
sales price of $833.5 million, including 27 operating properties in Latin America. These transactions, which are included in Discontinued Operations on the Company’s Consolidated Statements of Income, resulted in (i) an aggregate gain of $203.3 million, before income taxes of $12.0 million (ii) the release of a cumulative foreign currency translation loss of $92.9 million relating to the substantial liquidation of the Company’s investment in Mexico and (iii) aggregate impairment charges of $85.1 million before income tax benefits of $1.7 million.
Net income attributable to the Company was $894.1 million for the year ended December 31, 2015. Net income
attributable to the Company was $424.0 million for the year ended December 31, 2014. On a diluted per share basis, net income attributable to the Company was $2.00 for the year ended December 31, 2015, as compared to $0.89 for the year ended December 31, 2014. These changes are primarily attributable to (i) incremental earnings due to the acquisition of operating properties during 2015 and 2014 and increased profitability from the Company’s operating properties, (ii) an increase in equity in income of joint ventures, net, primarily from gains on sale of Canadian assets, (iii) an increase in gains on sale of marketable securities and (iv) an increase in gain on change in control of interests, net, partially offset by (v) an increase in depreciation and amortization, (vi) the disposition of operating properties during 2015 and 2014 and (vii) an increase in provision for income taxes, net.
Results of Operations Comparison 2014 to 2013 2014 2013 Change % change (amounts in millions) Revenues from rental properties (1) $ 958.9 $ 825.2 $ 133.7 16.2%Rental property expenses: (2) Rent $ 14.3 $ 13.3 $ 1.0 7.5%Real estate taxes 124.7 108.7 16.0 14.7%Operating and maintenance 119.7 99.4 20.3 20.4% $ 258.7 $ 221.4 $ 37.3 16.8%Depreciation and amortization (3) $ 258.1 $ 224.7 $ 33.4 14.9% (1) Revenues from rental property increased primarily from the combined effect of (i) the acquisition of operating properties during
2014 and 2013, providing incremental revenues for the year ended December 31, 2014, of $110.1 million, as compared to thecorresponding period in 2013 and (ii) an overall increase in the consolidated shopping center portfolio occupancy to 95.7% atDecember 31, 2014, as compared to 94.0% at December 31, 2013, the completion of certain redevelopment projects, tenant buyoutsand net growth in the current portfolio, providing incremental revenues for the year ended December 31, 2014, of $23.6 million, ascompared to the corresponding period in 2013.
(2) Rental property expenses include (i) rent expense relating to ground lease payments for which the Company is the lessee, (ii) realestate tax expense for consolidated properties for which the Company has a controlling ownership interest and (iii) operating andmaintenance expense, which consists of property related costs including repairs and maintenance costs, roof repair, landscaping,parking lot repair, snow removal, utilities, property insurance costs, security and various other property related expenses. Rentalproperty expenses increased for the year ended December 31, 2014, as compared to the corresponding period in 2013, primarily dueto acquisitions of properties during 2014 and 2013, resulting in (i) an increase in real estate taxes of $16.0 million, (ii) an increase inrepairs and maintenance costs of $6.8 million, (iii) an increase in snow removal costs of $3.4 million, (iv) an increase in propertyservices of $3.7 million, (v) an increase in utilities expense of $1.8 million and (vi) an increase in insurance expense of $3.9 million,due to an increase in insurance claims.
(3) Depreciation and amortization increased for the year ended December 31, 2014, as compared to the corresponding period in 2013,primarily due to operating property acquisitions during 2014 and 2013.
General and administrative costs include employee-related expenses (salaries, bonuses, equity awards, benefits,
severance costs and payroll taxes), professional fees, office rent, travel expense, and other company-specific expenses. General and administrative expenses decreased $5.3 million to $122.2 million for the year ended December 31, 2014, as compared to $127.5 million for the corresponding period in 2013. This decrease is primarily due to a decrease in professional fees of $3.4 million in connection with the Company’s response to a subpoena from the Enforcement Division of the SEC and a parallel investigation by the DOJ in connection with the investigation of Wal-Mart Stores, Inc. with
26
respect to the Foreign Corrupt Practices Act (see Item 3) and a decrease in personnel related costs of $1.8 million for the year ended December 31, 2014, as compared to the corresponding period in 2013.
During the year ended December 31, 2014, the Company recognized impairment charges of $217.8 million, of which
$178.0 million, before income tax benefits of $1.7 million, is included in discontinued operations. These impairment charges consist of (i) $118.4 million related to adjustments to property carrying values, (ii) the release of a cumulative foreign currency translation loss of $92.9 million relating to the substantial liquidation of the Company’s investment in Mexico, (iii) $4.8 million related to a cost method investment and (iv) $1.6 million related to a preferred equity investment. The adjustments to property carrying values were recognized in connection with the Company’s efforts to market certain properties and management’s assessment as to the likelihood and timing of such potential transactions and the anticipated hold period for such properties. During the second quarter ended June 30, 2014, the Company implemented a plan to accelerate its disposition of certain properties. This plan effectively shortened the Company’s anticipated hold period for these properties and as a result the Company recognized impairment charges on various operating properties. Certain of the calculations to determine fair value utilized unobservable inputs and as such are classified as Level 3 of the fair value hierarchy. For additional disclosure, see Footnote 15 of the Notes to Consolidated Financial Statements included in this Form 10-K.
During the year ended December 31, 2013, the Company recognized impairment charges of $190.2 million of which
$158.0 million, before noncontrolling interests and income tax, is included in discontinued operations. These impairment charges consist of (i) $175.6 million related to adjustments to property carrying values, (ii) $10.4 million related to a cost method investment, (iii) $1.0 million related to certain joint venture investments and (iv) $3.2 million related to a preferred equity investment. Certain of the calculations to determine fair value utilized unobservable inputs and as such are classified as Level 3 of the fair value hierarchy. For additional disclosure, see Footnote 15 of the Notes to Consolidated Financial Statements included in this Form 10-K.
Interest, dividends and other investment income decreased $15.8 million to $1.0 million for the year ended December
31, 2014, as compared to $16.8 million for the corresponding period in 2013. This decrease is primarily due to (i) a decrease in realized gains of $12.1 million resulting from the sale of certain marketable securities during the year ended December 31, 2013, (ii) a decrease in excess cash distributions related to cost method investments of $2.8 million for the year ended December 31, 2013 and (iii) a decrease in dividend income of $1.2 million resulting from the sale of certain marketable securities during the year ended December 31, 2013.
Other income/(expense), net changed $9.7 million to an expense of $8.5 million for the year ended December 31,
2014, as compared to income of $1.2 million for the corresponding period in 2013. This change is primarily due to a decrease in gains from land sales of $8.0 million and an increase in acquisition related costs of $1.4 million related to an increase in acquisitions during 2014 as compared to 2013.
Interest expense decreased $8.4 million to $203.8 million for the year ended December 31, 2014, as compared to
$212.2 million for the year ended December 31, 2013. This decrease is primarily related to lower effective interest rates and reduced borrowing levels during 2014, as compared to 2013.
Provision for income taxes, net decreased $10.3 million to $22.4 million for the year ended December 31, 2014, as
compared to $32.7 million for the corresponding period in 2013. This change is primarily due to (i) a decrease in foreign tax expense of $9.5 million primarily relating to the sale of certain unconsolidated properties during 2013 within the Company’s Latin American portfolio which were subject to foreign taxes at a consolidated reporting entity level offset by an increase in other foreign uncertain tax positions of $5.5 million, (ii) a decrease in tax provision of $9.1 million relating to a change in control gain recognized during the year ended December 31, 2013, (iii) a decrease in tax provision of $3.4 million related to gains on land sales during 2013, and (iv) a decrease in tax provision of $2.4 million related to gains on sale of certain marketable securities during 2013, partially offset by (v) a partial release of the deferred tax valuation allowance of $8.7 million during the year ended December 31, 2013 related to the Company’s FNC Realty Corp. (“FNC”) portfolio based on the Company’s estimated future earnings of FNC and (vi) a decrease in tax benefit of $4.3 million relating to equity losses recognized in connection with the Company’s Albertson’s investment.
Equity in income of joint ventures, net decreased $49.1 million to $159.6 million for the year ended December 31,
2014, as compared to $208.7 million for the corresponding period in 2013. This decrease is primarily the result of (i) the release of a cumulative foreign currency translation loss of $47.3 million relating to the substantial liquidation of the Company’s investment in Mexico, (ii) a decrease in gains of $21.7 million resulting from the sale of properties within various joint venture investments and interests in joint ventures primarily located in Latin America during 2013, (iii) a decrease in equity in income of $1.4 million due to the sale of the InTown portfolio in 2013 and (iv) a decrease of equity in
27
income of $7.5 million related to the sale of various joint ventures within the Company’s Latin American portfolio during 2014, partially offset by (v) an increase in equity in income of $15.6 million primarily resulting from a cash distribution received in excess of the Company’s carrying basis during 2014, and (vi) a decrease in impairment charges of $8.2 million relating to various joint venture properties primarily located in Mexico taken during the year ended 2013, as compared to 2014.
During 2014, the Company acquired 34 properties from joint ventures in which the Company had noncontrolling
interests. The Company recorded an aggregate net gain on change in control of interests of $107.2 million related to the fair value adjustment associated with its original ownership of these properties.
During 2013, the Company acquired four properties from joint ventures in which the Company had noncontrolling
interests. The Company recorded an aggregate net gain on change in control of interests of $21.7 million related to the fair value adjustment associated with its original ownership of these properties.
Equity in income from other real estate investments, net increased $6.9 million to $38.0 million for the year ended
December 31, 2014, as compared to $31.1 million for the corresponding period in 2013. This increase is primarily due to an increase of $10.7 million in equity in income, resulting from lower net losses in the Albertson’s joint venture during the year ended December 31, 2014, as compared to the corresponding period in 2013, partially offset by a decrease of $5.8 million in earnings from the Company’s Preferred Equity Program primarily resulting from the sale of the Company’s interests in certain preferred equity investments during 2014 and 2013.
During 2014, the Company disposed of 90 consolidated operating properties, in separate transactions, for an aggregate
sales price of $833.5 million, including 27 operating properties in Latin America. These transactions, which are included in Discontinued operations on the Company’s Consolidated Statements of Income, resulted in (i) an aggregate gain of $203.3 million, before income taxes of $12.0 million (ii) the release of a cumulative foreign currency translation loss of $92.9 million relating to the substantial liquidation of the Company’s investment in Mexico and (iii) aggregate impairment charges of $85.1 million before income tax benefits of $1.7 million.
During 2013, the Company disposed of 36 consolidated operating properties and three out-parcels in separate
transactions, for an aggregate sales price of $279.5 million. These transactions, which are included in Discontinued operations on the Company’s Consolidated Statements of Income, resulted in an aggregate gain of $25.4 million and impairment charges of $61.9 million, before income tax.
Additionally, during 2013, the Company sold eight consolidated properties in its Latin American portfolio for an
aggregate sales price of $115.4 million. These transactions, which are included in Discontinued operations on the Company’s Consolidated Statements of Income, resulted in an aggregate gain of $23.3 million, before income taxes, and aggregate impairment charges of $26.9 million (including the release of a cumulative foreign currency translation loss of $7.8 million associated with the sale of the Company’s interest in two properties within Brazil, which represents a full liquidation of the Company’s investment in Brazil), before income taxes.
Net income attributable to the Company increased $187.7 million to $424.0 million for the year ended December 31,
2014, as compared to $236.3 million for the corresponding period in 2013. On a diluted per share basis, net income attributable to the Company was $0.89 for 2014, as compared to net income attributable to the Company of $0.43 for 2013. These changes are primarily attributable to (i) incremental earnings due to the acquisition of operating properties during 2014 and 2013 and increased profitability from the Company’s operating properties, (ii) an increase in gains on sale of operating properties, (iii) an increase in gain on change in control of interests, (iv) a decrease in tax provision relating to decreased gains on sales from joint venture properties during 2014, and (v) an increase in equity in income of other real estate investments, net, partially offset by, (vi), a decrease in equity in income of joint ventures, net, including the release of a cumulative foreign currency translation loss relating to the substantial liquidation of the Company’s Mexican Portfolio (vii) a decrease in interest, dividends and other investment income, (viii) a decrease in other income/(expense), net and (ix) an increase in impairment charges, including the release of a cumulative foreign currency translation loss relating to the substantial liquidation of the Company’s Mexican Portfolio, during the year ended December 31, 2014, as compared to the corresponding period in 2013.
Liquidity and Capital Resources The Company’s capital resources include accessing the public debt and equity capital markets, mortgage and
construction loan financing, borrowings under term loans and immediate access to an unsecured revolving credit facility with bank commitments of $1.75 billion which can be increased to $2.25 billion through an accordion feature.
28
The Company’s cash flow activities are summarized as follows (in millions):
Year Ended December 31, 2015 2014 2013 Net cash flow provided by operating activities $ 493.7 $ 629.3 $ 570.0 Net cash flow provided by investing activities $ 21.4 $ 126.7 $ 72.2 Net cash flow used for financing activities $ (512.9) $ (717.5) $ (635.4)
Operating Activities The Company anticipates that cash on hand, borrowings under its revolving credit facility, issuance of equity and
public debt, as well as other debt and equity alternatives, will provide the necessary capital required by the Company. Net cash flows provided by operating activities for the year ended December 31, 2015, were $493.7 million, as compared to $629.3 million for the comparable period in 2014. The change of $135.6 million is primarily attributable to (i) a decrease in operational distributions from the Company’s joint venture programs due to the sale of certain joint ventures during 2015 and 2014 and (ii) changes in accounts and notes receivable and operating assets and liabilities due to timing of receipts and payments, partially offset by (iii) cash flow from the diverse portfolio of rental properties, (iv) the acquisition of operating properties during 2015 and 2014 and (v) new leasing, expansion and re-tenanting of core portfolio properties.
Investing Activities Cash flows provided by investing activities for the year ended December 31, 2015, was $21.4 million, as compared to
$126.7 million for the comparable period in 2014. This change of $105.3 million resulted primarily from (i) an increase in acquisition of operating real estate of $276.6 million, (ii) an increase in investment in other real estate investments of $190.3 million related to the Company’s KRS AB Acquisition, LLC joint venture investment in Safeway, Inc., (iii) a decrease in proceeds from the sale of operating properties of $175.7 million, (iv) a decrease in reimbursements of investments and advances to real estate joint ventures of $128.5 million, (v) an increase in improvements to operating real estate of $34.9 million and (vi) an increase in improvements to real estate under development of $16.4 million, partially offset by (vii) an increase in distributions from liquidation of real estate joint ventures of $373.8 million, (viii) an increase in return on investment from liquidation of real estate joint ventures of $88.7 million, (ix) an increase in proceeds from sale/repayments of marketable securities of $72.4 million, (x) a decrease in investment in mortgage loans receivable of $50.0 million, (xi) a decrease in acquisitions of real estate under development of $49.4 million, (xii) an increase in collection of mortgage loans receivable of $46.8 million, (xiii) an increase in reimbursements of investments and advances to other real estate investments of $24.2 million and (xiv) a decrease in investment in marketable securities of $11.2 million.
Acquisitions of Operating Real Estate
During the years ended December 31, 2015 and 2014, the Company expended $661.4 million and $384.8 million, respectively, towards the acquisition of operating real estate properties. The Company’s strategy is to continue to transform its operating portfolio through its capital recycling program by acquiring what the Company believes are high quality U.S. retail properties and disposing of lesser quality assets. The Company anticipates acquiring approximately $450.0 million to $550.0 million of operating properties during 2016. The Company intends to fund these acquisitions with proceeds from property dispositions, cash flow from operating activities, assumption of mortgage debt, if applicable, and availability under the Company’s revolving line of credit.
Improvements to Operating Real Estate During the years ended December 31, 2015 and 2014, the Company expended $166.7 million and $131.8 million,
respectively, towards improvements to operating real estate. These amounts are made up of the following (in thousands):
Year Ended December 31, 2015 2014 Redevelopment/renovations $ 125,994 $ 86,639 Tenant improvements/tenant allowances 30,127 40,060 Other 10,549 5,096
Total $ 166,670 $ 131,795
29
Additionally, during the years ended December 31, 2015 and 2014, the Company capitalized interest of $5.6 million and $2.4 million, respectively, and capitalized payroll of $3.6 million and $3.4 million, respectively, in connection with the Company’s improvements of real estate.
During the years ended December 31, 2015 and 2014, the Company capitalized personnel costs of $13.9 million and
$15.5 million, respectively, relating to deferred leasing costs. The Company has an ongoing program to redevelop and re-tenant its properties to maintain or enhance its competitive
position in the marketplace. The Company is actively pursuing redevelopment opportunities within its operating portfolio which it believes will increase the overall value by bringing in new tenants and improving the assets’ value. The Company has identified three categories of redevelopment, (i) large scale redevelopment, which involves demolishing and building new square footage, (ii) value creation redevelopment, which includes the subdivision of large anchor spaces into multiple tenant layouts, and (iii) creation of out-parcels and pads which are located in the front of the shopping center properties. The Company anticipates its capital commitment toward these redevelopment projects and re-tenanting efforts during 2016 will be approximately $175.0 million to $225.0 million. The funding of these capital requirements will be provided by cash flow from operating activities and availability under the Company’s revolving line of credit.
Ground-Up Development The Company is engaged in select ground-up development projects, which will be held as long-term investments by
the Company. As of December 31, 2015, the Company had in progress a total of five ground-up development projects located in the U.S.. The Company anticipates its capital commitment toward these development projects during 2016 will be approximately $75.0 million to $125.0 million. The funding of these capital requirements will be provided by cash flow from operating activities and availability under the Company’s revolving line of credit. The Company anticipates costs to complete these projects to be approximately $260.0 million to $270.0 million. Additionally, during the year ended December 31, 2015, the Company capitalized interest of $2.6 million and capitalized payroll of $0.6 million, in connection with these ground-up development projects.
Investments and Advances to Real Estate Joint Ventures During the year ended December 31, 2015, the Company expended $91.6 million for investments and advances to real
estate joint ventures, primarily related to the repayment of mortgage debt and received $94.1 million from reimbursements of investments and advances to real estate joint ventures. In addition, the Company received proceeds of $462.5 million from the liquidation of real estate joint ventures, including refinancing of debt, sales of properties, and return of investment from liquidation (see Footnote 7 of the Notes to Consolidated Financial Statements included in this Form 10-K).
Financing Activities Cash flow used for financing activities for the year ended December 31, 2015, was $512.9 million, as compared to
$717.5 million for the comparable period in 2014. This change of $204.6 million resulted primarily from (i) an increase in proceeds from unsecured term loan/notes of $1.0 billion and (ii) an increase in contributions from noncontrolling interest, net of $104.2 million, primarily relating to the joint venture investment in Safeway, partially offset by (iii) an increase in repayments under unsecured term loan/notes of $379.2 million, (iv) an increase in principal payments of $233.5 million, (v) an increase in redemption of preferred stock of $175.0 million, (vi) an increase in redemption of noncontrolling interests of $52.6 million, (vii) an increase in dividends paid of $28.0 million, (viii) a decrease in proceeds from mortgage loan financings of $15.7 million and (ix) an increase in repayments/proceeds under the unsecured revolving credit facility, net of $5.6 million.
The Company continually evaluates its debt maturities, and, based on management’s current assessment, believes it has viable financing and refinancing alternatives that will not materially adversely impact its expected financial results. The Company continues to pursue borrowing opportunities with large commercial U.S. and global banks, select life insurance companies and certain regional and local banks. The Company has noticed a continuing trend that although pricing remains dependent on specific deal terms, generally spreads for non-recourse mortgage financing have been widening due to global economic issues. However, the unsecured debt markets are functioning well and credit spreads are at manageable levels.
Debt maturities for 2016 consist of: $776.5 million of consolidated debt; $1.1 billion of unconsolidated joint venture
debt; and $68.8 million of debt on properties included in the Company’s Preferred Equity Program, assuming the utilization of extension options where available. The 2016 consolidated debt maturities are anticipated to be repaid with operating cash flows, borrowings from the Company’s revolving credit facility (which at December 31, 2015, had $1.75 billion
30
available) and debt refinancing. The 2016 debt maturities on properties in the Company’s unconsolidated joint ventures and Preferred Equity Program are anticipated to be repaid through debt refinancing and partner capital contributions, as deemed appropriate.
The Company intends to maintain strong debt service coverage and fixed charge coverage ratios as part of its
commitment to maintain its investment-grade debt ratings. The Company may, from time-to-time, seek to obtain funds through additional common and preferred equity offerings, unsecured debt financings and/or mortgage/construction loan financings and other capital alternatives.
Since the completion of the Company’s IPO in 1991, the Company has utilized the public debt and equity markets as
its principal source of capital for its expansion needs. Since the IPO, the Company has completed additional offerings of its public unsecured debt and equity, raising in the aggregate over $10.7 billion. Proceeds from public capital market activities have been used for the purposes of, among other things, repaying indebtedness, acquiring interests in open-air shopping centers, funding ground-up development projects, expanding and improving properties in the portfolio and other investments.
During February 2015, the Company filed a shelf registration statement on Form S-3, which is effective for a term of
three years, for the future unlimited offerings, from time-to-time, of debt securities, preferred stock, depositary shares, common stock and common stock warrants. The Company, pursuant to this shelf registration statement may, from time-to-time, offer for sale its senior unsecured debt for any general corporate purposes, including (i) funding specific liquidity requirements in its business, including property acquisitions, development and redevelopment costs and (ii) managing the Company’s debt maturities. (See Footnote 12 of the Notes to Consolidated Financial Statements included in this Form 10-K.)
Additionally during February 2015, the Company established an at the market continuous offering program (the “ATM program”), pursuant to which the Company may offer and sell shares of its common stock, par value $0.01 per share, with an aggregate gross sales price of up to $500.0 million through a consortium of banks acting as sales agents. Sales of the shares of common stock may be made, as needed, from time to time in “at the market” offerings as defined in Rule 415 of the Securities Act of 1933, including by means of ordinary brokers’ transactions on the NYSE or otherwise (i) at market prices prevailing at the time of sale, (ii) at prices related to prevailing market prices or (iii) as otherwise agreed to with the applicable sales agent. As of December 31, 2015, the Company had $500.0 million available under this ATM program. Preferred Stock –
On October 26, 2015, the Company called for the redemption of all of its outstanding 7,000,000 depositary shares of the Company’s 6.90% Class H Cumulative Redeemable Preferred Stock, $1.00 par value per share . The aggregate redemption amount of $175.0 million plus accumulated and unpaid dividends of $1.3 million, was paid on November 25, 2015. Upon redemption, the Company recorded a non-cash charge of $5.8 million resulting from the difference between the redemption amount and the carrying amount of the Class H Preferred Stock on the Company’s Condensed Consolidated Balance Sheets in accordance with the FASB’s guidance on Distinguishing Liabilities from Equity. This $5.8 million charge was subtracted from net income to arrive at net income available to common shareholders and used in the calculation of earnings per share for the year ended December 31, 2015. Medium Term Notes (“MTN”) and Senior Notes -
The Company’s supplemental indenture governing its MTN and senior notes contains the following covenants, all of which the Company is compliant with:
Covenant Must Be As of 12/31/15
Consolidated Indebtedness to Total Assets <65% 40% Consolidated Secured Indebtedness to Total Assets <40% 12% Consolidated Income Available for Debt Service to Maximum Annual Service Charge >1.50x 6.7x Unencumbered Total Asset Value to Consolidated Unsecured Indebtedness >1.50x 2.7x
For a full description of the various indenture covenants refer to the Indenture dated September 1, 1993; the First
Supplemental Indenture dated August 4, 1994; the Second Supplemental Indenture dated April 7, 1995; the Third Supplemental Indenture dated June 2, 2006; the Fourth Supplemental Indenture dated April 26, 2007; the Fifth Supplemental Indenture dated as of September 24, 2009; the Sixth Supplemental Indenture dated as of May 23, 2013; the Seventh Supplemental Indenture dated as of April 24, 2014; the Indenture dated April 21, 2005; the Second Supplemental
31
Indenture dated August 16, 2006; the Third Supplemental Indenture dated April 13, 2010; and the Fourth Supplemental Indenture dated July 22, 2013, as filed with the SEC. See the Exhibits Index for specific filing information.
During March 2015, the Company issued $350.0 million of 30-year Senior Unsecured Notes at an interest rate of
4.25% payable semi-annually in arrears which are scheduled to mature in April 2045. The Company used the net proceeds from the issuance of $342.7 million, after the underwriting discount and related offering costs, for general corporate purposes including to pre-fund near-term debt maturities and partially reduce borrowings under the Company’s Credit Facility.
During October 2015, the Company issued $500.0 million of seven-year Senior Unsecured Notes at an interest rate of
3.40% payable semi-annually in arrears which are scheduled to mature in November 2022. The Company used the net proceeds from the issuance of $493.0 million, after the underwriting discount and related offering costs, for general corporate purposes including to pre-fund near-term debt maturities and partially reduce borrowings under the Company’s Credit Facility.
During 2015, the Company repaid (i) its $100.0 million 4.904% medium term notes, which matured in February 2015,
(ii) its $100.0 million 5.250% senior unsecured notes, which matured in September 2015 and (iii) its $150.0 million 5.584% medium term notes, which matured in November 2015. Credit Facility -
The Company has a $1.75 billion unsecured revolving credit facility (the “Credit Facility”) with a group of banks,
which is scheduled to expire in March 2018 with two additional six month options to extend the maturity date, at the Company’s discretion, to March 2019. The Credit Facility, which can be increased to $2.25 billion through an accordion feature, accrues interest at a rate of LIBOR plus 92.5 basis points (1.35% as of December 31, 2015) on drawn funds. In addition, the Credit Facility includes a $500 million sub-limit which provides the Company the opportunity to borrow in alternative currencies including Canadian Dollars, British Pounds Sterling, Japanese Yen or Euros. Pursuant to the terms of the Credit Facility, the Company, among other things, is subject to covenants requiring the maintenance of (i) maximum leverage ratios on both unsecured and secured debt and (ii) minimum interest and fixed coverage ratios. As of December 31, 2015, the Credit Facility had no outstanding balance and $0.9 million appropriated for letters of credit.
Pursuant to the terms of the Credit Facility, the Company, among other things, is subject to maintenance of various covenants. The Company is currently in compliance with these covenants. The financial covenants for the Credit Facility are as follows:
Covenant Must Be As of 12/31/15
Total Indebtedness to Gross Asset Value (“GAV”) <60% 43% Total Priority Indebtedness to GAV <35% 12% Unencumbered Asset Net Operating Income to Total Unsecured Interest Expense >1.75x 4.47x Fixed Charge Total Adjusted EBITDA to Total Debt Service >1.50x 2.50x
For a full description of the Credit Facility’s covenants refer to the Credit Agreement dated as of March 17, 2014, filed
as Exhibit 10.1 to the Company’s Current Report on Form 8-K dated March 20, 2014. Term Loan –
During January 2015, the Company entered into a new $650.0 million unsecured term loan (“Term Loan”) which has an initial maturity in January 2017, with three one-year extension options at the Company’s discretion, and accrues interest at a spread (currently 95 basis points) to LIBOR or at the Company’s option at a base rate as defined per the agreement (1.37% at December 31, 2015). The proceeds from the Term Loan were used to repay the Company’s $400.0 million term loan, which was scheduled to mature in April 2015 with two additional one-year extension options and bore interest at LIBOR plus 105 basis points, and for general corporate purposes. Pursuant to the terms of the credit agreement for the Term Loan, the Company, among other things, is subject to covenants requiring the maintenance of (i) maximum indebtedness ratios and (ii) minimum interest and fixed charge coverage ratios. The term loan covenants are similar to the Credit Facility covenants described above.
32
Mortgages Payable –
During 2015, the Company (i) assumed $835.2 million of individual non-recourse mortgage debt relating to the acquisition of 38 operating properties, including an increase of $27.6 million associated with fair value debt adjustments and (ii) paid off $557.0 million of mortgage debt (including fair market value adjustment of $1.4 million) that encumbered 27 operating properties.
In addition to the public equity and debt markets as capital sources, the Company may, from time-to-time, obtain mortgage financing on selected properties and construction loans to partially fund the capital needs of its ground-up development projects. As of December 31, 2015, the Company had over 350 unencumbered property interests in its portfolio. Other –
In connection with its intention to continue to qualify as a REIT for federal income tax purposes, the Company expects
to continue paying regular dividends to its stockholders. These dividends will be paid from operating cash flows. The Company’s Board of Directors will continue to evaluate the Company’s dividend policy on a quarterly basis as the Board of Directors monitors sources of capital and evaluates the impact of the economy and capital markets availability on operating fundamentals. Since cash used to pay dividends reduces amounts available for capital investment, the Company generally intends to maintain a conservative dividend payout ratio, reserving such amounts as it considers necessary for the expansion and renovation of shopping centers in its portfolio, debt reduction, the acquisition of interests in new properties and other investments as suitable opportunities arise and such other factors as the Board of Directors considers appropriate. Cash dividends paid were $455.8 million in 2015, $427.9 million in 2014 and $400.4 million in 2013.
Although the Company receives substantially all of its rental payments on a monthly basis, it generally intends to
continue paying dividends quarterly. Amounts accumulated in advance of each quarterly distribution will be invested by the Company in short-term money market or other suitable instruments. On November 3, 2015, the Company’s Board of Directors declared an increased quarterly cash dividend of $0.255 per common share, an annualized increase of 6.3%, payable to shareholders of record on January 4, 2016, which was paid on January 15, 2016. Additionally, on February 2, 2016, the Company’s Board of Directors declared a quarterly cash dividend of $0.255 per common share payable to shareholders of record on April 5, 2016, which is scheduled to be paid on April 15, 2016.
The Company is subject to taxes on its activities in Canada, Puerto Rico, Mexico, and Chile. In general, under local
country law applicable to the structures the Company has in place and applicable treaties, the repatriation of cash to the Company from its subsidiaries and joint ventures in Canada, Puerto Rico and Mexico generally are not subject to withholding tax. The Company is subject to withholding taxes in Chile on sale transactions. As a result, the Company will incur a withholding tax on the repatriation of sale proceeds associated with the sale of the Company’s remaining property in Chile. The Company has determined this withholding tax to be $0.5 million. The Company is subject to and also includes in its tax provision non-U.S. income taxes on certain investments located in jurisdictions outside the U.S.. These investments are held by the Company at the REIT level and not in the Company’s taxable REIT subsidiary. Accordingly, the Company does not expect a U.S. income tax impact associated with the repatriation of undistributed earnings from the Company’s foreign subsidiaries.
Contractual Obligations and Other Commitments The Company has debt obligations relating to its revolving credit facility, term loan, MTNs, senior notes and
mortgages with maturities ranging from less than one year to 29 years. As of December 31, 2015, the Company’s total debt had a weighted average term to maturity of 5.3 years. In addition, the Company has non-cancelable operating leases pertaining to its shopping center portfolio. As of December 31, 2015, the Company has 46 shopping center properties that are subject to long-term ground leases where a third party owns and has leased the underlying land to the Company to
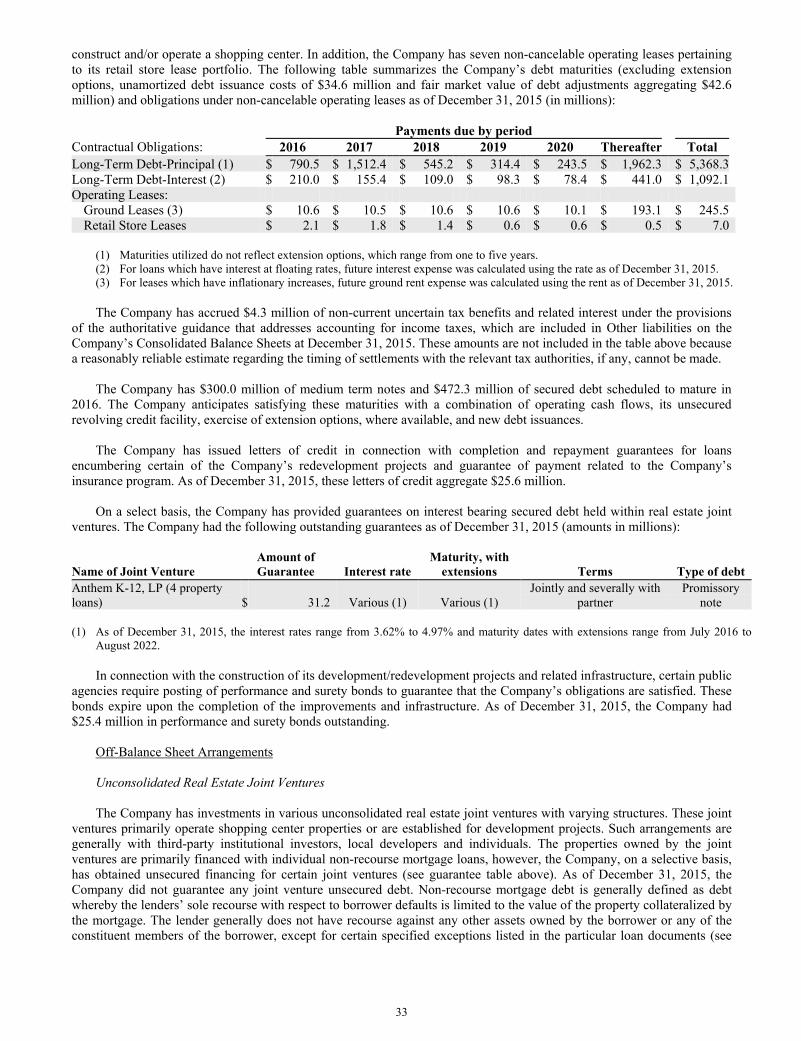
33
construct and/or operate a shopping center. In addition, the Company has seven non-cancelable operating leases pertaining to its retail store lease portfolio. The following table summarizes the Company’s debt maturities (excluding extension options, unamortized debt issuance costs of $34.6 million and fair market value of debt adjustments aggregating $42.6 million) and obligations under non-cancelable operating leases as of December 31, 2015 (in millions):
Payments due by period Contractual Obligations: 2016 2017 2018 2019 2020 Thereafter Total Long-Term Debt-Principal (1) $ 790.5 $ 1,512.4 $ 545.2 $ 314.4 $ 243.5 $ 1,962.3 $ 5,368.3 Long-Term Debt-Interest (2) $ 210.0 $ 155.4 $ 109.0 $ 98.3 $ 78.4 $ 441.0 $ 1,092.1 Operating Leases:
Ground Leases (3) $ 10.6 $ 10.5 $ 10.6 $ 10.6 $ 10.1 $ 193.1 $ 245.5 Retail Store Leases $ 2.1 $ 1.8 $ 1.4 $ 0.6 $ 0.6 $ 0.5 $ 7.0
(1) Maturities utilized do not reflect extension options, which range from one to five years. (2) For loans which have interest at floating rates, future interest expense was calculated using the rate as of December 31, 2015. (3) For leases which have inflationary increases, future ground rent expense was calculated using the rent as of December 31, 2015.
The Company has accrued $4.3 million of non-current uncertain tax benefits and related interest under the provisions of the authoritative guidance that addresses accounting for income taxes, which are included in Other liabilities on the Company’s Consolidated Balance Sheets at December 31, 2015. These amounts are not included in the table above because a reasonably reliable estimate regarding the timing of settlements with the relevant tax authorities, if any, cannot be made.
The Company has $300.0 million of medium term notes and $472.3 million of secured debt scheduled to mature in
2016. The Company anticipates satisfying these maturities with a combination of operating cash flows, its unsecured revolving credit facility, exercise of extension options, where available, and new debt issuances.
The Company has issued letters of credit in connection with completion and repayment guarantees for loans
encumbering certain of the Company’s redevelopment projects and guarantee of payment related to the Company’s insurance program. As of December 31, 2015, these letters of credit aggregate $25.6 million.
On a select basis, the Company has provided guarantees on interest bearing secured debt held within real estate joint
ventures. The Company had the following outstanding guarantees as of December 31, 2015 (amounts in millions):
Name of Joint Venture Amount of Guarantee Interest rate
Maturity, with extensions Terms Type of debt
Anthem K-12, LP (4 property loans) $ 31.2 Various (1) Various (1)
Jointly and severally with partner
Promissory note
(1) As of December 31, 2015, the interest rates range from 3.62% to 4.97% and maturity dates with extensions range from July 2016 to
August 2022. In connection with the construction of its development/redevelopment projects and related infrastructure, certain public
agencies require posting of performance and surety bonds to guarantee that the Company’s obligations are satisfied. These bonds expire upon the completion of the improvements and infrastructure. As of December 31, 2015, the Company had $25.4 million in performance and surety bonds outstanding.
Off-Balance Sheet Arrangements Unconsolidated Real Estate Joint Ventures The Company has investments in various unconsolidated real estate joint ventures with varying structures. These joint
ventures primarily operate shopping center properties or are established for development projects. Such arrangements are generally with third-party institutional investors, local developers and individuals. The properties owned by the joint ventures are primarily financed with individual non-recourse mortgage loans, however, the Company, on a selective basis, has obtained unsecured financing for certain joint ventures (see guarantee table above). As of December 31, 2015, the Company did not guarantee any joint venture unsecured debt. Non-recourse mortgage debt is generally defined as debt whereby the lenders’ sole recourse with respect to borrower defaults is limited to the value of the property collateralized by the mortgage. The lender generally does not have recourse against any other assets owned by the borrower or any of the constituent members of the borrower, except for certain specified exceptions listed in the particular loan documents (see
34
Footnote 7 of the Notes to Consolidated Financial Statements included in this Form 10-K). As of December 31, 2015, these investments include the following joint ventures:
Venture
Kimco Ownership
Interest Number ofProperties
Total GLA (in
thousands)
Non-Recourse
Mortgages Payable
(in millions)
Number of Encumbered
Properties
Average Interest
Rate
Weighted Average
Term (months)
KimPru (a) 15.0% 53 9,576 $ 777.1 33 5.54% 12.6 KIR (b) 48.6% 47 10,773 $ 781.9 45 4.73% 63.1 CPP (c) 55.0% 7 2,425 $ 109.9 2 5.25% 3.5 RioCan Venture (d) 50.0% 13 2,396 $ 87.5 8 5.02% 11.0 (a) Represents the Company’s joint ventures with Prudential Real Estate Investors.
(b) Represents the Company’s joint ventures with certain institutional investors. As of December 31, 2015, KIR also had anunsecured credit facility with an outstanding balance of $30.0 million, which is scheduled to mature in June 2018, with a one-year extension option at the joint venture’s discretion, and bore interest at a rate equal to LIBOR plus 1.75% (2.18% at December31, 2015).
(c) Represents the Company’s joint ventures with The Canada Pension Plan Investment Board (CPPIB). (d) Represents the Company’s joint ventures with RioCan Real Estate Investment Trust.
The Company has various other unconsolidated real estate joint ventures with varying structures. As of December 31,
2015, these other unconsolidated joint ventures had individual non-recourse mortgage loans aggregating $1.0 billion. The aggregate debt as of December 31, 2015, of all of the Company’s unconsolidated real estate joint ventures is $2.8 billion, of which the Company’s proportionate share of this debt is $1.1 billion. As of December 31, 2015, these loans had scheduled maturities ranging from one month to 14 years and bear interest at rates ranging from 2.01% to 7.88%. Approximately $1.1 billion of the aggregate outstanding loan balance matures in 2016, of which the Company’s proportionate share is $275.7 million. These maturing loans are anticipated to be repaid with operating cash flows, debt refinancing and partner capital contributions, as deemed appropriate (see Footnote 7 of the Notes to Consolidated Financial Statements included in this Form 10-K).
Other Real Estate Investments The Company previously provided capital to owners and developers of real estate properties through its Preferred
Equity Program. The Company accounts for its preferred equity investments under the equity method of accounting. As of December 31, 2015, the Company’s net investment under the Preferred Equity Program was $199.9 million relating to 421 properties, including 385 net leased properties. As of December 31, 2015, these preferred equity investment properties had individual non-recourse mortgage loans aggregating $523.0 million. These loans have scheduled maturities ranging from five months to 18 years and bear interest at rates ranging from 4.08% to 10.47%. Due to the Company’s preferred position in these investments, the Company’s share of each investment is subject to fluctuation and is dependent upon property cash flows. The Company’s maximum exposure to losses associated with its preferred equity investments is limited to its invested capital.
Funds From Operations
Funds From Operations (“FFO”) is a supplemental non-GAAP measure utilized to evaluate the operating performance of real estate companies. The National Association of Real Estate Investment Trusts (“NAREIT”) defines FFO as net income/(loss) attributable to common shareholders computed in accordance with generally accepted accounting principles in the United States (“GAAP”), excluding (i) gains or losses from sales of operating real estate assets and change in control of interests, plus (ii) depreciation and amortization of operating properties and (iii) impairment of depreciable real estate and in substance real estate equity investments and (iv) after adjustments for unconsolidated partnerships and joint ventures calculated to reflect funds from operations on the same basis.
The Company presents FFO as it considers it an important supplemental measure of our operating performance and believes it is frequently used by securities analysts, investors and other interested parties in the evaluation of REITs, many of which present FFO when reporting results. Comparison of our presentation of FFO to similarly titled measures for other REITs may not necessarily be meaningful due to possible differences in the application of the NAREIT definition used by such REITs.
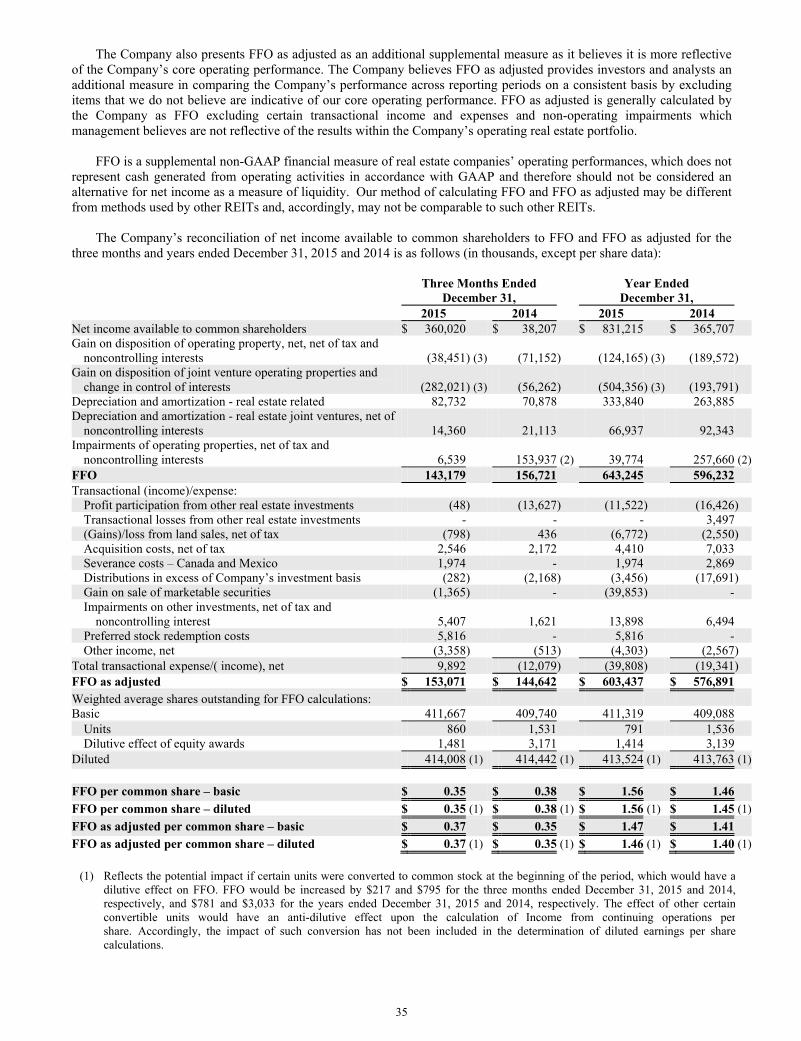
35
The Company also presents FFO as adjusted as an additional supplemental measure as it believes it is more reflective of the Company’s core operating performance. The Company believes FFO as adjusted provides investors and analysts an additional measure in comparing the Company’s performance across reporting periods on a consistent basis by excluding items that we do not believe are indicative of our core operating performance. FFO as adjusted is generally calculated by the Company as FFO excluding certain transactional income and expenses and non-operating impairments which management believes are not reflective of the results within the Company’s operating real estate portfolio.
FFO is a supplemental non-GAAP financial measure of real estate companies’ operating performances, which does not
represent cash generated from operating activities in accordance with GAAP and therefore should not be considered an alternative for net income as a measure of liquidity. Our method of calculating FFO and FFO as adjusted may be different from methods used by other REITs and, accordingly, may not be comparable to such other REITs.
The Company’s reconciliation of net income available to common shareholders to FFO and FFO as adjusted for the
three months and years ended December 31, 2015 and 2014 is as follows (in thousands, except per share data): Three Months Ended Year Ended December 31, December 31, 2015 2014 2015 2014 Net income available to common shareholders $ 360,020 $ 38,207 $ 831,215 $ 365,707 Gain on disposition of operating property, net, net of tax and
noncontrolling interests (38,451) (3) (71,152) (124,165) (3) (189,572) Gain on disposition of joint venture operating properties and
change in control of interests (282,021) (3) (56,262) (504,356) (3) (193,791) Depreciation and amortization - real estate related 82,732 70,878 333,840 263,885 Depreciation and amortization - real estate joint ventures, net of
noncontrolling interests 14,360 21,113 66,937 92,343 Impairments of operating properties, net of tax and
noncontrolling interests 6,539 153,937 (2) 39,774 257,660 (2)FFO 143,179 156,721 643,245 596,232 Transactional (income)/expense:
Profit participation from other real estate investments (48) (13,627) (11,522) (16,426) Transactional losses from other real estate investments - - - 3,497 (Gains)/loss from land sales, net of tax (798) 436 (6,772) (2,550) Acquisition costs, net of tax 2,546 2,172 4,410 7,033 Severance costs – Canada and Mexico 1,974 - 1,974 2,869 Distributions in excess of Company’s investment basis (282) (2,168) (3,456) (17,691) Gain on sale of marketable securities (1,365) - (39,853) - Impairments on other investments, net of tax and
noncontrolling interest 5,407 1,621 13,898 6,494 Preferred stock redemption costs 5,816 - 5,816 - Other income, net (3,358) (513) (4,303) (2,567)
Total transactional expense/( income), net 9,892 (12,079) (39,808) (19,341) FFO as adjusted $ 153,071 $ 144,642 $ 603,437 $ 576,891 Weighted average shares outstanding for FFO calculations: Basic 411,667 409,740 411,319 409,088
Units 860 1,531 791 1,536 Dilutive effect of equity awards 1,481 3,171 1,414 3,139
Diluted 414,008 (1) 414,442 (1) 413,524 (1) 413,763 (1) FFO per common share – basic $ 0.35 $ 0.38 $ 1.56 $ 1.46 FFO per common share – diluted $ 0.35 (1) $ 0.38 (1) $ 1.56 (1) $ 1.45 (1)FFO as adjusted per common share – basic $ 0.37 $ 0.35 $ 1.47 $ 1.41 FFO as adjusted per common share – diluted $ 0.37 (1) $ 0.35 (1) $ 1.46 (1) $ 1.40 (1)
(1) Reflects the potential impact if certain units were converted to common stock at the beginning of the period, which would have a dilutive effect on FFO. FFO would be increased by $217 and $795 for the three months ended December 31, 2015 and 2014, respectively, and $781 and $3,033 for the years ended December 31, 2015 and 2014, respectively. The effect of other certainconvertible units would have an anti-dilutive effect upon the calculation of Income from continuing operations pershare. Accordingly, the impact of such conversion has not been included in the determination of diluted earnings per sharecalculations.
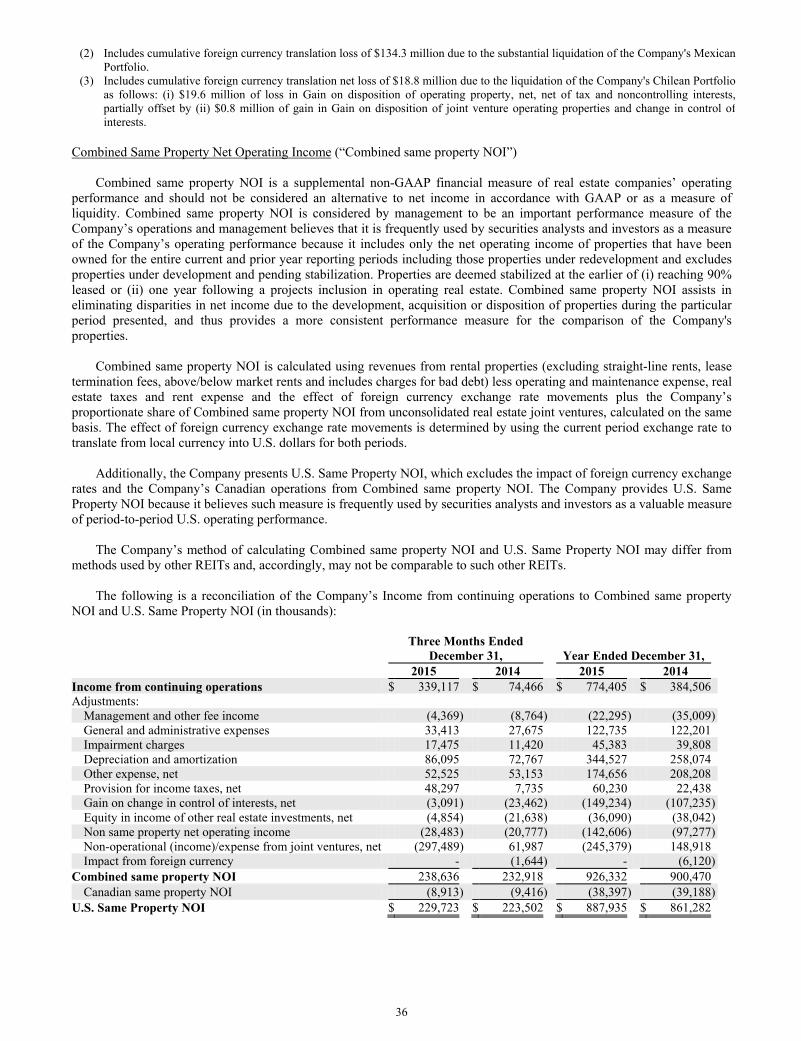
36
(2) Includes cumulative foreign currency translation loss of $134.3 million due to the substantial liquidation of the Company's Mexican Portfolio.
(3) Includes cumulative foreign currency translation net loss of $18.8 million due to the liquidation of the Company's Chilean Portfolio as follows: (i) $19.6 million of loss in Gain on disposition of operating property, net, net of tax and noncontrolling interests,partially offset by (ii) $0.8 million of gain in Gain on disposition of joint venture operating properties and change in control of interests.
Combined Same Property Net Operating Income (“Combined same property NOI”)
Combined same property NOI is a supplemental non-GAAP financial measure of real estate companies’ operating performance and should not be considered an alternative to net income in accordance with GAAP or as a measure of liquidity. Combined same property NOI is considered by management to be an important performance measure of the Company’s operations and management believes that it is frequently used by securities analysts and investors as a measure of the Company’s operating performance because it includes only the net operating income of properties that have been owned for the entire current and prior year reporting periods including those properties under redevelopment and excludes properties under development and pending stabilization. Properties are deemed stabilized at the earlier of (i) reaching 90% leased or (ii) one year following a projects inclusion in operating real estate. Combined same property NOI assists in eliminating disparities in net income due to the development, acquisition or disposition of properties during the particular period presented, and thus provides a more consistent performance measure for the comparison of the Company's properties.
Combined same property NOI is calculated using revenues from rental properties (excluding straight-line rents, lease
termination fees, above/below market rents and includes charges for bad debt) less operating and maintenance expense, real estate taxes and rent expense and the effect of foreign currency exchange rate movements plus the Company’s proportionate share of Combined same property NOI from unconsolidated real estate joint ventures, calculated on the same basis. The effect of foreign currency exchange rate movements is determined by using the current period exchange rate to translate from local currency into U.S. dollars for both periods.
Additionally, the Company presents U.S. Same Property NOI, which excludes the impact of foreign currency exchange
rates and the Company’s Canadian operations from Combined same property NOI. The Company provides U.S. Same Property NOI because it believes such measure is frequently used by securities analysts and investors as a valuable measure of period-to-period U.S. operating performance.
The Company’s method of calculating Combined same property NOI and U.S. Same Property NOI may differ from
methods used by other REITs and, accordingly, may not be comparable to such other REITs. The following is a reconciliation of the Company’s Income from continuing operations to Combined same property
NOI and U.S. Same Property NOI (in thousands):
Three Months Ended
December 31, Year Ended December 31, 2015 2014 2015 2014 Income from continuing operations $ 339,117 $ 74,466 $ 774,405 $ 384,506 Adjustments:
Management and other fee income (4,369) (8,764) (22,295 ) (35,009)General and administrative expenses 33,413 27,675 122,735 122,201 Impairment charges 17,475 11,420 45,383 39,808 Depreciation and amortization 86,095 72,767 344,527 258,074 Other expense, net 52,525 53,153 174,656 208,208 Provision for income taxes, net 48,297 7,735 60,230 22,438 Gain on change in control of interests, net (3,091) (23,462) (149,234 ) (107,235)Equity in income of other real estate investments, net (4,854) (21,638) (36,090 ) (38,042)Non same property net operating income (28,483) (20,777) (142,606 ) (97,277)Non-operational (income)/expense from joint ventures, net (297,489) 61,987 (245,379 ) 148,918 Impact from foreign currency - (1,644) - (6,120)
Combined same property NOI 238,636 232,918 926,332 900,470 Canadian same property NOI (8,913) (9,416) (38,397 ) (39,188)
U.S. Same Property NOI $ 229,723 $ 223,502 $ 887,935 $ 861,282
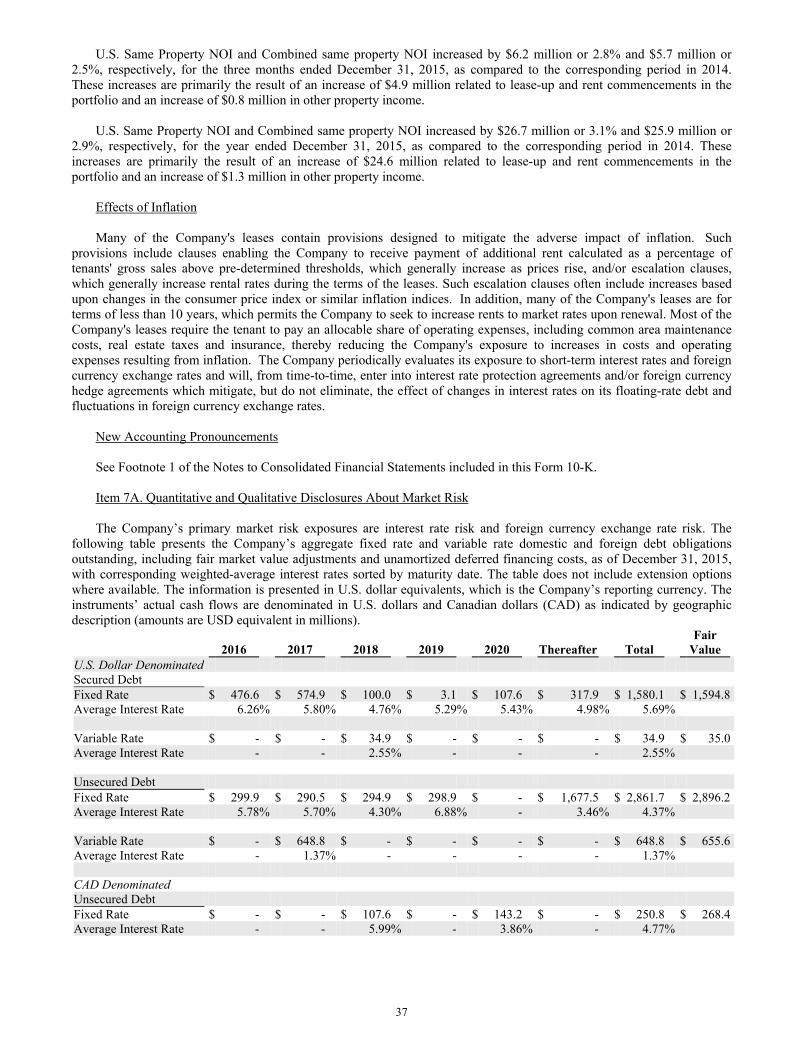
37
U.S. Same Property NOI and Combined same property NOI increased by $6.2 million or 2.8% and $5.7 million or 2.5%, respectively, for the three months ended December 31, 2015, as compared to the corresponding period in 2014. These increases are primarily the result of an increase of $4.9 million related to lease-up and rent commencements in the portfolio and an increase of $0.8 million in other property income.
U.S. Same Property NOI and Combined same property NOI increased by $26.7 million or 3.1% and $25.9 million or 2.9%, respectively, for the year ended December 31, 2015, as compared to the corresponding period in 2014. These increases are primarily the result of an increase of $24.6 million related to lease-up and rent commencements in the portfolio and an increase of $1.3 million in other property income.
Effects of Inflation Many of the Company's leases contain provisions designed to mitigate the adverse impact of inflation. Such
provisions include clauses enabling the Company to receive payment of additional rent calculated as a percentage of tenants' gross sales above pre-determined thresholds, which generally increase as prices rise, and/or escalation clauses, which generally increase rental rates during the terms of the leases. Such escalation clauses often include increases based upon changes in the consumer price index or similar inflation indices. In addition, many of the Company's leases are for terms of less than 10 years, which permits the Company to seek to increase rents to market rates upon renewal. Most of the Company's leases require the tenant to pay an allocable share of operating expenses, including common area maintenance costs, real estate taxes and insurance, thereby reducing the Company's exposure to increases in costs and operating expenses resulting from inflation. The Company periodically evaluates its exposure to short-term interest rates and foreign currency exchange rates and will, from time-to-time, enter into interest rate protection agreements and/or foreign currency hedge agreements which mitigate, but do not eliminate, the effect of changes in interest rates on its floating-rate debt and fluctuations in foreign currency exchange rates.
New Accounting Pronouncements See Footnote 1 of the Notes to Consolidated Financial Statements included in this Form 10-K. Item 7A. Quantitative and Qualitative Disclosures About Market Risk The Company’s primary market risk exposures are interest rate risk and foreign currency exchange rate risk. The
following table presents the Company’s aggregate fixed rate and variable rate domestic and foreign debt obligations outstanding, including fair market value adjustments and unamortized deferred financing costs, as of December 31, 2015, with corresponding weighted-average interest rates sorted by maturity date. The table does not include extension options where available. The information is presented in U.S. dollar equivalents, which is the Company’s reporting currency. The instruments’ actual cash flows are denominated in U.S. dollars and Canadian dollars (CAD) as indicated by geographic description (amounts are USD equivalent in millions).
2016 2017 2018 2019 2020 Thereafter Total Fair
Value
U.S. Dollar Denominated Secured Debt Fixed Rate $ 476.6 $ 574.9 $ 100.0 $ 3.1 $ 107.6 $ 317.9 $ 1,580.1 $ 1,594.8 Average Interest Rate 6.26% 5.80% 4.76% 5.29% 5.43% 4.98% 5.69% Variable Rate $ - $ - $ 34.9 $ - $ - $ - $ 34.9 $ 35.0 Average Interest Rate - - 2.55% - - - 2.55% Unsecured Debt Fixed Rate $ 299.9 $ 290.5 $ 294.9 $ 298.9 $ - $ 1,677.5 $ 2,861.7 $ 2,896.2 Average Interest Rate 5.78% 5.70% 4.30% 6.88% - 3.46% 4.37% Variable Rate $ - $ 648.8 $ - $ - $ - $ - $ 648.8 $ 655.6 Average Interest Rate - 1.37% - - - - 1.37% CAD Denominated Unsecured Debt Fixed Rate $ - $ - $ 107.6 $ - $ 143.2 $ - $ 250.8 $ 268.4 Average Interest Rate - - 5.99% - 3.86% - 4.77%
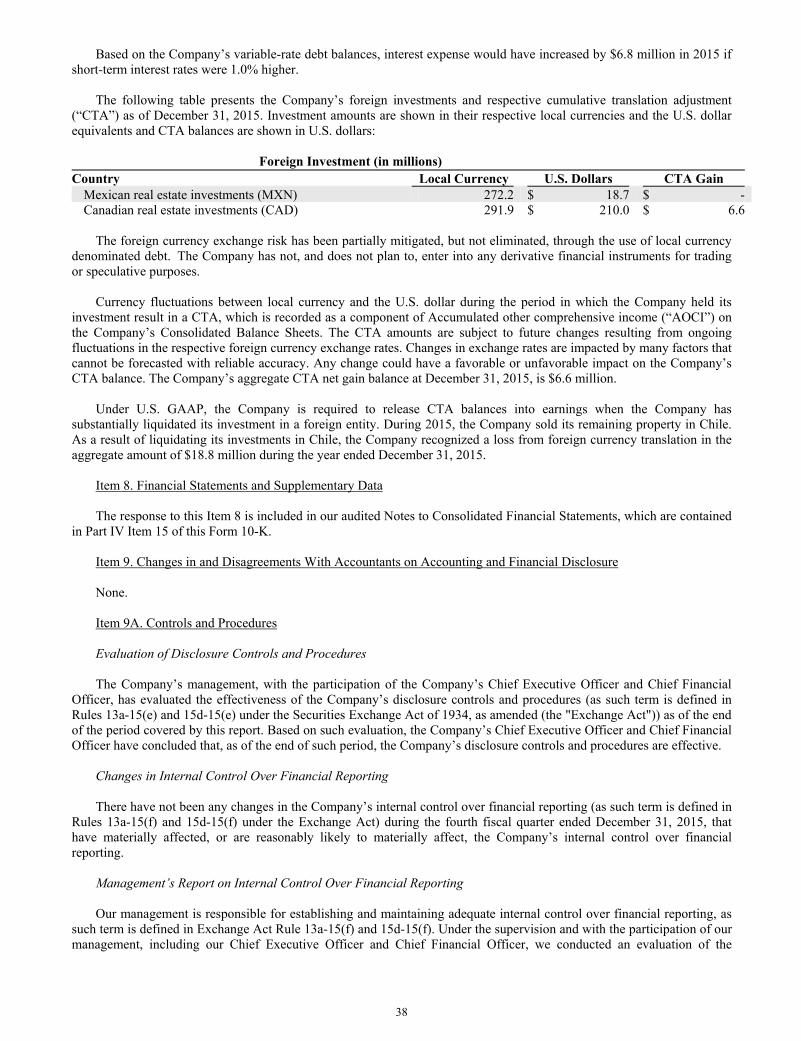
38
Based on the Company’s variable-rate debt balances, interest expense would have increased by $6.8 million in 2015 if short-term interest rates were 1.0% higher.
The following table presents the Company’s foreign investments and respective cumulative translation adjustment
(“CTA”) as of December 31, 2015. Investment amounts are shown in their respective local currencies and the U.S. dollar equivalents and CTA balances are shown in U.S. dollars:
Foreign Investment (in millions)
Country Local Currency U.S. Dollars CTA Gain Mexican real estate investments (MXN) 272.2 $ 18.7 $ - Canadian real estate investments (CAD) 291.9 $ 210.0 $ 6.6
The foreign currency exchange risk has been partially mitigated, but not eliminated, through the use of local currency
denominated debt. The Company has not, and does not plan to, enter into any derivative financial instruments for trading or speculative purposes.
Currency fluctuations between local currency and the U.S. dollar during the period in which the Company held its
investment result in a CTA, which is recorded as a component of Accumulated other comprehensive income (“AOCI”) on the Company’s Consolidated Balance Sheets. The CTA amounts are subject to future changes resulting from ongoing fluctuations in the respective foreign currency exchange rates. Changes in exchange rates are impacted by many factors that cannot be forecasted with reliable accuracy. Any change could have a favorable or unfavorable impact on the Company’s CTA balance. The Company’s aggregate CTA net gain balance at December 31, 2015, is $6.6 million.
Under U.S. GAAP, the Company is required to release CTA balances into earnings when the Company has
substantially liquidated its investment in a foreign entity. During 2015, the Company sold its remaining property in Chile. As a result of liquidating its investments in Chile, the Company recognized a loss from foreign currency translation in the aggregate amount of $18.8 million during the year ended December 31, 2015.
Item 8. Financial Statements and Supplementary Data The response to this Item 8 is included in our audited Notes to Consolidated Financial Statements, which are contained
in Part IV Item 15 of this Form 10-K. Item 9. Changes in and Disagreements With Accountants on Accounting and Financial Disclosure None. Item 9A. Controls and Procedures Evaluation of Disclosure Controls and Procedures The Company’s management, with the participation of the Company’s Chief Executive Officer and Chief Financial
Officer, has evaluated the effectiveness of the Company’s disclosure controls and procedures (as such term is defined in Rules 13a-15(e) and 15d-15(e) under the Securities Exchange Act of 1934, as amended (the "Exchange Act")) as of the end of the period covered by this report. Based on such evaluation, the Company’s Chief Executive Officer and Chief Financial Officer have concluded that, as of the end of such period, the Company’s disclosure controls and procedures are effective.
Changes in Internal Control Over Financial Reporting There have not been any changes in the Company’s internal control over financial reporting (as such term is defined in
Rules 13a-15(f) and 15d-15(f) under the Exchange Act) during the fourth fiscal quarter ended December 31, 2015, that have materially affected, or are reasonably likely to materially affect, the Company’s internal control over financial reporting.
Management’s Report on Internal Control Over Financial Reporting Our management is responsible for establishing and maintaining adequate internal control over financial reporting, as
such term is defined in Exchange Act Rule 13a-15(f) and 15d-15(f). Under the supervision and with the participation of our management, including our Chief Executive Officer and Chief Financial Officer, we conducted an evaluation of the

39
effectiveness of our internal control over financial reporting based on the framework in the Internal Control - Integrated Framework (2013) issued by the Committee of Sponsoring Organizations of the Treadway Commission. Based on our evaluation under the framework in Internal Control - Integrated Framework (2013), our management concluded that our internal control over financial reporting was effective as of December 31, 2015.
The effectiveness of our internal control over financial reporting as of December 31, 2015, has been audited by
PricewaterhouseCoopers LLP, an independent registered public accounting firm, as stated in their report which is included herein.
Item 9B. Other Information None.
40
PART III Item 10. Directors, Executive Officers and Corporate Governance The information required by this item is incorporated by reference to “Proposal 1—Election of Directors,” “Corporate
Governance,” “Committees of the Board of Directors,” “Executive Officers” and “Other Matters” in our definitive proxy statement to be filed with respect to the Annual Meeting of Stockholders expected to be held on April 26, 2016 (“Proxy Statement”).
We have adopted a Code of Business Conduct and Ethics that applies to all employees (the “Code of Ethics”). The
Code of Ethics is available at the Investors/Governance/Governance Documents section of our website at www.kimcorealty.com. A copy of the Code of Ethics is available in print, free of charge, to stockholders upon request to us at the address set forth in Item 1 of this Annual Report on Form 10-K under the section “Business - Background.” We intend to satisfy the disclosure requirements under the Securities and Exchange Act of 1934, as amended, regarding an amendment to or waiver from a provision of our Code of Ethics by posting such information on our web site.
Item 11. Executive Compensation The information required by this item is incorporated by reference to “Compensation Discussion and Analysis,”
“Executive Compensation Committee Report,” “Compensation Tables,” “Compensation of Directors” and “Other Matters” in our Proxy Statement.
Item 12. Security Ownership of Certain Beneficial Owners and Management and Related Stockholder Matters The information required by this item is incorporated by reference to “Security Ownership of Certain Beneficial
Owners and Management” and “Compensation Tables” in our Proxy Statement. Item 13. Certain Relationships and Related Transactions, and Director Independence The information required by this item is incorporated by reference to “Certain Relationships and Related Transactions”
and “Corporate Governance” in our Proxy Statement. Item 14. Principal Accounting Fees and Services The information required by this item is incorporated by reference to “Independent Registered Public Accountants” in
our Proxy Statement.
41
PART IV
Item 15. Exhibits, Financial Statement Schedules Form10-
K ReportPage
(a) 1. Financial Statements – The following consolidated financial information is included as a separate section of this annual report on Form 10-K.
Report of Independent Registered Public Accounting Firm 47 Consolidated Financial Statements Consolidated Balance Sheets as of December 31, 2015 and 2014 48 Consolidated Statements of Income for the years ended December 31, 2015, 2014 and 2013 49 Consolidated Statements of Comprehensive Income for the years ended December 31, 2015, 2014 and
2013 50 Consolidated Statements of Changes in Equity for the years ended December 31, 2015, 2014 and 2013 51 Consolidated Statements of Cash Flows for the years ended December 31, 2015, 2014 and 2013 53 Notes to Consolidated Financial Statements 54
2. Financial Statement Schedules - Schedule II - Valuation and Qualifying Accounts Schedule III - Real Estate and Accumulated Depreciation 101 Schedule IV - Mortgage Loans on Real Estate 112 All other schedules are omitted since the required information is not present or is not present in amounts
sufficient to require submission of the schedule.
3. Exhibits - The exhibits listed on the accompanying Index to Exhibits are filed as part of this report. 42
100
42
INDEX TO EXHIBITS Incorporated by Reference
Exhibit Number Exhibit Description Form File No.
Date of Filing
Exhibit Number
Filed/ Furnished Herewith
Page
Number3.1(a) Articles of Restatement of Kimco Realty Corporation,
dated January 14, 2011 10-K 1-10899 02/28/11 3.1(a)
3.1(b) Amendment to Articles of Restatement of Kimco Realty Corporation dated May 8, 2014
10-K 1-10899 02/27/15 3.1(b)
3.1(c) Articles Supplementary of Kimco Realty Corporation dated November 8, 2010
10-K 1-10899 02/28/11 3.1(b)
3.1(d) Articles Supplementary of Kimco Realty Corporation, dated March 12, 2012 8-A12B 1-10899 03/13/12
3.2
3.1(e) Articles Supplementary of Kimco Realty Corporation, dated July 17, 2012 8-A12B 1-10899 07/18/12 3.2
3.1(f) Articles Supplementary of Kimco Realty Corporation, dated November 30, 2012 8-A12B 1-10899 12/03/12 3.2
3.2 Amended and Restated By-laws of Kimco Realty Corporation, dated February 25, 2009
10-K 1-10899 02/27/09 3.2
4.1 Agreement of Kimco Realty Corporation pursuant to Item 601(b)(4)(iii)(A) of Regulation S-K
S-11 333-42588
09/11/91 4.1
4.2 Form of Certificate of Designations for the Preferred Stock
S-3 333-67552
09/10/93 4(d)
4.3 Indenture dated September 1, 1993, between Kimco Realty Corporation and Bank of New York (as successor to IBJ Schroder Bank and Trust Company)
S-3 333-67552
09/10/93 4(a)
4.4 First Supplemental Indenture, dated August 4, 1994, between Kimco Realty Corporation and Bank of New York (as successor to IBJ Schroder Bank and Trust Company)
10-K 1-10899 03/28/96 4.6
4.5 Second Supplemental Indenture, dated April 7, 1995, between Kimco Realty Corporation and Bank of New York (as successor to IBJ Schroder Bank and Trust Company)
8-K 1-10899 04/07/95 4(a)
4.6 Indenture dated April 21, 2005, between Kimco North Trust III, Kimco Realty Corporation, as guarantor and BNY Trust Company of Canada, as trustee
8-K 1-10899 04/25/05 4.1
4.7 Third Supplemental Indenture, dated June 2, 2006, between Kimco Realty Corporation, and The Bank of New York, as trustee
8-K 1-10899 06/05/06 4.1
4.8 First Supplemental Indenture, dated October 31, 2006, among Kimco Realty Corporation, Pan Pacific Retail Properties, Inc. and Bank of New York Trust Company, N.A., as trustee
8-K 1-10899 11/03/06 4.2
4.9 Fifth Supplemental Indenture, dated October 31, 2006, among Kimco Realty Corporation, Pan Pacific Retail Properties, Inc. and Bank of New York Trust Company, N.A., as trustee
8-K 1-10899 11/03/06 4.1
4.10 First Supplemental Indenture, dated June 2, 2006, among Kimco North Trust III, Kimco Realty Corporation, as guarantor and BNY Trust Company of Canada, as trustee
10-K 1-10899 02/28/07 4.12
4.11 Second Supplemental Indenture, dated August 16, 2006, among Kimco North Trust III, Kimco Realty Corporation, as guarantor and BNY Trust Company of Canada, as trustee
10-K 1-10899 02/28/07 4.13
4.12 Fourth Supplemental Indenture, dated April 26, 2007, between Kimco Realty Corporation and The Bank of New York, as trustee
8-K 1-10899 04/26/07 1.3
4.13 Fifth Supplemental Indenture, dated September 24, 2009, between Kimco Realty Corporation and The Bank of New York Mellon, as trustee
8-K 1-10899 09/24/09 4.1
43
Incorporated by Reference
Exhibit Number Exhibit Description Form File No.
Date of Filing
Exhibit Number
Filed/ Furnished Herewith
Page Number
4.15 Sixth Supplemental Indenture, dated May 23, 2013, between Kimco Realty Corporation and The Bank of New York Mellon, as trustee
8-K 1-10899 05/23/13 4.1
4.16 Fourth Supplemental Indenture, dated July 22, 2013, among Kimco North Trust III, Kimco Realty Corporation, as guarantor and BNY Trust Company of Canada, as trustee
10-Q 1-10899 08/02/13 99.2
4.17 Seventh Supplemental Indenture, dated April 24, 2014, between Kimco Realty Corporation and The Bank of New York Mellon, as trustee
8-K 1-10899 04/24/14 4.1
10.1 Amended and Restated Stock Option Plan 10-K 1-10899 03/28/95 10.3 10.2 Second Amended and Restated 1998 Equity Participation
Plan of Kimco Realty Corporation (restated February 25, 2009)
10-K 1-10899 02/27/09 10.9
10.3 Form of Indemnification Agreement 10-K 1-10899 02/27/09 99.1 10.4 Agency Agreement, dated July 17, 2013, by and among
Kimco North Trust III, Kimco Realty Corporation and Scotia Capital Inc., RBC Dominion Securities Inc., CIBC World Markets Inc. and National Bank Financial Inc.
10-Q 1-10899 08/02/13 99.1
10.5 Kimco Realty Corporation Executive Severance Plan, dated March 15, 2010
8-K 1-10899 03/19/10 10.5
10.6 Kimco Realty Corporation 2010 Equity Participation Plan 8-K 1-10899 03/19/10 10.7 10.7 Form of Performance Share Award Grant Notice and
Performance Share Award Agreement 8-K 1-10899 03/19/10 10.8
10.8 First Amendment to the Kimco Realty Corporation Executive Severance Plan, dated March 20, 2012 10-Q 1-10899 05/10/12 10.3
10.9 First Amendment to the Kimco Realty Corporation 2010 Equity Participation Plan S-8
333-184776 11/06/12 99.1
10.10 $1.75 Billion Amended and Restated Credit Agreement, dated March 17, 2014, among Kimco Realty Corporation, the subsidiaries of Kimco party thereto, the lenders party thereto, and JPMorgan Chase Bank, N.A., as administrative agent
8-K 1-10899 03/20/14 10.1
10.11 Credit Agreement, dated January 30, 2015, among Kimco Realty Corporation and each of the parties named therein
8-K 1-10899 02/05/15 10.1
10.12 Consulting Agreement, dated June 11, 2015, between Kimco Realty Corporation and David B. Henry
8-K 1-10899 06/12/15 10.1
12.1 Computation of Ratio of Earnings to Fixed Charges — — — — X 113 12.2 Computation of Ratio of Earnings to Combined Fixed
Charges and Preferred Stock Dividends — — — — X 114
21.1 Significant Subsidiaries of the Company — — — — * 23.1 Consent of PricewaterhouseCoopers LLP — — — — * 31.1 Certification of the Company’s Chief Executive Officer,
Conor C. Flynn, pursuant to Section 302 of the Sarbanes-Oxley Act of 2002
— — — — X 115
31.2 Certification of the Company’s Chief Financial Officer, Glenn G. Cohen, pursuant to Section 302 of the Sarbanes-Oxley Act of 2002
— — — — X 116
32.1 Certification of the Company’s Chief Executive Officer, Conor C. Flynn, and the Company’s Chief Financial Officer, Glenn G. Cohen, pursuant to Section 906 of the Sarbanes-Oxley Act of 2002
— — — — X 117
99.1 Property Chart — — — — X 118 101.INS XBRL Instance Document — — — — * 101.SCH XBRL Taxonomy Extension Schema — — — — * 101.CALXBRL Taxonomy Extension Calculation Linkbase — — — — *

44
Incorporated by Reference
Exhibit Number Exhibit Description Form File No.
Date of Filing
Exhibit Number
Filed/ Furnished Herewith
Page Number
101.DEF XBRL Taxonomy Extension Definition Linkbase — — — — * 101.LABXBRL Taxonomy Extension Label Linkbase — — — — * 101.PRE XBRL Taxonomy Extension Presentation Linkbase — — — — * * Incorporated by reference to the corresponding Exhibit to the Company’s Annual Report on Form 10-K filed on February 26, 2016.
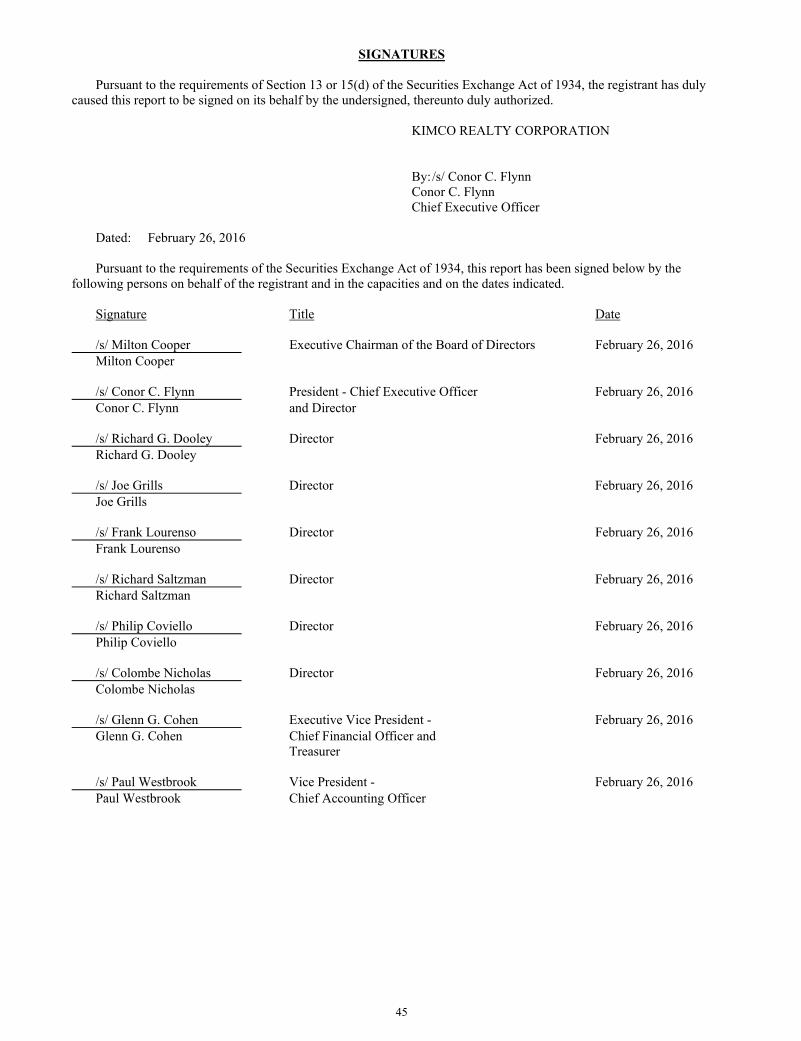
45
SIGNATURES Pursuant to the requirements of Section 13 or 15(d) of the Securities Exchange Act of 1934, the registrant has duly
caused this report to be signed on its behalf by the undersigned, thereunto duly authorized. KIMCO REALTY CORPORATION By:/s/ Conor C. Flynn Conor C. Flynn Chief Executive Officer
Dated: February 26, 2016 Pursuant to the requirements of the Securities Exchange Act of 1934, this report has been signed below by the
following persons on behalf of the registrant and in the capacities and on the dates indicated. Signature Title Date
/s/ Milton Cooper Executive Chairman of the Board of Directors February 26, 2016 Milton Cooper
/s/ Conor C. Flynn President - Chief Executive Officer February 26, 2016 Conor C. Flynn and Director
/s/ Richard G. Dooley Director February 26, 2016 Richard G. Dooley
/s/ Joe Grills Director February 26, 2016 Joe Grills
/s/ Frank Lourenso Director February 26, 2016 Frank Lourenso
/s/ Richard Saltzman Director February 26, 2016 Richard Saltzman
/s/ Philip Coviello Director February 26, 2016 Philip Coviello
/s/ Colombe Nicholas Director February 26, 2016 Colombe Nicholas
/s/ Glenn G. Cohen Executive Vice President - February 26, 2016 Glenn G. Cohen Chief Financial Officer and
Treasurer
/s/ Paul Westbrook Vice President - February 26, 2016 Paul Westbrook Chief Accounting Officer
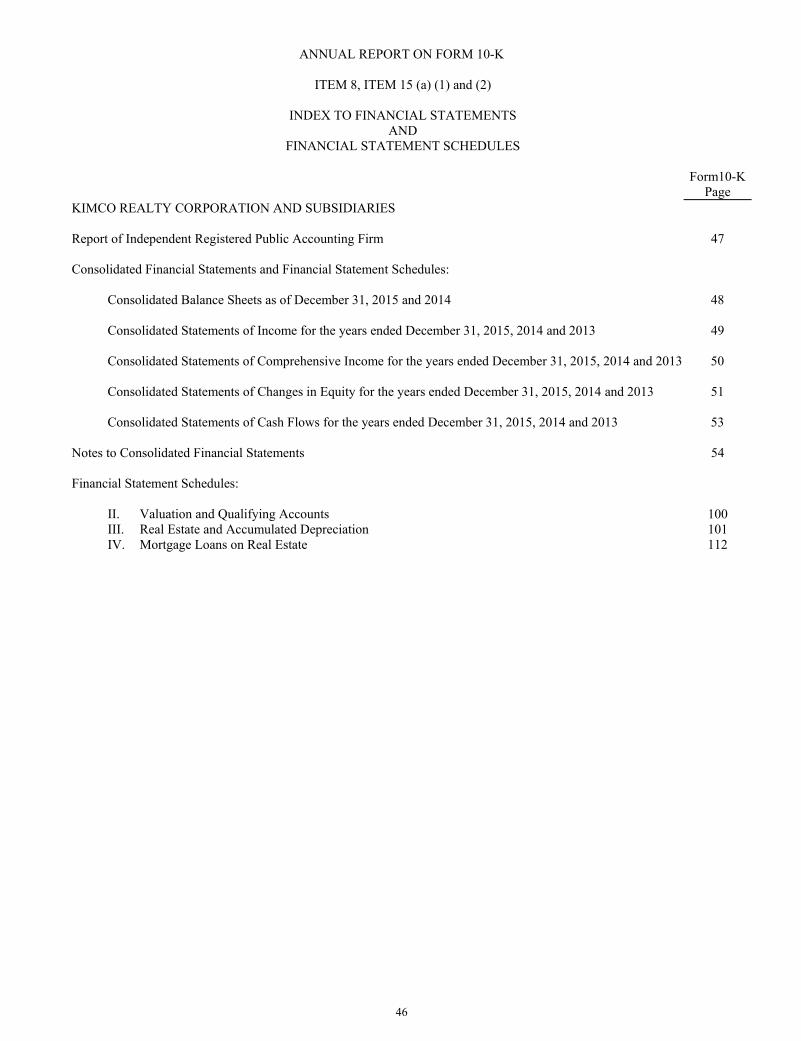
46
ANNUAL REPORT ON FORM 10-K
ITEM 8, ITEM 15 (a) (1) and (2)
INDEX TO FINANCIAL STATEMENTS AND
FINANCIAL STATEMENT SCHEDULES
Form10-KPage
KIMCO REALTY CORPORATION AND SUBSIDIARIES Report of Independent Registered Public Accounting Firm 47 Consolidated Financial Statements and Financial Statement Schedules:
Consolidated Balance Sheets as of December 31, 2015 and 2014 48
Consolidated Statements of Income for the years ended December 31, 2015, 2014 and 2013 49
Consolidated Statements of Comprehensive Income for the years ended December 31, 2015, 2014 and 2013 50
Consolidated Statements of Changes in Equity for the years ended December 31, 2015, 2014 and 2013 51
Consolidated Statements of Cash Flows for the years ended December 31, 2015, 2014 and 2013 53 Notes to Consolidated Financial Statements 54 Financial Statement Schedules:
II. Valuation and Qualifying Accounts III. Real Estate and Accumulated Depreciation 101 IV. Mortgage Loans on Real Estate 112
100
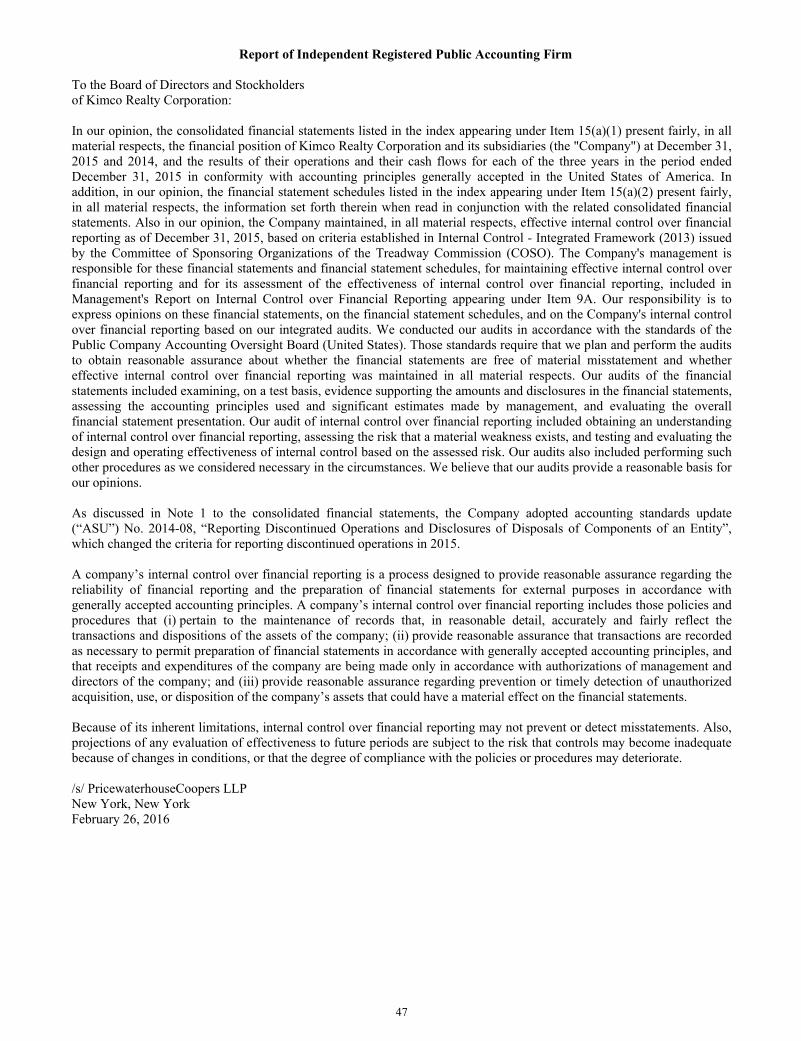
47
Report of Independent Registered Public Accounting Firm To the Board of Directors and Stockholders of Kimco Realty Corporation: In our opinion, the consolidated financial statements listed in the index appearing under Item 15(a)(1) present fairly, in all material respects, the financial position of Kimco Realty Corporation and its subsidiaries (the "Company") at December 31, 2015 and 2014, and the results of their operations and their cash flows for each of the three years in the period ended December 31, 2015 in conformity with accounting principles generally accepted in the United States of America. In addition, in our opinion, the financial statement schedules listed in the index appearing under Item 15(a)(2) present fairly, in all material respects, the information set forth therein when read in conjunction with the related consolidated financial statements. Also in our opinion, the Company maintained, in all material respects, effective internal control over financial reporting as of December 31, 2015, based on criteria established in Internal Control - Integrated Framework (2013) issued by the Committee of Sponsoring Organizations of the Treadway Commission (COSO). The Company's management is responsible for these financial statements and financial statement schedules, for maintaining effective internal control over financial reporting and for its assessment of the effectiveness of internal control over financial reporting, included in Management's Report on Internal Control over Financial Reporting appearing under Item 9A. Our responsibility is to express opinions on these financial statements, on the financial statement schedules, and on the Company's internal control over financial reporting based on our integrated audits. We conducted our audits in accordance with the standards of the Public Company Accounting Oversight Board (United States). Those standards require that we plan and perform the audits to obtain reasonable assurance about whether the financial statements are free of material misstatement and whether effective internal control over financial reporting was maintained in all material respects. Our audits of the financial statements included examining, on a test basis, evidence supporting the amounts and disclosures in the financial statements, assessing the accounting principles used and significant estimates made by management, and evaluating the overall financial statement presentation. Our audit of internal control over financial reporting included obtaining an understanding of internal control over financial reporting, assessing the risk that a material weakness exists, and testing and evaluating the design and operating effectiveness of internal control based on the assessed risk. Our audits also included performing such other procedures as we considered necessary in the circumstances. We believe that our audits provide a reasonable basis for our opinions. As discussed in Note 1 to the consolidated financial statements, the Company adopted accounting standards update (“ASU”) No. 2014-08, “Reporting Discontinued Operations and Disclosures of Disposals of Components of an Entity”, which changed the criteria for reporting discontinued operations in 2015. A company’s internal control over financial reporting is a process designed to provide reasonable assurance regarding the reliability of financial reporting and the preparation of financial statements for external purposes in accordance with generally accepted accounting principles. A company’s internal control over financial reporting includes those policies and procedures that (i) pertain to the maintenance of records that, in reasonable detail, accurately and fairly reflect the transactions and dispositions of the assets of the company; (ii) provide reasonable assurance that transactions are recorded as necessary to permit preparation of financial statements in accordance with generally accepted accounting principles, and that receipts and expenditures of the company are being made only in accordance with authorizations of management and directors of the company; and (iii) provide reasonable assurance regarding prevention or timely detection of unauthorized acquisition, use, or disposition of the company’s assets that could have a material effect on the financial statements. Because of its inherent limitations, internal control over financial reporting may not prevent or detect misstatements. Also, projections of any evaluation of effectiveness to future periods are subject to the risk that controls may become inadequate because of changes in conditions, or that the degree of compliance with the policies or procedures may deteriorate. /s/ PricewaterhouseCoopers LLP New York, New York February 26, 2016
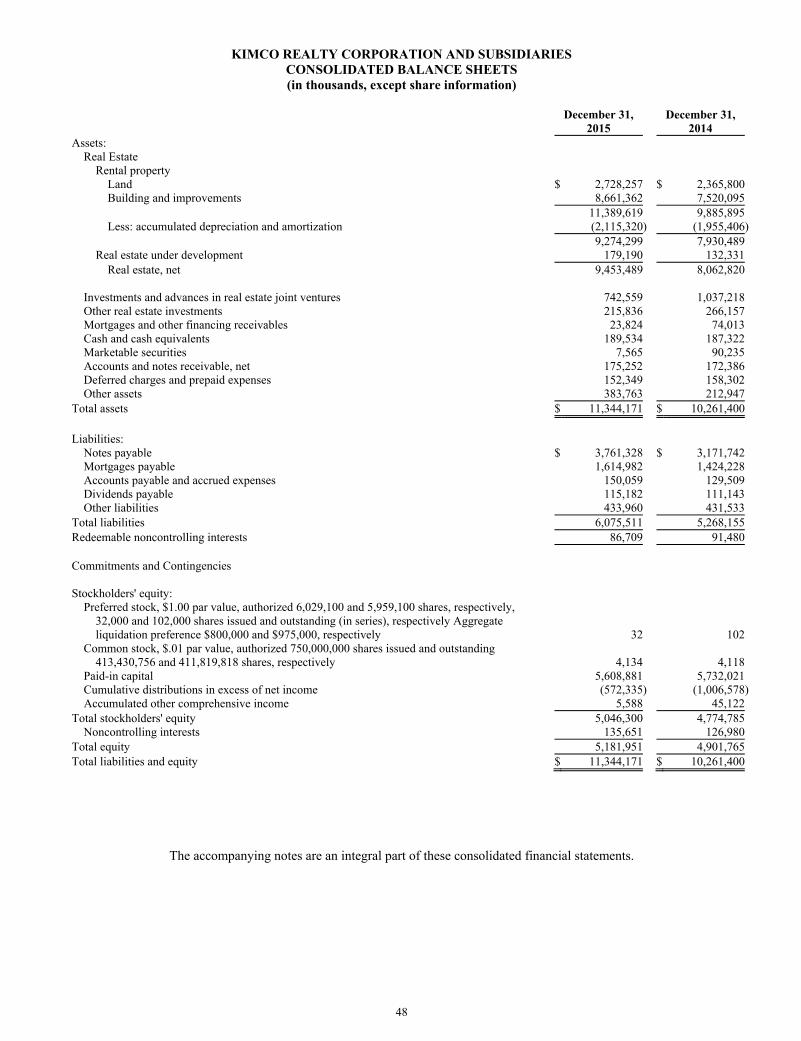
48
KIMCO REALTY CORPORATION AND SUBSIDIARIES CONSOLIDATED BALANCE SHEETS (in thousands, except share information)
December 31,
2015 December 31, 2014
Assets: Real Estate
Rental property Land $ 2,728,257 $ 2,365,800 Building and improvements 8,661,362 7,520,095
11,389,619 9,885,895 Less: accumulated depreciation and amortization (2,115,320) (1,955,406)
9,274,299 7,930,489 Real estate under development 179,190 132,331
Real estate, net 9,453,489 8,062,820
Investments and advances in real estate joint ventures 742,559 1,037,218 Other real estate investments 215,836 266,157 Mortgages and other financing receivables 23,824 74,013 Cash and cash equivalents 189,534 187,322 Marketable securities 7,565 90,235 Accounts and notes receivable, net 175,252 172,386 Deferred charges and prepaid expenses 152,349 158,302 Other assets 383,763 212,947
Total assets $ 11,344,171 $ 10,261,400 Liabilities:
Notes payable $ 3,761,328 $ 3,171,742 Mortgages payable 1,614,982 1,424,228 Accounts payable and accrued expenses 150,059 129,509 Dividends payable 115,182 111,143 Other liabilities 433,960 431,533
Total liabilities 6,075,511 5,268,155 Redeemable noncontrolling interests 86,709 91,480 Commitments and Contingencies Stockholders' equity:
Preferred stock, $1.00 par value, authorized 6,029,100 and 5,959,100 shares, respectively, 32,000 and 102,000 shares issued and outstanding (in series), respectively Aggregate liquidation preference $800,000 and $975,000, respectively 32 102
Common stock, $.01 par value, authorized 750,000,000 shares issued and outstanding 413,430,756 and 411,819,818 shares, respectively 4,134 4,118
Paid-in capital 5,608,881 5,732,021 Cumulative distributions in excess of net income (572,335) (1,006,578)Accumulated other comprehensive income 5,588 45,122
Total stockholders' equity 5,046,300 4,774,785 Noncontrolling interests 135,651 126,980
Total equity 5,181,951 4,901,765 Total liabilities and equity $ 11,344,171 $ 10,261,400
The accompanying notes are an integral part of these consolidated financial statements.
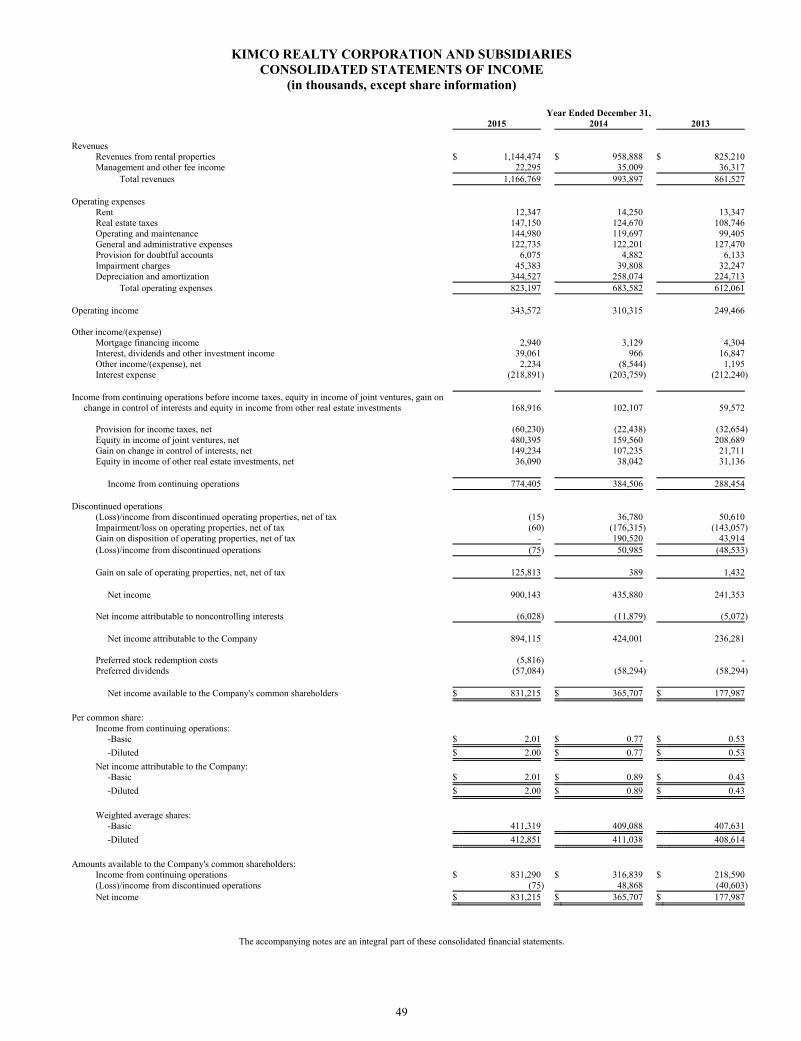
49
KIMCO REALTY CORPORATION AND SUBSIDIARIES CONSOLIDATED STATEMENTS OF INCOME
(in thousands, except share information) Year Ended December 31, 2015 2014 2013 Revenues
Revenues from rental properties $ 1,144,474 $ 958,888 $ 825,210 Management and other fee income 22,295 35,009 36,317
Total revenues 1,166,769 993,897 861,527
Operating expenses Rent 12,347 14,250 13,347 Real estate taxes 147,150 124,670 108,746 Operating and maintenance 144,980 119,697 99,405 General and administrative expenses 122,735 122,201 127,470 Provision for doubtful accounts 6,075 4,882 6,133 Impairment charges 45,383 39,808 32,247 Depreciation and amortization 344,527 258,074 224,713
Total operating expenses 823,197 683,582 612,061 Operating income 343,572 310,315 249,466 Other income/(expense)
Mortgage financing income 2,940 3,129 4,304 Interest, dividends and other investment income 39,061 966 16,847 Other income/(expense), net 2,234 (8,544) 1,195 Interest expense (218,891) (203,759) (212,240)
Income from continuing operations before income taxes, equity in income of joint ventures, gain on
change in control of interests and equity in income from other real estate investments 168,916 102,107 59,572
Provision for income taxes, net (60,230) (22,438) (32,654)Equity in income of joint ventures, net 480,395 159,560 208,689 Gain on change in control of interests, net 149,234 107,235 21,711 Equity in income of other real estate investments, net 36,090 38,042 31,136
Income from continuing operations 774,405 384,506 288,454
Discontinued operations
(Loss)/income from discontinued operating properties, net of tax (15) 36,780 50,610 Impairment/loss on operating properties, net of tax (60) (176,315) (143,057)Gain on disposition of operating properties, net of tax - 190,520 43,914 (Loss)/income from discontinued operations (75) 50,985 (48,533)
Gain on sale of operating properties, net, net of tax 125,813 389 1,432
Net income 900,143 435,880 241,353
Net income attributable to noncontrolling interests (6,028) (11,879) (5,072)
Net income attributable to the Company 894,115 424,001 236,281
Preferred stock redemption costs (5,816) - - Preferred dividends (57,084) (58,294) (58,294)
Net income available to the Company's common shareholders $ 831,215 $ 365,707 $ 177,987
Per common share:
Income from continuing operations: -Basic $ 2.01 $ 0.77 $ 0.53 -Diluted $ 2.00 $ 0.77 $ 0.53
Net income attributable to the Company: -Basic $ 2.01 $ 0.89 $ 0.43 -Diluted $ 2.00 $ 0.89 $ 0.43
Weighted average shares:
-Basic 411,319 409,088 407,631 -Diluted 412,851 411,038 408,614
Amounts available to the Company's common shareholders:
Income from continuing operations $ 831,290 $ 316,839 $ 218,590 (Loss)/income from discontinued operations (75) 48,868 (40,603)Net income $ 831,215 $ 365,707 $ 177,987
The accompanying notes are an integral part of these consolidated financial statements.
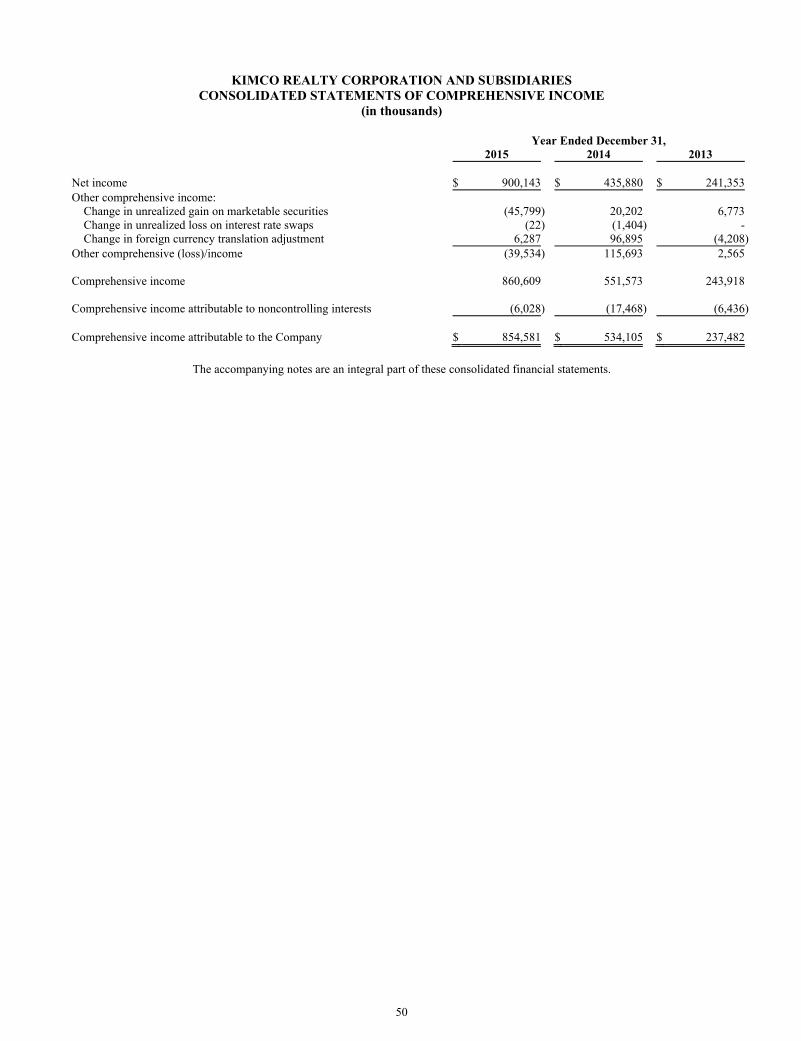
50
KIMCO REALTY CORPORATION AND SUBSIDIARIES CONSOLIDATED STATEMENTS OF COMPREHENSIVE INCOME
(in thousands) Year Ended December 31, 2015 2014 2013 Net income $ 900,143 $ 435,880 $ 241,353 Other comprehensive income:
Change in unrealized gain on marketable securities (45,799) 20,202 6,773 Change in unrealized loss on interest rate swaps (22) (1,404) - Change in foreign currency translation adjustment 6,287 96,895 (4,208)
Other comprehensive (loss)/income (39,534) 115,693 2,565 Comprehensive income 860,609 551,573 243,918 Comprehensive income attributable to noncontrolling interests (6,028) (17,468) (6,436) Comprehensive income attributable to the Company $ 854,581 $ 534,105 $ 237,482
The accompanying notes are an integral part of these consolidated financial statements.
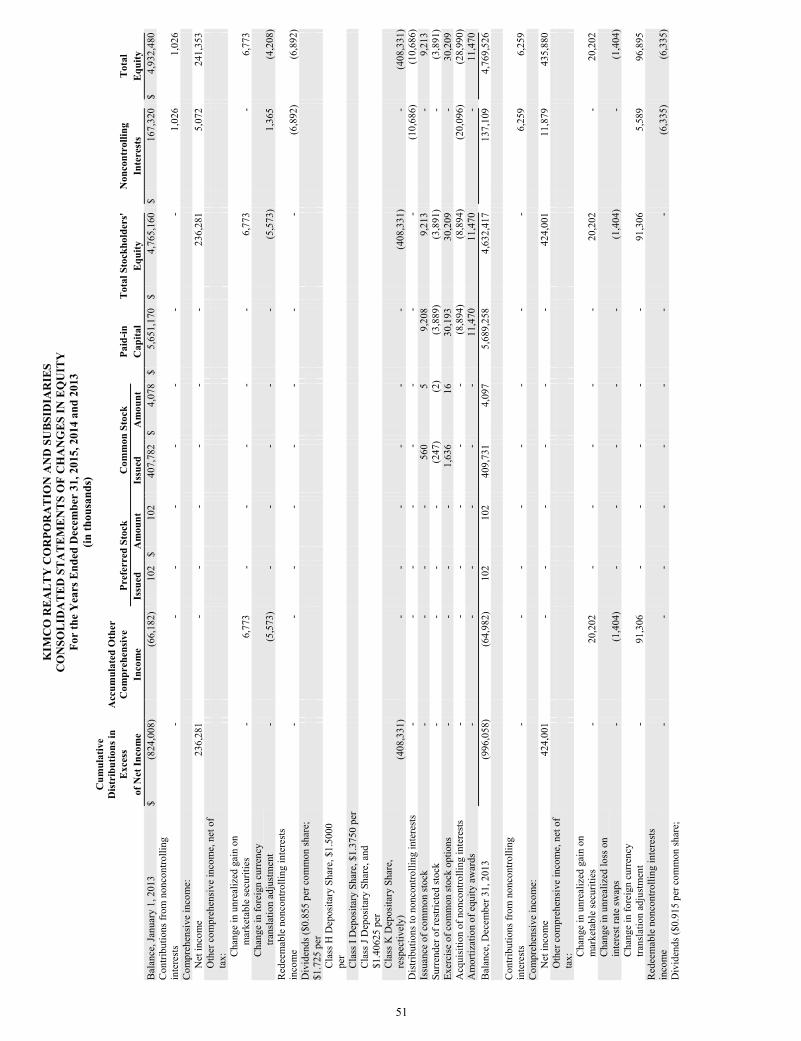
KIM
CO
RE
AL
TY
CO
RPO
RA
TIO
N A
ND
SU
BSI
DIA
RIE
S C
ON
SOL
IDA
TE
D S
TA
TE
ME
NT
S O
F C
HA
NG
ES
IN E
QU
ITY
Fo
r th
e Y
ears
End
ed D
ecem
ber
31, 2
015,
201
4 an
d 20
13
(in th
ousa
nds)
Cum
ulat
ive
Dis
trib
utio
ns in
E
xces
s
A
ccum
ulat
ed O
ther
C
ompr
ehen
sive
Pr
efer
red
Stoc
k
Com
mon
Sto
ck
Pa
id-in
T
otal
Sto
ckho
lder
s'
Non
cont
rolli
ng
Tot
al
of N
et In
com
e
In
com
e
Issu
ed
Am
ount
Is
sued
A
mou
nt
C
apita
l
Equ
ity
Inte
rest
s
Equ
ity
B
alan
ce, J
anua
ry 1
, 201
3 $
(8
24,0
08)
(6
6,18
2)
102
$
102
40
7,78
2 $
4,
078
$5,
651,
170
$
4,76
5,16
0 $
16
7,32
0 $
4,93
2,48
0
Con
tribu
tions
from
non
cont
rolli
ng
inte
rest
s
-
-
-
-
-
-
-
-
1,02
6
1,02
6
Com
preh
ensi
ve in
com
e:
N
et in
com
e
236,
281
-
-
-
-
-
-
236,
281
5,
072
24
1,35
3
Oth
er c
ompr
ehen
sive
inco
me,
net
of
tax:
Cha
nge
in u
nrea
lized
gai
n on
m
arke
tabl
e se
curit
ies
-
6,
773
-
-
-
-
-
6,
773
-
6,
773
C
hang
e in
fore
ign
curr
ency
tra
nsla
tion
adju
stm
ent
-
(5
,573
)
-
-
-
-
-
(5,5
73)
1,
365
(4
,208
) R
edee
mab
le n
onco
ntro
lling
inte
rest
s in
com
e
-
-
-
-
-
-
-
-
(6,8
92)
(6
,892
) D
ivid
ends
($0.
855
per c
omm
on sh
are;
$1
.725
per
Cla
ss H
Dep
osita
ry S
hare
, $1.
5000
pe
r
Cla
ss I
Dep
osita
ry S
hare
, $1.
3750
per
Cla
ss J
Dep
osita
ry S
hare
, and
$1
.406
25 p
er
Cla
ss K
Dep
osita
ry S
hare
, re
spec
tivel
y)
(4
08,3
31)
-
-
-
-
-
-
(4
08,3
31)
-
(4
08,3
31)
Dis
tribu
tions
to n
onco
ntro
lling
inte
rest
s
-
-
-
-
-
-
-
-
(10,
686)
(1
0,68
6)
Issu
ance
of c
omm
on st
ock
-
-
-
-
56
0
5
9,20
8
9,21
3
-
9,21
3
Surr
ende
r of r
estri
cted
stoc
k
-
-
-
-
(247
)
(2)
(3
,889
)
(3,8
91)
-
(3
,891
) Ex
erci
se o
f com
mon
stoc
k op
tions
-
-
-
-
1,63
6
16
30
,193
30,2
09
-
30
,209
A
cqui
sitio
n of
non
cont
rolli
ng in
tere
sts
-
-
-
-
-
-
(8
,894
)
(8,8
94)
(2
0,09
6)
(28,
990)
A
mor
tizat
ion
of e
quity
aw
ards
-
-
-
-
-
-
11,4
70
11
,470
-
11,4
70
Bal
ance
, Dec
embe
r 31,
201
3
(996
,058
)
(64,
982)
10
2
102
40
9,73
1
4,09
7
5,68
9,25
8
4,63
2,41
7
137,
109
4,
769,
526
C
ontri
butio
ns fr
om n
onco
ntro
lling
in
tere
sts
-
-
-
-
-
-
-
-
6,
259
6,
259
C
ompr
ehen
sive
inco
me:
Net
inco
me
42
4,00
1
-
-
-
-
-
-
42
4,00
1
11,8
79
43
5,88
0
Oth
er c
ompr
ehen
sive
inco
me,
net
of
tax:
Cha
nge
in u
nrea
lized
gai
n on
m
arke
tabl
e se
curit
ies
-
20
,202
-
-
-
-
-
20,2
02
-
20
,202
C
hang
e in
unr
ealiz
ed lo
ss o
n in
tere
st ra
te sw
aps
-
(1
,404
)
-
-
-
-
-
(1,4
04)
-
(1
,404
) C
hang
e in
fore
ign
curr
ency
tra
nsla
tion
adju
stm
ent
-
91
,306
-
-
-
-
-
91,3
06
5,
589
96
,895
R
edee
mab
le n
onco
ntro
lling
inte
rest
s in
com
e
-
-
-
-
-
-
-
-
(6,3
35)
(6
,335
) D
ivid
ends
($0.
915
per c
omm
on sh
are;
51
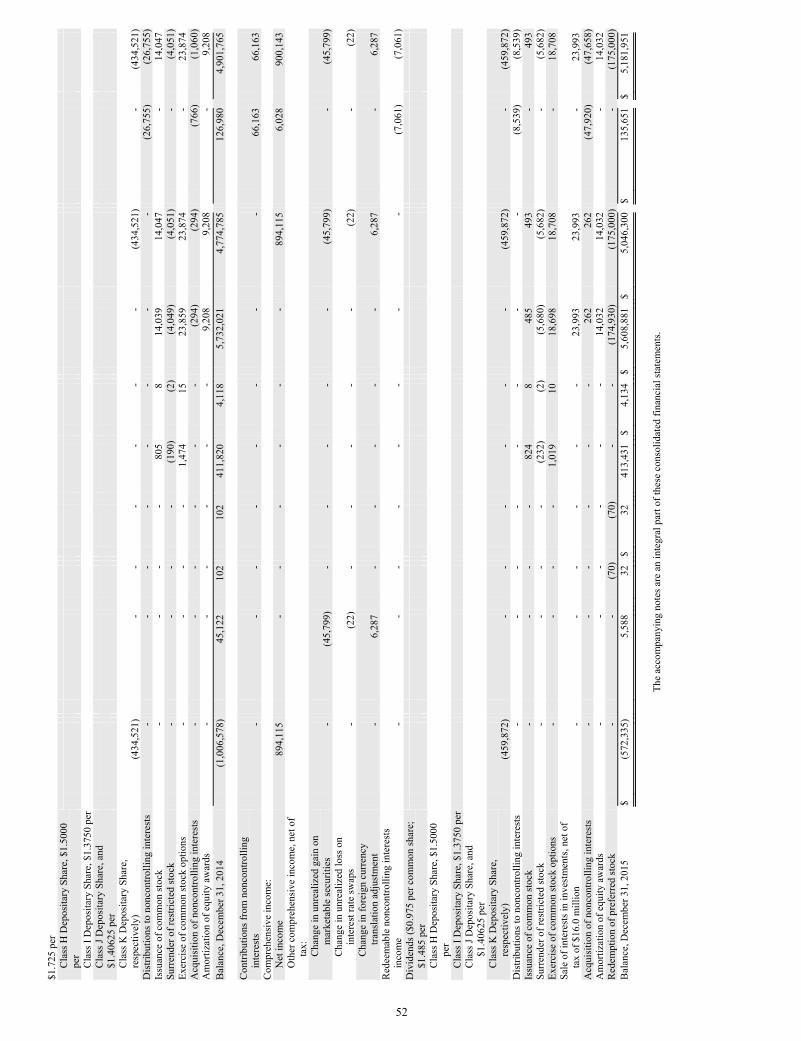
$1.7
25 p
er
Cla
ss H
Dep
osita
ry S
hare
, $1.
5000
pe
r
Cla
ss I
Dep
osita
ry S
hare
, $1.
3750
per
Cla
ss J
Dep
osita
ry S
hare
, and
$1
.406
25 p
er
Cla
ss K
Dep
osita
ry S
hare
, re
spec
tivel
y)
(4
34,5
21)
-
-
-
-
-
-
(4
34,5
21)
-
(4
34,5
21)
Dis
tribu
tions
to n
onco
ntro
lling
inte
rest
s
-
-
-
-
-
-
-
-
(26,
755)
(2
6,75
5)
Issu
ance
of c
omm
on st
ock
-
-
-
-
80
5
8
14,0
39
14
,047
-
14,0
47
Surr
ende
r of r
estri
cted
stoc
k
-
-
-
-
(190
)
(2)
(4
,049
)
(4,0
51)
-
(4
,051
) Ex
erci
se o
f com
mon
stoc
k op
tions
-
-
-
-
1,47
4
15
23
,859
23,8
74
-
23
,874
A
cqui
sitio
n of
non
cont
rolli
ng in
tere
sts
-
-
-
-
-
-
(2
94)
(2
94)
(7
66)
(1
,060
) A
mor
tizat
ion
of e
quity
aw
ards
-
-
-
-
-
-
9,20
8
9,20
8
-
9,20
8
Bal
ance
, Dec
embe
r 31,
201
4
(1,0
06,5
78)
45
,122
102
10
2
411,
820
4,
118
5,
732,
021
4,
774,
785
12
6,98
0
4,90
1,76
5
Con
tribu
tions
from
non
cont
rolli
ng
inte
rest
s
-
-
-
-
-
-
-
-
66,1
63
66
,163
C
ompr
ehen
sive
inco
me:
Net
inco
me
89
4,11
5
-
-
-
-
-
-
89
4,11
5
6,02
8
900,
143
O
ther
com
preh
ensi
ve in
com
e, n
et o
f ta
x:
Cha
nge
in u
nrea
lized
gai
n on
m
arke
tabl
e se
curit
ies
-
(4
5,79
9)
-
-
-
-
-
(45,
799)
-
(4
5,79
9)
Cha
nge
in u
nrea
lized
loss
on
inte
rest
rate
swap
s
-
(22)
-
-
-
-
-
(2
2)
-
(22)
C
hang
e in
fore
ign
curr
ency
tra
nsla
tion
adju
stm
ent
-
6,
287
-
-
-
-
-
6,
287
-
6,
287
R
edee
mab
le n
onco
ntro
lling
inte
rest
s in
com
e
-
-
-
-
-
-
-
-
(7,0
61)
(7
,061
) D
ivid
ends
($0.
975
per c
omm
on sh
are;
$1
.485
per
Cla
ss H
Dep
osita
ry S
hare
, $1.
5000
pe
r
Cla
ss I
Dep
osita
ry S
hare
, $1.
3750
per
Cla
ss J
Dep
osita
ry S
hare
, and
$1
.406
25 p
er
Cla
ss K
Dep
osita
ry S
hare
, re
spec
tivel
y)
(4
59,8
72)
-
-
-
-
-
-
(4
59,8
72)
-
(4
59,8
72)
Dis
tribu
tions
to n
onco
ntro
lling
inte
rest
s
-
-
-
-
-
-
-
-
(8,5
39)
(8
,539
) Is
suan
ce o
f com
mon
stoc
k
-
-
-
-
824
8
48
5
493
-
49
3
Surr
ende
r of r
estri
cted
stoc
k
-
-
-
-
(232
)
(2)
(5
,680
)
(5,6
82)
-
(5
,682
) Ex
erci
se o
f com
mon
stoc
k op
tions
-
-
-
-
1,01
9
10
18
,698
18,7
08
-
18
,708
Sa
le o
f int
eres
ts in
inve
stm
ents
, net
of
tax
of $
16.0
mill
ion
-
-
-
-
-
-
23
,993
23,9
93
-
23
,993
A
cqui
sitio
n of
non
cont
rolli
ng in
tere
sts
-
-
-
-
-
-
26
2
262
(4
7,92
0)
(47,
658)
A
mor
tizat
ion
of e
quity
aw
ards
-
-
-
-
-
-
14,0
32
14
,032
-
14,0
32
Red
empt
ion
of p
refe
rred
stoc
k
-
-
(70)
(7
0)
-
-
(174
,930
)
(175
,000
)
-
(175
,000
) B
alan
ce, D
ecem
ber 3
1, 2
015
$
(572
,335
)
5,58
8
32
$ 32
413,
431
$
4,13
4 $
5,60
8,88
1 $
5,
046,
300
$
135,
651
$5,
181,
951
Th
e ac
com
pany
ing
note
s are
an
inte
gral
par
t of t
hese
con
solid
ated
fina
ncia
l sta
tem
ents
.
52
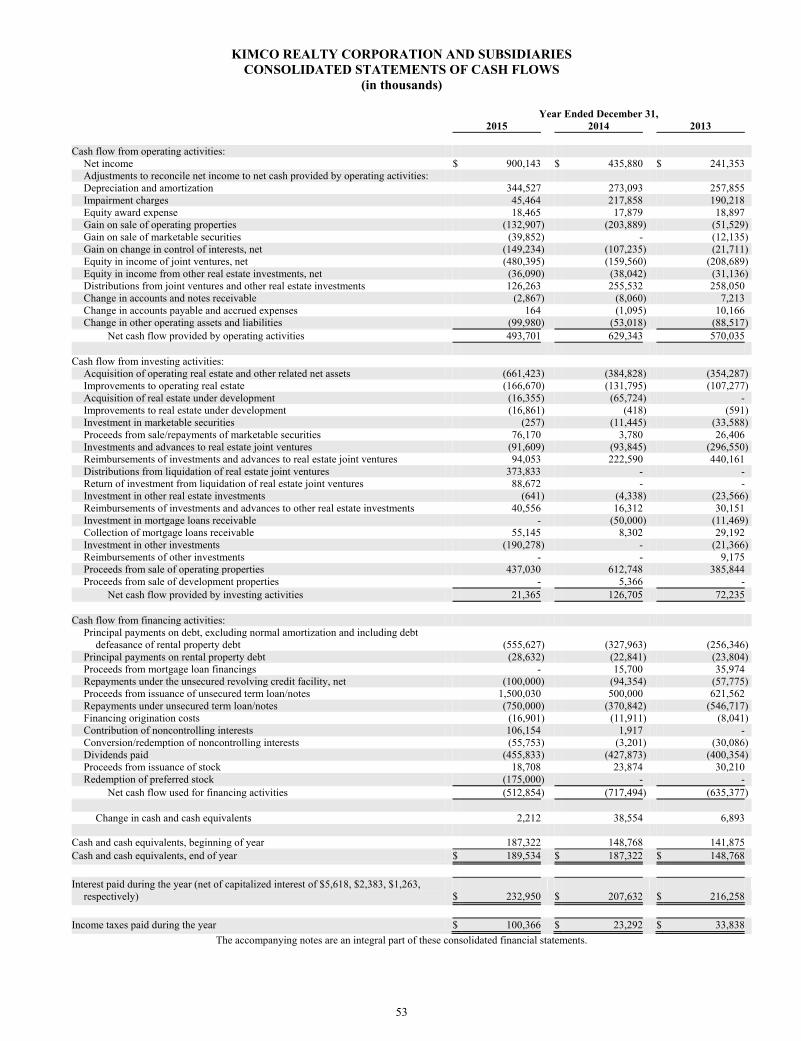
53
KIMCO REALTY CORPORATION AND SUBSIDIARIES CONSOLIDATED STATEMENTS OF CASH FLOWS
(in thousands) Year Ended December 31, 2015 2014 2013 Cash flow from operating activities:
Net income $ 900,143 $ 435,880 $ 241,353 Adjustments to reconcile net income to net cash provided by operating activities: Depreciation and amortization 344,527 273,093 257,855 Impairment charges 45,464 217,858 190,218 Equity award expense 18,465 17,879 18,897 Gain on sale of operating properties (132,907) (203,889) (51,529)Gain on sale of marketable securities (39,852) - (12,135)Gain on change in control of interests, net (149,234) (107,235) (21,711)Equity in income of joint ventures, net (480,395) (159,560) (208,689)Equity in income from other real estate investments, net (36,090) (38,042) (31,136)Distributions from joint ventures and other real estate investments 126,263 255,532 258,050 Change in accounts and notes receivable (2,867) (8,060) 7,213 Change in accounts payable and accrued expenses 164 (1,095) 10,166 Change in other operating assets and liabilities (99,980) (53,018) (88,517)
Net cash flow provided by operating activities 493,701 629,343 570,035 Cash flow from investing activities:
Acquisition of operating real estate and other related net assets (661,423) (384,828) (354,287)Improvements to operating real estate (166,670) (131,795) (107,277)Acquisition of real estate under development (16,355) (65,724) - Improvements to real estate under development (16,861) (418) (591)Investment in marketable securities (257) (11,445) (33,588)Proceeds from sale/repayments of marketable securities 76,170 3,780 26,406 Investments and advances to real estate joint ventures (91,609) (93,845) (296,550)Reimbursements of investments and advances to real estate joint ventures 94,053 222,590 440,161 Distributions from liquidation of real estate joint ventures 373,833 - - Return of investment from liquidation of real estate joint ventures 88,672 - - Investment in other real estate investments (641) (4,338) (23,566)Reimbursements of investments and advances to other real estate investments 40,556 16,312 30,151 Investment in mortgage loans receivable - (50,000) (11,469)Collection of mortgage loans receivable 55,145 8,302 29,192 Investment in other investments (190,278) - (21,366)Reimbursements of other investments - - 9,175 Proceeds from sale of operating properties 437,030 612,748 385,844 Proceeds from sale of development properties - 5,366 -
Net cash flow provided by investing activities 21,365 126,705 72,235 Cash flow from financing activities:
Principal payments on debt, excluding normal amortization and including debt defeasance of rental property debt (555,627) (327,963) (256,346)
Principal payments on rental property debt (28,632) (22,841) (23,804)Proceeds from mortgage loan financings - 15,700 35,974 Repayments under the unsecured revolving credit facility, net (100,000) (94,354) (57,775)Proceeds from issuance of unsecured term loan/notes 1,500,030 500,000 621,562 Repayments under unsecured term loan/notes (750,000) (370,842) (546,717)Financing origination costs (16,901) (11,911) (8,041)Contribution of noncontrolling interests 106,154 1,917 - Conversion/redemption of noncontrolling interests (55,753) (3,201) (30,086)Dividends paid (455,833) (427,873) (400,354)Proceeds from issuance of stock 18,708 23,874 30,210 Redemption of preferred stock (175,000) - -
Net cash flow used for financing activities (512,854) (717,494) (635,377)
Change in cash and cash equivalents 2,212 38,554 6,893 Cash and cash equivalents, beginning of year 187,322 148,768 141,875 Cash and cash equivalents, end of year $ 189,534 $ 187,322 $ 148,768 Interest paid during the year (net of capitalized interest of $5,618, $2,383, $1,263,
respectively) $ 232,950 $ 207,632 $ 216,258 Income taxes paid during the year $ 100,366 $ 23,292 $ 33,838
The accompanying notes are an integral part of these consolidated financial statements.
KIMCO REALTY CORPORATION AND SUBSIDIARIES
NOTES TO CONSOLIDATED FINANCIAL STATEMENTS
54
Amounts relating to the number of buildings, square footage, tenant and occupancy data, joint venture debt average interest rates and terms and estimated project costs are unaudited.
1. Summary of Significant Accounting Policies:
Business Kimco Realty Corporation and subsidiaries (the "Company" or "Kimco"), affiliates and related real estate joint ventures are engaged principally in the ownership, management, development and operation of open-air shopping centers, which are anchored generally by discount department stores, supermarkets or drugstores. Additionally, the Company provides complementary services that capitalize on the Company’s established retail real estate expertise. The Company evaluates performance on a property specific or transactional basis and does not distinguish its principal business or group its operations on a geographical basis for purposes of measuring performance. Accordingly, the Company believes it has a single reportable segment for disclosure purposes in accordance with accounting principles generally accepted in the United States of America ("GAAP"). Additionally, in connection with the Tax Relief Extension Act of 1999 (the "RMA"), which became effective January 1, 2001, the Company is permitted to participate in activities which it was precluded from previously in order to maintain its qualification as a Real Estate Investment Trust ("REIT"), so long as these activities are conducted in entities which elect to be treated as taxable subsidiaries under the Internal Revenue Code, as amended (the "Code"), subject to certain limitations. As such, the Company, through its wholly-owned taxable REIT subsidiaries (“TRS”), has been engaged in various retail real estate related opportunities including retail real estate management and disposition services which primarily focuses on leasing and disposition strategies of retail real estate controlled by both healthy and distressed and/or bankrupt retailers. The Company may consider other investments through its TRS should suitable opportunities arise. Principles of Consolidation and Estimates The accompanying Consolidated Financial Statements include the accounts of Kimco Realty Corporation and subsidiaries (the “Company”). The Company’s subsidiaries includes subsidiaries which are wholly-owned and all entities in which the Company has a controlling interest, including where the Company has been determined to be a primary beneficiary of a variable interest entity (“VIE”) or meets certain criteria of a sole general partner or managing member in accordance with the Consolidation guidance of the Financial Accounting Standards Board (“FASB”) Accounting Standards Codification (“ASC”). All inter-company balances and transactions have been eliminated in consolidation. GAAP requires the Company's management to make estimates and assumptions that affect the reported amounts of assets and liabilities, the disclosure of contingent assets and liabilities and the reported amounts of revenues and expenses during a reporting period. The most significant assumptions and estimates relate to the valuation of real estate and related intangible assets and liabilities, equity method investments, marketable securities and other investments, including the assessment of impairments, as well as, depreciable lives, revenue recognition, the collectability of trade accounts receivable, realizability of deferred tax assets and the assessment of uncertain tax positions. Application of these assumptions requires the exercise of judgment as to future uncertainties, and, as a result, actual results could differ from these estimates. Subsequent Events The Company has evaluated subsequent events and transactions for potential recognition or disclosure in its consolidated financial statements.
Real Estate Real estate assets are stated at cost, less accumulated depreciation and amortization. Upon acquisition of real estate operating properties, the Company estimates the fair value of acquired tangible assets (consisting of land, building, building improvements and tenant improvements) and identified intangible assets and liabilities (consisting of above
KIMCO REALTY CORPORATION AND SUBSIDIARIES
NOTES TO CONSOLIDATED FINANCIAL STATEMENTS (continued)
55
and below-market leases, in-place leases and tenant relationships, where applicable), assumed debt and redeemable units issued at the date of acquisition, based on evaluation of information and estimates available at that date. Fair value is determined based on an exit price approach, which contemplates the price that would be received to sell an asset or paid to transfer a liability in an orderly transaction between market participants at the measurement date. If, up to one year from the acquisition date, information regarding fair value of the assets acquired and liabilities assumed is received and estimates are refined, appropriate adjustments, are recognized in the reporting period in which the adjustment is identified. The Company expenses transaction costs associated with business combinations in the period incurred. In allocating the purchase price to identified intangible assets and liabilities of an acquired property, the value of above-market and below-market leases is estimated based on the present value of the difference between the contractual amounts, including fixed rate below-market lease renewal options, to be paid pursuant to the leases and management’s estimate of the market lease rates and other lease provisions (i.e., expense recapture, base rental changes, etc.) measured over a period equal to the estimated remaining term of the lease. The capitalized above-market or below-market intangible is amortized to rental income over the estimated remaining term of the respective leases, which includes the expected renewal option period. Mortgage debt discounts or premiums are amortized into interest expense over the remaining term of the related debt instrument. In determining the value of in-place leases, management considers current market conditions and costs to execute similar leases in arriving at an estimate of the carrying costs during the expected lease-up period from vacant to existing occupancy. In estimating carrying costs, management includes real estate taxes, insurance, other operating expenses, estimates of lost rental revenue during the expected lease-up periods and costs to execute similar leases including leasing commissions, legal and other related costs based on current market demand. The value assigned to in-place leases and tenant relationships is amortized over the estimated remaining term of the leases. If a lease were to be terminated prior to its scheduled expiration, all unamortized costs relating to that lease would be written off. Depreciation and amortization are provided on the straight-line method over the estimated useful lives of the assets, as follows: Buildings and building improvements 15 to 50 years Fixtures, leasehold and tenant improvements
(including certain identified intangible assets) Terms of leases or useful lives, whichever is shorter
The Company periodically assesses the useful lives of its depreciable real estate assets, including those expected to be redeveloped in future periods, and accounts for any revisions prospectively. Expenditures for maintenance, repairs and demolition costs are charged to operations as incurred. Significant renovations and replacements, which improve or extend the life of the asset, are capitalized. The useful lives of amortizable intangible assets are evaluated each reporting period with any changes in estimated useful lives being accounted for over the revised remaining useful life. When a real estate asset is identified by management as held-for-sale, the Company ceases depreciation of the asset and estimates the sales price, net of selling costs. If the net sales price of the asset is less than the net book value of the asset, an adjustment to the carrying value would be recorded to reflect the estimated fair value of the property, less estimated costs of sale. On a continuous basis, management assesses whether there are any indicators, including property operating performance, changes in anticipated holding period and general market conditions, that the value of the real estate properties (including any related amortizable intangible assets or liabilities) may be impaired. A property value is considered impaired only if management’s estimate of current and projected operating cash flows (undiscounted and unleveraged) of the property over its remaining hold period is less than the net carrying value of the property. Such cash flow projections consider factors such as expected future operating income, trends and prospects, as well as the effects of demand, competition and other factors. To the extent impairment has occurred, the carrying value of the property would be adjusted to an amount to reflect the estimated fair value of the property.
KIMCO REALTY CORPORATION AND SUBSIDIARIES
NOTES TO CONSOLIDATED FINANCIAL STATEMENTS (continued)
56
Real Estate Under Development Real estate under development represents the ground-up development of open-air shopping center projects which the Company plans to hold as long-term investments. These properties are carried at cost. The cost of land and buildings under development includes specifically identifiable costs. The capitalized costs include pre-construction costs essential to the development of the property, development costs, construction costs, interest costs, real estate taxes, salaries and related costs of personnel directly involved and other costs incurred during the period of development. The Company ceases cost capitalization when the property is held available for occupancy upon substantial completion of tenant improvements, but no later than one year from the completion of major construction activity. If, in management’s opinion, the current and projected undiscounted cash flows of these assets to be held as long-term investments is less than the net carrying value, the carrying value would be adjusted to an amount that reflects the estimated fair value of the property. Investments in Unconsolidated Joint Ventures The Company accounts for its investments in unconsolidated joint ventures under the equity method of accounting as the Company exercises significant influence, but does not control these entities. These investments are recorded initially at cost and subsequently adjusted for cash contributions, distributions and our share of earnings and losses. Earnings or losses for each investment are recognized in accordance with each respective investment agreement and where applicable, based upon an allocation of the investment’s net assets at book value as if the investment was hypothetically liquidated at the end of each reporting period. The Company’s joint ventures and other real estate investments primarily consist of co-investments with institutional and other joint venture partners in neighborhood and community shopping center properties, consistent with its core business. These joint ventures typically obtain non-recourse third-party financing on their property investments, thus contractually limiting the Company’s exposure to losses primarily to the amount of its equity investment; and due to the lender’s exposure to losses, a lender typically will require a minimum level of equity in order to mitigate its risk. The Company, on a limited selective basis, has obtained unsecured financing for certain joint ventures. These unsecured financings may be guaranteed by the Company with guarantees from the joint venture partners for their proportionate amounts of any guaranty payment the Company is obligated to make. To recognize the character of distributions from equity investees within its consolidated statements of cash flows, all distributions received are presumed to be returns on investment and classified as cash inflows from operating activities unless the Company’s cumulative distributions received less distributions received in prior periods that were determined to be returns of investment exceed its cumulative equity in earnings recognized by the investor (as adjusted for amortization of basis differences). When such an excess occurs, the current-period distribution up to this excess is considered a return of investment and classified as cash inflows from investing. On a continuous basis, management assesses whether there are any indicators, including the underlying investment property operating performance and general market conditions, that the value of the Company’s investments in unconsolidated joint ventures may be impaired. An investment’s value is impaired only if management’s estimate of the fair value of the investment is less than the carrying value of the investment and such difference is deemed to be other-than-temporary. To the extent impairment has occurred, the loss shall be measured as the excess of the carrying amount of the investment over the estimated fair value of the investment. The Company’s estimated fair values are based upon a discounted cash flow model for each joint venture that includes all estimated cash inflows and outflows over a specified holding period. Capitalization rates, discount rates and credit spreads utilized in these models are based upon rates that the Company believes to be within a reasonable range of current market rates. Other Real Estate Investments Other real estate investments primarily consist of preferred equity investments for which the Company provides capital to owners and developers of real estate. The Company typically accounts for its preferred equity investments on the equity method of accounting, whereby earnings for each investment are recognized in accordance with each respective
KIMCO REALTY CORPORATION AND SUBSIDIARIES
NOTES TO CONSOLIDATED FINANCIAL STATEMENTS (continued)
57
investment agreement and based upon an allocation of the investment’s net assets at book value as if the investment was hypothetically liquidated at the end of each reporting period. On a continuous basis, management assesses whether there are any indicators, including the underlying investment property operating performance and general market conditions, that the value of the Company’s Other real estate investments may be impaired. An investment’s value is impaired only if management’s estimate of the fair value of the investment is less than the carrying value of the investment and such difference is deemed to be other-than-temporary. To the extent impairment has occurred, the loss shall be measured as the excess of the carrying amount of the investment over the estimated fair value of the investment.
The Company’s estimated fair values are based upon a discounted cash flow model for each investment that includes all estimated cash inflows and outflows over a specified holding period and, where applicable, any estimated debt premiums. Capitalization rates, discount rates and credit spreads utilized in these models are based upon rates that the Company believes to be within a reasonable range of current market rates.
Mortgages and Other Financing Receivables Mortgages and other financing receivables consist of loans acquired and loans originated by the Company. Borrowers of these loans are primarily experienced owners, operators or developers of commercial real estate. The Company’s loans are primarily mortgage loans that are collateralized by real estate. Mortgages and other financing receivables are recorded at stated principal amounts, net of any discount or premium or deferred loan origination costs or fees. The related discounts or premiums on mortgages and other loans purchased are amortized or accreted over the life of the related loan receivable. The Company defers certain loan origination and commitment fees, net of certain origination costs and amortizes them as an adjustment of the loan’s yield over the term of the related loan. The Company reviews on a quarterly basis credit quality indicators such as (i) payment status to identify performing versus non-performing loans, (ii) changes affecting the underlying real estate collateral and (iii) national and regional economic factors. Interest income on performing loans is accrued as earned. A non-performing loan is placed on non-accrual status when it is probable that the borrower may be unable to meet interest payments as they become due. Generally, loans 90 days or more past due are placed on non-accrual status unless there is sufficient collateral to assure collectability of principal and interest. Upon the designation of non-accrual status, all unpaid accrued interest is reserved and charged against current income. Interest income on non-performing loans is generally recognized on a cash basis. Recognition of interest income on non-performing loans on an accrual basis is resumed when it is probable that the Company will be able to collect amounts due according to the contractual terms. The Company has determined that it has one portfolio segment, primarily represented by loans collateralized by real estate, whereby it determines, as needed, reserves for loan losses on an asset-specific basis. The reserve for loan losses reflects management's estimate of loan losses as of the balance sheet date. The reserve is increased through loan loss expense and is decreased by charge-offs when losses are confirmed through the receipt of assets such as cash or via ownership control of the underlying collateral in full satisfaction of the loan upon foreclosure or when significant collection efforts have ceased. The Company considers a loan to be impaired when, based upon current information and events, it is probable that the Company will be unable to collect all amounts due under the existing contractual terms. A reserve allowance is established for an impaired loan when the estimated fair value of the underlying collateral (for collateralized loans) or the present value of expected future cash flows is lower than the carrying value of the loan. An internal valuation is performed generally using the income approach to estimate the fair value of the collateral at the time a loan is determined to be impaired. The model is updated if circumstances indicate a significant change in value has occurred. The Company does not provide for an additional allowance for loan losses based on the grouping of loans as the Company believes the characteristics of the loans are not sufficiently similar to allow an evaluation of these loans as a group for a possible loan loss allowance. As such, all of the Company’s loans are evaluated individually for impairment purposes.
KIMCO REALTY CORPORATION AND SUBSIDIARIES
NOTES TO CONSOLIDATED FINANCIAL STATEMENTS (continued)
58
Cash and Cash Equivalents Cash and cash equivalents include demand deposits in banks, commercial paper and certificates of deposit with original maturities of three months or less. Cash and cash equivalent balances may, at a limited number of banks and financial institutions, exceed insurable amounts. The Company believes it mitigates risk by investing in or through major financial institutions and primarily in funds that are currently U.S. federal government insured up to applicable account limits. Recoverability of investments is dependent upon the performance of the issuers.
Marketable Securities The Company classifies its marketable equity securities as available-for-sale in accordance with the FASB’s Investments-Debt and Equity Securities guidance. These securities are carried at fair market value with unrealized gains and losses reported in stockholders’ equity as a component of Accumulated other comprehensive income ("AOCI"). Gains or losses on securities sold are based on the specific identification method and are recognized in Interest, dividends and other investment income on the Company’s Consolidated Statements of Income. All debt securities are generally classified as held-to-maturity because the Company has the positive intent and ability to hold the securities to maturity. It is more likely than not that the Company will not be required to sell the debt security before its anticipated recovery and the Company expects to recover the security’s entire amortized cost basis even if the entity does not intend to sell. Held-to-maturity securities are stated at amortized cost, adjusted for amortization of premiums and accretion of discounts to maturity. Debt securities which contain conversion features generally are classified as available-for-sale. On a continuous basis, management assesses whether there are any indicators that the value of the Company’s marketable securities may be impaired, which includes reviewing the underlying cause of any decline in value and the estimated recovery period, as well as the severity and duration of the decline. In the Company’s evaluation, the Company considers its ability and intent to hold these investments for a reasonable period of time sufficient for the Company to recover its cost basis. A marketable security is impaired if the fair value of the security is less than the carrying value of the security and such difference is deemed to be other-than-temporary. To the extent impairment has occurred, the loss shall be measured as the excess of the carrying amount of the security over the estimated fair value in the security. Deferred Leasing Costs Costs incurred in obtaining tenant leases, included in deferred charges and prepaid expenses in the accompanying Consolidated Balance Sheets, are amortized on a straight-line basis, over the terms of the related leases, as applicable. Such capitalized costs include salaries, lease incentives and related costs of personnel directly involved in successful leasing efforts. Software Development Costs Expenditures for major software purchases and software developed for internal use are capitalized and amortized on a straight-line basis generally over a 3 to 5 year period. The Company’s policy provides for the capitalization of external direct costs of materials and services associated with developing or obtaining internal use computer software. In addition, the Company also capitalizes certain payroll and payroll-related costs for employees who are directly associated with internal use computer software projects. The amount of capitalizable payroll costs with respect to these employees is limited to the time directly spent on such projects. Costs associated with preliminary project stage activities, training, maintenance and all other post-implementation stage activities are expensed as incurred. As of December 31, 2015 and 2014, the Company had unamortized software development costs of $16.1 million and $24.0 million, respectively, which is included in Other assets on the Company’s Consolidated Balance Sheets. The Company expensed $10.7 million, $9.2 million and $7.6 million in amortization of software development costs during the years ended December 31, 2015, 2014 and 2013, respectively.
KIMCO REALTY CORPORATION AND SUBSIDIARIES
NOTES TO CONSOLIDATED FINANCIAL STATEMENTS (continued)
59
Deferred Financing Costs Costs incurred in obtaining long-term financing, included in Notes Payable and Mortgages Payable in the accompanying Consolidated Balance Sheets, are amortized on a straight-line basis, which approximates the effective interest method, over the terms of the related debt agreements, as applicable. Revenue and Gain Recognition and Accounts Receivable Base rental revenues from rental property are recognized on a straight-line basis over the terms of the related leases. Certain of these leases also provide for percentage rents based upon the level of sales achieved by the lessee. These percentage rents are recognized once the required sales level is achieved. Rental income may also include payments received in connection with lease termination agreements. In addition, leases typically provide for reimbursement to the Company of common area maintenance costs, real estate taxes and other operating expenses. Operating expense reimbursements are recognized as earned.
Management and other fee income consists of property management fees, leasing fees, property acquisition and disposition fees, development fees and asset management fees. These fees arise from contractual agreements with third parties or with entities in which the Company has a noncontrolling interest. Management and other fee income, including acquisition and disposition fees, are recognized as earned under the respective agreements. Management and other fee income related to partially owned entities are recognized to the extent attributable to the unaffiliated interest. Gains and losses from the sale of depreciated operating property and ground-up development projects are recognized using the full accrual method in accordance with the FASB’s real estate sales guidance, provided that various criteria relating to the terms of sale and subsequent involvement by the Company with the properties are met. Gains and losses on transfers of operating properties result from the sale of a partial interest in properties to unconsolidated joint ventures and are recognized using the partial sale provisions of the FASB’s real estate sales guidance. The Company makes estimates of the uncollectability of its accounts receivable related to base rents, straight-line rent, expense reimbursements and other revenues. The Company analyzes accounts receivable and historical bad debt levels, customer credit worthiness and current economic trends when evaluating the adequacy of the allowance for doubtful accounts. In addition, tenants in bankruptcy are analyzed and estimates are made in connection with the expected recovery of pre-petition and post-petition claims. The Company’s reported net earnings are directly affected by management’s estimate of the collectability of accounts receivable. Accounts and notes receivable in the accompanying Consolidated Balance Sheets are net of estimated unrecoverable amounts of $13.9 million and $10.4 million of billed accounts receivable at December 31, 2015 and 2014, respectively. Additionally, Accounts and notes receivable in the accompanying Consolidated Balance Sheets are net of estimated unrecoverable amounts of $17.9 million and $22.9 million of straight-line rent receivable at December 31, 2015 and 2014, respectively. Income Taxes The Company has made an election to qualify, and believes it is operating so as to qualify, as a REIT for federal income tax purposes. Accordingly, the Company generally will not be subject to federal income tax, provided that distributions to its stockholders equal at least the amount of its REIT taxable income as defined under Section 856 through 860 of the Code. In connection with the RMA, which became effective January 1, 2001, the Company is permitted to participate in certain activities which it was previously precluded from in order to maintain its qualification as a REIT, so long as these activities are conducted by entities which elect to be treated as taxable REIT subsidiaries under the Code. As such, the Company is subject to federal and state income taxes on the income from these activities. The Company is also subject to local taxes on certain non-U.S. investments.
KIMCO REALTY CORPORATION AND SUBSIDIARIES
NOTES TO CONSOLIDATED FINANCIAL STATEMENTS (continued)
60
Income taxes are accounted for under the asset and liability method. Deferred tax assets and liabilities are recognized for the estimated future tax consequences attributable to differences between the financial statement carrying amounts of existing assets and liabilities and their respective tax bases and operating loss and tax credit carry-forwards. Deferred tax assets and liabilities are measured using enacted tax rates in effect for the year in which those temporary differences are expected to be recovered or settled. The Company provides a valuation allowance for deferred tax assets for which it does not consider realization of such assets to be more likely than not. The Company reviews the need to establish a valuation allowance against deferred tax assets on a quarterly basis. The review includes an analysis of various factors, such as future reversals of existing taxable temporary differences, the capacity for the carryback or carryforward of any losses, the expected occurrence of future income or loss and available tax planning strategies. The Company applies the FASB’s guidance relating to uncertainty in income taxes recognized in a Company’s financial statements. Under this guidance the Company may recognize the tax benefit from an uncertain tax position only if it is more likely than not that the tax position will be sustained on examination by taxing authorities, based on the technical merits of the position. The tax benefits recognized in the financial statements from such a position are measured based on the largest benefit that has a greater than fifty percent likelihood of being realized upon ultimate settlement. The guidance on accounting for uncertainty in income taxes also provides guidance on de-recognition, classification, interest and penalties on income taxes, and accounting in interim periods.
Foreign Currency Translation and Transactions Assets and liabilities of the Company’s foreign operations are translated using year-end exchange rates, and revenues and expenses are translated using exchange rates as determined throughout the year. Gains or losses resulting from translation are included in AOCI, as a separate component of the Company’s stockholders’ equity. Gains or losses resulting from foreign currency transactions are translated to local currency at the rates of exchange prevailing at the dates of the transactions. The effect of the transactions gain or loss is included in the caption Other income/(expense), net in the Consolidated Statements of Income. The Company is required to release cumulative translation adjustment (“CTA”) balances into earnings when the Company has substantially liquidated its investment in a foreign entity. Derivative/Financial Instruments The Company is exposed to certain risks arising from both its business operations and economic conditions. The Company principally manages its exposures to a wide variety of business and operational risk through management of its core business activities. The Company manages economic risks, including interest rate, liquidity, and credit risk primarily by managing the amount, sources, and duration of its debt funding and the use of derivative financial instruments. Specifically, the Company may use derivatives to manage exposures that arise from changes in interest rates, foreign currency exchange rate fluctuations and market value fluctuations of equity securities. The Company limits these risks by following established risk management policies and procedures including the use of derivatives. The Company measures its derivative instruments at fair value and records them in the Consolidated Balance Sheet as an asset or liability, depending on the Company’s rights or obligations under the applicable derivative contract. The accounting for changes in the fair value of the derivatives depends on the intended use of the derivative, whether the Company has elected to designate a derivative in a hedging relationship and apply hedge accounting and whether the hedging relationship has satisfied the criteria necessary to apply hedge accounting. Derivatives designated and qualifying as a hedge of the exposure to changes in the fair value of an asset, liability, or firm commitment attributable to a particular risk, such as interest rate risk, are considered fair value hedges. Derivatives designated and qualifying as a hedge of the exposure to variability in expected future cash flows, or other types of forecasted transactions, are considered cash flow hedges. Derivatives may also be designated as hedges of the foreign currency exposure of a net investment in a foreign operation. Hedge accounting generally provides for the matching of the timing of gain or loss recognition on the hedging instrument with the recognition of the changes in the fair value of the hedged asset or liability that are attributable to the hedged risk in a fair value hedge or the earnings effect of the hedged forecasted transactions in a cash flow hedge. The Company may enter into derivative contracts that are intended to economically hedge certain of its risk, even though hedge accounting does not apply or the Company elects not to apply hedge accounting under the Derivatives and Hedging guidance issued by the FASB.
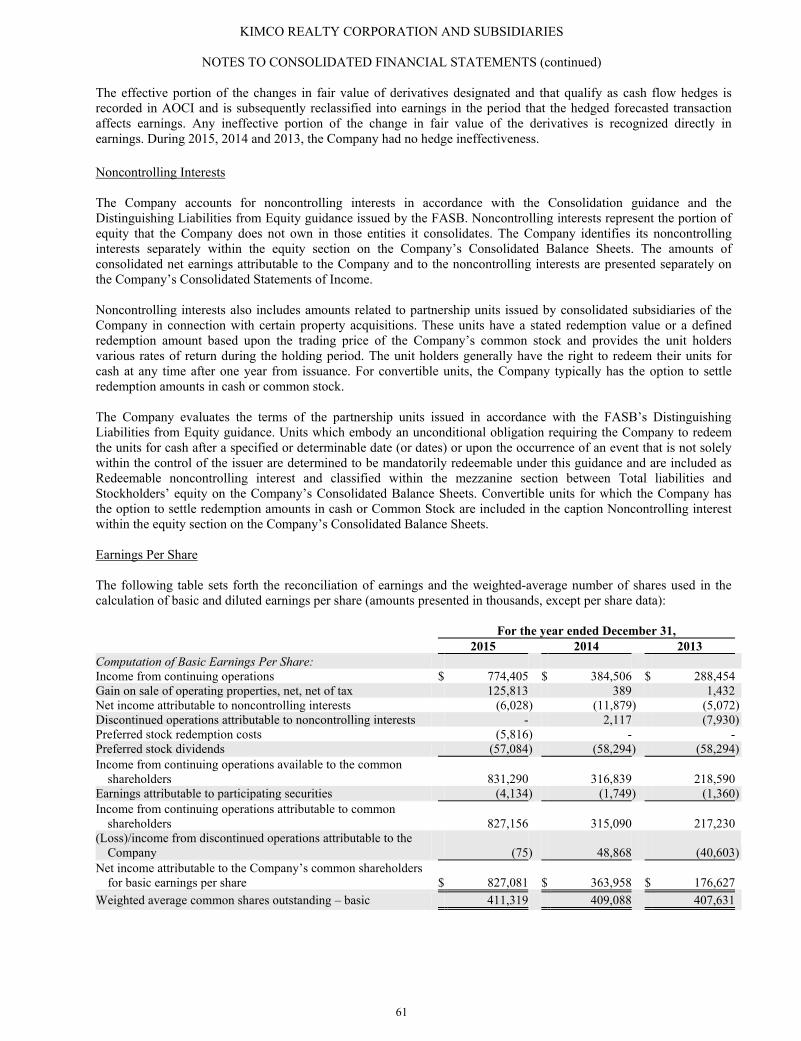
KIMCO REALTY CORPORATION AND SUBSIDIARIES
NOTES TO CONSOLIDATED FINANCIAL STATEMENTS (continued)
61
The effective portion of the changes in fair value of derivatives designated and that qualify as cash flow hedges is recorded in AOCI and is subsequently reclassified into earnings in the period that the hedged forecasted transaction affects earnings. Any ineffective portion of the change in fair value of the derivatives is recognized directly in earnings. During 2015, 2014 and 2013, the Company had no hedge ineffectiveness. Noncontrolling Interests The Company accounts for noncontrolling interests in accordance with the Consolidation guidance and the Distinguishing Liabilities from Equity guidance issued by the FASB. Noncontrolling interests represent the portion of equity that the Company does not own in those entities it consolidates. The Company identifies its noncontrolling interests separately within the equity section on the Company’s Consolidated Balance Sheets. The amounts of consolidated net earnings attributable to the Company and to the noncontrolling interests are presented separately on the Company’s Consolidated Statements of Income. Noncontrolling interests also includes amounts related to partnership units issued by consolidated subsidiaries of the Company in connection with certain property acquisitions. These units have a stated redemption value or a defined redemption amount based upon the trading price of the Company’s common stock and provides the unit holders various rates of return during the holding period. The unit holders generally have the right to redeem their units for cash at any time after one year from issuance. For convertible units, the Company typically has the option to settle redemption amounts in cash or common stock.
The Company evaluates the terms of the partnership units issued in accordance with the FASB’s Distinguishing Liabilities from Equity guidance. Units which embody an unconditional obligation requiring the Company to redeem the units for cash after a specified or determinable date (or dates) or upon the occurrence of an event that is not solely within the control of the issuer are determined to be mandatorily redeemable under this guidance and are included as Redeemable noncontrolling interest and classified within the mezzanine section between Total liabilities and Stockholders’ equity on the Company’s Consolidated Balance Sheets. Convertible units for which the Company has the option to settle redemption amounts in cash or Common Stock are included in the caption Noncontrolling interest within the equity section on the Company’s Consolidated Balance Sheets. Earnings Per Share The following table sets forth the reconciliation of earnings and the weighted-average number of shares used in the calculation of basic and diluted earnings per share (amounts presented in thousands, except per share data):
For the year ended December 31, 2015 2014 2013 Computation of Basic Earnings Per Share: Income from continuing operations $ 774,405 $ 384,506 $ 288,454 Gain on sale of operating properties, net, net of tax 125,813 389 1,432 Net income attributable to noncontrolling interests (6,028) (11,879) (5,072)Discontinued operations attributable to noncontrolling interests - 2,117 (7,930)Preferred stock redemption costs (5,816) - - Preferred stock dividends (57,084) (58,294) (58,294)Income from continuing operations available to the common
shareholders 831,290 316,839 218,590 Earnings attributable to participating securities (4,134) (1,749) (1,360)Income from continuing operations attributable to common
shareholders 827,156 315,090 217,230 (Loss)/income from discontinued operations attributable to the
Company (75) 48,868 (40,603)Net income attributable to the Company’s common shareholders
for basic earnings per share $ 827,081 $ 363,958 $ 176,627 Weighted average common shares outstanding – basic 411,319 409,088 407,631
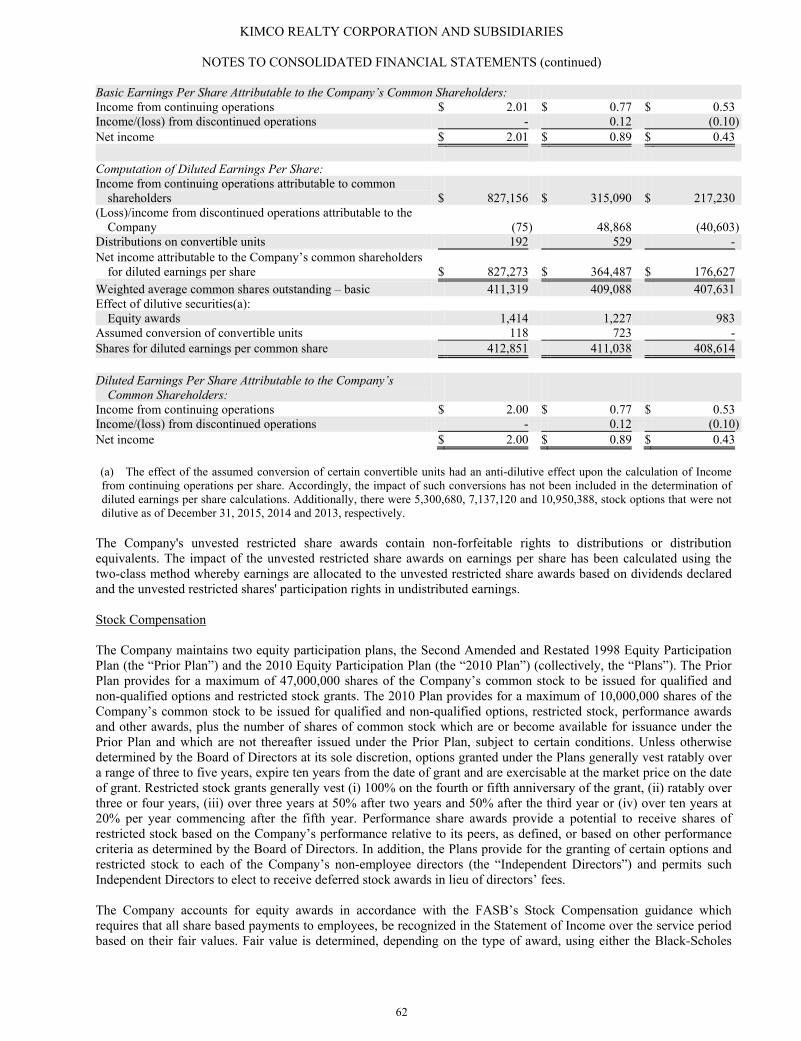
KIMCO REALTY CORPORATION AND SUBSIDIARIES
NOTES TO CONSOLIDATED FINANCIAL STATEMENTS (continued)
62
Basic Earnings Per Share Attributable to the Company’s Common Shareholders: Income from continuing operations $ 2.01 $ 0.77 $ 0.53 Income/(loss) from discontinued operations - 0.12 (0.10)Net income $ 2.01 $ 0.89 $ 0.43 Computation of Diluted Earnings Per Share: Income from continuing operations attributable to common
shareholders $ 827,156 $ 315,090 $ 217,230 (Loss)/income from discontinued operations attributable to the
Company (75) 48,868 (40,603)Distributions on convertible units 192 529 - Net income attributable to the Company’s common shareholders
for diluted earnings per share $ 827,273 $ 364,487 $ 176,627 Weighted average common shares outstanding – basic 411,319 409,088 407,631 Effect of dilutive securities(a):
Equity awards 1,414 1,227 983 Assumed conversion of convertible units 118 723 - Shares for diluted earnings per common share 412,851 411,038 408,614 Diluted Earnings Per Share Attributable to the Company’s
Common Shareholders: Income from continuing operations $ 2.00 $ 0.77 $ 0.53 Income/(loss) from discontinued operations - 0.12 (0.10)Net income $ 2.00 $ 0.89 $ 0.43
(a) The effect of the assumed conversion of certain convertible units had an anti-dilutive effect upon the calculation of Income from continuing operations per share. Accordingly, the impact of such conversions has not been included in the determination of diluted earnings per share calculations. Additionally, there were 5,300,680, 7,137,120 and 10,950,388, stock options that were not dilutive as of December 31, 2015, 2014 and 2013, respectively.
The Company's unvested restricted share awards contain non-forfeitable rights to distributions or distribution equivalents. The impact of the unvested restricted share awards on earnings per share has been calculated using the two-class method whereby earnings are allocated to the unvested restricted share awards based on dividends declared and the unvested restricted shares' participation rights in undistributed earnings. Stock Compensation The Company maintains two equity participation plans, the Second Amended and Restated 1998 Equity Participation Plan (the “Prior Plan”) and the 2010 Equity Participation Plan (the “2010 Plan”) (collectively, the “Plans”). The Prior Plan provides for a maximum of 47,000,000 shares of the Company’s common stock to be issued for qualified and non-qualified options and restricted stock grants. The 2010 Plan provides for a maximum of 10,000,000 shares of the Company’s common stock to be issued for qualified and non-qualified options, restricted stock, performance awards and other awards, plus the number of shares of common stock which are or become available for issuance under the Prior Plan and which are not thereafter issued under the Prior Plan, subject to certain conditions. Unless otherwise determined by the Board of Directors at its sole discretion, options granted under the Plans generally vest ratably over a range of three to five years, expire ten years from the date of grant and are exercisable at the market price on the date of grant. Restricted stock grants generally vest (i) 100% on the fourth or fifth anniversary of the grant, (ii) ratably over three or four years, (iii) over three years at 50% after two years and 50% after the third year or (iv) over ten years at 20% per year commencing after the fifth year. Performance share awards provide a potential to receive shares of restricted stock based on the Company’s performance relative to its peers, as defined, or based on other performance criteria as determined by the Board of Directors. In addition, the Plans provide for the granting of certain options and restricted stock to each of the Company’s non-employee directors (the “Independent Directors”) and permits such Independent Directors to elect to receive deferred stock awards in lieu of directors’ fees. The Company accounts for equity awards in accordance with the FASB’s Stock Compensation guidance which requires that all share based payments to employees, be recognized in the Statement of Income over the service period based on their fair values. Fair value is determined, depending on the type of award, using either the Black-Scholes
KIMCO REALTY CORPORATION AND SUBSIDIARIES
NOTES TO CONSOLIDATED FINANCIAL STATEMENTS (continued)
63
option pricing formula or the Monte Carlo method, both of which are intended to estimate the fair value of the awards at the grant date (see Footnote 20 for additional disclosure on the assumptions and methodology). New Accounting Pronouncements In February 2016, the FASB issued Accounting Standards Update (“ASU”) 2016-02, Leases (Topic 842) (“ASU 2016-02”), which sets out the principles for the recognition, measurement, presentation and disclosure of leases for both parties to a contract (i.e., lessees and lessors). The new standard requires lessees to apply a dual approach, classifying leases as either finance or operating leases based on the principle of whether or not the lease is effectively a financed purchase by the lessee. This classification will determine whether lease expense is recognized based on an effective interest method or on a straight-line basis over the term of the lease. A lessee is also required to record a right-of-use asset and a lease liability for all leases with a term of greater than 12 months regardless of their classification. Leases with a term of 12 months or less will be accounted for similar to existing guidance for operating leases today. The new standard requires lessors to account for leases using an approach that is substantially equivalent to existing guidance for sales-type leases, direct financing leases and operating leases. The ASU is expected to impact the Company’s consolidated financial statements as the Company has certain operating and land lease arrangements for which it is the lessee. ASU 2016-02 supersedes the previous leases standard, Leases (Topic 840). The standard is effective on January 1, 2019, with early adoption permitted. The Company is currently in the process of evaluating the impact the adoption of ASU 2016-02 will have on the Company’s financial position or results of operations.
In September 2015, the FASB issued ASU 2015-16, Simplifying the Accounting for Measurement-Period Adjustments (“ASU 2015-16”), which eliminates the requirement to restate prior period financial statements for measurement period adjustments. The new guidance requires that the cumulative impact of a measurement period adjustment (including the impact on prior periods) be recognized in the reporting period in which the adjustment is identified. ASU 2015-16 is effective for interim and annual periods beginning after December 15, 2015. Early adoption is permitted. The Company elected to early adopt ASU 2015-16 beginning in its third quarter ended September 30, 2015 (see Footnote 2). The adoption of ASU 2015-16 did not have a material impact on the Company’s financial position or results of operations. In April 2015, the FASB issued ASU 2015-03, Interest - Imputation of Interest (Topic 835): Simplifying the Presentation of Debt Issuance Costs (“ASU 2015-03”). The amendments in ASU 2015-03 require that debt issuance costs related to a recognized debt liability be presented in the balance sheet as a direct deduction from the carrying amount of that debt liability, consistent with debt discounts. The recognition and measurement guidance for debt issuance costs are not affected by the amendments in this update. The amendments in ASU 2015-03 are effective for fiscal years beginning after December 15, 2015. Early adoption is permitted. In August 2015, the FASB issued ASU 2015-15: Presentation and Subsequent Measurement of Debt Issuance Costs Associated with Line-of-Credit Arrangements (“ASU 2015-15”) providing guidance regarding the presentation and subsequent measurement of debt issuance costs related to line-of-credit arrangements. Given the absence of authoritative guidance on this matter, the SEC staff has stated that it would not object to an entity deferring and presenting debt issuance costs as an asset and subsequently amortizing the deferred debt issuance costs ratably over the term of the line-of-credit arrangement, regardless of whether there are any outstanding borrowings on that line-of-credit arrangement. Beginning in its fiscal year 2015, the Company elected to early adopt ASU 2015-03 and ASU 2015-15 and retrospectively applied the guidance to its Notes Payable and Mortgages Payable for all periods presented. Unamortized debt issuance costs of $31.4 million and $3.2 million are included in Notes Payable and Mortgages Payable, respectively, as of December 31, 2015, and $20.5 million and $3.9 million of unamortized debt issuance costs are included in Notes Payable and Mortgages Payable, respectively, as of December 31, 2014 (previously included in Other assets on the Company’s Consolidated Balance Sheets). The adoption of ASU 2015-03 and ASU 2015-15 did not have a material impact on the Company’s financial position or results of operations (see Footnotes 12 and 13).
In February 2015, the FASB issued ASU 2015-02, Consolidation (Topic 810): Amendments to the Consolidation Analysis (“ASU 2015-02”). ASU 2015-02 focuses to minimize situations under previously existing guidance in which a reporting entity was required to consolidate another legal entity in which that reporting entity did not have: (1) the ability through contractual rights to act primarily on its own behalf; (2) ownership of the majority of the legal entity's voting rights; or (3) the exposure to a majority of the legal entity's economic benefits. ASU 2015-02 affects reporting entities that are required to evaluate whether they should consolidate certain legal entities. All legal entities are subject to reevaluation under the revised consolidation model. ASU 2015-02 will be effective for periods beginning after
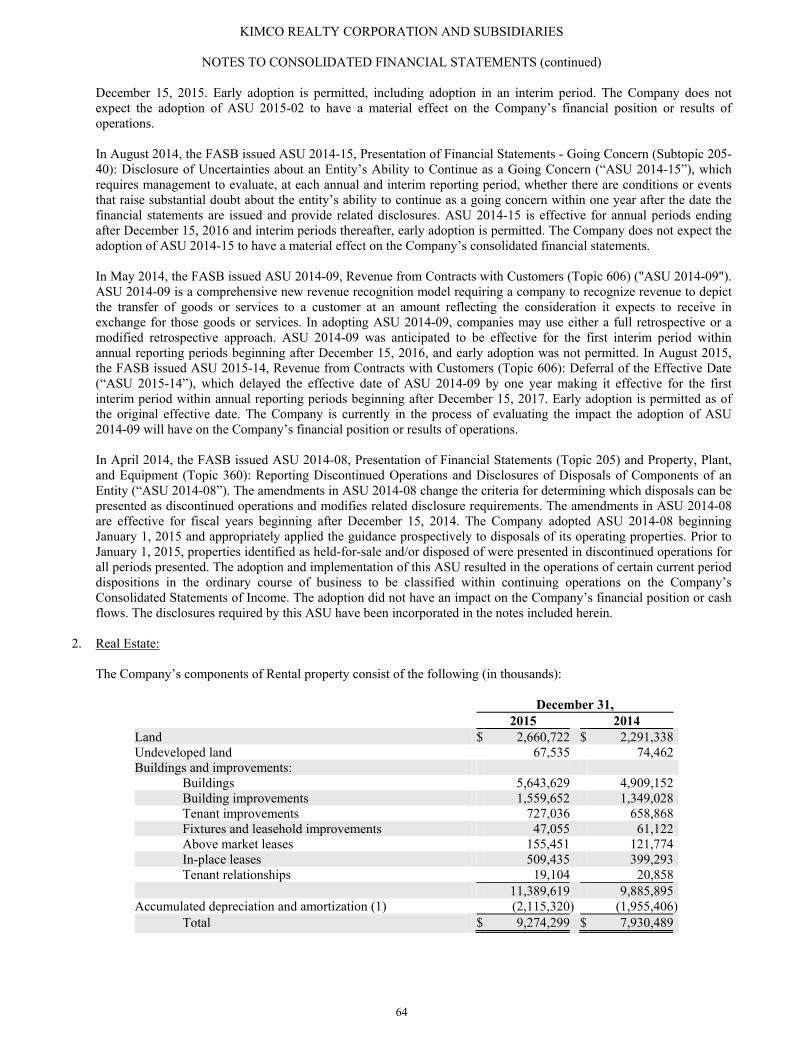
KIMCO REALTY CORPORATION AND SUBSIDIARIES
NOTES TO CONSOLIDATED FINANCIAL STATEMENTS (continued)
64
December 15, 2015. Early adoption is permitted, including adoption in an interim period. The Company does not expect the adoption of ASU 2015-02 to have a material effect on the Company’s financial position or results of operations. In August 2014, the FASB issued ASU 2014-15, Presentation of Financial Statements - Going Concern (Subtopic 205-40): Disclosure of Uncertainties about an Entity’s Ability to Continue as a Going Concern (“ASU 2014-15”), which requires management to evaluate, at each annual and interim reporting period, whether there are conditions or events that raise substantial doubt about the entity’s ability to continue as a going concern within one year after the date the financial statements are issued and provide related disclosures. ASU 2014-15 is effective for annual periods ending after December 15, 2016 and interim periods thereafter, early adoption is permitted. The Company does not expect the adoption of ASU 2014-15 to have a material effect on the Company’s consolidated financial statements. In May 2014, the FASB issued ASU 2014-09, Revenue from Contracts with Customers (Topic 606) ("ASU 2014-09"). ASU 2014-09 is a comprehensive new revenue recognition model requiring a company to recognize revenue to depict the transfer of goods or services to a customer at an amount reflecting the consideration it expects to receive in exchange for those goods or services. In adopting ASU 2014-09, companies may use either a full retrospective or a modified retrospective approach. ASU 2014-09 was anticipated to be effective for the first interim period within annual reporting periods beginning after December 15, 2016, and early adoption was not permitted. In August 2015, the FASB issued ASU 2015-14, Revenue from Contracts with Customers (Topic 606): Deferral of the Effective Date (“ASU 2015-14”), which delayed the effective date of ASU 2014-09 by one year making it effective for the first interim period within annual reporting periods beginning after December 15, 2017. Early adoption is permitted as of the original effective date. The Company is currently in the process of evaluating the impact the adoption of ASU 2014-09 will have on the Company’s financial position or results of operations. In April 2014, the FASB issued ASU 2014-08, Presentation of Financial Statements (Topic 205) and Property, Plant, and Equipment (Topic 360): Reporting Discontinued Operations and Disclosures of Disposals of Components of an Entity (“ASU 2014-08”). The amendments in ASU 2014-08 change the criteria for determining which disposals can be presented as discontinued operations and modifies related disclosure requirements. The amendments in ASU 2014-08 are effective for fiscal years beginning after December 15, 2014. The Company adopted ASU 2014-08 beginning January 1, 2015 and appropriately applied the guidance prospectively to disposals of its operating properties. Prior to January 1, 2015, properties identified as held-for-sale and/or disposed of were presented in discontinued operations for all periods presented. The adoption and implementation of this ASU resulted in the operations of certain current period dispositions in the ordinary course of business to be classified within continuing operations on the Company’s Consolidated Statements of Income. The adoption did not have an impact on the Company’s financial position or cash flows. The disclosures required by this ASU have been incorporated in the notes included herein.
2. Real Estate:
The Company’s components of Rental property consist of the following (in thousands):
December 31, 2015 2014 Land $ 2,660,722 $ 2,291,338 Undeveloped land 67,535 74,462 Buildings and improvements:
Buildings 5,643,629 4,909,152 Building improvements 1,559,652 1,349,028 Tenant improvements 727,036 658,868 Fixtures and leasehold improvements 47,055 61,122 Above market leases 155,451 121,774 In-place leases 509,435 399,293 Tenant relationships 19,104 20,858
11,389,619 9,885,895 Accumulated depreciation and amortization (1) (2,115,320) (1,955,406)
Total $ 9,274,299 $ 7,930,489
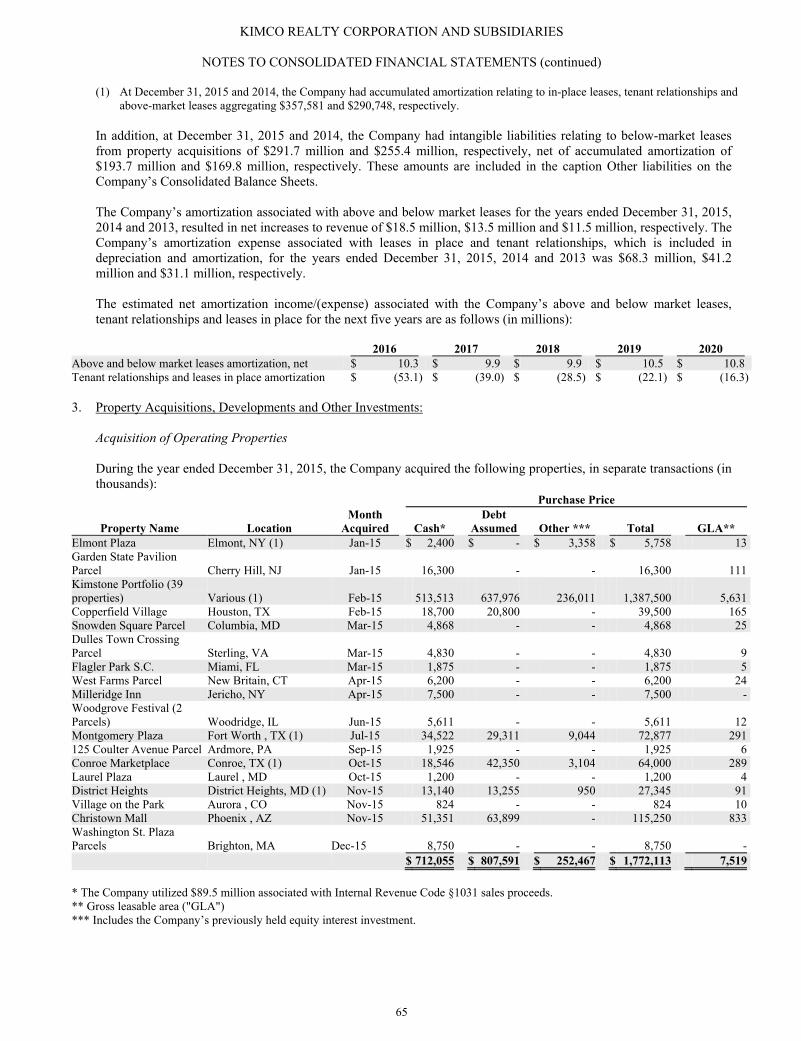
KIMCO REALTY CORPORATION AND SUBSIDIARIES
NOTES TO CONSOLIDATED FINANCIAL STATEMENTS (continued)
65
(1) At December 31, 2015 and 2014, the Company had accumulated amortization relating to in-place leases, tenant relationships and above-market leases aggregating $357,581 and $290,748, respectively.
In addition, at December 31, 2015 and 2014, the Company had intangible liabilities relating to below-market leases from property acquisitions of $291.7 million and $255.4 million, respectively, net of accumulated amortization of $193.7 million and $169.8 million, respectively. These amounts are included in the caption Other liabilities on the Company’s Consolidated Balance Sheets. The Company’s amortization associated with above and below market leases for the years ended December 31, 2015, 2014 and 2013, resulted in net increases to revenue of $18.5 million, $13.5 million and $11.5 million, respectively. The Company’s amortization expense associated with leases in place and tenant relationships, which is included in depreciation and amortization, for the years ended December 31, 2015, 2014 and 2013 was $68.3 million, $41.2 million and $31.1 million, respectively. The estimated net amortization income/(expense) associated with the Company’s above and below market leases, tenant relationships and leases in place for the next five years are as follows (in millions):
2016 2017 2018 2019 2020 Above and below market leases amortization, net $ 10.3 $ 9.9 $ 9.9 $ 10.5 $ 10.8 Tenant relationships and leases in place amortization $ (53.1) $ (39.0) $ (28.5) $ (22.1) $ (16.3)
3. Property Acquisitions, Developments and Other Investments:
Acquisition of Operating Properties During the year ended December 31, 2015, the Company acquired the following properties, in separate transactions (in thousands):
Purchase Price
Property Name Location Month
Acquired Cash* Debt
Assumed
Other *** Total GLA** Elmont Plaza Elmont, NY (1) Jan-15 $ 2,400 $ - $ 3,358 $ 5,758 13 Garden State Pavilion Parcel Cherry Hill, NJ Jan-15 16,300 - - 16,300 111 Kimstone Portfolio (39 properties) Various (1) Feb-15 513,513 637,976 236,011 1,387,500 5,631 Copperfield Village Houston, TX Feb-15 18,700 20,800 - 39,500 165 Snowden Square Parcel Columbia, MD Mar-15 4,868 - - 4,868 25 Dulles Town Crossing Parcel Sterling, VA Mar-15 4,830 - - 4,830 9 Flagler Park S.C. Miami, FL Mar-15 1,875 - - 1,875 5 West Farms Parcel New Britain, CT Apr-15 6,200 - - 6,200 24 Milleridge Inn Jericho, NY Apr-15 7,500 - - 7,500 - Woodgrove Festival (2 Parcels) Woodridge, IL Jun-15 5,611 - - 5,611 12 Montgomery Plaza Fort Worth , TX (1) Jul-15 34,522 29,311 9,044 72,877 291 125 Coulter Avenue Parcel Ardmore, PA Sep-15 1,925 - - 1,925 6 Conroe Marketplace Conroe, TX (1) Oct-15 18,546 42,350 3,104 64,000 289 Laurel Plaza Laurel , MD Oct-15 1,200 - - 1,200 4 District Heights District Heights, MD (1) Nov-15 13,140 13,255 950 27,345 91 Village on the Park Aurora , CO Nov-15 824 - - 824 10 Christown Mall Phoenix , AZ Nov-15 51,351 63,899 - 115,250 833 Washington St. Plaza Parcels Brighton, MA Dec-15 8,750 - - 8,750 - $ 712,055 $ 807,591 $ 252,467 $ 1,772,113 7,519 * The Company utilized $89.5 million associated with Internal Revenue Code §1031 sales proceeds. ** Gross leasable area ("GLA") *** Includes the Company’s previously held equity interest investment.
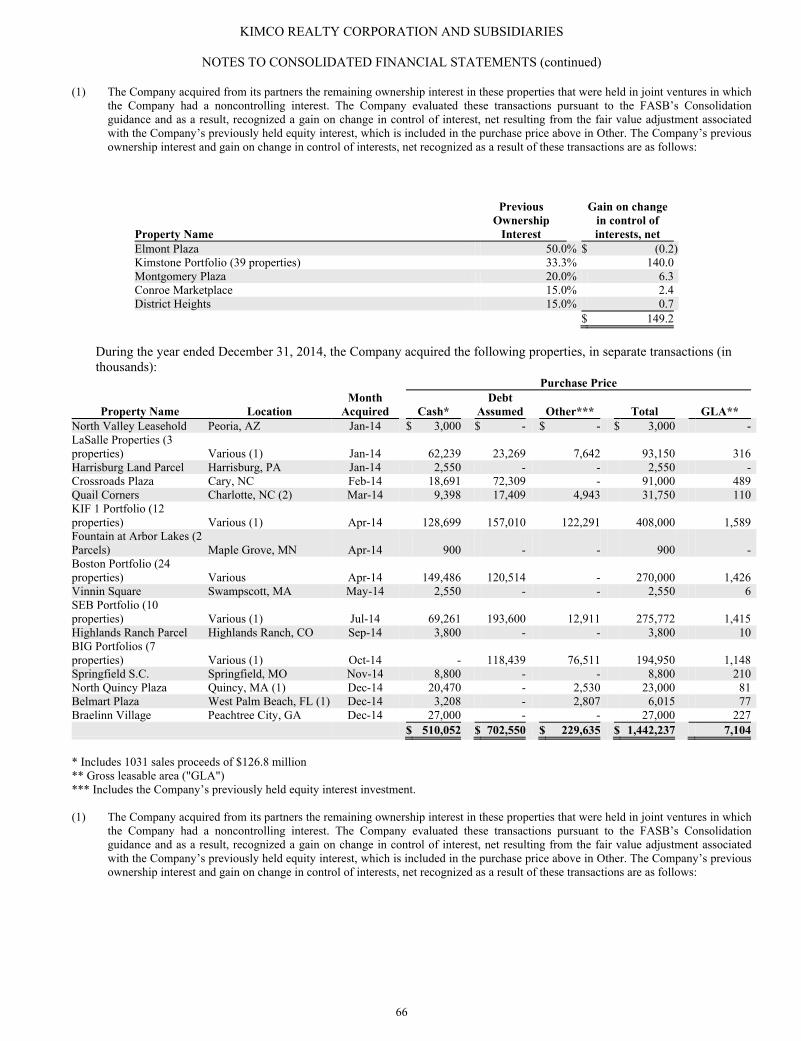
KIMCO REALTY CORPORATION AND SUBSIDIARIES
NOTES TO CONSOLIDATED FINANCIAL STATEMENTS (continued)
66
(1) The Company acquired from its partners the remaining ownership interest in these properties that were held in joint ventures in which the Company had a noncontrolling interest. The Company evaluated these transactions pursuant to the FASB’s Consolidationguidance and as a result, recognized a gain on change in control of interest, net resulting from the fair value adjustment associated with the Company’s previously held equity interest, which is included in the purchase price above in Other. The Company’s previousownership interest and gain on change in control of interests, net recognized as a result of these transactions are as follows:
Property Name
Previous Ownership
Interest
Gain on change in control of interests, net
Elmont Plaza 50.0% $ (0.2)Kimstone Portfolio (39 properties) 33.3% 140.0 Montgomery Plaza 20.0% 6.3 Conroe Marketplace 15.0% 2.4 District Heights 15.0% 0.7 $ 149.2
During the year ended December 31, 2014, the Company acquired the following properties, in separate transactions (in thousands):
Purchase Price
Property Name Location Month
Acquired Cash* Debt
Assumed Other*** Total GLA** North Valley Leasehold Peoria, AZ Jan-14 $ 3,000 $ - $ - $ 3,000 - LaSalle Properties (3 properties) Various (1) Jan-14 62,239 23,269 7,642 93,150 316 Harrisburg Land Parcel Harrisburg, PA Jan-14 2,550 - - 2,550 - Crossroads Plaza Cary, NC Feb-14 18,691 72,309 - 91,000 489 Quail Corners Charlotte, NC (2) Mar-14 9,398 17,409 4,943 31,750 110 KIF 1 Portfolio (12 properties) Various (1) Apr-14 128,699 157,010 122,291 408,000 1,589 Fountain at Arbor Lakes (2 Parcels) Maple Grove, MN Apr-14 900 - - 900 - Boston Portfolio (24 properties) Various Apr-14 149,486 120,514 - 270,000 1,426 Vinnin Square Swampscott, MA May-14 2,550 - - 2,550 6 SEB Portfolio (10 properties) Various (1) Jul-14 69,261 193,600 12,911 275,772 1,415 Highlands Ranch Parcel Highlands Ranch, CO Sep-14 3,800 - - 3,800 10 BIG Portfolios (7 properties) Various (1) Oct-14 - 118,439 76,511 194,950 1,148 Springfield S.C. Springfield, MO Nov-14 8,800 - - 8,800 210 North Quincy Plaza Quincy, MA (1) Dec-14 20,470 - 2,530 23,000 81 Belmart Plaza West Palm Beach, FL (1) Dec-14 3,208 - 2,807 6,015 77 Braelinn Village Peachtree City, GA Dec-14 27,000 - - 27,000 227 $ 510,052 $ 702,550 $ 229,635 $ 1,442,237 7,104 * Includes 1031 sales proceeds of $126.8 million ** Gross leasable area ("GLA") *** Includes the Company’s previously held equity interest investment. (1) The Company acquired from its partners the remaining ownership interest in these properties that were held in joint ventures in which
the Company had a noncontrolling interest. The Company evaluated these transactions pursuant to the FASB’s Consolidation guidance and as a result, recognized a gain on change in control of interest, net resulting from the fair value adjustment associated with the Company’s previously held equity interest, which is included in the purchase price above in Other. The Company’s previous ownership interest and gain on change in control of interests, net recognized as a result of these transactions are as follows:
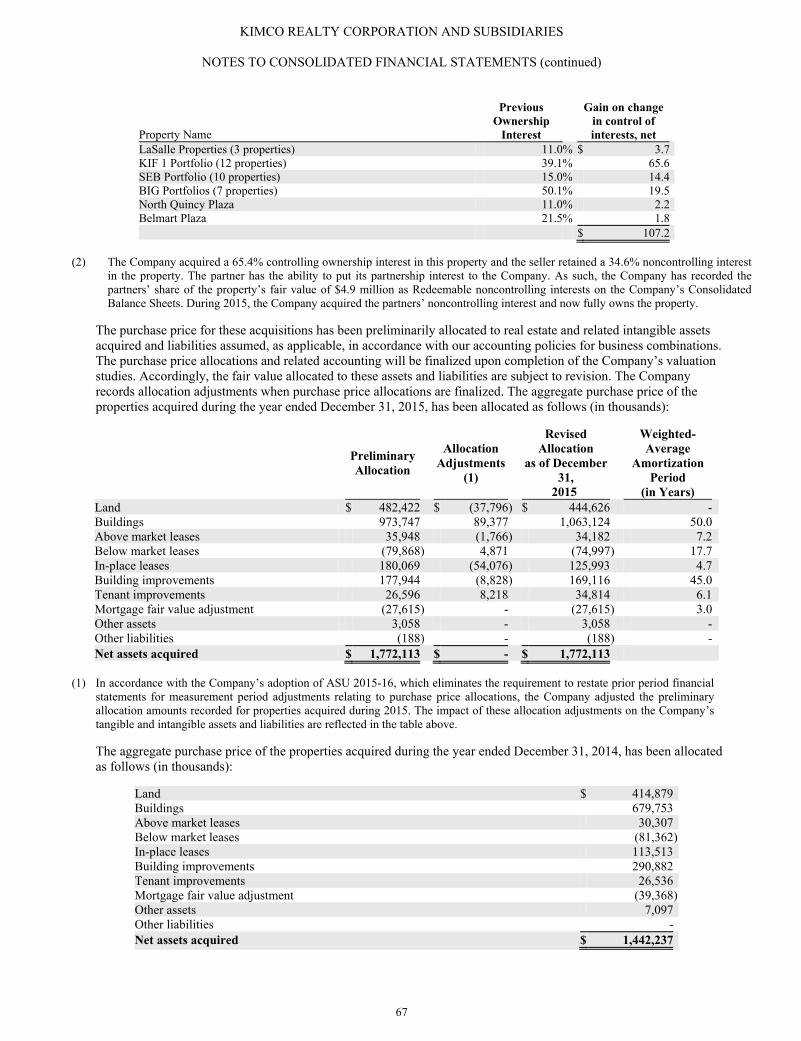
KIMCO REALTY CORPORATION AND SUBSIDIARIES
NOTES TO CONSOLIDATED FINANCIAL STATEMENTS (continued)
67
Property Name
Previous Ownership
Interest
Gain on changein control of interests, net
LaSalle Properties (3 properties) 11.0% $ 3.7 KIF 1 Portfolio (12 properties) 39.1% 65.6 SEB Portfolio (10 properties) 15.0% 14.4 BIG Portfolios (7 properties) 50.1% 19.5 North Quincy Plaza 11.0% 2.2 Belmart Plaza 21.5% 1.8 $ 107.2
(2) The Company acquired a 65.4% controlling ownership interest in this property and the seller retained a 34.6% noncontrolling interest
in the property. The partner has the ability to put its partnership interest to the Company. As such, the Company has recorded thepartners’ share of the property’s fair value of $4.9 million as Redeemable noncontrolling interests on the Company’s Consolidated Balance Sheets. During 2015, the Company acquired the partners’ noncontrolling interest and now fully owns the property.
The purchase price for these acquisitions has been preliminarily allocated to real estate and related intangible assets acquired and liabilities assumed, as applicable, in accordance with our accounting policies for business combinations. The purchase price allocations and related accounting will be finalized upon completion of the Company’s valuation studies. Accordingly, the fair value allocated to these assets and liabilities are subject to revision. The Company records allocation adjustments when purchase price allocations are finalized. The aggregate purchase price of the properties acquired during the year ended December 31, 2015, has been allocated as follows (in thousands):
Preliminary Allocation
Allocation Adjustments
(1)
Revised Allocation
as of December 31,
2015
Weighted-Average
Amortization Period
(in Years)
Land $ 482,422 $ (37,796) $ 444,626 - Buildings 973,747 89,377 1,063,124 50.0 Above market leases 35,948 (1,766) 34,182 7.2 Below market leases (79,868) 4,871 (74,997) 17.7 In-place leases 180,069 (54,076) 125,993 4.7 Building improvements 177,944 (8,828) 169,116 45.0 Tenant improvements 26,596 8,218 34,814 6.1 Mortgage fair value adjustment (27,615) - (27,615) 3.0 Other assets 3,058 - 3,058 - Other liabilities (188) - (188) - Net assets acquired $ 1,772,113 $ - $ 1,772,113
(1) In accordance with the Company’s adoption of ASU 2015-16, which eliminates the requirement to restate prior period financial
statements for measurement period adjustments relating to purchase price allocations, the Company adjusted the preliminary allocation amounts recorded for properties acquired during 2015. The impact of these allocation adjustments on the Company’stangible and intangible assets and liabilities are reflected in the table above. The aggregate purchase price of the properties acquired during the year ended December 31, 2014, has been allocated as follows (in thousands):
Land $ 414,879 Buildings 679,753 Above market leases 30,307 Below market leases (81,362)In-place leases 113,513 Building improvements 290,882 Tenant improvements 26,536 Mortgage fair value adjustment (39,368)Other assets 7,097 Other liabilities - Net assets acquired $ 1,442,237
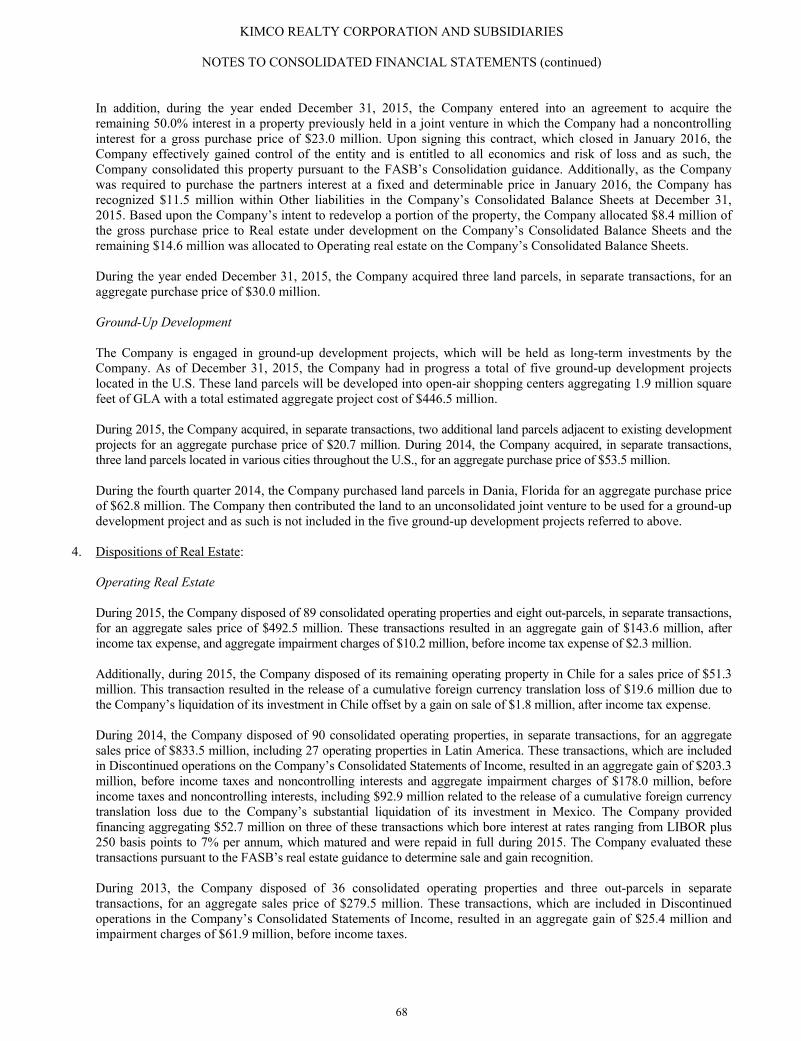
KIMCO REALTY CORPORATION AND SUBSIDIARIES
NOTES TO CONSOLIDATED FINANCIAL STATEMENTS (continued)
68
In addition, during the year ended December 31, 2015, the Company entered into an agreement to acquire the remaining 50.0% interest in a property previously held in a joint venture in which the Company had a noncontrolling interest for a gross purchase price of $23.0 million. Upon signing this contract, which closed in January 2016, the Company effectively gained control of the entity and is entitled to all economics and risk of loss and as such, the Company consolidated this property pursuant to the FASB’s Consolidation guidance. Additionally, as the Company was required to purchase the partners interest at a fixed and determinable price in January 2016, the Company has recognized $11.5 million within Other liabilities in the Company’s Consolidated Balance Sheets at December 31, 2015. Based upon the Company’s intent to redevelop a portion of the property, the Company allocated $8.4 million of the gross purchase price to Real estate under development on the Company’s Consolidated Balance Sheets and the remaining $14.6 million was allocated to Operating real estate on the Company’s Consolidated Balance Sheets. During the year ended December 31, 2015, the Company acquired three land parcels, in separate transactions, for an aggregate purchase price of $30.0 million. Ground-Up Development The Company is engaged in ground-up development projects, which will be held as long-term investments by the Company. As of December 31, 2015, the Company had in progress a total of five ground-up development projects located in the U.S. These land parcels will be developed into open-air shopping centers aggregating 1.9 million square feet of GLA with a total estimated aggregate project cost of $446.5 million. During 2015, the Company acquired, in separate transactions, two additional land parcels adjacent to existing development projects for an aggregate purchase price of $20.7 million. During 2014, the Company acquired, in separate transactions, three land parcels located in various cities throughout the U.S., for an aggregate purchase price of $53.5 million. During the fourth quarter 2014, the Company purchased land parcels in Dania, Florida for an aggregate purchase price of $62.8 million. The Company then contributed the land to an unconsolidated joint venture to be used for a ground-up development project and as such is not included in the five ground-up development projects referred to above.
4. Dispositions of Real Estate: Operating Real Estate During 2015, the Company disposed of 89 consolidated operating properties and eight out-parcels, in separate transactions, for an aggregate sales price of $492.5 million. These transactions resulted in an aggregate gain of $143.6 million, after income tax expense, and aggregate impairment charges of $10.2 million, before income tax expense of $2.3 million. Additionally, during 2015, the Company disposed of its remaining operating property in Chile for a sales price of $51.3 million. This transaction resulted in the release of a cumulative foreign currency translation loss of $19.6 million due to the Company’s liquidation of its investment in Chile offset by a gain on sale of $1.8 million, after income tax expense. During 2014, the Company disposed of 90 consolidated operating properties, in separate transactions, for an aggregate sales price of $833.5 million, including 27 operating properties in Latin America. These transactions, which are included in Discontinued operations on the Company’s Consolidated Statements of Income, resulted in an aggregate gain of $203.3 million, before income taxes and noncontrolling interests and aggregate impairment charges of $178.0 million, before income taxes and noncontrolling interests, including $92.9 million related to the release of a cumulative foreign currency translation loss due to the Company’s substantial liquidation of its investment in Mexico. The Company provided financing aggregating $52.7 million on three of these transactions which bore interest at rates ranging from LIBOR plus 250 basis points to 7% per annum, which matured and were repaid in full during 2015. The Company evaluated these transactions pursuant to the FASB’s real estate guidance to determine sale and gain recognition. During 2013, the Company disposed of 36 consolidated operating properties and three out-parcels in separate transactions, for an aggregate sales price of $279.5 million. These transactions, which are included in Discontinued operations in the Company’s Consolidated Statements of Income, resulted in an aggregate gain of $25.4 million and impairment charges of $61.9 million, before income taxes.

KIMCO REALTY CORPORATION AND SUBSIDIARIES
NOTES TO CONSOLIDATED FINANCIAL STATEMENTS (continued)
69
Additionally, during 2013, the Company sold eight consolidated properties in its Latin American portfolio for an aggregate sales price of $115.4 million. These transactions, which are included in Discontinued operations in the Company’s Consolidated Statements of Income, resulted in an aggregate gain of $23.3 million, before income taxes, and aggregate impairment charges of $26.9 million (including the release of the cumulative foreign currency translation loss of $7.8 million associated with the sale of the Company’s interest in two properties within Brazil, which represented a full liquidation of the Company’s investment in Brazil), before income taxes and noncontrolling interests. Land Sales During 2015, 2014 and 2013, the Company sold 13, three and nine land parcels, respectively, for an aggregate sales price of $31.5 million, $5.1 million and $18.2 million, respectively. These transactions resulted in an aggregate gain of $4.3 million, $3.5 million and $11.5 million, before income taxes expense and noncontrolling interest for the years ended December 31, 2015, 2014 and 2013, respectively. The gains from these transactions are recorded as other income, which is included in Other income/(expense), net, in the Company’s Consolidated Statements of Income.
5. Discontinued Operations and Assets Held-for-Sale: Prior to the Company’s adoption of ASU 2014-08 on January 1, 2015, as further discussed in Footnote 1, operations of properties held-for-sale and assets sold during the period were classified as discontinued operations. The results of these discontinued operations are included as a separate component of income on the Consolidated Statements of Income under the caption “Discontinued operations”. This reporting has resulted in certain reclassifications of 2014 and 2013 financial statement amounts. Since adoption of ASU 2014-08 individual property dispositions no longer qualify as a discontinued operation under the new guidance unless the asset disposal represents a significant strategic shift. The components of Income from discontinued operations for each of the three years in the period ended December 31, 2015, are shown below. These include the results of income through the date of each respective sale for properties sold during 2014 and 2013, and the operations for the applicable periods for those assets classified as held-for-sale as of December 31, 2014 and 2013 (in thousands):
2015 2014 2013 Discontinued operations: Revenues from rental property $ 124 $ 71,906 $ 129,315 Rental property expenses (49) (16,657) (39,425)Depreciation and amortization - (15,019) (33,142)Provision for doubtful accounts (57) (719) (2,971)Interest expense - (1,823) (1,371)Income from other real estate investments - 680 720 Other expense, net (12) (756) (880)Income from discontinued operating properties, before income taxes 6 37,612 52,246 Impairment of property carrying value, before income taxes (1) (82) (178,048) (157,972)Gain on disposition of operating properties, before income taxes - 203,271 48,731 Benefit/(provision) for income taxes 1 (11,850) 8,462 (Loss)/income from discontinued operating properties (75) 50,985 (48,533)Net (income)/loss attributable to noncontrolling interests - (2,117) 7,930 (Loss)/income from discontinued operations attributable to the Company $ (75) $ 48,868 $ (40,603)
(1) The year ended December 31, 2014, includes $92.9 million related to the release of a cumulative foreign currency translation loss
due to the Company’s substantial liquidation of its investment in Mexico.
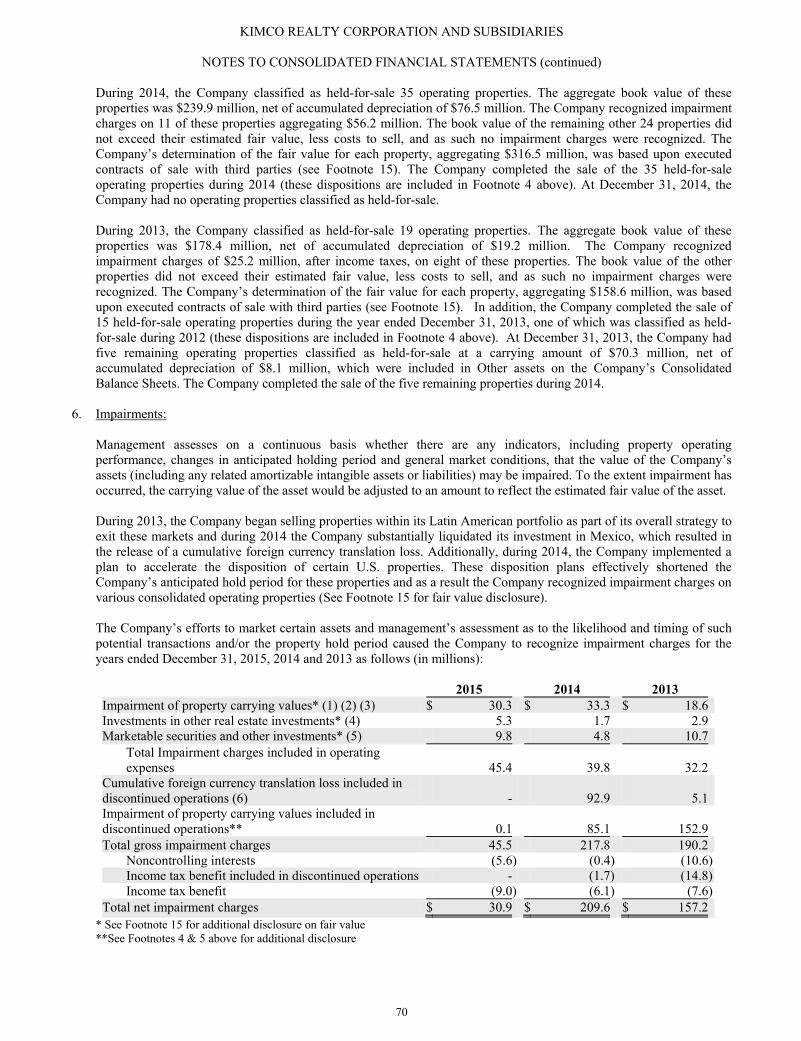
KIMCO REALTY CORPORATION AND SUBSIDIARIES
NOTES TO CONSOLIDATED FINANCIAL STATEMENTS (continued)
70
During 2014, the Company classified as held-for-sale 35 operating properties. The aggregate book value of these properties was $239.9 million, net of accumulated depreciation of $76.5 million. The Company recognized impairment charges on 11 of these properties aggregating $56.2 million. The book value of the remaining other 24 properties did not exceed their estimated fair value, less costs to sell, and as such no impairment charges were recognized. The Company’s determination of the fair value for each property, aggregating $316.5 million, was based upon executed contracts of sale with third parties (see Footnote 15). The Company completed the sale of the 35 held-for-sale operating properties during 2014 (these dispositions are included in Footnote 4 above). At December 31, 2014, the Company had no operating properties classified as held-for-sale.
During 2013, the Company classified as held-for-sale 19 operating properties. The aggregate book value of these properties was $178.4 million, net of accumulated depreciation of $19.2 million. The Company recognized impairment charges of $25.2 million, after income taxes, on eight of these properties. The book value of the other properties did not exceed their estimated fair value, less costs to sell, and as such no impairment charges were recognized. The Company’s determination of the fair value for each property, aggregating $158.6 million, was based upon executed contracts of sale with third parties (see Footnote 15). In addition, the Company completed the sale of 15 held-for-sale operating properties during the year ended December 31, 2013, one of which was classified as held-for-sale during 2012 (these dispositions are included in Footnote 4 above). At December 31, 2013, the Company had five remaining operating properties classified as held-for-sale at a carrying amount of $70.3 million, net of accumulated depreciation of $8.1 million, which were included in Other assets on the Company’s Consolidated Balance Sheets. The Company completed the sale of the five remaining properties during 2014.
6. Impairments:
Management assesses on a continuous basis whether there are any indicators, including property operating performance, changes in anticipated holding period and general market conditions, that the value of the Company’s assets (including any related amortizable intangible assets or liabilities) may be impaired. To the extent impairment has occurred, the carrying value of the asset would be adjusted to an amount to reflect the estimated fair value of the asset. During 2013, the Company began selling properties within its Latin American portfolio as part of its overall strategy to exit these markets and during 2014 the Company substantially liquidated its investment in Mexico, which resulted in the release of a cumulative foreign currency translation loss. Additionally, during 2014, the Company implemented a plan to accelerate the disposition of certain U.S. properties. These disposition plans effectively shortened the Company’s anticipated hold period for these properties and as a result the Company recognized impairment charges on various consolidated operating properties (See Footnote 15 for fair value disclosure). The Company’s efforts to market certain assets and management’s assessment as to the likelihood and timing of such potential transactions and/or the property hold period caused the Company to recognize impairment charges for the years ended December 31, 2015, 2014 and 2013 as follows (in millions): 2015 2014 2013 Impairment of property carrying values* (1) (2) (3) $ 30.3 $ 33.3 $ 18.6 Investments in other real estate investments* (4) 5.3 1.7 2.9 Marketable securities and other investments* (5) 9.8 4.8 10.7
Total Impairment charges included in operating expenses 45.4 39.8 32.2
Cumulative foreign currency translation loss included in discontinued operations (6) - 92.9 5.1 Impairment of property carrying values included in discontinued operations** 0.1 85.1 152.9 Total gross impairment charges 45.5 217.8 190.2
Noncontrolling interests (5.6) (0.4) (10.6)Income tax benefit included in discontinued operations - (1.7) (14.8)Income tax benefit (9.0) (6.1) (7.6)
Total net impairment charges $ 30.9 $ 209.6 $ 157.2 * See Footnote 15 for additional disclosure on fair value **See Footnotes 4 & 5 above for additional disclosure
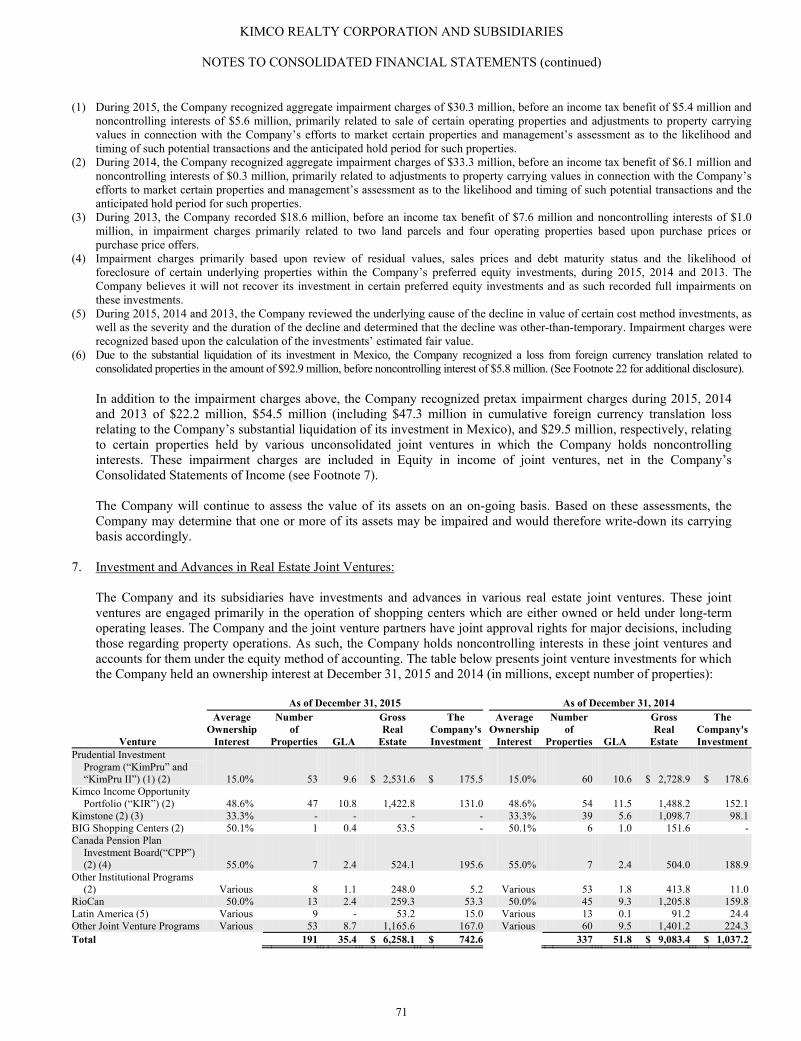
KIMCO REALTY CORPORATION AND SUBSIDIARIES
NOTES TO CONSOLIDATED FINANCIAL STATEMENTS (continued)
71
(1) During 2015, the Company recognized aggregate impairment charges of $30.3 million, before an income tax benefit of $5.4 million and
noncontrolling interests of $5.6 million, primarily related to sale of certain operating properties and adjustments to property carrying values in connection with the Company’s efforts to market certain properties and management’s assessment as to the likelihood andtiming of such potential transactions and the anticipated hold period for such properties.
(2) During 2014, the Company recognized aggregate impairment charges of $33.3 million, before an income tax benefit of $6.1 million and noncontrolling interests of $0.3 million, primarily related to adjustments to property carrying values in connection with the Company’s efforts to market certain properties and management’s assessment as to the likelihood and timing of such potential transactions and the anticipated hold period for such properties.
(3) During 2013, the Company recorded $18.6 million, before an income tax benefit of $7.6 million and noncontrolling interests of $1.0million, in impairment charges primarily related to two land parcels and four operating properties based upon purchase prices or purchase price offers.
(4) Impairment charges primarily based upon review of residual values, sales prices and debt maturity status and the likelihood offoreclosure of certain underlying properties within the Company’s preferred equity investments, during 2015, 2014 and 2013. The Company believes it will not recover its investment in certain preferred equity investments and as such recorded full impairments onthese investments.
(5) During 2015, 2014 and 2013, the Company reviewed the underlying cause of the decline in value of certain cost method investments, as well as the severity and the duration of the decline and determined that the decline was other-than-temporary. Impairment charges wererecognized based upon the calculation of the investments’ estimated fair value.
(6) Due to the substantial liquidation of its investment in Mexico, the Company recognized a loss from foreign currency translation related toconsolidated properties in the amount of $92.9 million, before noncontrolling interest of $5.8 million. (See Footnote 22 for additional disclosure).
In addition to the impairment charges above, the Company recognized pretax impairment charges during 2015, 2014 and 2013 of $22.2 million, $54.5 million (including $47.3 million in cumulative foreign currency translation loss relating to the Company’s substantial liquidation of its investment in Mexico), and $29.5 million, respectively, relating to certain properties held by various unconsolidated joint ventures in which the Company holds noncontrolling interests. These impairment charges are included in Equity in income of joint ventures, net in the Company’s Consolidated Statements of Income (see Footnote 7). The Company will continue to assess the value of its assets on an on-going basis. Based on these assessments, the Company may determine that one or more of its assets may be impaired and would therefore write-down its carrying basis accordingly.
7. Investment and Advances in Real Estate Joint Ventures:
The Company and its subsidiaries have investments and advances in various real estate joint ventures. These joint ventures are engaged primarily in the operation of shopping centers which are either owned or held under long-term operating leases. The Company and the joint venture partners have joint approval rights for major decisions, including those regarding property operations. As such, the Company holds noncontrolling interests in these joint ventures and accounts for them under the equity method of accounting. The table below presents joint venture investments for which the Company held an ownership interest at December 31, 2015 and 2014 (in millions, except number of properties):
As of December 31, 2015 As of December 31, 2014
Venture
Average Ownership
Interest
Number of
Properties GLA
Gross Real
Estate
The Company'sInvestment
Average Ownership
Interest
Number of
Properties GLA
Gross Real
Estate
The Company'sInvestment
Prudential Investment Program (“KimPru” and “KimPru II”) (1) (2) 15.0% 53 9.6 $ 2,531.6 $ 175.5 15.0% 60 10.6 $ 2,728.9 $ 178.6
Kimco Income Opportunity Portfolio (“KIR”) (2) 48.6% 47 10.8 1,422.8 131.0 48.6% 54 11.5 1,488.2 152.1
Kimstone (2) (3) 33.3% - - - - 33.3% 39 5.6 1,098.7 98.1 BIG Shopping Centers (2) 50.1% 1 0.4 53.5 - 50.1% 6 1.0 151.6 - Canada Pension Plan
Investment Board(“CPP”) (2) (4) 55.0% 7 2.4 524.1 195.6 55.0% 7 2.4 504.0 188.9
Other Institutional Programs (2) Various 8 1.1 248.0 5.2 Various 53 1.8 413.8 11.0
RioCan 50.0% 13 2.4 259.3 53.3 50.0% 45 9.3 1,205.8 159.8 Latin America (5) Various 9 - 53.2 15.0 Various 13 0.1 91.2 24.4 Other Joint Venture Programs Various 53 8.7 1,165.6 167.0 Various 60 9.5 1,401.2 224.3 Total 191 35.4 $ 6,258.1 $ 742.6 337 51.8 $ 9,083.4 $ 1,037.2
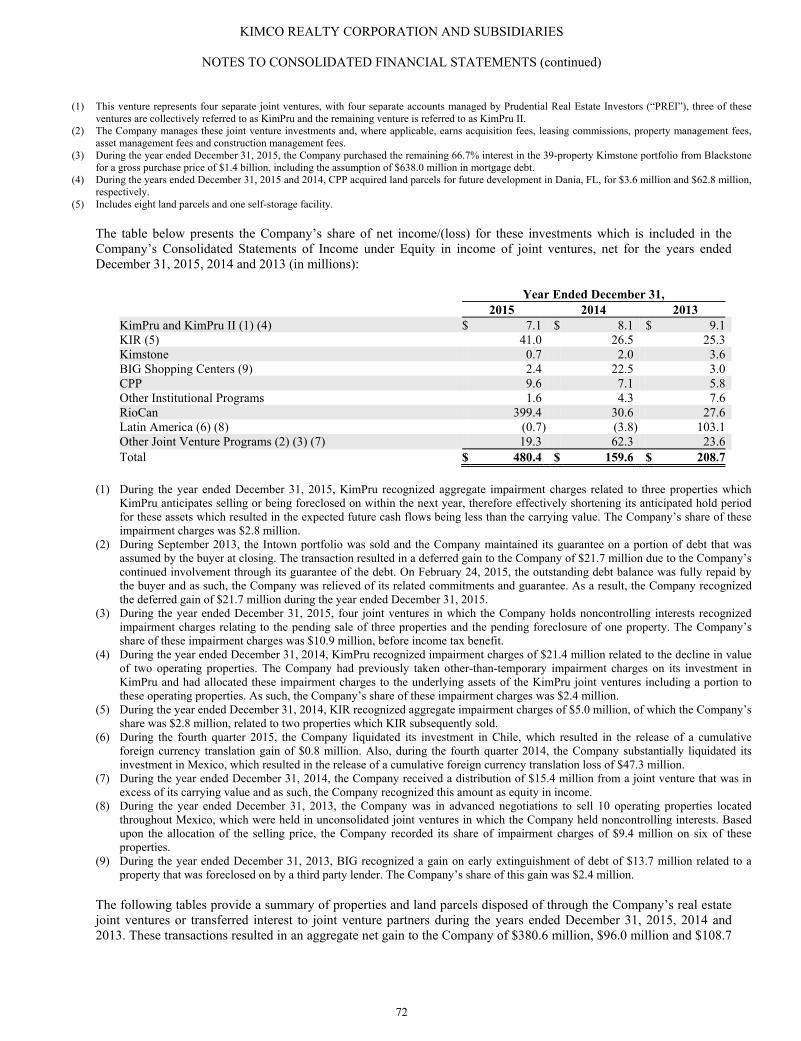
KIMCO REALTY CORPORATION AND SUBSIDIARIES
NOTES TO CONSOLIDATED FINANCIAL STATEMENTS (continued)
72
(1) This venture represents four separate joint ventures, with four separate accounts managed by Prudential Real Estate Investors (“PREI”), three of these
ventures are collectively referred to as KimPru and the remaining venture is referred to as KimPru II. (2) The Company manages these joint venture investments and, where applicable, earns acquisition fees, leasing commissions, property management fees,
asset management fees and construction management fees. (3) During the year ended December 31, 2015, the Company purchased the remaining 66.7% interest in the 39-property Kimstone portfolio from Blackstone
for a gross purchase price of $1.4 billion, including the assumption of $638.0 million in mortgage debt. (4) During the years ended December 31, 2015 and 2014, CPP acquired land parcels for future development in Dania, FL, for $3.6 million and $62.8 million,
respectively. (5) Includes eight land parcels and one self-storage facility.
The table below presents the Company’s share of net income/(loss) for these investments which is included in the Company’s Consolidated Statements of Income under Equity in income of joint ventures, net for the years ended December 31, 2015, 2014 and 2013 (in millions):
Year Ended December 31, 2015 2014 2013 KimPru and KimPru II (1) (4) $ 7.1 $ 8.1 $ 9.1 KIR (5) 41.0 26.5 25.3 Kimstone 0.7 2.0 3.6 BIG Shopping Centers (9) 2.4 22.5 3.0 CPP 9.6 7.1 5.8 Other Institutional Programs 1.6 4.3 7.6 RioCan 399.4 30.6 27.6 Latin America (6) (8) (0.7) (3.8) 103.1 Other Joint Venture Programs (2) (3) (7) 19.3 62.3 23.6 Total $ 480.4 $ 159.6 $ 208.7
(1) During the year ended December 31, 2015, KimPru recognized aggregate impairment charges related to three properties whichKimPru anticipates selling or being foreclosed on within the next year, therefore effectively shortening its anticipated hold period for these assets which resulted in the expected future cash flows being less than the carrying value. The Company’s share of these impairment charges was $2.8 million.
(2) During September 2013, the Intown portfolio was sold and the Company maintained its guarantee on a portion of debt that wasassumed by the buyer at closing. The transaction resulted in a deferred gain to the Company of $21.7 million due to the Company’s continued involvement through its guarantee of the debt. On February 24, 2015, the outstanding debt balance was fully repaid bythe buyer and as such, the Company was relieved of its related commitments and guarantee. As a result, the Company recognizedthe deferred gain of $21.7 million during the year ended December 31, 2015.
(3) During the year ended December 31, 2015, four joint ventures in which the Company holds noncontrolling interests recognized
impairment charges relating to the pending sale of three properties and the pending foreclosure of one property. The Company’s share of these impairment charges was $10.9 million, before income tax benefit.
(4) During the year ended December 31, 2014, KimPru recognized impairment charges of $21.4 million related to the decline in value of two operating properties. The Company had previously taken other-than-temporary impairment charges on its investment in KimPru and had allocated these impairment charges to the underlying assets of the KimPru joint ventures including a portion to these operating properties. As such, the Company’s share of these impairment charges was $2.4 million.
(5) During the year ended December 31, 2014, KIR recognized aggregate impairment charges of $5.0 million, of which the Company’sshare was $2.8 million, related to two properties which KIR subsequently sold.
(6) During the fourth quarter 2015, the Company liquidated its investment in Chile, which resulted in the release of a cumulative
foreign currency translation gain of $0.8 million. Also, during the fourth quarter 2014, the Company substantially liquidated its investment in Mexico, which resulted in the release of a cumulative foreign currency translation loss of $47.3 million.
(7) During the year ended December 31, 2014, the Company received a distribution of $15.4 million from a joint venture that was in excess of its carrying value and as such, the Company recognized this amount as equity in income.
(8) During the year ended December 31, 2013, the Company was in advanced negotiations to sell 10 operating properties located throughout Mexico, which were held in unconsolidated joint ventures in which the Company held noncontrolling interests. Basedupon the allocation of the selling price, the Company recorded its share of impairment charges of $9.4 million on six of these properties.
(9) During the year ended December 31, 2013, BIG recognized a gain on early extinguishment of debt of $13.7 million related to aproperty that was foreclosed on by a third party lender. The Company’s share of this gain was $2.4 million.
The following tables provide a summary of properties and land parcels disposed of through the Company’s real estate joint ventures or transferred interest to joint venture partners during the years ended December 31, 2015, 2014 and 2013. These transactions resulted in an aggregate net gain to the Company of $380.6 million, $96.0 million and $108.7
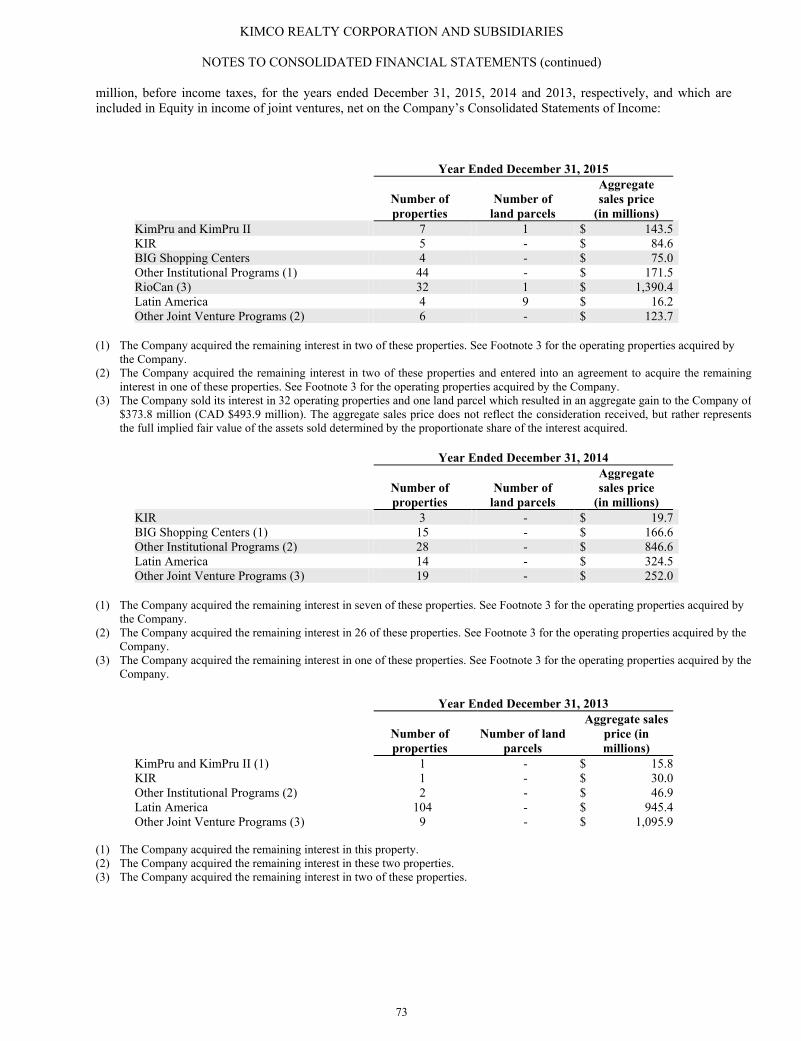
KIMCO REALTY CORPORATION AND SUBSIDIARIES
NOTES TO CONSOLIDATED FINANCIAL STATEMENTS (continued)
73
million, before income taxes, for the years ended December 31, 2015, 2014 and 2013, respectively, and which are included in Equity in income of joint ventures, net on the Company’s Consolidated Statements of Income:
Year Ended December 31, 2015
Number of properties
Number of land parcels
Aggregate sales price
(in millions) KimPru and KimPru II 7 1 $ 143.5 KIR 5 - $ 84.6 BIG Shopping Centers 4 - $ 75.0 Other Institutional Programs (1) 44 - $ 171.5 RioCan (3) 32 1 $ 1,390.4 Latin America 4 9 $ 16.2 Other Joint Venture Programs (2) 6 - $ 123.7
(1) The Company acquired the remaining interest in two of these properties. See Footnote 3 for the operating properties acquired by
the Company.
(2) The Company acquired the remaining interest in two of these properties and entered into an agreement to acquire the remaining interest in one of these properties. See Footnote 3 for the operating properties acquired by the Company.
(3) The Company sold its interest in 32 operating properties and one land parcel which resulted in an aggregate gain to the Company of
$373.8 million (CAD $493.9 million). The aggregate sales price does not reflect the consideration received, but rather represents the full implied fair value of the assets sold determined by the proportionate share of the interest acquired.
Year Ended December 31, 2014
Number of properties
Number of land parcels
Aggregate sales price
(in millions) KIR 3 - $ 19.7 BIG Shopping Centers (1) 15 - $ 166.6 Other Institutional Programs (2) 28 - $ 846.6 Latin America 14 - $ 324.5 Other Joint Venture Programs (3) 19 - $ 252.0
(1) The Company acquired the remaining interest in seven of these properties. See Footnote 3 for the operating properties acquired by
the Company.
(2) The Company acquired the remaining interest in 26 of these properties. See Footnote 3 for the operating properties acquired by the Company.
(3) The Company acquired the remaining interest in one of these properties. See Footnote 3 for the operating properties acquired by the Company.
Year Ended December 31, 2013
Number of properties
Number of land parcels
Aggregate sales price (in millions)
KimPru and KimPru II (1) 1 - $ 15.8 KIR 1 - $ 30.0 Other Institutional Programs (2) 2 - $ 46.9 Latin America 104 - $ 945.4 Other Joint Venture Programs (3) 9 - $ 1,095.9
(1) The Company acquired the remaining interest in this property. (2) The Company acquired the remaining interest in these two properties. (3) The Company acquired the remaining interest in two of these properties.
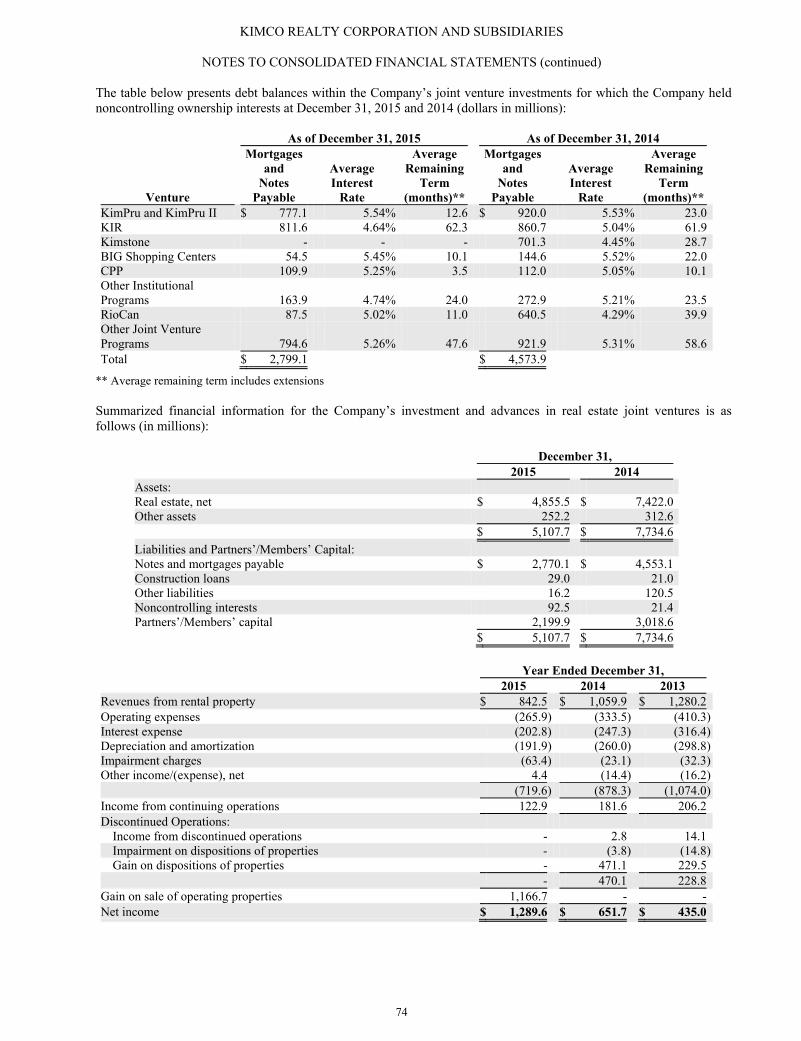
KIMCO REALTY CORPORATION AND SUBSIDIARIES
NOTES TO CONSOLIDATED FINANCIAL STATEMENTS (continued)
74
The table below presents debt balances within the Company’s joint venture investments for which the Company held noncontrolling ownership interests at December 31, 2015 and 2014 (dollars in millions): As of December 31, 2015 As of December 31, 2014
Venture
Mortgages and
Notes Payable
Average Interest
Rate
Average Remaining
Term (months)**
Mortgagesand
Notes Payable
Average Interest
Rate
Average Remaining
Term (months)**
KimPru and KimPru II $ 777.1 5.54% 12.6 $ 920.0 5.53% 23.0 KIR 811.6 4.64% 62.3 860.7 5.04% 61.9 Kimstone - - - 701.3 4.45% 28.7 BIG Shopping Centers 54.5 5.45% 10.1 144.6 5.52% 22.0 CPP 109.9 5.25% 3.5 112.0 5.05% 10.1 Other Institutional Programs 163.9 4.74% 24.0 272.9 5.21% 23.5 RioCan 87.5 5.02% 11.0 640.5 4.29% 39.9 Other Joint Venture Programs 794.6 5.26% 47.6 921.9 5.31% 58.6 Total $ 2,799.1 $ 4,573.9
** Average remaining term includes extensions Summarized financial information for the Company’s investment and advances in real estate joint ventures is as follows (in millions):
December 31, 2015 2014 Assets: Real estate, net $ 4,855.5 $ 7,422.0 Other assets 252.2 312.6 $ 5,107.7 $ 7,734.6 Liabilities and Partners’/Members’ Capital: Notes and mortgages payable $ 2,770.1 $ 4,553.1 Construction loans 29.0 21.0 Other liabilities 16.2 120.5 Noncontrolling interests 92.5 21.4 Partners’/Members’ capital 2,199.9 3,018.6 $ 5,107.7 $ 7,734.6
Year Ended December 31, 2015 2014 2013 Revenues from rental property $ 842.5 $ 1,059.9 $ 1,280.2 Operating expenses (265.9) (333.5) (410.3)Interest expense (202.8) (247.3) (316.4)Depreciation and amortization (191.9) (260.0) (298.8)Impairment charges (63.4) (23.1) (32.3)Other income/(expense), net 4.4 (14.4) (16.2) (719.6) (878.3) (1,074.0)Income from continuing operations 122.9 181.6 206.2 Discontinued Operations:
Income from discontinued operations - 2.8 14.1 Impairment on dispositions of properties - (3.8) (14.8)Gain on dispositions of properties - 471.1 229.5
- 470.1 228.8 Gain on sale of operating properties 1,166.7 - - Net income $ 1,289.6 $ 651.7 $ 435.0
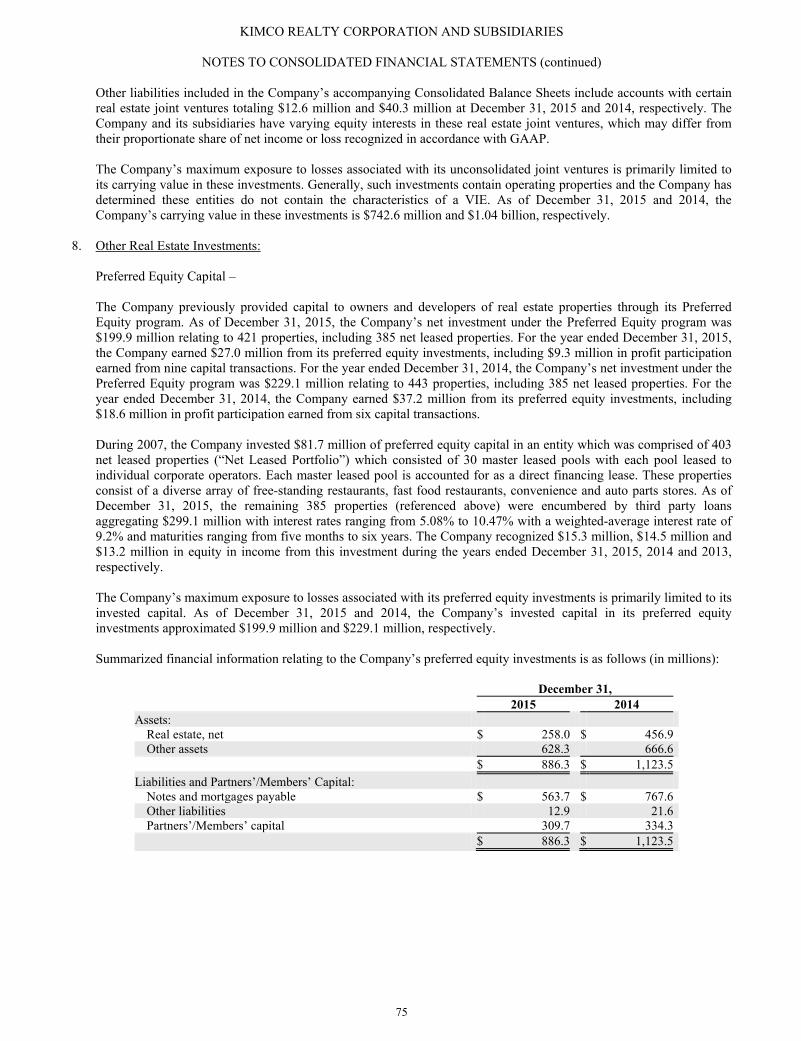
KIMCO REALTY CORPORATION AND SUBSIDIARIES
NOTES TO CONSOLIDATED FINANCIAL STATEMENTS (continued)
75
Other liabilities included in the Company’s accompanying Consolidated Balance Sheets include accounts with certain real estate joint ventures totaling $12.6 million and $40.3 million at December 31, 2015 and 2014, respectively. The Company and its subsidiaries have varying equity interests in these real estate joint ventures, which may differ from their proportionate share of net income or loss recognized in accordance with GAAP. The Company’s maximum exposure to losses associated with its unconsolidated joint ventures is primarily limited to its carrying value in these investments. Generally, such investments contain operating properties and the Company has determined these entities do not contain the characteristics of a VIE. As of December 31, 2015 and 2014, the Company’s carrying value in these investments is $742.6 million and $1.04 billion, respectively.
8. Other Real Estate Investments:
Preferred Equity Capital –
The Company previously provided capital to owners and developers of real estate properties through its Preferred Equity program. As of December 31, 2015, the Company’s net investment under the Preferred Equity program was $199.9 million relating to 421 properties, including 385 net leased properties. For the year ended December 31, 2015, the Company earned $27.0 million from its preferred equity investments, including $9.3 million in profit participation earned from nine capital transactions. For the year ended December 31, 2014, the Company’s net investment under the Preferred Equity program was $229.1 million relating to 443 properties, including 385 net leased properties. For the year ended December 31, 2014, the Company earned $37.2 million from its preferred equity investments, including $18.6 million in profit participation earned from six capital transactions. During 2007, the Company invested $81.7 million of preferred equity capital in an entity which was comprised of 403 net leased properties (“Net Leased Portfolio”) which consisted of 30 master leased pools with each pool leased to individual corporate operators. Each master leased pool is accounted for as a direct financing lease. These properties consist of a diverse array of free-standing restaurants, fast food restaurants, convenience and auto parts stores. As of December 31, 2015, the remaining 385 properties (referenced above) were encumbered by third party loans aggregating $299.1 million with interest rates ranging from 5.08% to 10.47% with a weighted-average interest rate of 9.2% and maturities ranging from five months to six years. The Company recognized $15.3 million, $14.5 million and $13.2 million in equity in income from this investment during the years ended December 31, 2015, 2014 and 2013, respectively. The Company’s maximum exposure to losses associated with its preferred equity investments is primarily limited to its invested capital. As of December 31, 2015 and 2014, the Company’s invested capital in its preferred equity investments approximated $199.9 million and $229.1 million, respectively. Summarized financial information relating to the Company’s preferred equity investments is as follows (in millions):
December 31, 2015 2014 Assets:
Real estate, net $ 258.0 $ 456.9 Other assets 628.3 666.6
$ 886.3 $ 1,123.5 Liabilities and Partners’/Members’ Capital:
Notes and mortgages payable $ 563.7 $ 767.6 Other liabilities 12.9 21.6 Partners’/Members’ capital 309.7 334.3
$ 886.3 $ 1,123.5
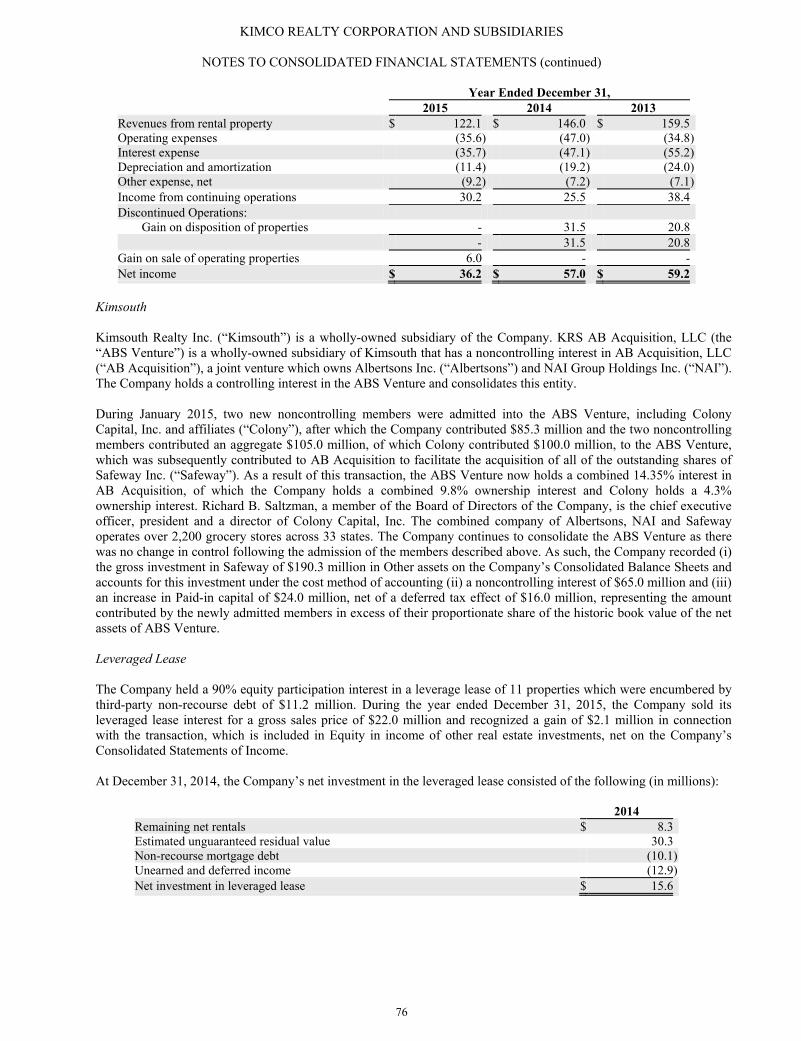
KIMCO REALTY CORPORATION AND SUBSIDIARIES
NOTES TO CONSOLIDATED FINANCIAL STATEMENTS (continued)
76
Year Ended December 31, 2015 2014 2013 Revenues from rental property $ 122.1 $ 146.0 $ 159.5 Operating expenses (35.6) (47.0 ) (34.8)Interest expense (35.7) (47.1 ) (55.2)Depreciation and amortization (11.4) (19.2 ) (24.0)Other expense, net (9.2) (7.2 ) (7.1)Income from continuing operations 30.2 25.5 38.4 Discontinued Operations:
Gain on disposition of properties - 31.5 20.8 - 31.5 20.8 Gain on sale of operating properties 6.0 - - Net income $ 36.2 $ 57.0 $ 59.2
Kimsouth Kimsouth Realty Inc. (“Kimsouth”) is a wholly-owned subsidiary of the Company. KRS AB Acquisition, LLC (the “ABS Venture”) is a wholly-owned subsidiary of Kimsouth that has a noncontrolling interest in AB Acquisition, LLC (“AB Acquisition”), a joint venture which owns Albertsons Inc. (“Albertsons”) and NAI Group Holdings Inc. (“NAI”). The Company holds a controlling interest in the ABS Venture and consolidates this entity. During January 2015, two new noncontrolling members were admitted into the ABS Venture, including Colony Capital, Inc. and affiliates (“Colony”), after which the Company contributed $85.3 million and the two noncontrolling members contributed an aggregate $105.0 million, of which Colony contributed $100.0 million, to the ABS Venture, which was subsequently contributed to AB Acquisition to facilitate the acquisition of all of the outstanding shares of Safeway Inc. (“Safeway”). As a result of this transaction, the ABS Venture now holds a combined 14.35% interest in AB Acquisition, of which the Company holds a combined 9.8% ownership interest and Colony holds a 4.3% ownership interest. Richard B. Saltzman, a member of the Board of Directors of the Company, is the chief executive officer, president and a director of Colony Capital, Inc. The combined company of Albertsons, NAI and Safeway operates over 2,200 grocery stores across 33 states. The Company continues to consolidate the ABS Venture as there was no change in control following the admission of the members described above. As such, the Company recorded (i) the gross investment in Safeway of $190.3 million in Other assets on the Company’s Consolidated Balance Sheets and accounts for this investment under the cost method of accounting (ii) a noncontrolling interest of $65.0 million and (iii) an increase in Paid-in capital of $24.0 million, net of a deferred tax effect of $16.0 million, representing the amount contributed by the newly admitted members in excess of their proportionate share of the historic book value of the net assets of ABS Venture. Leveraged Lease The Company held a 90% equity participation interest in a leverage lease of 11 properties which were encumbered by third-party non-recourse debt of $11.2 million. During the year ended December 31, 2015, the Company sold its leveraged lease interest for a gross sales price of $22.0 million and recognized a gain of $2.1 million in connection with the transaction, which is included in Equity in income of other real estate investments, net on the Company’s Consolidated Statements of Income. At December 31, 2014, the Company’s net investment in the leveraged lease consisted of the following (in millions):
2014 Remaining net rentals $ 8.3 Estimated unguaranteed residual value 30.3 Non-recourse mortgage debt (10.1)Unearned and deferred income (12.9)Net investment in leveraged lease $ 15.6
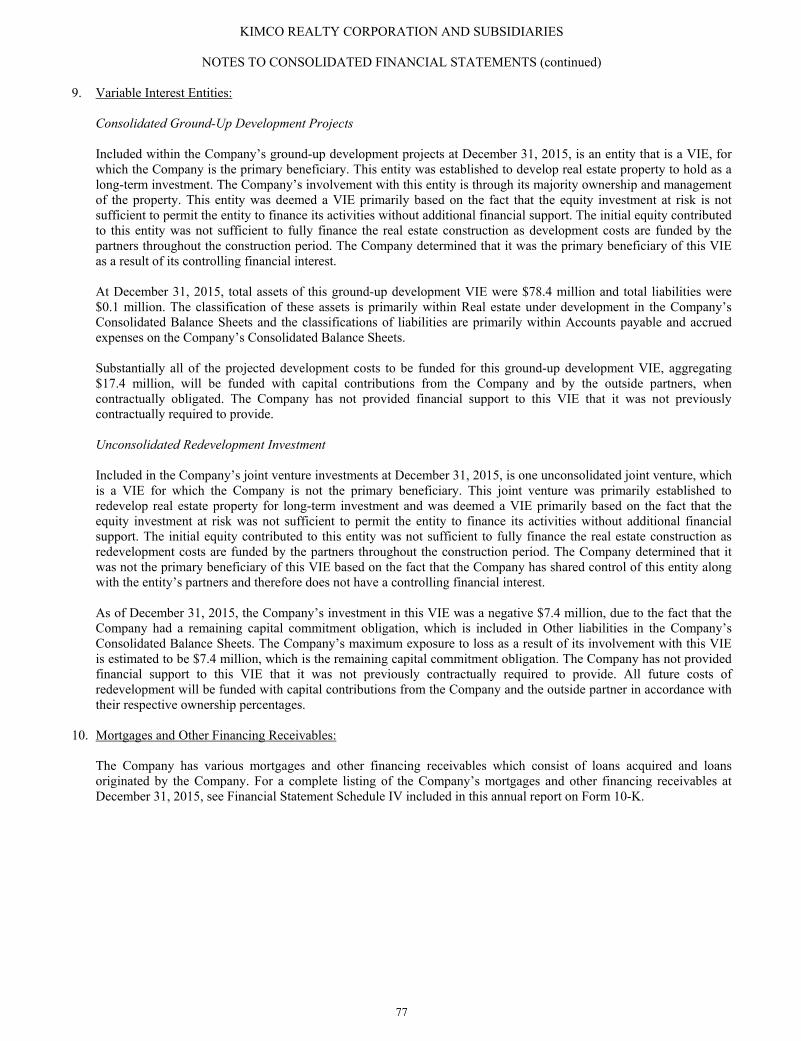
KIMCO REALTY CORPORATION AND SUBSIDIARIES
NOTES TO CONSOLIDATED FINANCIAL STATEMENTS (continued)
77
9. Variable Interest Entities: Consolidated Ground-Up Development Projects Included within the Company’s ground-up development projects at December 31, 2015, is an entity that is a VIE, for which the Company is the primary beneficiary. This entity was established to develop real estate property to hold as a long-term investment. The Company’s involvement with this entity is through its majority ownership and management of the property. This entity was deemed a VIE primarily based on the fact that the equity investment at risk is not sufficient to permit the entity to finance its activities without additional financial support. The initial equity contributed to this entity was not sufficient to fully finance the real estate construction as development costs are funded by the partners throughout the construction period. The Company determined that it was the primary beneficiary of this VIE as a result of its controlling financial interest. At December 31, 2015, total assets of this ground-up development VIE were $78.4 million and total liabilities were $0.1 million. The classification of these assets is primarily within Real estate under development in the Company’s Consolidated Balance Sheets and the classifications of liabilities are primarily within Accounts payable and accrued expenses on the Company’s Consolidated Balance Sheets.
Substantially all of the projected development costs to be funded for this ground-up development VIE, aggregating $17.4 million, will be funded with capital contributions from the Company and by the outside partners, when contractually obligated. The Company has not provided financial support to this VIE that it was not previously contractually required to provide.
Unconsolidated Redevelopment Investment Included in the Company’s joint venture investments at December 31, 2015, is one unconsolidated joint venture, which is a VIE for which the Company is not the primary beneficiary. This joint venture was primarily established to redevelop real estate property for long-term investment and was deemed a VIE primarily based on the fact that the equity investment at risk was not sufficient to permit the entity to finance its activities without additional financial support. The initial equity contributed to this entity was not sufficient to fully finance the real estate construction as redevelopment costs are funded by the partners throughout the construction period. The Company determined that it was not the primary beneficiary of this VIE based on the fact that the Company has shared control of this entity along with the entity’s partners and therefore does not have a controlling financial interest. As of December 31, 2015, the Company’s investment in this VIE was a negative $7.4 million, due to the fact that the Company had a remaining capital commitment obligation, which is included in Other liabilities in the Company’s Consolidated Balance Sheets. The Company’s maximum exposure to loss as a result of its involvement with this VIE is estimated to be $7.4 million, which is the remaining capital commitment obligation. The Company has not provided financial support to this VIE that it was not previously contractually required to provide. All future costs of redevelopment will be funded with capital contributions from the Company and the outside partner in accordance with their respective ownership percentages.
10. Mortgages and Other Financing Receivables: The Company has various mortgages and other financing receivables which consist of loans acquired and loans originated by the Company. For a complete listing of the Company’s mortgages and other financing receivables at December 31, 2015, see Financial Statement Schedule IV included in this annual report on Form 10-K.
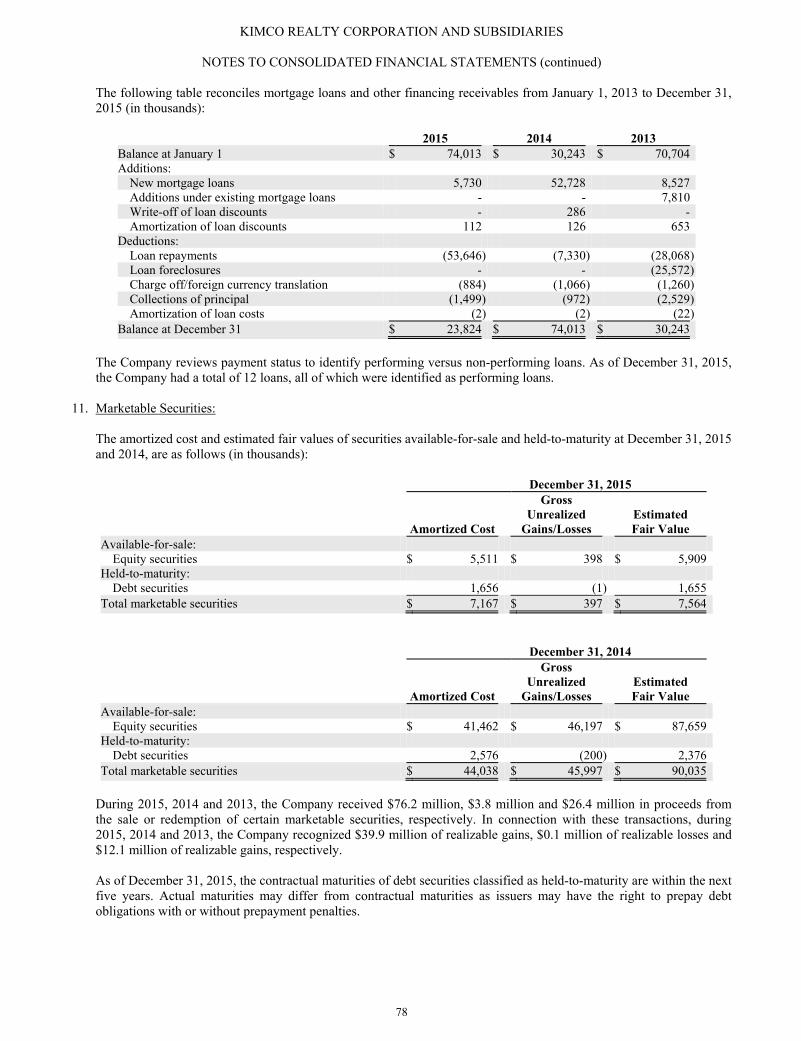
KIMCO REALTY CORPORATION AND SUBSIDIARIES
NOTES TO CONSOLIDATED FINANCIAL STATEMENTS (continued)
78
The following table reconciles mortgage loans and other financing receivables from January 1, 2013 to December 31, 2015 (in thousands):
2015 2014 2013 Balance at January 1 $ 74,013 $ 30,243 $ 70,704 Additions:
New mortgage loans 5,730 52,728 8,527 Additions under existing mortgage loans - - 7,810 Write-off of loan discounts - 286 - Amortization of loan discounts 112 126 653
Deductions: Loan repayments (53,646) (7,330 ) (28,068)Loan foreclosures - - (25,572)Charge off/foreign currency translation (884) (1,066 ) (1,260)Collections of principal (1,499) (972 ) (2,529)Amortization of loan costs (2) (2 ) (22)
Balance at December 31 $ 23,824 $ 74,013 $ 30,243 The Company reviews payment status to identify performing versus non-performing loans. As of December 31, 2015, the Company had a total of 12 loans, all of which were identified as performing loans.
11. Marketable Securities:
The amortized cost and estimated fair values of securities available-for-sale and held-to-maturity at December 31, 2015 and 2014, are as follows (in thousands): December 31, 2015
Amortized Cost
Gross Unrealized
Gains/Losses Estimated Fair Value
Available-for-sale: Equity securities $ 5,511 $ 398 $ 5,909
Held-to-maturity: Debt securities 1,656 (1) 1,655
Total marketable securities $ 7,167 $ 397 $ 7,564 December 31, 2014
Amortized Cost
Gross Unrealized
Gains/Losses Estimated Fair Value
Available-for-sale: Equity securities $ 41,462 $ 46,197 $ 87,659
Held-to-maturity: Debt securities 2,576 (200) 2,376
Total marketable securities $ 44,038 $ 45,997 $ 90,035 During 2015, 2014 and 2013, the Company received $76.2 million, $3.8 million and $26.4 million in proceeds from the sale or redemption of certain marketable securities, respectively. In connection with these transactions, during 2015, 2014 and 2013, the Company recognized $39.9 million of realizable gains, $0.1 million of realizable losses and $12.1 million of realizable gains, respectively. As of December 31, 2015, the contractual maturities of debt securities classified as held-to-maturity are within the next five years. Actual maturities may differ from contractual maturities as issuers may have the right to prepay debt obligations with or without prepayment penalties.
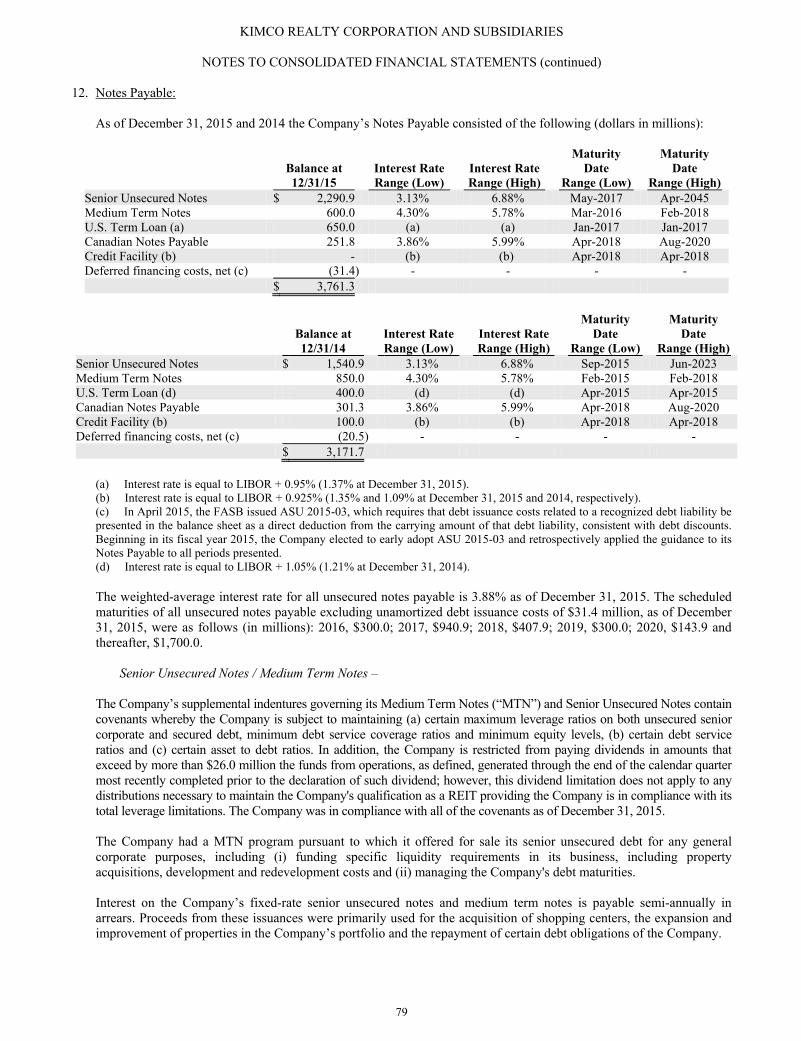
KIMCO REALTY CORPORATION AND SUBSIDIARIES
NOTES TO CONSOLIDATED FINANCIAL STATEMENTS (continued)
79
12. Notes Payable: As of December 31, 2015 and 2014 the Company’s Notes Payable consisted of the following (dollars in millions):
Balance at 12/31/15
Interest Rate Range (Low)
Interest Rate Range (High)
Maturity Date
Range (Low)
Maturity Date
Range (High) Senior Unsecured Notes $ 2,290.9 3.13% 6.88% May-2017 Apr-2045 Medium Term Notes 600.0 4.30% 5.78% Mar-2016 Feb-2018 U.S. Term Loan (a) 650.0 (a) (a) Jan-2017 Jan-2017 Canadian Notes Payable 251.8 3.86% 5.99% Apr-2018 Aug-2020 Credit Facility (b) - (b) (b) Apr-2018 Apr-2018 Deferred financing costs, net (c) (31.4) - - - - $ 3,761.3
Balance at 12/31/14
Interest Rate Range (Low)
Interest Rate Range (High)
Maturity Date
Range (Low)
Maturity Date
Range (High) Senior Unsecured Notes $ 1,540.9 3.13% 6.88% Sep-2015 Jun-2023 Medium Term Notes 850.0 4.30% 5.78% Feb-2015 Feb-2018 U.S. Term Loan (d) 400.0 (d) (d) Apr-2015 Apr-2015 Canadian Notes Payable 301.3 3.86% 5.99% Apr-2018 Aug-2020 Credit Facility (b) 100.0 (b) (b) Apr-2018 Apr-2018 Deferred financing costs, net (c) (20.5) - - - - $ 3,171.7
(a) Interest rate is equal to LIBOR + 0.95% (1.37% at December 31, 2015). (b) Interest rate is equal to LIBOR + 0.925% (1.35% and 1.09% at December 31, 2015 and 2014, respectively). (c) In April 2015, the FASB issued ASU 2015-03, which requires that debt issuance costs related to a recognized debt liability be presented in the balance sheet as a direct deduction from the carrying amount of that debt liability, consistent with debt discounts. Beginning in its fiscal year 2015, the Company elected to early adopt ASU 2015-03 and retrospectively applied the guidance to its Notes Payable to all periods presented. (d) Interest rate is equal to LIBOR + 1.05% (1.21% at December 31, 2014). The weighted-average interest rate for all unsecured notes payable is 3.88% as of December 31, 2015. The scheduled maturities of all unsecured notes payable excluding unamortized debt issuance costs of $31.4 million, as of December 31, 2015, were as follows (in millions): 2016, $300.0; 2017, $940.9; 2018, $407.9; 2019, $300.0; 2020, $143.9 and thereafter, $1,700.0.
Senior Unsecured Notes / Medium Term Notes –
The Company’s supplemental indentures governing its Medium Term Notes (“MTN”) and Senior Unsecured Notes contain covenants whereby the Company is subject to maintaining (a) certain maximum leverage ratios on both unsecured senior corporate and secured debt, minimum debt service coverage ratios and minimum equity levels, (b) certain debt service ratios and (c) certain asset to debt ratios. In addition, the Company is restricted from paying dividends in amounts that exceed by more than $26.0 million the funds from operations, as defined, generated through the end of the calendar quarter most recently completed prior to the declaration of such dividend; however, this dividend limitation does not apply to any distributions necessary to maintain the Company's qualification as a REIT providing the Company is in compliance with its total leverage limitations. The Company was in compliance with all of the covenants as of December 31, 2015.
The Company had a MTN program pursuant to which it offered for sale its senior unsecured debt for any general corporate purposes, including (i) funding specific liquidity requirements in its business, including property acquisitions, development and redevelopment costs and (ii) managing the Company's debt maturities. Interest on the Company’s fixed-rate senior unsecured notes and medium term notes is payable semi-annually in arrears. Proceeds from these issuances were primarily used for the acquisition of shopping centers, the expansion and improvement of properties in the Company’s portfolio and the repayment of certain debt obligations of the Company.
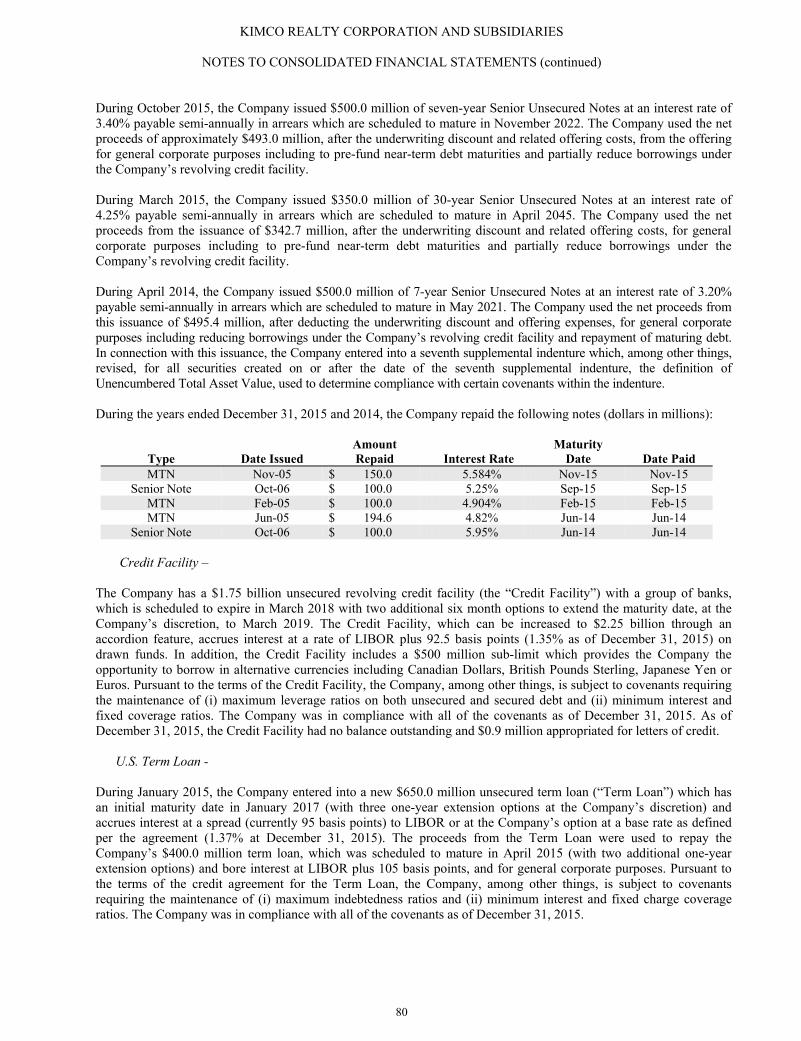
KIMCO REALTY CORPORATION AND SUBSIDIARIES
NOTES TO CONSOLIDATED FINANCIAL STATEMENTS (continued)
80
During October 2015, the Company issued $500.0 million of seven-year Senior Unsecured Notes at an interest rate of 3.40% payable semi-annually in arrears which are scheduled to mature in November 2022. The Company used the net proceeds of approximately $493.0 million, after the underwriting discount and related offering costs, from the offering for general corporate purposes including to pre-fund near-term debt maturities and partially reduce borrowings under the Company’s revolving credit facility. During March 2015, the Company issued $350.0 million of 30-year Senior Unsecured Notes at an interest rate of 4.25% payable semi-annually in arrears which are scheduled to mature in April 2045. The Company used the net proceeds from the issuance of $342.7 million, after the underwriting discount and related offering costs, for general corporate purposes including to pre-fund near-term debt maturities and partially reduce borrowings under the Company’s revolving credit facility. During April 2014, the Company issued $500.0 million of 7-year Senior Unsecured Notes at an interest rate of 3.20% payable semi-annually in arrears which are scheduled to mature in May 2021. The Company used the net proceeds from this issuance of $495.4 million, after deducting the underwriting discount and offering expenses, for general corporate purposes including reducing borrowings under the Company’s revolving credit facility and repayment of maturing debt. In connection with this issuance, the Company entered into a seventh supplemental indenture which, among other things, revised, for all securities created on or after the date of the seventh supplemental indenture, the definition of Unencumbered Total Asset Value, used to determine compliance with certain covenants within the indenture.
During the years ended December 31, 2015 and 2014, the Company repaid the following notes (dollars in millions):
Type Date Issued Amount Repaid Interest Rate
Maturity Date Date Paid
MTN Nov-05 $ 150.0 5.584% Nov-15 Nov-15 Senior Note Oct-06 $ 100.0 5.25% Sep-15 Sep-15
MTN Feb-05 $ 100.0 4.904% Feb-15 Feb-15 MTN Jun-05 $ 194.6 4.82% Jun-14 Jun-14
Senior Note Oct-06 $ 100.0 5.95% Jun-14 Jun-14 Credit Facility –
The Company has a $1.75 billion unsecured revolving credit facility (the “Credit Facility”) with a group of banks, which is scheduled to expire in March 2018 with two additional six month options to extend the maturity date, at the Company’s discretion, to March 2019. The Credit Facility, which can be increased to $2.25 billion through an accordion feature, accrues interest at a rate of LIBOR plus 92.5 basis points (1.35% as of December 31, 2015) on drawn funds. In addition, the Credit Facility includes a $500 million sub-limit which provides the Company the opportunity to borrow in alternative currencies including Canadian Dollars, British Pounds Sterling, Japanese Yen or Euros. Pursuant to the terms of the Credit Facility, the Company, among other things, is subject to covenants requiring the maintenance of (i) maximum leverage ratios on both unsecured and secured debt and (ii) minimum interest and fixed coverage ratios. The Company was in compliance with all of the covenants as of December 31, 2015. As of December 31, 2015, the Credit Facility had no balance outstanding and $0.9 million appropriated for letters of credit. U.S. Term Loan - During January 2015, the Company entered into a new $650.0 million unsecured term loan (“Term Loan”) which has an initial maturity date in January 2017 (with three one-year extension options at the Company’s discretion) and accrues interest at a spread (currently 95 basis points) to LIBOR or at the Company’s option at a base rate as defined per the agreement (1.37% at December 31, 2015). The proceeds from the Term Loan were used to repay the Company’s $400.0 million term loan, which was scheduled to mature in April 2015 (with two additional one-year extension options) and bore interest at LIBOR plus 105 basis points, and for general corporate purposes. Pursuant to the terms of the credit agreement for the Term Loan, the Company, among other things, is subject to covenants requiring the maintenance of (i) maximum indebtedness ratios and (ii) minimum interest and fixed charge coverage ratios. The Company was in compliance with all of the covenants as of December 31, 2015.
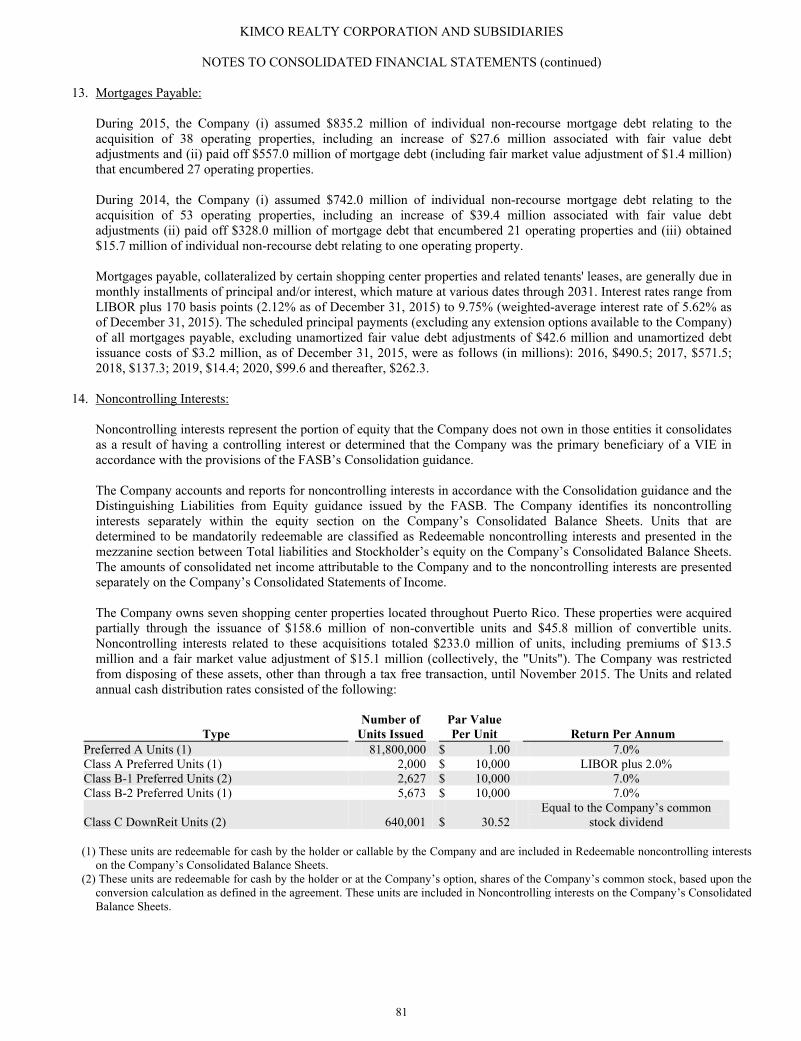
KIMCO REALTY CORPORATION AND SUBSIDIARIES
NOTES TO CONSOLIDATED FINANCIAL STATEMENTS (continued)
81
13. Mortgages Payable:
During 2015, the Company (i) assumed $835.2 million of individual non-recourse mortgage debt relating to the acquisition of 38 operating properties, including an increase of $27.6 million associated with fair value debt adjustments and (ii) paid off $557.0 million of mortgage debt (including fair market value adjustment of $1.4 million) that encumbered 27 operating properties. During 2014, the Company (i) assumed $742.0 million of individual non-recourse mortgage debt relating to the acquisition of 53 operating properties, including an increase of $39.4 million associated with fair value debt adjustments (ii) paid off $328.0 million of mortgage debt that encumbered 21 operating properties and (iii) obtained $15.7 million of individual non-recourse debt relating to one operating property.
Mortgages payable, collateralized by certain shopping center properties and related tenants' leases, are generally due in monthly installments of principal and/or interest, which mature at various dates through 2031. Interest rates range from LIBOR plus 170 basis points (2.12% as of December 31, 2015) to 9.75% (weighted-average interest rate of 5.62% as of December 31, 2015). The scheduled principal payments (excluding any extension options available to the Company) of all mortgages payable, excluding unamortized fair value debt adjustments of $42.6 million and unamortized debt issuance costs of $3.2 million, as of December 31, 2015, were as follows (in millions): 2016, $490.5; 2017, $571.5; 2018, $137.3; 2019, $14.4; 2020, $99.6 and thereafter, $262.3.
14. Noncontrolling Interests:
Noncontrolling interests represent the portion of equity that the Company does not own in those entities it consolidates as a result of having a controlling interest or determined that the Company was the primary beneficiary of a VIE in accordance with the provisions of the FASB’s Consolidation guidance. The Company accounts and reports for noncontrolling interests in accordance with the Consolidation guidance and the Distinguishing Liabilities from Equity guidance issued by the FASB. The Company identifies its noncontrolling interests separately within the equity section on the Company’s Consolidated Balance Sheets. Units that are determined to be mandatorily redeemable are classified as Redeemable noncontrolling interests and presented in the mezzanine section between Total liabilities and Stockholder’s equity on the Company’s Consolidated Balance Sheets. The amounts of consolidated net income attributable to the Company and to the noncontrolling interests are presented separately on the Company’s Consolidated Statements of Income. The Company owns seven shopping center properties located throughout Puerto Rico. These properties were acquired partially through the issuance of $158.6 million of non-convertible units and $45.8 million of convertible units. Noncontrolling interests related to these acquisitions totaled $233.0 million of units, including premiums of $13.5 million and a fair market value adjustment of $15.1 million (collectively, the "Units"). The Company was restricted from disposing of these assets, other than through a tax free transaction, until November 2015. The Units and related annual cash distribution rates consisted of the following:
Type Number of
Units Issued Par Value
Per Unit
Return Per Annum
Preferred A Units (1) 81,800,000 $ 1.00 7.0% Class A Preferred Units (1) 2,000 $ 10,000 LIBOR plus 2.0% Class B-1 Preferred Units (2) 2,627 $ 10,000 7.0% Class B-2 Preferred Units (1) 5,673 $ 10,000 7.0%
Class C DownReit Units (2) 640,001 $ 30.52 Equal to the Company’s common
stock dividend
(1) These units are redeemable for cash by the holder or callable by the Company and are included in Redeemable noncontrolling interests on the Company’s Consolidated Balance Sheets.
(2) These units are redeemable for cash by the holder or at the Company’s option, shares of the Company’s common stock, based upon the
conversion calculation as defined in the agreement. These units are included in Noncontrolling interests on the Company’s Consolidated Balance Sheets.
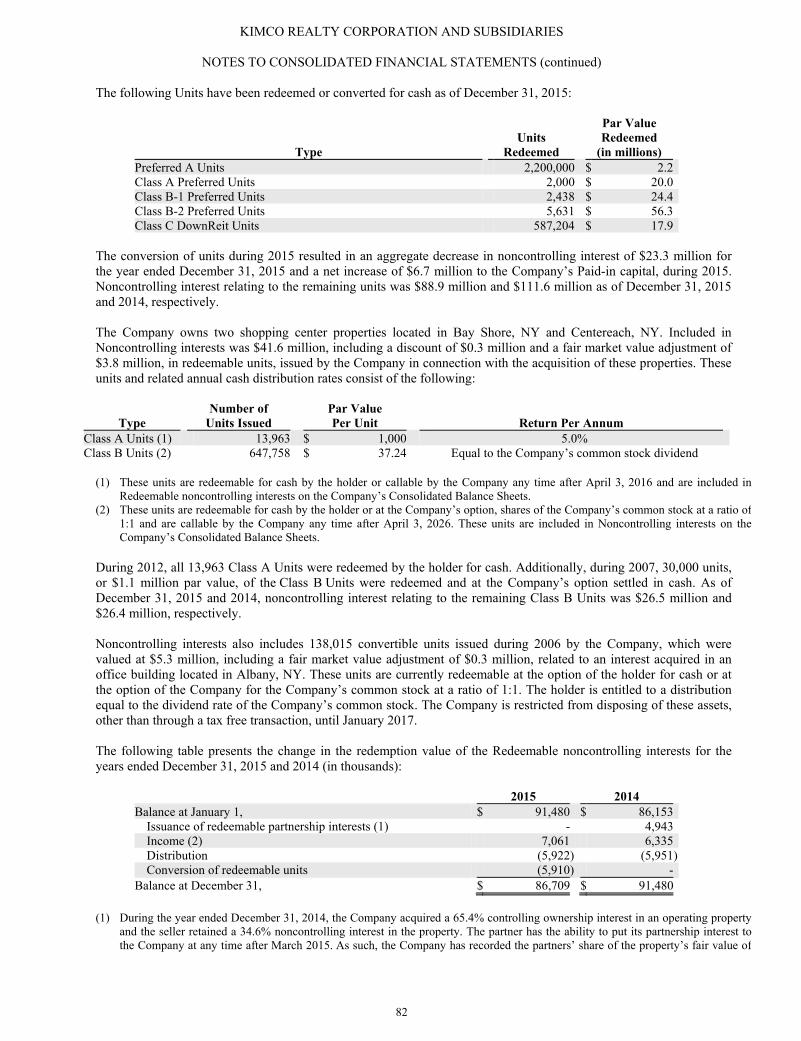
KIMCO REALTY CORPORATION AND SUBSIDIARIES
NOTES TO CONSOLIDATED FINANCIAL STATEMENTS (continued)
82
The following Units have been redeemed or converted for cash as of December 31, 2015:
Type Units
Redeemed
Par Value Redeemed
(in millions) Preferred A Units 2,200,000 $ 2.2 Class A Preferred Units 2,000 $ 20.0 Class B-1 Preferred Units 2,438 $ 24.4 Class B-2 Preferred Units 5,631 $ 56.3 Class C DownReit Units 587,204 $ 17.9
The conversion of units during 2015 resulted in an aggregate decrease in noncontrolling interest of $23.3 million for the year ended December 31, 2015 and a net increase of $6.7 million to the Company’s Paid-in capital, during 2015. Noncontrolling interest relating to the remaining units was $88.9 million and $111.6 million as of December 31, 2015 and 2014, respectively.
The Company owns two shopping center properties located in Bay Shore, NY and Centereach, NY. Included in Noncontrolling interests was $41.6 million, including a discount of $0.3 million and a fair market value adjustment of $3.8 million, in redeemable units, issued by the Company in connection with the acquisition of these properties. These units and related annual cash distribution rates consist of the following:
Type Number of
Units Issued Par Value
Per Unit
Return Per Annum
Class A Units (1) 13,963 $ 1,000 5.0% Class B Units (2) 647,758 $ 37.24 Equal to the Company’s common stock dividend
(1) These units are redeemable for cash by the holder or callable by the Company any time after April 3, 2016 and are included in
Redeemable noncontrolling interests on the Company’s Consolidated Balance Sheets.
(2) These units are redeemable for cash by the holder or at the Company’s option, shares of the Company’s common stock at a ratio of
1:1 and are callable by the Company any time after April 3, 2026. These units are included in Noncontrolling interests on theCompany’s Consolidated Balance Sheets.
During 2012, all 13,963 Class A Units were redeemed by the holder for cash. Additionally, during 2007, 30,000 units, or $1.1 million par value, of the Class B Units were redeemed and at the Company’s option settled in cash. As of December 31, 2015 and 2014, noncontrolling interest relating to the remaining Class B Units was $26.5 million and $26.4 million, respectively. Noncontrolling interests also includes 138,015 convertible units issued during 2006 by the Company, which were valued at $5.3 million, including a fair market value adjustment of $0.3 million, related to an interest acquired in an office building located in Albany, NY. These units are currently redeemable at the option of the holder for cash or at the option of the Company for the Company’s common stock at a ratio of 1:1. The holder is entitled to a distribution equal to the dividend rate of the Company’s common stock. The Company is restricted from disposing of these assets, other than through a tax free transaction, until January 2017. The following table presents the change in the redemption value of the Redeemable noncontrolling interests for the years ended December 31, 2015 and 2014 (in thousands):
2015 2014 Balance at January 1, $ 91,480 $ 86,153
Issuance of redeemable partnership interests (1) - 4,943 Income (2) 7,061 6,335 Distribution (5,922) (5,951)Conversion of redeemable units (5,910) -
Balance at December 31, $ 86,709 $ 91,480
(1) During the year ended December 31, 2014, the Company acquired a 65.4% controlling ownership interest in an operating property
and the seller retained a 34.6% noncontrolling interest in the property. The partner has the ability to put its partnership interest to the Company at any time after March 2015. As such, the Company has recorded the partners’ share of the property’s fair value of
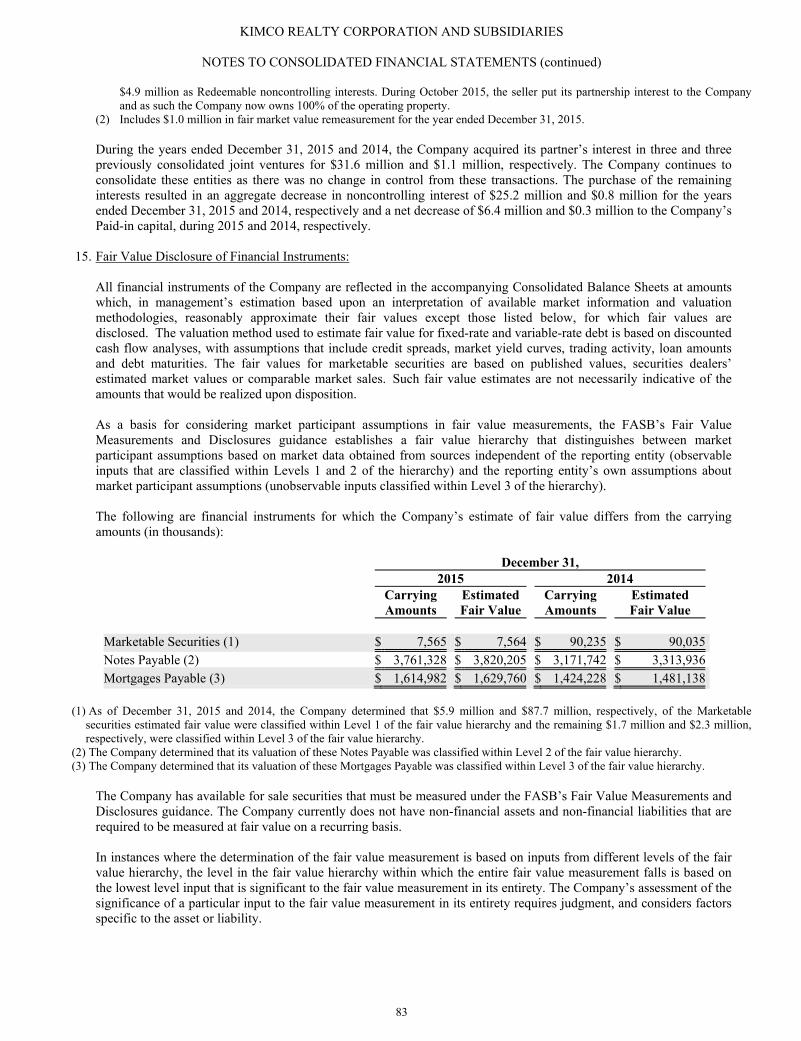
KIMCO REALTY CORPORATION AND SUBSIDIARIES
NOTES TO CONSOLIDATED FINANCIAL STATEMENTS (continued)
83
$4.9 million as Redeemable noncontrolling interests. During October 2015, the seller put its partnership interest to the Company and as such the Company now owns 100% of the operating property.
(2) Includes $1.0 million in fair market value remeasurement for the year ended December 31, 2015.
During the years ended December 31, 2015 and 2014, the Company acquired its partner’s interest in three and three previously consolidated joint ventures for $31.6 million and $1.1 million, respectively. The Company continues to consolidate these entities as there was no change in control from these transactions. The purchase of the remaining interests resulted in an aggregate decrease in noncontrolling interest of $25.2 million and $0.8 million for the years ended December 31, 2015 and 2014, respectively and a net decrease of $6.4 million and $0.3 million to the Company’s Paid-in capital, during 2015 and 2014, respectively.
15. Fair Value Disclosure of Financial Instruments:
All financial instruments of the Company are reflected in the accompanying Consolidated Balance Sheets at amounts which, in management’s estimation based upon an interpretation of available market information and valuation methodologies, reasonably approximate their fair values except those listed below, for which fair values are disclosed. The valuation method used to estimate fair value for fixed-rate and variable-rate debt is based on discounted cash flow analyses, with assumptions that include credit spreads, market yield curves, trading activity, loan amounts and debt maturities. The fair values for marketable securities are based on published values, securities dealers’ estimated market values or comparable market sales. Such fair value estimates are not necessarily indicative of the amounts that would be realized upon disposition. As a basis for considering market participant assumptions in fair value measurements, the FASB’s Fair Value Measurements and Disclosures guidance establishes a fair value hierarchy that distinguishes between market participant assumptions based on market data obtained from sources independent of the reporting entity (observable inputs that are classified within Levels 1 and 2 of the hierarchy) and the reporting entity’s own assumptions about market participant assumptions (unobservable inputs classified within Level 3 of the hierarchy). The following are financial instruments for which the Company’s estimate of fair value differs from the carrying amounts (in thousands):
December 31, 2015 2014 Carrying
Amounts Estimated
Fair Value Carrying
Amounts Estimated
Fair Value
Marketable Securities (1) $ 7,565 $ 7,564 $ 90,235 $ 90,035 Notes Payable (2) $ 3,761,328 $ 3,820,205 $ 3,171,742 $ 3,313,936 Mortgages Payable (3) $ 1,614,982 $ 1,629,760 $ 1,424,228 $ 1,481,138
(1) As of December 31, 2015 and 2014, the Company determined that $5.9 million and $87.7 million, respectively, of the Marketable
securities estimated fair value were classified within Level 1 of the fair value hierarchy and the remaining $1.7 million and $2.3 million,respectively, were classified within Level 3 of the fair value hierarchy.
(2) The Company determined that its valuation of these Notes Payable was classified within Level 2 of the fair value hierarchy. (3) The Company determined that its valuation of these Mortgages Payable was classified within Level 3 of the fair value hierarchy.
The Company has available for sale securities that must be measured under the FASB’s Fair Value Measurements and Disclosures guidance. The Company currently does not have non-financial assets and non-financial liabilities that are required to be measured at fair value on a recurring basis. In instances where the determination of the fair value measurement is based on inputs from different levels of the fair value hierarchy, the level in the fair value hierarchy within which the entire fair value measurement falls is based on the lowest level input that is significant to the fair value measurement in its entirety. The Company’s assessment of the significance of a particular input to the fair value measurement in its entirety requires judgment, and considers factors specific to the asset or liability.
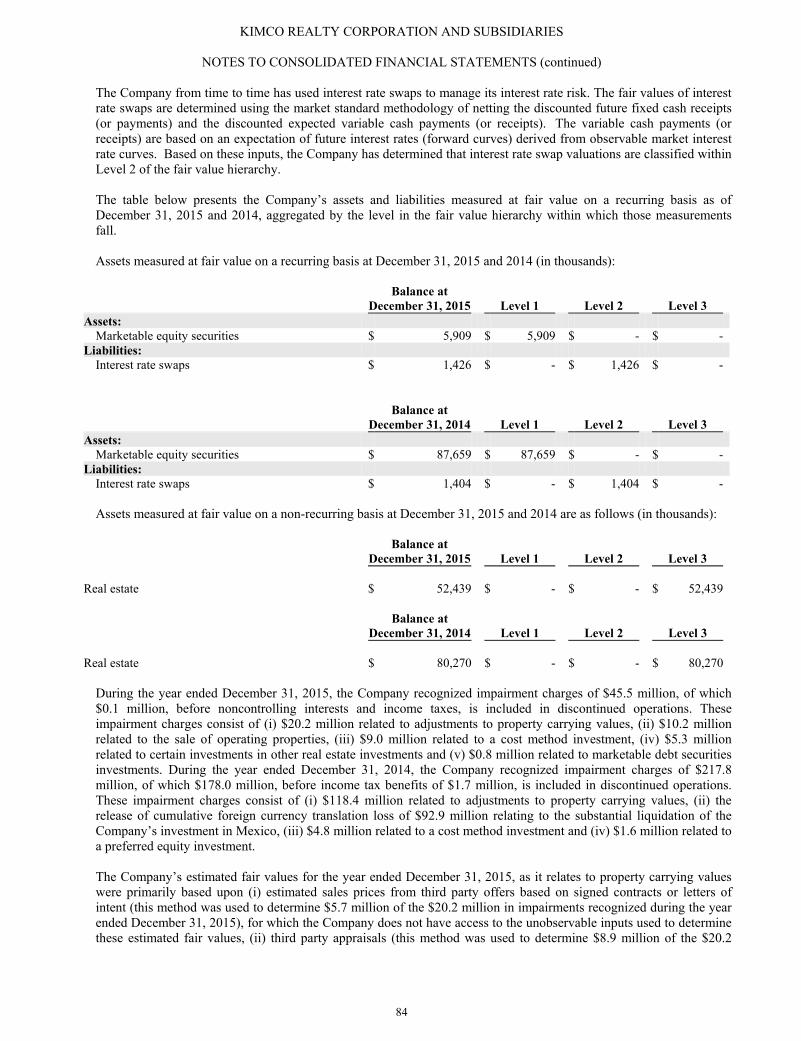
KIMCO REALTY CORPORATION AND SUBSIDIARIES
NOTES TO CONSOLIDATED FINANCIAL STATEMENTS (continued)
84
The Company from time to time has used interest rate swaps to manage its interest rate risk. The fair values of interest rate swaps are determined using the market standard methodology of netting the discounted future fixed cash receipts (or payments) and the discounted expected variable cash payments (or receipts). The variable cash payments (or receipts) are based on an expectation of future interest rates (forward curves) derived from observable market interest rate curves. Based on these inputs, the Company has determined that interest rate swap valuations are classified within Level 2 of the fair value hierarchy.
The table below presents the Company’s assets and liabilities measured at fair value on a recurring basis as of December 31, 2015 and 2014, aggregated by the level in the fair value hierarchy within which those measurements fall. Assets measured at fair value on a recurring basis at December 31, 2015 and 2014 (in thousands):
Balance at
December 31, 2015 Level 1 Level 2 Level 3 Assets:
Marketable equity securities $ 5,909 $ 5,909 $ - $ - Liabilities:
Interest rate swaps $ 1,426 $ - $ 1,426 $ -
Balance at
December 31, 2014 Level 1 Level 2 Level 3 Assets:
Marketable equity securities $ 87,659 $ 87,659 $ - $ - Liabilities:
Interest rate swaps $ 1,404 $ - $ 1,404 $ - Assets measured at fair value on a non-recurring basis at December 31, 2015 and 2014 are as follows (in thousands):
Balance at
December 31, 2015 Level 1 Level 2 Level 3 Real estate $ 52,439 $ - $ - $ 52,439
Balance at
December 31, 2014 Level 1 Level 2 Level 3 Real estate $ 80,270 $ - $ - $ 80,270
During the year ended December 31, 2015, the Company recognized impairment charges of $45.5 million, of which $0.1 million, before noncontrolling interests and income taxes, is included in discontinued operations. These impairment charges consist of (i) $20.2 million related to adjustments to property carrying values, (ii) $10.2 million related to the sale of operating properties, (iii) $9.0 million related to a cost method investment, (iv) $5.3 million related to certain investments in other real estate investments and (v) $0.8 million related to marketable debt securities investments. During the year ended December 31, 2014, the Company recognized impairment charges of $217.8 million, of which $178.0 million, before income tax benefits of $1.7 million, is included in discontinued operations. These impairment charges consist of (i) $118.4 million related to adjustments to property carrying values, (ii) the release of cumulative foreign currency translation loss of $92.9 million relating to the substantial liquidation of the Company’s investment in Mexico, (iii) $4.8 million related to a cost method investment and (iv) $1.6 million related to a preferred equity investment. The Company’s estimated fair values for the year ended December 31, 2015, as it relates to property carrying values were primarily based upon (i) estimated sales prices from third party offers based on signed contracts or letters of intent (this method was used to determine $5.7 million of the $20.2 million in impairments recognized during the year ended December 31, 2015), for which the Company does not have access to the unobservable inputs used to determine these estimated fair values, (ii) third party appraisals (this method was used to determine $8.9 million of the $20.2
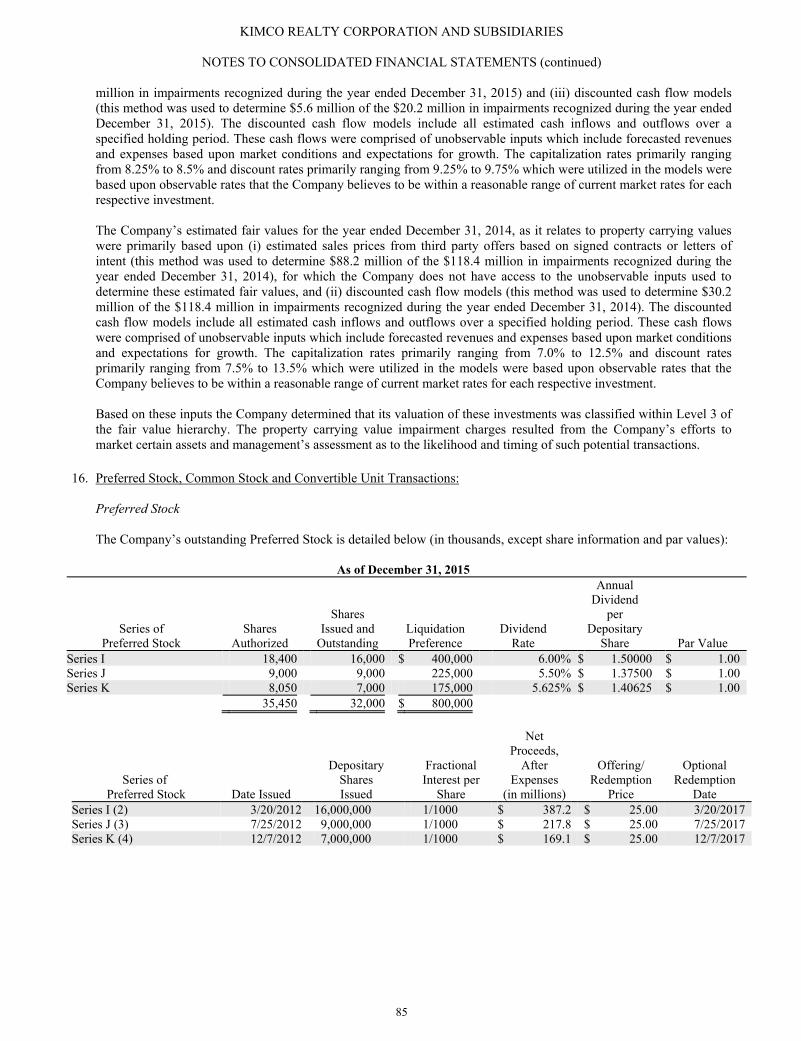
KIMCO REALTY CORPORATION AND SUBSIDIARIES
NOTES TO CONSOLIDATED FINANCIAL STATEMENTS (continued)
85
million in impairments recognized during the year ended December 31, 2015) and (iii) discounted cash flow models (this method was used to determine $5.6 million of the $20.2 million in impairments recognized during the year ended December 31, 2015). The discounted cash flow models include all estimated cash inflows and outflows over a specified holding period. These cash flows were comprised of unobservable inputs which include forecasted revenues and expenses based upon market conditions and expectations for growth. The capitalization rates primarily ranging from 8.25% to 8.5% and discount rates primarily ranging from 9.25% to 9.75% which were utilized in the models were based upon observable rates that the Company believes to be within a reasonable range of current market rates for each respective investment.
The Company’s estimated fair values for the year ended December 31, 2014, as it relates to property carrying values were primarily based upon (i) estimated sales prices from third party offers based on signed contracts or letters of intent (this method was used to determine $88.2 million of the $118.4 million in impairments recognized during the year ended December 31, 2014), for which the Company does not have access to the unobservable inputs used to determine these estimated fair values, and (ii) discounted cash flow models (this method was used to determine $30.2 million of the $118.4 million in impairments recognized during the year ended December 31, 2014). The discounted cash flow models include all estimated cash inflows and outflows over a specified holding period. These cash flows were comprised of unobservable inputs which include forecasted revenues and expenses based upon market conditions and expectations for growth. The capitalization rates primarily ranging from 7.0% to 12.5% and discount rates primarily ranging from 7.5% to 13.5% which were utilized in the models were based upon observable rates that the Company believes to be within a reasonable range of current market rates for each respective investment. Based on these inputs the Company determined that its valuation of these investments was classified within Level 3 of the fair value hierarchy. The property carrying value impairment charges resulted from the Company’s efforts to market certain assets and management’s assessment as to the likelihood and timing of such potential transactions.
16. Preferred Stock, Common Stock and Convertible Unit Transactions: Preferred Stock The Company’s outstanding Preferred Stock is detailed below (in thousands, except share information and par values):
As of December 31, 2015
Series of Preferred Stock
Shares Authorized
Shares Issued and
Outstanding Liquidation Preference
Dividend Rate
Annual Dividend
per Depositary
Share Par Value Series I 18,400 16,000 $ 400,000 6.00% $ 1.50000 $ 1.00 Series J 9,000 9,000 225,000 5.50% $ 1.37500 $ 1.00 Series K 8,050 7,000 175,000 5.625% $ 1.40625 $ 1.00 35,450 32,000 $ 800,000
Series of Preferred Stock Date Issued
Depositary Shares Issued
Fractional Interest per
Share
Net Proceeds,
After Expenses
(in millions)
Offering/ Redemption
Price
Optional Redemption
Date Series I (2) 3/20/2012 16,000,000 1/1000 $ 387.2 $ 25.00 3/20/2017 Series J (3) 7/25/2012 9,000,000 1/1000 $ 217.8 $ 25.00 7/25/2017 Series K (4) 12/7/2012 7,000,000 1/1000 $ 169.1 $ 25.00 12/7/2017
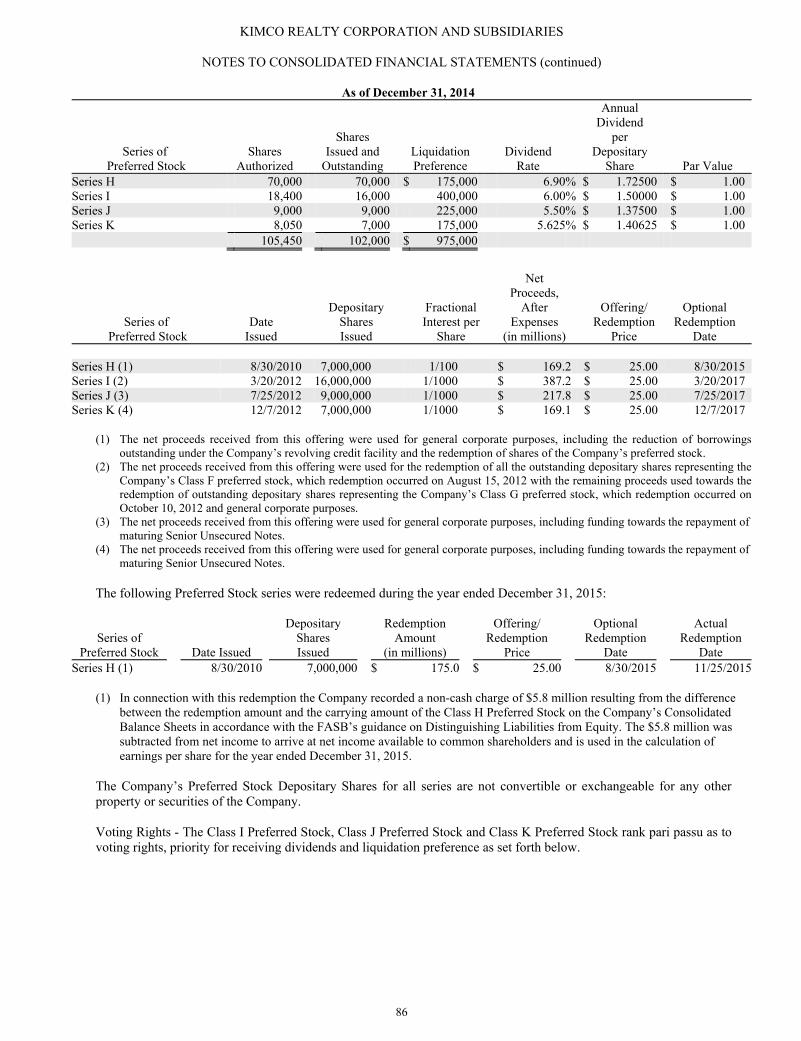
KIMCO REALTY CORPORATION AND SUBSIDIARIES
NOTES TO CONSOLIDATED FINANCIAL STATEMENTS (continued)
86
As of December 31, 2014
Series of Preferred Stock
Shares Authorized
Shares Issued and
Outstanding Liquidation Preference
Dividend Rate
Annual Dividend
per Depositary
Share Par Value Series H 70,000 70,000 $ 175,000 6.90% $ 1.72500 $ 1.00 Series I 18,400 16,000 400,000 6.00% $ 1.50000 $ 1.00 Series J 9,000 9,000 225,000 5.50% $ 1.37500 $ 1.00 Series K 8,050 7,000 175,000 5.625% $ 1.40625 $ 1.00 105,450 102,000 $ 975,000
Series of Preferred Stock
Date Issued
Depositary Shares Issued
Fractional Interest per
Share
Net Proceeds,
After Expenses
(in millions)
Offering/ Redemption
Price
Optional Redemption
Date Series H (1) 8/30/2010 7,000,000 1/100 $ 169.2 $ 25.00 8/30/2015 Series I (2) 3/20/2012 16,000,000 1/1000 $ 387.2 $ 25.00 3/20/2017 Series J (3) 7/25/2012 9,000,000 1/1000 $ 217.8 $ 25.00 7/25/2017 Series K (4) 12/7/2012 7,000,000 1/1000 $ 169.1 $ 25.00 12/7/2017 (1) The net proceeds received from this offering were used for general corporate purposes, including the reduction of borrowings
outstanding under the Company’s revolving credit facility and the redemption of shares of the Company’s preferred stock.
(2) The net proceeds received from this offering were used for the redemption of all the outstanding depositary shares representing the Company’s Class F preferred stock, which redemption occurred on August 15, 2012 with the remaining proceeds used towards the redemption of outstanding depositary shares representing the Company’s Class G preferred stock, which redemption occurred onOctober 10, 2012 and general corporate purposes.
(3) The net proceeds received from this offering were used for general corporate purposes, including funding towards the repayment of maturing Senior Unsecured Notes.
(4) The net proceeds received from this offering were used for general corporate purposes, including funding towards the repayment of maturing Senior Unsecured Notes.
The following Preferred Stock series were redeemed during the year ended December 31, 2015:
Series of Preferred Stock Date Issued
Depositary Shares Issued
Redemption Amount
(in millions)
Offering/ Redemption
Price
Optional Redemption
Date
Actual Redemption
Date Series H (1) 8/30/2010 7,000,000 $ 175.0 $ 25.00 8/30/2015 11/25/2015
(1) In connection with this redemption the Company recorded a non-cash charge of $5.8 million resulting from the difference between the redemption amount and the carrying amount of the Class H Preferred Stock on the Company’s Consolidated Balance Sheets in accordance with the FASB’s guidance on Distinguishing Liabilities from Equity. The $5.8 million was subtracted from net income to arrive at net income available to common shareholders and is used in the calculation of earnings per share for the year ended December 31, 2015.
The Company’s Preferred Stock Depositary Shares for all series are not convertible or exchangeable for any other property or securities of the Company. Voting Rights - The Class I Preferred Stock, Class J Preferred Stock and Class K Preferred Stock rank pari passu as to voting rights, priority for receiving dividends and liquidation preference as set forth below.
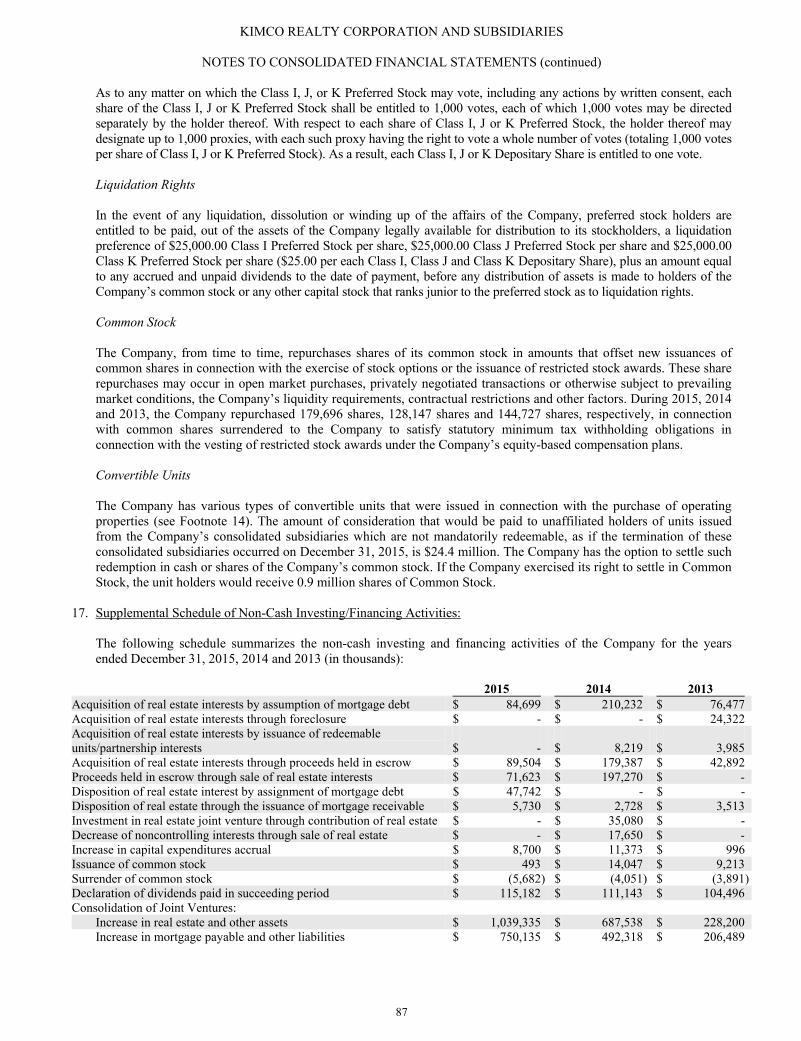
KIMCO REALTY CORPORATION AND SUBSIDIARIES
NOTES TO CONSOLIDATED FINANCIAL STATEMENTS (continued)
87
As to any matter on which the Class I, J, or K Preferred Stock may vote, including any actions by written consent, each share of the Class I, J or K Preferred Stock shall be entitled to 1,000 votes, each of which 1,000 votes may be directed separately by the holder thereof. With respect to each share of Class I, J or K Preferred Stock, the holder thereof may designate up to 1,000 proxies, with each such proxy having the right to vote a whole number of votes (totaling 1,000 votes per share of Class I, J or K Preferred Stock). As a result, each Class I, J or K Depositary Share is entitled to one vote. Liquidation Rights In the event of any liquidation, dissolution or winding up of the affairs of the Company, preferred stock holders are entitled to be paid, out of the assets of the Company legally available for distribution to its stockholders, a liquidation preference of $25,000.00 Class I Preferred Stock per share, $25,000.00 Class J Preferred Stock per share and $25,000.00 Class K Preferred Stock per share ($25.00 per each Class I, Class J and Class K Depositary Share), plus an amount equal to any accrued and unpaid dividends to the date of payment, before any distribution of assets is made to holders of the Company’s common stock or any other capital stock that ranks junior to the preferred stock as to liquidation rights. Common Stock The Company, from time to time, repurchases shares of its common stock in amounts that offset new issuances of common shares in connection with the exercise of stock options or the issuance of restricted stock awards. These share repurchases may occur in open market purchases, privately negotiated transactions or otherwise subject to prevailing market conditions, the Company’s liquidity requirements, contractual restrictions and other factors. During 2015, 2014 and 2013, the Company repurchased 179,696 shares, 128,147 shares and 144,727 shares, respectively, in connection with common shares surrendered to the Company to satisfy statutory minimum tax withholding obligations in connection with the vesting of restricted stock awards under the Company’s equity-based compensation plans. Convertible Units The Company has various types of convertible units that were issued in connection with the purchase of operating properties (see Footnote 14). The amount of consideration that would be paid to unaffiliated holders of units issued from the Company’s consolidated subsidiaries which are not mandatorily redeemable, as if the termination of these consolidated subsidiaries occurred on December 31, 2015, is $24.4 million. The Company has the option to settle such redemption in cash or shares of the Company’s common stock. If the Company exercised its right to settle in Common Stock, the unit holders would receive 0.9 million shares of Common Stock.
17. Supplemental Schedule of Non-Cash Investing/Financing Activities:
The following schedule summarizes the non-cash investing and financing activities of the Company for the years ended December 31, 2015, 2014 and 2013 (in thousands):
2015 2014 2013 Acquisition of real estate interests by assumption of mortgage debt $ 84,699 $ 210,232 $ 76,477 Acquisition of real estate interests through foreclosure $ - $ - $ 24,322 Acquisition of real estate interests by issuance of redeemable units/partnership interests $ - $ 8,219 $ 3,985 Acquisition of real estate interests through proceeds held in escrow $ 89,504 $ 179,387 $ 42,892 Proceeds held in escrow through sale of real estate interests $ 71,623 $ 197,270 $ - Disposition of real estate interest by assignment of mortgage debt $ 47,742 $ - $ - Disposition of real estate through the issuance of mortgage receivable $ 5,730 $ 2,728 $ 3,513 Investment in real estate joint venture through contribution of real estate $ - $ 35,080 $ - Decrease of noncontrolling interests through sale of real estate $ - $ 17,650 $ - Increase in capital expenditures accrual $ 8,700 $ 11,373 $ 996 Issuance of common stock $ 493 $ 14,047 $ 9,213 Surrender of common stock $ (5,682) $ (4,051) $ (3,891)Declaration of dividends paid in succeeding period $ 115,182 $ 111,143 $ 104,496 Consolidation of Joint Ventures:
Increase in real estate and other assets $ 1,039,335 $ 687,538 $ 228,200 Increase in mortgage payable and other liabilities $ 750,135 $ 492,318 $ 206,489
KIMCO REALTY CORPORATION AND SUBSIDIARIES
NOTES TO CONSOLIDATED FINANCIAL STATEMENTS (continued)
88
18. Transactions with Related Parties: The Company provides management services for shopping centers owned principally by affiliated entities and various real estate joint ventures in which certain stockholders of the Company have economic interests. Such services are performed pursuant to management agreements which provide for fees based upon a percentage of gross revenues from the properties and other direct costs incurred in connection with management of the centers. Substantially all of the Management and other fee income on the Company’s Consolidated Statements of Income constitute fees earned from affiliated entities. Reference is made to Footnotes 3, 7 and 19 for additional information regarding transactions with related parties. Ripco Real Estate Corp. (“Ripco”) business activities include serving as a leasing agent and representative for national and regional retailers including Target, Best Buy, Kohls and many others, providing real estate brokerage services and principal real estate investing. Mr. Todd Cooper, an officer and 50% shareholder of Ripco, is a son of Mr. Milton Cooper, Executive Chairman of the Board of Directors of the Company. During 2015, 2014 and 2013, the Company paid brokerage commissions of $0.6 million, $0.3 million and $0.6 million, respectively, to Ripco for services rendered primarily as leasing agent for various national tenants in shopping center properties owned by the Company. ProHEALTH is a multi-specialty physician group practice offering one-stop health care. ProHEALTH’s CEO, Dr. David Cooper, M.D. is a son of Milton Cooper, Executive Chairman of the Company. ProHEALTH and/or its affiliates (“ProHEALTH”) have leasing arrangements with the Company whereby two consolidated property locations are currently under lease. Total annual base rent for these properties leased to ProHEALTH for the years ended December 31, 2015, 2014 and 2013 aggregated to $0.4 million, $0.1 million and $0.1 million, respectively. During January 2015, Colony contributed $100.0 million, to the ABS Venture, which was subsequently contributed to AB Acquisition to facilitate the acquisition of all of the outstanding shares of Safeway. As a result of this transaction, the ABS Venture now holds a combined 14.35% interest in AB Acquisition, of which the Company holds a combined 9.8% ownership interest and Colony holds a 4.3% ownership interest. Richard B. Saltzman, a member of the Board of Directors of the Company, is the chief executive officer, president and a director of Colony Capital, Inc. (see Footnote 8).
19. Commitments and Contingencies:
Operations The Company and its subsidiaries are primarily engaged in the operation of shopping centers that are either owned or held under long-term leases that expire at various dates through 2114. The Company and its subsidiaries, in turn, lease premises in these centers to tenants pursuant to lease agreements which provide for terms ranging generally from 5 to 25 years and for annual minimum rentals plus incremental rents based on operating expense levels and tenants' sales volumes. Annual minimum rentals plus incremental rents based on operating expense levels and percentage rents comprised 98% of total revenues from rental property for each of the three years ended December 31, 2015, 2014 and 2013. The future minimum revenues from rental property under the terms of all non-cancelable tenant leases, assuming no new or renegotiated leases are executed for such premises, for future years are as follows (in millions): 2016, $825.8; 2017, $741.4; 2018, $636.7; 2019, $541.5; 2020, $446.2 and thereafter; $1,955.2. Base rental revenues from rental property are recognized on a straight-line basis over the terms of the related leases. The difference between the amount of rental income contracted through leases and rental income recognized on a straight-line basis before allowances for the years ended December 31, 2015, 2014 and 2013 was $14.8 million, $8.4 million and $4.8 million, respectively. Minimum rental payments to be made by the Company under the terms of all non-cancelable operating leases pertaining to the Company’s shopping center portfolio for future years are as follows (in millions): 2016, $12.7; 2017, $12.3; 2018, $12.0; 2019, $11.2; 2020, $10.7 and thereafter, $193.6.
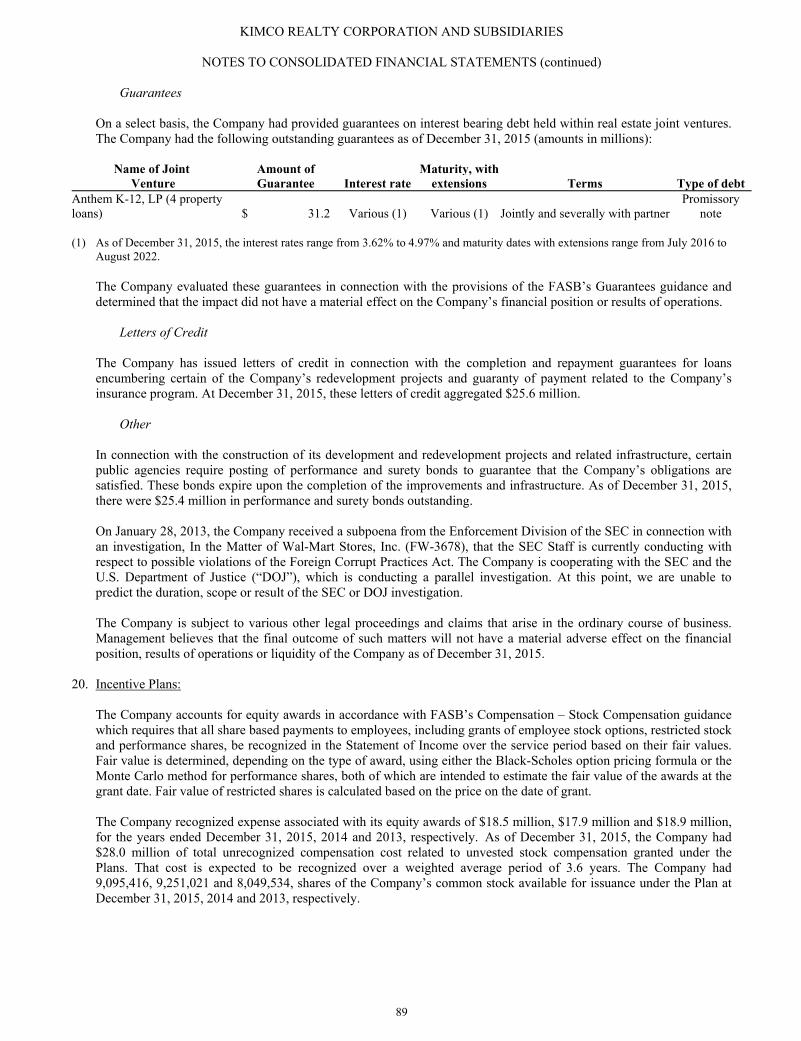
KIMCO REALTY CORPORATION AND SUBSIDIARIES
NOTES TO CONSOLIDATED FINANCIAL STATEMENTS (continued)
89
Guarantees On a select basis, the Company had provided guarantees on interest bearing debt held within real estate joint ventures. The Company had the following outstanding guarantees as of December 31, 2015 (amounts in millions):
Name of Joint Venture
Amount of Guarantee Interest rate
Maturity, with extensions Terms Type of debt
Anthem K-12, LP (4 property loans) $ 31.2 Various (1) Various (1) Jointly and severally with partner
Promissory note
(1) As of December 31, 2015, the interest rates range from 3.62% to 4.97% and maturity dates with extensions range from July 2016 to
August 2022. The Company evaluated these guarantees in connection with the provisions of the FASB’s Guarantees guidance and determined that the impact did not have a material effect on the Company’s financial position or results of operations.
Letters of Credit The Company has issued letters of credit in connection with the completion and repayment guarantees for loans encumbering certain of the Company’s redevelopment projects and guaranty of payment related to the Company’s insurance program. At December 31, 2015, these letters of credit aggregated $25.6 million.
Other In connection with the construction of its development and redevelopment projects and related infrastructure, certain public agencies require posting of performance and surety bonds to guarantee that the Company’s obligations are satisfied. These bonds expire upon the completion of the improvements and infrastructure. As of December 31, 2015, there were $25.4 million in performance and surety bonds outstanding. On January 28, 2013, the Company received a subpoena from the Enforcement Division of the SEC in connection with an investigation, In the Matter of Wal-Mart Stores, Inc. (FW-3678), that the SEC Staff is currently conducting with respect to possible violations of the Foreign Corrupt Practices Act. The Company is cooperating with the SEC and the U.S. Department of Justice (“DOJ”), which is conducting a parallel investigation. At this point, we are unable to predict the duration, scope or result of the SEC or DOJ investigation. The Company is subject to various other legal proceedings and claims that arise in the ordinary course of business. Management believes that the final outcome of such matters will not have a material adverse effect on the financial position, results of operations or liquidity of the Company as of December 31, 2015.
20. Incentive Plans:
The Company accounts for equity awards in accordance with FASB’s Compensation – Stock Compensation guidance which requires that all share based payments to employees, including grants of employee stock options, restricted stock and performance shares, be recognized in the Statement of Income over the service period based on their fair values. Fair value is determined, depending on the type of award, using either the Black-Scholes option pricing formula or the Monte Carlo method for performance shares, both of which are intended to estimate the fair value of the awards at the grant date. Fair value of restricted shares is calculated based on the price on the date of grant. The Company recognized expense associated with its equity awards of $18.5 million, $17.9 million and $18.9 million, for the years ended December 31, 2015, 2014 and 2013, respectively. As of December 31, 2015, the Company had $28.0 million of total unrecognized compensation cost related to unvested stock compensation granted under the Plans. That cost is expected to be recognized over a weighted average period of 3.6 years. The Company had 9,095,416, 9,251,021 and 8,049,534, shares of the Company’s common stock available for issuance under the Plan at December 31, 2015, 2014 and 2013, respectively.
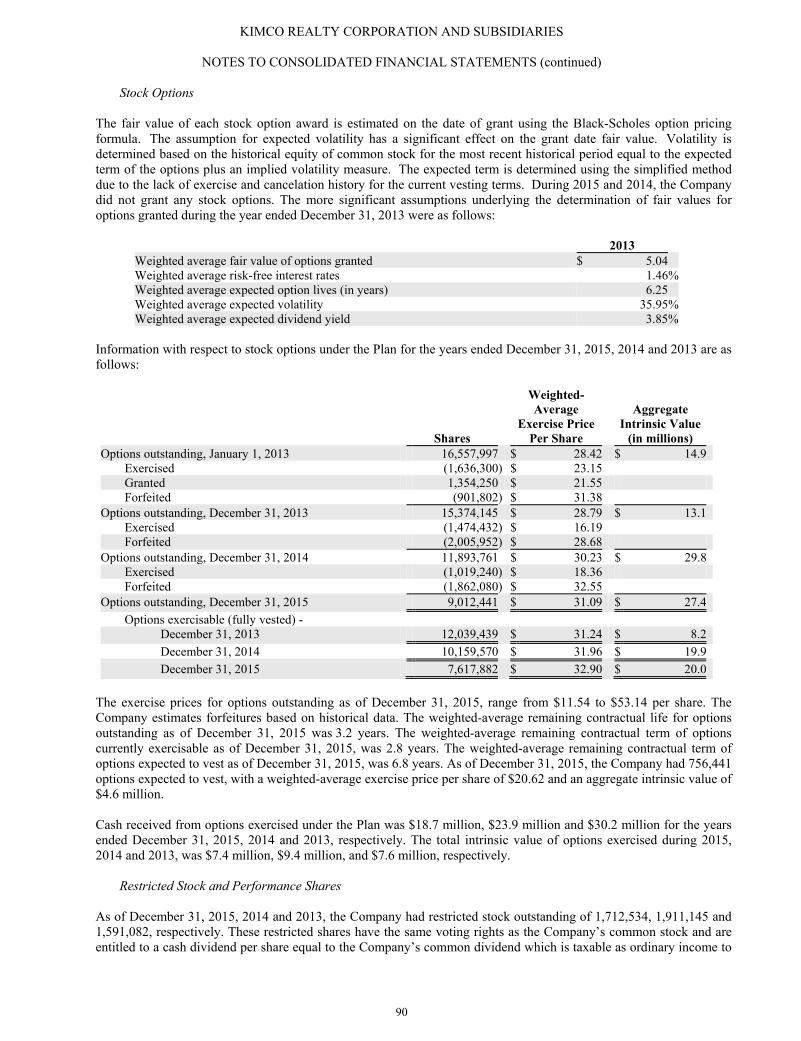
KIMCO REALTY CORPORATION AND SUBSIDIARIES
NOTES TO CONSOLIDATED FINANCIAL STATEMENTS (continued)
90
Stock Options The fair value of each stock option award is estimated on the date of grant using the Black-Scholes option pricing formula. The assumption for expected volatility has a significant effect on the grant date fair value. Volatility is determined based on the historical equity of common stock for the most recent historical period equal to the expected term of the options plus an implied volatility measure. The expected term is determined using the simplified method due to the lack of exercise and cancelation history for the current vesting terms. During 2015 and 2014, the Company did not grant any stock options. The more significant assumptions underlying the determination of fair values for options granted during the year ended December 31, 2013 were as follows:
2013 Weighted average fair value of options granted $ 5.04 Weighted average risk-free interest rates 1.46%Weighted average expected option lives (in years) 6.25 Weighted average expected volatility 35.95%Weighted average expected dividend yield 3.85%
Information with respect to stock options under the Plan for the years ended December 31, 2015, 2014 and 2013 are as follows:
Shares
Weighted- Average
Exercise Price Per Share
Aggregate Intrinsic Value
(in millions) Options outstanding, January 1, 2013 16,557,997 $ 28.42 $ 14.9
Exercised (1,636,300) $ 23.15 Granted 1,354,250 $ 21.55 Forfeited (901,802) $ 31.38
Options outstanding, December 31, 2013 15,374,145 $ 28.79 $ 13.1 Exercised (1,474,432) $ 16.19 Forfeited (2,005,952) $ 28.68
Options outstanding, December 31, 2014 11,893,761 $ 30.23 $ 29.8 Exercised (1,019,240) $ 18.36 Forfeited (1,862,080) $ 32.55
Options outstanding, December 31, 2015 9,012,441 $ 31.09 $ 27.4 Options exercisable (fully vested) -
December 31, 2013 12,039,439 $ 31.24 $ 8.2 December 31, 2014 10,159,570 $ 31.96 $ 19.9 December 31, 2015 7,617,882 $ 32.90 $ 20.0
The exercise prices for options outstanding as of December 31, 2015, range from $11.54 to $53.14 per share. The Company estimates forfeitures based on historical data. The weighted-average remaining contractual life for options outstanding as of December 31, 2015 was 3.2 years. The weighted-average remaining contractual term of options currently exercisable as of December 31, 2015, was 2.8 years. The weighted-average remaining contractual term of options expected to vest as of December 31, 2015, was 6.8 years. As of December 31, 2015, the Company had 756,441 options expected to vest, with a weighted-average exercise price per share of $20.62 and an aggregate intrinsic value of $4.6 million. Cash received from options exercised under the Plan was $18.7 million, $23.9 million and $30.2 million for the years ended December 31, 2015, 2014 and 2013, respectively. The total intrinsic value of options exercised during 2015, 2014 and 2013, was $7.4 million, $9.4 million, and $7.6 million, respectively.
Restricted Stock and Performance Shares As of December 31, 2015, 2014 and 2013, the Company had restricted stock outstanding of 1,712,534, 1,911,145 and 1,591,082, respectively. These restricted shares have the same voting rights as the Company’s common stock and are entitled to a cash dividend per share equal to the Company’s common dividend which is taxable as ordinary income to
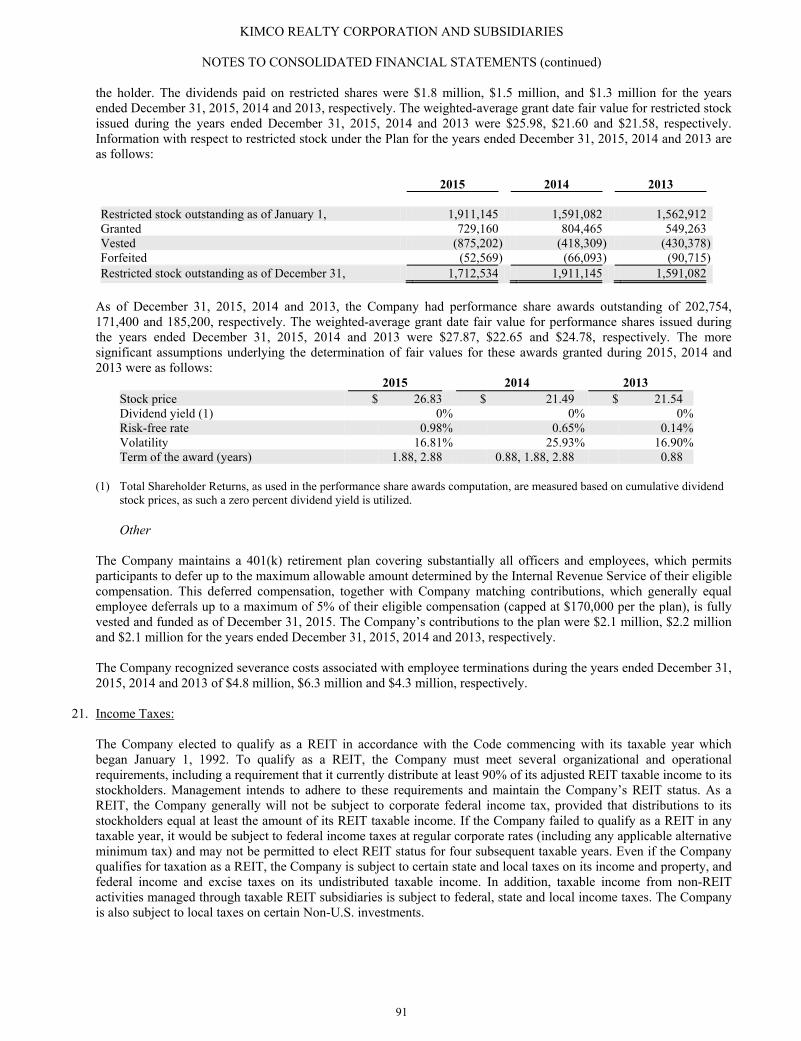
KIMCO REALTY CORPORATION AND SUBSIDIARIES
NOTES TO CONSOLIDATED FINANCIAL STATEMENTS (continued)
91
the holder. The dividends paid on restricted shares were $1.8 million, $1.5 million, and $1.3 million for the years ended December 31, 2015, 2014 and 2013, respectively. The weighted-average grant date fair value for restricted stock issued during the years ended December 31, 2015, 2014 and 2013 were $25.98, $21.60 and $21.58, respectively. Information with respect to restricted stock under the Plan for the years ended December 31, 2015, 2014 and 2013 are as follows: 2015 2014 2013 Restricted stock outstanding as of January 1, 1,911,145 1,591,082 1,562,912 Granted 729,160 804,465 549,263 Vested (875,202) (418,309 ) (430,378)Forfeited (52,569) (66,093 ) (90,715)Restricted stock outstanding as of December 31, 1,712,534 1,911,145 1,591,082
As of December 31, 2015, 2014 and 2013, the Company had performance share awards outstanding of 202,754, 171,400 and 185,200, respectively. The weighted-average grant date fair value for performance shares issued during the years ended December 31, 2015, 2014 and 2013 were $27.87, $22.65 and $24.78, respectively. The more significant assumptions underlying the determination of fair values for these awards granted during 2015, 2014 and 2013 were as follows:
2015 2014 2013 Stock price $ 26.83 $ 21.49 $ 21.54 Dividend yield (1) 0% 0% 0%Risk-free rate 0.98% 0.65% 0.14%Volatility 16.81% 25.93% 16.90%Term of the award (years) 1.88, 2.88 0.88, 1.88, 2.88 0.88
(1) Total Shareholder Returns, as used in the performance share awards computation, are measured based on cumulative dividend
stock prices, as such a zero percent dividend yield is utilized. Other
The Company maintains a 401(k) retirement plan covering substantially all officers and employees, which permits participants to defer up to the maximum allowable amount determined by the Internal Revenue Service of their eligible compensation. This deferred compensation, together with Company matching contributions, which generally equal employee deferrals up to a maximum of 5% of their eligible compensation (capped at $170,000 per the plan), is fully vested and funded as of December 31, 2015. The Company’s contributions to the plan were $2.1 million, $2.2 million and $2.1 million for the years ended December 31, 2015, 2014 and 2013, respectively. The Company recognized severance costs associated with employee terminations during the years ended December 31, 2015, 2014 and 2013 of $4.8 million, $6.3 million and $4.3 million, respectively.
21. Income Taxes:
The Company elected to qualify as a REIT in accordance with the Code commencing with its taxable year which began January 1, 1992. To qualify as a REIT, the Company must meet several organizational and operational requirements, including a requirement that it currently distribute at least 90% of its adjusted REIT taxable income to its stockholders. Management intends to adhere to these requirements and maintain the Company’s REIT status. As a REIT, the Company generally will not be subject to corporate federal income tax, provided that distributions to its stockholders equal at least the amount of its REIT taxable income. If the Company failed to qualify as a REIT in any taxable year, it would be subject to federal income taxes at regular corporate rates (including any applicable alternative minimum tax) and may not be permitted to elect REIT status for four subsequent taxable years. Even if the Company qualifies for taxation as a REIT, the Company is subject to certain state and local taxes on its income and property, and federal income and excise taxes on its undistributed taxable income. In addition, taxable income from non-REIT activities managed through taxable REIT subsidiaries is subject to federal, state and local income taxes. The Company is also subject to local taxes on certain Non-U.S. investments.
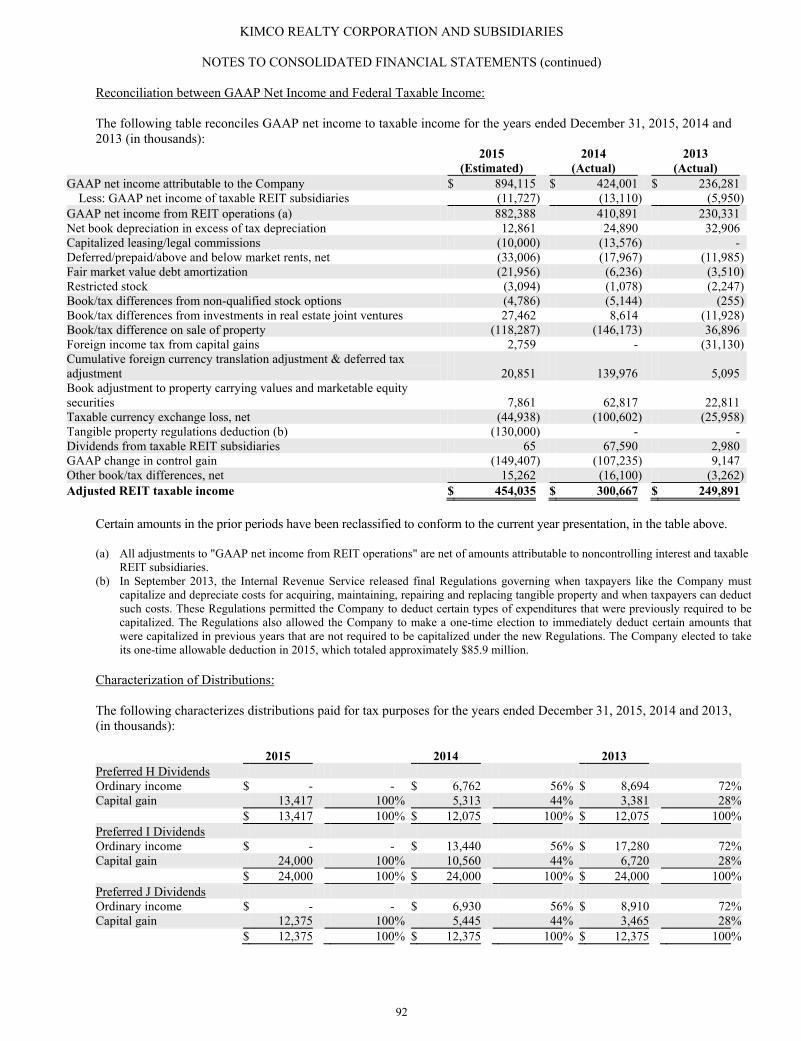
KIMCO REALTY CORPORATION AND SUBSIDIARIES
NOTES TO CONSOLIDATED FINANCIAL STATEMENTS (continued)
92
Reconciliation between GAAP Net Income and Federal Taxable Income: The following table reconciles GAAP net income to taxable income for the years ended December 31, 2015, 2014 and 2013 (in thousands):
2015 (Estimated) 2014
(Actual) 2013 (Actual)
GAAP net income attributable to the Company $ 894,115 $ 424,001 $ 236,281 Less: GAAP net income of taxable REIT subsidiaries (11,727) (13,110) (5,950)
GAAP net income from REIT operations (a) 882,388 410,891 230,331 Net book depreciation in excess of tax depreciation 12,861 24,890 32,906 Capitalized leasing/legal commissions (10,000) (13,576) - Deferred/prepaid/above and below market rents, net (33,006) (17,967) (11,985)Fair market value debt amortization (21,956) (6,236) (3,510)Restricted stock (3,094) (1,078) (2,247)Book/tax differences from non-qualified stock options (4,786) (5,144) (255) Book/tax differences from investments in real estate joint ventures 27,462 8,614 (11,928) Book/tax difference on sale of property (118,287) (146,173) 36,896 Foreign income tax from capital gains 2,759 - (31,130) Cumulative foreign currency translation adjustment & deferred tax adjustment 20,851 139,976 5,095 Book adjustment to property carrying values and marketable equity securities 7,861 62,817 22,811 Taxable currency exchange loss, net (44,938) (100,602) (25,958)Tangible property regulations deduction (b) (130,000) - - Dividends from taxable REIT subsidiaries 65 67,590 2,980 GAAP change in control gain (149,407) (107,235) 9,147 Other book/tax differences, net 15,262 (16,100) (3,262)Adjusted REIT taxable income $ 454,035 $ 300,667 $ 249,891
Certain amounts in the prior periods have been reclassified to conform to the current year presentation, in the table above.
(a) All adjustments to "GAAP net income from REIT operations" are net of amounts attributable to noncontrolling interest and taxable REIT subsidiaries.
(b) In September 2013, the Internal Revenue Service released final Regulations governing when taxpayers like the Company mustcapitalize and depreciate costs for acquiring, maintaining, repairing and replacing tangible property and when taxpayers can deductsuch costs. These Regulations permitted the Company to deduct certain types of expenditures that were previously required to be capitalized. The Regulations also allowed the Company to make a one-time election to immediately deduct certain amounts that were capitalized in previous years that are not required to be capitalized under the new Regulations. The Company elected to take its one-time allowable deduction in 2015, which totaled approximately $85.9 million.
Characterization of Distributions: The following characterizes distributions paid for tax purposes for the years ended December 31, 2015, 2014 and 2013, (in thousands): 2015 2014 2013 Preferred H Dividends Ordinary income $ - - $ 6,762 56% $ 8,694 72%Capital gain 13,417 100% 5,313 44% 3,381 28% $ 13,417 100% $ 12,075 100% $ 12,075 100%Preferred I Dividends Ordinary income $ - - $ 13,440 56% $ 17,280 72%Capital gain 24,000 100% 10,560 44% 6,720 28% $ 24,000 100% $ 24,000 100% $ 24,000 100%Preferred J Dividends Ordinary income $ - - $ 6,930 56% $ 8,910 72%Capital gain 12,375 100% 5,445 44% 3,465 28% $ 12,375 100% $ 12,375 100% $ 12,375 100%
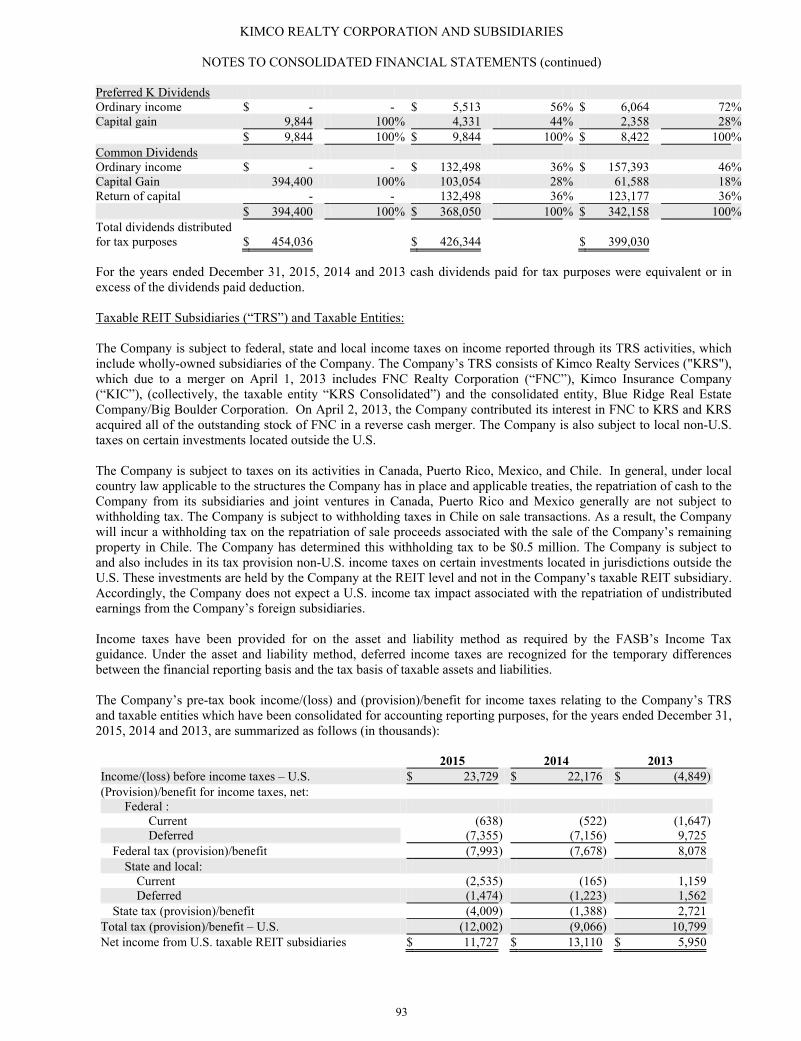
KIMCO REALTY CORPORATION AND SUBSIDIARIES
NOTES TO CONSOLIDATED FINANCIAL STATEMENTS (continued)
93
Preferred K Dividends Ordinary income $ - - $ 5,513 56% $ 6,064 72%Capital gain 9,844 100% 4,331 44% 2,358 28% $ 9,844 100% $ 9,844 100% $ 8,422 100%Common Dividends Ordinary income $ - - $ 132,498 36% $ 157,393 46%Capital Gain 394,400 100% 103,054 28% 61,588 18%Return of capital - - 132,498 36% 123,177 36% $ 394,400 100% $ 368,050 100% $ 342,158 100%Total dividends distributed for tax purposes $ 454,036 $ 426,344 $ 399,030 For the years ended December 31, 2015, 2014 and 2013 cash dividends paid for tax purposes were equivalent or in excess of the dividends paid deduction. Taxable REIT Subsidiaries (“TRS”) and Taxable Entities: The Company is subject to federal, state and local income taxes on income reported through its TRS activities, which include wholly-owned subsidiaries of the Company. The Company’s TRS consists of Kimco Realty Services ("KRS"), which due to a merger on April 1, 2013 includes FNC Realty Corporation (“FNC”), Kimco Insurance Company (“KIC”), (collectively, the taxable entity “KRS Consolidated”) and the consolidated entity, Blue Ridge Real Estate Company/Big Boulder Corporation. On April 2, 2013, the Company contributed its interest in FNC to KRS and KRS acquired all of the outstanding stock of FNC in a reverse cash merger. The Company is also subject to local non-U.S. taxes on certain investments located outside the U.S. The Company is subject to taxes on its activities in Canada, Puerto Rico, Mexico, and Chile. In general, under local country law applicable to the structures the Company has in place and applicable treaties, the repatriation of cash to the Company from its subsidiaries and joint ventures in Canada, Puerto Rico and Mexico generally are not subject to withholding tax. The Company is subject to withholding taxes in Chile on sale transactions. As a result, the Company will incur a withholding tax on the repatriation of sale proceeds associated with the sale of the Company’s remaining property in Chile. The Company has determined this withholding tax to be $0.5 million. The Company is subject to and also includes in its tax provision non-U.S. income taxes on certain investments located in jurisdictions outside the U.S. These investments are held by the Company at the REIT level and not in the Company’s taxable REIT subsidiary. Accordingly, the Company does not expect a U.S. income tax impact associated with the repatriation of undistributed earnings from the Company’s foreign subsidiaries. Income taxes have been provided for on the asset and liability method as required by the FASB’s Income Tax guidance. Under the asset and liability method, deferred income taxes are recognized for the temporary differences between the financial reporting basis and the tax basis of taxable assets and liabilities. The Company’s pre-tax book income/(loss) and (provision)/benefit for income taxes relating to the Company’s TRS and taxable entities which have been consolidated for accounting reporting purposes, for the years ended December 31, 2015, 2014 and 2013, are summarized as follows (in thousands): 2015 2014 2013 Income/(loss) before income taxes – U.S. $ 23,729 $ 22,176 $ (4,849)(Provision)/benefit for income taxes, net:
Federal : Current (638) (522) (1,647)Deferred (7,355) (7,156) 9,725
Federal tax (provision)/benefit (7,993) (7,678) 8,078 State and local:
Current (2,535) (165) 1,159 Deferred (1,474) (1,223) 1,562
State tax (provision)/benefit (4,009) (1,388) 2,721 Total tax (provision)/benefit – U.S. (12,002) (9,066) 10,799 Net income from U.S. taxable REIT subsidiaries $ 11,727 $ 13,110 $ 5,950
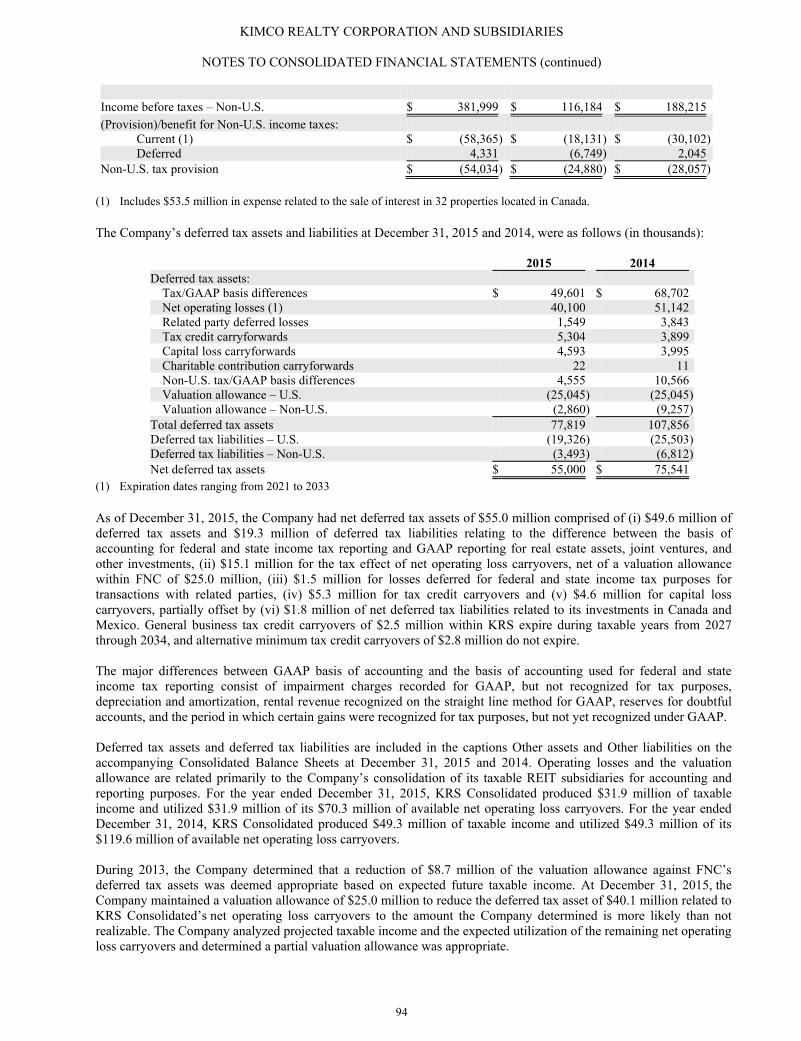
KIMCO REALTY CORPORATION AND SUBSIDIARIES
NOTES TO CONSOLIDATED FINANCIAL STATEMENTS (continued)
94
Income before taxes – Non-U.S. $ 381,999 $ 116,184 $ 188,215 (Provision)/benefit for Non-U.S. income taxes:
Current (1) $ (58,365) $ (18,131) $ (30,102)Deferred 4,331 (6,749) 2,045
Non-U.S. tax provision $ (54,034) $ (24,880) $ (28,057)
(1) Includes $53.5 million in expense related to the sale of interest in 32 properties located in Canada.
The Company’s deferred tax assets and liabilities at December 31, 2015 and 2014, were as follows (in thousands):
2015 2014 Deferred tax assets:
Tax/GAAP basis differences $ 49,601 $ 68,702 Net operating losses (1) 40,100 51,142 Related party deferred losses 1,549 3,843 Tax credit carryforwards 5,304 3,899 Capital loss carryforwards 4,593 3,995 Charitable contribution carryforwards 22 11 Non-U.S. tax/GAAP basis differences 4,555 10,566 Valuation allowance – U.S. (25,045) (25,045)Valuation allowance – Non-U.S. (2,860) (9,257)
Total deferred tax assets 77,819 107,856 Deferred tax liabilities – U.S. (19,326) (25,503)Deferred tax liabilities – Non-U.S. (3,493) (6,812)Net deferred tax assets $ 55,000 $ 75,541
(1) Expiration dates ranging from 2021 to 2033 As of December 31, 2015, the Company had net deferred tax assets of $55.0 million comprised of (i) $49.6 million of deferred tax assets and $19.3 million of deferred tax liabilities relating to the difference between the basis of accounting for federal and state income tax reporting and GAAP reporting for real estate assets, joint ventures, and other investments, (ii) $15.1 million for the tax effect of net operating loss carryovers, net of a valuation allowance within FNC of $25.0 million, (iii) $1.5 million for losses deferred for federal and state income tax purposes for transactions with related parties, (iv) $5.3 million for tax credit carryovers and (v) $4.6 million for capital loss carryovers, partially offset by (vi) $1.8 million of net deferred tax liabilities related to its investments in Canada and Mexico. General business tax credit carryovers of $2.5 million within KRS expire during taxable years from 2027 through 2034, and alternative minimum tax credit carryovers of $2.8 million do not expire.
The major differences between GAAP basis of accounting and the basis of accounting used for federal and state income tax reporting consist of impairment charges recorded for GAAP, but not recognized for tax purposes, depreciation and amortization, rental revenue recognized on the straight line method for GAAP, reserves for doubtful accounts, and the period in which certain gains were recognized for tax purposes, but not yet recognized under GAAP. Deferred tax assets and deferred tax liabilities are included in the captions Other assets and Other liabilities on the accompanying Consolidated Balance Sheets at December 31, 2015 and 2014. Operating losses and the valuation allowance are related primarily to the Company’s consolidation of its taxable REIT subsidiaries for accounting and reporting purposes. For the year ended December 31, 2015, KRS Consolidated produced $31.9 million of taxable income and utilized $31.9 million of its $70.3 million of available net operating loss carryovers. For the year ended December 31, 2014, KRS Consolidated produced $49.3 million of taxable income and utilized $49.3 million of its $119.6 million of available net operating loss carryovers. During 2013, the Company determined that a reduction of $8.7 million of the valuation allowance against FNC’s deferred tax assets was deemed appropriate based on expected future taxable income. At December 31, 2015, the Company maintained a valuation allowance of $25.0 million to reduce the deferred tax asset of $40.1 million related to KRS Consolidated’s net operating loss carryovers to the amount the Company determined is more likely than not realizable. The Company analyzed projected taxable income and the expected utilization of the remaining net operating loss carryovers and determined a partial valuation allowance was appropriate.
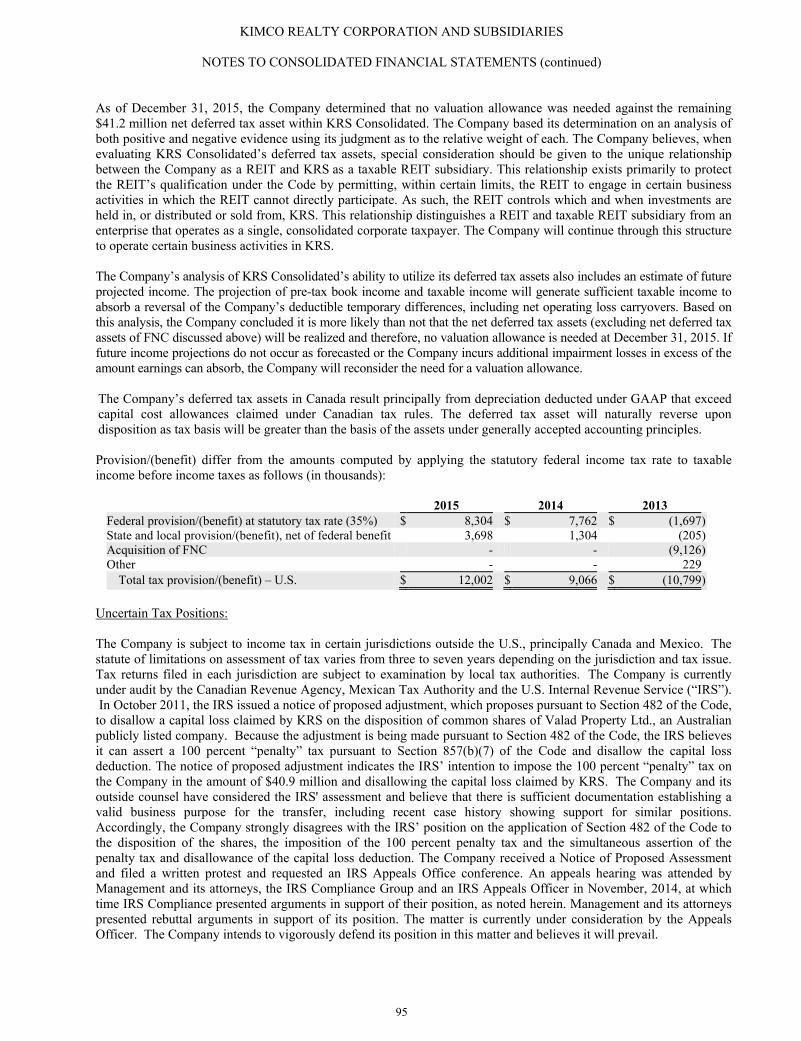
KIMCO REALTY CORPORATION AND SUBSIDIARIES
NOTES TO CONSOLIDATED FINANCIAL STATEMENTS (continued)
95
As of December 31, 2015, the Company determined that no valuation allowance was needed against the remaining $41.2 million net deferred tax asset within KRS Consolidated. The Company based its determination on an analysis of both positive and negative evidence using its judgment as to the relative weight of each. The Company believes, when evaluating KRS Consolidated’s deferred tax assets, special consideration should be given to the unique relationship between the Company as a REIT and KRS as a taxable REIT subsidiary. This relationship exists primarily to protect the REIT’s qualification under the Code by permitting, within certain limits, the REIT to engage in certain business activities in which the REIT cannot directly participate. As such, the REIT controls which and when investments are held in, or distributed or sold from, KRS. This relationship distinguishes a REIT and taxable REIT subsidiary from an enterprise that operates as a single, consolidated corporate taxpayer. The Company will continue through this structure to operate certain business activities in KRS. The Company’s analysis of KRS Consolidated’s ability to utilize its deferred tax assets also includes an estimate of future projected income. The projection of pre-tax book income and taxable income will generate sufficient taxable income to absorb a reversal of the Company’s deductible temporary differences, including net operating loss carryovers. Based on this analysis, the Company concluded it is more likely than not that the net deferred tax assets (excluding net deferred tax assets of FNC discussed above) will be realized and therefore, no valuation allowance is needed at December 31, 2015. If future income projections do not occur as forecasted or the Company incurs additional impairment losses in excess of the amount earnings can absorb, the Company will reconsider the need for a valuation allowance. The Company’s deferred tax assets in Canada result principally from depreciation deducted under GAAP that exceed capital cost allowances claimed under Canadian tax rules. The deferred tax asset will naturally reverse upon disposition as tax basis will be greater than the basis of the assets under generally accepted accounting principles. Provision/(benefit) differ from the amounts computed by applying the statutory federal income tax rate to taxable income before income taxes as follows (in thousands):
2015 2014 2013 Federal provision/(benefit) at statutory tax rate (35%) $ 8,304 $ 7,762 $ (1,697)State and local provision/(benefit), net of federal benefit 3,698 1,304 (205)Acquisition of FNC - - (9,126)Other - - 229
Total tax provision/(benefit) – U.S. $ 12,002 $ 9,066 $ (10,799)
Uncertain Tax Positions: The Company is subject to income tax in certain jurisdictions outside the U.S., principally Canada and Mexico. The statute of limitations on assessment of tax varies from three to seven years depending on the jurisdiction and tax issue. Tax returns filed in each jurisdiction are subject to examination by local tax authorities. The Company is currently under audit by the Canadian Revenue Agency, Mexican Tax Authority and the U.S. Internal Revenue Service (“IRS”). In October 2011, the IRS issued a notice of proposed adjustment, which proposes pursuant to Section 482 of the Code, to disallow a capital loss claimed by KRS on the disposition of common shares of Valad Property Ltd., an Australian publicly listed company. Because the adjustment is being made pursuant to Section 482 of the Code, the IRS believes it can assert a 100 percent “penalty” tax pursuant to Section 857(b)(7) of the Code and disallow the capital loss deduction. The notice of proposed adjustment indicates the IRS’ intention to impose the 100 percent “penalty” tax on the Company in the amount of $40.9 million and disallowing the capital loss claimed by KRS. The Company and its outside counsel have considered the IRS' assessment and believe that there is sufficient documentation establishing a valid business purpose for the transfer, including recent case history showing support for similar positions. Accordingly, the Company strongly disagrees with the IRS’ position on the application of Section 482 of the Code to the disposition of the shares, the imposition of the 100 percent penalty tax and the simultaneous assertion of the penalty tax and disallowance of the capital loss deduction. The Company received a Notice of Proposed Assessment and filed a written protest and requested an IRS Appeals Office conference. An appeals hearing was attended by Management and its attorneys, the IRS Compliance Group and an IRS Appeals Officer in November, 2014, at which time IRS Compliance presented arguments in support of their position, as noted herein. Management and its attorneys presented rebuttal arguments in support of its position. The matter is currently under consideration by the Appeals Officer. The Company intends to vigorously defend its position in this matter and believes it will prevail.
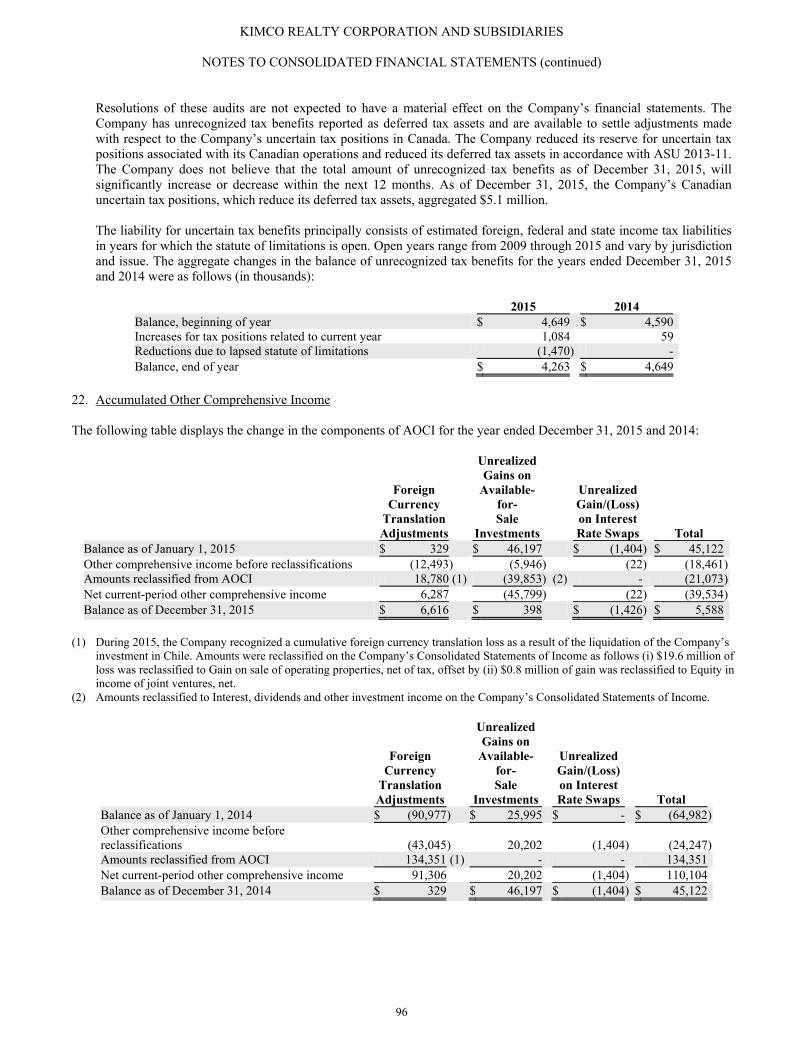
KIMCO REALTY CORPORATION AND SUBSIDIARIES
NOTES TO CONSOLIDATED FINANCIAL STATEMENTS (continued)
96
Resolutions of these audits are not expected to have a material effect on the Company’s financial statements. The Company has unrecognized tax benefits reported as deferred tax assets and are available to settle adjustments made with respect to the Company’s uncertain tax positions in Canada. The Company reduced its reserve for uncertain tax positions associated with its Canadian operations and reduced its deferred tax assets in accordance with ASU 2013-11. The Company does not believe that the total amount of unrecognized tax benefits as of December 31, 2015, will significantly increase or decrease within the next 12 months. As of December 31, 2015, the Company’s Canadian uncertain tax positions, which reduce its deferred tax assets, aggregated $5.1 million. The liability for uncertain tax benefits principally consists of estimated foreign, federal and state income tax liabilities in years for which the statute of limitations is open. Open years range from 2009 through 2015 and vary by jurisdiction and issue. The aggregate changes in the balance of unrecognized tax benefits for the years ended December 31, 2015 and 2014 were as follows (in thousands):
2015 2014 Balance, beginning of year $ 4,649 $ 4,590 Increases for tax positions related to current year 1,084 59 Reductions due to lapsed statute of limitations (1,470) - Balance, end of year $ 4,263 $ 4,649
22. Accumulated Other Comprehensive Income The following table displays the change in the components of AOCI for the year ended December 31, 2015 and 2014:
Foreign Currency
Translation Adjustments
UnrealizedGains on
Available-for- Sale
Investments
Unrealized Gain/(Loss) on Interest Rate Swaps Total
Balance as of January 1, 2015 $ 329 $ 46,197 $ (1,404) $ 45,122 Other comprehensive income before reclassifications (12,493) (5,946) (22) (18,461)Amounts reclassified from AOCI 18,780 (1) (39,853) (2) - (21,073)Net current-period other comprehensive income 6,287 (45,799) (22) (39,534)Balance as of December 31, 2015 $ 6,616 $ 398 $ (1,426) $ 5,588
(1) During 2015, the Company recognized a cumulative foreign currency translation loss as a result of the liquidation of the Company’s
investment in Chile. Amounts were reclassified on the Company’s Consolidated Statements of Income as follows (i) $19.6 million of loss was reclassified to Gain on sale of operating properties, net of tax, offset by (ii) $0.8 million of gain was reclassified to Equity in income of joint ventures, net.
(2) Amounts reclassified to Interest, dividends and other investment income on the Company’s Consolidated Statements of Income.
Foreign Currency
Translation Adjustments
Unrealized Gains on
Available-for- Sale
Investments
Unrealized Gain/(Loss) on Interest Rate Swaps Total
Balance as of January 1, 2014 $ (90,977) $ 25,995 $ - $ (64,982)Other comprehensive income before reclassifications (43,045) 20,202 (1,404) (24,247)Amounts reclassified from AOCI 134,351 (1) - - 134,351 Net current-period other comprehensive income 91,306 20,202 (1,404) 110,104 Balance as of December 31, 2014 $ 329 $ 46,197 $ (1,404) $ 45,122
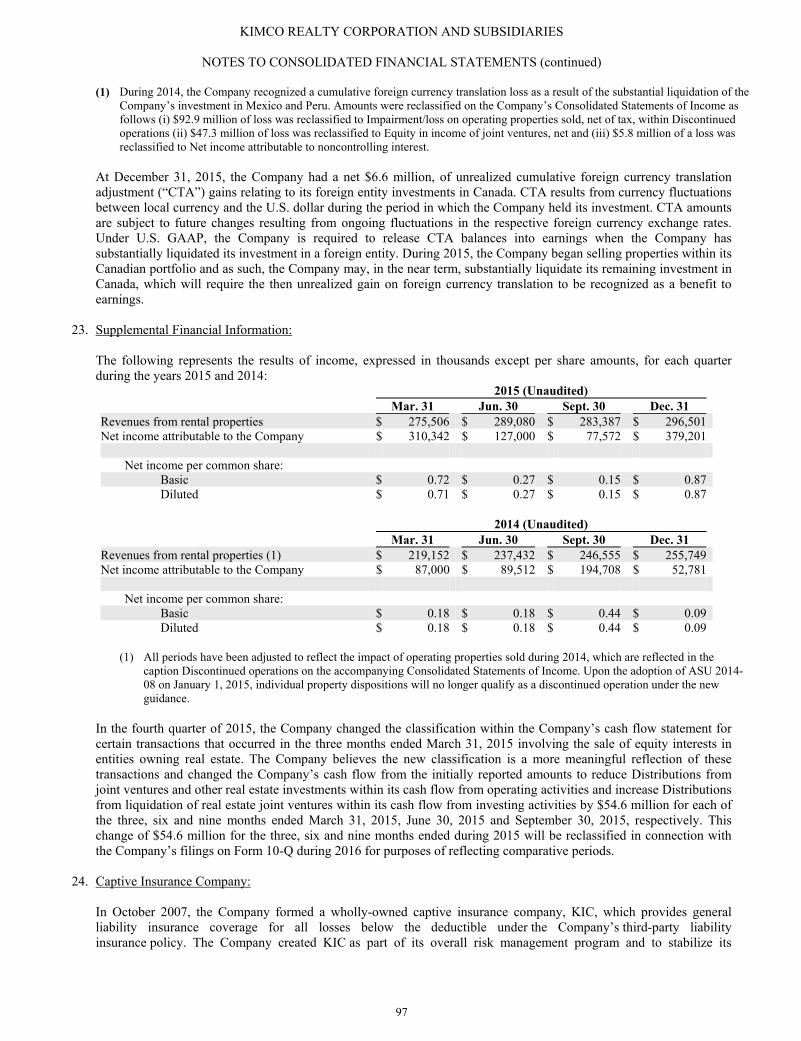
KIMCO REALTY CORPORATION AND SUBSIDIARIES
NOTES TO CONSOLIDATED FINANCIAL STATEMENTS (continued)
97
(1) During 2014, the Company recognized a cumulative foreign currency translation loss as a result of the substantial liquidation of the Company’s investment in Mexico and Peru. Amounts were reclassified on the Company’s Consolidated Statements of Income as follows (i) $92.9 million of loss was reclassified to Impairment/loss on operating properties sold, net of tax, within Discontinued operations (ii) $47.3 million of loss was reclassified to Equity in income of joint ventures, net and (iii) $5.8 million of a loss was reclassified to Net income attributable to noncontrolling interest.
At December 31, 2015, the Company had a net $6.6 million, of unrealized cumulative foreign currency translation adjustment (“CTA”) gains relating to its foreign entity investments in Canada. CTA results from currency fluctuations between local currency and the U.S. dollar during the period in which the Company held its investment. CTA amounts are subject to future changes resulting from ongoing fluctuations in the respective foreign currency exchange rates. Under U.S. GAAP, the Company is required to release CTA balances into earnings when the Company has substantially liquidated its investment in a foreign entity. During 2015, the Company began selling properties within its Canadian portfolio and as such, the Company may, in the near term, substantially liquidate its remaining investment in Canada, which will require the then unrealized gain on foreign currency translation to be recognized as a benefit to earnings.
23. Supplemental Financial Information: The following represents the results of income, expressed in thousands except per share amounts, for each quarter during the years 2015 and 2014: 2015 (Unaudited) Mar. 31 Jun. 30 Sept. 30 Dec. 31 Revenues from rental properties $ 275,506 $ 289,080 $ 283,387 $ 296,501 Net income attributable to the Company $ 310,342 $ 127,000 $ 77,572 $ 379,201
Net income per common share: Basic $ 0.72 $ 0.27 $ 0.15 $ 0.87 Diluted $ 0.71 $ 0.27 $ 0.15 $ 0.87
2014 (Unaudited) Mar. 31 Jun. 30 Sept. 30 Dec. 31 Revenues from rental properties (1) $ 219,152 $ 237,432 $ 246,555 $ 255,749 Net income attributable to the Company $ 87,000 $ 89,512 $ 194,708 $ 52,781
Net income per common share: Basic $ 0.18 $ 0.18 $ 0.44 $ 0.09 Diluted $ 0.18 $ 0.18 $ 0.44 $ 0.09
(1) All periods have been adjusted to reflect the impact of operating properties sold during 2014, which are reflected in the
caption Discontinued operations on the accompanying Consolidated Statements of Income. Upon the adoption of ASU 2014-08 on January 1, 2015, individual property dispositions will no longer qualify as a discontinued operation under the new guidance.
In the fourth quarter of 2015, the Company changed the classification within the Company’s cash flow statement for certain transactions that occurred in the three months ended March 31, 2015 involving the sale of equity interests in entities owning real estate. The Company believes the new classification is a more meaningful reflection of these transactions and changed the Company’s cash flow from the initially reported amounts to reduce Distributions from joint ventures and other real estate investments within its cash flow from operating activities and increase Distributions from liquidation of real estate joint ventures within its cash flow from investing activities by $54.6 million for each of the three, six and nine months ended March 31, 2015, June 30, 2015 and September 30, 2015, respectively. This change of $54.6 million for the three, six and nine months ended during 2015 will be reclassified in connection with the Company’s filings on Form 10-Q during 2016 for purposes of reflecting comparative periods.
24. Captive Insurance Company: In October 2007, the Company formed a wholly-owned captive insurance company, KIC, which provides general liability insurance coverage for all losses below the deductible under the Company’s third-party liability insurance policy. The Company created KIC as part of its overall risk management program and to stabilize its
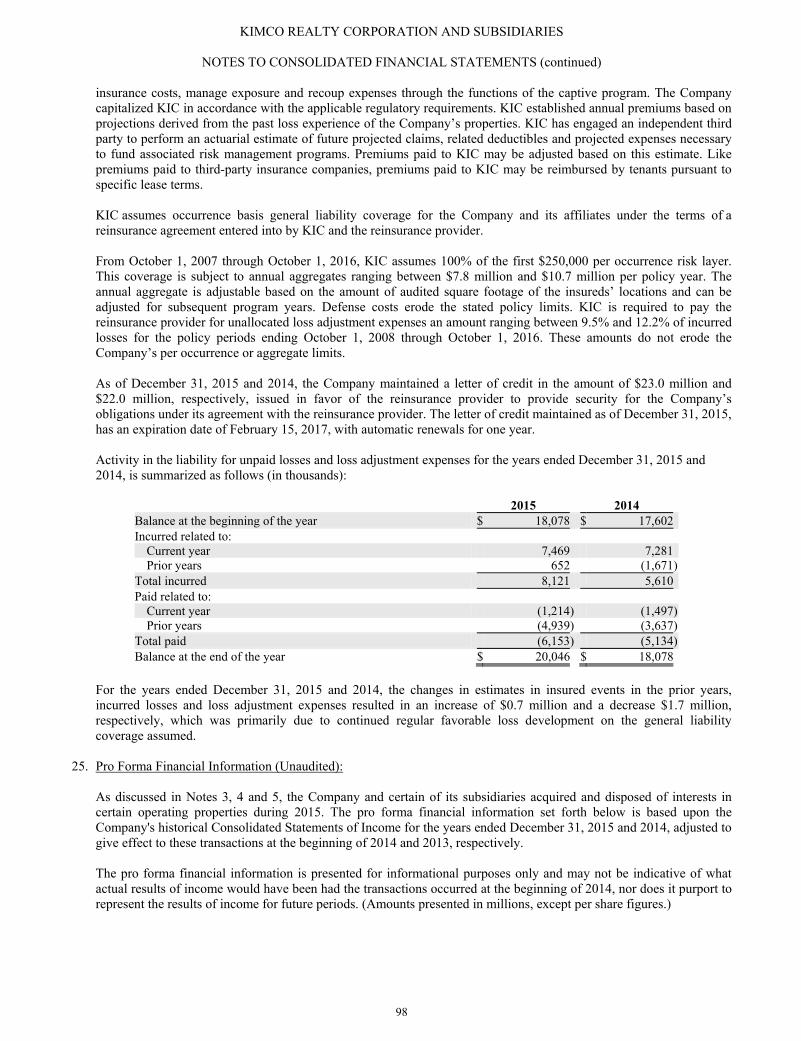
KIMCO REALTY CORPORATION AND SUBSIDIARIES
NOTES TO CONSOLIDATED FINANCIAL STATEMENTS (continued)
98
insurance costs, manage exposure and recoup expenses through the functions of the captive program. The Company capitalized KIC in accordance with the applicable regulatory requirements. KIC established annual premiums based on projections derived from the past loss experience of the Company’s properties. KIC has engaged an independent third party to perform an actuarial estimate of future projected claims, related deductibles and projected expenses necessary to fund associated risk management programs. Premiums paid to KIC may be adjusted based on this estimate. Like premiums paid to third-party insurance companies, premiums paid to KIC may be reimbursed by tenants pursuant to specific lease terms. KIC assumes occurrence basis general liability coverage for the Company and its affiliates under the terms of a reinsurance agreement entered into by KIC and the reinsurance provider. From October 1, 2007 through October 1, 2016, KIC assumes 100% of the first $250,000 per occurrence risk layer. This coverage is subject to annual aggregates ranging between $7.8 million and $10.7 million per policy year. The annual aggregate is adjustable based on the amount of audited square footage of the insureds’ locations and can be adjusted for subsequent program years. Defense costs erode the stated policy limits. KIC is required to pay the reinsurance provider for unallocated loss adjustment expenses an amount ranging between 9.5% and 12.2% of incurred losses for the policy periods ending October 1, 2008 through October 1, 2016. These amounts do not erode the Company’s per occurrence or aggregate limits. As of December 31, 2015 and 2014, the Company maintained a letter of credit in the amount of $23.0 million and $22.0 million, respectively, issued in favor of the reinsurance provider to provide security for the Company’s obligations under its agreement with the reinsurance provider. The letter of credit maintained as of December 31, 2015, has an expiration date of February 15, 2017, with automatic renewals for one year. Activity in the liability for unpaid losses and loss adjustment expenses for the years ended December 31, 2015 and 2014, is summarized as follows (in thousands):
2015 2014 Balance at the beginning of the year $ 18,078 $ 17,602 Incurred related to:
Current year 7,469 7,281 Prior years 652 (1,671)
Total incurred 8,121 5,610 Paid related to:
Current year (1,214) (1,497)Prior years (4,939) (3,637)
Total paid (6,153) (5,134)Balance at the end of the year $ 20,046 $ 18,078
For the years ended December 31, 2015 and 2014, the changes in estimates in insured events in the prior years, incurred losses and loss adjustment expenses resulted in an increase of $0.7 million and a decrease $1.7 million, respectively, which was primarily due to continued regular favorable loss development on the general liability coverage assumed.
25. Pro Forma Financial Information (Unaudited):
As discussed in Notes 3, 4 and 5, the Company and certain of its subsidiaries acquired and disposed of interests in certain operating properties during 2015. The pro forma financial information set forth below is based upon the Company's historical Consolidated Statements of Income for the years ended December 31, 2015 and 2014, adjusted to give effect to these transactions at the beginning of 2014 and 2013, respectively. The pro forma financial information is presented for informational purposes only and may not be indicative of what actual results of income would have been had the transactions occurred at the beginning of 2014, nor does it purport to represent the results of income for future periods. (Amounts presented in millions, except per share figures.)
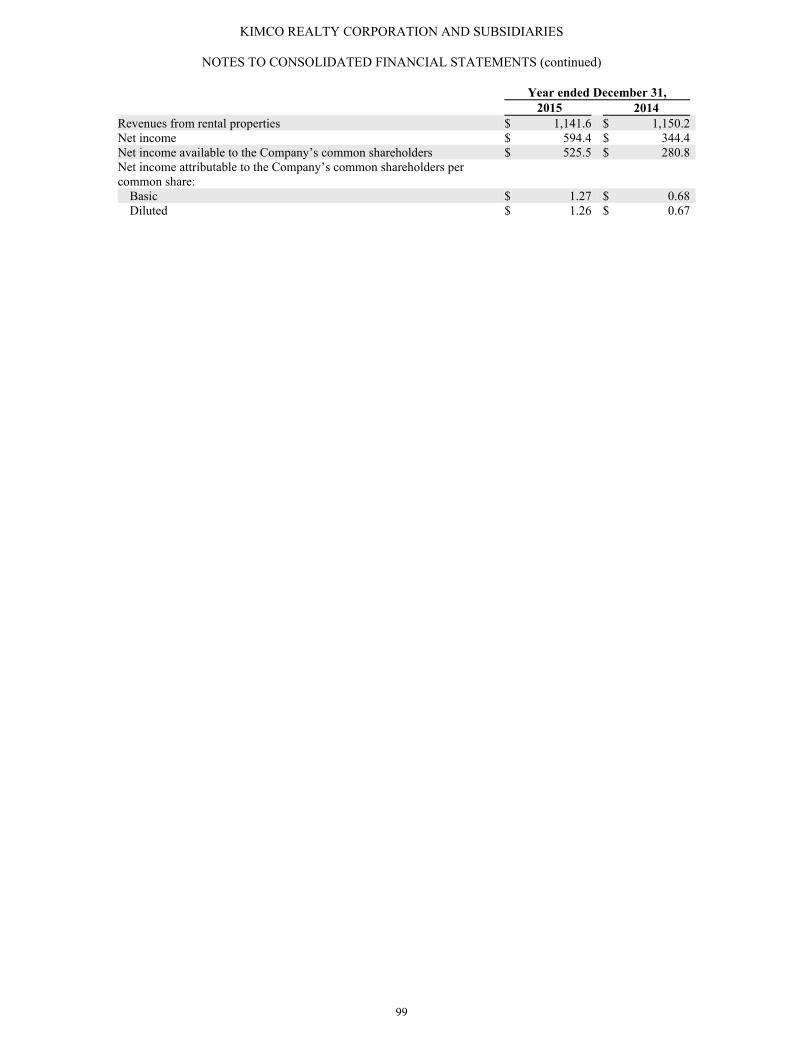
KIMCO REALTY CORPORATION AND SUBSIDIARIES
NOTES TO CONSOLIDATED FINANCIAL STATEMENTS (continued)
99
Year ended December 31, 2015 2014 Revenues from rental properties $ 1,141.6 $ 1,150.2 Net income $ 594.4 $ 344.4 Net income available to the Company’s common shareholders $ 525.5 $ 280.8 Net income attributable to the Company’s common shareholders per common share:
Basic $ 1.27 $ 0.68 Diluted $ 1.26 $ 0.67
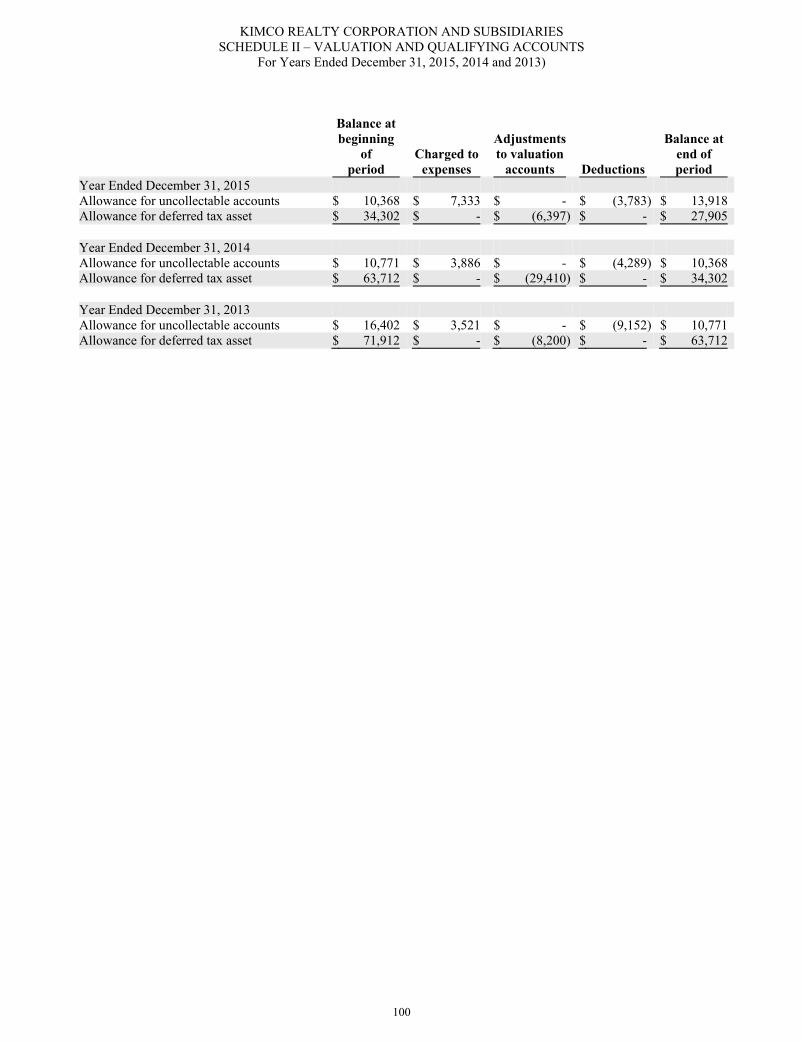
KIMCO REALTY CORPORATION AND SUBSIDIARIES SCHEDULE II – VALUATION AND QUALIFYING ACCOUNTS
For Years Ended December 31, 2015, 2014 and 2013)
Balance atbeginning
of period
Charged to expenses
Adjustments to valuation
accounts Deductions
Balance at end of period
Year Ended December 31, 2015 Allowance for uncollectable accounts $ 10,368 $ 7,333 $ - $ (3,783) $ 13,918 Allowance for deferred tax asset $ 34,302 $ - $ (6,397) $ - $ 27,905 Year Ended December 31, 2014 Allowance for uncollectable accounts $ 10,771 $ 3,886 $ - $ (4,289) $ 10,368 Allowance for deferred tax asset $ 63,712 $ - $ (29,410) $ - $ 34,302 Year Ended December 31, 2013 Allowance for uncollectable accounts $ 16,402 $ 3,521 $ - $ (9,152) $ 10,771 Allowance for deferred tax asset $ 71,912 $ - $ (8,200) $ - $ 63,712
100
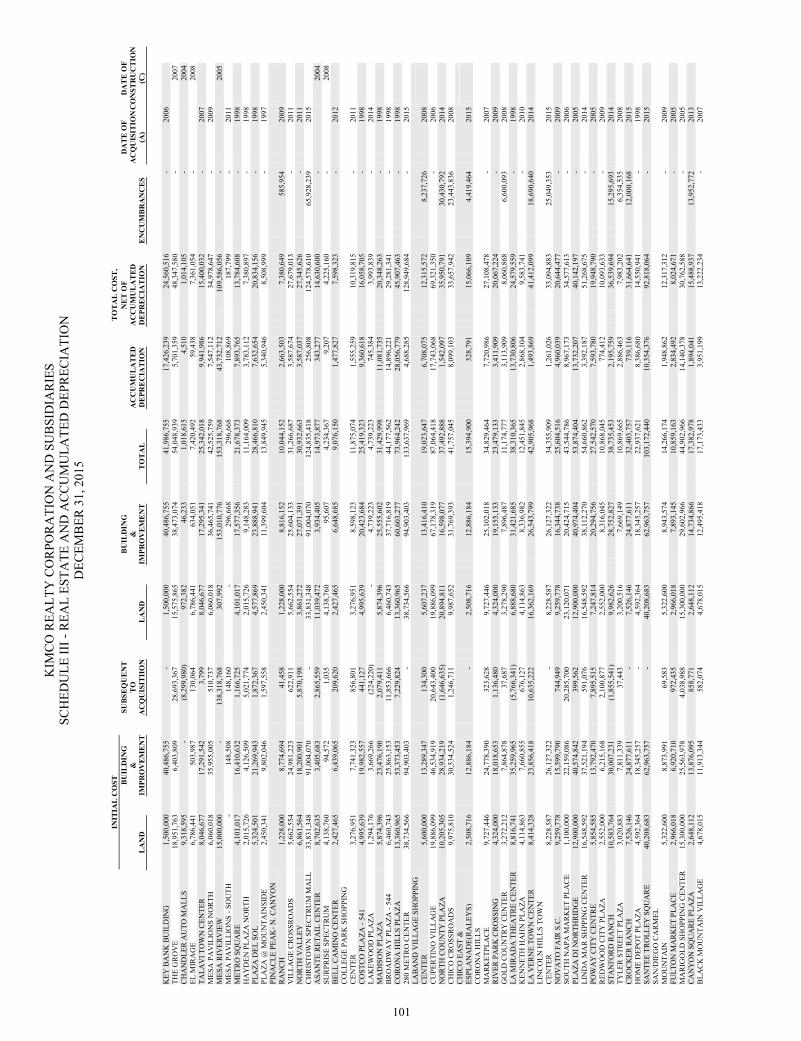
KIM
CO
REA
LTY
CO
RPO
RA
TIO
N A
ND
SU
BSI
DIA
RIE
S
SCH
EDU
LE II
I - R
EAL
ESTA
TE A
ND
AC
CU
MU
LATE
D D
EPR
ECIA
TIO
N
DEC
EMB
ER 3
1, 2
015
INIT
IAL
CO
ST
TO
TA
L C
OST
,
B
UIL
DIN
G
SU
BSE
QU
EN
T
B
UIL
DIN
G
N
ET
OF
DA
TE
OF
DA
TE
OF
&
TO
&
A
CC
UM
UL
AT
ED
A
CC
UM
UL
AT
ED
AC
QU
ISIT
ION
CO
NST
RU
CT
ION
L
AN
D
IM
PRO
VE
ME
NT
A
CQ
UIS
ITII
ON
L
AN
D
IM
PRO
VE
ME
NT
T
OT
AL
DE
PRE
CIA
TIO
N
DE
PRE
CIA
TIO
N
EN
CU
MB
RA
NC
ES
(A
) (C
)
KEY
BA
NK
BU
ILD
ING
1,
500,
000
40,4
86,7
55
-
1,50
0,00
0
40,4
86,7
55
41,9
86,7
55
17,4
26,2
39
24,5
60,5
16
-
2006
THE
GR
OV
E
18,9
51,7
63
6,
403,
809
28,6
93,3
67
15,5
75,8
65
38,4
73,0
74
54,0
48,9
39
5,70
1,35
9
48,3
47,5
80
-
20
07
CH
AN
DLE
R A
UTO
MA
LLS
9,
318,
595
-
(8,2
99,9
80)
972,
382
46
,233
1,
018,
615
4,
510
1,
014,
105
-
2004
EL
MIR
AG
E
6,78
6,44
1
50
3,98
7
13
0,06
4
6,78
6,44
1
634,
051
7,
420,
492
59
,438
7,
361,
054
-
2008
TA
LAV
I TO
WN
CEN
TER
8,
046,
677
17,2
91,5
42
3,
799
8,
046,
677
17
,295
,341
25
,342
,018
9,
941,
986
15
,400
,032
-
20
07
M
ESA
PA
VIL
ION
S N
OR
TH
6,06
0,01
8
35
,955
,005
510,
737
6,
060,
018
36
,465
,741
42
,525
,759
7,
547,
112
34
,978
,647
-
20
09
M
ESA
RIV
ERV
IEW
15
,000
,000
-
138,
318,
768
30
7,99
2
153,
010,
776
15
3,31
8,76
8
43,7
32,7
12
109,
586,
056
-
2005
M
ESA
PA
VIL
LIO
NS
- SO
UTH
-
14
8,50
8
14
8,16
0
-
29
6,66
8
296,
668
10
8,86
9
187,
799
-
20
11
M
ETR
O S
QU
AR
E
4,10
1,01
7
16
,410
,632
1,16
6,72
5
4,10
1,01
7
17,5
77,3
56
21,6
78,3
73
7,89
3,76
5
13,7
84,6
08
-
1998
HA
YD
EN P
LAZA
NO
RTH
2,
015,
726
4,12
6,50
9
5,
021,
774
2,
015,
726
9,
148,
283
11
,164
,009
3,
783,
112
7,
380,
897
-
19
98
PL
AZA
DEL
SO
L
5,32
4,50
1
21
,269
,943
1,87
2,36
7
4,57
7,86
9
23,8
88,9
41
28,4
66,8
10
7,63
2,65
4
20,8
34,1
56
-
1998
PLA
ZA @
MO
UN
TAIN
SID
E
2,45
0,34
1
9,
802,
046
1,59
7,55
8
2,45
0,34
1
11,3
99,6
04
13,8
49,9
45
5,34
0,94
6
8,50
8,99
9
-
1997
PIN
AC
LE P
EAK
- N. C
AN
YO
N
RA
NC
H
1,22
8,00
0
8,
774,
694
41,4
58
1,22
8,00
0
8,81
6,15
2
10,0
44,1
52
2,66
3,50
3
7,38
0,64
9
585,
954
2009
VIL
LAG
E C
RO
SSR
OA
DS
5,
662,
554
24,9
81,2
23
62
2,91
1
5,66
2,55
4
25,6
04,1
33
31,2
66,6
87
3,58
7,67
4
27,6
79,0
13
-
2011
NO
RTH
VA
LLEY
6,
861,
564
18,2
00,9
01
5,
870,
198
3,
861,
272
27
,071
,391
30
,932
,663
3,
587,
037
27
,345
,626
-
20
11
C
HR
ISTO
WN
SPE
CTR
UM
MA
LL
33,8
31,3
48
91
,004
,070
-
33
,831
,348
91
,004
,070
12
4,83
5,41
8
256,
808
12
4,57
8,61
0
65,9
28,2
39
20
15
A
SAN
TE R
ETA
IL C
ENTE
R
8,70
2,63
5
3,
405,
683
2,86
5,55
9
11,0
39,4
72
3,93
4,40
5
14,9
73,8
77
343,
277
14
,630
,600
-
2004
SU
RPR
ISE
SPEC
TRU
M
4,13
8,76
0
94
,572
1,03
5
4,13
8,76
0
95,6
07
4,23
4,36
7
9,20
7
4,22
5,16
0
-
20
08
BEL
L C
AM
INO
CEN
TER
2,
427,
465
6,43
9,06
5
20
9,62
0
2,42
7,46
5
6,64
8,68
5
9,07
6,15
0
1,47
7,82
7
7,59
8,32
3
-
2012
CO
LLEG
E PA
RK
SH
OPP
ING
C
ENTE
R
3,27
6,95
1
7,
741,
323
856,
801
3,
276,
951
8,
598,
123
11
,875
,074
1,
555,
259
10
,319
,815
-
20
11
CO
STC
O P
LAZA
- 54
1
4,99
5,63
9
19
,982
,557
441,
127
4,
995,
639
20
,423
,684
25
,419
,323
9,
360,
618
16
,058
,705
-
19
98
LA
KEW
OO
D P
LAZA
1,
294,
176
3,66
9,26
6
(2
24,2
20)
-
4,
739,
223
4,
739,
223
74
5,38
4
3,99
3,83
9
-
2014
MA
DIS
ON
PLA
ZA
5,87
4,39
6
23
,476
,190
2,07
9,41
1
5,87
4,39
6
25,5
55,6
02
31,4
29,9
98
11,0
81,7
35
20,3
48,2
63
-
1998
BR
OA
DW
AY
PLA
ZA -
544
6,
460,
743
25,8
63,1
53
11
,853
,666
6,
460,
743
37
,716
,819
44
,177
,562
14
,896
,221
29
,281
,341
-
19
98
C
OR
ON
A H
ILLS
PLA
ZA
13,3
60,9
65
53
,373
,453
7,22
9,82
4
13,3
60,9
65
60,6
03,2
77
73,9
64,2
42
28,0
56,7
79
45,9
07,4
63
-
1998
280
MET
RO
CEN
TER
38
,734
,566
94,9
03,4
03
-
38,7
34,5
66
94,9
03,4
03
133,
637,
969
4,
688,
285
12
8,94
9,68
4
-
2015
LAB
AN
D V
ILLA
GE
SHO
PPIN
G
CEN
TER
5,
600,
000
13,2
89,3
47
13
4,30
0
5,60
7,23
7
13,4
16,4
10
19,0
23,6
47
6,70
8,07
5
12,3
15,5
72
8,23
7,72
6
20
08
CU
PER
TIN
O V
ILLA
GE
19
,886
,099
46,5
34,9
19
20
,643
,400
19
,886
,099
67
,178
,319
87
,064
,418
17
,743
,068
69
,321
,350
-
20
06
N
OR
TH C
OU
NTY
PLA
ZA
10,2
05,3
05
28
,934
,219
(1,6
46,6
35)
20,8
94,8
11
16,5
98,0
77
37,4
92,8
88
1,54
2,09
7
35,9
50,7
91
30,4
30,7
92
20
14
C
HIC
O C
RO
SSR
OA
DS
9,
975,
810
30,5
34,5
24
1,
246,
711
9,
987,
652
31
,769
,393
41
,757
,045
8,
099,
103
33
,657
,942
23
,443
,836
2008
CH
ICO
EA
ST &
ES
PLA
NA
DE(
RA
LEY
S)
2,50
8,71
6
12
,886
,184
-
2,
508,
716
12
,886
,184
15
,394
,900
32
8,79
1
15,0
66,1
09
4,41
9,46
4
20
15
CO
RO
NA
HIL
LS
MA
RK
ETPL
AC
E
9,72
7,44
6
24
,778
,390
323,
628
9,
727,
446
25
,102
,018
34
,829
,464
7,
720,
986
27
,108
,478
-
20
07
RIV
ER P
AR
K C
RO
SSIN
G
4,32
4,00
0
18
,018
,653
1,13
6,48
0
4,32
4,00
0
19,1
55,1
33
23,4
79,1
33
3,41
1,90
9
20,0
67,2
24
-
2009
GO
LD C
OU
NTR
Y C
ENTE
R
3,27
2,21
2
7,
864,
878
37,6
87
3,27
8,29
0
7,89
6,48
7
11,1
74,7
77
3,11
3,90
9
8,06
0,86
8
6,60
0,09
3
20
08
LA
MIR
AD
A T
HEA
TRE
CEN
TER
8,
816,
741
35,2
59,9
65
(5
,766
,341
)
6,
888,
680
31
,421
,685
38
,310
,365
13
,730
,806
24
,579
,559
-
19
98
K
ENN
ETH
HA
HN
PLA
ZA
4,11
4,86
3
7,
660,
855
676,
127
4,
114,
863
8,
336,
982
12
,451
,845
2,
868,
104
9,
583,
741
-
20
10
LA
VER
NE
TOW
N C
ENTE
R
8,41
4,32
8
23
,856
,418
10,6
35,2
22
16,3
62,1
69
26,5
43,7
99
42,9
05,9
68
1,49
3,86
9
41,4
12,0
99
18,6
90,6
40
20
14
LI
NC
OLN
HIL
LS T
OW
N
CEN
TER
8,
228,
587
26,1
27,3
22
-
8,22
8,58
7
26,1
27,3
22
34,3
55,9
09
1,26
1,02
6
33,0
94,8
83
25,0
49,3
53
20
15
NO
VA
TO F
AIR
S.C
. 9,
259,
778
15,5
99,7
90
74
4,94
9
9,25
9,77
8
16,3
44,7
38
25,6
04,5
16
4,96
0,03
9
20,6
44,4
77
-
2009
SOU
TH N
APA
MA
RK
ET P
LAC
E
1,10
0,00
0
22
,159
,086
20,2
85,7
00
23,1
20,0
71
20,4
24,7
15
43,5
44,7
86
8,96
7,17
3
34,5
77,6
13
-
2006
PLA
ZA D
I NO
RTH
RID
GE
12
,900
,000
40,5
74,8
42
39
9,56
2
12,9
00,0
00
40,9
74,4
04
53,8
74,4
04
13,7
32,2
07
40,1
42,1
97
-
2005
LIN
DA
MA
R S
HPP
ING
CEN
TER
16
,548
,592
37,5
21,1
94
59
1,07
6
16,5
48,5
92
38,1
12,2
70
54,6
60,8
62
3,39
2,18
7
51,2
68,6
75
-
2014
POW
AY
CIT
Y C
ENTR
E
5,85
4,58
5
13
,792
,470
7,89
5,51
5
7,24
7,81
4
20,2
94,7
56
27,5
42,5
70
7,59
3,78
0
19,9
48,7
90
-
2005
RED
WO
OD
CIT
Y P
LAZA
2,
552,
000
6,21
5,16
8
2,
100,
877
2,
552,
000
8,
316,
045
10
,868
,045
77
4,41
2
10,0
93,6
33
-
2009
STA
NFO
RD
RA
NC
H
10,5
83,7
64
30
,007
,231
(1,8
55,5
41)
9,98
2,62
6
28,7
52,8
27
38,7
35,4
53
2,19
5,75
9
36,5
39,6
94
15,2
95,6
93
20
14
TY
LER
STR
EET
PLA
ZA
3,02
0,88
3
7,
811,
339
37,4
43
3,20
0,51
6
7,66
9,14
9
10,8
69,6
65
2,88
6,46
3
7,98
3,20
2
6,35
4,53
5
20
08
C
RO
CK
ER R
AN
CH
7,
526,
146
24,8
77,6
11
-
7,52
6,14
6
24,8
77,6
11
32,4
03,7
57
739,
116
31
,664
,641
12
,000
,168
2015
HO
ME
DEP
OT
PLA
ZA
4,59
2,36
4
18
,345
,257
-
4,
592,
364
18
,345
,257
22
,937
,621
8,
386,
680
14
,550
,941
-
19
98
SA
NTE
E TR
OLL
EY S
QU
AR
E
40,2
08,6
83
62
,963
,757
-
40
,208
,683
62
,963
,757
10
3,17
2,44
0
10,3
54,3
76
92,8
18,0
64
-
2015
SAN
/DIE
GO
CA
RM
EL
MO
UN
TAIN
5,
322,
600
8,87
3,99
1
69
,583
5,
322,
600
8,
943,
574
14
,266
,174
1,
948,
862
12
,317
,312
-
20
09
FULT
ON
MA
RK
ET P
LAC
E
2,96
6,01
8
6,
920,
710
972,
435
2,
966,
018
7,
893,
145
10
,859
,163
2,
834,
492
8,
024,
671
-
20
05
M
AR
IGO
LD S
HO
PPIN
G C
ENTE
R
15,3
00,0
00
25
,563
,978
4,03
8,98
8
15,3
00,0
00
29,6
02,9
66
44,9
02,9
66
14,1
40,3
78
30,7
62,5
88
-
2005
CA
NY
ON
SQ
UA
RE
PLA
ZA
2,64
8,11
2
13
,876
,095
858,
771
2,
648,
112
14
,734
,866
17
,382
,978
1,
894,
041
15
,488
,937
13
,952
,772
2013
BLA
CK
MO
UN
TAIN
VIL
LAG
E
4,67
8,01
5
11
,913
,344
582,
074
4,
678,
015
12
,495
,418
17
,173
,433
3,
951,
199
13
,222
,234
-
20
07
101
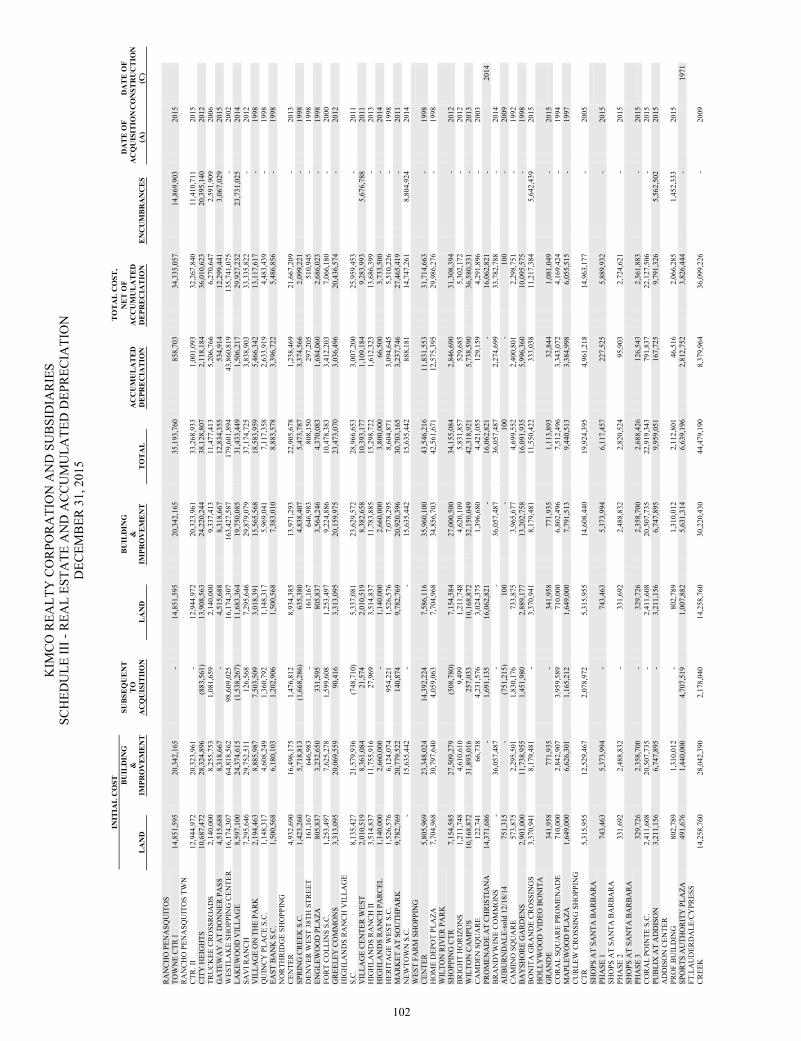
KIM
CO
REA
LTY
CO
RPO
RA
TIO
N A
ND
SU
BSI
DIA
RIE
S
SCH
EDU
LE II
I - R
EAL
ESTA
TE A
ND
AC
CU
MU
LATE
D D
EPR
ECIA
TIO
N
DEC
EMB
ER 3
1, 2
015
INIT
IAL
CO
ST
TO
TA
L C
OST
,
B
UIL
DIN
G
SU
BSE
QU
EN
T
B
UIL
DIN
G
N
ET
OF
DA
TE
OF
DA
TE
OF
&
TO
&
A
CC
UM
UL
AT
ED
A
CC
UM
UL
AT
ED
AC
QU
ISIT
ION
CO
NST
RU
CT
ION
L
AN
D
IM
PRO
VE
ME
NT
A
CQ
UIS
ITII
ON
L
AN
D
IM
PRO
VE
ME
NT
T
OT
AL
DE
PRE
CIA
TIO
N
DE
PRE
CIA
TIO
N
EN
CU
MB
RA
NC
ES
(A
) (C
)
RA
NC
HO
PEN
ASQ
UIT
OS
TOW
NE
CTR
I 14
,851
,595
20,3
42,1
65
-
14,8
51,5
95
20,3
42,1
65
35,1
93,7
60
858,
703
34
,335
,057
14
,869
,903
2015
RA
NC
HO
PEN
ASQ
UIT
OS
TWN
C
TR. I
I 12
,944
,972
20,3
23,9
61
-
12,9
44,9
72
20,3
23,9
61
33,2
68,9
33
1,00
1,09
3
32,2
67,8
40
11,4
10,7
11
20
15
CIT
Y H
EIG
HTS
10
,687
,472
28,3
24,8
96
(8
83,5
61)
13,9
08,5
63
24,2
20,2
44
38,1
28,8
07
2,11
8,18
4
36,0
10,6
23
20,3
95,1
40
20
12
TR
UC
KEE
CR
OSS
RO
AD
S
2,14
0,00
0
8,
255,
753
1,08
1,65
9
2,14
0,00
0
9,33
7,41
3
11,4
77,4
13
5,20
6,76
6
6,27
0,64
7
2,59
1,90
9
20
06
G
ATE
WA
Y A
T D
ON
NER
PA
SS
4,51
5,68
8
8,
318,
667
-
4,
515,
688
8,
318,
667
12
,834
,355
53
4,91
4
12,2
99,4
41
3,06
7,02
9
20
15
W
ESTL
AK
E SH
OPP
ING
CEN
TER
16
,174
,307
64,8
18,5
62
98
,609
,025
16
,174
,307
16
3,42
7,58
7
179,
601,
894
43
,860
,819
13
5,74
1,07
5
-
2002
LAK
EWO
OD
VIL
LAG
E
8,59
7,10
0
24
,374
,615
(1,5
38,2
67)
11,6
83,3
64
19,7
50,0
85
31,4
33,4
49
1,50
6,21
7
29,9
27,2
32
23,7
31,0
25
20
14
SA
VI R
AN
CH
7,
295,
646
29,7
52,5
11
12
6,56
8
7,29
5,64
6
29,8
79,0
79
37,1
74,7
25
3,83
8,90
3
33,3
35,8
22
-
2012
VIL
LAG
E O
N T
HE
PAR
K
2,19
4,46
3
8,
885,
987
7,50
3,50
9
3,01
8,39
1
15,5
65,5
68
18,5
83,9
59
5,46
6,34
2
13,1
17,6
17
-
1998
QU
INC
Y P
LAC
E S.
C.
1,14
8,31
7
4,
608,
249
1,36
0,79
2
1,14
8,31
7
5,96
9,04
1
7,11
7,35
8
2,63
3,91
9
4,48
3,43
9
-
1998
EAST
BA
NK
S.C
. 1,
500,
568
6,18
0,10
3
1,
202,
906
1,
500,
568
7,
383,
010
8,
883,
578
3,
396,
722
5,
486,
856
-
19
98
N
OR
THR
IDG
E SH
OPP
ING
C
ENTE
R
4,93
2,69
0
16
,496
,175
1,47
6,81
2
8,93
4,38
5
13,9
71,2
93
22,9
05,6
78
1,23
8,46
9
21,6
67,2
09
-
2013
SPR
ING
CR
EEK
S.C
. 1,
423,
260
5,71
8,81
3
(1
,668
,286
)
63
5,38
0
4,83
8,40
7
5,47
3,78
7
3,37
4,56
6
2,09
9,22
1
-
1998
DEN
VER
WES
T 38
TH S
TREE
T
161,
167
646,
983
-
16
1,16
7
646,
983
80
8,15
0
297,
205
51
0,94
5
-
1998
ENG
LEW
OO
D P
LAZA
80
5,83
7
3,
232,
650
331,
595
80
5,83
7
3,56
4,24
6
4,37
0,08
3
1,68
4,06
0
2,68
6,02
3
-
1998
FOR
T C
OLL
INS
S.C
. 1,
253,
497
7,62
5,27
8
1,
599,
608
1,
253,
497
9,
224,
886
10
,478
,383
3,
412,
203
7,
066,
180
-
20
00
G
REE
LEY
CO
MM
ON
S
3,31
3,09
5
20
,069
,559
90,4
16
3,31
3,09
5
20,1
59,9
75
23,4
73,0
70
3,03
6,49
6
20,4
36,5
74
-
2012
HIG
HLA
ND
S R
AN
CH
VIL
LAG
E S.
C.
8,13
5,42
7
21
,579
,936
(748
,710
)
5,
337,
081
23
,629
,572
28
,966
,653
3,
007,
200
25
,959
,453
-
20
11
VIL
LAG
E C
ENTE
R W
EST
2,
010,
519
8,36
1,08
4
21
,574
2,
010,
519
8,
382,
658
10
,393
,177
1,
109,
184
9,
283,
993
5,
676,
788
2011
HIG
HLA
ND
S R
AN
CH
II
3,51
4,83
7
11
,755
,916
27,9
69
3,51
4,83
7
11,7
83,8
85
15,2
98,7
22
1,61
2,32
3
13,6
86,3
99
-
2013
HIG
HLA
ND
S R
AN
CH
PA
RC
EL
1,14
0,00
0
2,
660,
000
-
1,
140,
000
2,
660,
000
3,
800,
000
66
,500
3,
733,
500
-
20
14
H
ERIT
AG
E W
EST
S.C
. 1,
526,
576
6,12
4,07
4
95
4,22
1
1,52
6,57
6
7,07
8,29
5
8,60
4,87
1
3,09
4,64
5
5,51
0,22
6
-
1998
MA
RK
ET A
T SO
UTH
PAR
K
9,78
2,76
9
20
,779
,522
140,
874
9,
782,
769
20
,920
,396
30
,703
,165
3,
237,
746
27
,465
,419
-
20
11
N
EWTO
WN
S.C
. -
15
,635
,442
-
-
15,6
35,4
42
15,6
35,4
42
888,
181
14
,747
,261
8,
804,
924
2014
WES
T FA
RM
SH
OPP
ING
C
ENTE
R
5,80
5,96
9
23
,348
,024
14,3
92,2
24
7,58
6,11
6
35,9
60,1
00
43,5
46,2
16
11,8
31,5
53
31,7
14,6
63
-
1998
HO
ME
DEP
OT
PLA
ZA
7,70
4,96
8
30
,797
,640
4,05
9,06
3
7,70
4,96
8
34,8
56,7
03
42,5
61,6
71
12,5
75,3
95
29,9
86,2
76
-
1998
WIL
TON
RIV
ER P
AR
K
SHO
PPIN
G C
TR
7,15
4,58
5
27
,509
,279
(508
,780
)
7,
154,
584
27
,000
,500
34
,155
,084
2,
846,
690
31
,308
,394
-
20
12
BR
IGH
T H
OR
IZO
NS
1,
211,
748
4,61
0,61
0
9,
499
1,
211,
748
4,
620,
109
5,
831,
857
52
9,68
5
5,30
2,17
2
-
2012
WIL
TON
CA
MPU
S
10,1
68,8
72
31
,893
,016
257,
033
10
,168
,872
32
,150
,049
42
,318
,921
5,
738,
590
36
,580
,331
-
20
13
C
AM
DEN
SQ
UA
RE
12
2,74
1
66
,738
4,23
1,57
6
3,02
4,37
5
1,39
6,68
0
4,42
1,05
5
129,
159
4,
291,
896
-
20
03
PR
OM
ENA
DE
AT
CH
RIS
TIA
NA
14
,371
,686
-
1,69
1,13
5
16,0
62,8
21
-
16
,062
,821
-
16,0
62,8
21
-
20
14
BR
AN
DY
WIN
E C
OM
MO
NS
-
36
,057
,487
-
-
36,0
57,4
87
36,0
57,4
87
2,27
4,69
9
33,7
82,7
88
-
2014
AU
BU
RN
DA
LE-s
old
12/1
8/14
75
1,31
5
-
(7
51,2
15)
100
-
100
-
100
-
20
09
C
AM
INO
SQ
UA
RE
57
3,87
5
2,
295,
501
1,83
0,17
6
733,
875
3,
965,
677
4,
699,
552
2,
400,
801
2,
298,
751
-
19
92
B
AY
SHO
RE
GA
RD
ENS
2,
901,
000
11,7
38,9
55
1,
451,
980
2,
889,
177
13
,202
,758
16
,091
,935
5,
996,
360
10
,095
,575
-
19
98
B
ON
ITA
GR
AN
DE
CR
OSS
ING
S
3,37
0,94
1
8,
179,
481
-
3,
370,
941
8,
179,
481
11
,550
,422
33
3,03
8
11,2
17,3
84
5,64
2,43
9
20
15
H
OLL
YW
OO
D V
IDEO
BO
NIT
A
GR
AN
DE
34
1,95
8
77
1,93
5
-
341,
958
77
1,93
5
1,11
3,89
3
32,8
44
1,08
1,04
9
-
2015
CO
RA
L SQ
UA
RE
PRO
MEN
AD
E
710,
000
2,84
2,90
7
3,
959,
589
71
0,00
0
6,80
2,49
6
7,51
2,49
6
3,34
3,07
2
4,16
9,42
4
-
1994
MA
PLEW
OO
D P
LAZA
1,
649,
000
6,62
6,30
1
1,
165,
212
1,
649,
000
7,
791,
513
9,
440,
513
3,
384,
998
6,
055,
515
-
19
97
C
UR
LEW
CR
OSS
ING
SH
OPP
ING
C
TR
5,31
5,95
5
12
,529
,467
2,07
8,97
2
5,31
5,95
5
14,6
08,4
40
19,9
24,3
95
4,96
1,21
8
14,9
63,1
77
-
2005
SHO
PS A
T SA
NTA
BA
RB
AR
A
PHA
SE 1
74
3,46
3
5,
373,
994
-
74
3,46
3
5,37
3,99
4
6,11
7,45
7
227,
525
5,
889,
932
-
20
15
SHO
PS A
T SA
NTA
BA
RB
AR
A
PHA
SE 2
33
1,69
2
2,
488,
832
-
33
1,69
2
2,48
8,83
2
2,82
0,52
4
95,9
03
2,72
4,62
1
-
2015
SHO
PS A
T SA
NTA
BA
RB
AR
A
PHA
SE 3
32
9,72
6
2,
358,
700
-
32
9,72
6
2,35
8,70
0
2,68
8,42
6
126,
543
2,
561,
883
-
20
15
CO
RA
L PO
INTE
S.C
. 2,
411,
608
20,5
07,7
35
-
2,41
1,60
8
20,5
07,7
35
22,9
19,3
43
791,
837
22
,127
,506
-
20
15
PU
BLI
X A
T A
DD
ISO
N
3,21
1,15
6
6,
747,
895
-
3,
211,
156
6,
747,
895
9,
959,
051
16
7,72
5
9,79
1,32
6
5,56
2,50
2
20
15
A
DD
ISO
N C
ENTE
R
PRO
F.B
UIL
DIN
G
802,
789
1,31
0,01
2
-
802,
789
1,
310,
012
2,
112,
801
46
,516
2,
066,
285
1,
452,
333
2015
SPO
RTS
AU
THO
RIT
Y P
LAZA
49
1,67
6
1,
440,
000
4,70
7,51
9
1,00
7,88
2
5,63
1,31
4
6,63
9,19
6
2,81
2,75
2
3,82
6,44
4
-
19
71
FT.L
AU
DER
DA
LE/C
YPR
ESS
CR
EEK
14
,258
,760
28,0
42,3
90
2,
178,
040
14
,258
,760
30
,220
,430
44
,479
,190
8,
379,
964
36
,099
,226
-
20
09
102
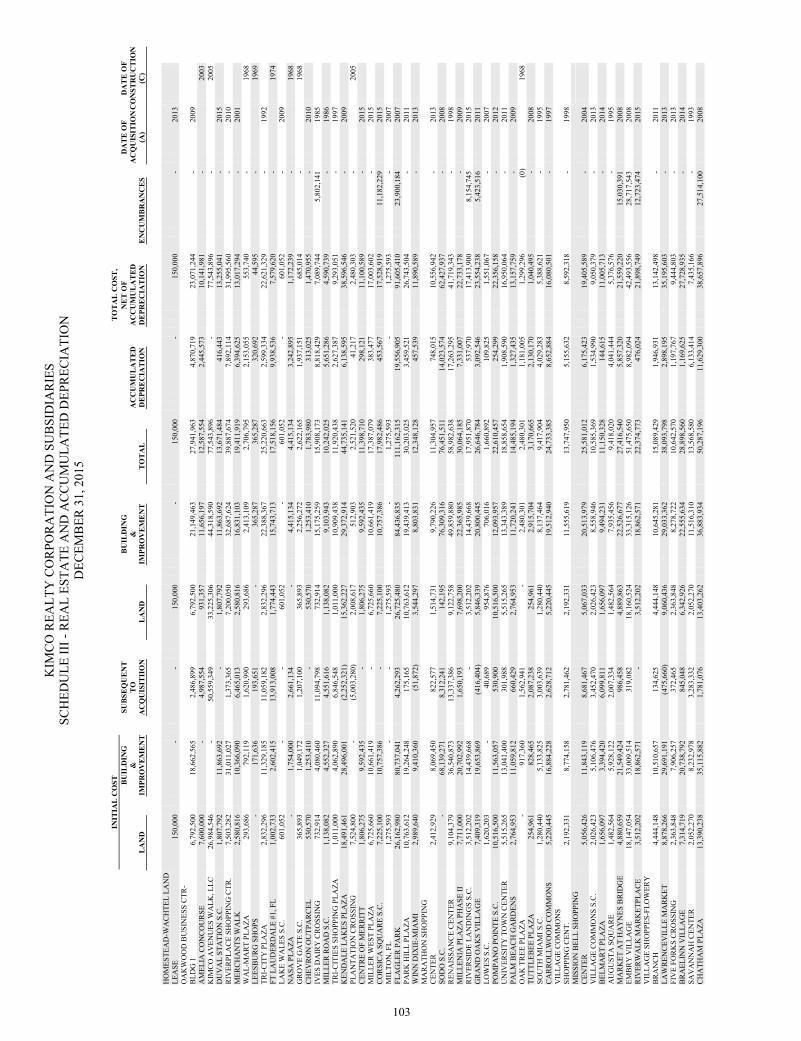
KIM
CO
REA
LTY
CO
RPO
RA
TIO
N A
ND
SU
BSI
DIA
RIE
S
SCH
EDU
LE II
I - R
EAL
ESTA
TE A
ND
AC
CU
MU
LATE
D D
EPR
ECIA
TIO
N
DEC
EMB
ER 3
1, 2
015
INIT
IAL
CO
ST
TO
TA
L C
OST
,
B
UIL
DIN
G
SU
BSE
QU
EN
T
B
UIL
DIN
G
N
ET
OF
DA
TE
OF
DA
TE
OF
&
TO
&
A
CC
UM
UL
AT
ED
A
CC
UM
UL
AT
ED
AC
QU
ISIT
ION
CO
NST
RU
CT
ION
L
AN
D
IM
PRO
VE
ME
NT
A
CQ
UIS
ITII
ON
L
AN
D
IM
PRO
VE
ME
NT
T
OT
AL
DE
PRE
CIA
TIO
N
DE
PRE
CIA
TIO
N
EN
CU
MB
RA
NC
ES
(A
) (C
)
HO
MES
TEA
D-W
AC
HTE
L LA
ND
LE
ASE
15
0,00
0
-
-
150,
000
-
150,
000
-
150,
000
-
20
13
OA
KW
OO
D B
USI
NES
S C
TR-
BLD
G 1
6,
792,
500
18,6
62,5
65
2,
486,
899
6,
792,
500
21
,149
,463
27
,941
,963
4,
870,
719
23
,071
,244
-
20
09
AM
ELIA
CO
NC
OU
RSE
7,
600,
000
-
4,98
7,55
4
931,
357
11
,656
,197
12
,587
,554
2,
445,
573
10
,141
,981
-
2003
K
IMC
O A
VEN
UES
WA
LK, L
LC
26,9
84,5
46
-
50
,559
,349
33
,225
,306
44
,318
,590
77
,543
,896
-
77,5
43,8
96
-
20
05
DU
VA
L ST
ATI
ON
S.C
. 1,
807,
792
11,8
63,6
92
-
1,80
7,79
2
11,8
63,6
92
13,6
71,4
84
416,
443
13
,255
,041
-
20
15
R
IVER
PLA
CE
SHO
PPIN
G C
TR.
7,50
3,28
2
31
,011
,027
1,37
3,36
5
7,20
0,05
0
32,6
87,6
24
39,8
87,6
74
7,89
2,11
4
31,9
95,5
60
-
2010
MER
CH
AN
TS W
ALK
2,
580,
816
10,3
66,0
90
6,
465,
013
2,
580,
816
16
,831
,103
19
,411
,919
6,
394,
625
13
,017
,294
-
20
01
W
AL-
MA
RT
PLA
ZA
293,
686
792,
119
1,62
0,99
0
293,
686
2,
413,
109
2,
706,
795
2,
153,
055
55
3,74
0
-
19
68
LEES
BU
RG
SH
OPS
-
17
1,63
6
19
3,65
1
-
36
5,28
7
365,
287
32
0,69
2
44,5
95
-
19
69
TRI-C
ITY
PLA
ZA
2,83
2,29
6
11
,329
,185
11,0
59,1
82
2,83
2,29
6
22,3
88,3
67
25,2
20,6
63
2,59
9,33
4
22,6
21,3
29
-
1992
FT L
AU
DER
DA
LE #
1, F
L
1,00
2,73
3
2,
602,
415
13,9
13,0
08
1,77
4,44
3
15,7
43,7
13
17,5
18,1
56
9,93
8,53
6
7,57
9,62
0
-
19
74
LAK
E W
ALE
S S.
C.
601,
052
-
-
60
1,05
2
-
60
1,05
2
-
60
1,05
2
-
2009
NA
SA P
LAZA
-
1,
754,
000
2,66
1,13
4
-
4,
415,
134
4,
415,
134
3,
242,
895
1,
172,
239
-
1968
G
RO
VE
GA
TE S
.C.
365,
893
1,04
9,17
2
1,
207,
100
36
5,89
3
2,25
6,27
2
2,62
2,16
5
1,93
7,15
1
685,
014
-
1968
C
HEV
RO
N O
UTP
AR
CEL
53
0,57
0
1,
253,
410
-
53
0,57
0
1,25
3,41
0
1,78
3,98
0
313,
025
1,
470,
955
-
20
10
IV
ES D
AIR
Y C
RO
SSIN
G
732,
914
4,08
0,46
0
11
,094
,798
73
2,91
4
15,1
75,2
59
15,9
08,1
73
8,81
8,42
9
7,08
9,74
4
5,80
2,14
1
19
85
M
ILLE
R R
OA
D S
.C.
1,13
8,08
2
4,
552,
327
4,55
1,61
6
1,13
8,08
2
9,10
3,94
3
10,2
42,0
25
5,65
1,28
6
4,59
0,73
9
-
1986
TRI-C
ITIE
S SH
OPP
ING
PLA
ZA
1,01
1,00
0
4,
062,
890
6,84
6,54
8
1,01
1,00
0
10,9
09,4
38
11,9
20,4
38
2,62
7,38
7
9,29
3,05
1
-
1997
KEN
DA
LE L
AK
ES P
LAZA
18
,491
,461
28,4
96,0
01
(2
,252
,321
)
15
,362
,227
29
,372
,914
44
,735
,141
6,
138,
595
38
,596
,546
-
20
09
PL
AN
TATI
ON
CR
OSS
ING
7,
524,
800
-
(5,0
03,2
80)
2,00
8,61
7
512,
903
2,
521,
520
41
,217
2,
480,
303
-
2005
C
ENTR
E O
F M
ERR
ITT
1,
806,
275
9,59
2,43
5
-
1,80
6,27
5
9,59
2,43
5
11,3
98,7
10
298,
121
11
,100
,589
-
20
15
M
ILLE
R W
EST
PLA
ZA
6,72
5,66
0
10
,661
,419
-
6,
725,
660
10
,661
,419
17
,387
,079
38
3,47
7
17,0
03,6
02
-
2015
CO
RSI
CA
SQ
UA
RE
S.C
. 7,
225,
100
10,7
57,3
86
-
7,22
5,10
0
10,7
57,3
86
17,9
82,4
86
453,
567
17
,528
,919
11
,182
,229
2015
MIL
TON
, FL
1,
275,
593
-
-
1,
275,
593
-
1,27
5,59
3
-
1,
275,
593
-
20
07
FL
AG
LER
PA
RK
26
,162
,980
80,7
37,0
41
4,
262,
293
26
,725
,480
84
,436
,835
11
1,16
2,31
5
19,5
56,9
05
91,6
05,4
10
23,9
00,1
84
20
07
PA
RK
HIL
L PL
AZA
10
,763
,612
19,2
64,2
48
17
5,16
5
10,7
63,6
12
19,4
39,4
13
30,2
03,0
25
3,45
9,52
1
26,7
43,5
04
-
2011
WIN
N D
IXIE
-MIA
MI
2,98
9,64
0
9,
410,
360
(51,
872)
3,
544,
297
8,
803,
831
12
,348
,128
45
7,53
9
11,8
90,5
89
-
2013
MA
RA
THO
N S
HO
PPIN
G
CEN
TER
2,
412,
929
8,06
9,45
0
82
2,57
7
1,51
4,73
1
9,79
0,22
6
11,3
04,9
57
748,
015
10
,556
,942
-
20
13
SOD
O S
.C.
-
68,1
39,2
71
8,
312,
241
14
2,19
5
76,3
09,3
16
76,4
51,5
11
14,0
23,5
74
62,4
27,9
37
-
2008
REN
AIS
SAN
CE
CEN
TER
9,
104,
379
36,5
40,8
73
13
,337
,386
9,
122,
758
49
,859
,880
58
,982
,638
17
,263
,295
41
,719
,343
-
19
98
M
ILLE
NIA
PLA
ZA P
HA
SE II
7,
711,
000
20,7
02,9
92
1,
650,
193
7,
698,
200
22
,365
,985
30
,064
,185
7,
331,
007
22
,733
,178
-
20
09
R
IVER
SID
E LA
ND
ING
S S.
C.
3,51
2,20
2
14
,439
,668
-
3,
512,
202
14
,439
,668
17
,951
,870
53
7,97
0
17,4
13,9
00
8,15
4,74
5
20
15
G
RA
ND
OA
KS
VIL
LAG
E
7,40
9,31
9
19
,653
,869
(416
,404
)
5,
846,
339
20
,800
,445
26
,646
,784
3,
092,
546
23
,554
,238
5,
423,
516
2011
LOW
ES S
.C.
1,62
0,20
3
-
40
,689
95
4,87
6
706,
016
1,
660,
892
10
9,82
5
1,55
1,06
7
-
2007
POM
PAN
O P
OIN
TE S
.C.
10,5
16,5
00
11
,563
,057
530,
900
10
,516
,500
12
,093
,957
22
,610
,457
25
4,29
9
22,3
56,1
58
-
2012
UN
IVER
SITY
TO
WN
CEN
TER
5,
515,
265
13,0
41,4
00
30
1,98
8
5,51
5,26
5
13,3
43,3
89
18,8
58,6
54
1,90
8,59
0
16,9
50,0
64
-
2011
PALM
BEA
CH
GA
RD
ENS
2,
764,
953
11,0
59,8
12
66
0,42
9
2,76
4,95
3
11,7
20,2
41
14,4
85,1
94
1,32
7,43
5
13,1
57,7
59
-
2009
OA
K T
REE
PLA
ZA
-
917,
360
1,56
2,94
1
-
2,
480,
301
2,
480,
301
1,
181,
005
1,
299,
296
(0
)
19
68
TUTT
LEB
EE P
LAZA
25
4,96
1
82
8,46
5
2,
087,
238
25
4,96
1
2,91
5,70
4
3,17
0,66
5
2,13
0,17
0
1,04
0,49
5
-
2008
SOU
TH M
IAM
I S.C
. 1,
280,
440
5,13
3,82
5
3,
003,
639
1,
280,
440
8,
137,
464
9,
417,
904
4,
029,
283
5,
388,
621
-
19
95
C
AR
RO
LLW
OO
D C
OM
MO
NS
5,
220,
445
16,8
84,2
28
2,
628,
712
5,
220,
445
19
,512
,940
24
,733
,385
8,
652,
884
16
,080
,501
-
19
97
V
ILLA
GE
CO
MM
ON
S SH
OPP
ING
CEN
T.
2,19
2,33
1
8,
774,
158
2,78
1,46
2
2,19
2,33
1
11,5
55,6
19
13,7
47,9
50
5,15
5,63
2
8,59
2,31
8
-
1998
MIS
SIO
N B
ELL
SHO
PPIN
G
CEN
TER
5,
056,
426
11,8
43,1
19
8,
681,
467
5,
067,
033
20
,513
,979
25
,581
,012
6,
175,
423
19
,405
,589
-
20
04
VIL
LAG
E C
OM
MO
NS
S.C
. 2,
026,
423
5,10
6,47
6
3,
452,
470
2,
026,
423
8,
558,
946
10
,585
,369
1,
534,
990
9,
050,
379
-
20
13
B
ELM
AR
T PL
AZA
1,
656,
097
3,39
4,42
0
6,
099,
811
1,
656,
097
9,
494,
231
11
,150
,328
14
4,61
5
11,0
05,7
13
-
2014
AU
GU
STA
SQ
UA
RE
1,
482,
564
5,92
8,12
2
2,
007,
334
1,
482,
564
7,
935,
456
9,
418,
020
4,
041,
444
5,
376,
576
-
19
95
M
AR
KET
AT
HA
YN
ES B
RID
GE
4,
880,
659
21,5
49,4
24
98
6,45
8
4,88
9,86
3
22,5
26,6
77
27,4
16,5
40
5,85
7,32
0
21,5
59,2
20
15,0
30,3
91
20
08
EM
BR
Y V
ILLA
GE
18
,147
,054
33,0
09,5
14
31
9,08
2
18,1
60,5
24
33,3
15,1
26
51,4
75,6
50
8,98
2,09
4
42,4
93,5
56
28,7
17,5
43
20
08
R
IVER
WA
LK M
AR
KET
PLA
CE
3,
512,
202
18,8
62,5
71
-
3,51
2,20
2
18,8
62,5
71
22,3
74,7
73
476,
024
21
,898
,749
12
,723
,474
2015
VIL
LAG
E SH
OPP
ES-F
LOW
ERY
B
RA
NC
H
4,44
4,14
8
10
,510
,657
134,
625
4,
444,
148
10
,645
,281
15
,089
,429
1,
946,
931
13
,142
,498
-
20
11
LAW
REN
CEV
ILLE
MA
RK
ET
8,87
8,26
6
29
,691
,191
(475
,660
)
9,
060,
436
29
,033
,362
38
,093
,798
2,
898,
195
35
,195
,603
-
20
13
FI
VE
FOR
KS
CR
OSS
ING
2,
363,
848
7,90
6,25
7
37
2,46
5
2,36
3,84
8
8,27
8,72
2
10,6
42,5
70
1,19
7,76
7
9,44
4,80
3
-
2013
BR
AEL
INN
VIL
LAG
E
7,31
4,71
9
20
,738
,792
845,
048
6,
342,
926
22
,555
,634
28
,898
,560
1,
169,
625
27
,728
,935
-
20
14
SA
VA
NN
AH
CEN
TER
2,
052,
270
8,23
2,97
8
3,
283,
332
2,
052,
270
11
,516
,310
13
,568
,580
6,
133,
414
7,
435,
166
-
19
93
C
HA
THA
M P
LAZA
13
,390
,238
35,1
15,8
82
1,
781,
076
13
,403
,262
36
,883
,934
50
,287
,196
11
,629
,300
38
,657
,896
27
,514
,100
2008
103
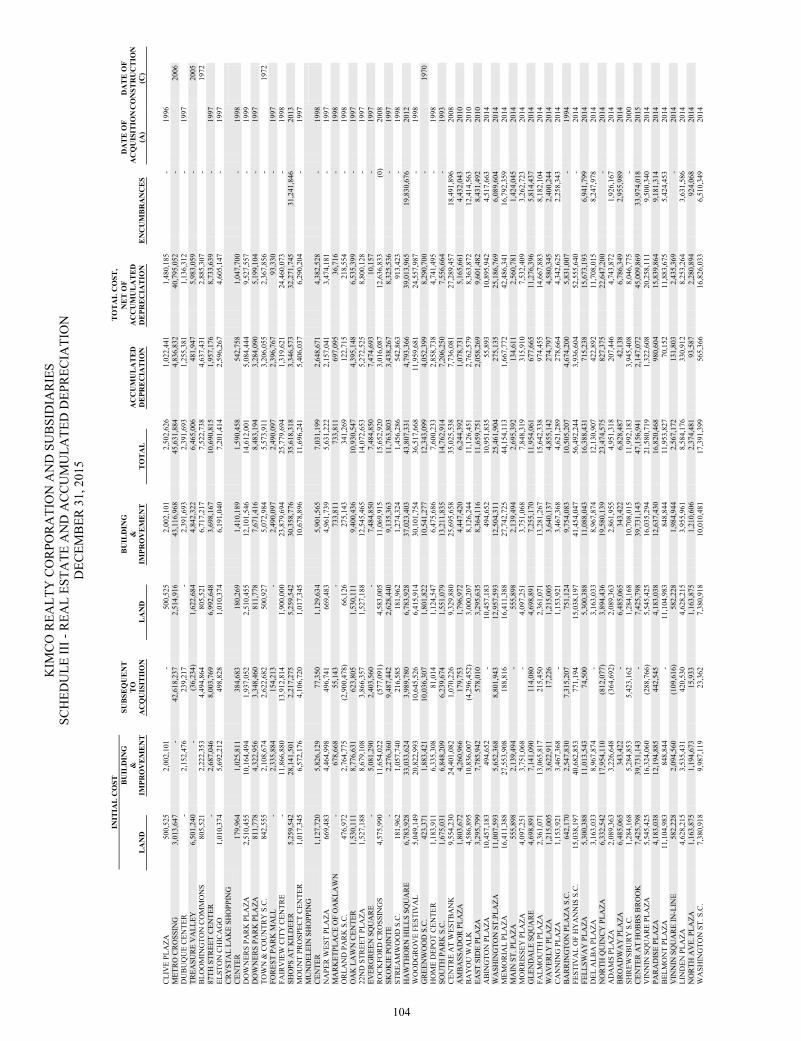
KIM
CO
REA
LTY
CO
RPO
RA
TIO
N A
ND
SU
BSI
DIA
RIE
S
SCH
EDU
LE II
I - R
EAL
ESTA
TE A
ND
AC
CU
MU
LATE
D D
EPR
ECIA
TIO
N
DEC
EMB
ER 3
1, 2
015
INIT
IAL
CO
ST
TO
TA
L C
OST
,
B
UIL
DIN
G
SU
BSE
QU
EN
T
B
UIL
DIN
G
N
ET
OF
DA
TE
OF
DA
TE
OF
&
TO
&
A
CC
UM
UL
AT
ED
A
CC
UM
UL
AT
ED
AC
QU
ISIT
ION
CO
NST
RU
CT
ION
L
AN
D
IM
PRO
VE
ME
NT
A
CQ
UIS
ITII
ON
L
AN
D
IM
PRO
VE
ME
NT
T
OT
AL
DE
PRE
CIA
TIO
N
DE
PRE
CIA
TIO
N
EN
CU
MB
RA
NC
ES
(A
) (C
)
CLI
VE
PLA
ZA
500,
525
2,00
2,10
1
-
500,
525
2,
002,
101
2,
502,
626
1,
022,
441
1,
480,
185
-
19
96
M
ETR
O C
RO
SSIN
G
3,01
3,64
7
-
42
,618
,237
2,
514,
916
43
,116
,968
45
,631
,884
4,
836,
832
40
,795
,052
-
2006
D
UB
UQ
UE
CEN
TER
-
2,
152,
476
239,
217
-
2,39
1,69
3
2,39
1,69
3
1,25
5,38
1
1,13
6,31
2
-
1997
TREA
SUR
E V
ALL
EY
6,50
1,24
0
-
(3
6,23
4)
1,62
2,68
4
4,84
2,32
2
6,46
5,00
6
481,
947
5,
983,
059
-
2005
B
LOO
MIN
GTO
N C
OM
MO
NS
80
5,52
1
2,
222,
353
4,49
4,86
4
805,
521
6,
717,
217
7,
522,
738
4,
637,
431
2,
885,
307
-
1972
87
TH S
TREE
T C
ENTE
R
-
2,68
7,04
6
8,
003,
769
6,
992,
648
3,
698,
167
10
,690
,815
1,
957,
176
8,
733,
639
-
19
97
EL
STO
N C
HIC
AG
O
1,01
0,37
4
5,
692,
212
498,
828
1,
010,
374
6,
191,
040
7,
201,
414
2,
596,
267
4,
605,
147
-
19
97
C
RY
STA
L LA
KE
SHO
PPIN
G
CEN
TER
17
9,96
4
1,
025,
811
384,
683
18
0,26
9
1,41
0,18
9
1,59
0,45
8
542,
758
1,
047,
700
-
19
98
DO
WN
ERS
PAR
K P
LAZA
2,
510,
455
10,1
64,4
94
1,
937,
052
2,
510,
455
12
,101
,546
14
,612
,001
5,
084,
444
9,
527,
557
-
19
99
D
OW
NER
S PA
RK
PLA
ZA
811,
778
4,32
2,95
6
3,
348,
460
81
1,77
8
7,67
1,41
6
8,48
3,19
4
3,28
4,09
0
5,19
9,10
4
-
1997
TOW
N &
CO
UN
TRY
S.C
. 84
2,55
5
2,
108,
674
2,62
2,68
2
500,
927
5,
072,
984
5,
573,
911
3,
206,
055
2,
367,
856
-
1972
FO
RES
T PA
RK
MA
LL
-
2,33
5,88
4
15
4,21
3
-
2,
490,
097
2,
490,
097
2,
396,
767
93
,330
-
19
97
FA
IRV
IEW
CIT
Y C
ENTR
E
-
11,8
66,8
80
13
,912
,814
1,
900,
000
23
,879
,694
25
,779
,694
1,
319,
621
24
,460
,073
-
19
98
SH
OPS
AT
KIL
DEE
R
5,25
9,54
2
28
,141
,501
2,21
7,27
5
5,25
9,54
2
30,3
58,7
76
35,6
18,3
18
3,34
6,57
3
32,2
71,7
45
31,2
41,8
46
20
13
M
OU
NT
PRO
SPEC
T C
ENTE
R
1,01
7,34
5
6,
572,
176
4,10
6,72
0
1,01
7,34
5
10,6
78,8
96
11,6
96,2
41
5,40
6,03
7
6,29
0,20
4
-
1997
MU
ND
ELEI
N S
HO
PPIN
G
CEN
TER
1,
127,
720
5,82
6,12
9
77
,350
1,
129,
634
5,
901,
565
7,
031,
199
2,
648,
671
4,
382,
528
-
19
98
NA
PER
WES
T PL
AZA
66
9,48
3
4,
464,
998
496,
741
66
9,48
3
4,96
1,73
9
5,63
1,22
2
2,15
7,04
1
3,47
4,18
1
-
1997
MA
RK
ETPL
AC
E O
F O
AK
LAW
N
-
678,
668
55,1
43
-
73
3,81
1
733,
811
69
7,09
5
36,7
16
-
1998
OR
LAN
D P
AR
K S
.C.
476,
972
2,76
4,77
5
(2
,900
,478
)
66
,126
27
5,14
3
341,
269
12
2,71
5
218,
554
-
19
98
O
AK
LA
WN
CEN
TER
1,
530,
111
8,77
6,63
1
62
3,80
5
1,53
0,11
1
9,40
0,43
6
10,9
30,5
47
4,39
5,14
8
6,53
5,39
9
-
1997
22N
D S
TREE
T PL
AZA
1,
527,
188
8,67
9,10
8
3,
866,
357
1,
527,
188
12
,545
,465
14
,072
,653
5,
272,
525
8,
800,
128
-
19
97
EV
ERG
REE
N S
QU
AR
E
-
5,08
1,29
0
2,
403,
560
-
7,48
4,85
0
7,48
4,85
0
7,47
4,69
3
10,1
57
-
1997
RO
CK
FOR
D C
RO
SSIN
GS
4,
575,
990
11,6
54,0
22
(5
77,0
91)
4,58
3,00
5
11,0
69,9
15
15,6
52,9
20
3,01
6,08
7
12,6
36,8
33
(0)
20
08
SK
OK
IE P
OIN
TE
-
2,27
6,36
0
9,
487,
442
2,
628,
440
9,
135,
363
11
,763
,803
3,
438,
267
8,
325,
536
-
19
97
ST
REA
MW
OO
D S
.C.
181,
962
1,05
7,74
0
21
6,58
5
181,
962
1,
274,
324
1,
456,
286
54
2,86
3
913,
423
-
19
98
H
AW
THO
RN
HIL
LS S
QU
AR
E
6,78
3,92
8
33
,033
,624
3,98
9,78
0
6,78
3,92
8
37,0
23,4
03
43,8
07,3
31
4,79
3,36
6
39,0
13,9
65
19,8
30,6
76
20
12
W
OO
DG
RO
VE
FEST
IVA
L
5,04
9,14
9
20
,822
,993
10,6
45,5
26
6,41
5,91
4
30,1
01,7
54
36,5
17,6
68
11,9
59,6
81
24,5
57,9
87
-
1998
GR
EEN
WO
OD
S.C
. 42
3,37
1
1,
883,
421
10,0
36,3
07
1,80
1,82
2
10,5
41,2
77
12,3
43,0
99
4,05
2,39
9
8,29
0,70
0
-
19
70
HO
ME
DEP
OT
CEN
TER
1,
183,
911
6,33
5,30
8
81
,014
1,
124,
547
6,
475,
686
7,
600,
233
2,
858,
738
4,
741,
495
-
19
98
SO
UTH
PA
RK
S.C
. 1,
675,
031
6,84
8,20
9
6,
239,
674
1,
551,
079
13
,211
,835
14
,762
,914
7,
206,
250
7,
556,
664
-
19
93
C
ENTR
E A
T W
ESTB
AN
K
9,55
4,23
0
24
,401
,082
1,07
0,22
6
9,32
9,88
0
25,6
95,6
58
35,0
25,5
38
7,73
6,08
1
27,2
89,4
57
18,4
91,8
96
20
08
A
MB
ASS
AD
OR
PLA
ZA
1,80
3,67
2
4,
260,
966
179,
753
1,
796,
972
4,
447,
420
6,
244,
392
1,
078,
731
5,
165,
661
4,
432,
043
2010
BA
YO
U W
ALK
4,
586,
895
10,8
36,0
07
(4
,296
,452
)
3,
000,
207
8,
126,
244
11
,126
,451
2,
762,
579
8,
363,
872
12
,414
,563
2010
EAST
SID
E PL
AZA
3,
295,
799
7,78
5,94
2
57
8,01
0
3,29
5,63
5
8,36
4,11
6
11,6
59,7
51
2,05
8,26
9
9,60
1,48
2
8,43
1,49
2
20
10
A
BIN
GTO
N P
LAZA
10
,457
,183
494,
652
-
10
,457
,183
49
4,65
2
10,9
51,8
35
55,8
93
10,8
95,9
42
4,51
7,66
3
20
14
W
ASH
ING
TON
ST.
PLA
ZA
11,0
07,5
93
5,
652,
368
8,80
1,94
3
12,9
57,5
93
12,5
04,3
11
25,4
61,9
04
275,
135
25
,186
,769
6,
089,
604
2014
MEM
OR
IAL
PLA
ZA
16,4
11,3
88
27
,553
,908
188,
816
16
,411
,388
27
,742
,725
44
,154
,113
1,
667,
772
42
,486
,341
16
,792
,359
2014
MA
IN S
T. P
LAZA
55
5,89
8
2,
139,
494
-
55
5,89
8
2,13
9,49
4
2,69
5,39
2
134,
611
2,
560,
781
1,
424,
045
2014
MO
RR
ISSE
Y P
LAZA
4,
097,
251
3,75
1,06
8
-
4,09
7,25
1
3,75
1,06
8
7,84
8,31
9
315,
910
7,
532,
409
3,
262,
723
2014
GLE
ND
ALE
SQ
UA
RE
4,
698,
891
7,14
1,09
0
11
4,08
0
4,69
8,89
1
7,25
5,17
0
11,9
54,0
61
677,
665
11
,276
,396
5,
814,
437
2014
FALM
OU
TH P
LAZA
2,
361,
071
13,0
65,8
17
21
5,45
0
2,36
1,07
1
13,2
81,2
67
15,6
42,3
38
974,
455
14
,667
,883
8,
182,
104
2014
WA
VER
LY P
LAZA
1,
215,
005
3,62
2,91
1
17
,226
1,
215,
005
3,
640,
137
4,
855,
142
27
4,79
7
4,58
0,34
5
2,40
0,24
4
20
14
C
AN
NIN
G P
LAZA
1,
153,
921
3,46
7,36
8
-
1,15
3,92
1
3,46
7,36
8
4,62
1,28
9
278,
664
4,
342,
625
2,
258,
343
2014
BA
RR
ING
TON
PLA
ZA S
.C.
642,
170
2,54
7,83
0
7,
315,
207
75
1,12
4
9,75
4,08
3
10,5
05,2
07
4,67
4,20
0
5,83
1,00
7
-
1994
FEST
IVA
L O
F H
YA
NN
IS S
.C.
15,0
38,1
97
40
,682
,853
771,
194
15
,038
,197
41
,454
,047
56
,492
,244
3,
936,
604
52
,555
,640
-
20
14
FE
LLSW
AY
PLA
ZA
5,30
0,38
8
11
,013
,543
74,5
00
5,30
0,38
8
11,0
88,0
43
16,3
88,4
31
715,
238
15
,673
,193
6,
941,
799
2014
DEL
ALB
A P
LAZA
3,
163,
033
8,96
7,87
4
-
3,16
3,03
3
8,96
7,87
4
12,1
30,9
07
422,
892
11
,708
,015
8,
247,
978
2014
NO
RTH
QU
INC
Y P
LAZA
6,
332,
542
17,9
54,1
10
(8
12,0
77)
3,89
4,43
6
19,5
80,1
39
23,4
74,5
75
827,
375
22
,647
,200
-
20
14
A
DA
MS
PLA
ZA
2,08
9,36
3
3,
226,
648
(364
,692
)
2,
089,
363
2,
861,
955
4,
951,
318
20
7,44
6
4,74
3,87
2
1,92
6,16
7
20
14
B
RO
AD
WA
Y P
LAZA
6,
485,
065
343,
422
-
6,
485,
065
34
3,42
2
6,82
8,48
7
42,1
38
6,78
6,34
9
2,95
5,98
9
20
14
SH
REW
SBU
RY
S.C
. 1,
284,
168
5,28
4,85
3
5,
423,
162
1,
284,
168
10
,708
,015
11
,992
,183
3,
945,
408
8,
046,
775
-
20
00
C
ENTE
R A
T H
OB
BS
BR
OO
K
7,42
5,79
8
39
,731
,143
-
7,
425,
798
39
,731
,143
47
,156
,941
2,
147,
072
45
,009
,869
33
,974
,018
2015
VIN
NIN
SQ
UA
RE
PLA
ZA
5,54
5,42
5
16
,324
,060
(288
,766
)
5,
545,
425
16
,035
,294
21
,580
,719
1,
322,
608
20
,258
,111
9,
500,
340
2014
PAR
AD
ISE
PLA
ZA
4,18
3,03
8
12
,194
,885
442,
545
4,
183,
038
12
,637
,430
16
,820
,468
98
0,60
4
15,8
39,8
64
9,18
1,31
4
20
14
B
ELM
ON
T PL
AZA
11
,104
,983
848,
844
-
11
,104
,983
84
8,84
4
11,9
53,8
27
70,1
52
11,8
83,6
75
5,42
4,45
3
20
14
V
INN
IN S
QU
AR
E IN
-LIN
E
582,
228
2,09
4,56
0
(1
09,6
16)
582,
228
1,
984,
944
2,
567,
172
13
1,80
3
2,43
5,36
9
-
2014
LIN
DEN
PLA
ZA
4,62
8,21
5
3,
535,
431
420,
530
4,
628,
215
3,
955,
961
8,
584,
176
33
0,91
2
8,25
3,26
4
3,63
1,58
6
20
14
N
OR
TH A
VE.
PLA
ZA
1,16
3,87
5
1,
194,
673
15,9
33
1,16
3,87
5
1,21
0,60
6
2,37
4,48
1
93,5
87
2,28
0,89
4
924,
068
2014
WA
SHIN
GTO
N S
T. S
.C.
7,38
0,91
8
9,
987,
119
23,3
62
7,38
0,91
8
10,0
10,4
81
17,3
91,3
99
565,
366
16
,826
,033
6,
510,
349
2014
104
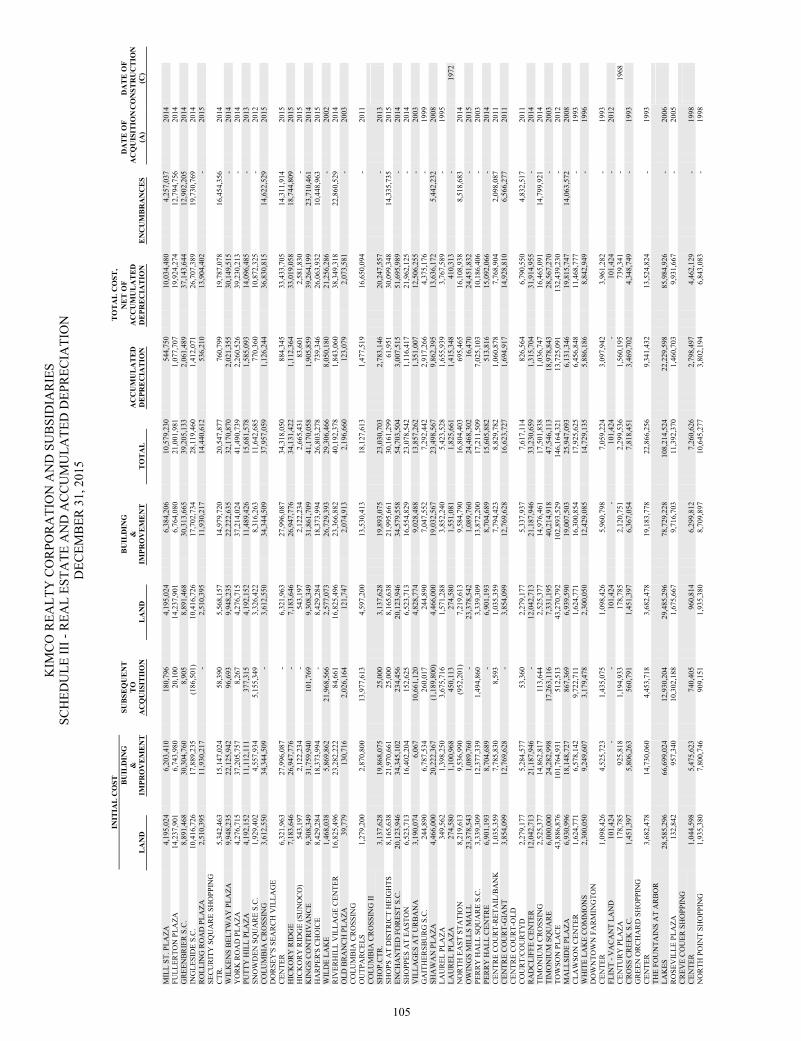
KIM
CO
REA
LTY
CO
RPO
RA
TIO
N A
ND
SU
BSI
DIA
RIE
S
SCH
EDU
LE II
I - R
EAL
ESTA
TE A
ND
AC
CU
MU
LATE
D D
EPR
ECIA
TIO
N
DEC
EMB
ER 3
1, 2
015
INIT
IAL
CO
ST
TO
TA
L C
OST
,
B
UIL
DIN
G
SU
BSE
QU
EN
T
B
UIL
DIN
G
N
ET
OF
DA
TE
OF
DA
TE
OF
&
TO
&
A
CC
UM
UL
AT
ED
A
CC
UM
UL
AT
ED
AC
QU
ISIT
ION
CO
NST
RU
CT
ION
L
AN
D
IM
PRO
VE
ME
NT
A
CQ
UIS
ITII
ON
L
AN
D
IM
PRO
VE
ME
NT
T
OT
AL
DE
PRE
CIA
TIO
N
DE
PRE
CIA
TIO
N
EN
CU
MB
RA
NC
ES
(A
) (C
)
MIL
L ST
. PLA
ZA
4,19
5,02
4
6,
203,
410
180,
796
4,
195,
024
6,
384,
206
10
,579
,230
54
4,75
0
10,0
34,4
80
4,25
7,03
7
20
14
FU
LLER
TON
PLA
ZA
14,2
37,9
01
6,
743,
980
20,1
00
14,2
37,9
01
6,76
4,08
0
21,0
01,9
81
1,07
7,70
7
19,9
24,2
74
12,7
94,7
56
20
14
G
REE
NB
RIE
R S
.C.
8,89
1,46
8
30
,304
,760
8,90
5
8,89
1,46
8
30,3
13,6
65
39,2
05,1
33
2,06
1,48
9
37,1
43,6
44
12,9
02,2
05
20
14
IN
GLE
SID
E S.
C.
10,4
16,7
26
17
,889
,235
(186
,501
)
10
,416
,726
17
,702
,734
28
,119
,460
1,
412,
071
26
,707
,389
19
,730
,769
2014
RO
LLIN
G R
OA
D P
LAZA
2,
510,
395
11,9
30,2
17
-
2,51
0,39
5
11,9
30,2
17
14,4
40,6
12
536,
210
13
,904
,402
-
20
15
SE
CU
RIT
Y S
QU
AR
E SH
OPP
ING
C
TR.
5,34
2,46
3
15
,147
,024
58,3
90
5,56
8,15
7
14,9
79,7
20
20,5
47,8
77
760,
799
19
,787
,078
16
,454
,356
2014
WIL
KEN
S B
ELTW
AY
PLA
ZA
9,94
8,23
5
22
,125
,942
96,6
93
9,94
8,23
5
22,2
22,6
35
32,1
70,8
70
2,02
1,35
5
30,1
49,5
15
-
2014
YO
RK
RO
AD
PLA
ZA
4,27
6,71
5
37
,205
,757
8,26
7
4,27
6,71
5
37,2
14,0
24
41,4
90,7
39
2,26
0,52
6
39,2
30,2
13
-
2014
PUTT
Y H
ILL
PLA
ZA
4,19
2,15
2
11
,112
,111
377,
315
4,
192,
152
11
,489
,426
15
,681
,578
1,
585,
093
14
,096
,485
-
20
13
SN
OW
DEN
SQ
UA
RE
S.C
. 1,
929,
402
4,55
7,93
4
5,
155,
349
3,
326,
422
8,
316,
263
11
,642
,685
77
0,36
0
10,8
72,3
25
-
2012
CO
LUM
BIA
CR
OSS
ING
3,
612,
550
34,3
44,5
09
-
3,61
2,55
0
34,3
44,5
09
37,9
57,0
59
1,12
6,24
4
36,8
30,8
15
14,6
22,5
29
20
15
D
OR
SEY
'S S
EAR
CH
VIL
LAG
E C
ENTE
R
6,32
1,96
3
27
,996
,087
-
6,
321,
963
27
,996
,087
34
,318
,050
88
4,34
5
33,4
33,7
05
14,3
11,9
14
20
15
HIC
KO
RY
RID
GE
7,
183,
646
26,9
47,7
76
-
7,18
3,64
6
26,9
47,7
76
34,1
31,4
22
1,11
2,36
4
33,0
19,0
58
18,7
44,8
09
20
15
H
ICK
OR
Y R
IDG
E (S
UN
OC
O)
543,
197
2,12
2,23
4
-
543,
197
2,
122,
234
2,
665,
431
83
,601
2,
581,
830
-
20
15
K
ING
S C
ON
TRIV
AN
CE
9,
308,
349
31,7
59,9
40
10
1,76
9
9,30
8,34
9
31,8
61,7
09
41,1
70,0
58
1,90
5,85
9
39,2
64,1
99
23,7
10,4
61
20
14
H
AR
PER
'S C
HO
ICE
8,
429,
284
18,3
73,9
94
-
8,42
9,28
4
18,3
73,9
94
26,8
03,2
78
739,
346
26
,063
,932
10
,448
,963
2015
WIL
DE
LAK
E
1,46
8,03
8
5,
869,
862
21,9
68,5
66
2,57
7,07
3
26,7
29,3
93
29,3
06,4
66
8,05
0,18
0
21,2
56,2
86
-
2002
RIV
ERH
ILL
VIL
LAG
E C
ENTE
R
16,8
25,4
96
23
,282
,222
84,6
61
16,8
25,4
96
23,3
66,8
82
40,1
92,3
78
1,84
3,06
0
38,3
49,3
18
22,8
60,5
29
20
14
O
LD B
RA
NC
H P
LAZA
39
,779
130,
716
2,02
6,16
4
121,
747
2,
074,
913
2,
196,
660
12
3,07
9
2,07
3,58
1
-
2003
CO
LUM
BIA
CR
OSS
ING
O
UTP
AR
CEL
S
1,27
9,20
0
2,
870,
800
13,9
77,6
13
4,59
7,20
0
13,5
30,4
13
18,1
27,6
13
1,47
7,51
9
16,6
50,0
94
-
2011
CO
LUM
BIA
CR
OSS
ING
II
SHO
P.C
TR.
3,13
7,62
8
19
,868
,075
25,0
00
3,13
7,62
8
19,8
93,0
75
23,0
30,7
03
2,78
3,14
6
20,2
47,5
57
-
2013
SHO
PS A
T D
ISTR
ICT
HEI
GH
TS
8,16
5,63
8
21
,970
,661
25,0
00
8,16
5,63
8
21,9
95,6
61
30,1
61,2
99
61,9
51
30,0
99,3
48
14,3
35,7
35
20
15
EN
CH
AN
TED
FO
RES
T S.
C.
20,1
23,9
46
34
,345
,102
234,
456
20
,123
,946
34
,579
,558
54
,703
,504
3,
007,
515
51
,695
,989
-
20
14
SH
OPP
ES A
T EA
STO
N
6,52
3,71
3
16
,402
,204
152,
625
6,
523,
713
16
,554
,829
23
,078
,542
1,
116,
417
21
,962
,125
-
20
14
V
ILLA
GES
AT
UR
BA
NA
3,
190,
074
6,06
7
10
,661
,120
4,
828,
774
9,
028,
488
13
,857
,262
1,
351,
007
12
,506
,255
-
20
03
G
AIT
HER
SBU
RG
S.C
. 24
4,89
0
6,
787,
534
260,
017
24
4,89
0
7,04
7,55
2
7,29
2,44
2
2,91
7,26
6
4,37
5,17
6
-
1999
SHA
WA
N P
LAZA
4,
466,
000
20,2
22,3
67
(1
,189
,800
)
4,
466,
000
19
,032
,567
23
,498
,567
9,
862,
395
13
,636
,172
5,
442,
232
2008
LAU
REL
PLA
ZA
349,
562
1,39
8,25
0
3,
675,
716
1,
571,
288
3,
852,
240
5,
423,
528
1,
655,
939
3,
767,
589
-
19
95
LA
UR
EL P
LAZA
27
4,58
0
1,
100,
968
450,
113
27
4,58
0
1,55
1,08
1
1,82
5,66
1
1,41
5,34
8
410,
313
-
1972
N
OR
TH E
AST
STA
TIO
N
8,21
9,61
3
9,
536,
990
(952
,201
)
7,
219,
613
9,
584,
790
16
,804
,403
69
5,46
5
16,1
08,9
38
8,51
8,68
3
20
14
O
WIN
GS
MIL
LS M
ALL
23
,378
,543
1,08
9,76
0
-
23,3
78,5
42
1,08
9,76
0
24,4
68,3
02
16,4
70
24,4
51,8
32
-
2015
PER
RY
HA
LL S
QU
AR
E S.
C.
3,33
9,30
9
12
,377
,339
1,49
4,86
0
3,33
9,30
9
13,8
72,2
00
17,2
11,5
09
7,02
5,10
3
10,1
86,4
06
-
2003
PER
RY
HA
LL C
ENTR
E
6,90
1,19
3
8,
704,
689
-
6,
901,
193
8,
704,
689
15
,605
,882
51
3,81
6
15,0
92,0
66
-
2014
CEN
TRE
CO
UR
T-R
ETA
IL/B
AN
K
1,03
5,35
9
7,
785,
830
8,59
3
1,03
5,35
9
7,79
4,42
3
8,82
9,78
2
1,06
0,87
8
7,76
8,90
4
2,09
8,08
7
20
11
C
ENTR
E C
OU
RT-
GIA
NT
3,
854,
099
12,7
69,6
28
-
3,85
4,09
9
12,7
69,6
28
16,6
23,7
27
1,69
4,91
7
14,9
28,8
10
6,56
6,27
7
20
11
C
ENTR
E C
OU
RT-
OLD
C
OU
RT/
CO
UR
TYD
2,
279,
177
5,28
4,57
7
53
,360
2,
279,
177
5,
337,
937
7,
617,
114
82
6,56
4
6,79
0,55
0
4,83
2,51
7
20
11
RA
DC
LIFF
E C
ENTE
R
12,0
42,7
13
21
,187
,946
-
12
,042
,713
21
,187
,946
33
,230
,659
1,
315,
704
31
,914
,955
-
20
14
TI
MO
NIU
M C
RO
SSIN
G
2,52
5,37
7
14
,862
,817
113,
644
2,
525,
377
14
,976
,461
17
,501
,838
1,
036,
747
16
,465
,091
14
,799
,921
2014
TIM
ON
IUM
SQ
UA
RE
6,
000,
000
24,2
82,9
98
17
,263
,116
7,
331,
195
40
,214
,918
47
,546
,113
18
,978
,843
28
,567
,270
-
20
03
TO
WSO
N P
LAC
E
43,8
86,8
76
10
1,76
4,93
1
51
2,51
3
43,2
70,7
92
102,
893,
529
14
6,16
4,32
1
13,7
25,0
91
132,
439,
230
-
20
12
M
ALL
SID
E PL
AZA
6,
930,
996
18,1
48,7
27
86
7,36
9
6,93
9,59
0
19,0
07,5
03
25,9
47,0
93
6,13
1,34
6
19,8
15,7
47
14,0
63,5
72
20
08
C
LAW
SON
CEN
TER
1,
624,
771
6,57
8,14
2
9,
722,
711
1,
624,
771
16
,300
,854
17
,925
,625
6,
456,
848
11
,468
,777
-
19
93
W
HIT
E LA
KE
CO
MM
ON
S
2,30
0,05
0
9,
249,
607
3,17
9,47
8
2,30
0,05
0
12,4
29,0
85
14,7
29,1
35
5,88
6,18
6
8,84
2,94
9
-
1996
DO
WN
TOW
N F
AR
MIN
GTO
N
CEN
TER
1,
098,
426
4,52
5,72
3
1,
435,
075
1,
098,
426
5,
960,
798
7,
059,
224
3,
097,
942
3,
961,
282
-
19
93
FLIN
T - V
AC
AN
T LA
ND
10
1,42
4
-
-
101,
424
-
101,
424
-
101,
424
-
20
12
C
ENTU
RY
PLA
ZA
178,
785
925,
818
1,19
4,93
3
178,
785
2,
120,
751
2,
299,
536
1,
560,
195
73
9,34
1
-
19
68
CR
OSS
CR
EEK
S.C
. 1,
451,
397
5,80
6,26
3
56
0,79
1
1,45
1,39
7
6,36
7,05
4
7,81
8,45
1
3,46
9,70
2
4,34
8,74
9
-
1993
GR
EEN
OR
CH
AR
D S
HO
PPIN
G
CEN
TER
3,
682,
478
14,7
30,0
60
4,
453,
718
3,
682,
478
19
,183
,778
22
,866
,256
9,
341,
432
13
,524
,824
-
19
93
THE
FOU
NTA
INS
AT
AR
BO
R
LAK
ES
28,5
85,2
96
66
,699
,024
12,9
30,2
04
29,4
85,2
96
78,7
29,2
28
108,
214,
524
22
,229
,598
85
,984
,926
-
20
06
RO
SEV
ILLE
PLA
ZA
132,
842
957,
340
10,3
02,1
88
1,67
5,66
7
9,71
6,70
3
11,3
92,3
70
1,46
0,70
3
9,93
1,66
7
-
2005
CR
EVE
CO
UER
SH
OPP
ING
C
ENTE
R
1,04
4,59
8
5,
475,
623
740,
405
96
0,81
4
6,29
9,81
2
7,26
0,62
6
2,79
8,49
7
4,46
2,12
9
-
1998
NO
RTH
PO
INT
SHO
PPIN
G
1,93
5,38
0
7,
800,
746
909,
151
1,
935,
380
8,
709,
897
10
,645
,277
3,
802,
194
6,
843,
083
-
19
98
105
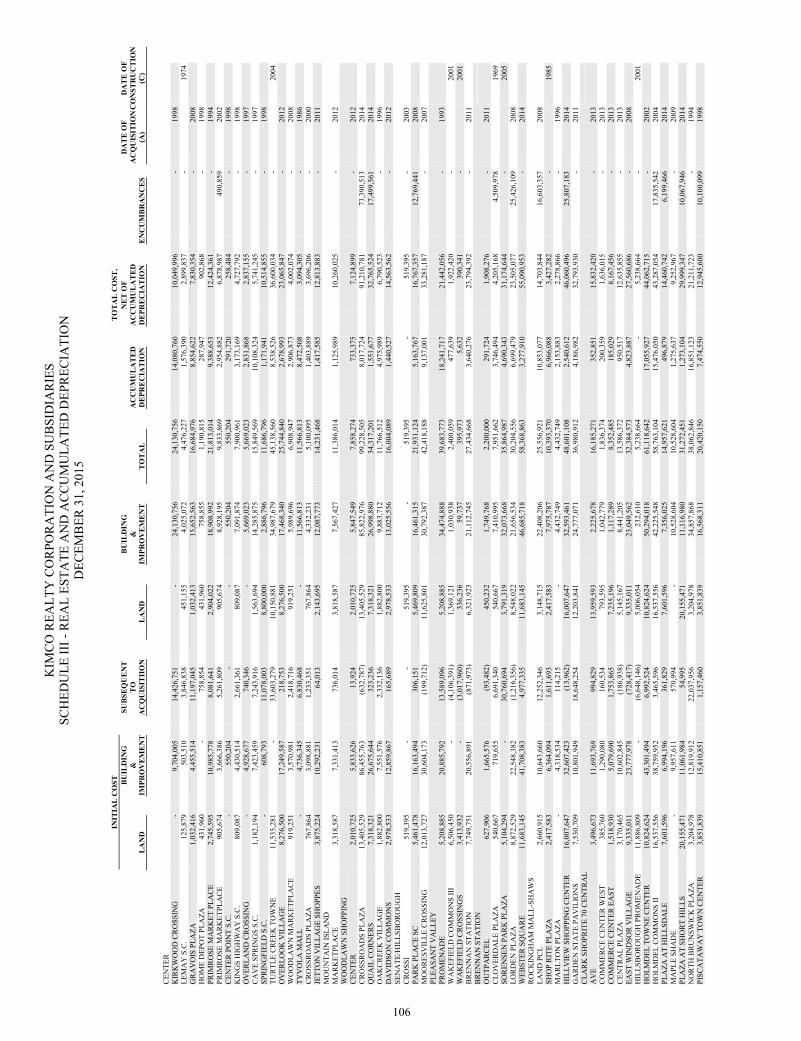
KIM
CO
REA
LTY
CO
RPO
RA
TIO
N A
ND
SU
BSI
DIA
RIE
S
SCH
EDU
LE II
I - R
EAL
ESTA
TE A
ND
AC
CU
MU
LATE
D D
EPR
ECIA
TIO
N
DEC
EMB
ER 3
1, 2
015
INIT
IAL
CO
ST
TO
TA
L C
OST
,
B
UIL
DIN
G
SU
BSE
QU
EN
T
B
UIL
DIN
G
N
ET
OF
DA
TE
OF
DA
TE
OF
&
TO
&
A
CC
UM
UL
AT
ED
A
CC
UM
UL
AT
ED
AC
QU
ISIT
ION
CO
NST
RU
CT
ION
L
AN
D
IM
PRO
VE
ME
NT
A
CQ
UIS
ITII
ON
L
AN
D
IM
PRO
VE
ME
NT
T
OT
AL
DE
PRE
CIA
TIO
N
DE
PRE
CIA
TIO
N
EN
CU
MB
RA
NC
ES
(A
) (C
)
CEN
TER
K
IRK
WO
OD
CR
OSS
ING
-
9,
704,
005
14,4
26,7
51
-
24
,130
,756
24
,130
,756
14
,080
,760
10
,049
,996
-
19
98
LE
MA
Y S
.C.
125,
879
503,
510
3,84
6,83
8
451,
155
4,
025,
072
4,
476,
227
1,
576,
390
2,
899,
837
-
1974
G
RA
VO
IS P
LAZA
1,
032,
416
4,45
5,51
4
11
,197
,045
1,
032,
413
15
,652
,563
16
,684
,976
8,
854,
622
7,
830,
354
-
20
08
H
OM
E D
EPO
T PL
AZA
43
1,96
0
-
75
8,85
4
431,
960
75
8,85
5
1,19
0,81
5
287,
947
90
2,86
8
-
1998
PRIM
RO
SE M
AR
KET
PLA
CE
2,
745,
595
10,9
85,7
78
8,
081,
641
2,
904,
022
18
,908
,992
21
,813
,014
9,
388,
653
12
,424
,361
-
19
94
PR
IMR
OSE
MA
RK
ETPL
AC
E
905,
674
3,66
6,38
6
5,
261,
809
90
5,67
4
8,92
8,19
5
9,83
3,86
9
2,95
4,88
2
6,87
8,98
7
490,
859
2002
CEN
TER
PO
INT
S.C
. -
55
0,20
4
-
-
55
0,20
4
550,
204
29
1,72
0
258,
484
-
19
98
K
ING
S H
IGH
WA
Y S
.C.
809,
087
4,43
0,51
4
2,
661,
361
80
9,08
7
7,09
1,87
4
7,90
0,96
1
3,17
3,16
9
4,72
7,79
2
-
1998
OV
ERLA
ND
CR
OSS
ING
-
4,
928,
677
740,
346
-
5,66
9,02
3
5,66
9,02
3
2,83
1,86
8
2,83
7,15
5
-
1997
CA
VE
SPR
ING
S S.
C.
1,18
2,19
4
7,
423,
459
7,24
3,91
6
1,56
3,69
4
14,2
85,8
75
15,8
49,5
69
10,1
08,3
24
5,74
1,24
5
-
1997
SPR
ING
FIEL
D S
.C.
-
608,
793
11,0
78,0
03
8,80
0,00
0
2,88
6,79
6
11,6
86,7
96
1,17
1,94
1
10,5
14,8
55
-
1998
TUR
TLE
CR
EEK
TO
WN
E
11,5
35,2
81
-
33
,603
,279
10
,150
,881
34
,987
,679
45
,138
,560
8,
538,
526
36
,600
,034
-
2004
O
VER
LOO
K V
ILLA
GE
8,
276,
500
17,2
49,5
87
21
8,75
3
8,27
6,50
0
17,4
68,3
40
25,7
44,8
40
2,67
8,99
3
23,0
65,8
47
-
2012
WO
OD
LAW
N M
AR
KET
PLA
CE
91
9,25
1
3,
570,
981
2,41
8,71
6
919,
251
5,
989,
696
6,
908,
947
2,
906,
873
4,
002,
074
-
20
08
TY
VO
LA M
ALL
-
4,
736,
345
6,83
0,46
8
-
11
,566
,813
11
,566
,813
8,
472,
508
3,
094,
305
-
19
86
C
RO
SSR
OA
DS
PLA
ZA
767,
864
3,09
8,88
1
1,
233,
351
76
7,86
4
4,33
2,23
1
5,10
0,09
5
1,40
3,88
9
3,69
6,20
6
-
2000
JETT
ON
VIL
LAG
E SH
OPP
ES
3,87
5,22
4
10
,292
,231
64,0
13
2,14
3,69
5
12,0
87,7
73
14,2
31,4
68
1,41
7,58
5
12,8
13,8
83
-
2011
MO
UN
TAIN
ISLA
ND
M
AR
KET
PLA
CE
3,
318,
587
7,33
1,41
3
73
6,01
4
3,81
8,58
7
7,56
7,42
7
11,3
86,0
14
1,12
5,98
9
10,2
60,0
25
-
2012
WO
OD
LAW
N S
HO
PPIN
G
CEN
TER
2,
010,
725
5,83
3,62
6
13
,924
2,
010,
725
5,
847,
549
7,
858,
274
73
3,37
5
7,12
4,89
9
-
2012
CR
OSS
RO
AD
S PL
AZA
13
,405
,529
86,4
55,7
63
(6
32,7
87)
13,4
05,5
29
85,8
22,9
76
99,2
28,5
05
8,01
7,72
4
91,2
10,7
81
73,3
90,5
13
20
14
Q
UA
IL C
OR
NER
S
7,31
8,32
1
26
,675
,644
323,
236
7,
318,
321
26
,998
,880
34
,317
,201
1,
551,
677
32
,765
,524
17
,499
,561
2014
OA
KC
REE
K V
ILLA
GE
1,
882,
800
7,55
1,57
6
2,
332,
136
1,
882,
800
9,
883,
712
11
,766
,512
4,
975,
989
6,
790,
523
-
19
96
D
AV
IDSO
N C
OM
MO
NS
2,
978,
533
12,8
59,8
67
16
5,68
9
2,97
8,53
3
13,0
25,5
56
16,0
04,0
89
1,44
0,52
7
14,5
63,5
62
-
2012
SEN
ATE
/HIL
LSB
OR
OU
GH
C
RO
SSI
519,
395
-
-
51
9,39
5
-
51
9,39
5
-
51
9,39
5
-
2003
PAR
K P
LAC
E SC
5,
461,
478
16,1
63,4
94
30
6,15
1
5,46
9,80
9
16,4
61,3
15
21,9
31,1
24
5,16
3,76
7
16,7
67,3
57
12,7
69,4
41
20
08
M
OO
RES
VIL
LE C
RO
SSIN
G
12,0
13,7
27
30
,604
,173
(199
,712
)
11
,625
,801
30
,792
,387
42
,418
,188
9,
137,
001
33
,281
,187
-
20
07
PL
EASA
NT
VA
LLEY
PR
OM
ENA
DE
5,
208,
885
20,8
85,7
92
13
,589
,096
5,
208,
885
34
,474
,888
39
,683
,773
18
,241
,717
21
,442
,056
-
19
93
WA
KEF
IELD
CO
MM
ON
S III
6,
506,
450
-
(4,1
06,3
91)
1,36
9,12
1
1,03
0,93
8
2,40
0,05
9
477,
639
1,
922,
420
-
2001
W
AK
EFIE
LD C
RO
SSIN
GS
3,
413,
932
-
(3,0
17,9
60)
336,
236
59
,737
39
5,97
3
5,63
2
390,
341
-
2001
B
REN
NA
N S
TATI
ON
7,
749,
751
20,5
56,8
91
(8
71,9
73)
6,32
1,92
3
21,1
12,7
45
27,4
34,6
68
3,64
0,27
6
23,7
94,3
92
-
2011
BR
ENN
AN
STA
TIO
N
OU
TPA
RC
EL
627,
906
1,66
5,57
6
(9
3,48
2)
450,
232
1,
749,
768
2,
200,
000
29
1,72
4
1,90
8,27
6
-
2011
CLO
VER
DA
LE P
LAZA
54
0,66
7
71
9,65
5
6,
691,
340
54
0,66
7
7,41
0,99
5
7,95
1,66
2
3,74
6,49
4
4,20
5,16
8
4,50
9,97
8
1969
SO
REN
SEN
PA
RK
PLA
ZA
5,10
4,29
4
-
30
,760
,694
3,
791,
319
32
,073
,668
35
,864
,987
4,
690,
343
31
,174
,644
-
2005
LO
RD
EN P
LAZA
8,
872,
529
22,5
48,3
82
(1
,216
,356
)
8,
548,
022
21
,656
,534
30
,204
,556
6,
699,
479
23
,505
,077
25
,426
,109
2008
WEB
STER
SQ
UA
RE
11
,683
,145
41,7
08,3
83
4,
977,
335
11
,683
,145
46
,685
,718
58
,368
,863
3,
277,
910
55
,090
,953
-
20
14
R
OC
KIN
GH
AM
MA
LL-S
HA
WS
LAN
D P
CL
2,66
0,91
5
10
,643
,660
12,2
52,3
46
3,14
8,71
5
22,4
08,2
06
25,5
56,9
21
10,8
53,0
77
14,7
03,8
44
16,6
03,3
57
20
08
SHO
P R
ITE
PLA
ZA
2,41
7,58
3
6,
364,
094
1,61
1,69
3
2,41
7,58
3
7,97
5,78
7
10,3
93,3
70
6,96
6,08
8
3,42
7,28
2
-
19
85
MA
RLT
ON
PLA
ZA
-
4,31
8,53
4
11
4,21
5
-
4,
432,
749
4,
432,
749
2,
153,
883
2,
278,
866
-
19
96
H
ILLV
IEW
SH
OPP
ING
CEN
TER
16
,007
,647
32,6
07,4
23
(1
3,96
2)
16,0
07,6
47
32,5
93,4
61
48,6
01,1
08
2,54
0,61
2
46,0
60,4
96
25,8
07,1
83
20
14
G
AR
DEN
STA
TE P
AV
ILIO
NS
7,
530,
709
10,8
01,9
49
18
,648
,254
12
,203
,841
24
,777
,071
36
,980
,912
4,
186,
982
32
,793
,930
-
20
11
C
LAR
K S
HO
PRIT
E 70
CEN
TRA
L A
VE
3,
496,
673
11,6
93,7
69
99
4,82
9
13,9
59,5
93
2,22
5,67
8
16,1
85,2
71
352,
851
15
,832
,420
-
20
13
CO
MM
ERC
E C
ENTE
R W
EST
38
5,76
0
1,
290,
080
160,
534
79
3,59
5
1,04
2,77
9
1,83
6,37
4
200,
359
1,
636,
015
-
20
13
C
OM
MER
CE
CEN
TER
EA
ST
1,51
8,93
0
5,
079,
690
1,75
3,86
5
7,23
5,19
6
1,11
7,28
9
8,35
2,48
5
185,
029
8,
167,
456
-
20
13
C
ENTR
AL
PLA
ZA
3,17
0,46
5
10
,602
,845
(186
,938
)
5,
145,
167
8,
441,
205
13
,586
,372
95
0,51
7
12,6
35,8
55
-
2013
EAST
WIN
DSO
R V
ILLA
GE
9,
335,
011
23,7
77,9
78
(7
28,4
17)
9,33
5,01
1
23,0
49,5
62
32,3
84,5
73
4,82
3,88
7
27,5
60,6
86
-
2008
HIL
LSB
OR
OU
GH
PR
OM
ENA
DE
11
,886
,809
-
(6,6
48,1
46)
5,00
6,05
4
232,
610
5,
238,
664
-
5,23
8,66
4
-
20
01
HO
LMD
EL T
OW
NE
CEN
TER
10
,824
,624
43,3
01,4
94
6,
992,
524
10
,824
,624
50
,294
,018
61
,118
,642
17
,055
,927
44
,062
,715
-
20
02
H
OLM
DEL
CO
MM
ON
S II
16
,537
,556
38,7
59,9
52
3,
465,
596
16
,537
,556
42
,225
,548
58
,763
,104
15
,476
,050
43
,287
,054
17
,835
,542
2004
PLA
ZA A
T H
ILLS
DA
LE
7,60
1,59
6
6,
994,
196
361,
829
7,
601,
596
7,
356,
025
14
,957
,621
49
6,87
9
14,4
60,7
42
6,19
9,46
6
20
14
M
APL
E SH
AD
E
-
9,95
7,61
1
57
0,99
4
-
10
,528
,604
10
,528
,604
1,
275,
637
9,
252,
967
-
20
09
PL
AZA
AT
SHO
RT
HIL
LS
20,1
55,4
71
11
,061
,984
54,9
95
20,1
55,4
71
11,1
16,9
80
31,2
72,4
51
1,27
3,10
4
29,9
99,3
47
10,0
67,9
46
20
14
N
OR
TH B
RU
NSW
ICK
PLA
ZA
3,20
4,97
8
12
,819
,912
22,0
37,9
56
3,20
4,97
8
34,8
57,8
68
38,0
62,8
46
16,8
51,1
23
21,2
11,7
23
-
1994
PISC
ATA
WA
Y T
OW
N C
ENTE
R
3,85
1,83
9
15
,410
,851
1,15
7,46
0
3,85
1,83
9
16,5
68,3
11
20,4
20,1
50
7,47
4,55
0
12,9
45,6
00
10,1
00,0
99
19
98
106
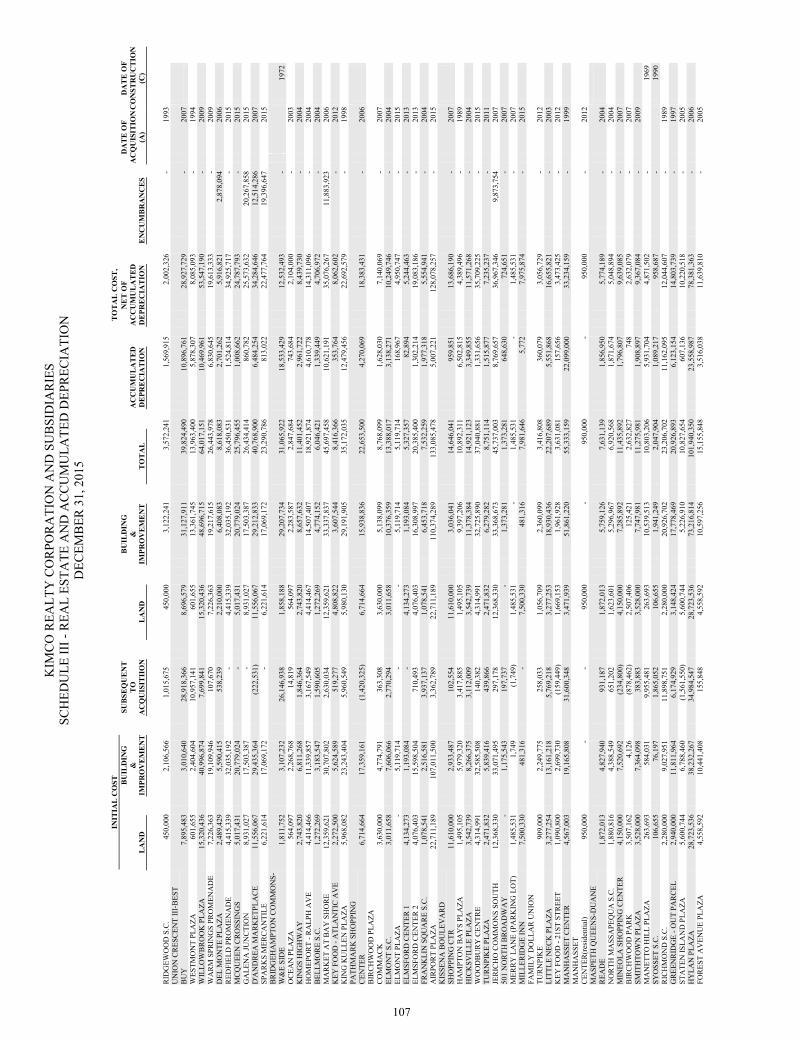
KIM
CO
REA
LTY
CO
RPO
RA
TIO
N A
ND
SU
BSI
DIA
RIE
S
SCH
EDU
LE II
I - R
EAL
ESTA
TE A
ND
AC
CU
MU
LATE
D D
EPR
ECIA
TIO
N
DEC
EMB
ER 3
1, 2
015
INIT
IAL
CO
ST
TO
TA
L C
OST
,
B
UIL
DIN
G
SU
BSE
QU
EN
T
B
UIL
DIN
G
N
ET
OF
DA
TE
OF
DA
TE
OF
&
TO
&
A
CC
UM
UL
AT
ED
A
CC
UM
UL
AT
ED
AC
QU
ISIT
ION
CO
NST
RU
CT
ION
L
AN
D
IM
PRO
VE
ME
NT
A
CQ
UIS
ITII
ON
L
AN
D
IM
PRO
VE
ME
NT
T
OT
AL
DE
PRE
CIA
TIO
N
DE
PRE
CIA
TIO
N
EN
CU
MB
RA
NC
ES
(A
) (C
)
RID
GEW
OO
D S
.C.
450,
000
2,10
6,56
6
1,
015,
675
45
0,00
0
3,12
2,24
1
3,57
2,24
1
1,56
9,91
5
2,00
2,32
6
-
1993
UN
ION
CR
ESC
ENT
III-
BES
T B
UY
7,
895,
483
3,01
0,64
0
28
,918
,366
8,
696,
579
31
,127
,911
39
,824
,490
10
,896
,761
28
,927
,729
-
20
07
WES
TMO
NT
PLA
ZA
601,
655
2,40
4,60
4
10
,957
,141
60
1,65
5
13,3
61,7
45
13,9
63,4
00
5,87
8,30
7
8,08
5,09
3
-
1994
WIL
LOW
BR
OO
K P
LAZA
15
,320
,436
40,9
96,8
74
7,
699,
841
15
,320
,436
48
,696
,715
64
,017
,151
10
,469
,961
53
,547
,190
-
20
09
W
AR
M S
PRIN
GS
PRO
MEN
AD
E
7,22
6,36
3
19
,109
,946
107,
670
7,
226,
363
19
,217
,615
26
,443
,978
6,
830,
645
19
,613
,333
-
20
09
D
EL M
ON
TE P
LAZA
2,
489,
429
5,59
0,41
5
53
8,23
9
2,21
0,00
0
6,40
8,08
3
8,61
8,08
3
2,70
1,26
2
5,91
6,82
1
2,87
8,09
4
20
06
R
EDFI
ELD
PR
OM
ENA
DE
4,
415,
339
32,0
35,1
92
-
4,41
5,33
9
32,0
35,1
92
36,4
50,5
31
1,52
4,81
4
34,9
25,7
17
-
2015
MC
QU
EEN
CR
OSS
ING
S
5,01
7,43
1
20
,779
,024
-
5,
017,
431
20
,779
,024
25
,796
,455
1,
008,
662
24
,787
,793
-
20
15
G
ALE
NA
JUN
CTI
ON
8,
931,
027
17,5
03,3
87
-
8,93
1,02
7
17,5
03,3
87
26,4
34,4
14
860,
782
25
,573
,632
20
,267
,858
2015
D'A
ND
REA
MA
RK
ETPL
AC
E
11,5
56,0
67
29
,435
,364
(222
,531
)
11
,556
,067
29
,212
,833
40
,768
,900
6,
484,
254
34
,284
,646
12
,514
,286
2007
SPA
RK
S M
ERC
AN
TILE
6,
221,
614
17,0
69,1
72
-
6,22
1,61
4
17,0
69,1
72
23,2
90,7
86
813,
022
22
,477
,764
19
,396
,647
2015
BR
IDG
EHA
MPT
ON
CO
MM
ON
S-W
&E
SID
E 1,
811,
752
3,10
7,23
2
26
,146
,938
1,
858,
188
29
,207
,734
31
,065
,922
18
,533
,429
12
,532
,493
-
19
72
OC
EAN
PLA
ZA
564,
097
2,26
8,76
8
14
,819
56
4,09
7
2,28
3,58
7
2,84
7,68
4
743,
684
2,
104,
000
-
20
03
K
ING
S H
IGH
WA
Y
2,74
3,82
0
6,
811,
268
1,84
6,36
4
2,74
3,82
0
8,65
7,63
2
11,4
01,4
52
2,96
1,72
2
8,43
9,73
0
-
2004
HO
MEP
OR
T - R
ALP
H A
VE
4,
414,
466
11,3
39,8
57
3,
167,
549
4,
414,
467
14
,507
,407
18
,921
,874
4,
610,
778
14
,311
,096
-
20
04
B
ELLM
OR
E S.
C.
1,27
2,26
9
3,
183,
547
1,59
0,60
5
1,27
2,26
9
4,77
4,15
2
6,04
6,42
1
1,33
9,44
9
4,70
6,97
2
-
2004
MA
RK
ET A
T B
AY
SH
OR
E
12,3
59,6
21
30
,707
,802
2,63
0,03
4
12,3
59,6
21
33,3
37,8
37
45,6
97,4
58
10,6
21,1
91
35,0
76,2
67
11,8
83,9
23
20
06
K
EY F
OO
D -
ATL
AN
TIC
AV
E
2,27
2,50
0
5,
624,
589
519,
277
4,
808,
822
3,
607,
544
8,
416,
366
35
3,76
4
8,06
2,60
2
-
2012
KIN
G K
ULL
EN P
LAZA
5,
968,
082
23,2
43,4
04
5,
960,
549
5,
980,
130
29
,191
,905
35
,172
,035
12
,479
,456
22
,692
,579
-
19
98
PA
THM
AR
K S
HO
PPIN
G
CEN
TER
6,
714,
664
17,3
59,1
61
(1
,420
,325
)
6,
714,
664
15
,938
,836
22
,653
,500
4,
270,
069
18
,383
,431
-
20
06
BIR
CH
WO
OD
PLA
ZA
CO
MM
AC
K
3,63
0,00
0
4,
774,
791
363,
308
3,
630,
000
5,
138,
099
8,
768,
099
1,
628,
030
7,
140,
069
-
20
07
ELM
ON
T S.
C.
3,01
1,65
8
7,
606,
066
2,77
0,29
4
3,01
1,65
8
10,3
76,3
59
13,3
88,0
17
3,13
8,27
1
10,2
49,7
46
-
2004
ELM
ON
T PL
AZA
-
5,
119,
714
-
-
5,11
9,71
4
5,11
9,71
4
168,
967
4,
950,
747
-
20
15
EL
MSF
OR
D C
ENTE
R 1
4,
134,
273
1,19
3,08
4
-
4,13
4,27
3
1,19
3,08
4
5,32
7,35
7
82,8
94
5,24
4,46
3
-
2013
ELM
SFO
RD
CEN
TER
2
4,07
6,40
3
15
,598
,504
710,
493
4,
076,
403
16
,308
,997
20
,385
,400
1,
302,
214
19
,083
,186
-
20
13
FR
AN
KLI
N S
QU
AR
E S.
C.
1,07
8,54
1
2,
516,
581
3,93
7,13
7
1,07
8,54
1
6,45
3,71
8
7,53
2,25
9
1,97
7,31
8
5,55
4,94
1
-
2004
AIR
POR
T PL
AZA
22
,711
,189
107,
011,
500
3,36
2,78
9
22,7
11,1
89
110,
374,
289
13
3,08
5,47
8
5,00
7,22
1
128,
078,
257
-
20
15
K
ISSE
NA
BO
ULE
VA
RD
SH
OPP
ING
CTR
11
,610
,000
2,93
3,48
7
10
2,55
4
11,6
10,0
00
3,03
6,04
1
14,6
46,0
41
959,
851
13
,686
,190
-
20
07
HA
MPT
ON
BA
YS
PLA
ZA
1,49
5,10
5
5,
979,
320
3,41
7,88
5
1,49
5,10
5
9,39
7,20
6
10,8
92,3
11
6,50
2,81
5
4,38
9,49
6
-
1989
HIC
KSV
ILLE
PLA
ZA
3,54
2,73
9
8,
266,
375
3,11
2,00
9
3,54
2,73
9
11,3
78,3
84
14,9
21,1
23
3,34
9,85
5
11,5
71,2
68
-
2004
WO
OD
BU
RY
CEN
TRE
4,
314,
991
32,5
85,5
08
14
0,38
2
4,31
4,99
1
32,7
25,8
90
37,0
40,8
81
1,33
1,65
6
35,7
09,2
25
-
2015
TUR
NPI
KE
PLA
ZA
2,47
1,83
2
5,
839,
416
439,
866
2,
471,
832
6,
279,
282
8,
751,
114
1,
515,
877
7,
235,
237
-
20
11
JE
RIC
HO
CO
MM
ON
S SO
UTH
12
,368
,330
33,0
71,4
95
29
7,17
8
12,3
68,3
30
33,3
68,6
73
45,7
37,0
03
8,76
9,65
7
36,9
67,3
46
9,87
3,75
4
20
07
50
1 N
OR
TH B
RO
AD
WA
Y
-
1,17
5,54
3
19
7,73
7
-
1,
373,
281
1,
373,
281
64
8,63
0
724,
651
-
20
07
M
ERR
Y L
AN
E (P
AR
KIN
G L
OT)
1,
485,
531
1,74
9
(1
,749
)
1,
485,
531
-
1,48
5,53
1
-
1,
485,
531
-
20
07
M
ILLE
RID
GE
INN
7,
500,
330
481,
316
-
7,
500,
330
48
1,31
6
7,98
1,64
6
5,77
2
7,97
5,87
4
-
2015
FAM
ILY
DO
LLA
R U
NIO
N
TUR
NPI
KE
90
9,00
0
2,
249,
775
258,
033
1,
056,
709
2,
360,
099
3,
416,
808
36
0,07
9
3,05
6,72
9
-
2012
LITT
LE N
ECK
PLA
ZA
3,27
7,25
4
13
,161
,218
5,76
9,21
8
3,27
7,25
3
18,9
30,4
36
22,2
07,6
89
5,55
1,86
8
16,6
55,8
21
-
2003
KEY
FO
OD
- 21
ST S
TREE
T
1,09
0,80
0
2,
699,
730
(159
,449
)
1,
669,
153
1,
961,
928
3,
631,
081
15
7,65
6
3,47
3,42
5
-
2012
MA
NH
ASS
ET C
ENTE
R
4,56
7,00
3
19
,165
,808
31,6
00,3
48
3,47
1,93
9
51,8
61,2
20
55,3
33,1
59
22,0
99,0
00
33,2
34,1
59
-
1999
MA
NH
ASS
ET
CEN
TER
(res
iden
tial)
95
0,00
0
-
-
950,
000
-
950,
000
-
950,
000
-
20
12
MA
SPET
H Q
UEE
NS-
DU
AN
E R
EAD
E
1,87
2,01
3
4,
827,
940
931,
187
1,
872,
013
5,
759,
126
7,
631,
139
1,
856,
950
5,
774,
189
-
20
04
NO
RTH
MA
SSA
PEQ
UA
S.C
. 1,
880,
816
4,38
8,54
9
65
1,20
2
1,62
3,60
1
5,29
6,96
7
6,92
0,56
8
1,87
1,67
4
5,04
8,89
4
-
2004
MIN
EOLA
SH
OPP
ING
CEN
TER
4,
150,
000
7,52
0,69
2
(2
34,8
00)
4,15
0,00
0
7,28
5,89
2
11,4
35,8
92
1,79
6,80
7
9,63
9,08
5
-
2007
BIR
CH
WO
OD
PA
RK
3,
507,
162
4,12
6
(8
78,4
62)
2,50
7,40
6
125,
421
2,
632,
827
74
8
2,63
2,07
9
-
2007
SMIT
HTO
WN
PLA
ZA
3,52
8,00
0
7,
364,
098
383,
883
3,
528,
000
7,
747,
981
11
,275
,981
1,
908,
897
9,
367,
084
-
20
09
M
AN
ETTO
HIL
L PL
AZA
26
3,69
3
58
4,03
1
9,
955,
481
26
3,69
3
10,5
39,5
13
10,8
03,2
06
5,93
1,70
4
4,87
1,50
2
-
19
69
SYO
SSET
S.C
. 10
6,65
5
76
,197
1,86
5,05
2
106,
655
1,
941,
249
2,
047,
904
1,
089,
217
95
8,68
7
-
19
90
RIC
HM
ON
D S
.C.
2,28
0,00
0
9,
027,
951
11,8
98,7
51
2,28
0,00
0
20,9
26,7
02
23,2
06,7
02
11,1
62,0
95
12,0
44,6
07
-
1989
GR
EEN
RID
GE
- OU
T PA
RC
EL
2,94
0,00
0
11
,811
,964
6,17
4,92
9
3,14
8,42
4
17,7
78,4
69
20,9
26,8
93
6,12
3,15
4
14,8
03,7
39
-
1997
STA
TEN
ISLA
ND
PLA
ZA
5,60
0,74
4
6,
788,
460
(1,5
61,5
50)
5,60
0,74
4
5,22
6,91
0
10,8
27,6
54
607,
136
10
,220
,518
-
20
05
H
YLA
N P
LAZA
28
,723
,536
38,2
32,2
67
34
,984
,547
28
,723
,536
73
,216
,814
10
1,94
0,35
0
23,5
58,9
87
78,3
81,3
63
-
2006
FOR
EST
AV
ENU
E PL
AZA
4,
558,
592
10,4
41,4
08
15
5,84
8
4,55
8,59
2
10,5
97,2
56
15,1
55,8
48
3,51
6,03
8
11,6
39,8
10
-
2005
107
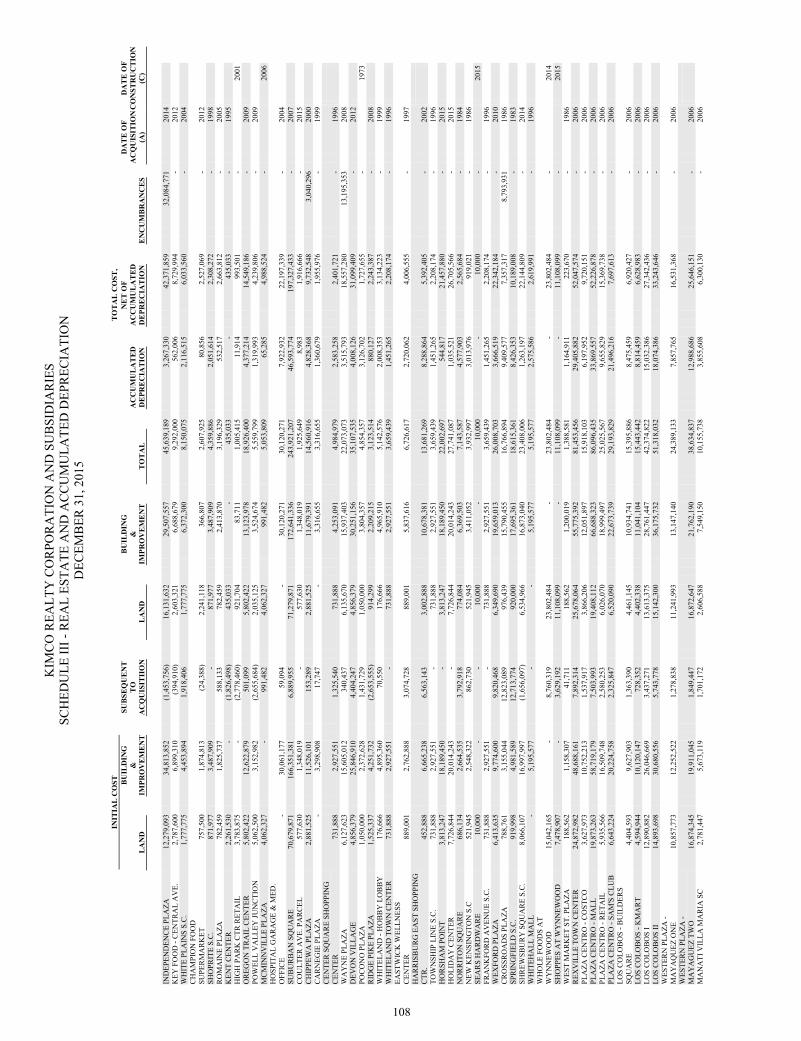
KIM
CO
REA
LTY
CO
RPO
RA
TIO
N A
ND
SU
BSI
DIA
RIE
S
SCH
EDU
LE II
I - R
EAL
ESTA
TE A
ND
AC
CU
MU
LATE
D D
EPR
ECIA
TIO
N
DEC
EMB
ER 3
1, 2
015
INIT
IAL
CO
ST
TO
TA
L C
OST
,
B
UIL
DIN
G
SU
BSE
QU
EN
T
B
UIL
DIN
G
N
ET
OF
DA
TE
OF
DA
TE
OF
&
TO
&
A
CC
UM
UL
AT
ED
A
CC
UM
UL
AT
ED
AC
QU
ISIT
ION
CO
NST
RU
CT
ION
L
AN
D
IM
PRO
VE
ME
NT
A
CQ
UIS
ITII
ON
L
AN
D
IM
PRO
VE
ME
NT
T
OT
AL
DE
PRE
CIA
TIO
N
DE
PRE
CIA
TIO
N
EN
CU
MB
RA
NC
ES
(A
) (C
)
IND
EPEN
DEN
CE
PLA
ZA
12,2
79,0
93
34
,813
,852
(1,4
53,7
56)
16,1
31,6
32
29,5
07,5
57
45,6
39,1
89
3,26
7,33
0
42,3
71,8
59
32,0
84,7
71
20
14
K
EY F
OO
D -
CEN
TRA
L A
VE.
2,
787,
600
6,89
9,31
0
(3
94,9
10)
2,60
3,32
1
6,68
8,67
9
9,29
2,00
0
562,
006
8,
729,
994
-
20
12
W
HIT
E PL
AIN
S S.
C.
1,77
7,77
5
4,
453,
894
1,91
8,40
6
1,77
7,77
5
6,37
2,30
0
8,15
0,07
5
2,11
6,51
5
6,03
3,56
0
-
2004
CH
AM
PIO
N F
OO
D
SUPE
RM
AR
KET
75
7,50
0
1,
874,
813
(24,
388)
2,
241,
118
36
6,80
7
2,60
7,92
5
80,8
56
2,52
7,06
9
-
2012
SHO
PRIT
E S.
C.
871,
977
3,48
7,90
9
-
871,
977
3,
487,
909
4,
359,
886
2,
051,
614
2,
308,
272
-
19
98
R
OM
AIN
E PL
AZA
78
2,45
9
1,
825,
737
588,
133
78
2,45
9
2,41
3,87
0
3,19
6,32
9
532,
517
2,
663,
812
-
20
05
K
ENT
CEN
TER
2,
261,
530
-
(1,8
26,4
98)
435,
033
-
435,
033
-
435,
033
-
19
95
H
IGH
PA
RK
CTR
RET
AIL
3,
783,
875
-
(2,7
78,4
60)
921,
704
83
,711
1,
005,
415
11
,914
99
3,50
1
-
20
01
OR
EGO
N T
RA
IL C
ENTE
R
5,80
2,42
2
12
,622
,879
501,
099
5,
802,
422
13
,123
,978
18
,926
,400
4,
377,
214
14
,549
,186
-
20
09
PO
WEL
L V
ALL
EY JU
NC
TIO
N
5,06
2,50
0
3,
152,
982
(2,6
55,6
84)
2,03
5,12
5
3,52
4,67
4
5,55
9,79
9
1,31
9,99
3
4,23
9,80
6
-
2009
MC
MIN
NV
ILLE
PLA
ZA
4,06
2,32
7
-
99
1,48
2
4,06
2,32
7
991,
482
5,
053,
809
65
,285
4,
988,
524
-
2006
H
OSP
ITA
L G
AR
AG
E &
MED
. O
FFIC
E
-
30,0
61,1
77
59
,094
-
30,1
20,2
71
30,1
20,2
71
7,92
2,93
2
22,1
97,3
39
-
2004
SUB
UR
BA
N S
QU
AR
E
70,6
79,8
71
16
6,35
1,38
1
6,
889,
955
71
,279
,871
17
2,64
1,33
6
243,
921,
207
46
,593
,774
19
7,32
7,43
3
-
2007
CO
ULT
ER A
VE.
PA
RC
EL
577,
630
1,34
8,01
9
-
577,
630
1,
348,
019
1,
925,
649
8,
983
1,
916,
666
-
20
15
C
HIP
PEW
A P
LAZA
2,
881,
525
11,5
26,1
01
15
3,28
9
2,88
1,52
5
11,6
79,3
91
14,5
60,9
16
4,82
8,36
8
9,73
2,54
8
3,04
0,29
6
20
00
C
AR
NEG
IE P
LAZA
-
3,
298,
908
17,7
47
-
3,
316,
655
3,
316,
655
1,
360,
679
1,
955,
976
-
19
99
C
ENTE
R S
QU
AR
E SH
OPP
ING
C
ENTE
R
731,
888
2,92
7,55
1
1,
325,
540
73
1,88
8
4,25
3,09
1
4,98
4,97
9
2,58
3,25
8
2,40
1,72
1
-
1996
WA
YN
E PL
AZA
6,
127,
623
15,6
05,0
12
34
0,43
7
6,13
5,67
0
15,9
37,4
03
22,0
73,0
73
3,51
5,79
3
18,5
57,2
80
13,1
95,3
53
20
08
D
EVO
N V
ILLA
GE
4,
856,
379
25,8
46,9
10
4,
404,
247
4,
856,
379
30
,251
,156
35
,107
,535
4,
008,
126
31
,099
,409
-
20
12
PO
CO
NO
PLA
ZA
1,05
0,00
0
2,
372,
628
1,43
1,72
9
1,05
0,00
0
3,80
4,35
7
4,85
4,35
7
3,12
6,70
2
1,72
7,65
5
-
19
73
RID
GE
PIK
E PL
AZA
1,
525,
337
4,25
1,73
2
(2
,653
,555
)
91
4,29
9
2,20
9,21
5
3,12
3,51
4
880,
127
2,
243,
387
-
20
08
W
HIT
ELA
ND
- H
OB
BY
LO
BB
Y
176,
666
4,89
5,36
0
70
,550
17
6,66
6
4,96
5,91
0
5,14
2,57
6
2,00
8,35
3
3,13
4,22
3
-
1999
WH
ITEL
AN
D T
OW
N C
ENTE
R
731,
888
2,92
7,55
1
-
731,
888
2,
927,
551
3,
659,
439
1,
451,
265
2,
208,
174
-
19
96
EA
STW
ICK
WEL
LNES
S C
ENTE
R
889,
001
2,76
2,88
8
3,
074,
728
88
9,00
1
5,83
7,61
6
6,72
6,61
7
2,72
0,06
2
4,00
6,55
5
-
1997
HA
RR
ISB
UR
G E
AST
SH
OPP
ING
C
TR.
452,
888
6,66
5,23
8
6,
563,
143
3,
002,
888
10
,678
,381
13
,681
,269
8,
288,
864
5,
392,
405
-
20
02
TOW
NSH
IP L
INE
S.C
. 73
1,88
8
2,
927,
551
-
73
1,88
8
2,92
7,55
1
3,65
9,43
9
1,45
1,26
5
2,20
8,17
4
-
1996
HO
RSH
AM
PO
INT
3,
813,
247
18,1
89,4
50
-
3,81
3,24
7
18,1
89,4
50
22,0
02,6
97
544,
817
21
,457
,880
-
20
15
H
OLI
DA
Y C
ENTE
R
7,72
6,84
4
20
,014
,243
-
7,
726,
844
20
,014
,243
27
,741
,087
1,
035,
521
26
,705
,566
-
20
15
N
OR
RIT
ON
SQ
UA
RE
68
6,13
4
2,
664,
535
3,79
2,91
8
774,
084
6,
369,
503
7,
143,
587
4,
577,
903
2,
565,
684
-
19
84
N
EW K
ENSI
NG
TON
S.C
52
1,94
5
2,
548,
322
862,
730
52
1,94
5
3,41
1,05
2
3,93
2,99
7
3,01
3,97
6
919,
021
-
19
86
SE
AR
S H
AR
DW
AR
E
10,0
00
-
-
10,0
00
-
10
,000
-
10,0
00
-
20
15
FRA
NK
FOR
D A
VEN
UE
S.C
. 73
1,88
8
2,
927,
551
-
73
1,88
8
2,92
7,55
1
3,65
9,43
9
1,45
1,26
5
2,20
8,17
4
-
1996
WEX
FOR
D P
LAZA
6,
413,
635
9,77
4,60
0
9,
820,
468
6,
349,
690
19
,659
,013
26
,008
,703
3,
666,
519
22
,342
,184
-
20
10
C
RO
SSR
OA
DS
PLA
ZA
788,
761
3,15
5,04
4
12
,823
,089
97
6,43
9
15,7
90,4
55
16,7
66,8
94
9,40
9,57
7
7,35
7,31
7
8,79
3,93
1
19
86
SP
RIN
GFI
ELD
S.C
. 91
9,99
8
4,
981,
589
12,7
13,7
74
920,
000
17
,695
,361
18
,615
,361
8,
426,
353
10
,189
,008
-
19
83
SH
REW
SBU
RY
SQ
UA
RE
S.C
. 8,
066,
107
16,9
97,9
97
(1
,656
,097
)
6,
534,
966
16
,873
,040
23
,408
,006
1,
263,
197
22
,144
,809
-
20
14
W
HIT
EHA
LL M
ALL
-
5,
195,
577
-
-
5,19
5,57
7
5,19
5,57
7
2,57
5,58
6
2,61
9,99
1
-
1996
WH
OLE
FO
OD
S A
T W
YN
NEW
OO
D
15,0
42,1
65
-
8,
760,
319
23
,802
,484
-
23,8
02,4
84
-
23
,802
,484
-
20
14
SHO
PPES
AT
WY
NN
EWO
OD
7,
478,
907
-
3,62
9,19
2
11,1
08,0
99
-
11
,108
,099
-
11,1
08,0
99
-
20
15
WES
T M
AR
KET
ST.
PLA
ZA
188,
562
1,15
8,30
7
41
,711
18
8,56
2
1,20
0,01
9
1,38
8,58
1
1,16
4,91
1
223,
670
-
19
86
R
EXV
ILLE
TO
WN
CEN
TER
24
,872
,982
48,6
88,1
61
7,
892,
314
25
,678
,064
55
,775
,392
81
,453
,456
29
,405
,882
52
,047
,574
-
20
06
PL
AZA
CEN
TRO
- C
OST
CO
3,
627,
973
10,7
52,2
13
1,
537,
917
3,
866,
206
12
,051
,897
15
,918
,103
6,
197,
952
9,
720,
151
-
20
06
PL
AZA
CEN
TRO
- M
ALL
19
,873
,263
58,7
19,1
79
7,
503,
993
19
,408
,112
66
,688
,323
86
,096
,435
33
,869
,557
52
,226
,878
-
20
06
PL
AZA
CEN
TRO
- R
ETA
IL
5,93
5,56
6
16
,509
,748
2,58
0,25
3
6,02
6,07
0
18,9
99,4
97
25,0
25,5
67
9,65
5,82
9
15,3
69,7
38
-
2006
PLA
ZA C
ENTR
O -
SAM
'S C
LUB
6,
643,
224
20,2
24,7
58
2,
325,
847
6,
520,
090
22
,673
,739
29
,193
,829
21
,496
,216
7,
697,
613
-
20
06
LO
S C
OLO
BO
S - B
UIL
DER
S SQ
UA
RE
4,
404,
593
9,62
7,90
3
1,
363,
390
4,
461,
145
10
,934
,741
15
,395
,886
8,
475,
459
6,
920,
427
-
20
06
LOS
CO
LOB
OS
- KM
AR
T
4,59
4,94
4
10
,120
,147
728,
352
4,
402,
338
11
,041
,104
15
,443
,442
8,
814,
459
6,
628,
983
-
20
06
LO
S C
OLO
BO
S I
12,8
90,8
82
26
,046
,669
3,43
7,27
1
13,6
13,3
75
28,7
61,4
47
42,3
74,8
22
15,0
32,3
86
27,3
42,4
36
-
2006
LOS
CO
LOB
OS
II
14,8
93,6
98
30
,680
,556
5,74
3,77
8
15,1
42,3
00
36,1
75,7
32
51,3
18,0
32
18,0
74,3
86
33,2
43,6
46
-
2006
WES
TER
N P
LAZA
- M
AY
AQ
UEZ
ON
E
10,8
57,7
73
12
,252
,522
1,27
8,83
8
11,2
41,9
93
13,1
47,1
40
24,3
89,1
33
7,85
7,76
5
16,5
31,3
68
-
2006
WES
TER
N P
LAZA
- M
AY
AG
UEZ
TW
O
16,8
74,3
45
19
,911
,045
1,84
9,44
7
16,8
72,6
47
21,7
62,1
90
38,6
34,8
37
12,9
88,6
86
25,6
46,1
51
-
2006
MA
NA
TI V
ILLA
MA
RIA
SC
2,
781,
447
5,67
3,11
9
1,
701,
172
2,
606,
588
7,
549,
150
10
,155
,738
3,
855,
608
6,
300,
130
-
20
06
108
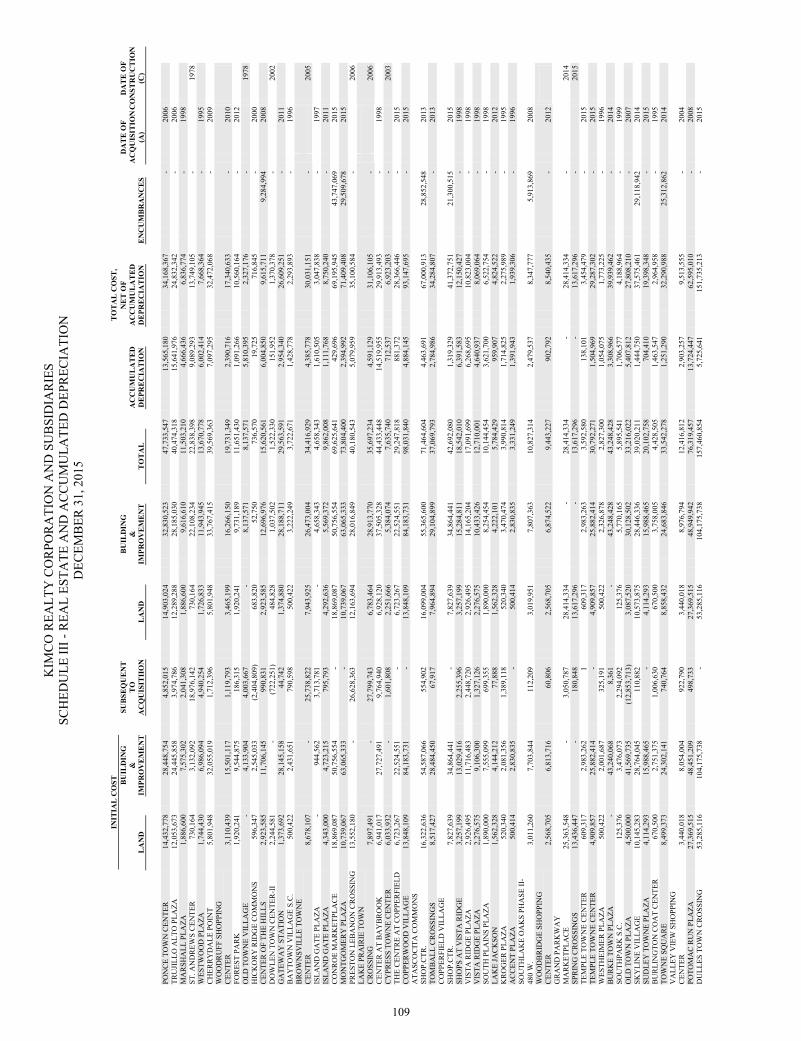
KIM
CO
REA
LTY
CO
RPO
RA
TIO
N A
ND
SU
BSI
DIA
RIE
S
SCH
EDU
LE II
I - R
EAL
ESTA
TE A
ND
AC
CU
MU
LATE
D D
EPR
ECIA
TIO
N
DEC
EMB
ER 3
1, 2
015
INIT
IAL
CO
ST
TO
TA
L C
OST
,
B
UIL
DIN
G
SU
BSE
QU
EN
T
B
UIL
DIN
G
N
ET
OF
DA
TE
OF
DA
TE
OF
&
TO
&
A
CC
UM
UL
AT
ED
A
CC
UM
UL
AT
ED
AC
QU
ISIT
ION
CO
NST
RU
CT
ION
L
AN
D
IM
PRO
VE
ME
NT
A
CQ
UIS
ITII
ON
L
AN
D
IM
PRO
VE
ME
NT
T
OT
AL
DE
PRE
CIA
TIO
N
DE
PRE
CIA
TIO
N
EN
CU
MB
RA
NC
ES
(A
) (C
)
PON
CE
TOW
N C
ENTE
R
14,4
32,7
78
28
,448
,754
4,85
2,01
5
14,9
03,0
24
32,8
30,5
23
47,7
33,5
47
13,5
65,1
80
34,1
68,3
67
-
2006
TRU
JILL
O A
LTO
PLA
ZA
12,0
53,6
73
24
,445
,858
3,97
4,78
6
12,2
89,2
88
28,1
85,0
30
40,4
74,3
18
15,6
41,9
76
24,8
32,3
42
-
2006
MA
RSH
ALL
PLA
ZA
1,88
6,60
0
7,
575,
302
2,04
1,30
8
1,88
6,60
0
9,61
6,61
0
11,5
03,2
10
4,66
6,43
6
6,83
6,77
4
-
1998
ST. A
ND
REW
S C
ENTE
R
730,
164
3,13
2,09
2
18
,976
,142
73
0,16
4
22,1
08,2
34
22,8
38,3
98
9,08
9,29
3
13,7
49,1
05
-
19
78
WES
TWO
OD
PLA
ZA
1,74
4,43
0
6,
986,
094
4,94
0,25
4
1,72
6,83
3
11,9
43,9
45
13,6
70,7
78
6,00
2,41
4
7,66
8,36
4
-
1995
CH
ERR
YD
ALE
PO
INT
5,
801,
948
32,0
55,0
19
1,
712,
396
5,
801,
948
33
,767
,415
39
,569
,363
7,
097,
295
32
,472
,068
-
20
09
W
OO
DR
UFF
SH
OPP
ING
C
ENTE
R
3,11
0,43
9
15
,501
,117
1,11
9,79
3
3,46
5,19
9
16,2
66,1
50
19,7
31,3
49
2,39
0,71
6
17,3
40,6
33
-
2010
FOR
EST
PAR
K
1,92
0,24
1
9,
544,
875
186,
315
1,
920,
241
9,
731,
189
11
,651
,430
1,
091,
266
10
,560
,164
-
20
12
O
LD T
OW
NE
VIL
LAG
E
-
4,13
3,90
4
4,
003,
667
-
8,13
7,57
1
8,13
7,57
1
5,81
0,39
5
2,32
7,17
6
-
19
78
HIC
KO
RY
RID
GE
CO
MM
ON
S
596,
347
2,54
5,03
3
(2
,404
,809
)
68
3,82
0
52,7
50
736,
570
19
,725
71
6,84
5
-
2000
CEN
TER
OF
THE
HIL
LS
2,92
3,58
5
11
,706
,145
990,
831
2,
923,
585
12
,696
,976
15
,620
,561
6,
004,
850
9,
615,
711
9,
284,
994
2008
DO
WLE
N T
OW
N C
ENTE
R-I
I 2,
244,
581
-
(722
,251
)
48
4,82
8
1,03
7,50
2
1,52
2,33
0
151,
952
1,
370,
378
-
2002
G
ATE
WA
Y S
TATI
ON
1,
373,
692
28,1
45,1
58
44
,742
1,
374,
880
28
,188
,711
29
,563
,591
2,
954,
340
26
,609
,251
-
20
11
B
AY
TOW
N V
ILLA
GE
S.C
. 50
0,42
2
2,
431,
651
790,
598
50
0,42
2
3,22
2,24
9
3,72
2,67
1
1,42
8,77
8
2,29
3,89
3
-
1996
BR
OW
NSV
ILLE
TO
WN
E C
ENTE
R
8,67
8,10
7
-
25
,738
,822
7,
943,
925
26
,473
,004
34
,416
,929
4,
385,
778
30
,031
,151
-
20
05
ISLA
ND
GA
TE P
LAZA
-
94
4,56
2
3,
713,
781
-
4,65
8,34
3
4,65
8,34
3
1,61
0,50
5
3,04
7,83
8
-
1997
ISLA
ND
GA
TE P
LAZA
4,
343,
000
4,72
3,21
5
79
5,79
3
4,29
2,63
6
5,56
9,37
2
9,86
2,00
8
1,11
1,76
8
8,75
0,24
0
-
2011
CO
NR
OE
MA
RK
ETPL
AC
E
18,8
69,0
87
50
,756
,554
-
18
,869
,087
50
,756
,554
69
,625
,641
42
9,69
6
69,1
95,9
45
43,7
47,0
69
20
15
M
ON
TGO
MER
Y P
LAZA
10
,739
,067
63,0
65,3
33
-
10,7
39,0
67
63,0
65,3
33
73,8
04,4
00
2,39
4,99
2
71,4
09,4
08
29,5
09,6
78
20
15
PR
ESTO
N L
EBA
NO
N C
RO
SSIN
G
13,5
52,1
80
-
26
,628
,363
12
,163
,694
28
,016
,849
40
,180
,543
5,
079,
959
35
,100
,584
-
2006
LA
KE
PRA
IRIE
TO
WN
C
RO
SSIN
G
7,89
7,49
1
-
27
,799
,743
6,
783,
464
28
,913
,770
35
,697
,234
4,
591,
129
31
,106
,105
-
20
06
CEN
TER
AT
BA
YB
RO
OK
6,
941,
017
27,7
27,4
91
9,
764,
940
6,
928,
120
37
,505
,328
44
,433
,448
14
,519
,955
29
,913
,493
-
19
98
C
YPR
ESS
TOW
NE
CEN
TER
6,
033,
932
-
1,60
1,80
8
2,25
1,66
6
5,38
4,07
4
7,63
5,74
0
712,
537
6,
923,
203
-
2003
TH
E C
ENTR
E A
T C
OPP
ERFI
ELD
6,
723,
267
22,5
24,5
51
-
6,72
3,26
7
22,5
24,5
51
29,2
47,8
18
881,
372
28
,366
,446
-
20
15
C
OPP
ERW
OO
D V
ILLA
GE
13
,848
,109
84,1
83,7
31
-
13,8
48,1
09
84,1
83,7
31
98,0
31,8
40
4,88
4,14
5
93,1
47,6
95
-
2015
ATA
SCO
CIT
A C
OM
MO
NS
SHO
P.C
TR.
16,3
22,6
36
54
,587
,066
554,
902
16
,099
,004
55
,365
,600
71
,464
,604
4,
463,
691
67
,000
,913
28
,852
,548
2013
TOM
BA
LL C
RO
SSIN
GS
8,
517,
427
28,4
84,4
50
67
,917
7,
964,
894
29
,104
,899
37
,069
,793
2,
784,
986
34
,284
,807
-
20
13
C
OPP
ERFI
ELD
VIL
LAG
E SH
OP.
CTR
. 7,
827,
639
34,8
64,4
41
-
7,82
7,63
9
34,8
64,4
41
42,6
92,0
80
1,31
9,32
9
41,3
72,7
51
21,3
00,5
15
20
15
SHO
PS A
T V
ISTA
RID
GE
3,
257,
199
13,0
29,4
16
2,
255,
396
3,
257,
199
15
,284
,811
18
,542
,010
6,
391,
583
12
,150
,427
-
19
98
V
ISTA
RID
GE
PLA
ZA
2,92
6,49
5
11
,716
,483
2,44
8,72
0
2,92
6,49
5
14,1
65,2
04
17,0
91,6
99
6,26
8,69
5
10,8
23,0
04
-
1998
VIS
TA R
IDG
E PL
AZA
2,
276,
575
9,10
6,30
0
1,
327,
126
2,
276,
575
10
,433
,426
12
,710
,001
4,
640,
937
8,
069,
064
-
19
98
SO
UTH
PLA
INS
PLA
ZA
1,89
0,00
0
7,
555,
099
699,
355
1,
890,
000
8,
254,
454
10
,144
,454
3,
621,
700
6,
522,
754
-
19
98
LA
KE
JAC
KSO
N
1,56
2,32
8
4,
144,
212
77,8
88
1,56
2,32
8
4,22
2,10
1
5,78
4,42
9
959,
907
4,
824,
522
-
20
12
K
RO
GER
PLA
ZA
520,
340
2,08
1,35
6
1,
389,
118
52
0,34
0
3,47
0,47
4
3,99
0,81
4
1,71
4,82
5
2,27
5,98
9
-
1995
AC
CEN
T PL
AZA
50
0,41
4
2,
830,
835
-
50
0,41
4
2,83
0,83
5
3,33
1,24
9
1,39
1,94
3
1,93
9,30
6
-
1996
SOU
THLA
KE
OA
KS
PHA
SE II
-48
0 W
. 3,
011,
260
7,70
3,84
4
11
2,20
9
3,01
9,95
1
7,80
7,36
3
10,8
27,3
14
2,47
9,53
7
8,34
7,77
7
5,91
3,86
9
20
08
WO
OD
BR
IDG
E SH
OPP
ING
C
ENTE
R
2,56
8,70
5
6,
813,
716
60,8
06
2,56
8,70
5
6,87
4,52
2
9,44
3,22
7
902,
792
8,
540,
435
-
20
12
GR
AN
D P
AR
KW
AY
M
AR
KET
PLA
CE
25
,363
,548
-
3,05
0,78
7
28,4
14,3
34
-
28
,414
,334
-
28,4
14,3
34
-
2014
SP
RIN
G C
RO
SSIN
GS
13
,436
,447
-
180,
848
13
,617
,296
-
13,6
17,2
96
-
13
,617
,296
-
2015
TE
MPL
E TO
WN
E C
ENTE
R
609,
317
2,98
3,26
2
1
60
9,31
7
2,98
3,26
3
3,59
2,58
0
138,
101
3,
454,
479
-
20
15
TE
MPL
E TO
WN
E C
ENTE
R
4,90
9,85
7
25
,882
,414
-
4,
909,
857
25
,882
,414
30
,792
,271
1,
504,
969
29
,287
,302
-
20
15
W
ESTH
EIM
ER P
LAZA
50
0,42
2
2,
001,
687
325,
191
50
0,42
2
2,32
6,87
8
2,82
7,30
0
1,05
4,07
5
1,77
3,22
5
-
1996
BU
RK
E TO
WN
PLA
ZA
-
43,2
40,0
68
8,
361
-
43,2
48,4
28
43,2
48,4
28
3,30
8,96
6
39,9
39,4
62
-
2014
SOU
THPA
RK
S.C
. 12
5,37
6
3,
476,
073
2,29
4,09
2
125,
376
5,
770,
165
5,
895,
541
1,
706,
577
4,
188,
964
-
19
99
O
LD T
OW
N P
LAZA
4,
500,
000
41,5
69,7
35
(1
2,85
3,71
3)
3,08
7,52
0
30,1
28,5
02
33,2
16,0
22
5,40
7,81
2
27,8
08,2
10
-
2007
SKY
LIN
E V
ILLA
GE
10
,145
,283
28,7
64,0
45
11
0,88
2
10,5
73,8
75
28,4
46,3
36
39,0
20,2
11
1,44
4,75
0
37,5
75,4
61
29,1
18,9
42
20
14
SU
DLE
Y T
OW
NE
PLA
ZA
4,11
4,29
3
15
,988
,465
-
4,
114,
293
15
,988
,465
20
,102
,758
70
4,41
0
19,3
98,3
48
-
2015
BU
RLI
NG
TON
CO
AT
CEN
TER
67
0,50
0
2,
751,
375
1,00
6,63
0
670,
500
3,
758,
005
4,
428,
505
1,
463,
547
2,
964,
958
-
19
95
TO
WN
E SQ
UA
RE
8,
499,
373
24,3
02,1
41
74
0,76
4
8,85
8,43
2
24,6
83,8
46
33,5
42,2
78
1,25
1,29
0
32,2
90,9
88
25,3
12,8
62
20
14
V
ALL
EY V
IEW
SH
OPP
ING
C
ENTE
R
3,44
0,01
8
8,
054,
004
922,
790
3,
440,
018
8,
976,
794
12
,416
,812
2,
903,
257
9,
513,
555
-
20
04
POTO
MA
C R
UN
PLA
ZA
27,3
69,5
15
48
,451
,209
498,
733
27
,369
,515
48
,949
,942
76
,319
,457
13
,724
,447
62
,595
,010
-
20
08
D
ULL
ES T
OW
N C
RO
SSIN
G
53,2
85,1
16
10
4,17
5,73
8
-
53,2
85,1
16
104,
175,
738
15
7,46
0,85
4
5,72
5,64
1
151,
735,
213
-
20
15
109
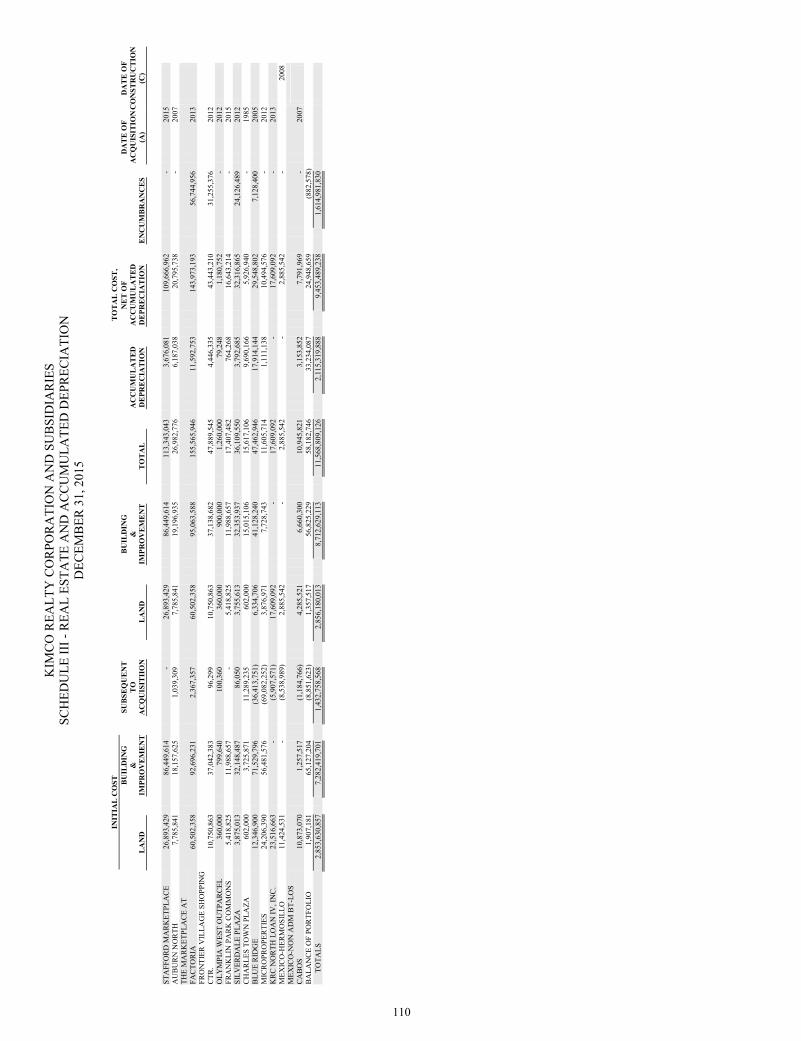
KIM
CO
REA
LTY
CO
RPO
RA
TIO
N A
ND
SU
BSI
DIA
RIE
S
SCH
EDU
LE II
I - R
EAL
ESTA
TE A
ND
AC
CU
MU
LATE
D D
EPR
ECIA
TIO
N
DEC
EMB
ER 3
1, 2
015
INIT
IAL
CO
ST
TO
TA
L C
OST
,
B
UIL
DIN
G
SU
BSE
QU
EN
T
B
UIL
DIN
G
N
ET
OF
DA
TE
OF
DA
TE
OF
&
TO
&
A
CC
UM
UL
AT
ED
A
CC
UM
UL
AT
ED
AC
QU
ISIT
ION
CO
NST
RU
CT
ION
L
AN
D
IM
PRO
VE
ME
NT
A
CQ
UIS
ITII
ON
L
AN
D
IM
PRO
VE
ME
NT
T
OT
AL
DE
PRE
CIA
TIO
N
DE
PRE
CIA
TIO
N
EN
CU
MB
RA
NC
ES
(A
) (C
)
STA
FFO
RD
MA
RK
ETPL
AC
E
26,8
93,4
29
86
,449
,614
-
26
,893
,429
86
,449
,614
11
3,34
3,04
3
3,67
6,08
1
109,
666,
962
-
20
15
A
UB
UR
N N
OR
TH
7,78
5,84
1
18
,157
,625
1,03
9,30
9
7,78
5,84
1
19,1
96,9
35
26,9
82,7
76
6,18
7,03
8
20,7
95,7
38
-
2007
THE
MA
RK
ETPL
AC
E A
T FA
CTO
RIA
60
,502
,358
92,6
96,2
31
2,
367,
357
60
,502
,358
95
,063
,588
15
5,56
5,94
6
11,5
92,7
53
143,
973,
193
56
,744
,956
2013
FRO
NTI
ER V
ILLA
GE
SHO
PPIN
G
CTR
. 10
,750
,863
37,0
42,3
83
96
,299
10
,750
,863
37
,138
,682
47
,889
,545
4,
446,
335
43
,443
,210
31
,255
,376
2012
OLY
MPI
A W
EST
OU
TPA
RC
EL
360,
000
799,
640
100,
360
36
0,00
0
900,
000
1,
260,
000
79
,248
1,
180,
752
-
20
12
FR
AN
KLI
N P
AR
K C
OM
MO
NS
5,
418,
825
11,9
88,6
57
-
5,41
8,82
5
11,9
88,6
57
17,4
07,4
82
764,
268
16
,643
,214
-
20
15
SI
LVER
DA
LE P
LAZA
3,
875,
013
32,1
48,4
87
86
,050
3,
755,
613
32
,353
,937
36
,109
,550
3,
792,
685
32
,316
,865
24
,126
,489
2012
CH
AR
LES
TOW
N P
LAZA
60
2,00
0
3,
725,
871
11,2
89,2
35
602,
000
15
,015
,106
15
,617
,106
9,
690,
166
5,
926,
940
-
19
85
B
LUE
RID
GE
12,3
46,9
00
71
,529
,796
(36,
413,
751)
6,
334,
706
41
,128
,240
47
,462
,946
17
,914
,144
29
,548
,802
7,
128,
400
2005
MIC
RO
PRO
PER
TIES
24
,206
,390
56,4
81,5
76
(6
9,08
2,25
2)
3,87
6,97
1
7,72
8,74
3
11,6
05,7
14
1,11
1,13
8
10,4
94,5
76
-
2012
KR
C N
OR
TH L
OA
N IV
, IN
C.
23,5
16,6
63
-
(5
,907
,571
)
17
,609
,092
-
17,6
09,0
92
-
17
,609
,092
-
20
13
M
EXIC
O-H
ERM
OSI
LLO
11
,424
,531
-
(8,5
38,9
89)
2,88
5,54
2
-
2,
885,
542
-
2,88
5,54
2
-
20
08
MEX
ICO
-NO
N A
DM
BT-
LOS
CA
BO
S 10
,873
,070
1,25
7,51
7
(1
,184
,766
)
4,
285,
521
6,
660,
300
10
,945
,821
3,
153,
852
7,
791,
969
-
20
07
BA
LAN
CE
OF
POR
TFO
LIO
1,
907,
181
65,1
27,2
04
(8
,851
,623
)
1,
357,
517
56
,825
,229
58
,182
,746
33
,234
,087
24
,948
,659
(8
82,5
78)
TOTA
LS
2,85
3,63
0,85
7
7,
282,
419,
701
1,43
2,75
8,56
8
2,85
6,18
0,01
3
8,71
2,62
9,11
3
11,5
68,8
09,1
26
2,11
5,31
9,88
8
9,45
3,48
9,23
8
1,61
4,98
1,83
0
110
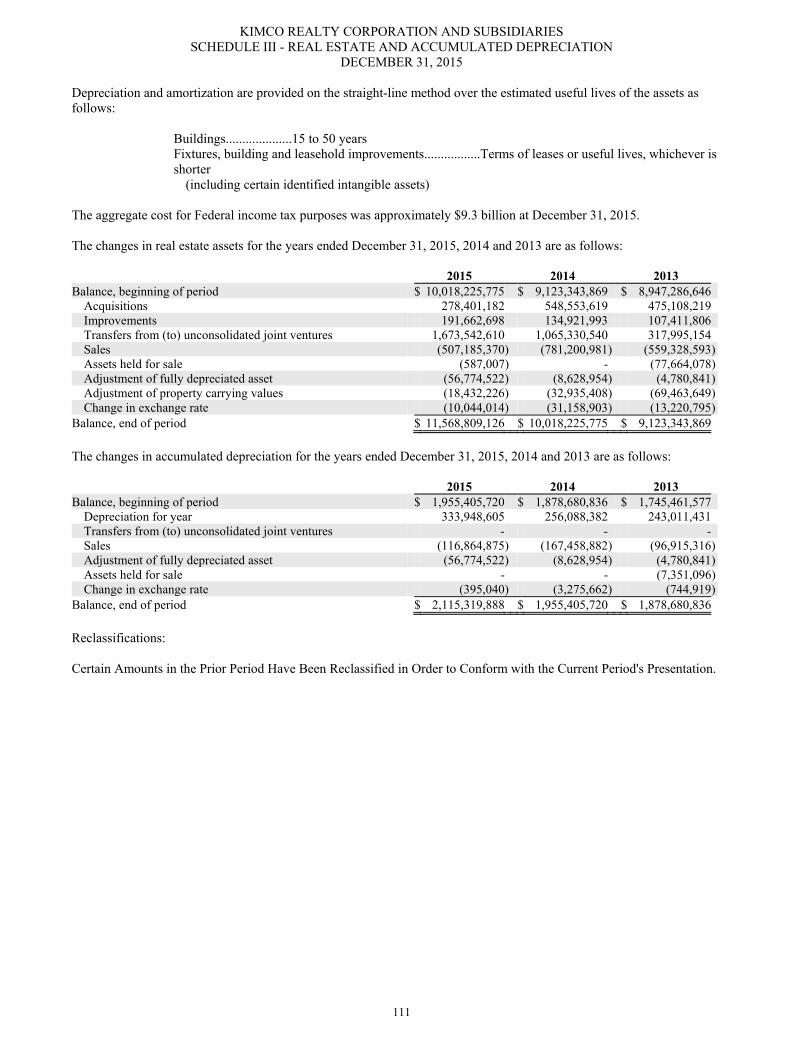
KIMCO REALTY CORPORATION AND SUBSIDIARIES SCHEDULE III - REAL ESTATE AND ACCUMULATED DEPRECIATION
DECEMBER 31, 2015
Depreciation and amortization are provided on the straight-line method over the estimated useful lives of the assets as follows: Buildings....................15 to 50 years
Fixtures, building and leasehold improvements.................Terms of leases or useful lives, whichever is shorter
(including certain identified intangible assets) The aggregate cost for Federal income tax purposes was approximately $9.3 billion at December 31, 2015. The changes in real estate assets for the years ended December 31, 2015, 2014 and 2013 are as follows: 2015 2014 2013 Balance, beginning of period $ 10,018,225,775 $ 9,123,343,869 $ 8,947,286,646
Acquisitions 278,401,182 548,553,619 475,108,219 Improvements 191,662,698 134,921,993 107,411,806 Transfers from (to) unconsolidated joint ventures 1,673,542,610 1,065,330,540 317,995,154 Sales (507,185,370) (781,200,981 ) (559,328,593)Assets held for sale (587,007) - (77,664,078)Adjustment of fully depreciated asset (56,774,522) (8,628,954 ) (4,780,841)Adjustment of property carrying values (18,432,226) (32,935,408 ) (69,463,649)Change in exchange rate (10,044,014) (31,158,903 ) (13,220,795)
Balance, end of period $ 11,568,809,126 $ 10,018,225,775 $ 9,123,343,869 The changes in accumulated depreciation for the years ended December 31, 2015, 2014 and 2013 are as follows: 2015 2014 2013 Balance, beginning of period $ 1,955,405,720 $ 1,878,680,836 $ 1,745,461,577
Depreciation for year 333,948,605 256,088,382 243,011,431 Transfers from (to) unconsolidated joint ventures - - - Sales (116,864,875) (167,458,882 ) (96,915,316)Adjustment of fully depreciated asset (56,774,522) (8,628,954 ) (4,780,841)Assets held for sale - - (7,351,096)Change in exchange rate (395,040) (3,275,662 ) (744,919)
Balance, end of period $ 2,115,319,888 $ 1,955,405,720 $ 1,878,680,836 Reclassifications: Certain Amounts in the Prior Period Have Been Reclassified in Order to Conform with the Current Period's Presentation.
111
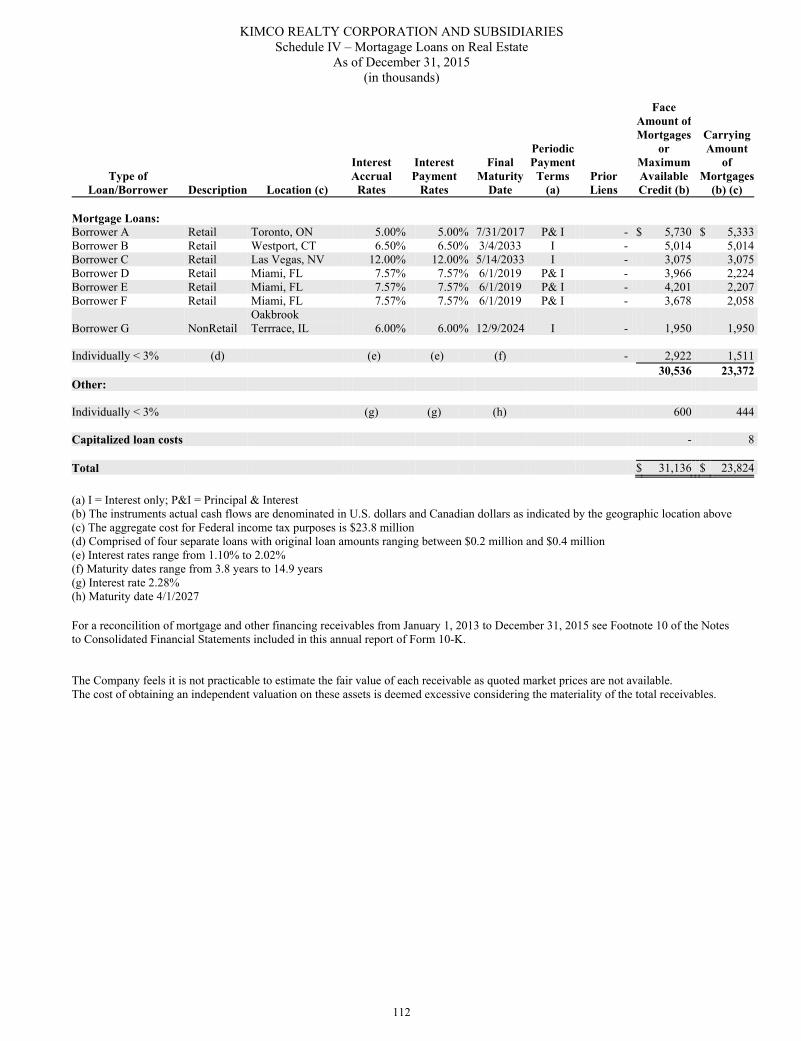
KIMCO REALTY CORPORATION AND SUBSIDIARIES Schedule IV – Mortagage Loans on Real Estate
As of December 31, 2015 (in thousands)
Type of Loan/Borrower Description Location (c)
Interest Accrual
Rates
Interest Payment
Rates
Final
Maturity Date
Periodic Payment Terms
(a)
Prior Liens
Face Amount of Mortgages
or Maximum Available Credit (b)
Carrying Amount
of Mortgages
(b) (c)
Mortgage Loans: Borrower A Retail Toronto, ON 5.00% 5.00% 7/31/2017 P& I - $ 5,730 $ 5,333 Borrower B Retail Westport, CT 6.50% 6.50% 3/4/2033 I - 5,014 5,014 Borrower C Retail Las Vegas, NV 12.00% 12.00% 5/14/2033 I - 3,075 3,075 Borrower D Retail Miami, FL 7.57% 7.57% 6/1/2019 P& I - 3,966 2,224 Borrower E Retail Miami, FL 7.57% 7.57% 6/1/2019 P& I - 4,201 2,207 Borrower F Retail Miami, FL 7.57% 7.57% 6/1/2019 P& I - 3,678 2,058
Borrower G NonRetail Oakbrook Terrrace, IL 6.00% 6.00% 12/9/2024 I - 1,950 1,950
Individually < 3% (d) (e) (e) (f) - 2,922 1,511 30,536 23,372 Other: Individually < 3% (g) (g) (h) 600 444 Capitalized loan costs - 8 Total $ 31,136 $ 23,824 (a) I = Interest only; P&I = Principal & Interest (b) The instruments actual cash flows are denominated in U.S. dollars and Canadian dollars as indicated by the geographic location above (c) The aggregate cost for Federal income tax purposes is $23.8 million (d) Comprised of four separate loans with original loan amounts ranging between $0.2 million and $0.4 million (e) Interest rates range from 1.10% to 2.02% (f) Maturity dates range from 3.8 years to 14.9 years (g) Interest rate 2.28% (h) Maturity date 4/1/2027 For a reconcilition of mortgage and other financing receivables from January 1, 2013 to December 31, 2015 see Footnote 10 of the Notes to Consolidated Financial Statements included in this annual report of Form 10-K. The Company feels it is not practicable to estimate the fair value of each receivable as quoted market prices are not available. The cost of obtaining an independent valuation on these assets is deemed excessive considering the materiality of the total receivables.
112
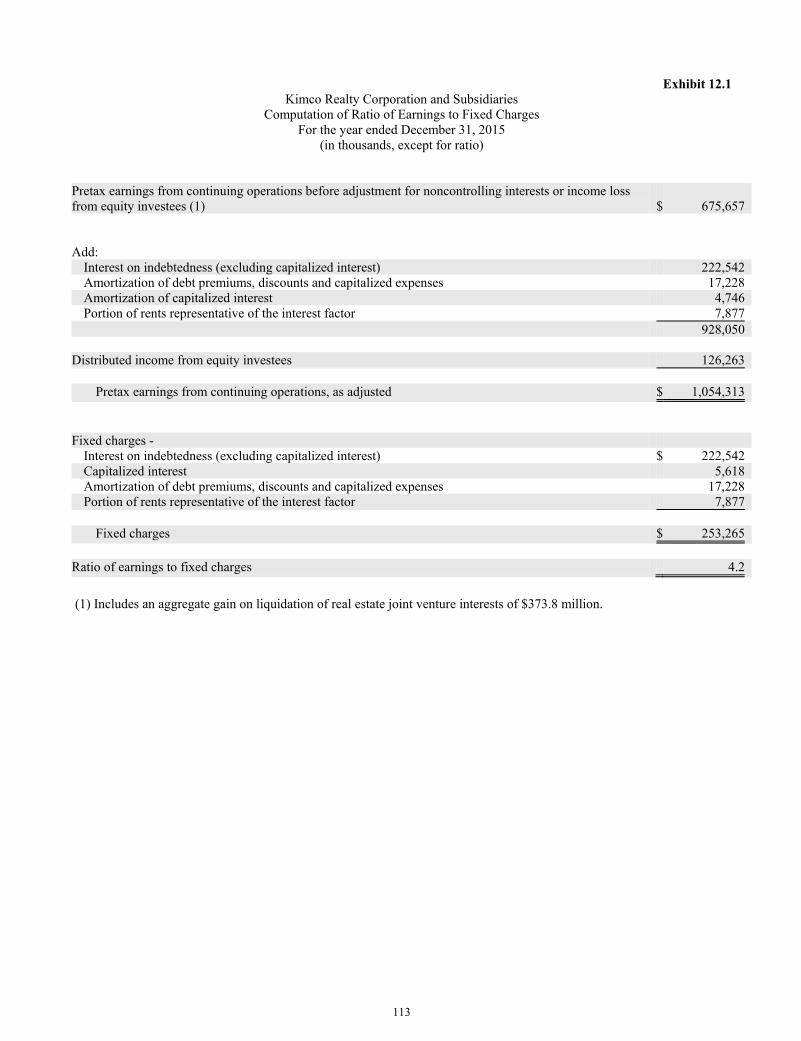
Exhibit 12.1
Kimco Realty Corporation and Subsidiaries Computation of Ratio of Earnings to Fixed Charges
For the year ended December 31, 2015 (in thousands, except for ratio)
Pretax earnings from continuing operations before adjustment for noncontrolling interests or income loss from equity investees (1) $ 675,657 Add:
Interest on indebtedness (excluding capitalized interest) 222,542 Amortization of debt premiums, discounts and capitalized expenses 17,228 Amortization of capitalized interest 4,746 Portion of rents representative of the interest factor 7,877
928,050 Distributed income from equity investees 126,263
Pretax earnings from continuing operations, as adjusted $ 1,054,313 Fixed charges -
Interest on indebtedness (excluding capitalized interest) $ 222,542 Capitalized interest 5,618 Amortization of debt premiums, discounts and capitalized expenses 17,228 Portion of rents representative of the interest factor 7,877
Fixed charges $ 253,265
Ratio of earnings to fixed charges 4.2
(1) Includes an aggregate gain on liquidation of real estate joint venture interests of $373.8 million.
113
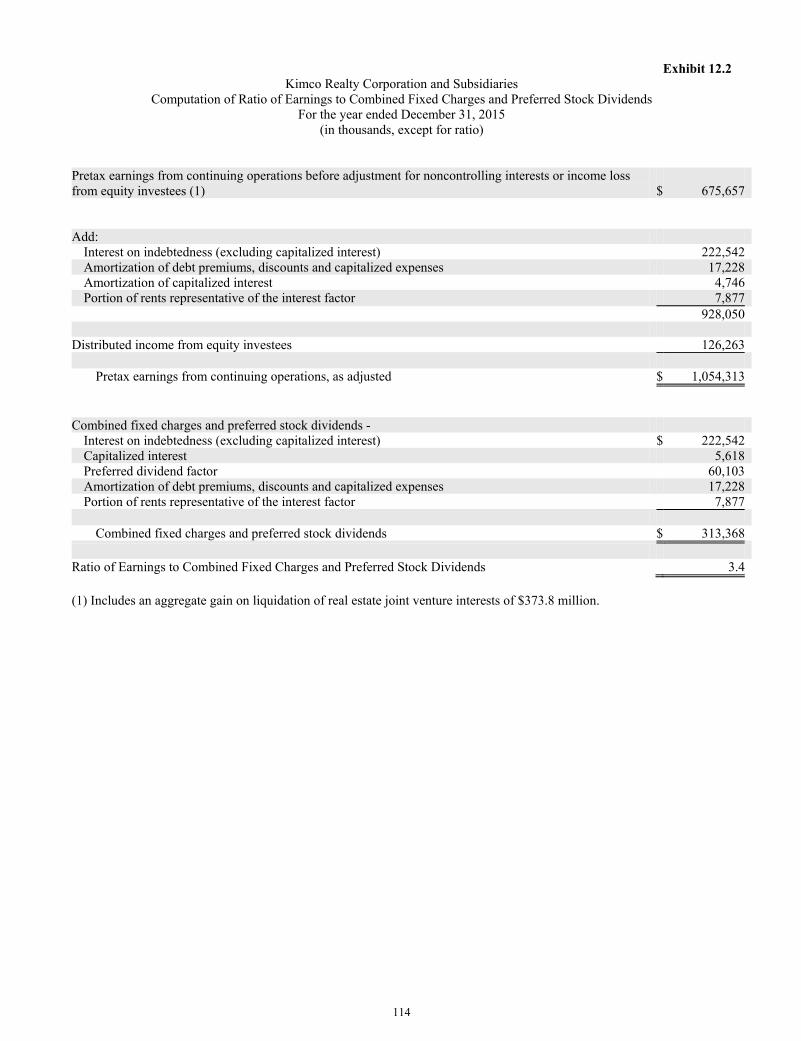
Exhibit 12.2 Kimco Realty Corporation and Subsidiaries
Computation of Ratio of Earnings to Combined Fixed Charges and Preferred Stock Dividends For the year ended December 31, 2015
(in thousands, except for ratio) Pretax earnings from continuing operations before adjustment for noncontrolling interests or income loss from equity investees (1) $ 675,657 Add:
Interest on indebtedness (excluding capitalized interest) 222,542 Amortization of debt premiums, discounts and capitalized expenses 17,228 Amortization of capitalized interest 4,746 Portion of rents representative of the interest factor 7,877
928,050 Distributed income from equity investees 126,263
Pretax earnings from continuing operations, as adjusted $ 1,054,313 Combined fixed charges and preferred stock dividends -
Interest on indebtedness (excluding capitalized interest) $ 222,542 Capitalized interest 5,618 Preferred dividend factor 60,103 Amortization of debt premiums, discounts and capitalized expenses 17,228 Portion of rents representative of the interest factor 7,877
Combined fixed charges and preferred stock dividends $ 313,368
Ratio of Earnings to Combined Fixed Charges and Preferred Stock Dividends 3.4 (1) Includes an aggregate gain on liquidation of real estate joint venture interests of $373.8 million.
114
Exhibit 31.1
CERTIFICATION PURSUANT TO SECTION 302 OF THE SARBANES-OXLEY ACT OF 2002
I, Conor C. Flynn, certify that: 1. I have reviewed this Annual Report on Form 10-K of Kimco Realty Corporation; 2. Based on my knowledge, this report does not contain any untrue statement of a material fact or omit to state a material fact necessary to make the statements made, in light of the circumstances under which such statements were made, not misleading with respect to the period covered by this report; 3. Based on my knowledge, the financial statements, and other financial information included in this report, fairly present in all material respects the financial condition, results of operations and cash flows of the registrant as of, and for, the periods presented in this report; 4. The registrant’s other certifying officer(s) and I are responsible for establishing and maintaining disclosure controls and procedures (as defined in Exchange Act Rules 13a-15(e) and 15d-15(e)) and internal control over financial reporting (as defined in Exchange Act Rules 13a-15(f) and 15d-15(f)) for the registrant and have:
(a) Designed such disclosure controls and procedures, or caused such disclosure controls and procedures to be designed under our supervision, to ensure that material information relating to the registrant, including its consolidated subsidiaries, is made known to us by others within those entities, particularly during the period in which this report is being prepared;
(b) Designed such internal control over financial reporting, or caused such internal control over financial reporting to be designed under our supervision, to provide reasonable assurance regarding the reliability of financial reporting and the preparation of financial statements for external purposes in accordance with generally accepted accounting principles;
(c) Evaluated the effectiveness of the registrant's disclosure controls and procedures and presented in this report our conclusions about the effectiveness of the disclosure controls and procedures, as of the end of the period covered by this report based on such evaluation; and
(d) Disclosed in this report any change in the registrant's internal control over financial reporting that occurred during the registrant's most recent fiscal quarter (the registrant's fourth fiscal quarter in the case of an annual report) that has materially affected, or is reasonably likely to materially affect, the registrant's internal control over financial reporting; and
5. The registrant’s other certifying officer(s) and I have disclosed, based on our most recent evaluation of internal control over financial reporting, to the registrant’s auditors and the audit committee of the registrant’s board of directors (or persons performing the equivalent functions):
(a) All significant deficiencies and material weaknesses in the design or operation of internal control over financial reporting which are reasonably likely to adversely affect the registrant’s ability to record, process, summarize and report financial information; and
(b) Any fraud, whether or not material, that involves management or other employees who have a significant role in the registrant’s internal control over financial reporting.
Date: February 26, 2016
/s/ Conor C. Flynn Conor C. Flynn Chief Executive Officer
115
Exhibit 31.2
CERTIFICATION PURSUANT TO SECTION 302 OF THE SARBANES-OXLEY ACT OF 2002
I, Glenn G. Cohen, certify that: 1. I have reviewed this Annual Report on Form 10-K of Kimco Realty Corporation; 2. Based on my knowledge, this report does not contain any untrue statement of a material fact or omit to state a material fact necessary to make the statements made, in light of the circumstances under which such statements were made, not misleading with respect to the period covered by this report; 3. Based on my knowledge, the financial statements, and other financial information included in this report, fairly present in all material respects the financial condition, results of operations and cash flows of the registrant as of, and for, the periods presented in this report; 4. The registrant’s other certifying officer(s) and I are responsible for establishing and maintaining disclosure controls and procedures (as defined in Exchange Act Rules 13a-15(e) and 15d-15(e)) and internal control over financial reporting (as defined in Exchange Act Rules 13a-15(f) and 15d-15(f)) for the registrant and have:
(a) Designed such disclosure controls and procedures, or caused such disclosure controls and procedures to be designed under our supervision, to ensure that material information relating to the registrant, including its consolidated subsidiaries, is made known to us by others within those entities, particularly during the period in which this report is being prepared;
(b) Designed such internal control over financial reporting, or caused such internal control over financial reporting to be designed under our supervision, to provide reasonable assurance regarding the reliability of financial reporting and the preparation of financial statements for external purposes in accordance with generally accepted accounting principles;
(c) Evaluated the effectiveness of the registrant's disclosure controls and procedures and presented in this report our conclusions about the effectiveness of the disclosure controls and procedures, as of the end of the period covered by this report based on such evaluation; and
(d) Disclosed in this report any change in the registrant's internal control over financial reporting that occurred during the registrant's most recent fiscal quarter (the registrant's fourth fiscal quarter in the case of an annual report) that has materially affected, or is reasonably likely to materially affect, the registrant's internal control over financial reporting; and
5. The registrant’s other certifying officer(s) and I have disclosed, based on our most recent evaluation of internal control over financial reporting, to the registrant’s auditors and the audit committee of the registrant’s board of directors (or persons performing the equivalent functions):
(a) All significant deficiencies and material weaknesses in the design or operation of internal control over financial reporting which are reasonably likely to adversely affect the registrant’s ability to record, process, summarize and report financial information; and
(b) Any fraud, whether or not material, that involves management or other employees who have a significant role in the registrant’s internal control over financial reporting.
Date: February 26, 2016
/s/ Glenn G. Cohen Glenn G. Cohen
Chief Financial Officer
116
Exhibit 32.1
Section 1350 Certification Pursuant to 18 U.S.C. § 1350, as adopted pursuant to Section 906 of the Sarbanes-Oxley Act of 2002, each of the undersigned officers of Kimco Realty Corporation (the “Company”) hereby certifies, to such officer’s knowledge, that:
(i) the accompanying Annual Report on Form 10-K of the Company for the year ended December 31, 2015 (the “Report”) fully complies with the requirements of Section 13(a) or 15(d) of the Securities Exchange Act of 1934; and
(ii) the information contained in the Report fairly presents, in all material respects, the financial condition and results of operations of the Company. Date: February 26, 2016
/s/ Conor C. Flynn Conor C. Flynn Chief Executive Officer
Date: February 26, 2016
/s/ Glenn G. Cohen Glenn G. Cohen
Chief Financial Officer
117
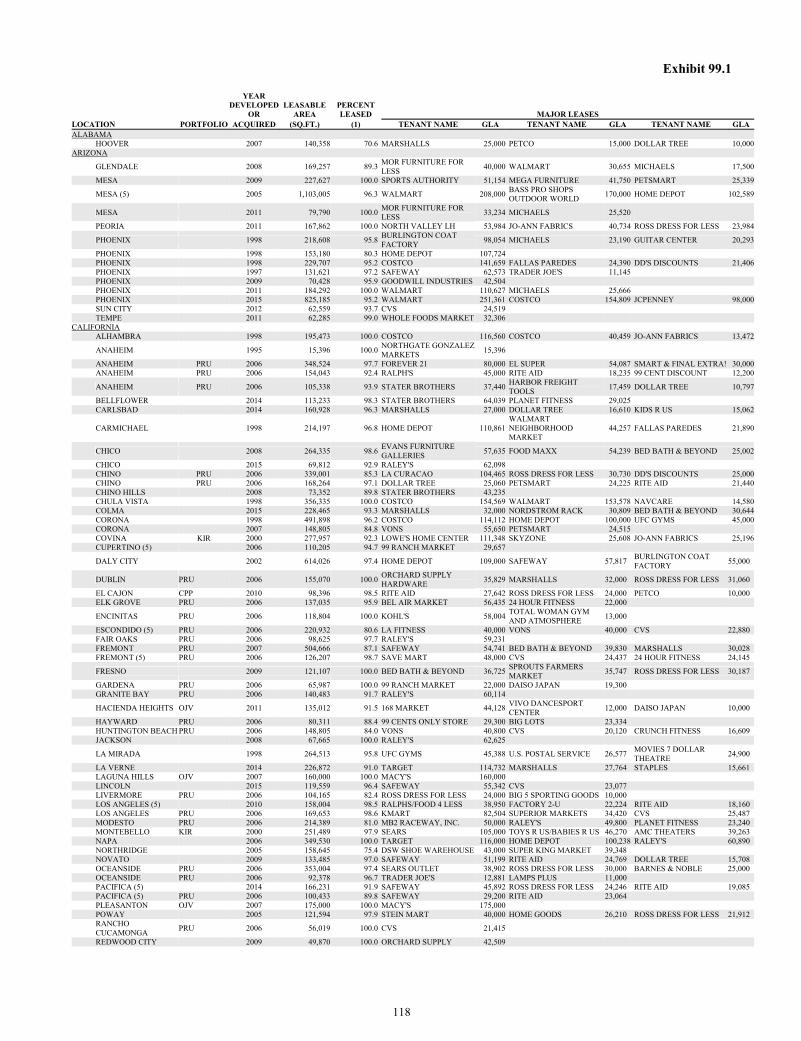
Exhibit 99.1
YEAR DEVELOPED
OR LEASABLE
AREA PERCENT LEASED MAJOR LEASES
LOCATION PORTFOLIO ACQUIRED (SQ.FT.) (1) TENANT NAME GLA TENANT NAME GLA TENANT NAME GLA ALABAMA
HOOVER 2007 140,358 70.6 MARSHALLS 25,000 PETCO 15,000 DOLLAR TREE 10,000 ARIZONA
GLENDALE 2008 169,257 89.3 MOR FURNITURE FOR LESS 40,000 WALMART 30,655 MICHAELS 17,500
MESA 2009 227,627 100.0 SPORTS AUTHORITY 51,154 MEGA FURNITURE 41,750 PETSMART 25,339
MESA (5) 2005 1,103,005 96.3 WALMART 208,000 BASS PRO SHOPS OUTDOOR WORLD 170,000 HOME DEPOT 102,589
MESA 2011 79,790 100.0 MOR FURNITURE FOR LESS 33,234 MICHAELS 25,520
PEORIA 2011 167,862 100.0 NORTH VALLEY LH 53,984 JO-ANN FABRICS 40,734 ROSS DRESS FOR LESS 23,984
PHOENIX 1998 218,608 95.8 BURLINGTON COAT FACTORY 98,054 MICHAELS 23,190 GUITAR CENTER 20,293
PHOENIX 1998 153,180 80.3 HOME DEPOT 107,724 PHOENIX 1998 229,707 95.2 COSTCO 141,659 FALLAS PAREDES 24,390 DD'S DISCOUNTS 21,406 PHOENIX 1997 131,621 97.2 SAFEWAY 62,573 TRADER JOE'S 11,145 PHOENIX 2009 70,428 95.9 GOODWILL INDUSTRIES 42,504 PHOENIX 2011 184,292 100.0 WALMART 110,627 MICHAELS 25,666 PHOENIX 2015 825,185 95.2 WALMART 251,361 COSTCO 154,809 JCPENNEY 98,000 SUN CITY 2012 62,559 93.7 CVS 24,519 TEMPE 2011 62,285 99.0 WHOLE FOODS MARKET 32,306
CALIFORNIA ALHAMBRA 1998 195,473 100.0 COSTCO 116,560 COSTCO 40,459 JO-ANN FABRICS 13,472
ANAHEIM 1995 15,396 100.0 NORTHGATE GONZALEZ MARKETS 15,396
ANAHEIM PRU 2006 348,524 97.7 FOREVER 21 80,000 EL SUPER 54,087 SMART & FINAL EXTRA! 30,000 ANAHEIM PRU 2006 154,043 92.4 RALPH'S 45,000 RITE AID 18,235 99 CENT DISCOUNT 12,200
ANAHEIM PRU 2006 105,338 93.9 STATER BROTHERS 37,440 HARBOR FREIGHT TOOLS 17,459 DOLLAR TREE 10,797
BELLFLOWER 2014 113,233 98.3 STATER BROTHERS 64,039 PLANET FITNESS 29,025 CARLSBAD 2014 160,928 96.3 MARSHALLS 27,000 DOLLAR TREE 16,610 KIDS R US 15,062
CARMICHAEL 1998 214,197 96.8 HOME DEPOT 110,861 WALMART NEIGHBORHOOD MARKET
44,257 FALLAS PAREDES 21,890
CHICO 2008 264,335 98.6 EVANS FURNITURE GALLERIES 57,635 FOOD MAXX 54,239 BED BATH & BEYOND 25,002
CHICO 2015 69,812 92.9 RALEY'S 62,098 CHINO PRU 2006 339,001 85.3 LA CURACAO 104,465 ROSS DRESS FOR LESS 30,730 DD'S DISCOUNTS 25,000 CHINO PRU 2006 168,264 97.1 DOLLAR TREE 25,060 PETSMART 24,225 RITE AID 21,440 CHINO HILLS 2008 73,352 89.8 STATER BROTHERS 43,235 CHULA VISTA 1998 356,335 100.0 COSTCO 154,569 WALMART 153,578 NAVCARE 14,580 COLMA 2015 228,465 93.3 MARSHALLS 32,000 NORDSTROM RACK 30,809 BED BATH & BEYOND 30,644 CORONA 1998 491,898 96.2 COSTCO 114,112 HOME DEPOT 100,000 UFC GYMS 45,000 CORONA 2007 148,805 84.8 VONS 55,650 PETSMART 24,515 COVINA KIR 2000 277,957 92.3 LOWE'S HOME CENTER 111,348 SKYZONE 25,608 JO-ANN FABRICS 25,196 CUPERTINO (5) 2006 110,205 94.7 99 RANCH MARKET 29,657
DALY CITY 2002 614,026 97.4 HOME DEPOT 109,000 SAFEWAY 57,817 BURLINGTON COAT FACTORY 55,000
DUBLIN PRU 2006 155,070 100.0 ORCHARD SUPPLY HARDWARE 35,829 MARSHALLS 32,000 ROSS DRESS FOR LESS 31,060
EL CAJON CPP 2010 98,396 98.5 RITE AID 27,642 ROSS DRESS FOR LESS 24,000 PETCO 10,000 ELK GROVE PRU 2006 137,035 95.9 BEL AIR MARKET 56,435 24 HOUR FITNESS 22,000
ENCINITAS PRU 2006 118,804 100.0 KOHL'S 58,004 TOTAL WOMAN GYM AND ATMOSPHERE 13,000
ESCONDIDO (5) PRU 2006 220,932 80.6 LA FITNESS 40,000 VONS 40,000 CVS 22,880 FAIR OAKS PRU 2006 98,625 97.7 RALEY'S 59,231 FREMONT PRU 2007 504,666 87.1 SAFEWAY 54,741 BED BATH & BEYOND 39,830 MARSHALLS 30,028 FREMONT (5) PRU 2006 126,207 98.7 SAVE MART 48,000 CVS 24,437 24 HOUR FITNESS 24,145
FRESNO 2009 121,107 100.0 BED BATH & BEYOND 36,725 SPROUTS FARMERS MARKET 35,747 ROSS DRESS FOR LESS 30,187
GARDENA PRU 2006 65,987 100.0 99 RANCH MARKET 22,000 DAISO JAPAN 19,300 GRANITE BAY PRU 2006 140,483 91.7 RALEY'S 60,114
HACIENDA HEIGHTS OJV 2011 135,012 91.5 168 MARKET 44,128 VIVO DANCESPORT CENTER 12,000 DAISO JAPAN 10,000
HAYWARD PRU 2006 80,311 88.4 99 CENTS ONLY STORE 29,300 BIG LOTS 23,334 HUNTINGTON BEACH PRU 2006 148,805 84.0 VONS 40,800 CVS 20,120 CRUNCH FITNESS 16,609 JACKSON 2008 67,665 100.0 RALEY'S 62,625
LA MIRADA 1998 264,513 95.8 UFC GYMS 45,388 U.S. POSTAL SERVICE 26,577 MOVIES 7 DOLLAR THEATRE 24,900
LA VERNE 2014 226,872 91.0 TARGET 114,732 MARSHALLS 27,764 STAPLES 15,661 LAGUNA HILLS OJV 2007 160,000 100.0 MACY'S 160,000 LINCOLN 2015 119,559 96.4 SAFEWAY 55,342 CVS 23,077 LIVERMORE PRU 2006 104,165 82.4 ROSS DRESS FOR LESS 24,000 BIG 5 SPORTING GOODS 10,000 LOS ANGELES (5) 2010 158,004 98.5 RALPHS/FOOD 4 LESS 38,950 FACTORY 2-U 22,224 RITE AID 18,160 LOS ANGELES PRU 2006 169,653 98.6 KMART 82,504 SUPERIOR MARKETS 34,420 CVS 25,487 MODESTO PRU 2006 214,389 81.0 MB2 RACEWAY, INC. 50,000 RALEY'S 49,800 PLANET FITNESS 23,240 MONTEBELLO KIR 2000 251,489 97.9 SEARS 105,000 TOYS R US/BABIES R US 46,270 AMC THEATERS 39,263 NAPA 2006 349,530 100.0 TARGET 116,000 HOME DEPOT 100,238 RALEY'S 60,890 NORTHRIDGE 2005 158,645 75.4 DSW SHOE WAREHOUSE 43,000 SUPER KING MARKET 39,348 NOVATO 2009 133,485 97.0 SAFEWAY 51,199 RITE AID 24,769 DOLLAR TREE 15,708 OCEANSIDE PRU 2006 353,004 97.4 SEARS OUTLET 38,902 ROSS DRESS FOR LESS 30,000 BARNES & NOBLE 25,000 OCEANSIDE PRU 2006 92,378 96.7 TRADER JOE'S 12,881 LAMPS PLUS 11,000 PACIFICA (5) 2014 166,231 91.9 SAFEWAY 45,892 ROSS DRESS FOR LESS 24,246 RITE AID 19,085 PACIFICA (5) PRU 2006 100,433 89.8 SAFEWAY 29,200 RITE AID 23,064 PLEASANTON OJV 2007 175,000 100.0 MACY'S 175,000 POWAY 2005 121,594 97.9 STEIN MART 40,000 HOME GOODS 26,210 ROSS DRESS FOR LESS 21,912 RANCHO CUCAMONGA PRU 2006 56,019 100.0 CVS 21,415
REDWOOD CITY 2009 49,870 100.0 ORCHARD SUPPLY 42,509
118
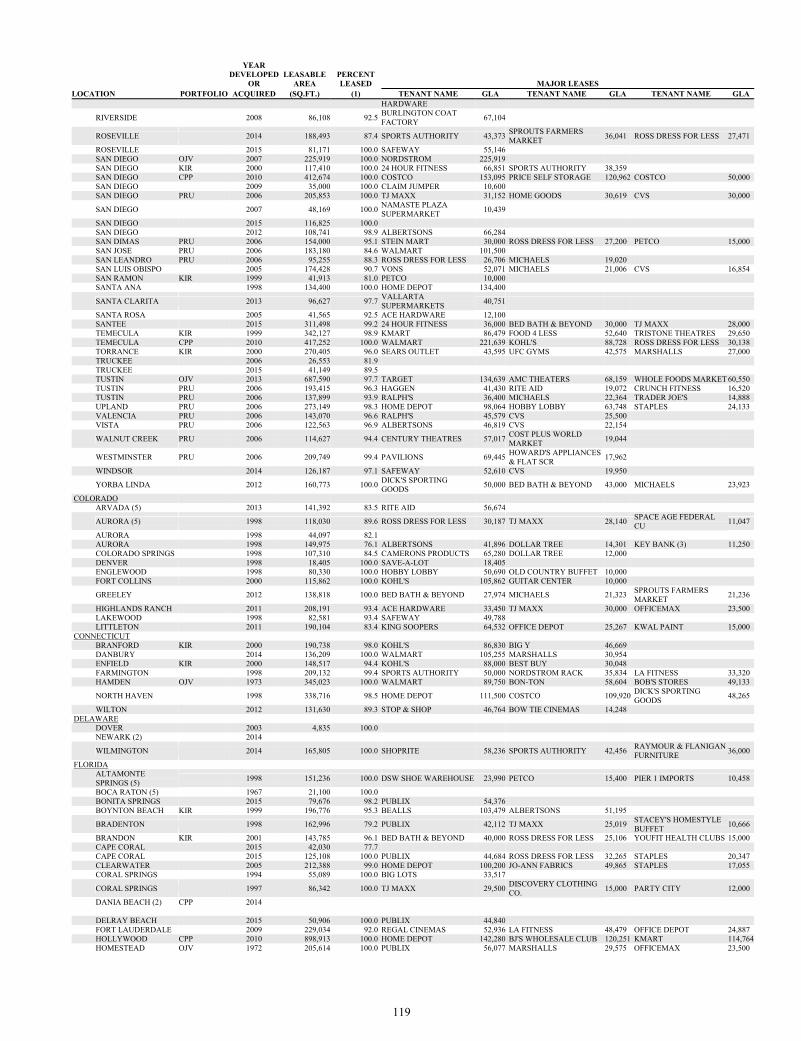
YEAR
DEVELOPED OR
LEASABLE AREA
PERCENT LEASED MAJOR LEASES
LOCATION PORTFOLIO ACQUIRED (SQ.FT.) (1) TENANT NAME GLA TENANT NAME GLA TENANT NAME GLA HARDWARE
RIVERSIDE 2008 86,108 92.5 BURLINGTON COAT FACTORY 67,104
ROSEVILLE 2014 188,493 87.4 SPORTS AUTHORITY 43,373 SPROUTS FARMERS MARKET 36,041 ROSS DRESS FOR LESS 27,471
ROSEVILLE 2015 81,171 100.0 SAFEWAY 55,146 SAN DIEGO OJV 2007 225,919 100.0 NORDSTROM 225,919 SAN DIEGO KIR 2000 117,410 100.0 24 HOUR FITNESS 66,851 SPORTS AUTHORITY 38,359 SAN DIEGO CPP 2010 412,674 100.0 COSTCO 153,095 PRICE SELF STORAGE 120,962 COSTCO 50,000 SAN DIEGO 2009 35,000 100.0 CLAIM JUMPER 10,600 SAN DIEGO PRU 2006 205,853 100.0 TJ MAXX 31,152 HOME GOODS 30,619 CVS 30,000
SAN DIEGO 2007 48,169 100.0 NAMASTE PLAZA SUPERMARKET 10,439
SAN DIEGO 2015 116,825 100.0 SAN DIEGO 2012 108,741 98.9 ALBERTSONS 66,284 SAN DIMAS PRU 2006 154,000 95.1 STEIN MART 30,000 ROSS DRESS FOR LESS 27,200 PETCO 15,000 SAN JOSE PRU 2006 183,180 84.6 WALMART 101,500 SAN LEANDRO PRU 2006 95,255 88.3 ROSS DRESS FOR LESS 26,706 MICHAELS 19,020 SAN LUIS OBISPO 2005 174,428 90.7 VONS 52,071 MICHAELS 21,006 CVS 16,854 SAN RAMON KIR 1999 41,913 81.0 PETCO 10,000 SANTA ANA 1998 134,400 100.0 HOME DEPOT 134,400
SANTA CLARITA 2013 96,627 97.7 VALLARTA SUPERMARKETS 40,751
SANTA ROSA 2005 41,565 92.5 ACE HARDWARE 12,100 SANTEE 2015 311,498 99.2 24 HOUR FITNESS 36,000 BED BATH & BEYOND 30,000 TJ MAXX 28,000 TEMECULA KIR 1999 342,127 98.9 KMART 86,479 FOOD 4 LESS 52,640 TRISTONE THEATRES 29,650 TEMECULA CPP 2010 417,252 100.0 WALMART 221,639 KOHL'S 88,728 ROSS DRESS FOR LESS 30,138 TORRANCE KIR 2000 270,405 96.0 SEARS OUTLET 43,595 UFC GYMS 42,575 MARSHALLS 27,000 TRUCKEE 2006 26,553 81.9 TRUCKEE 2015 41,149 89.5 TUSTIN OJV 2013 687,590 97.7 TARGET 134,639 AMC THEATERS 68,159 WHOLE FOODS MARKET 60,550 TUSTIN PRU 2006 193,415 96.3 HAGGEN 41,430 RITE AID 19,072 CRUNCH FITNESS 16,520 TUSTIN PRU 2006 137,899 93.9 RALPH'S 36,400 MICHAELS 22,364 TRADER JOE'S 14,888 UPLAND PRU 2006 273,149 98.3 HOME DEPOT 98,064 HOBBY LOBBY 63,748 STAPLES 24,133 VALENCIA PRU 2006 143,070 96.6 RALPH'S 45,579 CVS 25,500 VISTA PRU 2006 122,563 96.9 ALBERTSONS 46,819 CVS 22,154
WALNUT CREEK PRU 2006 114,627 94.4 CENTURY THEATRES 57,017 COST PLUS WORLD MARKET 19,044
WESTMINSTER PRU 2006 209,749 99.4 PAVILIONS 69,445 HOWARD'S APPLIANCES & FLAT SCR 17,962
WINDSOR 2014 126,187 97.1 SAFEWAY 52,610 CVS 19,950
YORBA LINDA 2012 160,773 100.0 DICK'S SPORTING GOODS 50,000 BED BATH & BEYOND 43,000 MICHAELS 23,923
COLORADO ARVADA (5) 2013 141,392 83.5 RITE AID 56,674
AURORA (5) 1998 118,030 89.6 ROSS DRESS FOR LESS 30,187 TJ MAXX 28,140 SPACE AGE FEDERAL CU 11,047
AURORA 1998 44,097 82.1 AURORA 1998 149,975 76.1 ALBERTSONS 41,896 DOLLAR TREE 14,301 KEY BANK (3) 11,250 COLORADO SPRINGS 1998 107,310 84.5 CAMERONS PRODUCTS 65,280 DOLLAR TREE 12,000 DENVER 1998 18,405 100.0 SAVE-A-LOT 18,405 ENGLEWOOD 1998 80,330 100.0 HOBBY LOBBY 50,690 OLD COUNTRY BUFFET 10,000 FORT COLLINS 2000 115,862 100.0 KOHL'S 105,862 GUITAR CENTER 10,000
GREELEY 2012 138,818 100.0 BED BATH & BEYOND 27,974 MICHAELS 21,323 SPROUTS FARMERS MARKET 21,236
HIGHLANDS RANCH 2011 208,191 93.4 ACE HARDWARE 33,450 TJ MAXX 30,000 OFFICEMAX 23,500 LAKEWOOD 1998 82,581 93.4 SAFEWAY 49,788 LITTLETON 2011 190,104 83.4 KING SOOPERS 64,532 OFFICE DEPOT 25,267 KWAL PAINT 15,000
CONNECTICUT BRANFORD KIR 2000 190,738 98.0 KOHL'S 86,830 BIG Y 46,669 DANBURY 2014 136,209 100.0 WALMART 105,255 MARSHALLS 30,954 ENFIELD KIR 2000 148,517 94.4 KOHL'S 88,000 BEST BUY 30,048 FARMINGTON 1998 209,132 99.4 SPORTS AUTHORITY 50,000 NORDSTROM RACK 35,834 LA FITNESS 33,320 HAMDEN OJV 1973 345,023 100.0 WALMART 89,750 BON-TON 58,604 BOB'S STORES 49,133
NORTH HAVEN 1998 338,716 98.5 HOME DEPOT 111,500 COSTCO 109,920 DICK'S SPORTING GOODS 48,265
WILTON 2012 131,630 89.3 STOP & SHOP 46,764 BOW TIE CINEMAS 14,248 DELAWARE
DOVER 2003 4,835 100.0 NEWARK (2) 2014
WILMINGTON 2014 165,805 100.0 SHOPRITE 58,236 SPORTS AUTHORITY 42,456 RAYMOUR & FLANIGAN FURNITURE 36,000
FLORIDA ALTAMONTE SPRINGS (5) 1998 151,236 100.0 DSW SHOE WAREHOUSE 23,990 PETCO 15,400 PIER 1 IMPORTS 10,458
BOCA RATON (5) 1967 21,100 100.0 BONITA SPRINGS 2015 79,676 98.2 PUBLIX 54,376 BOYNTON BEACH KIR 1999 196,776 95.3 BEALLS 103,479 ALBERTSONS 51,195
BRADENTON 1998 162,996 79.2 PUBLIX 42,112 TJ MAXX 25,019 STACEY'S HOMESTYLE BUFFET 10,666
BRANDON KIR 2001 143,785 96.1 BED BATH & BEYOND 40,000 ROSS DRESS FOR LESS 25,106 YOUFIT HEALTH CLUBS 15,000 CAPE CORAL 2015 42,030 77.7 CAPE CORAL 2015 125,108 100.0 PUBLIX 44,684 ROSS DRESS FOR LESS 32,265 STAPLES 20,347 CLEARWATER 2005 212,388 99.0 HOME DEPOT 100,200 JO-ANN FABRICS 49,865 STAPLES 17,055 CORAL SPRINGS 1994 55,089 100.0 BIG LOTS 33,517
CORAL SPRINGS 1997 86,342 100.0 TJ MAXX 29,500 DISCOVERY CLOTHING CO. 15,000 PARTY CITY 12,000
DANIA BEACH (2) CPP 2014 DELRAY BEACH 2015 50,906 100.0 PUBLIX 44,840 FORT LAUDERDALE 2009 229,034 92.0 REGAL CINEMAS 52,936 LA FITNESS 48,479 OFFICE DEPOT 24,887 HOLLYWOOD CPP 2010 898,913 100.0 HOME DEPOT 142,280 BJ'S WHOLESALE CLUB 120,251 KMART 114,764 HOMESTEAD OJV 1972 205,614 100.0 PUBLIX 56,077 MARSHALLS 29,575 OFFICEMAX 23,500
119
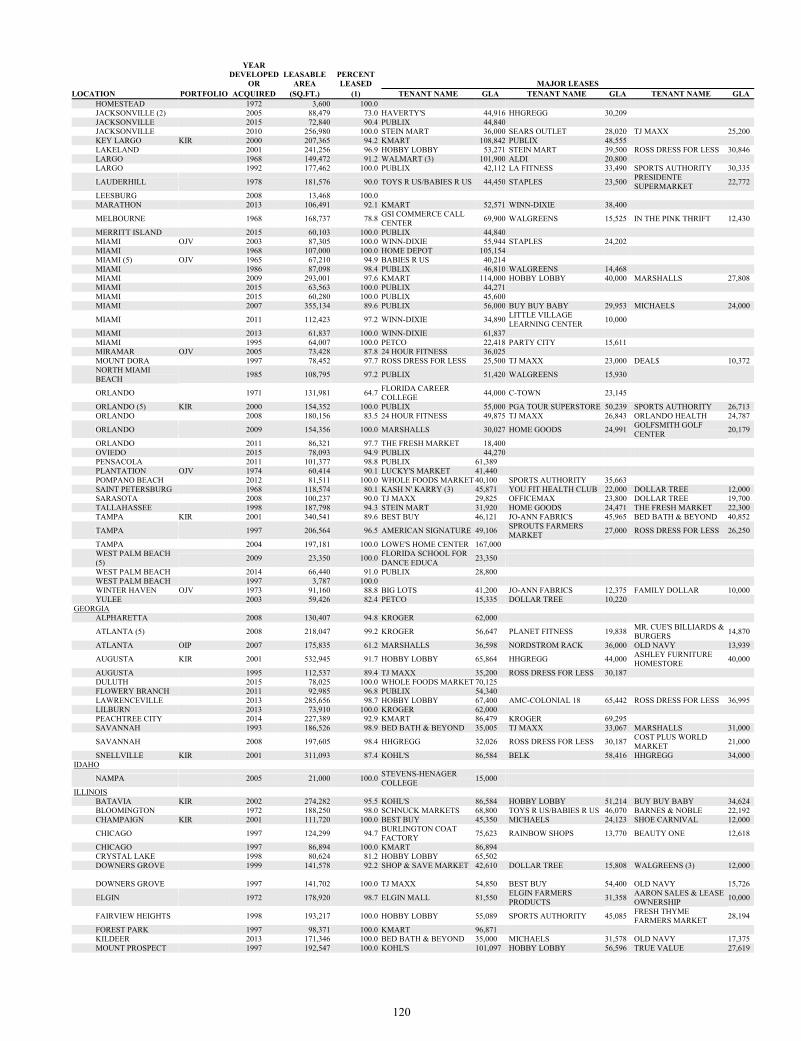
YEAR
DEVELOPED OR
LEASABLE AREA
PERCENT LEASED MAJOR LEASES
LOCATION PORTFOLIO ACQUIRED (SQ.FT.) (1) TENANT NAME GLA TENANT NAME GLA TENANT NAME GLA HOMESTEAD 1972 3,600 100.0 JACKSONVILLE (2) 2005 88,479 73.0 HAVERTY'S 44,916 HHGREGG 30,209 JACKSONVILLE 2015 72,840 90.4 PUBLIX 44,840 JACKSONVILLE 2010 256,980 100.0 STEIN MART 36,000 SEARS OUTLET 28,020 TJ MAXX 25,200 KEY LARGO KIR 2000 207,365 94.2 KMART 108,842 PUBLIX 48,555 LAKELAND 2001 241,256 96.9 HOBBY LOBBY 53,271 STEIN MART 39,500 ROSS DRESS FOR LESS 30,846 LARGO 1968 149,472 91.2 WALMART (3) 101,900 ALDI 20,800 LARGO 1992 177,462 100.0 PUBLIX 42,112 LA FITNESS 33,490 SPORTS AUTHORITY 30,335
LAUDERHILL 1978 181,576 90.0 TOYS R US/BABIES R US 44,450 STAPLES 23,500 PRESIDENTE SUPERMARKET 22,772
LEESBURG 2008 13,468 100.0 MARATHON 2013 106,491 92.1 KMART 52,571 WINN-DIXIE 38,400
MELBOURNE 1968 168,737 78.8 GSI COMMERCE CALL CENTER 69,900 WALGREENS 15,525 IN THE PINK THRIFT 12,430
MERRITT ISLAND 2015 60,103 100.0 PUBLIX 44,840 MIAMI OJV 2003 87,305 100.0 WINN-DIXIE 55,944 STAPLES 24,202 MIAMI 1968 107,000 100.0 HOME DEPOT 105,154 MIAMI (5) OJV 1965 67,210 94.9 BABIES R US 40,214 MIAMI 1986 87,098 98.4 PUBLIX 46,810 WALGREENS 14,468 MIAMI 2009 293,001 97.6 KMART 114,000 HOBBY LOBBY 40,000 MARSHALLS 27,808 MIAMI 2015 63,563 100.0 PUBLIX 44,271 MIAMI 2015 60,280 100.0 PUBLIX 45,600 MIAMI 2007 355,134 89.6 PUBLIX 56,000 BUY BUY BABY 29,953 MICHAELS 24,000
MIAMI 2011 112,423 97.2 WINN-DIXIE 34,890 LITTLE VILLAGE LEARNING CENTER 10,000
MIAMI 2013 61,837 100.0 WINN-DIXIE 61,837 MIAMI 1995 64,007 100.0 PETCO 22,418 PARTY CITY 15,611 MIRAMAR OJV 2005 73,428 87.8 24 HOUR FITNESS 36,025 MOUNT DORA 1997 78,452 97.7 ROSS DRESS FOR LESS 25,500 TJ MAXX 23,000 DEAL$ 10,372 NORTH MIAMI BEACH 1985 108,795 97.2 PUBLIX 51,420 WALGREENS 15,930
ORLANDO 1971 131,981 64.7 FLORIDA CAREER COLLEGE 44,000 C-TOWN 23,145
ORLANDO (5) KIR 2000 154,352 100.0 PUBLIX 55,000 PGA TOUR SUPERSTORE 50,239 SPORTS AUTHORITY 26,713 ORLANDO 2008 180,156 83.5 24 HOUR FITNESS 49,875 TJ MAXX 26,843 ORLANDO HEALTH 24,787
ORLANDO 2009 154,356 100.0 MARSHALLS 30,027 HOME GOODS 24,991 GOLFSMITH GOLF CENTER 20,179
ORLANDO 2011 86,321 97.7 THE FRESH MARKET 18,400 OVIEDO 2015 78,093 94.9 PUBLIX 44,270 PENSACOLA 2011 101,377 98.8 PUBLIX 61,389 PLANTATION OJV 1974 60,414 90.1 LUCKY'S MARKET 41,440 POMPANO BEACH 2012 81,511 100.0 WHOLE FOODS MARKET 40,100 SPORTS AUTHORITY 35,663 SAINT PETERSBURG 1968 118,574 80.1 KASH N' KARRY (3) 45,871 YOU FIT HEALTH CLUB 22,000 DOLLAR TREE 12,000 SARASOTA 2008 100,237 90.0 TJ MAXX 29,825 OFFICEMAX 23,800 DOLLAR TREE 19,700 TALLAHASSEE 1998 187,798 94.3 STEIN MART 31,920 HOME GOODS 24,471 THE FRESH MARKET 22,300 TAMPA KIR 2001 340,541 89.6 BEST BUY 46,121 JO-ANN FABRICS 45,965 BED BATH & BEYOND 40,852
TAMPA 1997 206,564 96.5 AMERICAN SIGNATURE 49,106 SPROUTS FARMERS MARKET 27,000 ROSS DRESS FOR LESS 26,250
TAMPA 2004 197,181 100.0 LOWE'S HOME CENTER 167,000 WEST PALM BEACH (5) 2009 23,350 100.0 FLORIDA SCHOOL FOR
DANCE EDUCA 23,350
WEST PALM BEACH 2014 66,440 91.0 PUBLIX 28,800 WEST PALM BEACH 1997 3,787 100.0 WINTER HAVEN OJV 1973 91,160 88.8 BIG LOTS 41,200 JO-ANN FABRICS 12,375 FAMILY DOLLAR 10,000 YULEE 2003 59,426 82.4 PETCO 15,335 DOLLAR TREE 10,220
GEORGIA ALPHARETTA 2008 130,407 94.8 KROGER 62,000
ATLANTA (5) 2008 218,047 99.2 KROGER 56,647 PLANET FITNESS 19,838 MR. CUE'S BILLIARDS & BURGERS 14,870
ATLANTA OIP 2007 175,835 61.2 MARSHALLS 36,598 NORDSTROM RACK 36,000 OLD NAVY 13,939
AUGUSTA KIR 2001 532,945 91.7 HOBBY LOBBY 65,864 HHGREGG 44,000 ASHLEY FURNITURE HOMESTORE 40,000
AUGUSTA 1995 112,537 89.4 TJ MAXX 35,200 ROSS DRESS FOR LESS 30,187 DULUTH 2015 78,025 100.0 WHOLE FOODS MARKET 70,125 FLOWERY BRANCH 2011 92,985 96.8 PUBLIX 54,340 LAWRENCEVILLE 2013 285,656 98.7 HOBBY LOBBY 67,400 AMC-COLONIAL 18 65,442 ROSS DRESS FOR LESS 36,995 LILBURN 2013 73,910 100.0 KROGER 62,000 PEACHTREE CITY 2014 227,389 92.9 KMART 86,479 KROGER 69,295 SAVANNAH 1993 186,526 98.9 BED BATH & BEYOND 35,005 TJ MAXX 33,067 MARSHALLS 31,000
SAVANNAH 2008 197,605 98.4 HHGREGG 32,026 ROSS DRESS FOR LESS 30,187 COST PLUS WORLD MARKET 21,000
SNELLVILLE KIR 2001 311,093 87.4 KOHL'S 86,584 BELK 58,416 HHGREGG 34,000 IDAHO
NAMPA 2005 21,000 100.0 STEVENS-HENAGER COLLEGE 15,000
ILLINOIS BATAVIA KIR 2002 274,282 95.5 KOHL'S 86,584 HOBBY LOBBY 51,214 BUY BUY BABY 34,624 BLOOMINGTON 1972 188,250 98.0 SCHNUCK MARKETS 68,800 TOYS R US/BABIES R US 46,070 BARNES & NOBLE 22,192 CHAMPAIGN KIR 2001 111,720 100.0 BEST BUY 45,350 MICHAELS 24,123 SHOE CARNIVAL 12,000
CHICAGO 1997 124,299 94.7 BURLINGTON COAT FACTORY 75,623 RAINBOW SHOPS 13,770 BEAUTY ONE 12,618
CHICAGO 1997 86,894 100.0 KMART 86,894 CRYSTAL LAKE 1998 80,624 81.2 HOBBY LOBBY 65,502 DOWNERS GROVE 1999 141,578 92.2 SHOP & SAVE MARKET 42,610 DOLLAR TREE 15,808 WALGREENS (3) 12,000 DOWNERS GROVE 1997 141,702 100.0 TJ MAXX 54,850 BEST BUY 54,400 OLD NAVY 15,726
ELGIN 1972 178,920 98.7 ELGIN MALL 81,550 ELGIN FARMERS PRODUCTS 31,358 AARON SALES & LEASE
OWNERSHIP 10,000
FAIRVIEW HEIGHTS 1998 193,217 100.0 HOBBY LOBBY 55,089 SPORTS AUTHORITY 45,085 FRESH THYME FARMERS MARKET 28,194
FOREST PARK 1997 98,371 100.0 KMART 96,871 KILDEER 2013 171,346 100.0 BED BATH & BEYOND 35,000 MICHAELS 31,578 OLD NAVY 17,375 MOUNT PROSPECT 1997 192,547 100.0 KOHL'S 101,097 HOBBY LOBBY 56,596 TRUE VALUE 27,619
120
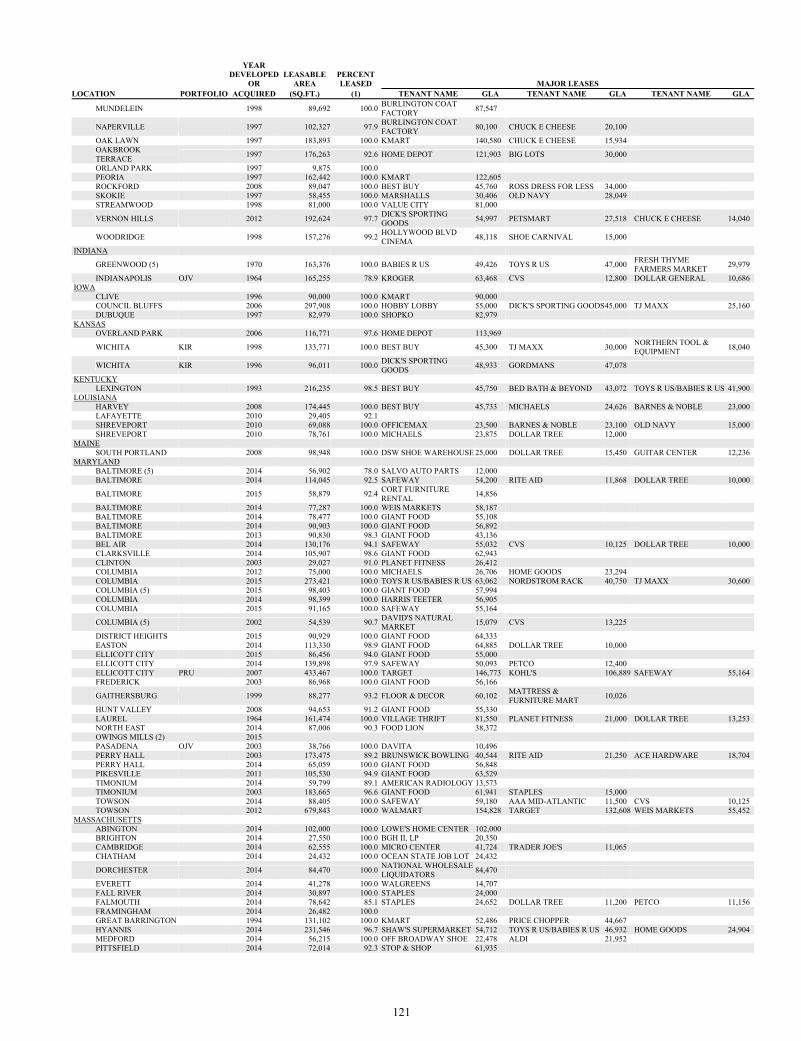
YEAR
DEVELOPED OR
LEASABLE AREA
PERCENT LEASED MAJOR LEASES
LOCATION PORTFOLIO ACQUIRED (SQ.FT.) (1) TENANT NAME GLA TENANT NAME GLA TENANT NAME GLA
MUNDELEIN 1998 89,692 100.0 BURLINGTON COAT FACTORY 87,547
NAPERVILLE 1997 102,327 97.9 BURLINGTON COAT FACTORY 80,100 CHUCK E CHEESE 20,100
OAK LAWN 1997 183,893 100.0 KMART 140,580 CHUCK E CHEESE 15,934 OAKBROOK TERRACE 1997 176,263 92.6 HOME DEPOT 121,903 BIG LOTS 30,000
ORLAND PARK 1997 9,875 100.0 PEORIA 1997 162,442 100.0 KMART 122,605 ROCKFORD 2008 89,047 100.0 BEST BUY 45,760 ROSS DRESS FOR LESS 34,000 SKOKIE 1997 58,455 100.0 MARSHALLS 30,406 OLD NAVY 28,049 STREAMWOOD 1998 81,000 100.0 VALUE CITY 81,000
VERNON HILLS 2012 192,624 97.7 DICK'S SPORTING GOODS 54,997 PETSMART 27,518 CHUCK E CHEESE 14,040
WOODRIDGE 1998 157,276 99.2 HOLLYWOOD BLVD CINEMA 48,118 SHOE CARNIVAL 15,000
INDIANA
GREENWOOD (5) 1970 163,376 100.0 BABIES R US 49,426 TOYS R US 47,000 FRESH THYME FARMERS MARKET 29,979
INDIANAPOLIS OJV 1964 165,255 78.9 KROGER 63,468 CVS 12,800 DOLLAR GENERAL 10,686 IOWA
CLIVE 1996 90,000 100.0 KMART 90,000 COUNCIL BLUFFS 2006 297,908 100.0 HOBBY LOBBY 55,000 DICK'S SPORTING GOODS 45,000 TJ MAXX 25,160 DUBUQUE 1997 82,979 100.0 SHOPKO 82,979
KANSAS OVERLAND PARK 2006 116,771 97.6 HOME DEPOT 113,969
WICHITA KIR 1998 133,771 100.0 BEST BUY 45,300 TJ MAXX 30,000 NORTHERN TOOL & EQUIPMENT 18,040
WICHITA KIR 1996 96,011 100.0 DICK'S SPORTING GOODS 48,933 GORDMANS 47,078
KENTUCKY LEXINGTON 1993 216,235 98.5 BEST BUY 45,750 BED BATH & BEYOND 43,072 TOYS R US/BABIES R US 41,900
LOUISIANA HARVEY 2008 174,445 100.0 BEST BUY 45,733 MICHAELS 24,626 BARNES & NOBLE 23,000 LAFAYETTE 2010 29,405 92.1 SHREVEPORT 2010 69,088 100.0 OFFICEMAX 23,500 BARNES & NOBLE 23,100 OLD NAVY 15,000 SHREVEPORT 2010 78,761 100.0 MICHAELS 23,875 DOLLAR TREE 12,000
MAINE SOUTH PORTLAND 2008 98,948 100.0 DSW SHOE WAREHOUSE 25,000 DOLLAR TREE 15,450 GUITAR CENTER 12,236
MARYLAND BALTIMORE (5) 2014 56,902 78.0 SALVO AUTO PARTS 12,000 BALTIMORE 2014 114,045 92.5 SAFEWAY 54,200 RITE AID 11,868 DOLLAR TREE 10,000
BALTIMORE 2015 58,879 92.4 CORT FURNITURE RENTAL 14,856
BALTIMORE 2014 77,287 100.0 WEIS MARKETS 58,187 BALTIMORE 2014 78,477 100.0 GIANT FOOD 55,108 BALTIMORE 2014 90,903 100.0 GIANT FOOD 56,892 BALTIMORE 2013 90,830 98.3 GIANT FOOD 43,136 BEL AIR 2014 130,176 94.1 SAFEWAY 55,032 CVS 10,125 DOLLAR TREE 10,000 CLARKSVILLE 2014 105,907 98.6 GIANT FOOD 62,943 CLINTON 2003 29,027 91.0 PLANET FITNESS 26,412 COLUMBIA 2012 75,000 100.0 MICHAELS 26,706 HOME GOODS 23,294 COLUMBIA 2015 273,421 100.0 TOYS R US/BABIES R US 63,062 NORDSTROM RACK 40,750 TJ MAXX 30,600 COLUMBIA (5) 2015 98,403 100.0 GIANT FOOD 57,994 COLUMBIA 2014 98,399 100.0 HARRIS TEETER 56,905 COLUMBIA 2015 91,165 100.0 SAFEWAY 55,164
COLUMBIA (5) 2002 54,539 90.7 DAVID'S NATURAL MARKET 15,079 CVS 13,225
DISTRICT HEIGHTS 2015 90,929 100.0 GIANT FOOD 64,333 EASTON 2014 113,330 98.9 GIANT FOOD 64,885 DOLLAR TREE 10,000 ELLICOTT CITY 2015 86,456 94.0 GIANT FOOD 55,000 ELLICOTT CITY 2014 139,898 97.9 SAFEWAY 50,093 PETCO 12,400 ELLICOTT CITY PRU 2007 433,467 100.0 TARGET 146,773 KOHL'S 106,889 SAFEWAY 55,164 FREDERICK 2003 86,968 100.0 GIANT FOOD 56,166
GAITHERSBURG 1999 88,277 93.2 FLOOR & DECOR 60,102 MATTRESS & FURNITURE MART 10,026
HUNT VALLEY 2008 94,653 91.2 GIANT FOOD 55,330 LAUREL 1964 161,474 100.0 VILLAGE THRIFT 81,550 PLANET FITNESS 21,000 DOLLAR TREE 13,253 NORTH EAST 2014 87,006 90.3 FOOD LION 38,372 OWINGS MILLS (2) 2015 PASADENA OJV 2003 38,766 100.0 DAVITA 10,496 PERRY HALL 2003 173,475 89.2 BRUNSWICK BOWLING 40,544 RITE AID 21,250 ACE HARDWARE 18,704 PERRY HALL 2014 65,059 100.0 GIANT FOOD 56,848 PIKESVILLE 2011 105,530 94.9 GIANT FOOD 63,529 TIMONIUM 2014 59,799 89.1 AMERICAN RADIOLOGY 13,573 TIMONIUM 2003 183,665 96.6 GIANT FOOD 61,941 STAPLES 15,000 TOWSON 2014 88,405 100.0 SAFEWAY 59,180 AAA MID-ATLANTIC 11,500 CVS 10,125 TOWSON 2012 679,843 100.0 WALMART 154,828 TARGET 132,608 WEIS MARKETS 55,452
MASSACHUSETTS ABINGTON 2014 102,000 100.0 LOWE'S HOME CENTER 102,000 BRIGHTON 2014 27,550 100.0 BGH II, LP 20,350 CAMBRIDGE 2014 62,555 100.0 MICRO CENTER 41,724 TRADER JOE'S 11,065 CHATHAM 2014 24,432 100.0 OCEAN STATE JOB LOT 24,432
DORCHESTER 2014 84,470 100.0 NATIONAL WHOLESALE LIQUIDATORS 84,470
EVERETT 2014 41,278 100.0 WALGREENS 14,707 FALL RIVER 2014 30,897 100.0 STAPLES 24,000 FALMOUTH 2014 78,642 85.1 STAPLES 24,652 DOLLAR TREE 11,200 PETCO 11,156 FRAMINGHAM 2014 26,482 100.0 GREAT BARRINGTON 1994 131,102 100.0 KMART 52,486 PRICE CHOPPER 44,667 HYANNIS 2014 231,546 96.7 SHAW'S SUPERMARKET 54,712 TOYS R US/BABIES R US 46,932 HOME GOODS 24,904 MEDFORD 2014 56,215 100.0 OFF BROADWAY SHOE 22,478 ALDI 21,952 PITTSFIELD 2014 72,014 92.3 STOP & SHOP 61,935
121
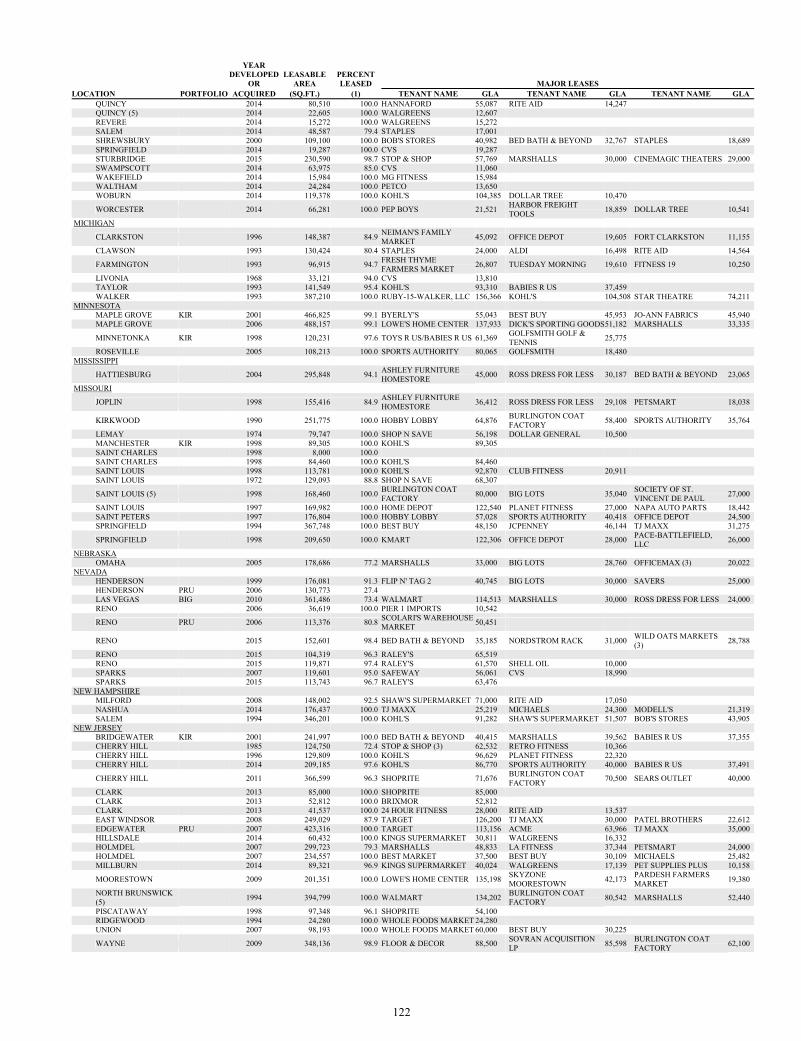
YEAR
DEVELOPED OR
LEASABLE AREA
PERCENT LEASED MAJOR LEASES
LOCATION PORTFOLIO ACQUIRED (SQ.FT.) (1) TENANT NAME GLA TENANT NAME GLA TENANT NAME GLA QUINCY 2014 80,510 100.0 HANNAFORD 55,087 RITE AID 14,247 QUINCY (5) 2014 22,605 100.0 WALGREENS 12,607 REVERE 2014 15,272 100.0 WALGREENS 15,272 SALEM 2014 48,587 79.4 STAPLES 17,001 SHREWSBURY 2000 109,100 100.0 BOB'S STORES 40,982 BED BATH & BEYOND 32,767 STAPLES 18,689 SPRINGFIELD 2014 19,287 100.0 CVS 19,287 STURBRIDGE 2015 230,590 98.7 STOP & SHOP 57,769 MARSHALLS 30,000 CINEMAGIC THEATERS 29,000 SWAMPSCOTT 2014 63,975 85.0 CVS 11,060 WAKEFIELD 2014 15,984 100.0 MG FITNESS 15,984 WALTHAM 2014 24,284 100.0 PETCO 13,650 WOBURN 2014 119,378 100.0 KOHL'S 104,385 DOLLAR TREE 10,470
WORCESTER 2014 66,281 100.0 PEP BOYS 21,521 HARBOR FREIGHT TOOLS 18,859 DOLLAR TREE 10,541
MICHIGAN
CLARKSTON 1996 148,387 84.9 NEIMAN'S FAMILY MARKET 45,092 OFFICE DEPOT 19,605 FORT CLARKSTON 11,155
CLAWSON 1993 130,424 80.4 STAPLES 24,000 ALDI 16,498 RITE AID 14,564
FARMINGTON 1993 96,915 94.7 FRESH THYME FARMERS MARKET 26,807 TUESDAY MORNING 19,610 FITNESS 19 10,250
LIVONIA 1968 33,121 94.0 CVS 13,810 TAYLOR 1993 141,549 95.4 KOHL'S 93,310 BABIES R US 37,459 WALKER 1993 387,210 100.0 RUBY-15-WALKER, LLC 156,366 KOHL'S 104,508 STAR THEATRE 74,211
MINNESOTA MAPLE GROVE KIR 2001 466,825 99.1 BYERLY'S 55,043 BEST BUY 45,953 JO-ANN FABRICS 45,940 MAPLE GROVE 2006 488,157 99.1 LOWE'S HOME CENTER 137,933 DICK'S SPORTING GOODS 51,182 MARSHALLS 33,335
MINNETONKA KIR 1998 120,231 97.6 TOYS R US/BABIES R US 61,369 GOLFSMITH GOLF & TENNIS 25,775
ROSEVILLE 2005 108,213 100.0 SPORTS AUTHORITY 80,065 GOLFSMITH 18,480 MISSISSIPPI
HATTIESBURG 2004 295,848 94.1 ASHLEY FURNITURE HOMESTORE 45,000 ROSS DRESS FOR LESS 30,187 BED BATH & BEYOND 23,065
MISSOURI
JOPLIN 1998 155,416 84.9 ASHLEY FURNITURE HOMESTORE 36,412 ROSS DRESS FOR LESS 29,108 PETSMART 18,038
KIRKWOOD 1990 251,775 100.0 HOBBY LOBBY 64,876 BURLINGTON COAT FACTORY 58,400 SPORTS AUTHORITY 35,764
LEMAY 1974 79,747 100.0 SHOP N SAVE 56,198 DOLLAR GENERAL 10,500 MANCHESTER KIR 1998 89,305 100.0 KOHL'S 89,305 SAINT CHARLES 1998 8,000 100.0 SAINT CHARLES 1998 84,460 100.0 KOHL'S 84,460 SAINT LOUIS 1998 113,781 100.0 KOHL'S 92,870 CLUB FITNESS 20,911 SAINT LOUIS 1972 129,093 88.8 SHOP N SAVE 68,307
SAINT LOUIS (5) 1998 168,460 100.0 BURLINGTON COAT FACTORY 80,000 BIG LOTS 35,040 SOCIETY OF ST.
VINCENT DE PAUL 27,000
SAINT LOUIS 1997 169,982 100.0 HOME DEPOT 122,540 PLANET FITNESS 27,000 NAPA AUTO PARTS 18,442 SAINT PETERS 1997 176,804 100.0 HOBBY LOBBY 57,028 SPORTS AUTHORITY 40,418 OFFICE DEPOT 24,500 SPRINGFIELD 1994 367,748 100.0 BEST BUY 48,150 JCPENNEY 46,144 TJ MAXX 31,275
SPRINGFIELD 1998 209,650 100.0 KMART 122,306 OFFICE DEPOT 28,000 PACE-BATTLEFIELD, LLC 26,000
NEBRASKA OMAHA 2005 178,686 77.2 MARSHALLS 33,000 BIG LOTS 28,760 OFFICEMAX (3) 20,022
NEVADA HENDERSON 1999 176,081 91.3 FLIP N' TAG 2 40,745 BIG LOTS 30,000 SAVERS 25,000 HENDERSON PRU 2006 130,773 27.4 LAS VEGAS BIG 2010 361,486 73.4 WALMART 114,513 MARSHALLS 30,000 ROSS DRESS FOR LESS 24,000 RENO 2006 36,619 100.0 PIER 1 IMPORTS 10,542
RENO PRU 2006 113,376 80.8 SCOLARI'S WAREHOUSE MARKET 50,451
RENO 2015 152,601 98.4 BED BATH & BEYOND 35,185 NORDSTROM RACK 31,000 WILD OATS MARKETS (3) 28,788
RENO 2015 104,319 96.3 RALEY'S 65,519 RENO 2015 119,871 97.4 RALEY'S 61,570 SHELL OIL 10,000 SPARKS 2007 119,601 95.0 SAFEWAY 56,061 CVS 18,990 SPARKS 2015 113,743 96.7 RALEY'S 63,476
NEW HAMPSHIRE MILFORD 2008 148,002 92.5 SHAW'S SUPERMARKET 71,000 RITE AID 17,050 NASHUA 2014 176,437 100.0 TJ MAXX 25,219 MICHAELS 24,300 MODELL'S 21,319 SALEM 1994 346,201 100.0 KOHL'S 91,282 SHAW'S SUPERMARKET 51,507 BOB'S STORES 43,905
NEW JERSEY BRIDGEWATER KIR 2001 241,997 100.0 BED BATH & BEYOND 40,415 MARSHALLS 39,562 BABIES R US 37,355 CHERRY HILL 1985 124,750 72.4 STOP & SHOP (3) 62,532 RETRO FITNESS 10,366 CHERRY HILL 1996 129,809 100.0 KOHL'S 96,629 PLANET FITNESS 22,320 CHERRY HILL 2014 209,185 97.6 KOHL'S 86,770 SPORTS AUTHORITY 40,000 BABIES R US 37,491
CHERRY HILL 2011 366,599 96.3 SHOPRITE 71,676 BURLINGTON COAT FACTORY 70,500 SEARS OUTLET 40,000
CLARK 2013 85,000 100.0 SHOPRITE 85,000 CLARK 2013 52,812 100.0 BRIXMOR 52,812 CLARK 2013 41,537 100.0 24 HOUR FITNESS 28,000 RITE AID 13,537 EAST WINDSOR 2008 249,029 87.9 TARGET 126,200 TJ MAXX 30,000 PATEL BROTHERS 22,612 EDGEWATER PRU 2007 423,316 100.0 TARGET 113,156 ACME 63,966 TJ MAXX 35,000 HILLSDALE 2014 60,432 100.0 KINGS SUPERMARKET 30,811 WALGREENS 16,332 HOLMDEL 2007 299,723 79.3 MARSHALLS 48,833 LA FITNESS 37,344 PETSMART 24,000 HOLMDEL 2007 234,557 100.0 BEST MARKET 37,500 BEST BUY 30,109 MICHAELS 25,482 MILLBURN 2014 89,321 96.9 KINGS SUPERMARKET 40,024 WALGREENS 17,139 PET SUPPLIES PLUS 10,158
MOORESTOWN 2009 201,351 100.0 LOWE'S HOME CENTER 135,198 SKYZONE MOORESTOWN 42,173 PARDESH FARMERS
MARKET 19,380
NORTH BRUNSWICK (5) 1994 394,799 100.0 WALMART 134,202 BURLINGTON COAT
FACTORY 80,542 MARSHALLS 52,440
PISCATAWAY 1998 97,348 96.1 SHOPRITE 54,100 RIDGEWOOD 1994 24,280 100.0 WHOLE FOODS MARKET 24,280 UNION 2007 98,193 100.0 WHOLE FOODS MARKET 60,000 BEST BUY 30,225
WAYNE 2009 348,136 98.9 FLOOR & DECOR 88,500 SOVRAN ACQUISITION LP 85,598 BURLINGTON COAT
FACTORY 62,100
122
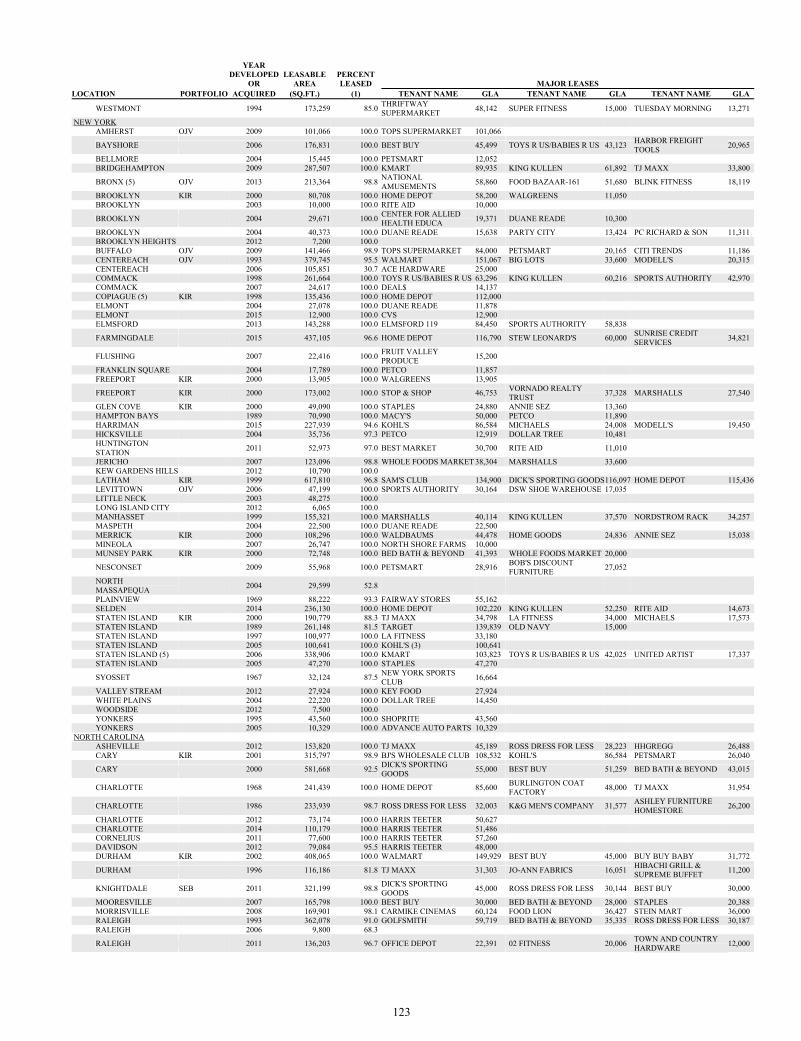
YEAR
DEVELOPED OR
LEASABLE AREA
PERCENT LEASED MAJOR LEASES
LOCATION PORTFOLIO ACQUIRED (SQ.FT.) (1) TENANT NAME GLA TENANT NAME GLA TENANT NAME GLA
WESTMONT 1994 173,259 85.0 THRIFTWAY SUPERMARKET 48,142 SUPER FITNESS 15,000 TUESDAY MORNING 13,271
NEW YORK AMHERST OJV 2009 101,066 100.0 TOPS SUPERMARKET 101,066
BAYSHORE 2006 176,831 100.0 BEST BUY 45,499 TOYS R US/BABIES R US 43,123 HARBOR FREIGHT TOOLS 20,965
BELLMORE 2004 15,445 100.0 PETSMART 12,052 BRIDGEHAMPTON 2009 287,507 100.0 KMART 89,935 KING KULLEN 61,892 TJ MAXX 33,800
BRONX (5) OJV 2013 213,364 98.8 NATIONAL AMUSEMENTS 58,860 FOOD BAZAAR-161 51,680 BLINK FITNESS 18,119
BROOKLYN KIR 2000 80,708 100.0 HOME DEPOT 58,200 WALGREENS 11,050 BROOKLYN 2003 10,000 100.0 RITE AID 10,000
BROOKLYN 2004 29,671 100.0 CENTER FOR ALLIED HEALTH EDUCA 19,371 DUANE READE 10,300
BROOKLYN 2004 40,373 100.0 DUANE READE 15,638 PARTY CITY 13,424 PC RICHARD & SON 11,311 BROOKLYN HEIGHTS 2012 7,200 100.0 BUFFALO OJV 2009 141,466 98.9 TOPS SUPERMARKET 84,000 PETSMART 20,165 CITI TRENDS 11,186 CENTEREACH OJV 1993 379,745 95.5 WALMART 151,067 BIG LOTS 33,600 MODELL'S 20,315 CENTEREACH 2006 105,851 30.7 ACE HARDWARE 25,000 COMMACK 1998 261,664 100.0 TOYS R US/BABIES R US 63,296 KING KULLEN 60,216 SPORTS AUTHORITY 42,970 COMMACK 2007 24,617 100.0 DEAL$ 14,137 COPIAGUE (5) KIR 1998 135,436 100.0 HOME DEPOT 112,000 ELMONT 2004 27,078 100.0 DUANE READE 11,878 ELMONT 2015 12,900 100.0 CVS 12,900 ELMSFORD 2013 143,288 100.0 ELMSFORD 119 84,450 SPORTS AUTHORITY 58,838
FARMINGDALE 2015 437,105 96.6 HOME DEPOT 116,790 STEW LEONARD'S 60,000 SUNRISE CREDIT SERVICES 34,821
FLUSHING 2007 22,416 100.0 FRUIT VALLEY PRODUCE 15,200
FRANKLIN SQUARE 2004 17,789 100.0 PETCO 11,857 FREEPORT KIR 2000 13,905 100.0 WALGREENS 13,905
FREEPORT KIR 2000 173,002 100.0 STOP & SHOP 46,753 VORNADO REALTY TRUST 37,328 MARSHALLS 27,540
GLEN COVE KIR 2000 49,090 100.0 STAPLES 24,880 ANNIE SEZ 13,360 HAMPTON BAYS 1989 70,990 100.0 MACY'S 50,000 PETCO 11,890 HARRIMAN 2015 227,939 94.6 KOHL'S 86,584 MICHAELS 24,008 MODELL'S 19,450 HICKSVILLE 2004 35,736 97.3 PETCO 12,919 DOLLAR TREE 10,481 HUNTINGTON STATION 2011 52,973 97.0 BEST MARKET 30,700 RITE AID 11,010
JERICHO 2007 123,096 98.8 WHOLE FOODS MARKET 38,304 MARSHALLS 33,600 KEW GARDENS HILLS 2012 10,790 100.0 LATHAM KIR 1999 617,810 96.8 SAM'S CLUB 134,900 DICK'S SPORTING GOODS 116,097 HOME DEPOT 115,436 LEVITTOWN OJV 2006 47,199 100.0 SPORTS AUTHORITY 30,164 DSW SHOE WAREHOUSE 17,035 LITTLE NECK 2003 48,275 100.0 LONG ISLAND CITY 2012 6,065 100.0 MANHASSET 1999 155,321 100.0 MARSHALLS 40,114 KING KULLEN 37,570 NORDSTROM RACK 34,257 MASPETH 2004 22,500 100.0 DUANE READE 22,500 MERRICK KIR 2000 108,296 100.0 WALDBAUMS 44,478 HOME GOODS 24,836 ANNIE SEZ 15,038 MINEOLA 2007 26,747 100.0 NORTH SHORE FARMS 10,000 MUNSEY PARK KIR 2000 72,748 100.0 BED BATH & BEYOND 41,393 WHOLE FOODS MARKET 20,000
NESCONSET 2009 55,968 100.0 PETSMART 28,916 BOB'S DISCOUNT FURNITURE 27,052
NORTH MASSAPEQUA 2004 29,599 52.8
PLAINVIEW 1969 88,222 93.3 FAIRWAY STORES 55,162 SELDEN 2014 236,130 100.0 HOME DEPOT 102,220 KING KULLEN 52,250 RITE AID 14,673 STATEN ISLAND KIR 2000 190,779 88.3 TJ MAXX 34,798 LA FITNESS 34,000 MICHAELS 17,573 STATEN ISLAND 1989 261,148 81.5 TARGET 139,839 OLD NAVY 15,000 STATEN ISLAND 1997 100,977 100.0 LA FITNESS 33,180 STATEN ISLAND 2005 100,641 100.0 KOHL'S (3) 100,641 STATEN ISLAND (5) 2006 338,906 100.0 KMART 103,823 TOYS R US/BABIES R US 42,025 UNITED ARTIST 17,337 STATEN ISLAND 2005 47,270 100.0 STAPLES 47,270
SYOSSET 1967 32,124 87.5 NEW YORK SPORTS CLUB 16,664
VALLEY STREAM 2012 27,924 100.0 KEY FOOD 27,924 WHITE PLAINS 2004 22,220 100.0 DOLLAR TREE 14,450 WOODSIDE 2012 7,500 100.0 YONKERS 1995 43,560 100.0 SHOPRITE 43,560 YONKERS 2005 10,329 100.0 ADVANCE AUTO PARTS 10,329
NORTH CAROLINA ASHEVILLE 2012 153,820 100.0 TJ MAXX 45,189 ROSS DRESS FOR LESS 28,223 HHGREGG 26,488 CARY KIR 2001 315,797 98.9 BJ'S WHOLESALE CLUB 108,532 KOHL'S 86,584 PETSMART 26,040
CARY 2000 581,668 92.5 DICK'S SPORTING GOODS 55,000 BEST BUY 51,259 BED BATH & BEYOND 43,015
CHARLOTTE 1968 241,439 100.0 HOME DEPOT 85,600 BURLINGTON COAT FACTORY 48,000 TJ MAXX 31,954
CHARLOTTE 1986 233,939 98.7 ROSS DRESS FOR LESS 32,003 K&G MEN'S COMPANY 31,577 ASHLEY FURNITURE HOMESTORE 26,200
CHARLOTTE 2012 73,174 100.0 HARRIS TEETER 50,627 CHARLOTTE 2014 110,179 100.0 HARRIS TEETER 51,486 CORNELIUS 2011 77,600 100.0 HARRIS TEETER 57,260 DAVIDSON 2012 79,084 95.5 HARRIS TEETER 48,000 DURHAM KIR 2002 408,065 100.0 WALMART 149,929 BEST BUY 45,000 BUY BUY BABY 31,772
DURHAM 1996 116,186 81.8 TJ MAXX 31,303 JO-ANN FABRICS 16,051 HIBACHI GRILL & SUPREME BUFFET 11,200
KNIGHTDALE SEB 2011 321,199 98.8 DICK'S SPORTING GOODS 45,000 ROSS DRESS FOR LESS 30,144 BEST BUY 30,000
MOORESVILLE 2007 165,798 100.0 BEST BUY 30,000 BED BATH & BEYOND 28,000 STAPLES 20,388 MORRISVILLE 2008 169,901 98.1 CARMIKE CINEMAS 60,124 FOOD LION 36,427 STEIN MART 36,000 RALEIGH 1993 362,078 91.0 GOLFSMITH 59,719 BED BATH & BEYOND 35,335 ROSS DRESS FOR LESS 30,187 RALEIGH 2006 9,800 68.3
RALEIGH 2011 136,203 96.7 OFFICE DEPOT 22,391 02 FITNESS 20,006 TOWN AND COUNTRY HARDWARE 12,000
123
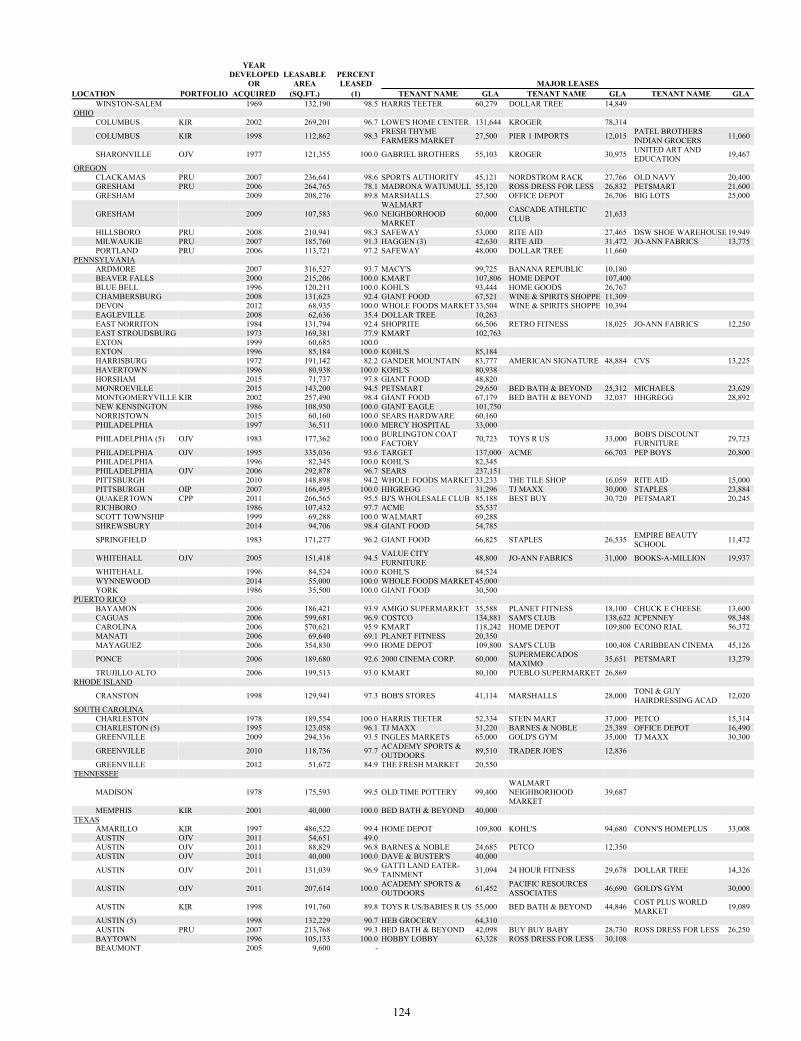
YEAR
DEVELOPED OR
LEASABLE AREA
PERCENT LEASED MAJOR LEASES
LOCATION PORTFOLIO ACQUIRED (SQ.FT.) (1) TENANT NAME GLA TENANT NAME GLA TENANT NAME GLA WINSTON-SALEM 1969 132,190 98.5 HARRIS TEETER 60,279 DOLLAR TREE 14,849
OHIO COLUMBUS KIR 2002 269,201 96.7 LOWE'S HOME CENTER 131,644 KROGER 78,314
COLUMBUS KIR 1998 112,862 98.3 FRESH THYME FARMERS MARKET 27,500 PIER 1 IMPORTS 12,015 PATEL BROTHERS
INDIAN GROCERS 11,060
SHARONVILLE OJV 1977 121,355 100.0 GABRIEL BROTHERS 55,103 KROGER 30,975 UNITED ART AND EDUCATION 19,467
OREGON CLACKAMAS PRU 2007 236,641 98.6 SPORTS AUTHORITY 45,121 NORDSTROM RACK 27,766 OLD NAVY 20,400 GRESHAM PRU 2006 264,765 78.1 MADRONA WATUMULL 55,120 ROSS DRESS FOR LESS 26,832 PETSMART 21,600 GRESHAM 2009 208,276 89.8 MARSHALLS 27,500 OFFICE DEPOT 26,706 BIG LOTS 25,000
GRESHAM 2009 107,583 96.0 WALMART NEIGHBORHOOD MARKET
60,000 CASCADE ATHLETIC CLUB 21,633
HILLSBORO PRU 2008 210,941 98.3 SAFEWAY 53,000 RITE AID 27,465 DSW SHOE WAREHOUSE 19,949 MILWAUKIE PRU 2007 185,760 91.3 HAGGEN (3) 42,630 RITE AID 31,472 JO-ANN FABRICS 13,775 PORTLAND PRU 2006 113,721 97.2 SAFEWAY 48,000 DOLLAR TREE 11,660
PENNSYLVANIA ARDMORE 2007 316,527 93.7 MACY'S 99,725 BANANA REPUBLIC 10,180 BEAVER FALLS 2000 215,206 100.0 KMART 107,806 HOME DEPOT 107,400 BLUE BELL 1996 120,211 100.0 KOHL'S 93,444 HOME GOODS 26,767 CHAMBERSBURG 2008 131,623 92.4 GIANT FOOD 67,521 WINE & SPIRITS SHOPPE 11,309 DEVON 2012 68,935 100.0 WHOLE FOODS MARKET 33,504 WINE & SPIRITS SHOPPE 10,394 EAGLEVILLE 2008 62,636 35.4 DOLLAR TREE 10,263 EAST NORRITON 1984 131,794 92.4 SHOPRITE 66,506 RETRO FITNESS 18,025 JO-ANN FABRICS 12,250 EAST STROUDSBURG 1973 169,381 77.9 KMART 102,763 EXTON 1999 60,685 100.0 EXTON 1996 85,184 100.0 KOHL'S 85,184 HARRISBURG 1972 191,142 82.2 GANDER MOUNTAIN 83,777 AMERICAN SIGNATURE 48,884 CVS 13,225 HAVERTOWN 1996 80,938 100.0 KOHL'S 80,938 HORSHAM 2015 71,737 97.8 GIANT FOOD 48,820 MONROEVILLE 2015 143,200 94.5 PETSMART 29,650 BED BATH & BEYOND 25,312 MICHAELS 23,629 MONTGOMERYVILLE KIR 2002 257,490 98.4 GIANT FOOD 67,179 BED BATH & BEYOND 32,037 HHGREGG 28,892 NEW KENSINGTON 1986 108,950 100.0 GIANT EAGLE 101,750 NORRISTOWN 2015 60,160 100.0 SEARS HARDWARE 60,160 PHILADELPHIA 1997 36,511 100.0 MERCY HOSPITAL 33,000
PHILADELPHIA (5) OJV 1983 177,362 100.0 BURLINGTON COAT FACTORY 70,723 TOYS R US 33,000 BOB'S DISCOUNT
FURNITURE 29,723
PHILADELPHIA OJV 1995 335,036 93.6 TARGET 137,000 ACME 66,703 PEP BOYS 20,800 PHILADELPHIA 1996 82,345 100.0 KOHL'S 82,345 PHILADELPHIA OJV 2006 292,878 96.7 SEARS 237,151 PITTSBURGH 2010 148,898 94.2 WHOLE FOODS MARKET 33,233 THE TILE SHOP 16,059 RITE AID 15,000 PITTSBURGH OIP 2007 166,495 100.0 HHGREGG 31,296 TJ MAXX 30,000 STAPLES 23,884 QUAKERTOWN CPP 2011 266,565 95.5 BJ'S WHOLESALE CLUB 85,188 BEST BUY 30,720 PETSMART 20,245 RICHBORO 1986 107,432 97.7 ACME 55,537 SCOTT TOWNSHIP 1999 69,288 100.0 WALMART 69,288 SHREWSBURY 2014 94,706 98.4 GIANT FOOD 54,785
SPRINGFIELD 1983 171,277 96.2 GIANT FOOD 66,825 STAPLES 26,535 EMPIRE BEAUTY SCHOOL 11,472
WHITEHALL OJV 2005 151,418 94.5 VALUE CITY FURNITURE 48,800 JO-ANN FABRICS 31,000 BOOKS-A-MILLION 19,937
WHITEHALL 1996 84,524 100.0 KOHL'S 84,524 WYNNEWOOD 2014 55,000 100.0 WHOLE FOODS MARKET 45,000 YORK 1986 35,500 100.0 GIANT FOOD 30,500
PUERTO RICO BAYAMON 2006 186,421 93.9 AMIGO SUPERMARKET 35,588 PLANET FITNESS 18,100 CHUCK E CHEESE 13,600 CAGUAS 2006 599,681 96.9 COSTCO 134,881 SAM'S CLUB 138,622 JCPENNEY 98,348 CAROLINA 2006 570,621 95.9 KMART 118,242 HOME DEPOT 109,800 ECONO RIAL 56,372 MANATI 2006 69,640 69.1 PLANET FITNESS 20,350 MAYAGUEZ 2006 354,830 99.0 HOME DEPOT 109,800 SAM'S CLUB 100,408 CARIBBEAN CINEMA 45,126
PONCE 2006 189,680 92.6 2000 CINEMA CORP. 60,000 SUPERMERCADOS MAXIMO 35,651 PETSMART 13,279
TRUJILLO ALTO 2006 199,513 93.0 KMART 80,100 PUEBLO SUPERMARKET 26,869 RHODE ISLAND
CRANSTON 1998 129,941 97.3 BOB'S STORES 41,114 MARSHALLS 28,000 TONI & GUY HAIRDRESSING ACAD 12,020
SOUTH CAROLINA CHARLESTON 1978 189,554 100.0 HARRIS TEETER 52,334 STEIN MART 37,000 PETCO 15,314 CHARLESTON (5) 1995 123,058 96.1 TJ MAXX 31,220 BARNES & NOBLE 25,389 OFFICE DEPOT 16,490 GREENVILLE 2009 294,336 93.5 INGLES MARKETS 65,000 GOLD'S GYM 35,000 TJ MAXX 30,300
GREENVILLE 2010 118,736 97.7 ACADEMY SPORTS & OUTDOORS 89,510 TRADER JOE'S 12,836
GREENVILLE 2012 51,672 84.9 THE FRESH MARKET 20,550 TENNESSEE
MADISON 1978 175,593 99.5 OLD TIME POTTERY 99,400 WALMART NEIGHBORHOOD MARKET
39,687
MEMPHIS KIR 2001 40,000 100.0 BED BATH & BEYOND 40,000 TEXAS
AMARILLO KIR 1997 486,522 99.4 HOME DEPOT 109,800 KOHL'S 94,680 CONN'S HOMEPLUS 33,008 AUSTIN OJV 2011 54,651 49.0 AUSTIN OJV 2011 88,829 96.8 BARNES & NOBLE 24,685 PETCO 12,350 AUSTIN OJV 2011 40,000 100.0 DAVE & BUSTER'S 40,000
AUSTIN OJV 2011 131,039 96.9 GATTI LAND EATER-TAINMENT 31,094 24 HOUR FITNESS 29,678 DOLLAR TREE 14,326
AUSTIN OJV 2011 207,614 100.0 ACADEMY SPORTS & OUTDOORS 61,452 PACIFIC RESOURCES
ASSOCIATES 46,690 GOLD'S GYM 30,000
AUSTIN KIR 1998 191,760 89.8 TOYS R US/BABIES R US 55,000 BED BATH & BEYOND 44,846 COST PLUS WORLD MARKET 19,089
AUSTIN (5) 1998 132,229 90.7 HEB GROCERY 64,310 AUSTIN PRU 2007 213,768 99.3 BED BATH & BEYOND 42,098 BUY BUY BABY 28,730 ROSS DRESS FOR LESS 26,250 BAYTOWN 1996 105,133 100.0 HOBBY LOBBY 63,328 ROSS DRESS FOR LESS 30,108 BEAUMONT 2005 9,600 -
124
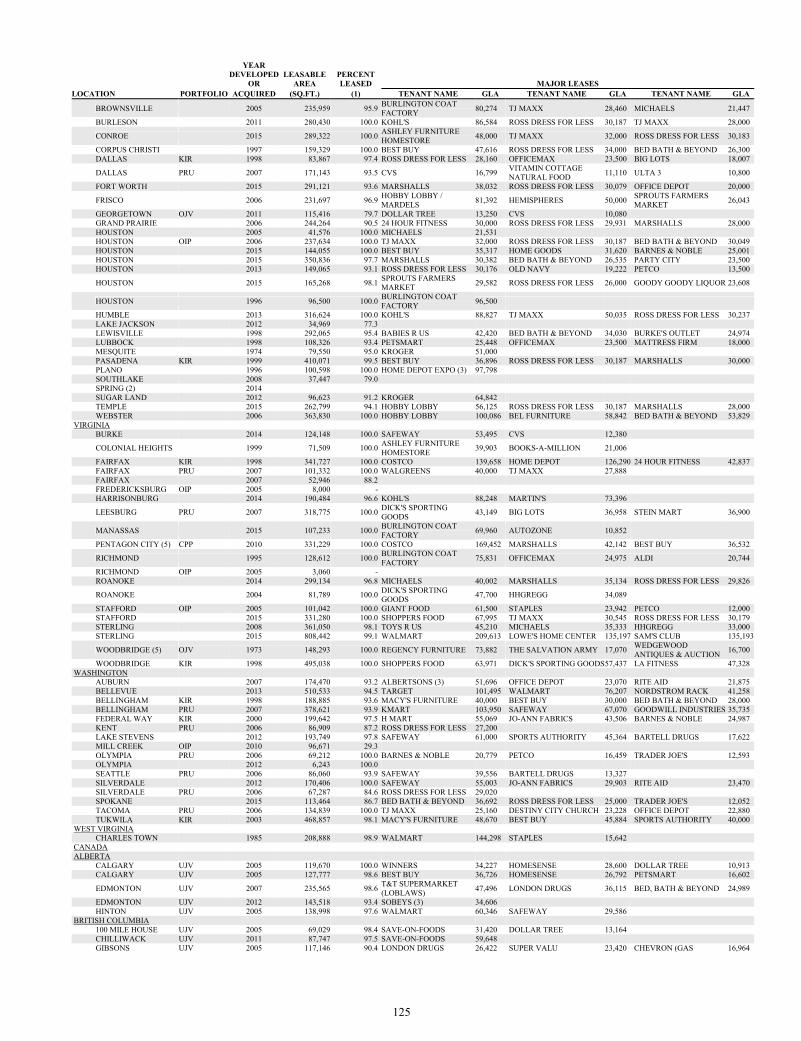
YEAR
DEVELOPED OR
LEASABLE AREA
PERCENT LEASED MAJOR LEASES
LOCATION PORTFOLIO ACQUIRED (SQ.FT.) (1) TENANT NAME GLA TENANT NAME GLA TENANT NAME GLA
BROWNSVILLE 2005 235,959 95.9 BURLINGTON COAT FACTORY 80,274 TJ MAXX 28,460 MICHAELS 21,447
BURLESON 2011 280,430 100.0 KOHL'S 86,584 ROSS DRESS FOR LESS 30,187 TJ MAXX 28,000
CONROE 2015 289,322 100.0 ASHLEY FURNITURE HOMESTORE 48,000 TJ MAXX 32,000 ROSS DRESS FOR LESS 30,183
CORPUS CHRISTI 1997 159,329 100.0 BEST BUY 47,616 ROSS DRESS FOR LESS 34,000 BED BATH & BEYOND 26,300 DALLAS KIR 1998 83,867 97.4 ROSS DRESS FOR LESS 28,160 OFFICEMAX 23,500 BIG LOTS 18,007
DALLAS PRU 2007 171,143 93.5 CVS 16,799 VITAMIN COTTAGE NATURAL FOOD 11,110 ULTA 3 10,800
FORT WORTH 2015 291,121 93.6 MARSHALLS 38,032 ROSS DRESS FOR LESS 30,079 OFFICE DEPOT 20,000
FRISCO 2006 231,697 96.9 HOBBY LOBBY / MARDELS 81,392 HEMISPHERES 50,000 SPROUTS FARMERS
MARKET 26,043
GEORGETOWN OJV 2011 115,416 79.7 DOLLAR TREE 13,250 CVS 10,080 GRAND PRAIRIE 2006 244,264 90.5 24 HOUR FITNESS 30,000 ROSS DRESS FOR LESS 29,931 MARSHALLS 28,000 HOUSTON 2005 41,576 100.0 MICHAELS 21,531 HOUSTON OIP 2006 237,634 100.0 TJ MAXX 32,000 ROSS DRESS FOR LESS 30,187 BED BATH & BEYOND 30,049 HOUSTON 2015 144,055 100.0 BEST BUY 35,317 HOME GOODS 31,620 BARNES & NOBLE 25,001 HOUSTON 2015 350,836 97.7 MARSHALLS 30,382 BED BATH & BEYOND 26,535 PARTY CITY 23,500 HOUSTON 2013 149,065 93.1 ROSS DRESS FOR LESS 30,176 OLD NAVY 19,222 PETCO 13,500
HOUSTON 2015 165,268 98.1 SPROUTS FARMERS MARKET 29,582 ROSS DRESS FOR LESS 26,000 GOODY GOODY LIQUOR 23,608
HOUSTON 1996 96,500 100.0 BURLINGTON COAT FACTORY 96,500
HUMBLE 2013 316,624 100.0 KOHL'S 88,827 TJ MAXX 50,035 ROSS DRESS FOR LESS 30,237 LAKE JACKSON 2012 34,969 77.3 LEWISVILLE 1998 292,065 95.4 BABIES R US 42,420 BED BATH & BEYOND 34,030 BURKE'S OUTLET 24,974 LUBBOCK 1998 108,326 93.4 PETSMART 25,448 OFFICEMAX 23,500 MATTRESS FIRM 18,000 MESQUITE 1974 79,550 95.0 KROGER 51,000 PASADENA KIR 1999 410,071 99.5 BEST BUY 36,896 ROSS DRESS FOR LESS 30,187 MARSHALLS 30,000 PLANO 1996 100,598 100.0 HOME DEPOT EXPO (3) 97,798 SOUTHLAKE 2008 37,447 79.0 SPRING (2) 2014 SUGAR LAND 2012 96,623 91.2 KROGER 64,842 TEMPLE 2015 262,799 94.1 HOBBY LOBBY 56,125 ROSS DRESS FOR LESS 30,187 MARSHALLS 28,000 WEBSTER 2006 363,830 100.0 HOBBY LOBBY 100,086 BEL FURNITURE 58,842 BED BATH & BEYOND 53,829
VIRGINIA BURKE 2014 124,148 100.0 SAFEWAY 53,495 CVS 12,380
COLONIAL HEIGHTS 1999 71,509 100.0 ASHLEY FURNITURE HOMESTORE 39,903 BOOKS-A-MILLION 21,006
FAIRFAX KIR 1998 341,727 100.0 COSTCO 139,658 HOME DEPOT 126,290 24 HOUR FITNESS 42,837 FAIRFAX PRU 2007 101,332 100.0 WALGREENS 40,000 TJ MAXX 27,888 FAIRFAX 2007 52,946 88.2 FREDERICKSBURG OIP 2005 8,000 - HARRISONBURG 2014 190,484 96.6 KOHL'S 88,248 MARTIN'S 73,396
LEESBURG PRU 2007 318,775 100.0 DICK'S SPORTING GOODS 43,149 BIG LOTS 36,958 STEIN MART 36,900
MANASSAS 2015 107,233 100.0 BURLINGTON COAT FACTORY 69,960 AUTOZONE 10,852
PENTAGON CITY (5) CPP 2010 331,229 100.0 COSTCO 169,452 MARSHALLS 42,142 BEST BUY 36,532
RICHMOND 1995 128,612 100.0 BURLINGTON COAT FACTORY 75,831 OFFICEMAX 24,975 ALDI 20,744
RICHMOND OIP 2005 3,060 - ROANOKE 2014 299,134 96.8 MICHAELS 40,002 MARSHALLS 35,134 ROSS DRESS FOR LESS 29,826
ROANOKE 2004 81,789 100.0 DICK'S SPORTING GOODS 47,700 HHGREGG 34,089
STAFFORD OIP 2005 101,042 100.0 GIANT FOOD 61,500 STAPLES 23,942 PETCO 12,000 STAFFORD 2015 331,280 100.0 SHOPPERS FOOD 67,995 TJ MAXX 30,545 ROSS DRESS FOR LESS 30,179 STERLING 2008 361,050 98.1 TOYS R US 45,210 MICHAELS 35,333 HHGREGG 33,000 STERLING 2015 808,442 99.1 WALMART 209,613 LOWE'S HOME CENTER 135,197 SAM'S CLUB 135,193
WOODBRIDGE (5) OJV 1973 148,293 100.0 REGENCY FURNITURE 73,882 THE SALVATION ARMY 17,070 WEDGEWOOD ANTIQUES & AUCTION 16,700
WOODBRIDGE KIR 1998 495,038 100.0 SHOPPERS FOOD 63,971 DICK'S SPORTING GOODS 57,437 LA FITNESS 47,328 WASHINGTON
AUBURN 2007 174,470 93.2 ALBERTSONS (3) 51,696 OFFICE DEPOT 23,070 RITE AID 21,875 BELLEVUE 2013 510,533 94.5 TARGET 101,495 WALMART 76,207 NORDSTROM RACK 41,258 BELLINGHAM KIR 1998 188,885 93.6 MACY'S FURNITURE 40,000 BEST BUY 30,000 BED BATH & BEYOND 28,000 BELLINGHAM PRU 2007 378,621 93.9 KMART 103,950 SAFEWAY 67,070 GOODWILL INDUSTRIES 35,735 FEDERAL WAY KIR 2000 199,642 97.5 H MART 55,069 JO-ANN FABRICS 43,506 BARNES & NOBLE 24,987 KENT PRU 2006 86,909 87.2 ROSS DRESS FOR LESS 27,200 LAKE STEVENS 2012 193,749 97.8 SAFEWAY 61,000 SPORTS AUTHORITY 45,364 BARTELL DRUGS 17,622 MILL CREEK OIP 2010 96,671 29.3 OLYMPIA PRU 2006 69,212 100.0 BARNES & NOBLE 20,779 PETCO 16,459 TRADER JOE'S 12,593 OLYMPIA 2012 6,243 100.0 SEATTLE PRU 2006 86,060 93.9 SAFEWAY 39,556 BARTELL DRUGS 13,327 SILVERDALE 2012 170,406 100.0 SAFEWAY 55,003 JO-ANN FABRICS 29,903 RITE AID 23,470 SILVERDALE PRU 2006 67,287 84.6 ROSS DRESS FOR LESS 29,020 SPOKANE 2015 113,464 86.7 BED BATH & BEYOND 36,692 ROSS DRESS FOR LESS 25,000 TRADER JOE'S 12,052 TACOMA PRU 2006 134,839 100.0 TJ MAXX 25,160 DESTINY CITY CHURCH 23,228 OFFICE DEPOT 22,880 TUKWILA KIR 2003 468,857 98.1 MACY'S FURNITURE 48,670 BEST BUY 45,884 SPORTS AUTHORITY 40,000
WEST VIRGINIA CHARLES TOWN 1985 208,888 98.9 WALMART 144,298 STAPLES 15,642
CANADA ALBERTA
CALGARY UJV 2005 119,670 100.0 WINNERS 34,227 HOMESENSE 28,600 DOLLAR TREE 10,913 CALGARY UJV 2005 127,777 98.6 BEST BUY 36,726 HOMESENSE 26,792 PETSMART 16,602
EDMONTON UJV 2007 235,565 98.6 T&T SUPERMARKET (LOBLAWS) 47,496 LONDON DRUGS 36,115 BED, BATH & BEYOND 24,989
EDMONTON UJV 2012 143,518 93.4 SOBEYS (3) 34,606 HINTON UJV 2005 138,998 97.6 WALMART 60,346 SAFEWAY 29,586
BRITISH COLUMBIA 100 MILE HOUSE UJV 2005 69,029 98.4 SAVE-ON-FOODS 31,420 DOLLAR TREE 13,164 CHILLIWACK UJV 2011 87,747 97.5 SAVE-ON-FOODS 59,648 GIBSONS UJV 2005 117,146 90.4 LONDON DRUGS 26,422 SUPER VALU 23,420 CHEVRON (GAS 16,964
125
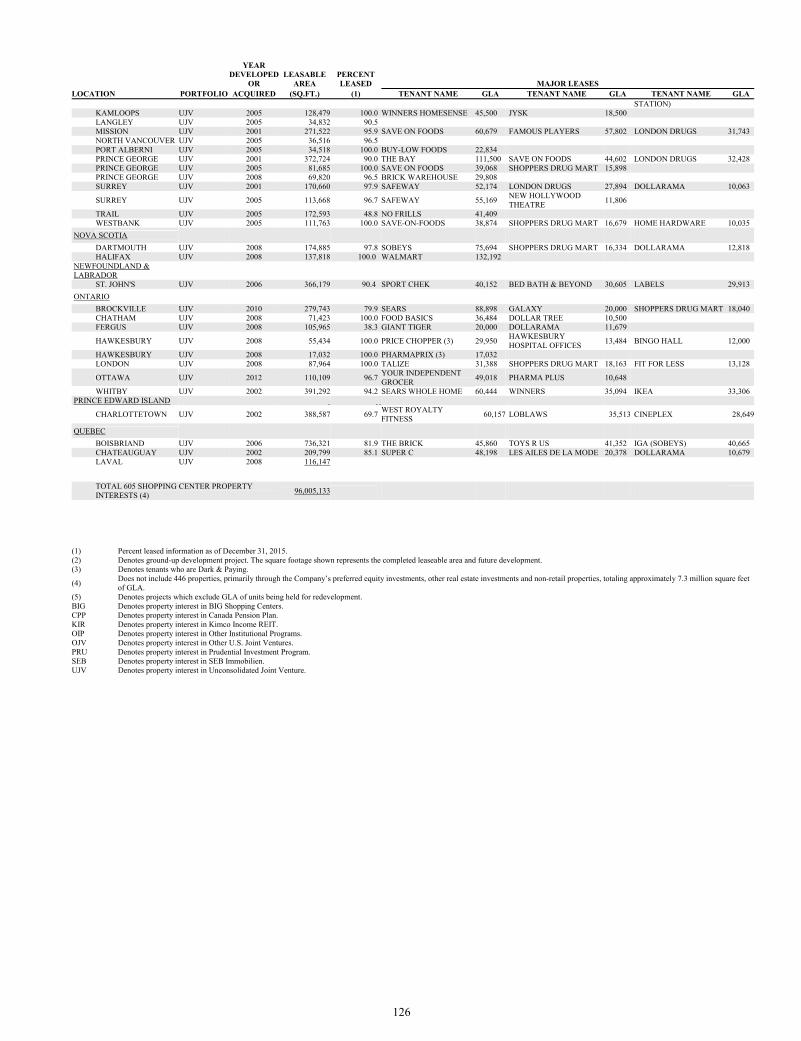
126
YEAR DEVELOPED
OR LEASABLE
AREA PERCENT LEASED MAJOR LEASES
LOCATION PORTFOLIO ACQUIRED (SQ.FT.) (1) TENANT NAME GLA TENANT NAME GLA TENANT NAME GLA STATION)
KAMLOOPS UJV 2005 128,479 100.0 WINNERS HOMESENSE 45,500 JYSK 18,500 LANGLEY UJV 2005 34,832 90.5 MISSION UJV 2001 271,522 95.9 SAVE ON FOODS 60,679 FAMOUS PLAYERS 57,802 LONDON DRUGS 31,743 NORTH VANCOUVER UJV 2005 36,516 96.5 PORT ALBERNI UJV 2005 34,518 100.0 BUY-LOW FOODS 22,834 PRINCE GEORGE UJV 2001 372,724 90.0 THE BAY 111,500 SAVE ON FOODS 44,602 LONDON DRUGS 32,428 PRINCE GEORGE UJV 2005 81,685 100.0 SAVE ON FOODS 39,068 SHOPPERS DRUG MART 15,898 PRINCE GEORGE UJV 2008 69,820 96.5 BRICK WAREHOUSE 29,808 SURREY UJV 2001 170,660 97.9 SAFEWAY 52,174 LONDON DRUGS 27,894 DOLLARAMA 10,063
SURREY UJV 2005 113,668 96.7 SAFEWAY 55,169 NEW HOLLYWOOD THEATRE 11,806
TRAIL UJV 2005 172,593 48.8 NO FRILLS 41,409 WESTBANK UJV 2005 111,763 100.0 SAVE-ON-FOODS 38,874 SHOPPERS DRUG MART 16,679 HOME HARDWARE 10,035
NOVA SCOTIADARTMOUTH UJV 2008 174,885 97.8 SOBEYS 75,694 SHOPPERS DRUG MART 16,334 DOLLARAMA 12,818 HALIFAX UJV 2008 137,818 100.0 WALMART 132,192
NEWFOUNDLAND & LABRADOR
ST. JOHN'S UJV 2006 366,179 90.4 SPORT CHEK 40,152 BED BATH & BEYOND 30,605 LABELS 29,913 ONTARIO
BROCKVILLE UJV 2010 279,743 79.9 SEARS 88,898 GALAXY 20,000 SHOPPERS DRUG MART 18,040 CHATHAM UJV 2008 71,423 100.0 FOOD BASICS 36,484 DOLLAR TREE 10,500 FERGUS UJV 2008 105,965 38.3 GIANT TIGER 20,000 DOLLARAMA 11,679
HAWKESBURY UJV 2008 55,434 100.0 PRICE CHOPPER (3) 29,950 HAWKESBURY HOSPITAL OFFICES 13,484 BINGO HALL 12,000
HAWKESBURY UJV 2008 17,032 100.0 PHARMAPRIX (3) 17,032 LONDON UJV 2008 87,964 100.0 TALIZE 31,388 SHOPPERS DRUG MART 18,163 FIT FOR LESS 13,128
OTTAWA UJV 2012 110,109 96.7 YOUR INDEPENDENT GROCER 49,018 PHARMA PLUS 10,648
WHITBY UJV 2002 391,292 94.2 SEARS WHOLE HOME 60,444 WINNERS 35,094 IKEA 33,306 PRINCE EDWARD ISLAND
CHARLOTTETOWN UJV 2002 388,587 69.7 WEST ROYALTY FITNESS 60,157 LOBLAWS 35,513 CINEPLEX 28,649
QUEBECBOISBRIAND UJV 2006 736,321 81.9 THE BRICK 45,860 TOYS R US 41,352 IGA (SOBEYS) 40,665 CHATEAUGUAY UJV 2002 209,799 85.1 SUPER C 48,198 LES AILES DE LA MODE 20,378 DOLLARAMA 10,679 LAVAL UJV 2008 116,147
TOTAL 605 SHOPPING CENTER PROPERTY INTERESTS (4) 96,005,133
(1) Percent leased information as of December 31, 2015. (2) Denotes ground-up development project. The square footage shown represents the completed leaseable area and future development. (3) Denotes tenants who are Dark & Paying.
(4) Does not include 446 properties, primarily through the Company’s preferred equity investments, other real estate investments and non-retail properties, totaling approximately 7.3 million square feet of GLA.
(5) Denotes projects which exclude GLA of units being held for redevelopment. BIG Denotes property interest in BIG Shopping Centers. CPP Denotes property interest in Canada Pension Plan. KIR Denotes property interest in Kimco Income REIT. OIP Denotes property interest in Other Institutional Programs. OJV Denotes property interest in Other U.S. Joint Ventures. PRU Denotes property interest in Prudential Investment Program. SEB Denotes property interest in SEB Immobilien. UJV Denotes property interest in Unconsolidated Joint Venture.

This page intentionally left blank.
JOB TITLE Kimco AR REVISION 4 SERIAL DATE Thursday, March 19, 2015 JOB NUMBER 279628 TYPE PAGE NO. 147 OPERATOR Joy D
<12345678>
CounselLatham & Watkins LLP New York, NY
AuditorsPricewaterhouseCoopers LLP New York, NY
Registrar and Transfer AgentWells Fargo Bank, N.A. Shareowner Services P.O. Box 64874 St. Paul, MN 55164-0854 1-866-557-8695 Website: www.shareowneronline.com
Stock ListingsNYSE—Symbols KIM, KIMprI KIMprJ, KIMprK
On May 11, 2015, the Company’s Chief Executive Officer submitted to the New York Stock Exchange the annual certifica-tion required by Section 303A.12(a) of the NYSE Company Manual. In addition, the Company has filed with the Securities and Exchange Commission as exhibits to its Form 10-K for the fiscal year ended December 31, 2015, the certifications, required pursuant to Section 302 of the Sarbanes-Oxley Act, of its Chief Executive Officer and Chief Financial Officer relating to the quality of its public disclosure.
Investor RelationsA copy of the Company’s Annual Report to the U.S. Securities and Exchange Commission on Form 10-K may be obtained at no cost to stockholders by writing to:David F. Bujnicki Vice President, Investor Relations & Corporate Communications Kimco Realty Corporation 3333 New Hyde Park Road New Hyde Park, NY 11042 1-866-831-4297 E-mail: [email protected]
Annual Meeting of StockholdersStockholders of Kimco Realty Corporation are cordially invited to attend the Annual Meeting of Stockholders scheduled to be held at 10:00 am on May 5, 2016, at Grand Hyatt New York 109 E 42nd Street New York, NY 10017.
Annual Report to StockholdersOur Annual Report on Form 10-K filed with the Securities and Exchange Commission (SEC) is included in our mailing to stock-holders and together with this 2015 Annual Report forms our annual report to stock-holders within the meaning of SEC rules.
Dividend Reinvestment and Common Stock Purchase PlanThe Company’s Dividend Reinvestment and Common Stock Purchase Plan pro-vides common and preferred stockhold-ers with an opportunity to conveniently and economically acquire Kimco common stock. Stockholders may have their divi-dends automatically directed to our trans-fer agent to purchase common shares without paying any brokerage commis-sions. Requests for booklets describing the Plan, enrollment forms and any cor-respondence or questions regarding the Plan should be directed to:Wells Fargo Bank, N.A. Shareowner Services P.O. Box 64874 St. Paul, MN 55164-0854 1-866-557-8695
Holders of RecordHolders of record of the Company’s common stock, par value $.01 per share, totaled 2,397 as of March 7, 2016.
Shareholder Information
Offices
Executive Offices
3333 New Hyde Park Road New Hyde Park, NY 11042 516-869-9000 www.kimcorealty.com
Regional OfficesMesa, AZ 480-461-0050
Daly City, CA 650-301-3000
Carmichael, CA 916-791-0600
Los Angeles, CA 310-284-6000
Tustin, CA 949-252-3880
Vista, CA 760-727-1002
Aurora, CO 720-870-1210
Wilton, CT203-761-8951
Hollywood, FL 954-923-8444
Orlando, FL 407-302-4400
Tampa, FL 727-536-3287
Rosemont, IL 847-299-1160
Newton, MA 617-933-2820
Timonium, MD 410-684-2000
Charlotte, NC 704-367-0131
Las Vegas, NV 702-258-4330
New York, NY 212-972-7456
Portland, OR 503-574-3329
Ardmore, PA 610-896-7560
Dallas, TX 214-720-0559
Houston, TX 832-242-6913
Arlington, VA 703-415-7612
Woodbridge, VA 703-583-0071
Bellevue, WA 425-373-3500
Kimco Realty Corporation and Subsidiaries
299287_Kimco_TXT.indd 22 3/14/16 5:37 PM
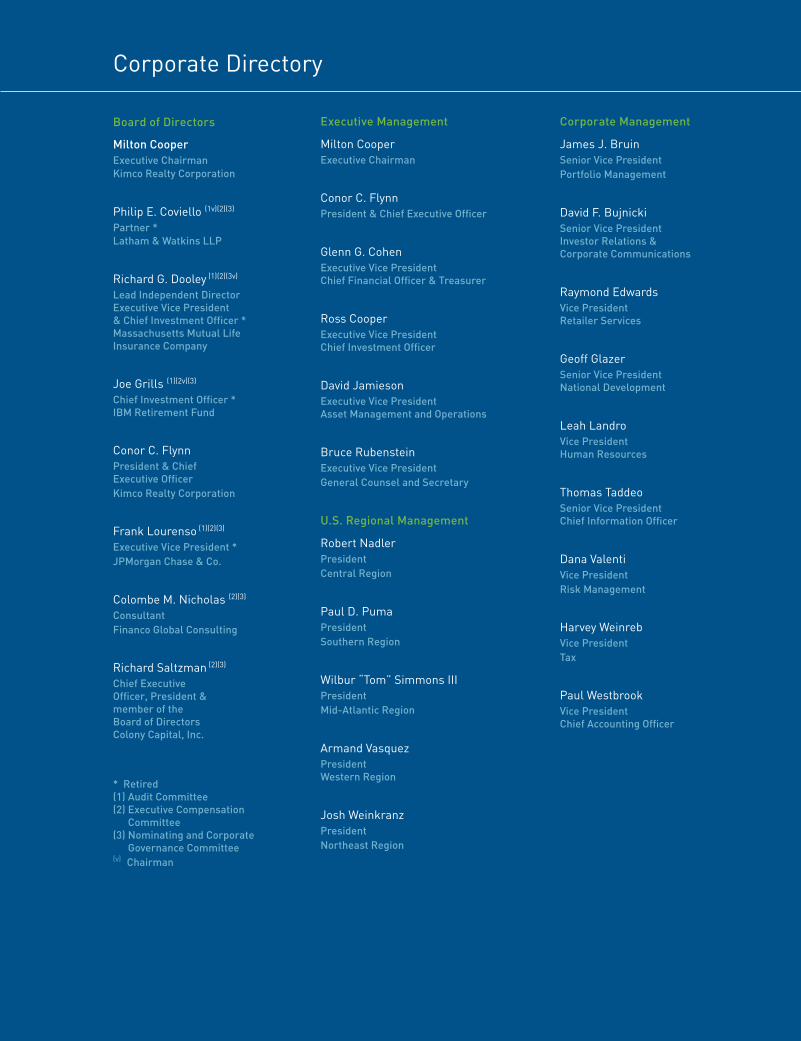
Board of Directors
Milton Cooper Executive ChairmanKimco Realty Corporation
Philip E. Coviello (1v)(2)(3) Partner *Latham & Watkins LLP
Richard G. Dooley (1)(2)(3v)
Lead Independent DirectorExecutive Vice President & Chief Investment Officer * Massachusetts Mutual Life Insurance Company
Joe Grills (1)(2v)(3)
Chief Investment Officer *IBM Retirement Fund
Conor C. FlynnPresident & Chief Executive OfficerKimco Realty Corporation
Frank Lourenso (1)(2)(3)
Executive Vice President *JPMorgan Chase & Co.
Colombe M. Nicholas (2)(3)
ConsultantFinanco Global Consulting
Richard Saltzman (2)(3)
Chief Executive Officer, President & member of the Board of DirectorsColony Capital, Inc.
* Retired(1) Audit Committee(2) Executive Compensation
Committee(3) Nominating and Corporate
Governance Committee(v) Chairman
Executive Management
Milton CooperExecutive Chairman
Conor C. FlynnPresident & Chief Executive Officer
Glenn G. Cohen Executive Vice President Chief Financial Officer & Treasurer
Ross Cooper Executive Vice President Chief Investment Officer
David Jamieson Executive Vice President Asset Management and Operations
Bruce Rubenstein Executive Vice President General Counsel and Secretary
U.S. Regional Management
Robert Nadler President Central Region
Paul D. Puma President Southern Region
Wilbur “Tom” Simmons IIIPresidentMid-Atlantic Region
Armand Vasquez President Western Region
Josh WeinkranzPresident Northeast Region
Corporate Management
James J. Bruin Senior Vice President Portfolio Management
David F. Bujnicki Senior Vice President Investor Relations & Corporate Communications
Raymond Edwards Vice PresidentRetailer Services
Geoff GlazerSenior Vice PresidentNational Development
Leah Landro Vice President Human Resources
Thomas Taddeo Senior Vice President Chief Information Officer
Dana ValentiVice President Risk Management
Harvey WeinrebVice President Tax
Paul WestbrookVice President Chief Accounting Officer
Corporate Directory
Kimco Realty Corporation (NYSE: KIM) is a real estate investment
trust (REIT) headquartered in New Hyde Park, N.Y., that is North
America’s largest publicly traded owner and operator of open-air
shopping centers. As of December 31, 2015, the company owned
interests in 564 open-air shopping centers comprising 90 million
square feet of leasable space across 38 U.S. states and Puerto Rico.
Letter from the Chairman 2 2015 Operating Review 4Form 10-K 21 Shareholder Information 128 Corporate Directory IBC
A BOU T THE COMPA N Y
299287_Kimco_CVR_R2.indd 2 3/16/16 2:43 AM
Kim
co Realty • 2015 A
nn
ual R
eport
3333 New Hyde Park Road
New Hyde Park, NY 11042
Tel: 516-869-9000
kimcorealty.com / blog.kimcorealty.com
R E A L T Y
R E A L T Y
PM S 2945
R E A L T YRGB
CMYK
2020 VISION2020 VISION
2 015 A NNUA L REP OR T
R E A L T Y
R E A L T Y
PM S 2945
R E A L T YRGB
CMYK
299287_Kimco_CVR_R2.indd 1 3/16/16 2:43 AM