Embed Size (px)
Citation preview

�������������� ������������������������������� �!�"���#��$%�"���&�'����( ����������)��+*,���������.-(-��/�0�1�2���.3�0�14�$��/3���(��5�67�980�&:;��5�<>=?-(���&=��"@A��-��B�2$%C�����"���/$%�����5<>=?-����D=?-�E)�F�/<�G���.H�$%�IKJML#NPO%NPQRN S O�TVUWUXT YZO\[ ]^J _a`cbedf`cghT
iDj�kWlnm3opj2qrm?j)k�iDjhsut�v+q\wropxzy\q{q{j2|}j2q\~W�Wspyf�D�fs
�����/�%���9�%�����\������������%�}�?�&�%���2����2���>���u�%�
�����¡ £¢#¤���¥��&¦#§# ¨�B¦#©ª�¬«#©¡��,®�¦¡¯°«K±³²h§�¥�«A £´�µB��¤�®�¶·�«K�,¢B§�®�«#¦¸«�¹K�&¤º§»µ#�¼·A�#¤�®� ½²c¤B�&�¿¾�²À¦ªÁ�¹K�&¤,¹K®��& «K±
§»µ#�¼Ã�ÄBÅ^Æ7Ç)È ·�¤»«KÉ���¶�§
�Ê�/)$%��Ë�ÌÎÍ>Ï��»Ì�*9��$%���!��ÐnÍ/Ï)��Ì?Ñ�-(��@A�����Ò!Ï)��Ì?6�Ó�=?�%�/-.ÔÕÏ��}Ì?Ö����×2@A���fÒ!Ï3�DÌ���G��!Ø����F�F��Ù?Ï�{Ì�ÚBÌ�ÑD-.��@A��3� Í Ï?:#Ì3Û�=?@BÓ�������Ü!Ï�:BÌ3Û�$'��/Ðf��-(�(��Ý!Ï?:#Ì�Þ»-���E2ßÕÏ3�}Ìà�DÌ?Ëá��âp��Ó� )��� Ô Ï?Ö�Ì!Ër=?���F�/< Ô Ï:BÌ\� �!�����.%Ù!Ï\Û#Ì£�c���ã?���/Ò�Ïf�DÌf�D������=?��äzÏ\��Ì\�%�(<��!��Ð�Ò����пÛ#Ì£år=?$%C£���<>�/äæèç�é>êìë"íîé"ï.ë�ðÎíìñ�ò�ñDóõôñèïÕôñ0ë"íöë�÷àëìø"ð.ñ,ù�ú"û!é"ü'ð(ý1þÿñ������������3íîé"û �uñ�������ñèí��Fð��uñ�ò�� �¡ôñèíîë"û!ë"ü'ð.ñ������������3íîé"û �uñ����ç�é>êìë"íîé"ï.ë�ðÎíìñ��uûÿï ñèíuþÕûzð��"ñèí��uð ï.é"ðÎíìñ»ò�ñ����ÿú��ìï��ñèü ñ����rï�ü�ë���� rôñèíuð(ý1þÿñ��!�"���#�#����3íöé"û$�uñ��%�ç)é>êìë"íîé�ï.ë"ðÎíìñ�ò�ñ��� �1ð.ñèû$�uñ��ò"þ&��÷ ðÎü�é"ï�ñèïáò�ñ÷'� (�û)�Fð íîë"ûzû?ñèü ñèûzï*��fë"üü'ð��!�èé"íuð(é"ï��é�÷'� (�û?ñèí�ø"ð.ñ+�rï.ë"üð(ý1þÿñ�������#�)���3íîé�û$�uñ��, ç�é>êìë"íîé"ï.ë�ðÎíìñ�ò�� �¡ôñèíöë�÷àëìø"ð.ñ��-�����#� .0/�ûzð��"ñèí��ìðÎï/ôñ21ré"þÕ÷3��é>êìé"ï�ð.ñèí����3íöé"û$�uñ���4����'�516�#���7�8�81áé"íèð9�����3íîé"û �uñ��: ó ô(<; ô(+=5.9�>�����2�?(5��1áé"íèð9�����3íöé"û$�uñ��A@0�)ë"í��B�� �þÕû�ø��DC�ñèûzï�íèþ/üFEHGþÕ÷ ð��� I�%ùJ.DK�L0MLNK�EOGþz÷ ð*�� N��Prñèíèü�é"ûÿú
48.5
48.6
48.7
48.8
48.9
49.0
49.1
49.2
1.8 1.9 2.0 2.1 2.2 2.3 2.4 2.5 2.6 2.7 2.8 2.9 3.0
PARIS
Trappes
Rambouillet
Creteil
Montge en Goele
Palaiseau
QR>SUT R8VXWUYZR\[5]�]�]X^`_ba5T$Rdc<egf

hji`kl�mZl�nJo3pOoJq'rsnutUl�mwvxrsoJl�m
�'�»Ð�=)<�$�@A�/3� �/�F��-��+C����/@A�(��� �$�@������=�Ð%�/� ��=��F�/��Ð��/� 6�<>���( )���)��/�&81����F��$�@¡�/�����-��/� Ð%�»-!y 81���2Ë9Ì�'�/�+��=��F�/�»<>=?�<>���"%�/3�»-!y �/��F�/@BÓf-��KÐ%�/�+��<>���� 2������/��Ð%�¡-'y 80��F������$��Iz&:Ê��� ��/-(=�C�C��/@¡�/3���B�(��F�F�"$�@¡�/�����$A{ ���@������G%=2Ð%=?-�=�ã?�.H�$%�/�/Ïf<���@¡Cf�!ã?%�/��Ð%�»@¡�/��$����/� <>=)=���Ð%=?�'����/�&��� ��{)C�����"���/�<>�/�&Ð��+�F���������(nÌ
Ër�+Óf$%� Ð%�»<>�/���&=��F�/���/�F�&Ð%=?$�Óf-��$z| :���}n$��F���'���!Cf�.Ð%�/@¡�/��-��/��)��/��$�-����!���'=�Ó��F�/)$���~�#-'y 81f�F������$%�9 ����"�'-.��<>=?@A@#$����$%�)��+��<����/����*�fH)$%��C���=2<�G%�Ð��»-'yà�(��F�F�"$�@¡�/����!����=?P�/ @���������=���=?-�=�ã?����Ï�H)$%��<>���F=?�(� �/ÊÑ%�����<>�B=?$b~�A-'y1����F�����ã����/Ï| ��=?��F������$%����Ð%�/� Ð%=2<�$�@¡�/���� Ð%�+�2���â/������/�<>�KH�$��n��»�F=?3�&Cf��� �F=?$)�F=?$%��� ��=?$�@A�(��C�=?$%� Cf$�Óf-(�(<��!����=?áÌ�'�/�&�&=��F�/��C��/$% ��/3� Ð�=?�<�C����/�Ð����+��$�������Óf�(�/ -(�Kâ =��"@¡��Ð%�»��=��F�/�&��<��(�/3���*�£H�$%�/� H)$%�»�F�/<"G���(H)$%�/��ÌËUyà��<>��$���-(���)��+Ð%�/�'�&=��F�/��Ï�)$�@������=?��~�BCf�!�������F���&��� <>=?@A���)��+Ð5yè��/Ð�������=?P�F=?��'<>=?f��$�-����!Óf-(�/��~�#-'yà��Ð%���/�������(��F���F�%��� ��$��� !��3�F�$z
���?�6���������H�?�$�O���5��!�3���Z�?���>�����H�$� �3�s���6���������H� �������Z���8� �)�� Z¡��
Û ������!��У¢¥¤¦3§�¨©¦ Ï:������/<>�F�/$%��Ð%�»-'y 80�'�2Ë
81f�F������$%� ����������>�1�2�.@¡=?WËr�!Cf-(��<>������ ������������������������������� �!�"���#��$%�"��� ����� �������������+*,���������(-(-(�/�&�2���(���4�$%�/����(Ö«ªI¬Z¡��å�ªN®#�52® �'=?-.-7~��ã��»*9��$%Óf��¯ Ï�C£-(��<>�±°?$f�������/$ ¯?² Ï�Ó�=?$�-(�� ÿ�!��ÐW*9��$�Óf��² ®$$®$X���!���(���'�/Ð���{³¬Z® ² ´ ¬ ¯?² Û�$%E?���<>=?$%�����'�/Ð%��{

Measurementsand Modeling of Atmospheric Pollution over theParis Ar ea:An Overview of the ESQUIF Project
Menut L. µ , R. Vautard µ , C. Flamant ¶ , C. Abonnel· , M. Beekmann¶ , P. Chazette , P. H. Flamant µ , D. Gombert ¹ ,D. Guedaliaº , D. Kley » , M.P. Lefebvre· , B. Lossec· , D. Martin ¸ , G. Megie¶ , P. Perros¼ , M. Sicard¶ , G. Toupance¼½
LaboratoiredeMeteorologieDynamique,CNRS,France¾Serviced’Aeronomie,CNRS,France¿LaboratoireInteruniversitairedesSystemesAtmospheriques,CNRS,FranceÀLaboratoiredesSciencesdu Climatetdel’Environnement,Commissariata l’EnergieAtomique,CNRS,FranceÁLaboratoired’Aerologie,CNRS-UniversitePaulSabatier, FranceÂAIRPARIF, Paris,FranceÃMETEO-FRANCE,Paris,FranceÄForschungszentrumJulich, D-52425Julich, Germany
Received:date/ Revisedversion:Revisedversion
Abstract. The ”Etudeet Simulationde la QUalite de l’airen Ile de France” (ESQUIF) project is the first integratedproject dedicatedto the study of the processesleading toair pollution events over the Paris area.The project wascarriedout over two years(summer1998to winter 2000)todocumentall typesof meteorologicalconditionsfavourableto air quality degradation,andin particularto photooxydantformation. The goals of ESQUIF are (i) to improve ourunderstandingof the relevant chemical and dynamicalprocessesand, in turn, improve their parameterizationsinnumericalmodels,and(ii) to improve andvalidateexistingmodels dedicatedto pollution analysis, scenariosand/orforecasting,by establishinga comprehensive and thoroughdatabase.In this paper, we presentthe rationaleof the ES-QUIF projectandwe describethe experimentalset-up.Wealsoreporton the first experimentswhich took placeduringthe summerof 1998 involving surface networks, remotesensinginstrumentsas well as several aircraft. Focusingon threedaysof August1998,the relative contributionsoflong-rangetransportedand locally-producedozone to theelevated ozoneconcentrationsobserved during this periodare discussedand chemistry-transportmodel preliminaryresultson this periodarecomparedto measurements.
Key words. Field experiment, urban pollution, ozoneepisode,aircraftmeasurements
1 Rationaleand objectivesof the ESQUIF project
As in many big cities throughoutthe world, pollution levelsin the Paris areadue to concentratedactivity have becomea majorhealthissue.Currentpredictive capabilitiesmustbeÅ
Presentaddress:Laboratoirede MeteorologieDynamique,In-stitut P.S. Laplace,Ecole Polytechnique,91128PalaiseauCedex,FranceSendoffprint requeststo: MenutL.
improvedto enablepolicy makersto reachbalanceddecisionsonemissionreductionstrategies.Thisrequiresathoroughun-derstandingof theprocessesandfactorsaffectingtheforma-tion of pollutantsandtheir concentrations.
Air quality over Paris is continuouslysurveyedby a ded-icatedsurfacenetwork carrying out measurementsof criti-cal pollutantconcentrations(AIRPARIF). However, surfacemeasurementsarenot sufficient to fully understandthe pol-lutantsdynamicsand chemistry. Also, unlike cities as LosAngeles(McElroy, 1993),Athens(Ziomas,1998),Mexico-City (Doran et al, 1998) where the local dynamical pro-cessesaredominantdueto mountainbarriers,and land-seabreezeregimes,the Paris agglomerationhasa ratherflat to-pographyand is thus also strongly influencedby synopticandlocal-scalemeteorologicalconditions.Moreover, photo-chemicalpollution in this areais actuallyboth due to pho-tooxydantbuild-up from local emissionsand to large-scaletransportof ozone(asstudiedover Bostonduring the NorthAtlantic Regional Experiment,Fast and Berkowitz, 1996)formed over other areasof Europe.The determinationoftheir respective role, as well as several other scientific is-sues,requiresa specific researchproject where numericalmodeling and measurementcampaignsare simultaneouslyperformed.During the last decade,several campaignshavebeencarriedout to studyphotochemicalpollution at the re-gionalscale.POLLUMET (PollutionandMeteorology)wascarried out in Switzerland(1992-1994)and illustrated theinfluenceof the Milan ozoneplume (Prevot et al., 1997).BERLIOZ (Berlin Ozone)(Volz-Thomaset al., 2000;Rap-pengluecket al., 2000) was designedto study the chemi-cal reactionstaking placein the plumeof the city of Berlin(1998).LOOP-PIPAPO (Limitation of oxidantsproduction)focussedon chemicalregimesin the Po valley, over Milan(Neftel,1999).
ESQUIF (“ Etudeet Simulationde la QUalite de l’air enIle deFrance”,a Frenchacronym for “Air quality studyandmodelingover the Paris area”) is sucha researchinitiative.
MenutL.Æ etal.: MeasurementsandModelingof AtmosphericPollutionover theParisArea:An Overview of theESQUIF Project 3
It is thefirst importantprojectdedicatedto thestudyof pol-lution in this area.The particular interestof the Paris areastemsfrom its geographicalsituation: It is a large city lo-catedfar from otherpopulatedareasby about200 km. It isthereforein principleeasierthanfor othereuropeancities todistinguishthe air masseschargedwith locally-emittedpol-lutantsfrom thosechargedwith pollutantsemittedin remoteareas.This shouldallow one to distinguishbetweenerrorscomingfrom boundaryconditionsandfrom modelparame-terizationsin regionalmodelsimulations.Anothergeograph-ical interestof theParisareais its low topography, which inthe absenceof local forcing makesthe modelingof the ac-cumulation/dispersionof pollutantsmorecomplex (Lossec,1992;Dupontet al., 1999).More specifically, the ESQUIFprojectfocusesonseveralresearchissues,themostimportantoneslistedhere:
Ç Thethermodynamicsof theboundarylayerin andaroundabig city: Themainquestionsare(a) therole of theverticalstructureof the boundarylayer and the turbulent mixingprocessesduringpollutionepisodes,and(b) whethermod-els areable to simulatethe air flow, its vertical structureandthe surfacefluxesencounteredduring low dispersionepisodes,and,if not, how to improve thevariousparame-terizationsusedwithin themodels,Ç The photochemistryof pollutants: the focus here is es-sentiallyon processesmodifying the radiative fluxesandtherebyphotolysisrates(clouds,aerosols,total ozonecol-umn),Ç The transport of pollutants at the interface of the ur-ban/regionalandthecontinentalscale:wewill evaluatetheconcentrationof ozoneandits precursorsbothat theinflowboundariesof thedomainandin thecity plume,Ç The physical and chemicalevolution of urban and sub-urban aerosolsand their representationin air qualitychemistry-transportmodels.
Theseresearchissuesaim at giving someanswersforthe following environmentalissues:(i) The origin of ozoneepisodesin theParisarea,includingthedeterminationof therelative role of local emissionsandlarge-scaletransport,(ii)The influenceof the city areaon neighbouringregions, in-cluding the studyof the pollutantsin the plume,their agingandthehorizontalandverticalextentof this plume,(iii) Thedeterminationof the photochemicalregimes(NOÈ or VOClimited) and their spatialdistribution, and (iv) The evalua-tion of existingemissioninventoriesusingmeasurementsac-quiredduringthecampaign.
Theprojecthasbeeninitiatedjointly by theInstitutPierreSimonLaplace(IPSL)andtheLaboratoireInter-universitairedesSystemesAtmospheriques(LISA), andthepartnershipisextendedto theLaboratoired’A erologie,theForschungZen-trum of Julich, AIRPARIF (the local air-quality monitoringnetwork) and Meteo-France(seeTable 1). The project ex-tendedover two years(July 1998- January2000).
The measurementcampaignstartedduring the summerof 1998, and ending during the winter of 1999-2000:Tenepisodesof 1-5 days were documented,denotedhereafterthe ESQUIF IOPs, (Intensive Observation Periods).TheseIOP days were selectedon the basisof weatherforecastsfavourableto degradationof air quality. Table2 lists themain
Table 2. Overview of the ten IOPsof ESQUIF from1998to 2000.The’airmass’ is specifiedin order to check its continentalor mar-itim origin (with ’st.’ for stagnation). TÉDÊ0Ë!Ì and OÍ correspondto maximalsurfacetemperature andozoneconcentrations,respec-tively, observedover the Paris city during the diurnal day. Someadditional remarksare displayedon themeanmeteorological con-ditionsobservedover each wholeIOP.
IOP Dates Airmass Remarks(wholeIOP)
1 25/07/1998 Continental Mostly cloudyby26/07/1998 1-2daysst. mediumandhighclouds
stagnation nowind2 6/08/1998 Continental Clearsky
7/08/1998 2-4daysst. Hot temperature8/08/1998 Light winds9/08/1998
10/08/199811/08/199812/08/1998
3 16/06/1999 Continental Overcastafter12UT.17/06/1999 3-4daysst. Wind (NE) Î 3 m/s
4 25/06/1999 Continental Clearsky26/06/1999 3-4daysst. Wind (E) Ï 5 m/s
5 1/07/1999 Maritime Clearsky2/07/1999 Wind (SE) Ï 4 m/s
6 16/07/1999 Maritime Clearsky17/07/1999 thenstagnant18/07/1999
7 24/07/1999 Continental Parisplumetracking25/07/1999 2-3daysst. in Brittany. Windy
8 28/07/1999 Continental Light wind29/07/1999 3-4daysst. Î 2 m/s30/07/199931/07/1999
9 07/10/1999 Continental Anticyclonicsituation08/10/1999 2-3daysst. NOÐ NOÑ
experiment10 26/01/2000 Continental High NOÒ concentrations
27/01/2000 Plumeto Westof Paris28/01/2000
characteristicsof the meteorologicalsituationsencounteredduringtheseIOPs.
Following theESQUIF objectives,thecampaignincludedaircraftandground-basedmeasurements.Variousflight plansweredefined:flightsto documentspatialozonedistributioninloopsaroundthecity atvariousdistancesfrom thecenter, the“city plume”flights to follow theurbanplume,the“chemicalregimes” flights occuringat constantlatitudeover the Parisarea,andthe“regular” flightsperformedto obtainaclimatol-ogy of long-livedtracegasspeciesaroundtheParisarea.
Thepaperisorganizedasfollows:in Section2,wepresentthe main definedexperimentsandthe experimentalstrategydesignedto addressthe scientificgoalsin the framework ofESQUIF. Theinstrumentalset-upis alsobriefly discussed.InSection3, the modelsto be usedin the framework of ES-QUIF arebriefly described.Section4 is devotedto the de-scriptionof the meteorologicalconditionsandexperimentalset-upduringthetwo IOP’sperformedduringthesummerof1998andto reportonresultsobtainedduringthesecondIOP.Chemistry-transportmodel resultsare presentedand com-paredto measurementsin Section5. In Section6 we discusstheperspectivesof furtherwork within theESQUIF project.

4 MenutL. et al.: MeasurementsandModelingof AtmosphericPollutionover theParisArea:An Overview of theESQUIF Project
Table1. List of institutesandpeopleinvolvedin theESQUIF experiment.
Institute, acronym and affiliation Peoplesinvolvedin ESQUIF (in alphabeticalorder)AIRPARIF (Parisianpollution network) E.Gilibert,D.GombertLaboratoire Inter-Universitaire des Systemes Atmo-spheriques(LISA) - Univ. ParisXIII IPSL/CNRS
S.Alfaro, B.Aumont, G.Bergametti, C.Boissard, F.Brocheton,B.Chatenet,A.Dutot, A.Gaudichet,L. Gomes,C.Jambert,M.Maille,T.Marion,F.Millard, P.Perros,G.Toupance
Laboratoire des Sciences du Climat et del’Environnement(LSCE) - Commissariata l’ energieatomique/IPSL,Saclay
B.Bonsang,P.Bousquet,H.Cachier, P.Chamaret,P.Chazette,P.Ciais,A.Foucras,D.Martin,P. Moral, C.Morfopoulos,D.Picard,M.Ramonet,R.Sarda,M.Touaty, P. Vaillant,C. Valant
Laboratoire de Meteorologie Dynamique (LMD) -IPSL/CNRS-Paris& Palaiseau
H.Chepfer, P.Delville, P.Drobinski,P.H.Flamant,C.Honore,F.Hourdin,C.Loth,L.Menut,J.Roux,R.Vautard
Meteo-France(FrenchWeatherService) C.Abonnel, H.Bellec, D.Bernard, R.Caillou, M.Charpentier,G.Duverneuil, F.Goyon, J.C.Etienne, M.Laurens, M.P.Lefebvre,B.Lossec,M.Morera,M.Payen,V.H. Peuch,F.Pouvesle
Serviced’Aeronomie(SA) IPSL/CNRS- Paris O.Antivilo, G.Ancellet,M.Beekmann,C.Flamant,P.Genau,G.Megie,J.Pelon,M.Pinharanda,J.P.Pommereau
Laboratoired’AerologieCNRS- Toulouse D.Guedalia,R.RossetForschungszentrumJulich, D-52425Julich, Germany D.Kley andMETAIR
2 Overview of the experimental strategy and set-up
2.1 IOP organizationandforecast
In order to trigger IOPs,several modelsandmodeloutputswere used(seedescriptionbelow). First, we usedweatherforecastsissued at Meteo-Franceand comparedthem tothe EuropeanCentrefor Medium-RangeWeatherForecasts(ECMWF) and National Centers for Environmental Pre-diction (NCEP) forecasts.When favourableweathercondi-tions were forecastedandwhen the forecastbecamestable(typically 2-3 daysbeforethe experiment),we checked thechemistry-transportforecastmodelCHIMERE(Menutetal.,2000). This model is forced either by ECMWF or Meteo-Francemeteorologicalvariables(wind, temperature,humid-ity, cloudiness)andforecastspollutantfields(ozonein partic-ular) which wereusedto triggeranIOP. A particularempha-siswasput on thenatureof theepisode(local-scaleor large-scale).Theavailability of airplanesandinstrumentswasalsotaken into accountin the designof the experiment(a com-pletelist of instrumentsis displayedin theTable3). Finally,the IOPswerechosento be meteorologicallyasdifferentaspossiblein order to collect a large rangeof situations(e.g.continentalair, maritimeair, hot weather, stagnationcondi-tions).
2.2 Aircraft measurements
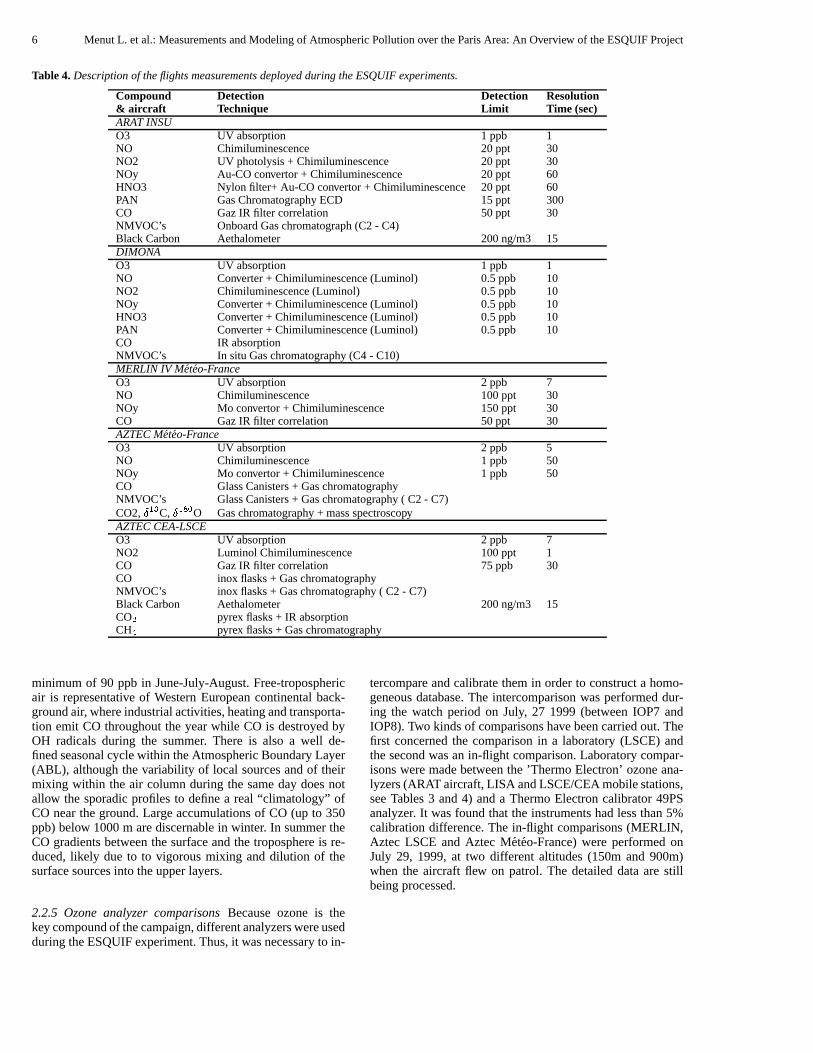
Five aircraft (two PiperAZTECs,a MERLIN IV, theFokker27 “ARAT” anda DIMONA) wereusedto looparoundParisat various distancesand to collect measurementsof CO,NO,NOÓ , OÔ andNMVOC’s(Non-MethaneVolatileOrganicCompounds)aswell asstandardmeteorologicalparameters.The flight plansmay be definedas (1) ’ local and regional’flights(Figure1), (2) ’meso-scale’flights(Figure2), (3) ’ded-icated’ flights (urbanplumeandchemicalregimes)and (4)the ’regular’ flights, devotedto theCOÓ climatology, asfol-lows:
2.2.1 The’local and regional’ flights In order to studythelocal andregionalpollutantsconcentrationsaroundtheParisagglomeration,threemajorsflight patternsweredesignedasloopsaroundthecity (Figure1):Õ ‘Urban’ flights, madeabove the Paris “ring” (limit of the
Paris city) at 500, 1000 and 1500 m AGL, aim at char-acterizingpollutantconcentrationabove the mainsources(traffic, industry).Õ ‘Suburban’ flights, madeat a distanceof 20 km from thecenterof Paris, weredesignedto documentthe chemicalcompoundsconcentrationsat theborderof theurbanarea.In addition,theseflights will alsobeusedfor determiningthegradientof concentrationsbetweenupwindanddown-wind thecity, in orderto helpevaluatingemissioninvento-ries.Õ The‘Ile deFrance’flights (from now called’IdF’ flights),madeat adistanceof 50 km from thecenterof Paris,werealsodesignedto explore theverticaldistribution of pollu-tantsby meansof soundingsat 4 pointsin eachdirectionfrom the city, and to characterizepollution at rural sitescloseto thecity.
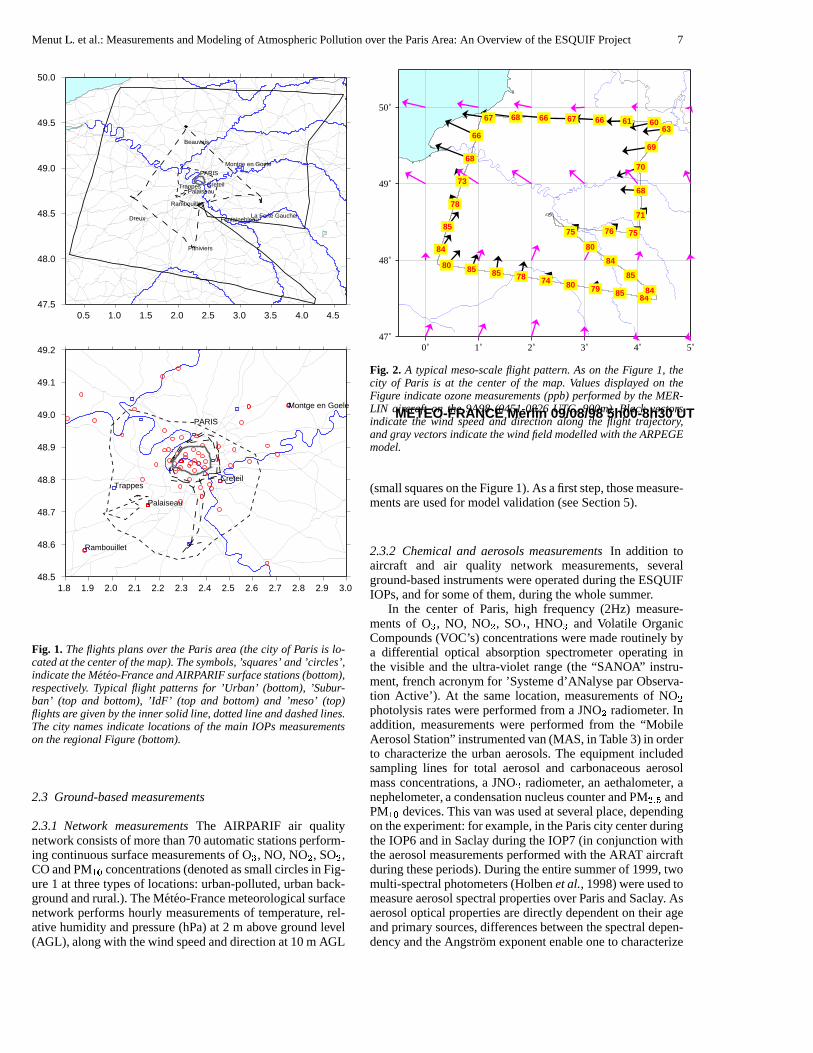
2.2.2 The ’meso-scale’ flights The ‘meso-scale’ flights(from hereincalled ’Meso’ flights) weredesignedto docu-mentpollutantconcentrationfields(ozone,in particular)at adistanceof 150km from thecenterof Paris(Figure2). Theseflights wereperformedwith the MERLIN aircraft (Table4)and the flights were done from one to two times per IOP(dependingon the meteorologicalsituation).These’Meso’flights,alongwith the‘IdF’ flights,areto beusedto provideboundarycounditionsfor regionalair quality models,andtounderstandthetransportof pollutantsat theregionalscale.
2.2.3 The ’dedicated’flights The ’dedicated’flights weredesignedto provide a databaseon thewholeParisarea(130x 120 km). Thesedataincludeozone,nitrogencompounds(NO, NOÓ , NOÖ , HNOÔ , PAN) andNMHCs (CÓ - C× ) mea-suredby the ARAT aircraft (Table4) in the boundarylayerusing a regular trajectory (5 legs of 130 km separatedby

MenutL.Ø etal.: MeasurementsandModelingof AtmosphericPollutionover theParisArea:An Overview of theESQUIF Project 5
Table 3. Descriptionof thegroundmeasurementsdeployedduring theESQUIF experiments.Ù , Ú , Û#Ü , Ý , Þ , ß and à designatepressure,temperature, relativehumidity, zonalandmeridiencomponentsof thewind, specifichumidityandaltitude, respectively. Oá , CO, etc...referto concentrationsfor ozone, carbonmonoxyde, etc...The( â ) and ( ã ) symbolsreferred to the instrumentsin theLSCE“MAS” (for MobileAerosolStation)andLISA“MILEA GE” mobilestations,respectively.
Measurements Instruments Site MeasurementsDynamics Lidar Palaiseau ABL depth,entrainmentzonedepth
Soundings Trappes Pä , T ä , RHä , U ä , V ä , qäSurfacenetwork IdF PåDæ , T åDæ , RHåDæ , U çéè7æ V çéè7æSensorsâ Paris,Saclay T åDæ , RHåDæStation Creteil T åDè7æ , RHåDè7æ , uåDè7æ ,v åDè7æ
Aerosol Lidar Palaiseau Aerosolopticaldepth,extinction coefficientLidar Paris Aerosolopticaldepth,extinction coefficientNephelometerâ Paris,Saclay AerosolscatteringcoefficientAethalometerâ Paris,Saclay SurfaceblackcarbonconcentrationAerosolsamplingline â Paris,Saclay ChemicalapportionmentParticulecounterâ Paris,Saclay Aerosolsizedistribution( ê : 0 ë 3ì m)Diffusionbatteryâ Paris,Saclay Aerosolsizedistribution( ê : 7nm ë 0.2ì m)TEOM balanceâ Paris,Saclay PM1or PM10AerosolmassconcentrationJ(NOå ) Paris NOå photolysisfrequenciesTEOM balance Creteil PM1or PM10AerosolmassconcentrationCascadimpactor Creteil Aerosolmasssizedistribution(0.03to 10ì m)
Chemistry SANOA Paris Oá , NOå , NO, SOå , VOC’sSAOZ Verrieres OáSurfacenetwork IdF Oá , NOå , NO, SOå , CO,PM çéèPhotometers Paris,Palaiseau Opticalthickness,Angstromexponent
Saclay, Creteil sizedistributionAnalyzersã Creteil Oá , NOå , NO, PAN, NMVOC’s
30 km). The aim of the chemicalregimesexperimentis tobuild a mapof theareasurroundingPariswith respectto theNOí andVOC sensitivity regimesundermeteorologicalsit-uationstypicalof highpollutantlevels.This is doneusingin-dicatorspecies(Milford et al., 1994;Sillman,1995)suchasO3/NOî , O3/NOï andOð /HNOð . SomeotherARAT flightsweredesignedto studytheurbanplume:perpendicularflightlegsto themeanwind directionwereperformedandgavepol-lutantsgradientsin andaroundthecity plume.
In the samemanner, chemicalregimes will be studiedusing the DIMONA flights (Lehning et al, 1998).The DI-MONA aircraft (seeTable4 for measurements)circumnavi-gatedthecity of Paris,well insidethemixing layer, at a dis-tanceof about30 km from thecity center. Designedaccord-ing to a trifold strategy, thefirst objectivewasto obtainmea-surementsof the VOC/NOí concentrationratios at a pointclosein time to theemissions.A shortextrapolationto zerotime will bemadeusingtheconceptof chemicalage(wherethe ChemicalAge (CA) is the time integratedOH concen-tration from emissionto the time of measurement,accord-ing to ln(NOî )/(NOí ) = k (OH)dt = k CA, wherek is therate coefficient of oxidation of NOñ to HNOð .). Here, thefact is usedthat emissionsof the oxidesof nitrogenare toa largeextentin theform of NO. PhotochemicalequilibriumbetweenNO andNOñ is rapidly establishedwithin 1-2 min-utesandthe consecutive oxidationof NOñ to HNOð by OHoccurswith aknown ratecoefficient.ThenCA canbederivedfrom themeasuredratio of NOî to NOí concentrations.Thesecondobjective wasto experimentallydetermineintegratedNOí andVOC emissionratesover the Paris area. This canbe done,oncethe chemicalagehasbeendetermined,fromquasi-continuousNOí andVOCmeasurementsalongthecir-cumferentialflight track.As anadditionalparameterthemix-
ing layerheightmustbeknown. Thethird objectivecenteredaroundtheconceptof oxidantOí (Oð +NOñ ). Frommeasure-mentsof Oí on the circumferenceandusing3D wind fieldinformations(measurementsandmodel), it will be possibleto derive the oxidant formation rate within the city and itsexport to theregion.
2.2.4 The ’regular’ flights Regional aircraft soundingsinthe vicinity of Orleans(48ò N 1ò E, 150 km Southof Paris)have beencarriedout sinceApril 1996,and since1999 aspartof theESQUIF project.Theobjective of theseflights istwofold : (1) to establisha climatology of long-lived tracegasspecieswhich areradiatively active (COñ , CHó ) or inter-venein the oxidyzingcapacityof the atmosphere(CO, NonMethaneHydrocarbons),and(2) to establishboundarycon-ditions of continental“background”rural concentrationsofCO andNon MethaneHydrocarbons(NMHCs) beforetheirhorizontal transportover the Paris Area. This is especiallyimportantin thecaseof NMHCs which intervenein thefor-mationanddestructionof ozonein pollutedair, andcanbeemittedby vegetatedareasoutsideof theurbanarea.Thefre-quency of the regional flights wasbiweekly andthe sound-ingsweretakenapproximatelyatmid-day, between50m and3000 m. The total flight time was on the order of 4 hoursandtheprofile itself tookabout1 hour. Pressure,air tempera-tureandrelativehumidityweremeasuredroutinelyalongtheprofile. Pyrex glassflasksweresampledin pair at 7 differ-entverticallevels(from 100to 3000m)(Francey etal., 1996,Groset al., 1998,Touaty, 1999).
Thetimeseriesof COverticalprofilesoverOrleansshowsa well definedseasonalcycle within the free troposphere,with a maximum of 190 ppb in December-Januaryand a
6 MenutL. et al.: MeasurementsandModelingof AtmosphericPollutionover theParisArea:An Overview of theESQUIF Project
Table4. Descriptionof theflightsmeasurementsdeployedduring theESQUIF experiments.
Compound Detection Detection Resolution& aircraft Technique Limit Time (sec)ARAT INSUO3 UV absorption 1 ppb 1NO Chimiluminescence 20ppt 30NO2 UV photolysis+ Chimiluminescence 20ppt 30NOy Au-COconvertor+ Chimiluminescence 20ppt 60HNO3 Nylon filter+ Au-CO convertor+ Chimiluminescence 20ppt 60PAN GasChromatographyECD 15ppt 300CO GazIR filter correlation 50ppt 30NMVOC’s OnboardGaschromatograph(C2 - C4)BlackCarbon Aethalometer 200ng/m3 15DIMONAO3 UV absorption 1 ppb 1NO Converter+ Chimiluminescence(Luminol) 0.5ppb 10NO2 Chimiluminescence(Luminol) 0.5ppb 10NOy Converter+ Chimiluminescence(Luminol) 0.5ppb 10HNO3 Converter+ Chimiluminescence(Luminol) 0.5ppb 10PAN Converter+ Chimiluminescence(Luminol) 0.5ppb 10CO IR absorptionNMVOC’s In situGaschromatography(C4 - C10)MERLINIV Meteo-FranceO3 UV absorption 2 ppb 7NO Chimiluminescence 100ppt 30NOy Mo convertor+ Chimiluminescence 150ppt 30CO GazIR filter correlation 50ppt 30AZTECMeteo-FranceO3 UV absorption 2 ppb 5NO Chimiluminescence 1 ppb 50NOy Mo convertor+ Chimiluminescence 1 ppb 50CO GlassCanisters+ GaschromatographyNMVOC’s GlassCanisters+ Gaschromatography( C2- C7)CO2, ôIõéö C, ô�õé÷7ø O Gaschromatography+ massspectroscopyAZTECCEA-LSCEO3 UV absorption 2 ppb 7NO2 Luminol Chimiluminescence 100ppt 1CO GazIR filter correlation 75ppb 30CO inox flasks+ GaschromatographyNMVOC’s inox flasks+ Gaschromatography( C2 - C7)BlackCarbon Aethalometer 200ng/m3 15COù pyrex flasks+ IR absorptionCHú pyrex flasks+ Gaschromatography
minimum of 90 ppb in June-July-August.Free-troposphericair is representative of WesternEuropeancontinentalback-groundair, whereindustrialactivities,heatingandtransporta-tion emit CO throughoutthe yearwhile CO is destroyedbyOH radicalsduring the summer. There is also a well de-finedseasonalcyclewithin theAtmosphericBoundaryLayer(ABL), althoughthe variability of local sourcesandof theirmixing within the air columnduring the sameday doesnotallow the sporadicprofilesto definea real “climatology” ofCO neartheground.Largeaccumulationsof CO (up to 350ppb)below 1000m arediscernablein winter. In summertheCO gradientsbetweenthesurfaceandthe troposphereis re-duced,likely due to to vigorousmixing anddilution of thesurfacesourcesinto theupperlayers.
2.2.5 Ozoneanalyzer comparisonsBecauseozone is thekey compoundof thecampaign,differentanalyzerswereusedduringtheESQUIF experiment.Thus,it wasnecessaryto in-
tercompareandcalibratethemin orderto constructa homo-geneousdatabase.The intercomparisonwasperformeddur-ing the watch period on July, 27 1999 (betweenIOP7 andIOP8).Two kindsof comparisonshavebeencarriedout.Thefirst concernedthe comparisonin a laboratory(LSCE) andthesecondwasanin-flight comparison.Laboratorycompar-isonsweremadebetweenthe ’ThermoElectron’ozoneana-lyzers(ARAT aircraft,LISA andLSCE/CEAmobilestations,seeTables3 and4) anda ThermoElectroncalibrator49PSanalyzer. It wasfoundthat the instrumentshadlessthan5%calibrationdifference.The in-flight comparisons(MERLIN,Aztec LSCE and Aztec Meteo-France)were performedonJuly 29, 1999,at two different altitudes(150m and 900m)when the aircraft flew on patrol. The detaileddataare stillbeingprocessed.
MenutL.û etal.: MeasurementsandModelingof AtmosphericPollutionover theParisArea:An Overview of theESQUIF Project 7
47.5
48.0
48.5
49.0
49.5
50.0
0.5 1.0 1.5 2.0 2.5 3.0 3.5 4.0 4.5
Fontainebleau
PARIS
Trappes
Rambouillet
Creteil
Montge en Goele
Palaiseau
La Ferte Gaucher
Beauvais
Dreux
Pithiviers
48.5
48.6
48.7
48.8
48.9
49.0
49.1
49.2
1.8 1.9 2.0 2.1 2.2 2.3 2.4 2.5 2.6 2.7 2.8 2.9 3.0
PARIS
Trappes
Rambouillet
Creteil
Montge en Goele
Palaiseau
Fig. 1. Theflightsplansover theParis area (thecity of Paris is lo-catedat thecenterof themap).Thesymbols,’squares’and’cir cles’,indicatetheMeteo-FranceandAIRPARIFsurfacestations(bottom),respectively. Typical flight patternsfor ’Urban’ (bottom),’Subur-ban’ (top and bottom), ’IdF’ (top and bottom) and ’meso’ (top)flightsaregivenbytheinnersolid line, dottedline anddashedlines.Thecity namesindicatelocationsof the main IOPs measurementson theregional Figure (bottom).
2.3 Ground-basedmeasurements
2.3.1 Network measurementsThe AIRPARIF air qualitynetwork consistsof morethan70automaticstationsperform-ing continuoussurfacemeasurementsof Oü , NO, NOý , SOý ,COandPMþ'ÿ concentrations(denotedassmallcirclesin Fig-ure1 at threetypesof locations:urban-polluted,urbanback-groundandrural.).TheMeteo-Francemeteorologicalsurfacenetwork performshourly measurementsof temperature,rel-ative humidity andpressure(hPa) at 2 m above groundlevel(AGL), alongwith thewind speedanddirectionat10m AGL
0˚ 1˚ 2˚ 3˚ 4˚ 5˚47˚
48˚
49˚
50˚
76 75
71
68
70
69
6360616667666867
66
68
73
78
85
84
80 85 85 78 74 80 79 85 8484
85
84
80
75
METEO-FRANCE Merlin 09/08/98 5h00-8h30 UT
Fig. 2. A typical meso-scaleflight pattern.As on the Figure 1, thecity of Paris is at the centerof the map.Valuesdisplayedon theFigure indicateozonemeasurements(ppb)performedby theMER-LIN aircraft on the 9A98 (0451-0826UTC, 900m).Black vectorsindicate the wind speedand direction along the flight trajectory,andgrayvectors indicatethewindfieldmodelledwith theARPEGEmodel.
(smallsquaresontheFigure1).As afirst step,thosemeasure-mentsareusedfor modelvalidation(seeSection5).
2.3.2 Chemicaland aerosolsmeasurements In addition toaircraft and air quality network measurements,severalground-basedinstrumentswereoperatedduringtheESQUIFIOPs,andfor someof them,duringthewholesummer.
In the centerof Paris, high frequency (2Hz) measure-mentsof O� , NO, NO� , SO� , HNO� and Volatile OrganicCompounds(VOC’s) concentrationsweremaderoutinelybya differential optical absorptionspectrometeroperatinginthe visible andthe ultra-violet range(the “SANOA” instru-ment,frenchacronym for ’Systemed’ANalyseparObserva-tion Active’). At the samelocation,measurementsof NO�photolysisrateswereperformedfrom a JNO� radiometer. Inaddition, measurementswere performedfrom the “MobileAerosolStation”instrumentedvan(MAS, in Table3) in orderto characterizethe urbanaerosols.The equipmentincludedsampling lines for total aerosoland carbonaceousaerosolmassconcentrations,a JNO� radiometer, an aethalometer, anephelometer, acondensationnucleuscounterandPM��� � andPM��� devices.Thisvanwasusedat severalplace,dependingontheexperiment:for example,in thePariscity centerduringtheIOP6andin SaclayduringtheIOP7(in conjunctionwiththeaerosolmeasurementsperformedwith theARAT aircraftduringtheseperiods).Duringtheentiresummerof 1999,twomulti-spectralphotometers(Holbenetal., 1998)wereusedtomeasureaerosolspectralpropertiesoverParisandSaclay. Asaerosolopticalpropertiesaredirectly dependenton their ageandprimarysources,differencesbetweenthespectraldepen-dency andtheAngstromexponentenableoneto characterize

8 MenutL. et al.: MeasurementsandModelingof AtmosphericPollutionover theParisArea:An Overview of theESQUIF Project
theaerosolregional transport.For example,during IOP7, inwhichSaclaywasundertheParisplume,urbanaerosolswerecomparedwith rural ones.Around noon, the urbanopticalthicknesswastwiceaslargeastheruralone,while at theendof the day, optical thicknesswascomparable.For this case,we hypothesizethat the urbanaerosol,mainly generatedbycar traffic (black carbonandorganiccarbon),wasadvectedoverSaclay.
In thesuburbof Paris,integratedozonecontentwasmea-suredin Verrieres(20 km, southwestof Paris) by a spec-trometeroperatingin thevisible andtheultra-violet (SAOZ,french acronym for “Systeme d’Analyse par ObservationZenithale”) twice a day, at dusk anddawn. This integratedozonecolumn is an importantinput parameterfor an exactcalculationof J(O
�� ) photolysisfrequencieswith radiativetransfermodels.In addition,aerosolssizedistributionsandcomposition(aswell astheiropticalproperties)werecharac-terizedin Saclay(25 km, southwestof Paris) usinga neph-elometer, anaethalometeranda condensationnucleicounteraswell astotal aerosolfilters andblackcarbonfilters.
2.3.3 Backscatterlidar measurementsTwo upward-lookingbackscatterlidarsoperatingat awavelengthof 0.53 � m weredeployedin thecenterof Parisandin Palaiseau(25km south-westof Paris).The lidar wasintendedto documentsomeofthekey parametersrelevantto (i) theABL dynamics,i.e., theABL depthand entrainmentzonedepth,(ii) radiative bud-get i.e, optical depth,and(iii) oxidation/productionof pho-tochemicalspecies,i.e.,extinctioncoefficientprofiles(whicharerelevantto theactualphotolysisrate),with a verticalres-olution of 30 m. In addition,a pyranometeranda pyrgeome-ter(for measurementsof infraredandlongwaveradiations),asonicanemometer(turbulence),andpressure,humidity andtemperaturemeasurementswere performedsimultaneouslyto lidar measurementsat Palaiseau.In addition,a differen-tial absorptionlidar (ALTO, acronym for “AirborneLidar forTroposphericOzone”,Ancellet andRavetta,1998)wasop-eratedduring theIOPsof summer1999at thePalaiseausitein orderto continuouslyrecordthetroposphericozoneprofileup to 5 km height.
2.3.4 SoundingsThevertical thermodynamicalstructureofthe atmospherein the Paris areawasdocumentedby meansof soundingsperformedby Meteo-Francein Trappes(25 kmsouthwestof Paris).Temperature,relativehumidity, pressureandwindspeedanddirectionsoundingsweremeasuredtwicedaily at 0000and1200UTC. During someIOPs,additionalsoundingswereperformedevery threehoursat the Trappessite.Fromtemperature,specifichumidityandwind measure-ments,Richardsonnumberandpotentialtemperatureprofilescanbeobtainedwhich arethenusedto computethe diurnalevolutionof thedepthof theABL. TheABL depthcyclecanin turnbecomparedto thatderivedfrom lidar measurements.
3 Overview of numerical models
3.1 Meteorological models
Two meso-scalemodels,MERCURE(Souffland,1985)andMeso-NH(Laforeetal., 1998)will beusedto performsimu-lationsof themeteorologicalconditionson domainsrangingfrom 100 100km� to 500 500km� , centeredonParis.Hor-izontalandverticalresolutionsmaybeadaptfrom 1 to 10kmand from 10 to 50m, respectively. Thesemodelshave al-readybeenusedfor simulatingtheair flow overParis(Menutet al., 1999aandTulet et al., 1999 for MercureandMeso-NH, respectively). Realisticmeteorologicalboundarycondi-tions for thesemeso-scalemodelswill be provided by theECMWF and ARPEGE (Meteo-France)analyses.In addi-tion, a zoomedversionof the Laboratoirede MeteorologieDynamique(LMD) generalcirculationmodel(LMDz, Hour-din and Armengaud,1998) was also used(Hourdin et al,2000).The sizeof the grid cell characterizingParis in thismodelis 50 50 km� . Thegrid sizeincreasesaway from thecenterof thedomain,andthemodelusesECMWFfor bound-ary conditions.
3.2 Chemistry-Transportmodels
The meteorologicalfields provided by the modelsdecribedin the previous sectionwill be usedas inputs to the mod-els presentedhere.At the local scale,the urbanCHIMEREmodel (Vautardet al., 1999; Menut et al., 2000) was usedasa forecast(Vautardet al., 2000)andanalysistool. It is amorerealisticadaptationof theboxmodelapproachproposedby Jin and Demerjian(1993) to the Paris area.It usestheMELCHIOR chemicalmechanismof BeekmannandLattuati(2000). At the meso-scale,the modelsusedwill be Meso-NHC (Tuletet al., 1999),A � UR (Jaecker-Voirol etal., 1998)andPOLLUTO,whicharecoupledto meteorologicalmodelsMeso-NH,MERCUREandECMWF datarespectively. ThechemicalmechanismMoCA (Aumontet al., 1997)of A � URhasalreadybeentestedoverParis.
In addition,modifiedversionsof CHIMERE,with anEu-lerian grid, are currently being developed:namelya meso-scale version to perform simulationson a 150x150 km�domain around Paris with a horizontal resolution from 6to 10km and a continentalversion over westernEurope,with a 1/2 degreeresolution.modelingresultspresentedinthis paperhave beenperformedwith the meso-scalechem-istry transportmodel (CTM) POLLUTO. POLLUTO, is athree-dimensionalchemistry-transportmodel using a carte-sian mesh.The domainis definedin order to have the cityof Paris (the mosturbanizedarea)at the centerof the hori-zontalmeshandis composedof 15 9 6 nodesin thex-y-zdirections,respectively. Themodelis forcedby theECMWFfirst guesses(6-hour forecasts).Thesemeteorologicalfieldsarere-interpolatedover thestudieddomainin time (onehourfrequency) andspace(with anhorizontalresolutionof 10kmandrangingfrom 0 to 2700m vertically).To accountfor ther-modynamicprocesses,POLLUTO requiresmassfluxes,tem-perature,density, specifichumidityandcloudiness(for chem-istry) asinputs.At eachgrid point, turbulenceparameteriza-tions areusedin orderto retrieve vertical turbulentdiffusiv-

MenutL.� etal.: MeasurementsandModelingof AtmosphericPollutionover theParisArea:An Overview of theESQUIF Project 9
Table 5. Overview of themeteorological conditionsover Paris andmaximumsurfaceozoneconcentrationsin representativelocationsduring the IOP 2. The background and plumeconcentrations arefrom the AIRPARIF stationsin Montge en Goele and Rambouil-let, respectively. Thetimeswere themaximumof ozoneoccuredaregivenin parentheses.
Day 7A98 8A98 9A98Meteorological conditionsover ParisWind direction(from) N-E E Sto EWind speedat 10m (ms��� ) 1.4 1.3 1.8MaximumABL depth(m) 800 2300 2800Temp.at 2 m ( � C) - low 16.5(05) 17.5(06) 18.7(05)Temp.at 2 m ( � C) - high 31.0(16) 35.3(16) 35.0(15)Ozoneconcentrations(ppb)over theIle deFrance(IdF)Paris 60 (16) 85 (12) 95 (16)
55 (16)Urbanplume 125(16) 90 (12) 120(16)
85 (16)Background 55(15) 70 (12) 90 (16)
55 (16)Productionby Paris 70 20-30 30
ity profiles,surfacefriction velocity for dry deposition(We-sely, 1989).The gas-phasechemistrymechanismis MoCAandthe adjoint part of the whole model is developped,andcurrentlyusedfor sensitivity analysis(seeMenutetal., 2000for theadjointprinciple).Hourly valuesof surfacicanthropicemissionsaregivenfor 15primarypollutants,usingtwo datasources:the CITEPA (1993)inventory, providing annualto-talsof emissionsof NO� , SO� , CO,CH� andNMVOCs(nonspeciated),and the GENEMIS (1994) data base,usedforNMVOCspeciationandtemporaldisagregationof annualto-talsto hourly values.
The MOCAGE model (Peuchet al., 1999), currentlydeveloppedat Meteo-France/CNRM,will be usedto pro-vide chemicalboundaryconditionsat continentalscale.Fi-nally, asa complementto all previous Eulerianmodels,theLagrangianmodel, MELCHIOR (Beekmannand Lattuati,2000)wasusedfor analysisof pollutanttrajectoriesoverEu-rope.
4 IOP2 of ESQUIF: Data analysis
The ESQUIF experimentsperformedduring Summer1998have beendesignedto addressmorespecificallythe follow-ing questions:(i) whatarethe relative contributionsof localproductionandlong-rangetransportto theozoneconcentra-tionsmeasuredovertheParisareaduringpollutioneventsand(ii) whatis theimpactof theverticalboundarylayerstructureonozonebuild-upovertheParisarea?In thissection,weper-form preliminaryanalysesin orderto illustratehow ESQUIFdatacanbeusedto addressthesequestions.
In this paper, we focuson IOP 2 which lastedthreedays,from Friday to Sunday7-9 August 1998 (hereaftercalled7A98, 8A98 and 9A98, respectively, Table 5). This period(including10and11August1998)correspondedto thehigh-estozoneconcentrationsrecordedduring thewholesummerof 1998. As the experimentalset-upwas optimum during
7A98,8A98and9A98(includingaircraftmeasurements),wefocusouranalysison thesethreedays.
In orderto understandthe origin of air massesadvectedinto the Paris area,a seriesof 7 day back-trajectorieswerecalculated.Thesetrajectoriesusedthe wind field as diag-nosedby ECMWF first guesses.During the convective pe-riod, air parcelsare well mixed within the boundarylayer.Henceneitherconstant-altitudetrajectoriesnor trajectoriesfollowing themean3-dimensionalwind field would bereal-istic. In orderto overcomethis problem,air trajectorieswereassumedto undergoarandomaltitudechangeeveryhourdur-ing theconvectiveperiod(0900-1800UTC). They werenev-erthelessboundedto staybetween0 and1500m.Fifty back-trajectoriesarecalculatedin this way (dueto the convectiveprocesses,an endingpoint doesnot correspondto the sameorigin. In order to taken into accounttheseseveral origins,fifty trajectoriesarestudied).Figure3 representsthese“back-plumes”endingin ParisduringthethreeIOPdaysandthedayprior. On6A98and7A98,theair masshasamaritimeorigin,while on 9A98 it hastravelledover the British IslesaswellasBelgium,theNetherlandsandLuxemburg.We thusexpectthat on day 9A98 a significantpart of ozonemeasuredoverParis originatedfrom precursorsemittedover NorthernEu-rope,while on day 7A98, mostof the pollution waslocallyproduced.
4.1 Regionalozoneformationandcontinentaltransport
In order to quantify the amountof ozoneproducedin largecities such as Paris, one cannot use measurementstakenwithin the Paris city limits sinceozoneformationis usuallymaximumin thecity plume,about50 km downstreamof thePariscity (seefor instanceTuletet al., 1999).
On 7A98, the urbanplume was observed southwestofParis from aircraftandsurfacemeasurements.In this region,ozoneconcentrationsmeasuredby theMERLIN aircraft(Ta-ble 6) at about500 m AGL reachedabout110 ppb at theendof theafternoon,while thoseencounteredin thenortheastsideof thecity wereabout60-70ppb. Therefore,photochem-ical ozoneproductionfrom localemissionswasat leastabout50ppbduringthisday. Theaircraftlooped6 timesaroundthecity during the afternoonon the sametrajectory. Thus,onecanplot, at eachtrajectorypoint, a time seriesof the ozoneconcentrations.
We representin Figure4 this time evolution for four se-lected points. The first (second)location, in the northeast(southwest)of Paris, is usedto characterizethe ozonecon-centrationupstream(downstream)of Paris.Theothertwo lo-cations(southeastandnorthwestof Paris)arechosensuchasto documentozoneconcentrationsin the cross-winddirec-tion. Theselocationsare further referredto asNE, SW, SEandNW (Figure4). On the leeside,downwind of Paris, theozoneincreaseis very pronouncedwhile on theupwindsideconcentrationsdonotvarymuchduringtheafternoon.At thetwo otherlocations,concentrationsreachintermediatevalues,with a peakoccurringearlier than in the plume.The samebehaviour is observed from groundstations.At Montge enGoele(about40 km NE of Paris),peakconcentrationsreachabout60 ppbwhile at Rambouillet(soutwestof Paris),peak

10 MenutL. et al.: MeasurementsandModelingof AtmosphericPollutionover theParisArea:An Overview of theESQUIF Project
(a) (b)
(c) (d)
Fig. 3. Back-trajectoriesendingin Paris on (a) 6 August1998,(b) 7 August1998,(c) 8 August1998and(d) 9 August1998.
Table6. Aircraft operationsduring theIOP 2. ’Loops’ refers to thenumberof circlesmadearoundParis during theflight.
Aircraft Day Time period(UT) Flight type Loops Levels(m)MERLIN 7A98 0609-0711 Suburban 1 500
7A98 1224-1540 Suburban 6 5008A98 0454-0832 Meso 1 9008A98 1232-1448 IdF 1 5009A98 0451-0826 Meso 1 9009A98 1254-1513 Suburban 5 500
AZTEC-MF 7A98 0725-0817 Urban 3 300,900,1500,16507A98 1444-1542 Urban 3 300,900,1500,16508A98 0558-0837 IdF 1 165,330,5008A98 1158-1255 Suburban 1 5008A98 1443-1534 Suburban 1 5009A98 0556-0852 IdF 1 165,500,16509A98 1314-1625 IdF 1 165,500,1650
AZTEC-LSCE 7A98 0727-0919 IdF 1 300,600,15007A98 1320-1522 IdF 1 300,600,1500

MenutL.� etal.: MeasurementsandModelingof AtmosphericPollutionover theParisArea:An Overview of theESQUIF Project 11
12� 13� 14� 15� 16�50
60
70
80
90
100
110
120
130
140
12� 13� 14� 15� 16�50
60
70
80
90
100
110
120
130
140
O3
(ppb
)
7 August 1998�9 August 1998�
12� 13� 14� 15� 16�Time (h)�
50
60
70
80
90
100
110
120
130
140
O3
(ppb
)
12� 13� 14� 15� 16�Time (h)�
50
60
70
80
90
100
110
120
130
140
1.9 2.1 2.3 2.5 2.7Longitude
48.50
48.60
48.70
48.80
48.90
49.00
49.10
Latit
ude
Flight traj.Paris
North−West
North−East
South−West!
South−East!
NW NE
SW!
SE!
Paris"
Fig. 4.Aircraft measurementsof ozone, on7A98and9A98,at 500mAGL. Thecentral boxpresentsthecity of Paris with the’Suburban’flight trajectoriessuperimposed.Alsoshownare the four represen-tativelocationsselectedto conductthepollution analysis(NW, NE,SE and SW, seetext for explainations).The time evolution of theozoneconcentration measured in theselocationsare presentedinthesurroundingboxes.
valuesareof theorderof 125ppb(seeFigure8). In theurbanarea,concentrationsaresimilar to upstreamvalues.
On 8A98, thesurfaceconcentrationsmeasuredat all sta-tions peaked around1200 UTC which is quite unusual(aspeaksaregenerallyobservedaround1500UTCovertheParisarea).A secondmaximumof ozoneconcentrationis observedat the expectedtime (1600 UTC). In the afternoon,back-groundvaluesin Montge en Goelearelarger thanon 7A98.Theplumeoccursmorewestward,dueto light easterlies.Bycomparingupstreamanddownstreamvalues(not shown) weconcludethattheozoneproductionis approximately25 ppb.
On 9A98, theevolution of theozoneconcentrationmea-suredat500m AGL duringthe5 ’Agglo’ flightsexhibit sim-ilar trendsin the NE, NW andSW locations(Figure4), thevaluesin theSWlocationbeingapproximately10ppblarger.Thebackgroundconcentrationsaremuchlargerthanon7A98
-6˚ -4˚ -2˚ 0˚ 2˚ 4˚ 6˚ 8˚ 10˚ 12˚44˚
45˚
46˚
47˚
48˚
49˚
50˚
51˚
52˚
53˚
54˚
55˚
75
70
606766
85
8580
84
6666
90
82
ARPEGE BACKPLUMES FOR 09/08/1998
Fig. 5.Aircraft measurementsperformedduringtheMesoflight per-formedon 9A98during themorning(0451-0826UTC): boxesindi-catetheozoneconcentrations(ppb)at 900m.Thetwo setsof back-trajectoriesendingat thenortheast(with [O # ]=66ppb) andsouth-west(with [O # ]=82ppb) corners of the Mesoflight (9A98at 0600UTC) are estimatedfrom back-trajectoriesmodeling. Each pointcorrespondsto 24h stepsbefore the endingtime, showingthe airmassestrajectoriesandthetimespentaboveurbanand/orrural ar-eas.
and8A98. Meanozoneconcentrationsdifferencesbetweendownwindandupwindof Parisareabout30 ppb.
Concentrationsof ozonemeasuredalongtheMesoflightwerealsovery interesting(Figure2): Theflight altitudewasabout900m AGL, above therising mixedlayer, early in themorning.High concentrations(80-90ppb)werefoundin thesouthernbranchwhile in thenorthernbranchconcentrationsweremoderate(60-70ppb).The explanationof suchtrendscanagainbegivenin termsof backtrajectories.
Figure5 shows the backtrajectories,calculatedwith thesamemodel as above, arriving at the northeastand south-westcornersof the Mesoflight trajectory. The air massar-riving at the northeastcorneroriginatesfrom the ocean,be-forespendingabout24hoursabovecontinentalpollutedareas(Benelux).Theair massarriving at thesouthwestcornerhastravelledabove centralEngland,Benelux,westernGermanyandcentral-eastFrance.It hasspentmorethanfour daysovercontinentalareas,which apparentlycausesthe higherozoneconcentrations.It is noteworthy thatduring thetwo daysbe-forearrival, theair massesarriving atthesouthwesterncornerof theParismetropolitanarea,essentiallycrossesrural areas,but with potentiallyhighbiogenicemissions,especiallygiventhe hot temperaturesat this time (about30-35$ C). The rela-tive importanceof biogenicversusanthropogeniccontinentalemissionswill beinverstigatedwithin theESQUIF projectona modelingbasis,andwill bereportedin a futurearticle.
The important point here is that these measurementsdemonstratethathighozoneconcentrationscanbefoundoverruralareasremotefrom importanturbansources,andeventu-

12 MenutL. et al.: MeasurementsandModelingof AtmosphericPollutionover theParisArea:An Overview of theESQUIF Project
8 9 10 11 12 13 14 150
0.5
1
1.5
2
2.5
3
3.5
4
Time (UTC)
Alti
tude
(km
)
Soff
0.1
0.2
0.3
0.4
0.5
0.6
0.7
0.8
0.9
1
Fig. 6. Atmosphericreflectivityat a wavelengthof 0.53 % m as ob-tainedfromthebackscatterlidar locatedin Palaiseauduring 8 Au-gust1998.
ally betransportedinto urbanareas,togetherwith othernon-oxidisedprecursorspecies.
4.2 Impactof theverticalboundarylayer structure for theozoneconcentrationsmeasuredover theParis area
In addition to horizontal transportand chemicalprocesses,the accumulationor dispersionof pollutantsemittedat thesurfaceis alsodrivenby theconvectionprocesseswithin theABL.
On 7A98, the ozoneconcentrationsin Montge en GoeleandParisaremoderate(seeprevioussection).However, theconcentrationsmeasuredin Rambouilletat thesurfaceandat500m AGL werethelargestmeasuredduringtheIOP. Onthisday, the maximumABL depthis observedat 800 m around1200UTC which is muchshallower thanon 8A98and9A98andis not representativeof whatis generallyobservedduringthesummer. Moreover, it remainsconstantfor therestof theafternoon.Meso-scalesimulationsweredonewith theMeso-NH model showing that this atypical situationwas mainlydueto large-scalesubsidenceover the Parisarea.It is inter-estingto noticethat thelow ABL heightwasassociatedwiththestrongestozonegradientsbetweenthecity andtheplume,althoughwe cannotconcludedirectly that low ABL heightsfavours local ozoneproduction.Indeedseveral effects arecombined:thefirst IOP day, 7A98, is a Fridaywhile therestof the IOP occursduring the weekend,for which the emis-sionpatternis significantlydifferent;thesecondis thaturbanozoneconcentrationscanbelowerwhentheABL is low dueto ozonetitration by NO emissions;andthird, in a shallowABL higheraerosolconcentrationsmay alter the photolysisprocessesin the urbanarea,makingthe city-plumegradient
290& 295& 300' 305' 310( 315(0.0
0.5
1.0
1.5
2.0
2.5
3.0
3.5
Hei
ght (
km)
7A98 − 0532 UTC8A98 − 0528 UTC9A98 − 0534 UTC
290& 295& 300' 305' 310( 315(0.0
0.5
1.0
1.5
2.0
2.5
3.0
3.5
Hei
ght (
km)
7A98 − 1119 UTC8A98 − 1118 UTC9A98 − 1116 UTC
290& 295& 300' 305' 310( 315(Potential Temperature (K))
0.0
0.5
1.0
1.5
2.0
2.5
3.0
3.5
Hei
ght (
km)
7A98 − 1727 UTC8A98 − 1727 UTC9A98 − 1726 UTC
Fig. 7. Potential temperature soundingsperformed in Trappes,30 kmto thesouthwestof Paris on 7-9August1998.
higher. All thesehypotheseswill be testedusingnumericalmodeling,andwill bereportedin futurearticles.
On 8A98, the0830UTC temperaturesounding(not pre-sentedhere)exhibiteda synopticinversionat 1300m whichwas also observed on the lidar-derived atmosphericreflec-tivity (Figure 6) measuredin Palaiseau(approximativelyhalfway betweenParis and Rambouillet).The diurnal evo-lution of the lidar signal shows the maintenanceof an ele-vatedpolluted layer (from 600 and1300m) between0800and0900UTC which wasdecoupledfrom thesurfaceby thenocturnalinversion(the heightof the nocturnaltemperatureinversionwas observed at 600 m on the 7A98 2318 UTCsounding).Around 1000 UTC, the residual layer was ab-sorbedby the growing ABL. Surfaceozoneconcentrations

MenutL.* etal.: MeasurementsandModelingof AtmosphericPollutionover theParisArea:An Overview of theESQUIF Project 13
measuredin Rambouilletdid notexhibit asuddenincreaseatthis time periodwhich couldmeanthattheozoneconcentra-tion in the residuallayerwassmall.Thesurfaceozonecon-centrationin Rambouilletincreaseduntil 1200 UTC whilethe ABL height roseto approximately2300 m (from lidardataandtemperaturesoundings)until 1700UTC. The con-centrationdecreasebetween1200 and 1700UTC could beexplainedby entrainmentof low ozonebackgroundconcen-tration into the ABL. This is in agreementwith the fact thatthepreviousday’sboundarylayerwasratherlow andthatairmassesentrainedinto theABL thushavenotencounteredforthechemicalozoneproductionthedaybefore.
On9A98,theozoneconcentrationin RambouilletandtheABL depth increaseduntil 1700 UTC (Figure 8 and Fig-ure 7, respectively). However, the previous day’s ABL wasalsohigh,explaininghighozoneconcentrationsfoundathighaltitude.Ozonepeaksweremuchlaterthanthepreviousday,sincethedilution effect wasnot aseffective on this day. Wealsonoteanincrease,duringtheafternoon,in thebackgroundozone(seeon Figure8 theMontge-en-Goelestation),whichcouldalsoexplain the generalincreaseof all ozoneconcen-trationsat the end of the afternoon.Again, definitive con-clusionscanonly begivenafternumericalsimulationof theepisodeusingbothregionalandcontinentalscalemodels.
5 IOP2 of ESQUIF: Model analysis
The first goal of analysismodelingis to determineif CTMmodelsare able to reproducea complex pollution event astheoneobservedduringIOP2.Thesimulationwasperformedfrom 7A98(0000UTC) to 9A98(2300UTC). In orderto ac-countfor small-scalesurfaceheterogeneities,ECMWF pro-files were interpolatedto the surface using observed tem-peratureand pressuredata (from surface stations).Ozoneconcentrationsresultingfrom the three-dimensionalsimula-tions are comparedto thosemeasuredby surface stationson an hourly basis.In Figure 8, comparisonsaredisplayedfor Paris (top), Montge-en-Goele, northeastof Paris (mid-dle), andRambouillet,southwestof Paris (bottom).For thethreelocations,the agreementis fair over the threedays.InParis,on 7A98 and8A98, concentrationsarerepresentativeof the averagedobserved concentrations,and on 9A98, inParis, one notesa model underestimationat the end of theday. In Montge-en-Goele,themodelfits theobservationswellwhich arerepresentativeof backgroundozoneadvectedoverthewholesimulateddomain.OverRambouillet,on8A98and9A98, the modelfits well the surfaceozoneconcentrations,but somediscrepanciesappearon 7A98 where the plumeintensity is underestimated.In order to understandthis un-derestimation,we turn to Figure9 which displaysa mapofsimulatedozone(in ppb,at z=500m AGL, on 7A98 andat1500UTC) over theParisarea.
Thesesimulatedozonevaluesare comparedto aircraftozone measurements,performedat the sameperiod. Theplumeamplitudeis well reproduced,but it is slightly shiftedsouthward comparedto observations.The discrepanciesbe-tweenmodelledand observed valuesmay be explained interms of the meanmeteorologicalforcing fields used: theECMWF inputscorrespondto themeanflow over thewholedomain,without topographyat small scale.Errors induced
0+
6,
12- 18. 24/ 30+
36,
42- 48. 54/ 60+
66,
72-Time (UT)
0
30
60
90
120
150
Par
is −
O3
(ppb
)
0
Station P131Station Eiffel Tower1Station P181Model2
0+
6,
12- 18. 24/ 30+
36,
42- 48. 54/ 60+
66,
72-Time (UT)
0
30
60
90
120
150
Mon
tge
en G
oele
− O
3 (p
pb)
3
Station4Model5
0+
6,
12- 18. 24/ 30+
36,
42- 48. 54/ 60+
66,
72-Time (UT)
0
30
60
90
120
150
Ram
boui
llet −
O3
(ppb
)
6
Station1Model2
Fig. 8. Surfaceozoneconcentrations (ppb) measurementsby AIR-PARIF from 7 to 9 August 1998 (from 0 to 72h) in Paris (top),Montge enGoele(middle),andRambouillet(bottom).TheMontgeen Goele and Rambouilletsuburban stations are located to thenortheastandsouthwestof Paris, repectively. ResultsfromtheCTMmodelare addedat each locationfor comparisonwith in-situ mea-surements
using thesemeteorologicalfields may be of the order of afew percentfor wind speedanddirection.Thenext stepto im-prove theanalysesperformedwith POLLUTO will beto usesimulationsmadeby a fully mesoscalemodel,suchasMeso-NH in orderto accountfor small-scaletopographyandmoreaccurateturbulent effects.This stepis currently in prepara-tion.
6 Summary and conclusion
The objectivesand the experimentalset-upof the ESQUIFprojecthave beenpresented.Numerousgroundandairbornemeasurementshave beenacquiredin thecourseof 10 IOPs,which covera varietyof meteorologicalsituationsleadingtoair pollution in the region of Paris. This project is part of aseriesof Europeanprojectsdedicatedto atmosphericpollu-tion whichhavebeenundertakenrecently. With respectto theotherprojects,oneoutstandinggoalof theESQUIF projectisto implementa thoroughdatabasewhich would includethemeasurementsaswell asmodelsimulations.This databaseexists(http://www.lmd.ens.fr/ESQUIF/) andwill beavailable

14 MenutL. et al.: MeasurementsandModelingof AtmosphericPollutionover theParisArea:An Overview of theESQUIF Project
48.5
48.6
48.7
48.8
48.9
49.0
49.1
49.2
1.75 2.00 2.25 2.50 2.75 3.00 48.5
48.6
48.7
48.8
48.9
49.0
49.1
49.2
1.75 2.00 2.25 2.50 2.75 3.00 48.5
48.6
48.7
48.8
48.9
49.0
49.1
49.2
1.75 2.00 2.25 2.50 2.75 3.00 6062646668707274767880828486889092949698
100102104106108110
97 84 83
78 87
110 105
108
113
108
110
95
77 87
89 76
60 76 75 70
64 56
53 58
64
74
89
88 91
98 102
103
PARIS
Trappes
Montge
Rambouillet
Fig. 9. Measurementsandmodelcomparisonfor [O 7 ] (ppb)concentrationson7A98at 500mAGL and1500UTC.Thecity of Paris is at thecenterof themodeldomain,andtheconcentrationsare representativeof thevertical boxmodelat z=500m.Theaircraft measurementswereperformedduring a ’Suburban’ flight (7A98,from1430to 1500UTC,with theMERLINaircraft, seeTable6) and[O 7 ] (ppb)measurementsare superimposedalongtheflight trajectory. Wind vectors are issuedfromECMWFdata.
shortlyto thescientificcommunityinterestedonatmosphericpollution studies.
In this paper, we have presentedpreliminary resultsobtained during the secondIOP of ESQUIF, in August1998. The study conductedhere demonstratesthat only acontinental-scaleapproachenablesa thoroughunderstandingof atmosphericphotochemicalpollution over a stronglyur-banizedareasuchas Paris. Indeed,strongpollution eventswere diagnosedto be influencedby dynamicaland chemi-cal processesat differentscales.A major reasonfor this iscertainly the absenceof marked orography. For the situa-tions documentedhere, it was shown that, besidessurfaceemissions,themajorfactorsdriving pollutantsconcentrationswerecontinental-scaletransportandconvectiveactivity.
The main resultof this studyis to show that,combiningmodelingand experimentation,we could identify the con-tribution of local productionversusregional transportto theozonepeak.Using this combinedapproach,we have shownthaton 7A98, thepollution event is mainly dueto local pro-duction,whereason9A98,highozoneconcentrationsareduebothto localproductionandregionalozonetransport.
Acknowledgments
This work was supported by the Institut Pierre-SimonLaplace(IPSL), the Ministerede l’Am enagementdu Terri-toire et de l’Environnement,the ConseilRegionald’Ile-de-France,the Commissariata l’Energie Atomique, and Elf-Aquitaine.We areindebtedto all ourcolleaguesfrom LSCE,SA, LMD, LISA, METEO-FRANCEand AIRPARIF whohaveoperatedtheinstrumentsduringthecampaign.
References
Ancellet G., and F. Ravetta, ’Compactairbornelidar for tropo-sphericozone:descriptionandfield measurements’,Applied Op-tics,37, (1998)5509-5521.Aumont, B., A. Jaecker-Voirol, D. Martin and G. Toupance,’Tests of some reduction hypothesisin photochemicalmecha-nisms:applicationto air quality modelingin the Paris area’,At-mosphericEnvironment,30 (1997)2061-2077.Beekmann M. and M. Lattuati , ’Developmentof a gas-phasechemistrymechanismand comparisonwith RAKM and EMEPmechanisms’,submittedto AtmosphericEnvironment, (2000).Centre InterprofessionelTechniqueEtude de la Pollution At-mopsherique(CITEPA), Inventairedesemissionsde SO8 , NO9 ,poussieres,COVNM, CH: dansl’atmosphereenIle-deFranceen1990,Etude136,Paris,France,1993.

MenutL.; etal.: MeasurementsandModelingof AtmosphericPollutionover theParisArea:An Overview of theESQUIF Project 15
Doran J.C, etal., ’The IMADA-AVER boundarylayerexperimentin theMexico city area’,Bulletin of theAmericanMeteorologicalSociety, 79, (1998)2497-2508.Dupont E., L. Menut, B. Carissimo,J. Pelonand P.H. Flamant,’Observationsof theatmosphericboundaryLayer in Parisanditsruralsuburbs:theECLAPexperiment’,AtmosphericEnvironment,(1999)33, 979-994.Francey, R.J., et al., Global atmosphericsampling laboratory(Gaslab):supportingandextendingthe CapeGrim tracegaspro-grams,Baseline1993,(1996)8-29.Generationof EuropeanEmissionDatafor Episodes(GENEMIS)project,EUROTRAC Annualreport1993,part5,EUROTRAC Int.Sci.Secretariat,Garmish-Partenkirchen,Germany, 1994Gros, V., Sarda-Esteve, R., Bonsang, B. and Ramonet M. ,Mesuredu monoxydede carbonepar chromatographieen phasegazeuse,ReportDSM/CEA Saclay, CEA-R-5814,(1998).Holben B. N., T. F. Eck, I. Sluster, D. Tanre, J. P. Buis, A. Set-zer, E. Vermote,J. A. Reagan,Y. J. Kaufman, T. Nakajima, F.Lavenu,I. Jankowiak and Z. Smirnov, ’AERONET-A FederatedInstrumentNetwork anddataarchive for aerosolcharacterisation,Rem.Sens.Environ., 66 (1998)1-16.Hourdin, F., and A. Armengaud, ’Testof a hierarchyof finite-volumeschemesfor transportof tracespeciesin an atmosphericgeneralcirculationmodel’,Mon. Wea.Rev., (1998)(in press).Hourdin, F., F. Couvreuxand L.Menut , ’Parameterizationof thedry convective boundarylayerbasedonamassflux representationof thermals’,Journalof AtmosphericSciences,(2000)(submitted).Jaecker-Voirol A., M. Lipphardt, B. Martin, P. Quandalle, J.Salles,B. Carissimo, E. Dupont, L. Musson-Genon,P.M. Ri-boud, B. Aumont, G. Bergametti, I. Bey and G. Toupance, ’A3D regionalscalephotochemicalair quality model:applicationtoa 3 daysummertimeepisodeover Paris’, Rev. Inst.Fr. Petrole,53,(1998)225-237.Jin S.and K. Demerjian, ’A photochemicalbox modelfor urbanair qualitystudy’,AtmosphericEnvironment,27B (1993)371-387Lafore J. P., Stein J., Asencio N., Bougeault P., Ducrocq V.,Duron J., Fischer C., Hereil P., Mascart P., MassonV., PintyJ. P., Redelsperger J. L., Richard E. and Vila-Guerau de Ar el-lano J., ’The Meso-NH atmosphericsimulationsystem.Part I :adiabaticformulationandcontrolsimulations’,AnnalesGeophys-icae,16 (1998)90-109.Lehning M., H. Richner, G. L. Kok, B. Neininger, ’Verticalex-changeandregional budgetsof air pollutantsover denselypopu-latedareas’,AtmosphericEnvironment,32 (1998)1353-1363.LossecB., ’Situationmeteorologiqueet pollution photo-oxydantesurla regionParisienne’,La metorologie(in french),8 (1994)n< 8.McElr oy J., Smith T. B., ’Creationandfateof ozonelayersaloftin southernCalifornia’, (1993) AtmosphericEnvironment,27A1917-1929.Milf ord, J.B., Gao, D. and Sillman, S., ’Total reactive nitrogen(NO= ) as an indicator of the sensitivity of ozoneto reductionsin hydrocarbonandNO> emissions’,J. Geophys.Res.99 (1994)3533-3542.Menut L., C. Flamant and J. Pelon, ’Evidenceof synopticscaleinfluenceon theatmosphericboundarylayerdynamicsandturbu-lent processesover theParisarea’,BoundaryLayerMeteorology,93 (1999)269-286.Menut L., R. Vautard, M. Beekmannand C. Honore, ’Sensitiv-ity of PhotochemicalPollution usingthe Adjoint of a SimplifiedChemistry-TransportModel’, J. Geophys.Res.(2000),105, D12,15,379-15,402.Neftel A., ’Examplesof theimportanceof tracegasmeasurementsin theMilan ozoneplume’,Analusis,27 (1999)325-327.Peuch V.H, M. Amodei, T. Barthet, M.-L. Cathala, B. Josse,M. Michou, P. Simon, ’MOCAGE : Modele de Chimie At-mospherique a Grande Echelle’, ’Atelier de Modelisation del’Atmosphere’ Conference,Toulouse- France(1999).
Prevot A.S.H., J. Staehelin, G.L. Kok, R.D. Schillawski, B.Neininger, T. Staffelbach,A. Neftel,H. Wernli, andJ. Dommen,TheMilan photooxidantplume,J. Geophys.Res.,102, (1997)23375-23388.RappenglueckB., Jakobi G., Fabian P., ’Comparisonof PANandO? measurementsduringBERLIOZ’, EGSConference,Nice,France(2000).SallesJ, J. Janischewski,A. Jaecker-Voirol, andB. Martin , Mo-bile sourceemissionsinventory model: Application to the Parisarea,Atmos.Environ., 30, (1996),1965-1975Sillman S., ’The useof NO= , H @ O@ , andHNO? asindicatorsforozone-NO> -hydrocarbonsensitivity in urban locations’, J. Geo-phys.Res.100(1995)14175-14188.Souffland, D., ’Developpement et Validation d’un ModeleTridimensionnel Non-Hydrostatique d’Ecoulements Meso-MeteorologiquesenTerrainComplexe - Le CodeMercure’,PHDdissertation,InstitutNationalPolytechniquedeGrenoble,(1985).Touaty, M. , Dveloppementinstrumentalde la mesureen continudeshydrocarbures lgers par chromatographieen phasegazeuse,PhDThesis,Univ. Paris7, (1999).Tulet P., A. Maalej, V. Crassier and R. Rosset, ’An episodeofphotooxidantplumepollution over theParisregion’, AtmosphericEnvironment,33 (1999)1651-1662.Vautard R., BeekmannM., Menut L. and M. Lattuati , ’Appli-cationsof adjoint modelingin urbanair pollution’. Proceedingsof EUROTRAC Symposium’98, Eds.P. M. Borrell andP. Borrell,WITPress,Southampton,(1999)502-508.Vautard R., M. Beekmann,J. Roux, D. Gombert, ’Validationof a deterministicforecastingsystemfor the ozone concentra-tionsover theParisarea’,submittedto AtmosphericEnvironment,(2000).Volz-ThomasA., Mihelic D., Konrad S.,Ptz H.-W. Houben N.,Platt U., Perner D., 2000, ’Local ozoneproductionratesfromphotostationarystateof O3/NOx and from peroxy radicalmea-surementsin theplumeof Berlin duringtheBERLIOZ campaign’,EGSConference,Nice,France.WeselyM. L. , ’Parameterizationof surfaceresistancesto gaseousdry depositionin regional scalenumericalmodels’,AtmosphericEnvironment,23, n< 6, (1989)pp.1293-1304Ziomas I. C., ’The Mediterraneancampaign of photochem-ical tracers-transportand chemical evolution (MEDCAPHOT-TRACE):An outline’,AtmosphericEnvironment,32(1998)2045-2054


![½½Ú½]]½]††]†‘‘‘†‘oooÖÖÖFFFF]]Ö]ðð]ð^^ð^ ^ mmmøøø ...khalifatullahmehdi.info/Books/Urdu/Mahiyat-ut-Taqleed.pdf · V ÷ F F ò{z¤/$̇{á*¦VxÏÈ]|](https://img.pdfslide.tips/doc/110x75/5f96e6f67195673ef7537496/aaaaaaaaoooffff-mmm.jpg)


![РРРРЫРШРРР- spbrta.customs.ruspbrta.customs.ru/spbrta/images/stories/Newsletters/almanah_17.pdfK Z g d l I _ l _ j [ m j ] k d b c b f _ g b < ; ; h [ d h](https://img.pdfslide.tips/doc/110x75/5e3e4e21a368250bc76a02b0/-k-z-g-d-l-i-l-j-m-j-k-d-b-c-b-f-g-b.jpg)


![TEDET62 Science G6 [All Star] · ü ß ü ì÷ ý ÿêø d ððø ëöý Öþ ð xì ð ð ð ð ð ð ð ð ð ð ð ð ð ð ð ð ð ð ð ð ð ð ð ð ð ð ð ð ð ð ð ð](https://img.pdfslide.tips/doc/110x75/6020b9b9469d0105f23a7d89/tedet62-science-g6-all-star-d-x.jpg)


![f N w ¶Í ï1 `o ÏsY q mX `h Ðf & åpqx s 4Q b Ð { y spbT Ð f xb]M Ð > yf iZws: \sbOjt Ï ç ó ²w Ð è a ôsMpbU ÏOj Ù q T óhTs ÐwST[ Ð sMp¾V !Zh\Ov Ðp Ï\ x \që F](https://img.pdfslide.tips/doc/110x75/5e4327c410aaac5bc23b546a/f-n-w-1-o-sy-q-mx-h-f-pqx-s-4q-b-y-spbt-f-xbm-.jpg)