Embed Size (px)
Citation preview
ASEANの大企業(1)
Large ASEAN
Companies
フォーブス世界2000・日経アジア・他抜粋/Forbes G
lobal 2000, Nikkei A
sia 300, etc.
5. 企業(2)
Enterprises
★ フォーブ
ス世界の有力企業2000にランクインした
ASEANの大企業/Large ASEAN Enterprises Listed on Forbes Global 2000 Leading Companies
順位/Rank
企業名 /Com
pany国 /Country
190PTT PCL
タイ(Thailand)
245DBS G
roupシンガポール(Singapore)
301Oversea-Chinese Banking Corp.
シンガポール(Singapore)
330SingTel
シンガポール(Singapore)
332United O
verseas Bankシンガポール(Singapore)
386Bank Rakyat Indonesia
インドネシア(Indonesia)
388Wilmar International
シンガポール(Singapore)
390Maybank
マレーシア(Malaysia)
490Tenaga N
asionalマレーシア(Malaysia)
494Bank M
andiriインドネシア(Indonesia)
564Bank Central Asia
インドネシア(Indonesia)
592Broadcom
シンガポール(Singapore)
604Siam
Cement
タイ(Thailand)
616Siam
Commercial Bank
タイ(Thailand)
632Public Bank
マレーシア(Malaysia)
642Kasikornbank
タイ(Thailand)
653Telkom
Indonesiaインドネシア(Indonesia)
671CIM
B Group Holdings
マレーシア(Malaysia)
672Krung Thai Bank
タイ(Thailand)
791Sime Darby
マレーシア(Malaysia)
804Bangkok Bank
タイ(Thailand)
823SM Investm
entsフィリピン(Philippines)
924Bank N
egara Indonesiaインドネシア(Indonesia)
948CapitaLand
シンガポール(Singapore)
985CP All
タイ(Thailand)
992Singapore Airlines
シンガポール(Singapore)
1018BDO Unibank
フィリピン(Philippines)
1026PTT G
lobal Chemical
タイ(Thailand)
1107ThaiBev
タイ(Thailand)
1110Flextronics International
シンガポール(Singapore)
1138Keppel
シンガポール(Singapore)
1149Charoen Pokphand Foods
タイ(Thailand)
順位/Rank
企業名 /Com
pany国 /Country
1151JG Sum
mit Holdings
フィリピン(Philippines)
1170Global Logistic Properties
シンガポール(Singapore)
1176Ayala
フィリピン(Philippines)
1196Advanced Info Service
タイ(Thailand)
1228Top Frontier Investm
ent Holdingsフィリピン(Philippines)
1259Genting
マレーシア(Malaysia)
1319Petronas Chem
icalsマレーシア(Malaysia)
1353Airports of Thailand
タイ(Thailand)
1373Gudang G
aramインドネシア(Indonesia)
1405RHB Bank
マレーシア(Malaysia)
1414Olam International
シンガポール(Singapore)
1472Hong Leong Financial
マレーシア(Malaysia)
1509Thai O
ilタイ(Thailand)
1510Axiata G
roupマレーシア(Malaysia)
1531Metropolitan Bank & Trust
フィリピン(Philippines)
1543MISC
マレーシア(Malaysia)
1596Maxis
マレーシア(Malaysia)
1633Vietin Bank
ベトナム(Vietnam
)1656
Joint Stock Commercial Bank for Foreign Trade of Vietnam
ベトナム(Vietnam
)1682
Commercial Bank For Investm
ent & Developm
ent Of Vietnam
ベトナム(Vietnam
)1719
City Developm
entsシンガポール(Singapore)
1757Indoram
a Venturesタイ(Thailand)
1771AmBank G
roupマレーシア(Malaysia)
1783Frasers Centrepoint
シンガポール(Singapore)
1793Aboitiz Equity Ventures
フィリピン(Philippines)
1823Golden Agri-Resources
シンガポール(Singapore)
1874ST Engineering
シンガポール(Singapore)
1881Petronas G
asマレーシア(Malaysia)
1888Vietnam
Dairy Products
ベトナム(Vietnam
)1909
China Aviation Oil
シンガポール(Singapore)
1947Manila Electric
フィリピン(Philippines)
Source: A
JC com
pilation, based on Global 2000 Leading C
ompanies (2017), http://w
ww.forbes.com
/global 2000/list
シンガポール(Singapore)
NoCom
pany企業名
IndustryFull time employees:
Revenue Unit: $US million
Total equity Unit: $US million
1Banyan Tree Holdings Ltd.
バンヤンツリー・ホールディングス Hotels/Resorts/Cruiselines
--224.21
390.722CapitaLand Ltd.
キャピタランド
Real Estate Developm
ent8,407
3,870.2612,185.81
3City D
evelopments Ltd.
シティ・デベロップメンツ
Real Estate Developm
ent2,482
2,828.716,433.03
4Com
fortDelGro Corp. Ltd.
コンフォートデルグロ
Other Transportation
22,0482,940.28
1,713.50
5DBS G
roup Holdings Ltd.DBSグ
ループ・ホールディングス
(DBS)
Regional Banks22,194
10,279.9529,623.45
6Global Logistic Properties Ltd.
グローバル・ロジスティック・プロ
パティーズ(GLP)
Real Estate Developm
ent1,126
902.28,711.37
7Hyfl ux Ltd.
ハイフラックス
Industrial Machinery
2,800714.86
513.888Keppel Corp. Ltd.
ケッペル・コーポレーション
Industrial Conglomerates
28,8794,901.51
8,070.159Olam International Ltd.
オラム・インターナショナル
Food: Major D
iversifi ed69,800
14,911.133,092.63
10Oversea-Chinese Banking Corp. Ltd.
オーバーシー・チャイニーズ銀行
(OCBC)
Regional Banks29,792
16,392.5725,270.25
11Raffl es M
edical Group Ltd.
ラッフルズ・メディカル・グループ Hospital/N
ursing Managem
ent--
343.03461.26
12Sem
bcorp Industries Ltd.セムコープ・インダストリーズ
Electric Utilities
8,0005,727.05
4,082.7313Singapore Airlines Ltd.
シンガポール航空(SIA)
Airlines25,194
10,744.399,363.05
14Singapore Exchange Ltd.
シンガポール取引所(SGX)
Investment Banks/Brokers
787579.19
749.9215Singapore Post Ltd.
シンガポール・ポスト
Air Freight/Couriers--
974.46972.82
16Singapore Press Holdings Ltd.
シンガポール・プレス・ホールディ
ングス(SPH)
Publishing: Newspapers
3,800811.9
2,580.86
17Singapore Technologies Engineering Ltd.
シンガポール・テクノロジーズ・エン
ジニアリング
Aerospace & Defense
21,5844,841.01
1,510.52
18Singapore Telecom
munications
Ltd.シンガポール・テ
レコム(シングテル)Major Telecom
munications
25,00012,076.12
20,175.48
19StarHub Ltd.
スターハブ
Wireless Telecom
munications
2,9651,735.92
134.9
20United O
verseas Bank Ltd. (Singapore)
ユナイテッド・オーバーシーズ銀行
(UOB)
Regional Banks23,904
8,221.8221,304.56
21UOL Group Ltd.
UOLグループ
Real Estate Developm
ent--
1,043.525,625.49
22Wilmar International Ltd.
ウィルマー・インターナショナル
Agricultural Commodities/
Milling
90,00041,401.68
14,434.53
マレーシア(Malaysia)
NoCom
pany企業名
IndustryFull time employees:
Revenue Unit: $US million
Total equity Unit: $US million
1AirAsia Bhd.
エアアジア
Airlines7,615
1,652.561,478.59
2Astro M
alaysia Holdings Bhd.アストロ・マレーシア・ホールディン
グス
Broadcasting4,850
1,351.56140.74
3Axiata G
roup Bhd.アクシアタ・グループ
Wireless Telecom
munications
25,0005,205.61
5,256.49
4CIM
B Group Holdings Bhd.
CIMBグループ・ホールディングス
(CIMB)
Regional Banks38,952
6,147.1610,144.48
5DRB-Hicom
Bhd.DRBハイコム
Motor Vehicles
58,1102,867.49
1,663.896Genting Bhd.
ゲンティン
Casinos/Gaming
49,7004,433.27
7,758.357Hartalega Holdings Bhd.
ハルタレガ
Medical Specialties
--433.24
380.18Hong Leong Financial G
roup Bhd.ホンリョン・フィナンシャル・グループ Finance/Rental/Leasing
--1,971.21
3,869.15
9IHH Healthcare Bhd.
IHHヘルスケア
Hospital/Nursing
Managem
ent35,000
2,419.154,900.96
10Malayan Banking Bhd.
マラヤン・バンキング(メイバンク)Regional Banks
43,9768,850.97
15,273.23
11Malaysia Airports Holdings Bhd.
マレーシア・エアポーツ・ホールディ
ングス
Other Transportation
10,0001,007.25
1,715.78
12Maxis Bhd.
マキシス
Major Telecom
munications
--2,078.78
1,052.3613MMC Corp. Bhd.
MMCコーポレーション
Engineering & Construction--
1,116.992,124.95
14PETRO
NAS Chem
icals Group Bhd.
ペトロナス・ケミカルズ・グループ Chem
icals: Specialty--
3,345.636,028.08
15Public Bank Bhd.
パブリック・バンク
Regional Banks18,651
4,528.307,626.68
16QL Resources Bhd.
QLリソーシズ
Agricultural Commodities/
Milling
--716.25
395.05
17Sapura Energy Bhd.
サプラ・エナジー
Oilfi eld Services/Equipm
ent--
1,842.492,952.05
18Sime Darby Bhd.
サイム・ダービー
Wholesale D
istributors120,000
7,254.448,699.28
19Telekom
Malaysia Bhd.
テレコム・マレーシア
Major Telecom
munications
28,0452,911.35
1,714.7320Tenaga N
asional Bhd.テナガ・ナショナル
Electric Utilities
35,68410,729.41
12,917.9121Top G
love Corp. Bhd.トップ・グローブ
Medical Specialties
10,000695.95
448.2822YTL Corp Bhd.
YTL Electric U
tilities--
3,436.853,455.80
インドネシア(Indonesia)
NoCom
pany企業名
IndustryFull time employees:
Revenue Unit: $US million
Total equity Unit: $US million
1PT Adaro Energy Tbk
アダロ・エナジー
Coal7,923
2,524.233,146.45
2PT Aneka Tam
bang Persero Tbkアネカ・タンバン
Other M
etals/Minerals
3,202684.66
1,366.393PT Astra International Tbk
アストラ・インターナショナル
Motor Vehicles
141,72813,614.92
8,309.594PT Bank Central Asia Tbk
バンク・セントラル・アジア (BCA)
Regional Banks26,364
4,821.268,345.37
5PT Bank M
andiri (Persero) Tbkマンディリ銀行
Regional Banks38,940
7,701.3911,167.48
6PT Bank Rakyat Indonesia (Persero) Tbk
バンク・ラクヤット・インドネシア
(BRI)
Regional Banks58,885
8,246.6510,868.16
7PT Bum
i Serpong Damai Tbk
ブミ・スルポン・ダマイ
Real Estate Developm
ent2,217
490.341,527.60
8PT Ciputra D
evelopment Tbk
チプトラ・デベロップメント
Real Estate Developm
ent3,359
535.87681.2
9PT G
aruda Indonesia (Persero) Tbk
ガルーダ・インドネシア航空
Airlines16,735
3,863.92992.8
10PT G
lobal Mediacom
Tbkグローバル・メディアコム
Broadcasting12,477
786.41685.42
11PT G
udang Garam
Tbkグダン・ガラム
Tobacco35,900
5,734.722,930.93
12PT Hero Superm
arket Tbkヘロー・スーパーマーケット
Food Retail15,007
1,028.38405.1
13PT Indofood Sukses M
akmur Tbk
インドフード・スクセス・マクムル Food: Specialty/Candy
83,3105,018.66
2,150.6214PT Kalbe Farm
a Tbkカルベ・ファルマ
Pharmaceuticals: O
ther12,736
1,456.66883.96
15PT Lippo Karaw
aci Tbkリッポー・カラワチ
Real Estate Developm
ent8,946
801.091,378.54
16PT M
itra Adiperkasa Tbkミトラ・アディプルカサ
Departm
ent Stores22,478
1,063.84237.78
17PT Perusahaan G
as Negara
(Persero) Tbkプルウサハアン・ガ
ス・ヌガラ(PGN)Oil & G
as Pipelines2,242
2,934.773,163.17
18PT Saratoga Investam
a Sedaya Tbk
サラトガ・インベスタマ・スダヤ
Investment Trusts/M
utual Funds
--81.58
1,409.11
19PT Sem
en Indonesia (Persero) Tbkセメン・インドネシア
Construction Materials
6,8281,964.92
2,155.1420PT Sum
ber Alfaria Trijaya Tbkスンブル・アルファリア・トリジャヤ Food Retail
42,1154,218.44
381.32
21PT Tam
bang Batubara Bukit Asam
(Persero) Tbkブキット・アサム
Coal2,568
1,057.02773.52
22PT Telekom
unikasi Indonesia Tbkテレコムニカシ・インドネシア
Major Telecom
munications
23,8768,746.57
6,263.4223PT U
nilever Indonesia Tbkユニリーバ・インドネシア
Household/Personal Care6,185
3,011.46349.17
24PT W
ijaya Karya Tbkウィジャヤ・カルヤ
Engineering & Construction2,187
1,178.07842.59
25PT XL Axiata Tbk
XLアクシアタ
Major Telecom
munications
1,8921,604.56
1,574.25
フィリピン(Philippines)
NoCom
pany企業名
IndustryFull time employees:
Revenue Unit: $US million
Total equity Unit: $US million
1Aboitiz Pow
er Corp.アボイティス・パワー
Electric Utilities
2,9441,877.61
2,114.442Alliance G
lobal Group, Inc.
アライアンス・グローバル
Industrial Conglomerates
38,1862,883.10
2,959.823Ayala Corp.
アヤラ・コーポレーション
Financial Conglomerates
--4,194.97
4,638.044Ayala Land, Inc.
アヤラ・ランド
Real Estate Developm
ent429
2,608.332,999.06
5BDO Unibank, Inc.
BDOユニバンク
Regional Banks31,443
2,593.864,360.91
6Bloom
berry Resorts Corp.ブルームベリー・リゾーツ
Casinos/Gaming
5,272639.88
484.927Cebu Air, Inc.
セブ・エア
Airlines4,123
1,303.48673.98
8DMCI Holdings, Inc.
DMCIホ
ールディングス
Industrial Conglomerates
121,366.64
1,359.819GT Capital Holdings, Inc.
GTキャピタル・ホールディングス Motor Vehicles
24,7154,118.62
2,309.37
10International Container Term
inal Services, Inc.
インターナショナル・コンテナ・ター
ミナル・サービシズ(ICTSI)
Other Transportation
8,0091,184.34
863.50
11JG Sum
mit Holdings, Inc.
JGサミット・ホールディングス
Industrial Conglomerates
21,4774,892.37
4,818.0112Jollibee Foods Corp.
ジョリビー・フーズ
Restaurants11,957
2,398.68676.27
13LT G
roup, Inc.LTグループ
Beverages: Alcoholic14,134
1,217.162,737.70
14Manila Electric Co.
マニラ電力(メラルコ)
Electric Utilities
5,5695,415.76
1,496.94
15Metro Pacifi c Investm
ents Corp.メトロ・パシフィック・インベストメ
ンツ
Real Estate Developm
ent49
943.823,058.22
16Philippine Long D
istance Telephone Co.
PLDT Major Telecom
munications
18,0383,480.11
2,176.01
17San M
iguel Corp.サンミゲル
Beverages: Alcoholic22,396
14,431.455,631.21
18SM Investm
ents Corp.SMインベストメンツ
Departm
ent Stores--
7,325.116,044.42
19SM Prim
e Holdings, Inc.SMプライム・ホールディングス
Real Estate Developm
ent11,242
1,704.264,656.39
20Universal Robina Corp.
ユニバーサル・ロビーナ
Food: Specialty/Candy29,801
2,378.711,548.12
★ 日
経アジア300 ASEAN
の大企業リスト(
国別)/Large ASEAN
Enterprises Listed on Nikkei Asia 300
日本企業のM&A
対象となってきた
ASEANの企業
急拡大するASEAN
のコングロマリット
首都 (Capital)人口100万人以上の都市 (City with more than 1 million people)2014年→2030年の人口を示す。 例:(1.5→2.0)150万人→200万人The number in the blanket ( ) indicates the number of population in 2004 and 2030. For example, (1.5 →2.0) 1.5 millions of persons → 2 millions of persons日本大使館・総領事館・駐在官事務所所在地 (Japanese embassies and consulates)日本人学校所在地 (Japanese school)日本人商工会議所所在地 (Japanese Chamber of Commerce and Industry)
ペナン
チョンブリー
(2.2→3.0)メダン(2.2→3.0)(6.6→9.4)クアラルンプール(6.6→9.4)
ジョホールバル
(1.3→2.5)バタム(1.3→2.5)
(1.1→1.7)プカンバル(1.1→1.7)
(1.5→1.9)パレンバン(1.5→1.9)
(10.2→13.8)ジャカルタ
(10.2→13.8)
(2.5→3.4)バンドン
(2.5→3.4)(1.1→1.5)ボゴール
(1.1→1.5)
(1.0→1.9)デンパサル(1.0→1.9)
(2.8→3.8)スラバヤ(2.8→3.8)(1.6→2.2)スマラン
(1.6→2.2)
(1.5→2.1)マカッサル(1.5→2.1)
コタキナバル
(1.4万人)
バンダルスリブガワン
(1.4万人)
(1.6→2.2)ダバオ(1.6→2.2)
セブ
(12.8→16.8)マニラ
(12.8→16.8)
ハノイ(3.5→5.5)
ハイフォン(1.0→1.6)ハイフォン(1.0→1.6)
ダナン
(9.1→11.5)バンコク(9.1→11.5)
(1.7→3.1)サムットプラーカーン(1.7→3.1)
ヤンゴン(4.7→6.6)
(1.7→2.6)プノンペン(1.7→2.6)
(7.1→10.2)ホーチミン(7.1→10.2)
(1.1→1.9)カントー(1.1→1.9)
マンダレー(1.14→1.7)
ネーピードー(1.0→1.4)
チェンマイビエンチャン(人口:80万人)
(5.5→6.6)(5.5→6.6)
ブルネイ・ダルサラーム
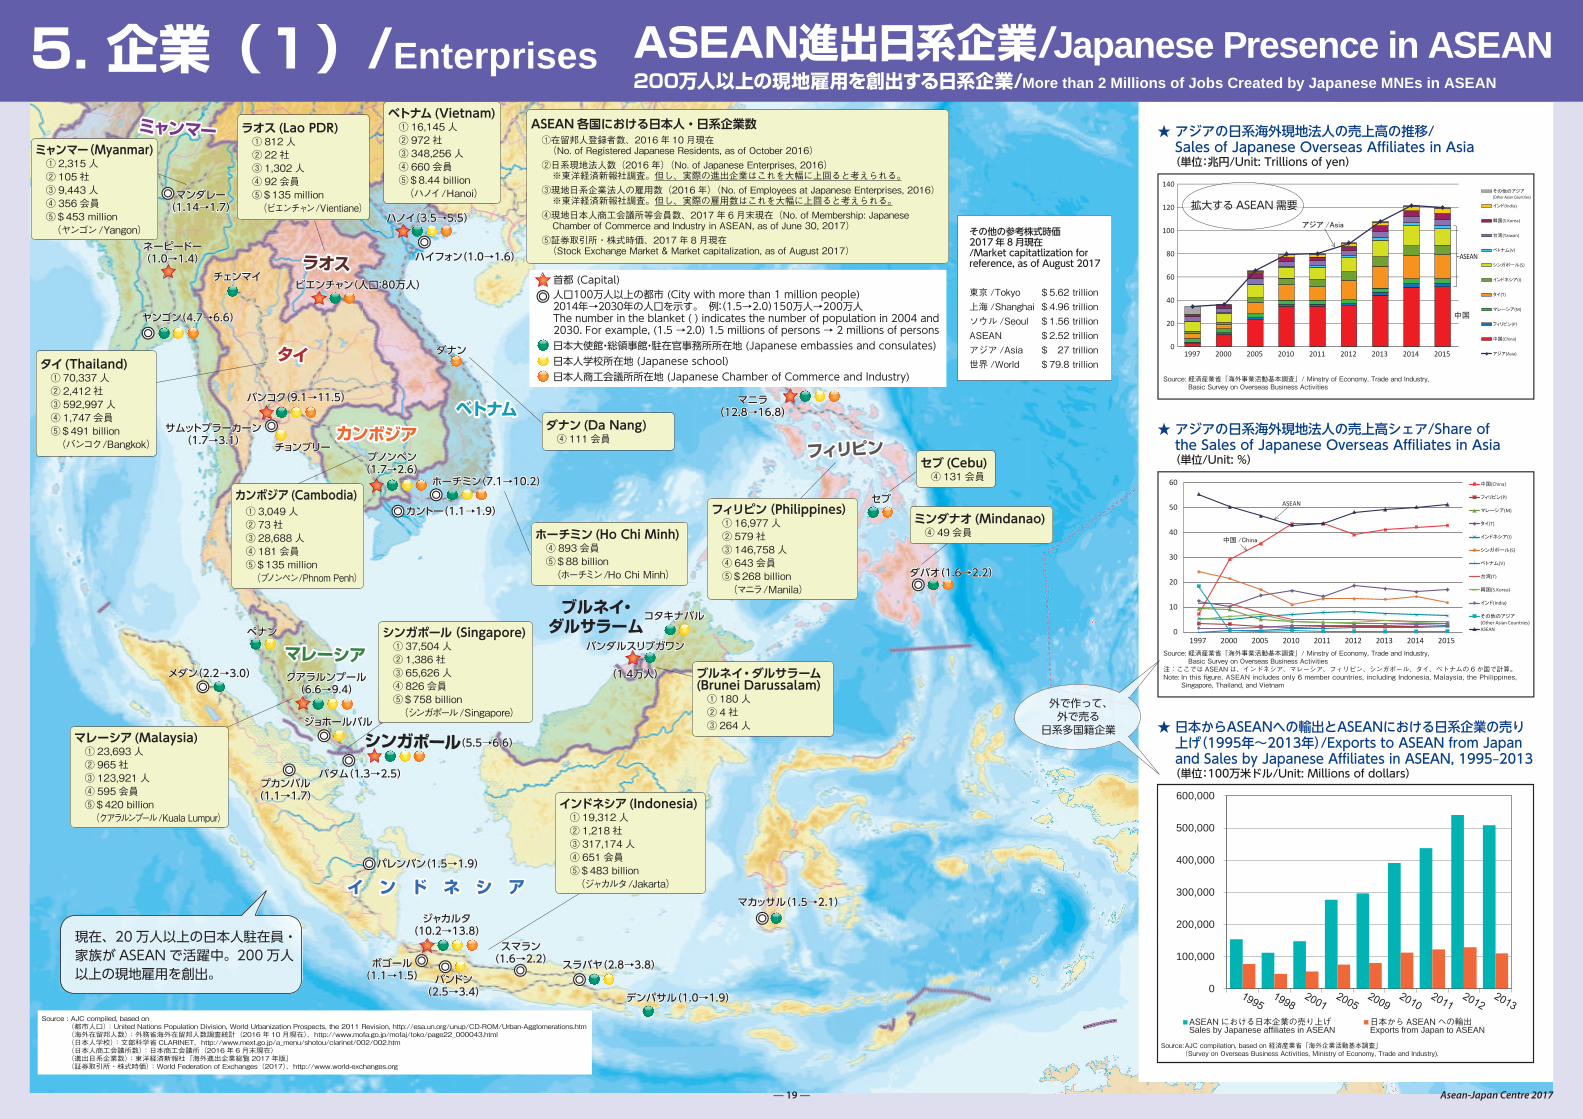
★ 日本からASEANへの輸出とASEANにおける日系企業の売り上げ(1995年~2013年)/Exports to ASEAN from Japan and Sales by Japanese Affiliates in ASEAN, 1995‒2013 (単位:100万米ドル/Unit: Millions of dollars)
★ アジアの日系海外現地法人の売上高シェア/Share of the Sales of Japanese Overseas Affiliates in Asia(単位/Unit: %)
★ アジアの日系海外現地法人の売上高の推移/Sales of Japanese Overseas Affiliates in Asia(単位:兆円/Unit: Trillions of yen)
0
100,000
200,000
300,000
400,000
500,000
600,000
ASEAN における日本企業の売り上げSales by Japanese affiliates in ASEAN
日本から ASEAN への輸出Exports from Japan to ASEAN
Source: AJC compilation, based on 経済産業省「海外企業活動基本調査」 (Survey on Overseas Business Activities, Ministry of Economy, Trade and Industry).
0
20
40
60
80
100
120
140
1997 2000 2005 2010 2011 2012 2013 2014 2015
その他のアジア
(Other Asian Countries)
インド(India)
韓国(S.Korea)
台湾(Taiwan)
ベトナム(V)
シンガポール(S)
インドネシア(I)
タイ(T)
マレーシア(M)
フィリピン(P)
中国(China)
アジア(Asia)
アジア /Asiaアジア /Asia
中国
ASEAN
0
10
20
30
40
50
60
1997 2000 2005 2010 2011 2012 2013 2014 2015
中国(China)
フィリピン(P)
マレーシア(M)
タイ(T)
インドネシア(I)
シンガポール(S)
ベトナム(V)
台湾(T)
韓国(S.Korea)
インド(India)
その他のアジア(Other Asian Countries)ASEAN
ASEAN
中国 /China
Source: 経済産業省「海外事業活動基本調査」/ Minstry of Economy, Trade and Industry, Basic Survey on Overseas Business Activities
Source: 経済産業省「海外事業活動基本調査」/ Minstry of Economy, Trade and Industry, Basic Survey on Overseas Business Activities 注:ここでは ASEAN は、インドネシア、マレーシア、フィリピン、シンガポール、タイ、ベトナムの 6 か国で計算。Note: In this figure, ASEAN includes only 6 member countries, including Indonesia, Malaysia, the Philippines,
Singapore, Thailand, and Vietnam
0
100,000
200,000
300,000
400,000
500,000
600,000
ASEAN における日本企業の売り上げSales by Japanese affiliates in ASEAN
日本から ASEAN への輸出Exports from Japan to ASEAN
Source: AJC compilation, based on 経済産業省「海外企業活動基本調査」 (Survey on Overseas Business Activities, Ministry of Economy, Trade and Industry).
0
20
40
60
80
100
120
140
1997 2000 2005 2010 2011 2012 2013 2014 2015
その他のアジア
(Other Asian Countries)
インド(India)
韓国(S.Korea)
台湾(Taiwan)
ベトナム(V)
シンガポール(S)
インドネシア(I)
タイ(T)
マレーシア(M)
フィリピン(P)
中国(China)
アジア(Asia)
アジア /Asiaアジア /Asia
中国
ASEAN
0
10
20
30
40
50
60
1997 2000 2005 2010 2011 2012 2013 2014 2015
中国(China)
フィリピン(P)
マレーシア(M)
タイ(T)
インドネシア(I)
シンガポール(S)
ベトナム(V)
台湾(T)
韓国(S.Korea)
インド(India)
その他のアジア(Other Asian Countries)ASEAN
ASEAN
中国 /China
Source: 経済産業省「海外事業活動基本調査」/ Minstry of Economy, Trade and Industry, Basic Survey on Overseas Business Activities
Source: 経済産業省「海外事業活動基本調査」/ Minstry of Economy, Trade and Industry, Basic Survey on Overseas Business Activities 注:ここでは ASEAN は、インドネシア、マレーシア、フィリピン、シンガポール、タイ、ベトナムの 6 か国で計算。Note: In this figure, ASEAN includes only 6 member countries, including Indonesia, Malaysia, the Philippines,
Singapore, Thailand, and Vietnam
Source : AJC compiled, based on (都市人口):United Nations Population Division, World Urbanization Prospects, the 2011 Revision, http://esa.un.org/unup/CD-ROM/Urban-Agglomerations.htm (海外在留邦人数):外務省海外在留邦人数調査統計(2016年 10月現在)、http://www.mofa.go.jp/mofaj/toko/page22_000043.html (日本人学校):文部科学省CLARINET、http://www.mext.go.jp/a_menu/shotou/clarinet/002/002.htm (日本人商工会議所数):日本商工会議所(2016年 6月末現在) (進出日系企業数):東洋経済新報社『海外進出企業総覧2017年版』 (証券取引所・株式時価):World Federation of Exchanges(2017)、http://www.world-exchanges.org
ASEAN各国における日本人・日系企業数①在留邦人登録者数、2016 年 10月現在 (No. of Registered Japanese Residents, as of October 2016)
②日系現地法人数(2016 年)(No. of Japanese Enterprises, 2016)※東洋経済新報社調査。但し、実際の進出企業はこれを大幅に上回ると考えられる。
③現地日系企業法人の雇用数(2016 年)(No. of Employees at Japanese Enterprises, 2016)※東洋経済新報社調査。但し、実際の雇用数はこれを大幅に上回ると考えられる。
④現地日本人商工会議所等会員数、2017 年 6月末現在(No. of Membership: Japanese Chamber of Commerce and Industry in ASEAN, as of June 30, 2017)
⑤証券取引所・株式時価、2017 年 8月現在(Stock Exchange Market & Market capitalization, as of August 2017)
ミャンマー(Myanmar)① 2,315 人② 105 社③ 9,443 人④ 356 会員⑤ $453 million(ヤンゴン/Yangon)
ラオス(Lao PDR)① 812人② 22社③ 1,302 人④ 92会員⑤ $135 million(ビエンチャン/Vientiane)
タイ(Thailand)① 70,337 人② 2,412 社③ 592,997 人④ 1,747 会員⑤ $491 billion(バンコク/Bangkok)
カンボジア(Cambodia)① 3,049 人② 73社③ 28,688 人④ 181 会員⑤ $135 million(プノンペン/Phnom Penh)
マレーシア(Malaysia)① 23,693 人② 965 社③ 123,921 人④ 595 会員⑤ $420 billion(クアラルンプール/Kuala Lumpur)
シンガポール(Singapore)① 37,504 人② 1,386 社③ 65,626 人④ 826 会員⑤ $758 billion(シンガポール/Singapore)
ブルネイ・ダルサラーム(Brunei Darussalam)① 180人② 4社③ 264人
フィリピン(Philippines)① 16,977 人② 579 社③ 146,758 人④ 643 会員⑤ $268 billion(マニラ/Manila)
ホーチミン(Ho Chi Minh)④ 893会員⑤ $88 billion(ホーチミン/Ho Chi Minh)
ダナン(Da Nang)④ 111会員
ベトナム(Vietnam)① 16,145 人② 972 社③ 348,256 人④ 660 会員⑤ $8.44 billion(ハノイ/Hanoi)
ミンダナオ(Mindanao)④ 49会員
セブ (Cebu)④ 131会員
インドネシア(Indonesia)① 19,312 人② 1,218 社③ 317,174 人④ 651 会員⑤ $483 billion(ジャカルタ/Jakarta)
■ GDP産業別構成比(2016)・GDP Classified by Sectors of Industry
現在、20万人以上の日本人駐在員・家族がASEANで活躍中。200 万人以上の現地雇用を創出。
5. 企業(1)/Enterprises ASEAN進出日系企業/Japanese Presence in ASEAN200万人以上の現地雇用を創出する日系企業/More than 2 Millions of Jobs Created by Japanese MNEs in ASEAN
その他の参考株式時価 2017年 8月現在/Market capitatlization for reference, as of August 2017
東京 /Tokyo $ 5.62 trillion上海 /Shanghai $ 4.96 trillionソウル /Seoul $ 1.56 trillionASEAN $ 2.52 trillionアジア /Asia $ 27 trillion世界 /World $ 79.8 trillion
拡大するASEAN需要
外で作って、外で売る
日系多国籍企業
— 19 — Asean-Japan Centre 2017

ASEANの大企業(1)Large ASEAN Companiesフォーブス世界2000・日経アジア・他抜粋/Forbes Global 2000, Nikkei Asia 300, etc.
5. 企業(2) Enterprises
★ フォーブス世界の有力企業2000にランクインしたASEANの大企業/Large ASEAN Enterprises Listed on Forbes Global 2000 Leading Companies順位 /Rank 企業名 /Company 国 /Country
190 PTT PCL タイ (Thailand)245 DBS Group シンガポール (Singapore)301 Oversea-Chinese Banking Corp. シンガポール (Singapore)330 SingTel シンガポール (Singapore)332 United Overseas Bank シンガポール (Singapore)386 Bank Rakyat Indonesia インドネシア (Indonesia)388 Wilmar International シンガポール (Singapore)390 Maybank マレーシア (Malaysia)490 Tenaga Nasional マレーシア (Malaysia)494 Bank Mandiri インドネシア (Indonesia)564 Bank Central Asia インドネシア (Indonesia)592 Broadcom シンガポール (Singapore)604 Siam Cement タイ (Thailand)616 Siam Commercial Bank タイ (Thailand)632 Public Bank マレーシア (Malaysia)642 Kasikornbank タイ (Thailand)653 Telkom Indonesia インドネシア (Indonesia)671 CIMB Group Holdings マレーシア (Malaysia)672 Krung Thai Bank タイ (Thailand)791 Sime Darby マレーシア (Malaysia)804 Bangkok Bank タイ (Thailand)823 SM Investments フィリピン (Philippines)924 Bank Negara Indonesia インドネシア (Indonesia)948 CapitaLand シンガポール (Singapore)985 CP All タイ (Thailand)992 Singapore Airlines シンガポール (Singapore)1018 BDO Unibank フィリピン (Philippines)1026 PTT Global Chemical タイ (Thailand)1107 ThaiBev タイ (Thailand)1110 Flextronics International シンガポール (Singapore)1138 Keppel シンガポール (Singapore)1149 Charoen Pokphand Foods タイ (Thailand)
順位 /Rank 企業名 /Company 国 /Country1151 JG Summit Holdings フィリピン (Philippines)1170 Global Logistic Properties シンガポール (Singapore)1176 Ayala フィリピン (Philippines)1196 Advanced Info Service タイ (Thailand)1228 Top Frontier Investment Holdings フィリピン (Philippines)1259 Genting マレーシア (Malaysia)1319 Petronas Chemicals マレーシア (Malaysia)1353 Airports of Thailand タイ (Thailand)1373 Gudang Garam インドネシア (Indonesia)1405 RHB Bank マレーシア (Malaysia)1414 Olam International シンガポール (Singapore)1472 Hong Leong Financial マレーシア (Malaysia)1509 Thai Oil タイ (Thailand)1510 Axiata Group マレーシア (Malaysia)1531 Metropolitan Bank & Trust フィリピン (Philippines)1543 MISC マレーシア (Malaysia)1596 Maxis マレーシア (Malaysia)1633 Vietin Bank ベトナム (Vietnam)1656 Joint Stock Commercial Bank for Foreign Trade of Vietnam ベトナム (Vietnam)1682 Commercial Bank For Investment & Development Of Vietnam ベトナム (Vietnam)1719 City Developments シンガポール (Singapore)1757 Indorama Ventures タイ (Thailand)1771 AmBank Group マレーシア (Malaysia)1783 Frasers Centrepoint シンガポール (Singapore)1793 Aboitiz Equity Ventures フィリピン (Philippines)1823 Golden Agri-Resources シンガポール (Singapore)1874 ST Engineering シンガポール (Singapore)1881 Petronas Gas マレーシア (Malaysia)1888 Vietnam Dairy Products ベトナム (Vietnam)1909 China Aviation Oil シンガポール (Singapore)1947 Manila Electric フィリピン (Philippines)
Source: AJC compilation, based on Global 2000 Leading Companies (2017), http://www.forbes.com/global 2000/list
シンガポール (Singapore)No Company 企業名 Industry Full time
employees:Revenue Unit: $US million
Total equity Unit: $US million
1 Banyan Tree Holdings Ltd. バンヤンツリー・ホールディングス Hotels/Resorts/Cruiselines -- 224.21 390.722 CapitaLand Ltd. キャピタランド Real Estate Development 8,407 3,870.26 12,185.813 City Developments Ltd. シティ・デベロップメンツ Real Estate Development 2,482 2,828.71 6,433.034 ComfortDelGro Corp. Ltd. コンフォートデルグロ Other Transportation 22,048 2,940.28 1,713.50
5 DBS Group Holdings Ltd. DBSグループ・ホールディングス(DBS) Regional Banks 22,194 10,279.95 29,623.45
6 Global Logistic Properties Ltd. グローバル・ロジスティック・プロパティーズ(GLP) Real Estate Development 1,126 902.2 8,711.37
7 Hyfl ux Ltd. ハイフラックス Industrial Machinery 2,800 714.86 513.888 Keppel Corp. Ltd. ケッペル・コーポレーション Industrial Conglomerates 28,879 4,901.51 8,070.159 Olam International Ltd. オラム・インターナショナル Food: Major Diversifi ed 69,800 14,911.13 3,092.63
10 Oversea-Chinese Banking Corp. Ltd.オーバーシー・チャイニーズ銀行(OCBC) Regional Banks 29,792 16,392.57 25,270.25
11 Raffl es Medical Group Ltd. ラッフルズ・メディカル・グループ Hospital/Nursing Management -- 343.03 461.26
12 Sembcorp Industries Ltd. セムコープ・インダストリーズ Electric Utilities 8,000 5,727.05 4,082.7313 Singapore Airlines Ltd. シンガポール航空(SIA) Airlines 25,194 10,744.39 9,363.0514 Singapore Exchange Ltd. シンガポール取引所(SGX) Investment Banks/Brokers 787 579.19 749.9215 Singapore Post Ltd. シンガポール・ポスト Air Freight/Couriers -- 974.46 972.82
16 Singapore Press Holdings Ltd. シンガポール・プレス・ホールディングス(SPH) Publishing: Newspapers 3,800 811.9 2,580.86
17 Singapore Technologies Engineering Ltd.シンガポール・テクノロジーズ・エンジニアリング Aerospace & Defense 21,584 4,841.01 1,510.52
18 Singapore Telecommunications Ltd. シンガポール・テレコム(シングテル)Major Telecommunications 25,000 12,076.12 20,175.48
19 StarHub Ltd. スターハブ Wireless Telecommunications 2,965 1,735.92 134.9
20 United Overseas Bank Ltd. (Singapore)ユナイテッド・オーバーシーズ銀行(UOB) Regional Banks 23,904 8,221.82 21,304.56
21 UOL Group Ltd. UOLグループ Real Estate Development -- 1,043.52 5,625.49
22 Wilmar International Ltd. ウィルマー・インターナショナル Agricultural Commodities/Milling 90,000 41,401.68 14,434.53
マレーシア (Malaysia)No Company 企業名 Industry Full time
employees:Revenue Unit: $US million
Total equity Unit: $US million
1 AirAsia Bhd. エアアジア Airlines 7,615 1,652.56 1,478.59
2 Astro Malaysia Holdings Bhd. アストロ・マレーシア・ホールディングス Broadcasting 4,850 1,351.56 140.74
3 Axiata Group Bhd. アクシアタ・グループ Wireless Telecommunications 25,000 5,205.61 5,256.49
4 CIMB Group Holdings Bhd. CIMBグループ・ホールディングス(CIMB) Regional Banks 38,952 6,147.16 10,144.48
5 DRB-Hicom Bhd. DRBハイコム Motor Vehicles 58,110 2,867.49 1,663.896 Genting Bhd. ゲンティン Casinos/Gaming 49,700 4,433.27 7,758.357 Hartalega Holdings Bhd. ハルタレガ Medical Specialties -- 433.24 380.18 Hong Leong Financial Group Bhd. ホンリョン・フィナンシャル・グループ Finance/Rental/Leasing -- 1,971.21 3,869.15
9 IHH Healthcare Bhd. IHHヘルスケア Hospital/Nursing Management 35,000 2,419.15 4,900.96
10 Malayan Banking Bhd. マラヤン・バンキング(メイバンク)Regional Banks 43,976 8,850.97 15,273.23
11 Malaysia Airports Holdings Bhd. マレーシア・エアポーツ・ホールディングス Other Transportation 10,000 1,007.25 1,715.78
12 Maxis Bhd. マキシス Major Telecommunications -- 2,078.78 1,052.3613 MMC Corp. Bhd. MMCコーポレーション Engineering & Construction -- 1,116.99 2,124.9514 PETRONAS Chemicals Group Bhd. ペトロナス・ケミカルズ・グループ Chemicals: Specialty -- 3,345.63 6,028.0815 Public Bank Bhd. パブリック・バンク Regional Banks 18,651 4,528.30 7,626.68
16 QL Resources Bhd. QLリソーシズ Agricultural Commodities/Milling -- 716.25 395.05
17 Sapura Energy Bhd. サプラ・エナジー Oilfi eld Services/Equipment -- 1,842.49 2,952.0518 Sime Darby Bhd. サイム・ダービー Wholesale Distributors 120,000 7,254.44 8,699.2819 Telekom Malaysia Bhd. テレコム・マレーシア Major Telecommunications 28,045 2,911.35 1,714.7320 Tenaga Nasional Bhd. テナガ・ナショナル Electric Utilities 35,684 10,729.41 12,917.9121 Top Glove Corp. Bhd. トップ・グローブ Medical Specialties 10,000 695.95 448.2822 YTL Corp Bhd. YTL Electric Utilities -- 3,436.85 3,455.80
インドネシア (Indonesia)No Company 企業名 Industry Full time
employees:Revenue Unit: $US million
Total equity Unit: $US million
1 PT Adaro Energy Tbk アダロ・エナジー Coal 7,923 2,524.23 3,146.452 PT Aneka Tambang Persero Tbk アネカ・タンバン Other Metals/Minerals 3,202 684.66 1,366.393 PT Astra International Tbk アストラ・インターナショナル Motor Vehicles 141,728 13,614.92 8,309.594 PT Bank Central Asia Tbk バンク・セントラル・アジア (BCA)Regional Banks 26,364 4,821.26 8,345.375 PT Bank Mandiri (Persero) Tbk マンディリ銀行 Regional Banks 38,940 7,701.39 11,167.48
6 PT Bank Rakyat Indonesia (Persero) Tbk
バンク・ラクヤット・インドネシア(BRI) Regional Banks 58,885 8,246.65 10,868.16
7 PT Bumi Serpong Damai Tbk ブミ・スルポン・ダマイ Real Estate Development 2,217 490.34 1,527.608 PT Ciputra Development Tbk チプトラ・デベロップメント Real Estate Development 3,359 535.87 681.2
9 PT Garuda Indonesia (Persero) Tbk ガルーダ・インドネシア航空 Airlines 16,735 3,863.92 992.8
10 PT Global Mediacom Tbk グローバル・メディアコム Broadcasting 12,477 786.41 685.4211 PT Gudang Garam Tbk グダン・ガラム Tobacco 35,900 5,734.72 2,930.9312 PT Hero Supermarket Tbk ヘロー・スーパーマーケット Food Retail 15,007 1,028.38 405.113 PT Indofood Sukses Makmur Tbk インドフード・スクセス・マクムル Food: Specialty/Candy 83,310 5,018.66 2,150.6214 PT Kalbe Farma Tbk カルベ・ファルマ Pharmaceuticals: Other 12,736 1,456.66 883.9615 PT Lippo Karawaci Tbk リッポー・カラワチ Real Estate Development 8,946 801.09 1,378.5416 PT Mitra Adiperkasa Tbk ミトラ・アディプルカサ Department Stores 22,478 1,063.84 237.78
17 PT Perusahaan Gas Negara (Persero) Tbk プルウサハアン・ガス・ヌガラ(PGN)Oil & Gas Pipelines 2,242 2,934.77 3,163.17
18 PT Saratoga Investama Sedaya Tbk サラトガ・インベスタマ・スダヤ Investment Trusts/Mutual Funds -- 81.58 1,409.11
19 PT Semen Indonesia (Persero) Tbk セメン・インドネシア Construction Materials 6,828 1,964.92 2,155.1420 PT Sumber Alfaria Trijaya Tbk スンブル・アルファリア・トリジャヤ Food Retail 42,115 4,218.44 381.32
21 PT Tambang Batubara Bukit Asam (Persero) Tbk ブキット・アサム Coal 2,568 1,057.02 773.52
22 PT Telekomunikasi Indonesia Tbk テレコムニカシ・インドネシア Major Telecommunications 23,876 8,746.57 6,263.4223 PT Unilever Indonesia Tbk ユニリーバ・インドネシア Household/Personal Care 6,185 3,011.46 349.1724 PT Wijaya Karya Tbk ウィジャヤ・カルヤ Engineering & Construction 2,187 1,178.07 842.5925 PT XL Axiata Tbk XLアクシアタ Major Telecommunications 1,892 1,604.56 1,574.25
フィリピン (Philippines)No Company 企業名 Industry Full time
employees:Revenue Unit: $US million
Total equity Unit: $US million
1 Aboitiz Power Corp. アボイティス・パワー Electric Utilities 2,944 1,877.61 2,114.442 Alliance Global Group, Inc. アライアンス・グローバル Industrial Conglomerates 38,186 2,883.10 2,959.823 Ayala Corp. アヤラ・コーポレーション Financial Conglomerates -- 4,194.97 4,638.044 Ayala Land, Inc. アヤラ・ランド Real Estate Development 429 2,608.33 2,999.065 BDO Unibank, Inc. BDOユニバンク Regional Banks 31,443 2,593.86 4,360.916 Bloomberry Resorts Corp. ブルームベリー・リゾーツ Casinos/Gaming 5,272 639.88 484.927 Cebu Air, Inc. セブ・エア Airlines 4,123 1,303.48 673.988 DMCI Holdings, Inc. DMCIホールディングス Industrial Conglomerates 12 1,366.64 1,359.819 GT Capital Holdings, Inc. GTキャピタル・ホールディングス Motor Vehicles 24,715 4,118.62 2,309.37
10 International Container Terminal Services, Inc.インターナショナル・コンテナ・ターミナル・サービシズ(ICTSI) Other Transportation 8,009 1,184.34 863.50
11 JG Summit Holdings, Inc. JGサミット・ホールディングス Industrial Conglomerates 21,477 4,892.37 4,818.0112 Jollibee Foods Corp. ジョリビー・フーズ Restaurants 11,957 2,398.68 676.2713 LT Group, Inc. LTグループ Beverages: Alcoholic 14,134 1,217.16 2,737.7014 Manila Electric Co. マニラ電力(メラルコ) Electric Utilities 5,569 5,415.76 1,496.94
15 Metro Pacifi c Investments Corp. メトロ・パシフィック・インベストメンツ Real Estate Development 49 943.82 3,058.22
16 Philippine Long Distance Telephone Co. PLDT Major Telecommunications 18,038 3,480.11 2,176.01
17 San Miguel Corp. サンミゲル Beverages: Alcoholic 22,396 14,431.45 5,631.2118 SM Investments Corp. SMインベストメンツ Department Stores -- 7,325.11 6,044.4219 SM Prime Holdings, Inc. SMプライム・ホールディングス Real Estate Development 11,242 1,704.26 4,656.3920 Universal Robina Corp. ユニバーサル・ロビーナ Food: Specialty/Candy 29,801 2,378.71 1,548.12
★ 日経アジア300 ASEANの大企業リスト(国別)/Large ASEAN Enterprises Listed on Nikkei Asia 300
日本企業の M&A対象となってきたASEANの企業
急拡大する ASEANのコングロマリット
Asean-Japan Centre 2017— 20 —
— 1
9 —
Asea
n-Ja
pan
Cent
re 2
017
5. 企業(3) Enterprises
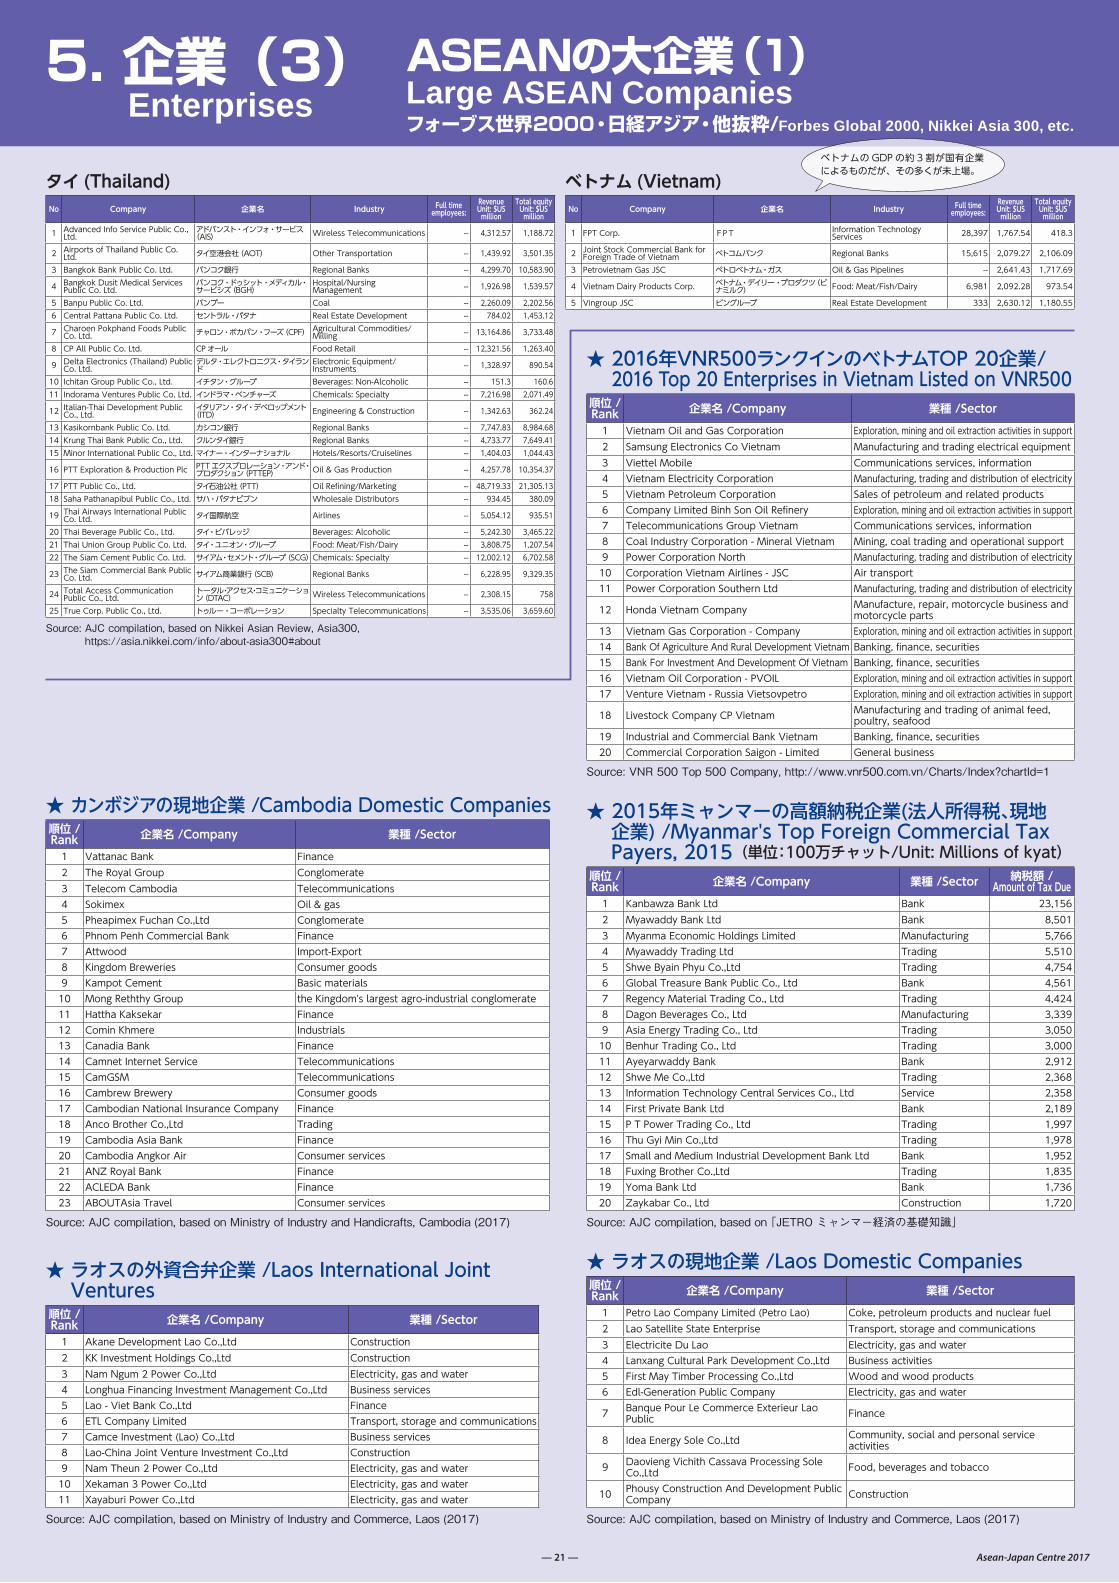
タイ (Thailand)No Company 企業名 Industry Full time
employees:Revenue Unit: $US million
Total equity Unit: $US million
1 Advanced Info Service Public Co., Ltd.
アドバンスト・インフォ・サービス(AIS) Wireless Telecommunications -- 4,312.57 1,188.72
2 Airports of Thailand Public Co. Ltd. タイ空港会社(AOT) Other Transportation -- 1,439.92 3,501.35
3 Bangkok Bank Public Co. Ltd. バンコク銀行 Regional Banks -- 4,299.70 10,583.90
4 Bangkok Dusit Medical Services Public Co. Ltd.
バンコク・ドゥシット・メディカル・サービシズ(BGH)
Hospital/Nursing Management -- 1,926.98 1,539.57
5 Banpu Public Co. Ltd. バンプー Coal -- 2,260.09 2,202.566 Central Pattana Public Co. Ltd. セントラル・パタナ Real Estate Development -- 784.02 1,453.12
7 Charoen Pokphand Foods Public Co. Ltd. チャロン・ポカパン・フーズ(CPF) Agricultural Commodities/Milling -- 13,164.86 3,733.48
8 CP All Public Co. Ltd. CPオール Food Retail -- 12,321.56 1,263.40
9 Delta Electronics (Thailand) Public Co. Ltd.
デルタ・エレクトロニクス・タイランド
Electronic Equipment/Instruments -- 1,328.97 890.54
10 Ichitan Group Public Co., Ltd. イチタン・グループ Beverages: Non-Alcoholic -- 151.3 160.611 Indorama Ventures Public Co. Ltd. インドラマ・ベンチャーズ Chemicals: Specialty -- 7,216.98 2,071.49
12 Italian-Thai Development Public Co., Ltd.イタリアン・タイ・デベロップメント(ITD) Engineering & Construction -- 1,342.63 362.24
13 Kasikornbank Public Co. Ltd. カシコン銀行 Regional Banks -- 7,747.83 8,984.6814 Krung Thai Bank Public Co., Ltd. クルンタイ銀行 Regional Banks -- 4,733.77 7,649.4115 Minor International Public Co., Ltd. マイナー・インターナショナル Hotels/Resorts/Cruiselines -- 1,404.03 1,044.43
16 PTT Exploration & Production Plc PTTエクスプロレーション・アンド・プロダクション(PTTEP) Oil & Gas Production -- 4,257.78 10,354.37
17 PTT Public Co., Ltd. タイ石油公社(PTT) Oil Refi ning/Marketing -- 48,719.33 21,305.1318 Saha Pathanapibul Public Co., Ltd. サハ・パタナピブン Wholesale Distributors -- 934.45 380.09
19 Thai Airways International Public Co. Ltd. タイ国際航空 Airlines -- 5,054.12 935.51
20 Thai Beverage Public Co., Ltd. タイ・ビバレッジ Beverages: Alcoholic -- 5,242.30 3,465.2221 Thai Union Group Public Co. Ltd. タイ・ユニオン・グループ Food: Meat/Fish/Dairy -- 3,808.75 1,207.5422 The Siam Cement Public Co. Ltd. サイアム・セメント・グループ(SCG)Chemicals: Specialty -- 12,002.12 6,702.58
23 The Siam Commercial Bank Public Co. Ltd. サイアム商業銀行(SCB) Regional Banks -- 6,228.95 9,329.35
24 Total Access Communication Public Co., Ltd.トータル・アクセス・コミュニケーション(DTAC) Wireless Telecommunications -- 2,308.15 758
25 True Corp. Public Co., Ltd. トゥルー・コーポレーション Specialty Telecommunications -- 3,535.06 3,659.60
Source: AJC compilation, based on Nikkei Asian Review, Asia300, https://asia.nikkei.com/info/about-asia300#about
ベトナム (Vietnam)No Company 企業名 Industry Full time
employees:Revenue Unit: $US million
Total equity Unit: $US million
1 FPT Corp. FPT Information Technology Services 28,397 1,767.54 418.3
2 Joint Stock Commercial Bank for Foreign Trade of Vietnam ベトコムバンク Regional Banks 15,615 2,079.27 2,106.09
3 Petrovietnam Gas JSC ペトロベトナム・ガス Oil & Gas Pipelines -- 2,641.43 1,717.69
4 Vietnam Dairy Products Corp. ベトナム・デイリー・プロダクツ(ビナミルク) Food: Meat/Fish/Dairy 6,981 2,092.28 973.54
5 Vingroup JSC ビングループ Real Estate Development 333 2,630.12 1,180.55
ASEANの大企業(1)Large ASEAN Companiesフォーブス世界2000・日経アジア・他抜粋/Forbes Global 2000, Nikkei Asia 300, etc.
★ 2015年ミャンマーの高額納税企業(法人所得税、現地企業) /Myanmar's Top Foreign Commercial Tax Payers, 2015 (単位:100万チャット/Unit: Millions of kyat)
順位 /Rank 企業名 /Company 業種 /Sector 納税額 /
Amount of Tax Due1 Kanbawza Bank Ltd Bank 23,1562 Myawaddy Bank Ltd Bank 8,5013 Myanma Economic Holdings Limited Manufacturing 5,7664 Myawaddy Trading Ltd Trading 5,5105 Shwe Byain Phyu Co.,Ltd Trading 4,7546 Global Treasure Bank Public Co., Ltd Bank 4,5617 Regency Material Trading Co., Ltd Trading 4,4248 Dagon Beverages Co., Ltd Manufacturing 3,3399 Asia Energy Trading Co., Ltd Trading 3,05010 Benhur Trading Co., Ltd Trading 3,00011 Ayeyarwaddy Bank Bank 2,91212 Shwe Me Co.,Ltd Trading 2,36813 Information Technology Central Services Co., Ltd Service 2,35814 First Private Bank Ltd Bank 2,18915 P T Power Trading Co., Ltd Trading 1,99716 Thu Gyi Min Co.,Ltd Trading 1,97817 Small and Medium Industrial Development Bank Ltd Bank 1,95218 Fuxing Brother Co.,Ltd Trading 1,83519 Yoma Bank Ltd Bank 1,73620 Zaykabar Co., Ltd Construction 1,720
Source: AJC compilation, based on 「JETRO ミャンマー経済の基礎知識」
★ ラオスの現地企業 /Laos Domestic Companies順位 /Rank 企業名 /Company 業種 /Sector1 Petro Lao Company Limited (Petro Lao) Coke, petroleum products and nuclear fuel2 Lao Satellite State Enterprise Transport, storage and communications3 Electricite Du Lao Electricity, gas and water4 Lanxang Cultural Park Development Co.,Ltd Business activities5 First May Timber Processing Co.,Ltd Wood and wood products6 Edl-Generation Public Company Electricity, gas and water
7 Banque Pour Le Commerce Exterieur Lao Public Finance
8 Idea Energy Sole Co.,Ltd Community, social and personal service activities
9 Daovieng Vichith Cassava Processing Sole Co.,Ltd Food, beverages and tobacco
10 Phousy Construction And Development Public Company Construction
Source: AJC compilation, based on Ministry of Industry and Commerce, Laos (2017)
★ カンボジアの現地企業 /Cambodia Domestic Companies順位 /Rank 企業名 /Company 業種 /Sector1 Vattanac Bank Finance2 The Royal Group Conglomerate3 Telecom Cambodia Telecommunications4 Sokimex Oil & gas5 Pheapimex Fuchan Co.,Ltd Conglomerate6 Phnom Penh Commercial Bank Finance7 Attwood Import-Export8 Kingdom Breweries Consumer goods9 Kampot Cement Basic materials10 Mong Reththy Group the Kingdom's largest agro-industrial conglomerate11 Hattha Kaksekar Finance12 Comin Khmere Industrials13 Canadia Bank Finance14 Camnet Internet Service Telecommunications15 CamGSM Telecommunications16 Cambrew Brewery Consumer goods17 Cambodian National Insurance Company Finance18 Anco Brother Co.,Ltd Trading19 Cambodia Asia Bank Finance20 Cambodia Angkor Air Consumer services21 ANZ Royal Bank Finance22 ACLEDA Bank Finance23 ABOUTAsia Travel Consumer services
Source: AJC compilation, based on Ministry of Industry and Handicrafts, Cambodia (2017)
★ 2016年VNR500ランクインのベトナムTOP 20企業/2016 Top 20 Enterprises in Vietnam Listed on VNR500
順位 /Rank 企業名 /Company 業種 /Sector1 Vietnam Oil and Gas Corporation Exploration, mining and oil extraction activities in support2 Samsung Electronics Co Vietnam Manufacturing and trading electrical equipment3 Viettel Mobile Communications services, information4 Vietnam Electricity Corporation Manufacturing, trading and distribution of electricity5 Vietnam Petroleum Corporation Sales of petroleum and related products6 Company Limited Binh Son Oil Refi nery Exploration, mining and oil extraction activities in support7 Telecommunications Group Vietnam Communications services, information8 Coal Industry Corporation - Mineral Vietnam Mining, coal trading and operational support9 Power Corporation North Manufacturing, trading and distribution of electricity10 Corporation Vietnam Airlines - JSC Air transport11 Power Corporation Southern Ltd Manufacturing, trading and distribution of electricity
12 Honda Vietnam Company Manufacture, repair, motorcycle business and motorcycle parts
13 Vietnam Gas Corporation - Company Exploration, mining and oil extraction activities in support14 Bank Of Agriculture And Rural Development Vietnam Banking, fi nance, securities15 Bank For Investment And Development Of Vietnam Banking, fi nance, securities16 Vietnam Oil Corporation - PVOIL Exploration, mining and oil extraction activities in support17 Venture Vietnam - Russia Vietsovpetro Exploration, mining and oil extraction activities in support
18 Livestock Company CP Vietnam Manufacturing and trading of animal feed, poultry, seafood
19 Industrial and Commercial Bank Vietnam Banking, fi nance, securities20 Commercial Corporation Saigon - Limited General business
Source: VNR 500 Top 500 Company, http://www.vnr500.com.vn/Charts/Index?chartId=1
★ ラオスの外資合弁企業 /Laos International Joint Ventures
順位 /Rank 企業名 /Company 業種 /Sector1 Akane Development Lao Co.,Ltd Construction2 KK Investment Holdings Co.,Ltd Construction3 Nam Ngum 2 Power Co.,Ltd Electricity, gas and water4 Longhua Financing Investment Management Co.,Ltd Business services5 Lao - Viet Bank Co.,Ltd Finance6 ETL Company Limited Transport, storage and communications7 Camce Investment (Lao) Co.,Ltd Business services8 Lao-China Joint Venture Investment Co.,Ltd Construction9 Nam Theun 2 Power Co.,Ltd Electricity, gas and water10 Xekaman 3 Power Co.,Ltd Electricity, gas and water11 Xayaburi Power Co.,Ltd Electricity, gas and water
Source: AJC compilation, based on Ministry of Industry and Commerce, Laos (2017)
ベトナムのGDP の約 3割が国有企業によるものだが、その多くが未上場。
0
10,000
20,000
30,000
40,000
50,000
60,000
70,000
最下位20%(Bo�om 20%)
下位20% 中位20% 上位20% 最上位20%(Top 20%)
マレーシア(Malaysia)
タイ(Thailand)
中国(China)
フィリピン(Philippines)
インドネシア(Indonesia)
ベトナム(Vietnam)
横軸は人口の5等分布。縦軸は各人口分布帯の平均所得(Popula�on of 5 distribu�on categorized by household disposable income)
所得格差 (Income gaps)マレーシア:15.3倍(Malaysia:15.3 �mes)タイ:13.0倍(Thailand:13 �mes)中国:15.8倍(China:15.8 �mes)フィリピン:11.7倍(Philippines:11.7 �mes)インドネシア:9.0倍 (Indonesia:9 �mes)ベトナム:11.5倍(Vietnam:11.5 �mes)※日本:6.7倍(Japan:6.7 �mes)
0% 10% 20% 30% 40% 50% 60% 70% 80% 90% 100%2020
(China) 2015中国 2009
2020(Vietnam) 2015ベトナム 2009
2020(Thailand) 2015
タイ 2009
2020(Philippines) 2015フィリピン 2009
2020(Malaysia) 2015マレーシア 2009
2020(Indonesia) 2015
インドネシア 2009
富裕層(世帯可処分所得:年間35,000ドル超)/ Wealthy class (household disposable income is over 35 thousand dollars) アッパーミドル(同15,000超、35,000以下)/ Upper middle class (15 to 35 thousand dollars)ローワーミドル(同5,000ドル超、15,000ドル以下)/ Lower middle class (5 to 15 thousand dollars)低所得層(同5,000ドル以下)/ Low-income class (below 5,000 dollars)
Source: Euromonitor International, World Consumer Income and Expenditure Patterns 2012 ジェトロ「アジア売れ筋商品調査」(2011年1月)、http://www.jetro.go.jp/world/asia/hot-selling/pdf/report.pdf Reproduction of this data is prohibited (転載禁止)
Source:AJC compilation, based on International Organization of Motor Vehicle Manufacturers, http://oica.net/category/production-statistics/
Source:AJC compilation, based on International Organization of Motor Vehicle Manufacturers, http://oica.net/category/sales-statistics/
Source: JETRO「これからの消費市場を読む-拡大する世界の中間層を狙え」(2011年)を一部加工 http://www.jetro.go.jp/world/asia/reports/07000438 Reproduction of this data is prohibited (転載禁止)
Source: AJC compilation, based on World Bank, World Development Indicators (2017) http://databank.worldbank.org/data/reports.aspx?source=world-development-indicators#
Source: AJC compilation, based on World Bank, World Development Indicators (2017) http://databank.worldbank.org/data/reports.aspx?source=world-development-indicators#
0
200
400
600
800
1,000
1,200
1980 1990 2000 2010 2016
インドネシア(Indonesia) マレーシア(Malaysia) フィリピン(Philippines)
シンガポール(Singapore) タイ(Thailand) ベトナム(Vietnam)
インドネシア(Indonesia) マレーシア(Malaysia) フィリピン(Philippines)
シンガポール(Singapore) タイ(Thailand) ベトナム(Vietnam)
2016 年日本 (Japan): 3,535 社中国 (China): 3,052 社
韓国 (S. Korea): 2,039 社
0
50
100
150
200
250
300
350
1990 2000 2010 2016
2016 年日本 (Japan): 100.3%中国 (China): 65.4%
韓国 (S. Korea): 88.9%
0
500,000
1,000,000
1,500,000
2,000,000
2,500,000
3,000,000
3,500,000
4,000,000
4,500,000
2005 2006 2007 2008 2009 2010 2011 2012 2013 2014 2015 2016インドネシア(Indonesia) タイ(Thailand) マレーシア(Malaysia) フィリピン(Philippines) ベトナム(Vietnam)
0
500,000
1,000,000
1,500,000
2,000,000
2,500,000
3,000,000
3,500,000
4,000,000
4,500,000
2005 2006 2007 2008 2009 2010 2011 2012 2013 2014 2015 2016
インドネシア(Indonesia) タイ(Thailand) マレーシア(Malaysia) フィリピン(Philippines)ベトナム(Vietnam) シンガポール(Singapore) ブルネイ(Brunei) ラオス(Lao PDR)
自動車生産台数(2016年)/ Automotive Production (2016) インドネシア(Indonesia) 1,177,389台 タイ(Thailand) 1,944,417台 マレーシア(Malaysia) 513,445台 ASEAN 3,837,121台 中国(China) 28,118,794台 韓国(Korea) 4,228,509台 日本(Japan) 9,204,590台 世界(Wolrd) 94,976,569台
日本車シェア(2016年)/ Japan Automobile Market Share (2016) インドネシア(Indonesia) 98.5% (1,046,788台) フィリピン(Philippines) 74.6% (301,906台) タイ(Thailand) 88.4%(679,608台) ASEAN 80%(2,500,000台) 中国(China) 16.0%(3,800,000台)
冷蔵庫(Refrigerator)
洗濯機(Washingmachine)
エアコン(Airconditioner)
カラーTV(Colortelevision)
電子レンジ(Microwaveoven)
掃除機(Vacuumcleaner)
パソコン(Personalcomputer)
電話(Telephone)
乗用車(Passengercar)
二輪車(Motorcycle)
マレーシア (Malaysia) 97.2% 89.8% 34.2% 98.8% 27.4% 76.7% 65.8% 26.9% 63.2% 52.6%タイ(Thailand) 90.1% 55.8% 14.6% 93.1% 39.9% 14.0% 26.3% 20.0% 14.8% 72.0%
インドネシア (Indonesia) 30.6% 30.5% 7.6% 73.4% 3.0% 38.6% 13.2% 8.5% 7.4% 23.5%フィリピン (Philippines)※2011年 41.4% 32.1% 12.9% 72.9% 31.8% 41.2% 17.2% 11.6% 10.9% 31.2%シンガポール (Singapore) 99.2% 97.3% 78.8% 99.5% 68.1% 70.1% 87.6% 87.5% 40.6% 7.1%ベトナム (Vietnam) 50.0% 22.5% 9.5% 89.5% 20.9% 35.2% 19.5% 30.6% 1.5% 80.6%中国 (China) 77.0% 73.2% 53.0% 96.8% 33.7% 33.7% 39.3% 69.1% 6.1% 40.7%韓国 (S. Korea) 99.7% 99.0% 53.5% 98.5% 95.0% 90.6% 82.2% 74.9% 68.6% 7.4%日本 (Japan) 98.9% 99.6% 89.6% 96.5% 97.6% 99.1% 87.7% 95.5% 83.9% 19.5%
Source:Consumer Asia Pacifi c and Australasia 2014 21st Edition, Euromonitor International Reproduction of this data is prohibited (転載禁止)
■ 世帯あたり耐久消費財普及率(2012年)/ Household Penetration Rates of Durable Consumer Goods (2012)
平均世帯可処分所得の格差(2011年)/ Household Disposable Income Gap(2011) (単位:米ドル/ Unit:US$)
■ ASEAN主要国の自動車生産台数/ Automotive Production in ASEAN Countries (単位:台/ Unit: Vehicle)
■ ASEAN主要国の自動車販売台数/ Automobile Sales in ASEAN Countries (単位:台/ Unit: Vehicle)
世帯可処分所得の予測(2009年、2015年、2020年)/ Household Disposable Income (2009, 2015 and 2020)
生産台数は中国の7分の 1だが、ASEAN市場での日本車シェアの高さのため販売台数は、中国の国内販売の 70%に匹敵する。
拡大する中間層若年層マーケットExpanding Middle Class and ASEAN Market
6. ASEAN市場(1) ASEAN Market
★ 上場国内企業数(1980年~2016年)/Listed Domestic Companies, 1980 - 2016 (単位:企業数/Unit: Companies)
★ 上場国内企業資本金額(1990年~2016年)/Market Capitalization of Listed Domestic Companies, 1990 - 2016 (単位:対GDP比/Unit: % of GDP)
所得水準が日本の 70年代のベトナムでも、多くの世帯でカラーテレビやバイク、冷蔵庫を持っており、消費パターンに違いも。
— 21 — Asean-Japan Centre 2017