Embed Size (px)
Citation preview
56% 149,028 33% 128,322,270 88% 56% 347,000 35% 498,322,000 82% 56% 147,000 33% 1,742,060 23% 16% 679,0248 33% 498,322,000 96% 56% 547,000 33% 498,322,000 82% 2,742,060 23%
56% 149,028 33% 498,322,000 96% 56% 547,000 33% 498,322,000 82% 56% 147,000 33% 1,742,060 23%
56% 149,028 21% 298,348,000 96% 56% 547,000 33% 498,322,000 82% 56% 147,000 33% 1,742,060 23%
56% 149,028 33% 498,322,000 96% 56% 547,000 33% 498,322,000 82% 56% 147,000 33% 1,742,060 23% 56% 149,028 33% 498,322,000 96% 56% 547,000 33% 498,322,000 82% 56% 147,000 33% 1,742,060 23%
88% 56% 347,000 35% 498,322,000 82% 56% 147,000 33% 1,742,060 23%
Introduction............................................................................................................................. 1
The State of Israel...................................................................................................................2
Key Figures...............................................................................................................................4
Climate...................................................................................................................6
Population................................................................................................................................ 7
Vital Statistics (Live Births, Deaths, Marriages, Divorces)......................................8
Immigration...................................................................................................................9
Households and Families.................................................................................................10
Health ......................................................................................................................................12
Society...................................................................................................................13
Welfare..............................................................................................................................14
Education...................................................................................................................15
Culture, Entertainment and Sport............................................................................16
Crime and Justice...............................................................................................................17
Labour...................................................................................................................18
Wages...................................................................................................................19
Prices...................................................................................................................20
General Government........................................................................................................21
National Accounts..............................................................................................................22
International Accounts, Imports and Exports.........................................................23
Agriculture...................................................................................................................24
Manufacturing, Commerce and Services..................................................................25
Construction, Electricity and Water............................................................................26
Tourism and Hotels...........................................................................................................27
Transport.......................................................................................................................28
Science and Technology.................................................................................................29
Environment............................................................................................................30
Obtaining Statistical Information and Purchasing Publications.......................31
CONTENTS
1
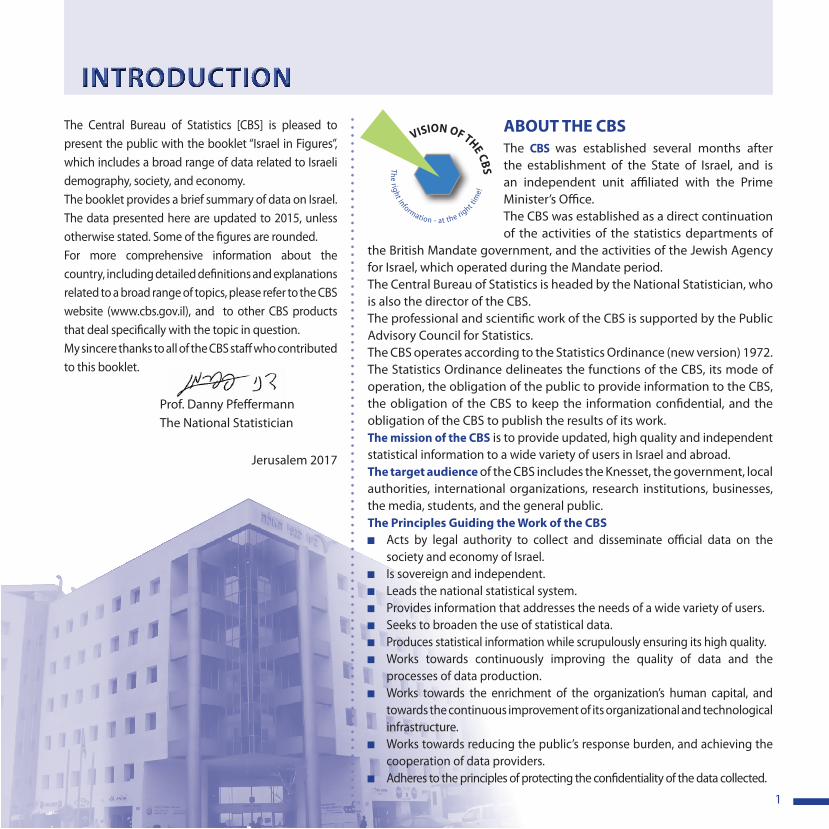
The Central Bureau of Statistics [CBS] is pleased to present the public with the booklet “Israel in Figures”, which includes a broad range of data related to Israeli demography, society, and economy. The booklet provides a brief summary of data on Israel.The data presented here are updated to 2015, unless otherwise stated. Some of the figures are rounded.For more comprehensive information about the country, including detailed definitions and explanations related to a broad range of topics, please refer to the CBS website (www.cbs.gov.il), and to other CBS products that deal specifically with the topic in question.My sincere thanks to all of the CBS staff who contributed to this booklet. Prof. Danny Pfeffermann The National Statistician
Jerusalem 2017
INTRODUCTIONABOUT THE CBSThe CBS was established several months after the establishment of the State of Israel, and is an independent unit affiliated with the Prime Minister’s Office.The CBS was established as a direct continuation of the activities of the statistics departments of
the British Mandate government, and the activities of the Jewish Agency for Israel, which operated during the Mandate period.The Central Bureau of Statistics is headed by the National Statistician, who is also the director of the CBS.The professional and scientific work of the CBS is supported by the Public Advisory Council for Statistics.The CBS operates according to the Statistics Ordinance (new version) 1972. The Statistics Ordinance delineates the functions of the CBS, its mode of operation, the obligation of the public to provide information to the CBS, the obligation of the CBS to keep the information confidential, and the obligation of the CBS to publish the results of its work.The mission of the CBS is to provide updated, high quality and independent statistical information to a wide variety of users in Israel and abroad.The target audience of the CBS includes the Knesset, the government, local authorities, international organizations, research institutions, businesses, the media, students, and the general public. The Principles Guiding the Work of the CBS
Acts by legal authority to collect and disseminate official data on the society and economy of Israel.
Is sovereign and independent. Leads the national statistical system. Provides information that addresses the needs of a wide variety of users. Seeks to broaden the use of statistical data. Produces statistical information while scrupulously ensuring its high quality. Works towards continuously improving the quality of data and the
processes of data production. Works towards the enrichment of the organization’s human capital, and
towards the continuous improvement of its organizational and technological infrastructure.
Works towards reducing the public’s response burden, and achieving the cooperation of data providers.
Adheres to the principles of protecting the confidentiality of the data collected.
The right information - at the right tim
e!
VISION OF THE CBS
2
Declaration of Independence: 14 May 1948.
State emblem:The official emblem of the State of Israel is the Menorah – a candelabrum, whose shape is derived from the sage plant (Moria). In certain species of the plant, the leaves branch out in a way that resembles the candelabrum that stood in the Holy Temple in ancient Jerusalem. The Menora appearing in the state emblem is similar to the one carved on the Arch of Titus in Rome. It is flanked by two olive branches that symbolize Israel’s longing for peace.
Official languages: Hebrew, Arabic.
Currency: The Israeli currency is the New Israeli Sheqel (NIS), which is divided into 100 agorot (as of January 1986).
Capital city: Jerusalem.
The Proclamation of Independence (selected excerpts):“…The State of Israel will be open for Jewish immigration and for the Ingathering of the Exiles; it will foster the development of the country for the benefit of all its inhabitants; it will be based on freedom, justice and peace as envisaged by the prophets of Israel; it will ensure complete equality of social and political rights to all its inhabitants irrespective of religion, race or sex; it will guarantee freedom of religion, conscience, language, education and culture; it will safeguard the Holy Places of all religions… We extend our hand to all neighbouring states and their peoples in an offer of peace and good neighbourliness, and appeal to them to establish bonds of cooperation and mutual help with the sovereign Jewish people settled in its own land…”
Governing system: Democratic - parliamentary.
The legislative branch is the Knesset (the Parliament of the State of Israel). It is located in Jerusalem, and has 120 members. The present Knesset is the 20th in number, and the elections for this Knesset were held on 17 March 2015.The Knesset has parliamentary sovereignty, and enacts legislation on every issue.
The executive branch includes the government and government ministries.
The judiciary includes the system of courts: the Supreme Court, the District Court, Magistrates Court, Court for Local Affairs, Religious Court, Traffic Court, Labour Court, Juvenile Court, etc.
President: The Knesset elects the President every seven years, and his main duties are representational. The first President: Dr. Chaim Weizmann, sworn into office on 16 February 1949.The incumbent President: Reuven "Rubi" Rivlin, the tenth president of Israel, sworn into office on 24 July 2014.The Prime Minister: The first Prime Minister was David Ben-Gurion. The first government was established on 8 March 1949.The incumbent Prime Minister: Binyamin Netanyahu, has been in office since 31 March 2009.Local authorities: Municipalities, local councils, and regional councils. These authorities have governmental and administrative powers in their areas of jurisdiction, and are responsible for provision of services to their constituencies.
THE STATE OF ISRAEL
Prickly sage
3
THE STATE OF ISRAEL (CONTINUED)
Location: The State of Israel is located on the southwest tip of the Asian continent, on the eastern basin of the Mediterranean Sea. The State of Israel lies at a latitude between 29° and the 33° north of the Equator.
Area: 22,072 sq. km. (as of 1967 including East Jerusalem and as of 1982 including the Golan Heights ).
Land area: 21,643 sq. km. Area of lakes: 429 sq. km. (Sea of Galilee – 164 sq. km., the Dead Sea - 265 sq. km.)Land border: Total length of border: 857 km.Coastline: Length of Mediterranean Sea Coast 194 km. Length of Red Sea Coast about 12 km.
Lowest point: The Dead Sea - 429 m. below sea level.Highest point: Mount Hermon - 2,224 m.The only river in Israel: The Jordan River, approximately 250 km.Main streams: Alexander, Habesor, Hayarqon, Haqishon, Hadera, Kziv, Lakhish, Shiqma, Soreq, and Tanninim.Natural resources: Raw materials for construction of buildings and roads: gravel and
stone, sand, kurkar, clay, limestone, gypsum, and tuff. Raw materials for manufacturing: potash, bromine, magnesium, salt, phosphates, sand, clay, and limestone. Energy sources: natural gas, oil shales.
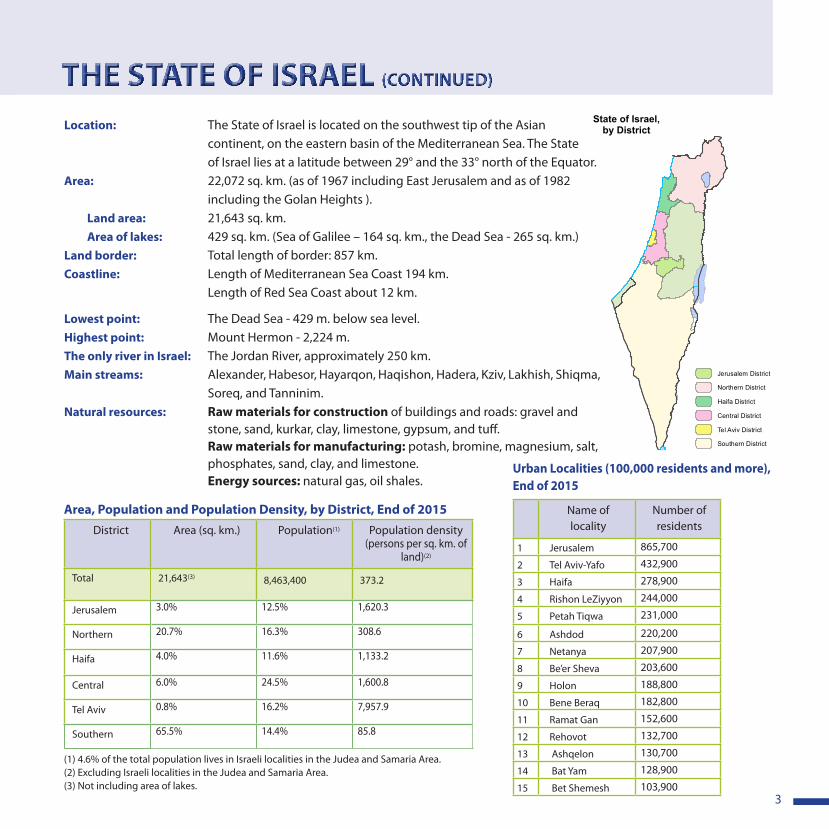
State of Israel,by District
Jerusalem District
Northern District
Haifa District
Central District
Tel Aviv District
Southern District
State of Israel,by District
Jerusalem District
Northern District
Haifa District
Central District
Tel Aviv District
Southern District
Area, Population and Population Density, by District, End of 2015District Area (sq. km.) Population(1) Population density
(persons per sq. km. of land)(2)
Total 21,643(3) 8,463,400 373.2
Jerusalem 3.0% 12.5% 1,620.3
Northern 20.7% 16.3% 308.6
Haifa 4.0% 11.6% 1,133.2
Central 6.0% 24.5% 1,600.8
Tel Aviv 0.8% 16.2% 7,957.9
Southern 65.5% 14.4% 85.8
(1) 4.6% of the total population lives in Israeli localities in the Judea and Samaria Area.(2) Excluding Israeli localities in the Judea and Samaria Area.(3) Not including area of lakes.
Urban Localities (100,000 residents and more), End of 2015
Name of locality
Number of residents
1 Jerusalem 865,700
2 Tel Aviv-Yafo 432,900
3 Haifa 278,900
4 Rishon LeZiyyon 244,000
5 Petah Tiqwa 231,000
6 Ashdod 220,200
7 Netanya 207,900
8 Be’er Sheva 203,600
9 Holon 188,800
10 Bene Beraq 182,800
11 Ramat Gan 152,600
12 Rehovot 132,700
13 Ashqelon 130,700
14 Bat Yam 128,900
15 Bet Shemesh 103,900
4
Crime and JusticeJudges in the Supreme Court 15Judges in district courts 193Judges in magistrates’ courts 428Judges in labour tribunals 63Judges in Rabbinical courts 97
Licenced lawyers 60,132
Israel police (list of employees) 28,624Prison wardens (list of employees) 8,810Files opened by the police 341,778
Population
Population - Total (end of year) 8,463,400
Males 4,195,200
Females 4,268,200
Selected age groups
0-14 28.3%
65+ 11.1%
Percentage of annual population growth
2.0%
Percentage of natural increase out of the total
80.2%
Urban population 91.2%
Vital Statistics
Crude marriage rate (2014) 6.2
Median marriage age(1st marriage) - grooms (2014)
27.3
Median marriage age (1st marriage) - brides (2014)
24.5
Live births 178,723
Crude birth rate 21.3
Total fertility rate 3.09
Deaths 44,457
Crude mortality rate 5.3
Infant mortality rate 3.1
Life expectancy – males 80.1
Life expectancy – females 84.1
2015, unless otherwise stated
HouseholdsNo. of households 2,411,700
Average no. of persons per household
3.32
One-person households 18.2%
FamiliesNumber of families 1,958,100
Average no. of persons per family 3.72
Standard of Living2014
Total monthly consumption expenditure per household (NIS)
15,053
Total 100.0%Food 16.2%Housing 24.5%Dwelling and household maintenance 9.6%Furniture and household equipment 3.9%Clothing and footwear 3.3%Health 5.9%Education, culture and entertainment 12.1%Transport and communications 19.8%Miscellaneous goods and services 4.7%Gross monthly money income per household (NIS)
18,329
Total 100.0%From work 77.4%From capital 4.3%From pension and provident funds 7.1%From allowances and assistance 11.1%Ownership of durable goods per household
Percentage of all households
Air conditioner 86.6%Clothes dryer 40.9%Computer 81.3%Internet subscription 72.1%Dishwasher 39.5%Freezer 22.4%Two cars or more 23.9%
Health Beds in hospitals 44,715
Thereof: Beds for general care 15,487
Beds per 1,000 residents 5.3
Thereof: Percentage of beds for general care
1.8
Hospitalization days 15,228,300
Thereof: General hospitalization days 5,274,500
Hospitalization days per 1,000 residents 1,817
Thereof: Rate of general hospitalization
629
Physicians (up to age 65)(1) 26,029
Physicians (up to age 65) per 1,000 residents(1)
3.08
(1) Licensed physicians (even those not practicing medicine).
EducationStudents – total 2,580,206Total 100.0%Pre-primary education(1) 20.0%Primary education 38.2%Secondary education (lower and upper) 26.8%Schools for apprentices under the supervision of the Ministry of Economy and Industry
0.5%
Non-academic post-secondary institutions 2.4%Academic colleges 3.8%Colleges of education 1.4%Universities 5.1%The Open University 1.8%Teaching staff – total(2) 160,565Pre-primary education (kindergarten teachers in formal education)(1)
16,404
Primary education 79,514Lower secondary education 33,492Upper secondary education 46,492
(1) Children in institutions supervised by the Ministry of Education and the Ministry of Economy and Industry.(2) A teacher who teaches at more than one level is counted separately at each level, but only once in the total.
CultureCommercial movie theaters (incl. cinematheques) 50Tickets sold 16,125,081
2014Visits to museums 6,702,125 Thereof: Jerusalem District 2,331,733 Tel Aviv District 1,906,860 Haifa District 862,581Books and booklets published 8,867
KEY FIGURES
5
2015, unless otherwise stated
National AccountsGross Domestic Product (percentage of change compared with previous year)
2.5
Gross Domestic Product - in international prices - (Purchasing Power Parities - PPP) - billions of $
300.3
Gross Domestic Product per capita - in international prices – (Purchasing Power Parities - PPP) - thousands of $
35.8
Fixed capital formation (% of GDP) 19.1Government consumption (% of GDP) 22.3Government liabilities (% of GDP) 62.6
International AccountsCurrent account (% of GDP) 4.6Current account excl. direct defence imports (% of GDP)
5.6
Israel’s external liabilities (millions of $)
284,869
Israel’s external assets (millions of $)
353,410
Imports of goods and services (millions of $)
82,970
Exports of goods and services (millions of $) 91,976
EnergyFinal consumption of electricity (Million Kilowatt Hour) 55,143
Prices(% change compared with previous year)
Consumer Price Index -1.0Price Index of Inputs in Residential Building 0.9Price Index of Manufacturing Output -7.1
ConstructionArea of building completed (sq. m.) 11,550,000Area of building begun (sq. m.) 12,230,000No. of dwellings – building completed 43,670No. of dwellings – building begun 50,330Construction and widening of roads - completed (km.) (2014)
556
Construction and widening of roads - begun (km.) (2014)
463
AgricultureAgricultural area (thousand dunams) 3,060
Total agricultural output (NIS billion) 29.5
Manufacturing; Mining and Quarrying (% change compared with previous year)
Manufacturing; Mining and quarrying – grand total
2.3
Mining and quarrying – total -0.1Manufacturing – total 2.5Food products 1.4Beverages and tobacco products 2.3Textiles 0.5Wearing apparel -1.2Manufacture and processing of leather and related products
4.9
Weed, cork and straw products, except furniture
6.2
Paper and paper products 13.0Printing and reproduction of recorded media
-1.0
Refined petroleum products, chemicals and chemical products
1.7
Pharmaceutical products, including homeopathic preparations
19.0
Rubber and plastics products -0.4Other non-metallic mineral products 5.1Basic metals -0.6Fabricated metal products, except machinery and equipment
1.0
Computers, electronic and optical products -5.5Electrical equipment 3.3Machinery and equipment n.e.c. 1.6Motor vehicles, trailers and semi-trailers -4.5Other transport equipment 8.1Furniture 4.7Other manufacturing -0.7Repair and installation of machinery and equipment
1.2
TransportLicenced to drive 4,019,565Kilometers traveled – millions of kilometers a year
54,820
Private vehicles 2,583,175Trucks and commercial vehicles 322,561Buses 18,788Railway: Passengers 52,811,238 Freight (tons) 7,501,048Air transport: passengers 15,717,300Movement of Aircrafts 106,237Road Accidents(1)
Road accidents with casualties 12,122Casualties in road accidents 22,164 Thereof: killed 322
(1) Excluding the Judea and Samaria Area.
Tourism and Tourist HotelsDepartures of Israelis 5,891,100Returns of Israelis 5,852,200Visitor arrivals 3,108,600Tourist hotels 374Rooms in tourist hotels 50,607Person-nights in tourist hotels 21,686,200Tourist person-nights as a percentage of all person-nights
38%
Room occupancy 61%
KEY FIGURES (CONTINUED)
EnvironmentSolid household and commercial waste (millions of tons)
5.1
Emissions of greenhouse gases(millions of tons, in CO2 equivalent) (2014)
76
Average salinity in Coastal Aquifer (mg cl/l) 227Average salinity in the Sea of Galilee (mg cl/l) 271Recycling of solid waste in local authorities 20%
Labour and Wages Population aged 15+ - Total 6,000,100
Labour force 3,845,700
Labour force, out of total aged 15+ 64.1%
Males 69.3%
Females 59.1%Employed persons out of total aged 15+
60.7%
Unemployed persons out of total Labour force
5.3%
Average wage per employee job (NIS) 9,576
Communications (2014)Households with internet subscription 72.1%
Households with at least one mobile phone
96.1%
6
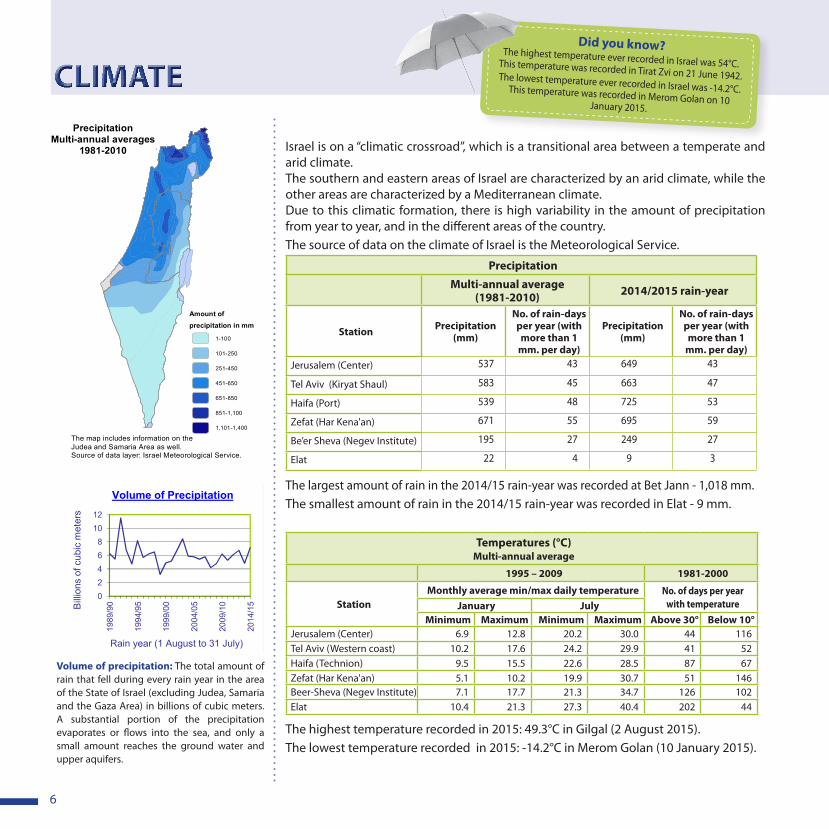
Israel is on a “climatic crossroad”, which is a transitional area between a temperate and arid climate.The southern and eastern areas of Israel are characterized by an arid climate, while the other areas are characterized by a Mediterranean climate.Due to this climatic formation, there is high variability in the amount of precipitation from year to year, and in the different areas of the country. The source of data on the climate of Israel is the Meteorological Service.
Precipitation
Multi-annual average (1981-2010) 2014/2015 rain-year
Station Precipitation (mm)
No. of rain-days per year (with more than 1
mm. per day)
Precipitation (mm)
No. of rain-days per year (with more than 1
mm. per day)Jerusalem (Center) 537 43 649 43
Tel Aviv (Kiryat Shaul) 583 45 663 47
Haifa (Port) 539 48 725 53
Zefat (Har Kena'an) 671 55 695 59
Be’er Sheva (Negev Institute) 195 27 249 27
Elat 22 4 9 3
The largest amount of rain in the 2014/15 rain-year was recorded at Bet Jann - 1,018 mm.The smallest amount of rain in the 2014/15 rain-year was recorded in Elat - 9 mm.
Temperatures (°C)Multi-annual average
1995 – 2009 1981-2000
StationMonthly average min/max daily temperature No. of days per year
with temperatureJanuary JulyMinimum Maximum Minimum Maximum Above 30° Below 10°
Jerusalem (Center) 6.9 12.8 20.2 30.0 44 116Tel Aviv (Western coast) 10.2 17.6 24.2 29.9 41 52Haifa (Technion) 9.5 15.5 22.6 28.5 87 67Zefat (Har Kena'an) 5.1 10.2 19.9 30.7 51 146Beer-Sheva (Negev Institute) 7.1 17.7 21.3 34.7 126 102Elat 10.4 21.3 27.3 40.4 202 44
The highest temperature recorded in 2015: 49.3°C in Gilgal (2 August 2015).The lowest temperature recorded in 2015: -14.2°C in Merom Golan (10 January 2015).
CLIMATEDid you know?The highest temperature ever recorded in Israel was 54°C. This temperature was recorded in Tirat Zvi on 21 June 1942.The lowest temperature ever recorded in Israel was -14.2°C. This temperature was recorded in Merom Golan on 10 January 2015.
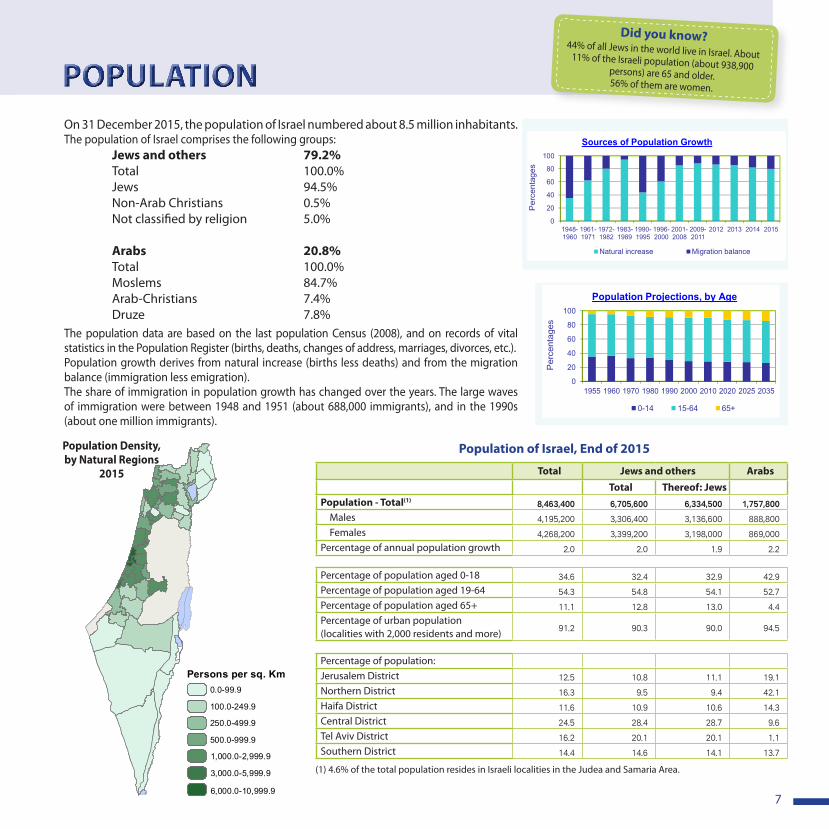
Volume of precipitation: The total amount of rain that fell during every rain year in the area of the State of Israel (excluding Judea, Samaria and the Gaza Area) in billions of cubic meters. A substantial portion of the precipitation evaporates or flows into the sea, and only a small amount reaches the ground water and upper aquifers.
אקלים
02468
1012
1989
/90
1994
/95
1999
/00
2004
/05
2009
/10
2014
/15Bill
ions
of c
ubic
met
ers
Rain year (1 August to 31 July)
Volume of Precipitation
6
PrecipitationMulti-annual averages
1981-2010
Amount ofprecipitation in mm
1-100
101-250
251-450
451-650
651-850
851-1,100
1,101-1,400
The map includes information on theJudea and Samaria Area as well.Source of data layer: Israel Meteorological Service.
PrecipitationMulti-annual averages
1981-2010
Amount ofprecipitation in mm
1-100
101-250
251-450
451-650
651-850
851-1,100
1,101-1,400
The map includes information on theJudea and Samaria Area as well.Source of data layer: Israel Meteorological Service.
7
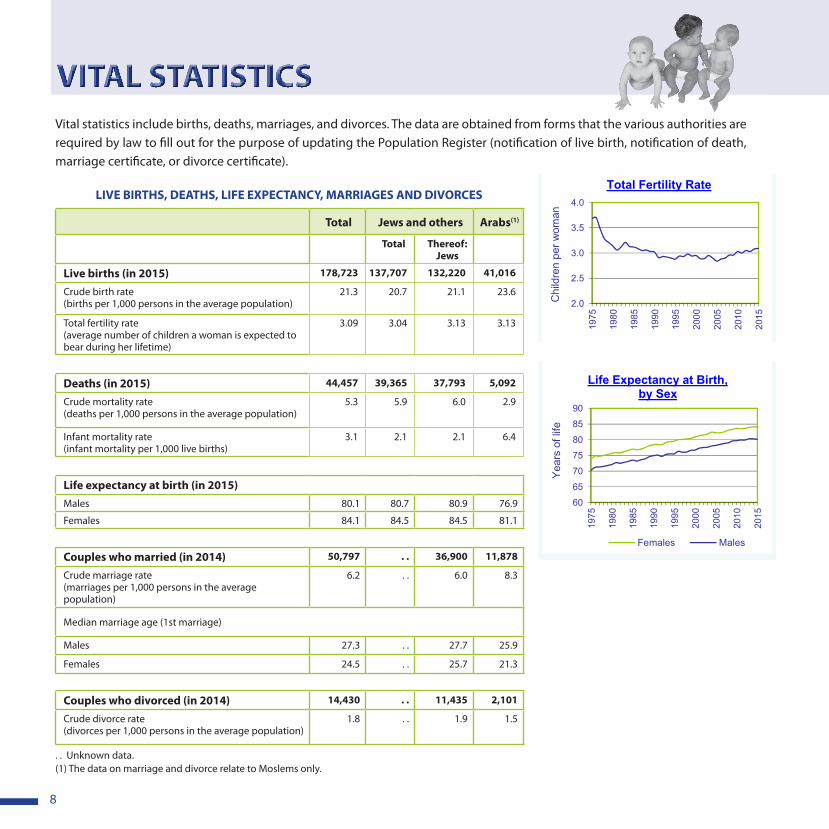
On 31 December 2015, the population of Israel numbered about 8.5 million inhabitants. The population of Israel comprises the following groups: Jews and others 79.2% Total 100.0% Jews 94.5% Non-Arab Christians 0.5% Not classified by religion 5.0%
Arabs 20.8% Total 100.0% Moslems 84.7% Arab-Christians 7.4% Druze 7.8%The population data are based on the last population Census (2008), and on records of vital statistics in the Population Register (births, deaths, changes of address, marriages, divorces, etc.).Population growth derives from natural increase (births less deaths) and from the migration balance (immigration less emigration).The share of immigration in population growth has changed over the years. The large waves of immigration were between 1948 and 1951 (about 688,000 immigrants), and in the 1990s (about one million immigrants).
Did you know?44% of all Jews in the world live in Israel. About 11% of the Israeli population (about 938,900 persons) are 65 and older. 56% of them are women. POPULATION
Population of Israel, End of 2015
Total Jews and others ArabsTotal Thereof: Jews
Population - Total(1) 8,463,400 6,705,600 6,334,500 1,757,800 Males 4,195,200 3,306,400 3,136,600 888,800 Females 4,268,200 3,399,200 3,198,000 869,000Percentage of annual population growth 2.0 2.0 1.9 2.2
Percentage of population aged 0-18 34.6 32.4 32.9 42.9Percentage of population aged 19-64 54.3 54.8 54.1 52.7Percentage of population aged 65+ 11.1 12.8 13.0 4.4Percentage of urban population(localities with 2,000 residents and more) 91.2 90.3 90.0 94.5
Percentage of population:Jerusalem District 12.5 10.8 11.1 19.1Northern District 16.3 9.5 9.4 42.1Haifa District 11.6 10.9 10.6 14.3Central District 24.5 28.4 28.7 9.6Tel Aviv District 16.2 20.1 20.1 1.1Southern District 14.4 14.6 14.1 13.7
(1) 4.6% of the total population resides in Israeli localities in the Judea and Samaria Area.
אוכלוסייה
0
20
40
60
80
100
1948-1960
1961-1971
1972-1982
1983-1989
1990-1995
1996-2000
2001-2008
2009-2011
2012 2013 2014 2015
Per
cent
ages
Sources of Population Growth
Natural increase Migration balance
0
20
40
60
80
100
1955 1960 1970 1980 1990 2000 2010 2020 2025 2035
Per
cent
ages
Population Projections, by Age
0-14 15-64 +65
7
Population Density, by Natural Regions
2015
Population Density, by Natural Regions
2015
0.0-99.9
100.0-249.9
250.0-499.9
500.0-999.9
1,000.0-2,999.9
3,000.0-5,999.9
6,000.0-10,999.9
Persons per sq. Km
Population Density, by Natural Regions
2015
0.0-99.9
100.0-249.9
250.0-499.9
500.0-999.9
1,000.0-2,999.9
3,000.0-5,999.9
6,000.0-10,999.9
Persons per sq. Km
8
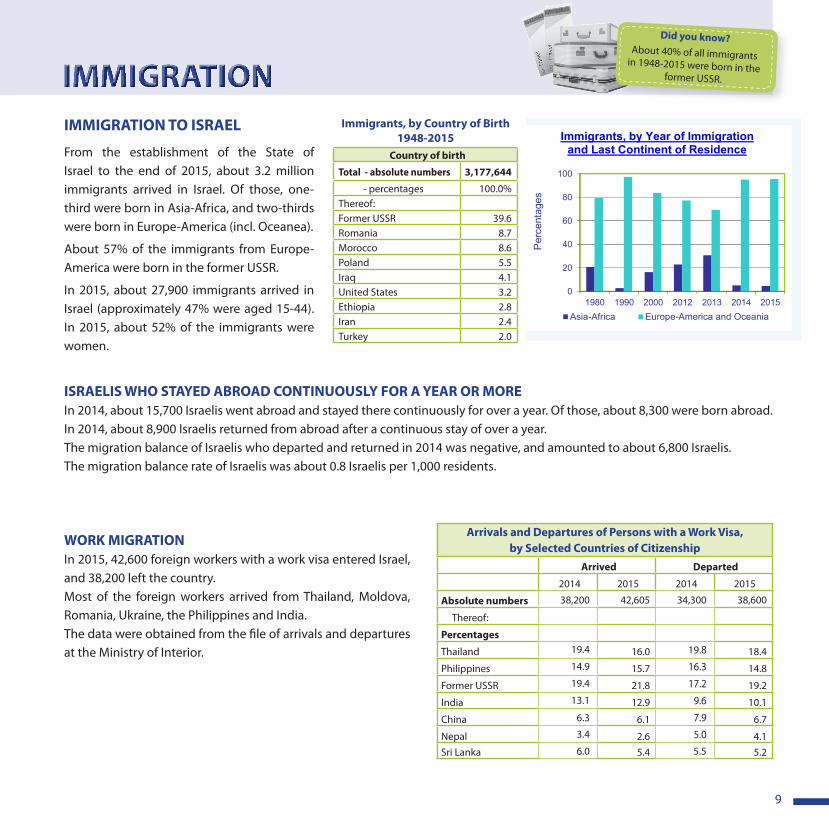
Vital statistics include births, deaths, marriages, and divorces. The data are obtained from forms that the various authorities are required by law to fill out for the purpose of updating the Population Register (notification of live birth, notification of death, marriage certificate, or divorce certificate).
Total Jews and others Arabs(1)
Total Thereof: Jews
Live births (in 2015) 178,723 137,707 132,220 41,016
Crude birth rate (births per 1,000 persons in the average population)
21.3 20.7 21.1 23.6
Total fertility rate (average number of children a woman is expected to bear during her lifetime)
3.09 3.04 3.13 3.13
Deaths (in 2015) 44,457 39,365 37,793 5,092
Crude mortality rate (deaths per 1,000 persons in the average population)
5.3 5.9 6.0 2.9
Infant mortality rate(infant mortality per 1,000 live births)
3.1 2.1 2.1 6.4
Life expectancy at birth (in 2015)Males 80.1 80.7 80.9 76.9
Females 84.1 84.5 84.5 81.1
Couples who married (in 2014) 50,797 . . 36,900 11,878
Crude marriage rate (marriages per 1,000 persons in the average population)
6.2 . . 6.0 8.3
Median marriage age (1st marriage)
Males 27.3 . . 27.7 25.9
Females 24.5 . . 25.7 21.3
Couples who divorced (in 2014) 14,430 . . 11,435 2,101
Crude divorce rate (divorces per 1,000 persons in the average population)
1.8 . . 1.9 1.5
. . Unknown data.(1) The data on marriage and divorce relate to Moslems only.
VITAL STATISTICS
LIVE BIRTHS, DEATHS, LIFE EXPECTANCY, MARRIAGES AND DIVORCES
תנועה טבעית
60
65
70
75
80
85
90
1975
1980
1985
1990
1995
2000
2005
2010
2015
Yea
rs o
f life
Life Expectancy at Birth,by Sex
Females Males
2.0
2.5
3.0
3.5
4.0
1975
1980
1985
1990
1995
2000
2005
2010
2015
Chi
ldre
n pe
r wom
an
Total Fertility Rate
8
9
IMMIGRATION TO ISRAEL
From the establishment of the State of Israel to the end of 2015, about 3.2 million immigrants arrived in Israel. Of those, one-third were born in Asia-Africa, and two-thirds were born in Europe-America (incl. Oceanea).
About 57% of the immigrants from Europe-America were born in the former USSR.
In 2015, about 27,900 immigrants arrived in Israel (approximately 47% were aged 15-44). In 2015, about 52% of the immigrants were women.
IMMIGRATIONImmigrants, by Country of Birth
1948-2015Country of birth
Total - absolute numbers 3,177,644
- percentages 100.0%Thereof:Former USSR 39.6Romania 8.7Morocco 8.6Poland 5.5Iraq 4.1United States 3.2Ethiopia 2.8Iran 2.4Turkey 2.0
ISRAELIS WHO STAYED ABROAD CONTINUOUSLY FOR A YEAR OR MOREIn 2014, about 15,700 Israelis went abroad and stayed there continuously for over a year. Of those, about 8,300 were born abroad.In 2014, about 8,900 Israelis returned from abroad after a continuous stay of over a year.The migration balance of Israelis who departed and returned in 2014 was negative, and amounted to about 6,800 Israelis.The migration balance rate of Israelis was about 0.8 Israelis per 1,000 residents.
WORK MIGRATIONIn 2015, 42,600 foreign workers with a work visa entered Israel, and 38,200 left the country. Most of the foreign workers arrived from Thailand, Moldova, Romania, Ukraine, the Philippines and India. The data were obtained from the file of arrivals and departures at the Ministry of Interior.
Did you know?About 40% of all immigrants in 1948-2015 were born in the
former USSR.
Arrivals and Departures of Persons with a Work Visa, by Selected Countries of Citizenship
Arrived Departed
2014 2015 2014 2015
Absolute numbers 38,200 42,605 34,300 38,600
Thereof:
Percentages
Thailand 19.4 16.0 19.8 18.4
Philippines 14.9 15.7 16.3 14.8
Former USSR 19.4 21.8 17.2 19.2
India 13.1 12.9 9.6 10.1
China 6.3 6.1 7.9 6.7
Nepal 3.4 2.6 5.0 4.1Sri Lanka 6.0 5.4 5.5 5.2
עלייה
0
20
40
60
80
100
1980 1990 2000 2012 2013 2014 2015
Per
cent
ages
Immigrants, by Year of Immigration and Last Continent of Residence
Asia-Africa Europe-America and Oceania
9
10
Household: One person or a group of persons living together in one dwelling on a permanent basis most of the week, who have a common expense budget for food.
A household may include persons who are not a family.
Family household: A household that contains at least one family.
Non-family household: Includes one person only or a group of persons who are not a family.
Family: A family is defined as two persons or more who share the same household and are usually related to one another as husband and wife, as an unmarried couple, or as a parent and child. The most common type of family is a couple with children (about 63%).
Today, the structure of households and families is more diverse than in the past, as a result of changing demographic, social, and economic trends in society.
The structure of the households and families is influenced by a variety of factors, some of which are presented below:
In recent years, more young people have been delaying marriage. Some live alone or with a roommate, and others cohabit with their partners.
Age at marriage and age at birth of first child have risen, as have divorce rates. Consequently, there has been an increase in the number of single-parent families.
Increased life expectancy has led to a rise in the proportion of elderly persons in the population, many of whom live alone.
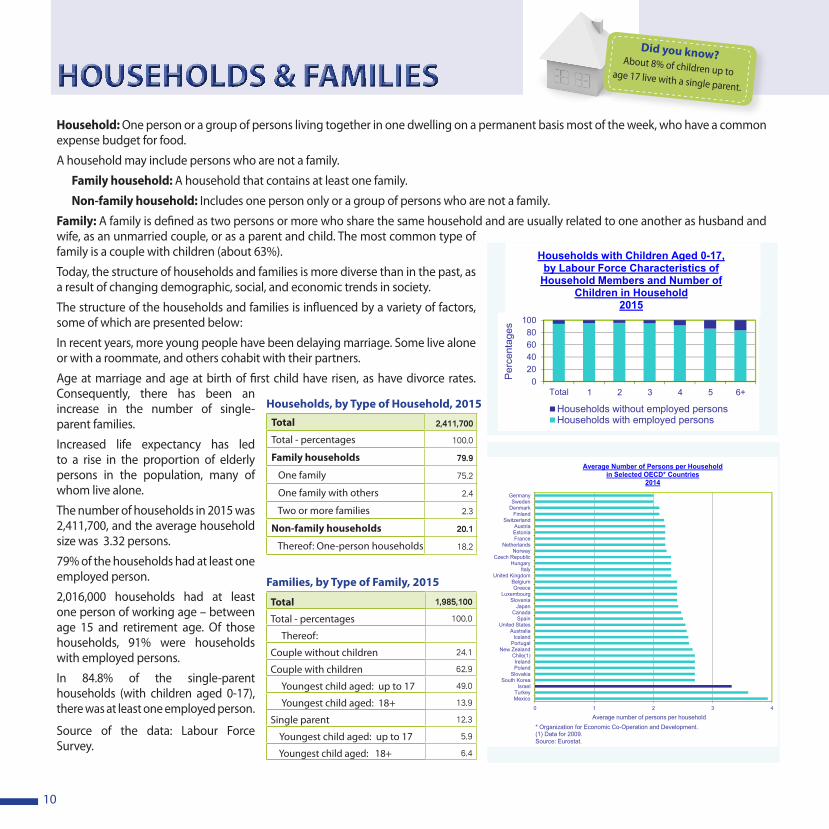
The number of households in 2015 was 2,411,700, and the average household size was 3.32 persons.
79% of the households had at least one employed person.
2,016,000 households had at least one person of working age – between age 15 and retirement age. Of those households, 91% were households with employed persons.
In 84.8% of the single-parent households (with children aged 0-17), there was at least one employed person.
Source of the data: Labour Force Survey.
HOUSEHOLDS & FAMILIES
Households, by Type of Household, 2015Total 2,411,700
Total - percentages 100.0
Family households 79.9
One family 75.2
One family with others 2.4
Two or more families 2.3
Non-family households 20.1
Thereof: One-person households 18.2
Families, by Type of Family, 2015
Total 1,985,100
Total - percentages 100.0
Thereof:
Couple without children 24.1
Couple with children 62.9
Youngest child aged: up to 17 49.0
Youngest child aged: 18+ 13.9
Single parent 12.3
Youngest child aged: up to 17 5.9
Youngest child aged: 18+ 6.4
Did you know?About 8% of children up to age 17 live with a single parent.
משקי בית ומשפחה
020406080
100
Total 1 2 3 4 5 +6
Per
cent
ages
Households with Children Aged 0-17, by Labour Force Characteristics of
Household Members and Number of Children in Household
2015
Households without employed personsHouseholds with employed persons
0 1 2 3 4
MexicoTurkey
IsraelSouth Korea
SlovakiaPolandIreland
Chile(1)New Zealand
PortugalIceland
AustraliaUnited States
SpainCanada
JapanSlovenia
LuxembourgGreece
BelgiumUnited Kingdom
ItalyHungary
Czech RepublicNorway
NetherlandsFranceEstoniaAustria
SwitzerlandFinland
DenmarkSweden
Germany
Average number of persons per household
Average Number of Persons per Householdin Selected OECD* Countries
2014
* Organization for Economic Co-Operation and Development.(1) Data for 2009.Source: Eurostat.
10
11
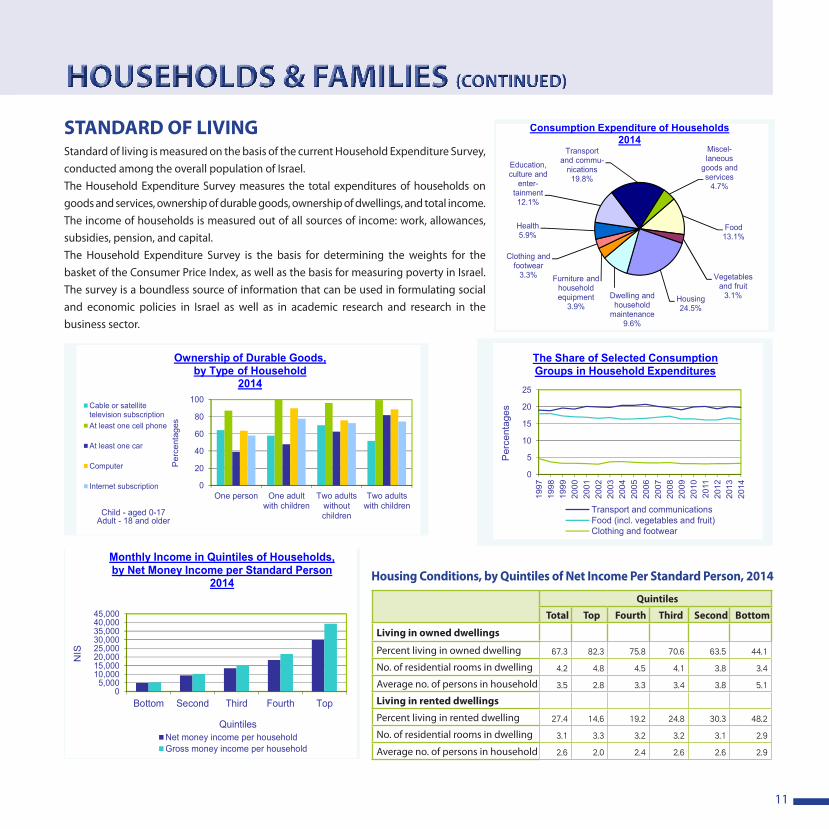
STANDARD OF LIVINGStandard of living is measured on the basis of the current Household Expenditure Survey, conducted among the overall population of Israel. The Household Expenditure Survey measures the total expenditures of households on goods and services, ownership of durable goods, ownership of dwellings, and total income. The income of households is measured out of all sources of income: work, allowances, subsidies, pension, and capital. The Household Expenditure Survey is the basis for determining the weights for the basket of the Consumer Price Index, as well as the basis for measuring poverty in Israel. The survey is a boundless source of information that can be used in formulating social and economic policies in Israel as well as in academic research and research in the business sector.
HOUSEHOLDS & FAMILIES (CONTINUED)
Housing Conditions, by Quintiles of Net Income Per Standard Person, 2014
QuintilesTotal Top Fourth Third Second Bottom
Living in owned dwellings
Percent living in owned dwelling 67.3 82.3 75.8 70.6 63.5 44.1
No. of residential rooms in dwelling 4.2 4.8 4.5 4.1 3.8 3.4
Average no. of persons in household 3.5 2.8 3.3 3.4 3.8 5.1
Living in rented dwellings
Percent living in rented dwelling 27.4 14.6 19.2 24.8 30.3 48.2
No. of residential rooms in dwelling 3.1 3.3 3.2 3.2 3.1 2.9
Average no. of persons in household 2.6 2.0 2.4 2.6 2.6 2.9
משקי בית, רמת חיים
Food13.1%
Vegetables and fruit
3.1%Housing24.5%
Dwelling and household
maintenance9.6%
Furniture and
household equipment
3.9%
Clothing and footwear
3.3%
Health5.9%
Education, culture and
enter-tainment12.1%
Transport and commu-
nications19.8%
Miscel-laneous
goods and services
4.7%
Consumption Expenditure of Households2011
0
5
10
15
20
25
1997
1998
1999
2000
2001
2002
2003
2004
2005
2006
2007
2008
2009
2010
2011
2012
2013
2014
Per
cent
ages
The Share of Selected Consumption Groups in Household Expenditures
Transport and communicationsFood (incl. vegetables and fruit)Clothing and footwear
Food13.1%
Vegetables and fruit
3.1%Housing24.5%
Dwelling and household
maintenance9.6%
Furniture and household equipment
3.9%
Clothing and footwear
3.3%
Health5.9%
Education, culture and
enter-tainment12.1%
Transport and commu-
nications19.8%
Miscel-laneous
goods and services
4.7%
Consumption Expenditure of Households2014
0
20
40
60
80
100
One person One adultwith children
Two adultswithoutchildren
Two adultswith children
Per
cent
ages
Ownership of Durable Goods,by Type of Household
2014
Cable or satellitetelevision subscriptionAt least one cell phone
At least one car
Computer
Internet subscription
Child - aged 0-17Adult - 18 and older
05,000
10,00015,00020,00025,00030,00035,00040,00045,000
Bottom Second Third Fourth Top
NIS
Quintiles
Monthly Income in Quintiles of Households, by Net Money Income per Standard Person
2014
Net money income per householdGross money income per household
11
משקי בית, רמת חיים
Food13.1%
Vegetables and fruit
3.1%Housing24.5%
Dwelling and household
maintenance9.6%
Furniture and
household equipment
3.9%
Clothing and footwear
3.3%
Health5.9%
Education, culture and
enter-tainment12.1%
Transport and commu-
nications19.8%
Miscel-laneous
goods and services
4.7%
Consumption Expenditure of Households2011
0
5
10
15
20
2519
9719
9819
9920
0020
0120
0220
0320
0420
0520
0620
0720
0820
0920
1020
1120
1220
1320
14
Per
cent
ages
The Share of Selected Consumption Groups in Household Expenditures
Transport and communicationsFood (incl. vegetables and fruit)Clothing and footwear
Food13.1%
Vegetables and fruit
3.1%Housing24.5%
Dwelling and household
maintenance9.6%
Furniture and household equipment
3.9%
Clothing and footwear
3.3%
Health5.9%
Education, culture and
enter-tainment12.1%
Transport and commu-
nications19.8%
Miscel-laneous
goods and services
4.7%
Consumption Expenditure of Households2014
0
20
40
60
80
100
One person One adultwith children
Two adultswithoutchildren
Two adultswith children
Per
cent
ages
Ownership of Durable Goods,by Type of Household
2014
Cable or satellitetelevision subscriptionAt least one cell phone
At least one car
Computer
Internet subscription
Child - aged 0-17Adult - 18 and older
05,000
10,00015,00020,00025,00030,00035,00040,00045,000
Bottom Second Third Fourth Top
NIS
Quintiles
Monthly Income in Quintiles of Households, by Net Money Income per Standard Person
2014
Net money income per householdGross money income per household
11
משקי בית, רמת חיים
Food13.1%
Vegetables and fruit
3.1%Housing24.5%
Dwelling and household
maintenance9.6%
Furniture and
household equipment
3.9%
Clothing and footwear
3.3%
Health5.9%
Education, culture and
enter-tainment12.1%
Transport and commu-
nications19.8%
Miscel-laneous
goods and services
4.7%
Consumption Expenditure of Households2011
0
5
10
15
20
25
1997
1998
1999
2000
2001
2002
2003
2004
2005
2006
2007
2008
2009
2010
2011
2012
2013
2014
Per
cent
ages
The Share of Selected Consumption Groups in Household Expenditures
Transport and communicationsFood (incl. vegetables and fruit)Clothing and footwear
Food13.1%
Vegetables and fruit
3.1%Housing24.5%
Dwelling and household
maintenance9.6%
Furniture and household equipment
3.9%
Clothing and footwear
3.3%
Health5.9%
Education, culture and
enter-tainment12.1%
Transport and commu-
nications19.8%
Miscel-laneous
goods and services
4.7%
Consumption Expenditure of Households2014
0
20
40
60
80
100
One person One adultwith children
Two adultswithoutchildren
Two adultswith children
Per
cent
ages
Ownership of Durable Goods,by Type of Household
2014
Cable or satellitetelevision subscriptionAt least one cell phone
At least one car
Computer
Internet subscription
Child - aged 0-17Adult - 18 and older
05,000
10,00015,00020,00025,00030,00035,00040,00045,000
Bottom Second Third Fourth Top
NIS
Quintiles
Monthly Income in Quintiles of Households, by Net Money Income per Standard Person
2014
Net money income per householdGross money income per household
11
12
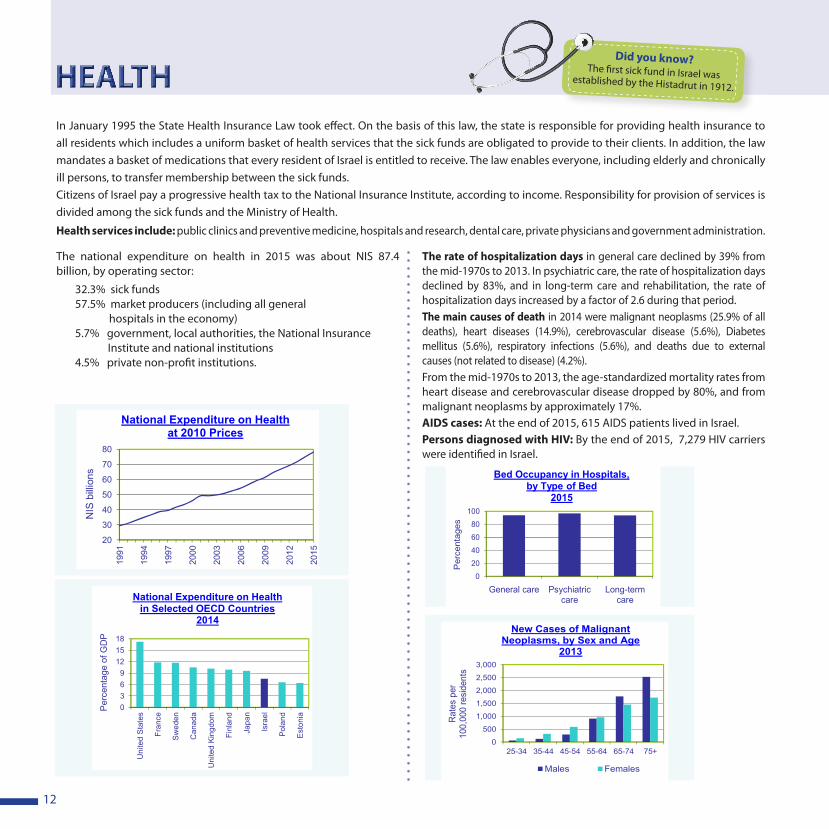
In January 1995 the State Health Insurance Law took effect. On the basis of this law, the state is responsible for providing health insurance to all residents which includes a uniform basket of health services that the sick funds are obligated to provide to their clients. In addition, the law mandates a basket of medications that every resident of Israel is entitled to receive. The law enables everyone, including elderly and chronically ill persons, to transfer membership between the sick funds.Citizens of Israel pay a progressive health tax to the National Insurance Institute, according to income. Responsibility for provision of services is divided among the sick funds and the Ministry of Health.
Health services include: public clinics and preventive medicine, hospitals and research, dental care, private physicians and government administration.
HEALTHDid you know?
The first sick fund in Israel was established by the Histadrut in 1912.
The national expenditure on health in 2015 was about NIS 87.4 billion, by operating sector:
32.3% sick funds57.5% market producers (including all general
hospitals in the economy)5.7% government, local authorities, the National Insurance
Institute and national institutions4.5% private non-profit institutions.
The rate of hospitalization days in general care declined by 39% from the mid-1970s to 2013. In psychiatric care, the rate of hospitalization days declined by 83%, and in long-term care and rehabilitation, the rate of hospitalization days increased by a factor of 2.6 during that period.The main causes of death in 2014 were malignant neoplasms (25.9% of all deaths), heart diseases (14.9%), cerebrovascular disease (5.6%), Diabetes mellitus (5.6%), respiratory infections (5.6%), and deaths due to external causes (not related to disease) (4.2%). From the mid-1970s to 2013, the age-standardized mortality rates from heart disease and cerebrovascular disease dropped by 80%, and from malignant neoplasms by approximately 17%.AIDS cases: At the end of 2015, 615 AIDS patients lived in Israel.Persons diagnosed with HIV: By the end of 2015, 7,279 HIV carriers were identified in Israel.
בריאות
0
500
1,000
1,500
2,000
2,500
3,000
25-34 35-44 45-54 55-64 65-74 +75
Rat
es p
er10
0,00
0 re
side
nts
גיל
New Cases of Malignant Neoplasms, by Sex and Age
2013
Males Females
0
20
40
60
80
100
General care Psychiatriccare
Long-termcare
Per
cent
ages
Bed Occupancy in Hospitals,by Type of Bed
2015
20
30
40
50
60
70
80
1991
1994
1997
2000
2003
2006
2009
2012
2015
NIS
bill
ions
National Expenditure on Healthat 2010 Prices
0369
121518
Uni
ted
Sta
tes
Fran
ce
Sw
eden
Can
ada
Uni
ted
Kin
gdom
Finl
and
Japa
n
Isra
el
Pol
and
Est
onia
Per
cent
age
of G
DP
National Expenditure on Healthin Selected OECD Countries
2014
12
בריאות
0
500
1,000
1,500
2,000
2,500
3,000
25-34 35-44 45-54 55-64 65-74 +75
Rat
es p
er10
0,00
0 re
side
nts
גיל
New Cases of Malignant Neoplasms, by Sex and Age
2013
Males Females
0
20
40
60
80
100
General care Psychiatriccare
Long-termcare
Perc
enta
ges
Bed Occupancy in Hospitals,by Type of Bed
2015
20
30
40
50
60
70
80
1991
1994
1997
2000
2003
2006
2009
2012
2015
NIS
billi
ons
National Expenditure on Healthat 2010 Prices
0369
121518
Uni
ted
Stat
es
Fran
ce
Swed
en
Can
ada
Uni
ted
King
dom
Finl
and
Japa
n
Isra
el
Pola
nd
Esto
niaPe
rcen
tage
of G
DP
National Expenditure on Healthin Selected OECD Countries
2014
12
בריאות
0
500
1,000
1,500
2,000
2,500
3,000
25-34 35-44 45-54 55-64 65-74 +75
Rat
es p
er10
0,00
0 re
side
nts
גיל
New Cases of Malignant Neoplasms, by Sex and Age
2013
Males Females
0
20
40
60
80
100
General care Psychiatriccare
Long-termcare
Per
cent
ages
Bed Occupancy in Hospitals,by Type of Bed
2015
20
30
40
50
60
70
80
1991
1994
1997
2000
2003
2006
2009
2012
2015
NIS
bill
ions
National Expenditure on Healthat 2010 Prices
0369
121518
Uni
ted
Sta
tes
Fran
ce
Sw
eden
Can
ada
Uni
ted
Kin
gdom
Finl
and
Japa
n
Isra
el
Pol
and
Est
onia
Per
cent
age
of G
DP
National Expenditure on Healthin Selected OECD Countries
2014
12
13
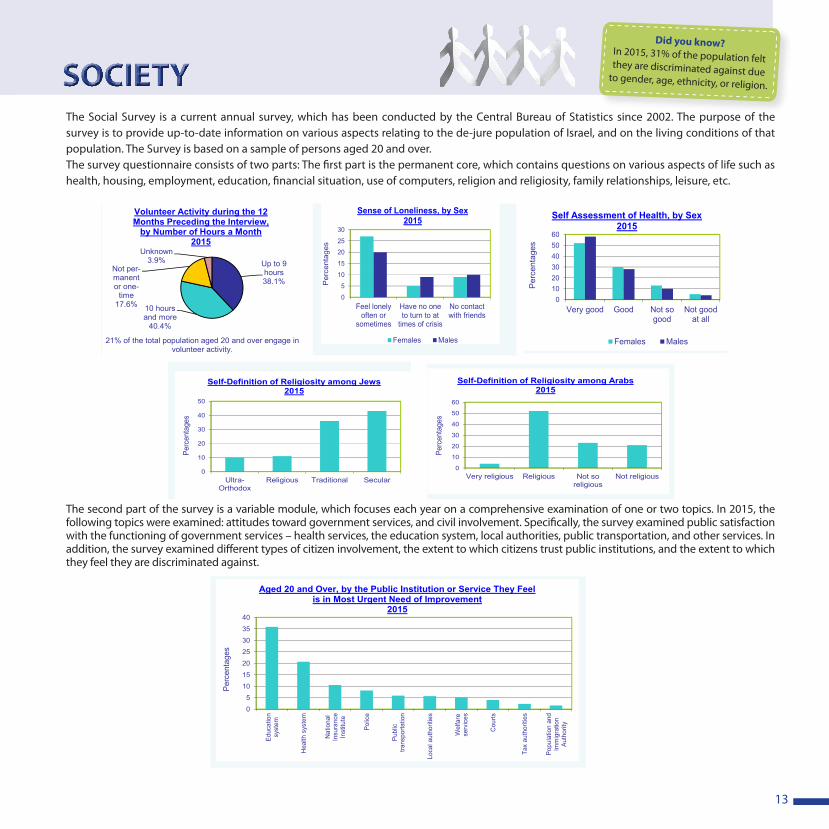
The Social Survey is a current annual survey, which has been conducted by the Central Bureau of Statistics since 2002. The purpose of the survey is to provide up-to-date information on various aspects relating to the de-jure population of Israel, and on the living conditions of that population. The Survey is based on a sample of persons aged 20 and over. The survey questionnaire consists of two parts: The first part is the permanent core, which contains questions on various aspects of life such as health, housing, employment, education, financial situation, use of computers, religion and religiosity, family relationships, leisure, etc.
The second part of the survey is a variable module, which focuses each year on a comprehensive examination of one or two topics. In 2015, the following topics were examined: attitudes toward government services, and civil involvement. Specifically, the survey examined public satisfaction with the functioning of government services – health services, the education system, local authorities, public transportation, and other services. In addition, the survey examined different types of citizen involvement, the extent to which citizens trust public institutions, and the extent to which they feel they are discriminated against.
SOCIETYDid you know?
In 2015, 31% of the population felt they are discriminated against due to gender, age, ethnicity, or religion.
חברה
0102030405060
Very good Good Not sogood
Not goodat all
Per
cent
ages
Self Assessment of Health, by Sex2015
Females Males
Up to 9 hours38.1%
10 hours and more
40.4%
Not per-manent or one-
time17.6%
Unknown3.9%
Volunteer Activity during the 12 Months Preceding the Interview,
by Number of Hours a Month 2015
21% of the total population aged 20 and over engage in volunteer activity.
0
5
10
15
20
25
30
Feel lonelyoften or
sometimes
Have no oneto turn to at
times of crisis
No contactwith friends
Per
cent
ages
Sense of Loneliness, by Sex2015
Females Males
13
חברה
0102030405060
Very good Good Not sogood
Not goodat all
Perc
enta
ges
Self Assessment of Health, by Sex2015
Females Males
Up to 9 hours38.1%
10 hours and more
40.4%
Not per-manent or one-
time17.6%
Unknown3.9%
Volunteer Activity during the 12 Months Preceding the Interview,
by Number of Hours a Month 2015
21% of the total population aged 20 and over engage in volunteer activity.
0
5
10
15
20
25
30
Feel lonelyoften or
sometimes
Have no oneto turn to at
times of crisis
No contactwith friends
Perc
enta
ges
Sense of Loneliness, by Sex2015
Females Males
13
חברה
0
10
20
30
40
50
Ultra-Orthodox
Religious Traditional Secular
Perc
enta
ges
Self-Definition of Religiosity among Jews2015
0
10
20
30
40
50
60
Very religious Religious Not soreligious
Not religious
Perc
enta
ges
Self-Definition of Religiosity among Arabs2015
0
5
10
15
20
25
30
35
40
Educ
atio
nsy
stem
Heal
th s
yste
m
Natio
nal
Insu
ranc
eIn
stitu
te
Polic
e
Publ
ictra
nspo
rtatio
n
Loca
l aut
horit
ies
Wel
fare
serv
ices
Cour
ts
Tax
auth
oritie
s
Popu
latio
n an
dIm
mig
ratio
nAu
thor
ity
Perc
enta
ges
Aged 20 and Over, by the Public Institution or Service They Feel is in Most Urgent Need of Improvement
2015
13
חברה
0
10
20
30
40
50
Ultra-Orthodox
Religious Traditional Secular
Perc
enta
ges
Self-Definition of Religiosity among Jews2015
0
10
20
30
40
50
60
Very religious Religious Not soreligious
Not religious
Perc
enta
ges
Self-Definition of Religiosity among Arabs2015
0
5
10
15
20
25
30
35
40
Educ
atio
nsy
stem
Hea
lth s
yste
m
Nat
iona
lIn
sura
nce
Inst
itute
Polic
e
Publ
ictra
nspo
rtatio
n
Loca
l aut
horit
ies
Wel
fare
serv
ices
Cou
rts
Tax
auth
oriti
es
Popu
latio
n an
dIm
mig
ratio
nAu
thor
ity
Perc
enta
ges
Aged 20 and Over, by the Public Institution or Service They Feel is in Most Urgent Need of Improvement
2015
13
14
WELFARE SERVICES
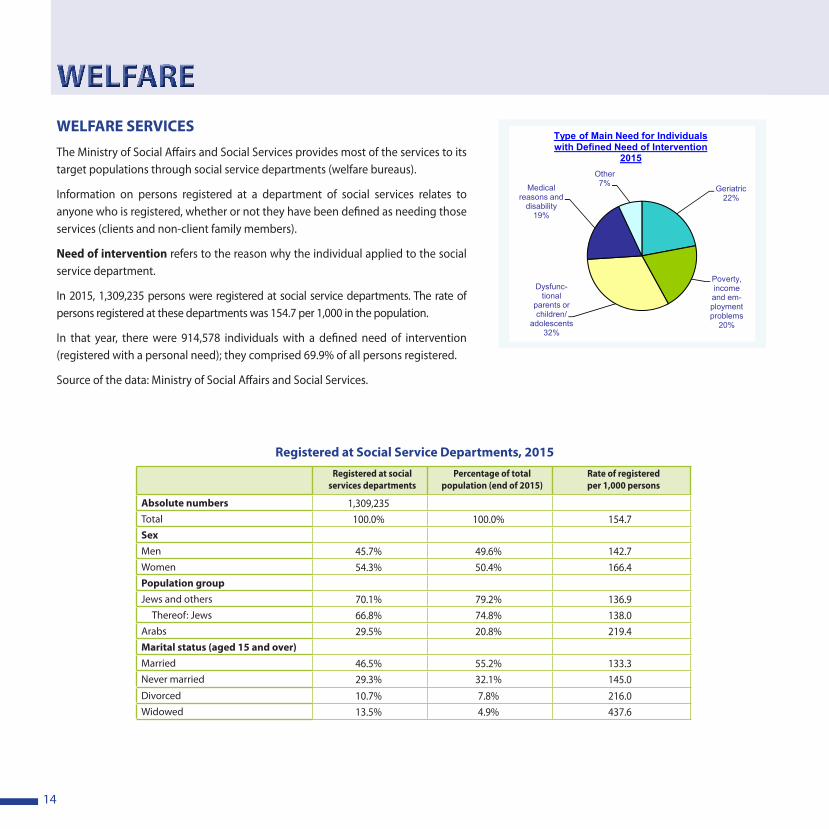
The Ministry of Social Affairs and Social Services provides most of the services to its target populations through social service departments (welfare bureaus).
Information on persons registered at a department of social services relates to anyone who is registered, whether or not they have been defined as needing those services (clients and non-client family members).
Need of intervention refers to the reason why the individual applied to the social service department.
In 2015, 1,309,235 persons were registered at social service departments. The rate of persons registered at these departments was 154.7 per 1,000 in the population.
In that year, there were 914,578 individuals with a defined need of intervention (registered with a personal need); they comprised 69.9% of all persons registered.
Source of the data: Ministry of Social Affairs and Social Services.
WELFARE
Registered at Social Service Departments, 2015 Rate of registeredper 1,000 persons
Percentage of total population (end of 2015)
Registered at social services departments
1,309,235Absolute numbers
154.7100.0%100.0%Total
Sex
142.749.6%45.7%Men
166.450.4%54.3%Women
Population group
136.979.2%70.1%Jews and others
138.074.8%66.8%Thereof: Jews
219.420.8%29.5%Arabs
Marital status (aged 15 and over)
133.355.2%46.5%Married
145.032.1%29.3%Never married
216.07.8%10.7%Divorced
437.64.9%13.5%Widowed
רווחה
Geriatric22%
Poverty, income and em-ployment problems
20%
Dysfunc-tional
parents or children/
adolescents32%
Medical reasons and
disability19%
Other7%
Type of Main Need for Individualswith Defined Need of Intervention
2015
14
15
EDUCATION
Students and Teaching Staff in the Educational System, 2014/15
Students Teaching
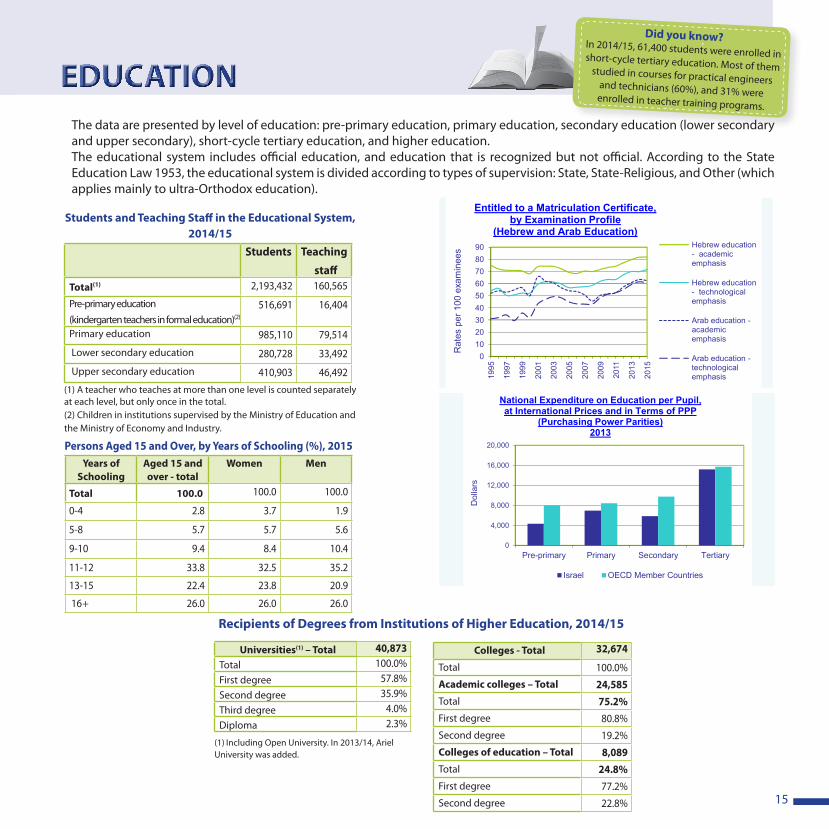
staffTotal(1) 2,193,432 160,565
Pre-primary education(kindergarten teachers in formal education)(2)
516,691 16,404
Primary education 985,110 79,514
Lower secondary education 280,728 33,492
Upper secondary education 410,903 46,492(1) A teacher who teaches at more than one level is counted separately at each level, but only once in the total.(2) Children in institutions supervised by the Ministry of Education and the Ministry of Economy and Industry.
Persons Aged 15 and Over, by Years of Schooling (%), 2015Years of
SchoolingAged 15 and over - total
Women Men
Total 100.0 100.0 100.0
0-4 2.8 3.7 1.9
5-8 5.7 5.7 5.6
9-10 9.4 8.4 10.4
11-12 33.8 32.5 35.2
13-15 22.4 23.8 20.9
16 + 26.0 26.0 26.0
Did you know?In 2014/15, 61,400 students were enrolled in short-cycle tertiary education. Most of them studied in courses for practical engineers and technicians (60%), and 31% were enrolled in teacher training programs.
The data are presented by level of education: pre-primary education, primary education, secondary education (lower secondary and upper secondary), short-cycle tertiary education, and higher education.The educational system includes official education, and education that is recognized but not official. According to the State Education Law 1953, the educational system is divided according to types of supervision: State, State-Religious, and Other (which applies mainly to ultra-Orthodox education).
חינוך
0
4,000
8,000
12,000
16,000
20,000
Pre-primary Primary Secondary Tertiary
Dol
lars
National Expenditure on Education per Pupil,at International Prices and in Terms of PPP
(Purchasing Power Parities)2013
Israel OECD Member Countries
0102030405060708090
1995
1997
1999
2001
2003
2005
2007
2009
2011
2013
2015
Rat
es p
er 1
00 e
xam
inee
s
Entitled to a Matriculation Certificate,by Examination Profile
(Hebrew and Arab Education)Hebrew education- academicemphasis
Hebrew education- technologicalemphasis
Arab education -academicemphasis
Arab education -technologicalemphasis
15
Recipients of Degrees from Institutions of Higher Education, 2014/15
40,873 Universities(1) – Total100.0%Total
57.8% First degree35.9% Second degree
4.0% Third degree2.3%Diploma
(1) Including Open University. In 2013/14, Ariel University was added.
32,674 Colleges - Total
100.0%Total
24,585Academic colleges – Total
75.2%Total
80.8% First degree
19.2% Second degree
8,089Colleges of education – Total
24.8%Total
77.2% First degree
22.8% Second degree
16
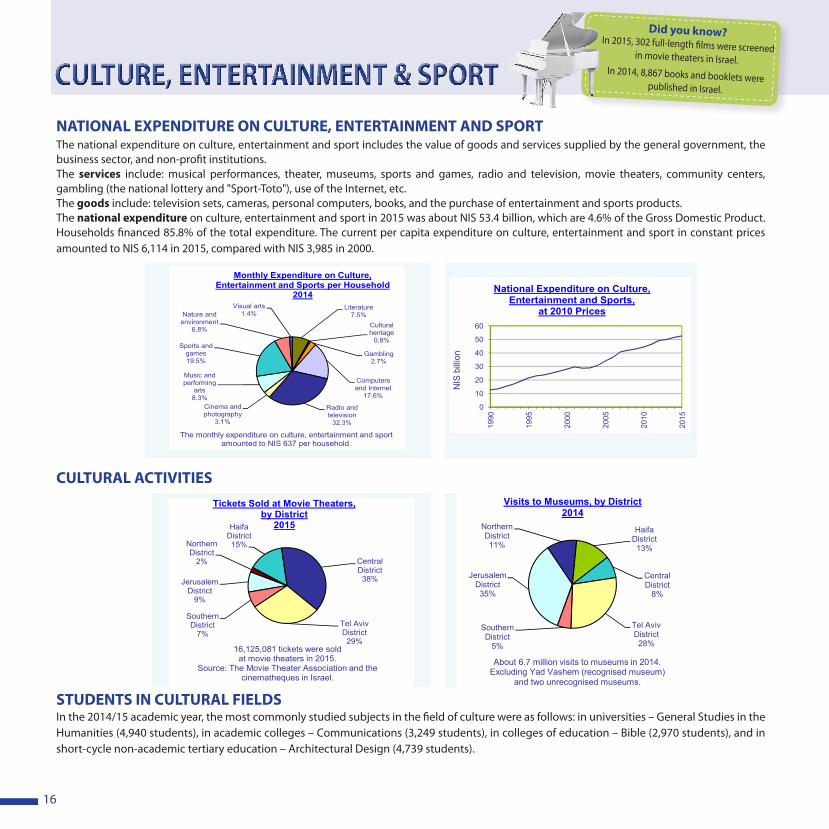
NATIONAL EXPENDITURE ON CULTURE, ENTERTAINMENT AND SPORTThe national expenditure on culture, entertainment and sport includes the value of goods and services supplied by the general government, the business sector, and non-profit institutions.The services include: musical performances, theater, museums, sports and games, radio and television, movie theaters, community centers, gambling (the national lottery and "Sport-Toto"), use of the Internet, etc. The goods include: television sets, cameras, personal computers, books, and the purchase of entertainment and sports products.The national expenditure on culture, entertainment and sport in 2015 was about NIS 53.4 billion, which are 4.6% of the Gross Domestic Product. Households financed 85.8% of the total expenditure. The current per capita expenditure on culture, entertainment and sport in constant prices amounted to NIS 6,114 in 2015, compared with NIS 3,985 in 2000.
CULTURAL ACTIVITIES
STUDENTS IN CULTURAL FIELDSIn the 2014/15 academic year, the most commonly studied subjects in the field of culture were as follows: in universities – General Studies in the Humanities (4,940 students), in academic colleges – Communications (3,249 students), in colleges of education – Bible (2,970 students), and in short-cycle non-academic tertiary education – Architectural Design (4,739 students).
CULTURE, ENTERTAINMENT & SPORT
Did you know? In 2015, 302 full-length films were screened in movie theaters in Israel.
In 2014, 8,867 books and booklets were published in Israel.
תרבות, בידור וספורט
Jerusalem District
9%
Northern District
2%
Haifa District15%
Central District38%
Tel Aviv District29%
Southern District
7%
Tickets Sold at Movie Theaters,by District
2015
16,125,081 tickets were soldat movie theaters in 2015.
Source: The Movie Theater Association and the cinematheques in Israel.
Computers and Internet
17.6%
Radio and television
32.3%
Cinema and photography
3.1%
Music and performing
arts8.3%
Sports and games19.5%
Nature and environment
6.8%
Visual arts1.4%
Literature7.5%
Cultural heritage
0.8%
Gambling2.7%
Monthly Expenditure on Culture, Entertainment and Sports per Household
2014
The monthly expenditure on culture, entertainment and sport amounted to NIS 637 per household.
0
10
20
30
40
50
60
1990
1995
2000
2005
2010
2015
NIS
billi
on
National Expenditure on Culture, Entertainment and Sports,
at 2010 Prices
16
תרבות, בידור וספורט
Jerusalem District35%
Northern District11%
Haifa District13%
Central District
8%
Tel Aviv District28%
Southern District
5%
Visits to Museums, by District2014
About 6.7 million visits to museums in 2014.Excluding Yad Vashem (recognised museum)
and two unrecognised museums.
16
17
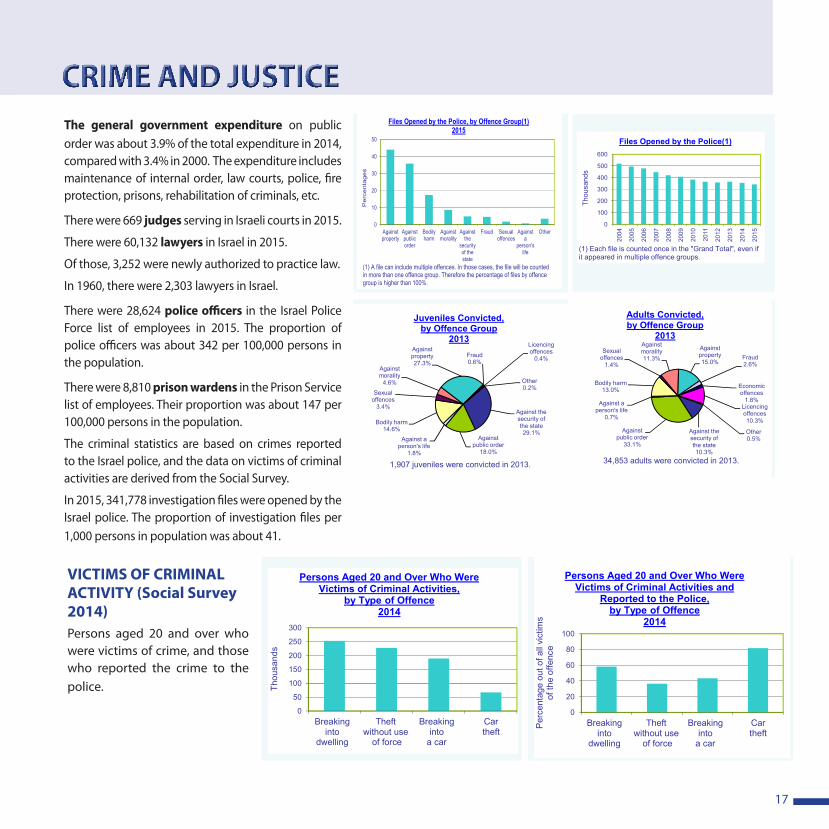
The general government expenditure on public order was about 3.9% of the total expenditure in 2014, compared with 3.4% in 2000. The expenditure includes maintenance of internal order, law courts, police, fire protection, prisons, rehabilitation of criminals, etc.
There were 669 judges serving in Israeli courts in 2015.
There were 60,132 lawyers in Israel in 2015.
Of those, 3,252 were newly authorized to practice law.
In 1960, there were 2,303 lawyers in Israel.
There were 28,624 police officers in the Israel Police Force list of employees in 2015. The proportion of police officers was about 342 per 100,000 persons in the population.
There were 8,810 prison wardens in the Prison Service list of employees. Their proportion was about 147 per 100,000 persons in the population.
The criminal statistics are based on crimes reported to the Israel police, and the data on victims of criminal activities are derived from the Social Survey.
In 2015, 341,778 investigation files were opened by the Israel police. The proportion of investigation files per 1,000 persons in population was about 41.
CRIME AND JUSTICE
VICTIMS OF CRIMINAL ACTIVITY ׂ(Social Survey 2014)Persons aged 20 and over who were victims of crime, and those who reported the crime to the police.
פשיעה ומשפט
Against the security of the state29.1%
Against public order
18.0%
Against a person's life
1.8%
Bodily harm14.6%
Sexual offences
3.4%
Against morality
4.6%
Against property27.3%
Fraud0.6%
Licencing offences
0.4%
Other0.2%
Juveniles Convicted,by Offence Group
2013
1,907 juveniles were convicted in 2013.
0
100
200
300
400
500
600
2004
2005
2006
2007
2008
2009
2010
2011
2012
2013
2014
2015
Thou
sand
s
Files Opened by the Police(1)
(1) Each file is counted once in the "Grand Total", even if it appeared in multiple offence groups.
0
10
20
30
40
50
Againstproperty
Againstpublicorder
Bodilyharm
Againstmorality
Againstthe
securityof thestate
Fraud Sexualoffences
Againsta
person'slife
Other
Per
cent
ages
Files Opened by the Police, by Offence Group(1)2015
(1) A file can include multiple offences. In those cases, the file will be counted in more than one offence group. Therefore the percentage of files by offence group is higher than 100%.
17
פשיעה ומשפט
Against the security of the state29.1%
Against public order
18.0%
Against a person's life
1.8%
Bodily harm14.6%
Sexual offences
3.4%
Against morality
4.6%
Against property27.3%
Fraud0.6%
Licencing offences
0.4%
Other0.2%
Juveniles Convicted,by Offence Group
2013
1,907 juveniles were convicted in 2013.
0
100
200
300
400
500
600
2004
2005
2006
2007
2008
2009
2010
2011
2012
2013
2014
2015
Thousa
nds
Files Opened by the Police(1)
(1) Each file is counted once in the "Grand Total", even if it appeared in multiple offence groups.
0
10
20
30
40
50
Againstproperty
Againstpublicorder
Bodilyharm
Againstmorality
Againstthe
securityof thestate
Fraud Sexualoffences
Againsta
person'slife
Other
Perc
enta
ges
Files Opened by the Police, by Offence Group(1)2015
(1) A file can include multiple offences. In those cases, the file will be counted in more than one offence group. Therefore the percentage of files by offence group is higher than 100%.
17
פשיעה ומשפט
Against the security of the state10.3%
Against public order
33.1%
Against a person's life
0.7%
Bodily harm13.0%
Sexual offences
1.4%
Against morality11.3%
Against property15.0%
Fraud2.6%
Economic offences
1.8%Licencing offences10.3%
Other0.5%
Adults Convicted,by Offence Group
2013
34,853 adults were convicted in 2013.
0
50
100
150
200
250
300
Breakinginto
dwelling
Theftwithout use
of force
Breakinginto
a car
Cartheft
Thou
sand
s
Persons Aged 20 and Over Who Were Victims of Criminal Activities,
by Type of Offence2014
0
20
40
60
80
100
Breakinginto
dwelling
Theftwithout use
of force
Breakinginto
a car
Cartheft
Per
cent
age
out o
f all
vict
ims
of th
e of
fenc
e
Persons Aged 20 and Over Who Were Victims of Criminal Activities and
Reported to the Police,by Type of Offence
2014
17
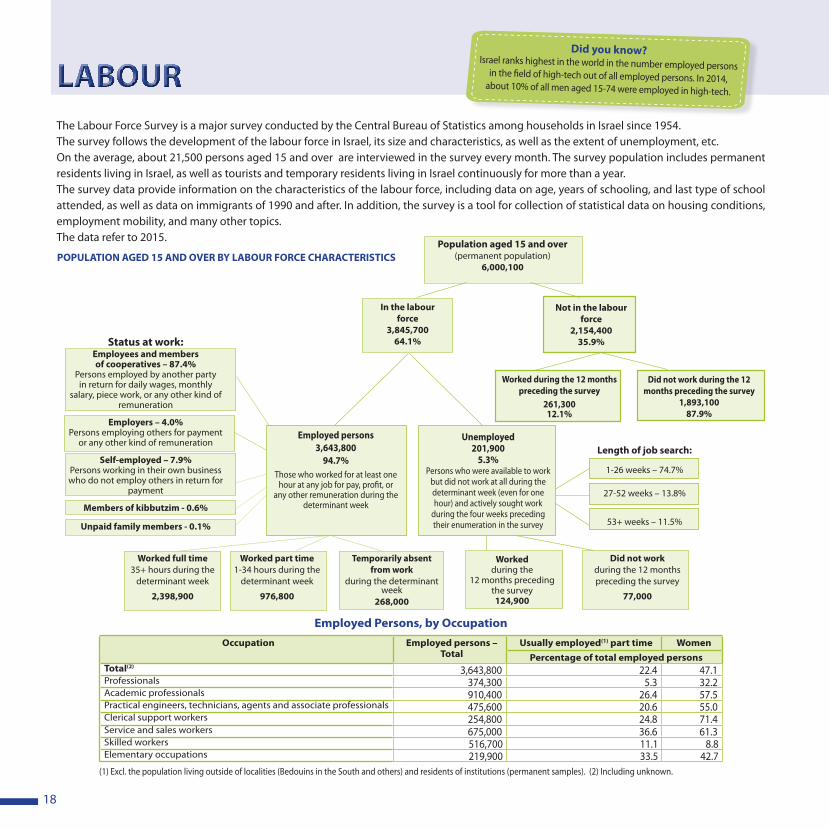
18
The Labour Force Survey is a major survey conducted by the Central Bureau of Statistics among households in Israel since 1954. The survey follows the development of the labour force in Israel, its size and characteristics, as well as the extent of unemployment, etc. On the average, about 21,500 persons aged 15 and over are interviewed in the survey every month. The survey population includes permanent residents living in Israel, as well as tourists and temporary residents living in Israel continuously for more than a year.The survey data provide information on the characteristics of the labour force, including data on age, years of schooling, and last type of school attended, as well as data on immigrants of 1990 and after. In addition, the survey is a tool for collection of statistical data on housing conditions, employment mobility, and many other topics.The data refer to 2015.
LABOURDid you know?
Israel ranks highest in the world in the number employed persons in the field of high-tech out of all employed persons. In 2014,
about 10% of all men aged 15-74 were employed in high-tech.
Employed Persons, by Occupation
Occupation Employed persons – Total
Usually employed(1) part time WomenPercentage of total employed persons
Total(2) 3,643,800 22.4 47.1Professionals 374,300 5.3 32.2Academic professionals 910,400 26.4 57.5Practical engineers, technicians, agents and associate professionals 475,600 20.6 55.0Clerical support workers 254,800 24.8 71.4Service and sales workers 675,000 36.6 61.3Skilled workers 516,700 11.1 8.8Elementary occupations 219,900 33.5 42.7
(1) Excl. the population living outside of localities (Bedouins in the South and others) and residents of institutions (permanent samples). (2) Including unknown.
POPULATION AGED 15 AND OVER BY LABOUR FORCE CHARACTERISTICS
Worked full time 35+ hours during the
determinant week
2,398,900
Worked part time1-34 hours during the
determinant week
976,800
Temporarily absent from work
during the determinant week
268,000
Workedduring the
12 months preceding the survey124,900
Did not work during the 12 months preceding the survey
77,000
Status at work:Employees and members of cooperatives – 87.4%
Persons employed by another party in return for daily wages, monthly
salary, piece work, or any other kind of remuneration
Employers – 4.0%Persons employing others for payment
or any other kind of remuneration
Self-employed – 7.9%Persons working in their own business who do not employ others in return for
payment
Members of kibbutzim - 0.6%
Unpaid family members - 0.1%
Population aged 15 and over (permanent population)
6,000,100
In the labour force
3,845,70064.1%
Not in the labour force
2,154,40035.9%
Did not work during the 12 months preceding the survey
1,893,10087.9%
Worked during the 12 months preceding the survey
261,30012.1%
Unemployed 201,900
5.3%Persons who were available to work
but did not work at all during the determinant week (even for one hour) and actively sought work
during the four weeks preceding their enumeration in the survey
Employed persons 3,643,800
94.7%Those who worked for at least one
hour at any job for pay, profit, or any other remuneration during the
determinant week
Length of job search:
1-26 weeks – 74.7%
27-52 weeks – 13.8%
53+ weeks – 11.5%
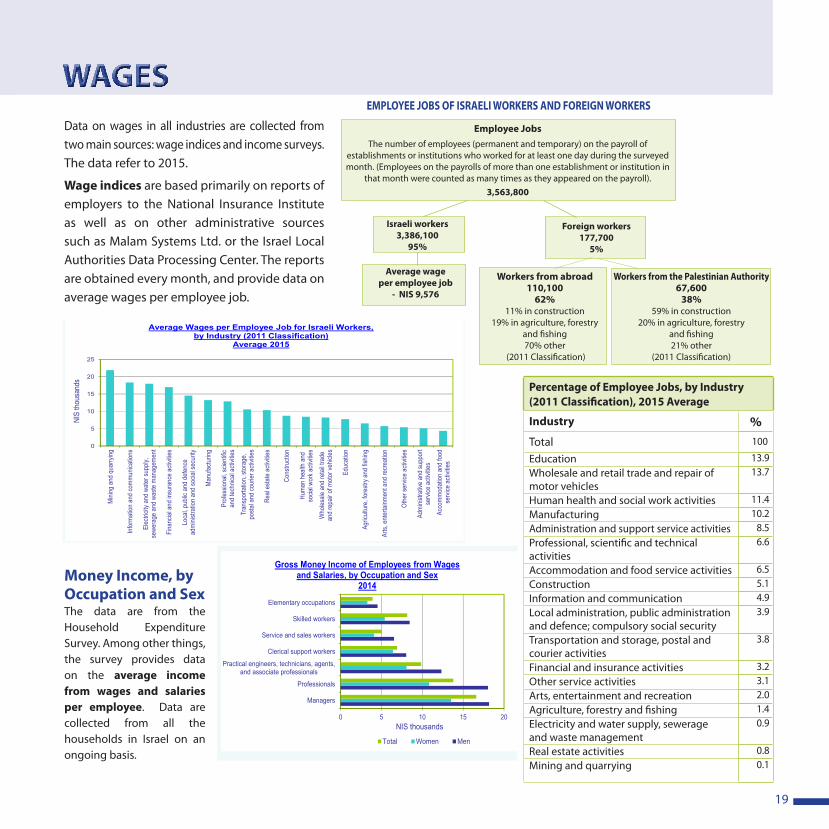
19
Data on wages in all industries are collected from two main sources: wage indices and income surveys. The data refer to 2015.
Wage indices are based primarily on reports of employers to the National Insurance Institute as well as on other administrative sources such as Malam Systems Ltd. or the Israel Local Authorities Data Processing Center. The reports are obtained every month, and provide data on average wages per employee job.
WAGESEMPLOYEE JOBS OF ISRAELI WORKERS AND FOREIGN WORKERS
Employee JobsThe number of employees (permanent and temporary) on the payroll of
establishments or institutions who worked for at least one day during the surveyed month. (Employees on the payrolls of more than one establishment or institution in
that month were counted as many times as they appeared on the payroll).3,563,800
Israeli workers3,386,100
95%
Foreign workers177,700
5%
Workers from abroad110,100
62%11% in construction
19% in agriculture, forestry and fishing70% other
(2011 Classification)
Workers from the Palestinian Authority67,600
38%59% in construction
20% in agriculture, forestry and fishing21% other
(2011 Classification)
Average wage per employee job
- NIS 9,576
Money Income, by Occupation and SexThe data are from the Household Expenditure Survey. Among other things, the survey provides data on the average income from wages and salaries per employee. Data are collected from all the households in Israel on an ongoing basis.
Percentage of Employee Jobs, by Industry (2011 Classification), 2015 Average
Industry %Total 100
Education 13.9Wholesale and retail trade and repair of motor vehicles
13.7
Human health and social work activities 11.4Manufacturing 10.2Administration and support service activities 8.5 Professional, scientific and technical activities
6.6
Accommodation and food service activities 6.5Construction 5.1Information and communication 4.9Local administration, public administration and defence; compulsory social security
3.9
Transportation and storage, postal and courier activities
3.8
Financial and insurance activities 3.2Other service activities 3.1Arts, entertainment and recreation 2.0Agriculture, forestry and fishing 1.4Electricity and water supply, sewerage and waste management
0.9
Real estate activities 0.8Mining and quarrying 0.1
שכר
0
5
10
15
20
25
Mini
ng a
nd q
uarry
ing
Info
rmat
ion a
nd c
omm
unica
tions
Elec
tricit
y an
d wa
ter s
uppl
y,se
wera
ge a
nd w
aste
man
agem
ent
Fina
ncia
l and
insu
ranc
e ac
tivitie
s
Loca
l, pub
lic a
nd d
efen
cead
mini
strat
ion
and
socia
l sec
urity
Man
ufac
turin
g
Prof
essio
nal,
scien
tific
and
tech
nical
acti
vitie
s
Tran
spor
tatio
n, s
tora
ge,
posta
l and
cou
rier a
ctivit
ies
Real
esta
te a
ctivit
ies
Cons
truct
ion
Hum
an h
ealth
and
socia
l wor
k ac
tivitie
s
Who
lesale
and
reta
il tra
dean
d re
pair
of m
otor
vehic
les
Educ
ation
Agric
ultur
e, fo
restr
y and
fish
ing
Arts
, ent
erta
inmen
t and
recr
eatio
n
Othe
r ser
vice
activ
ities
Adm
inist
rativ
e an
d su
ppor
tse
rvice
act
ivitie
s
Acco
mm
odat
ion
and
food
serv
ice a
ctivi
ties
NIS
thou
sand
s
Average Wages per Employee Job for Israeli Workers,by Industry (2011 Classification)
Average 2015
0 5 10 15 20
Managers
Professionals
Practical engineers, technicians, agents,and associate professionals
Clerical support workers
Service and sales workers
Skilled workers
Elementary occupations
NIS thousands
Gross Money Income of Employees from Wagesand Salaries, by Occupation and Sex
2014
Total Women Men
19
שכר
0
5
10
15
20
25
Min
ing
and
quar
ryin
g
Info
rmat
ion
and
com
mun
icat
ions
Ele
ctric
ity a
nd w
ater
sup
ply,
sew
erag
e an
d w
aste
man
agem
ent
Fin
anci
al a
nd in
sura
nce
activ
ities
Loca
l, pu
blic
and
def
ence
adm
inis
trat
ion
and
soci
al s
ecur
ity
Man
ufac
turin
g
Pro
fess
iona
l, sc
ient
ific
and
tech
nica
l act
iviti
es
Tra
nspo
rtat
ion,
sto
rage
,po
stal
and
cou
rier
activ
ities
Rea
l est
ate
activ
ities
Con
stru
ctio
n
Hum
an h
ealth
and
soci
al w
ork
activ
ities
Who
lesa
le a
nd r
etai
l tra
dean
d re
pair
of m
otor
veh
icle
s
Edu
catio
n
Agr
icul
ture
, for
estr
y an
d fis
hing
Art
s, e
nter
tain
men
t and
rec
reat
ion
Oth
er s
ervi
ce a
ctiv
ities
Adm
inis
trat
ive
and
supp
ort
serv
ice
activ
ities
Acc
omm
odat
ion
and
food
serv
ice
activ
ities
NIS
thou
sand
s
Average Wages per Employee Job for Israeli Workers,by Industry (2011 Classification)
Average 2015
0 5 10 15 20
Managers
Professionals
Practical engineers, technicians, agents,and associate professionals
Clerical support workers
Service and sales workers
Skilled workers
Elementary occupations
NIS thousands
Gross Money Income of Employees from Wagesand Salaries, by Occupation and Sex
2014
Total Women Men
19
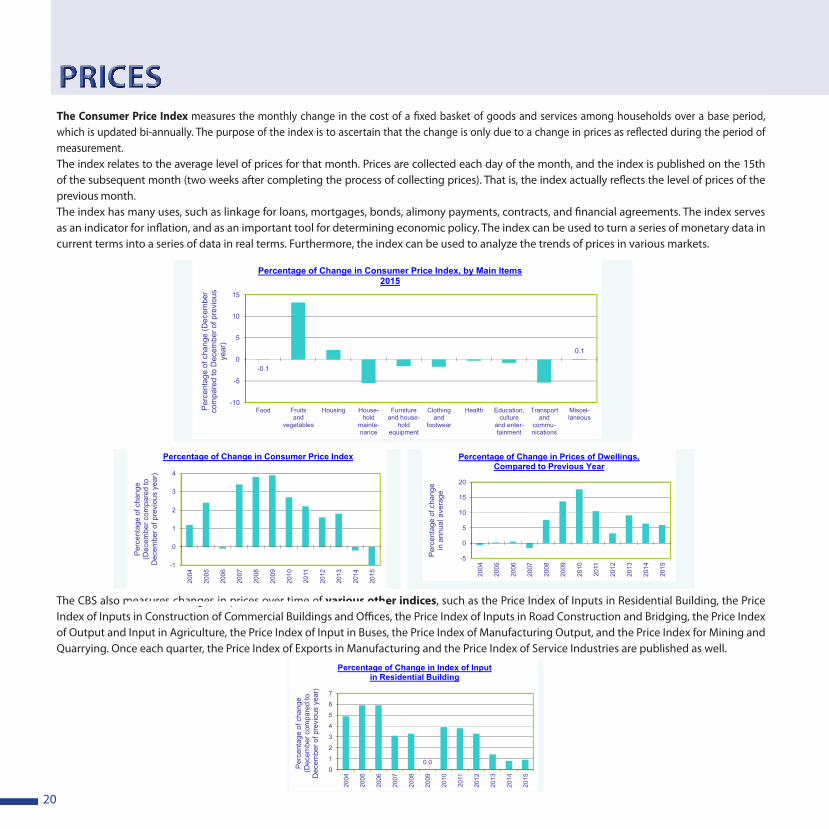
20
The Consumer Price Index measures the monthly change in the cost of a fixed basket of goods and services among households over a base period, which is updated bi-annually. The purpose of the index is to ascertain that the change is only due to a change in prices as reflected during the period of measurement.The index relates to the average level of prices for that month. Prices are collected each day of the month, and the index is published on the 15th of the subsequent month (two weeks after completing the process of collecting prices). That is, the index actually reflects the level of prices of the previous month. The index has many uses, such as linkage for loans, mortgages, bonds, alimony payments, contracts, and financial agreements. The index serves as an indicator for inflation, and as an important tool for determining economic policy. The index can be used to turn a series of monetary data in current terms into a series of data in real terms. Furthermore, the index can be used to analyze the trends of prices in various markets.
The CBS also measures changes in prices over time of various other indices, such as the Price Index of Inputs in Residential Building, the Price Index of Inputs in Construction of Commercial Buildings and Offices, the Price Index of Inputs in Road Construction and Bridging, the Price Index of Output and Input in Agriculture, the Price Index of Input in Buses, the Price Index of Manufacturing Output, and the Price Index for Mining and Quarrying. Once each quarter, the Price Index of Exports in Manufacturing and the Price Index of Service Industries are published as well.
מחירים
-1
0
1
2
3
4
2004
2005
2006
2007
2008
2009
2010
2011
2012
2013
2014
2015
Per
cent
age
of c
hang
e (D
ecem
ber c
ompa
red
to
Dec
embe
r of p
revi
ous
year
)
Percentage of Change in Consumer Price Index
-0.1
0.1
-10
-5
0
5
10
15
Food Fruitsand
vegetables
Housing House-hold
mainte-nance
Furnitureand house-
holdequipment
Clothingand
footwear
Health Education,culture
and enter-tainment
Transportand
commu-nications
Miscel-laneous
Per
cent
age
of c
hang
e (D
ecem
ber
com
pare
d to
Dec
embe
r of p
revi
ous
year
)
Percentage of Change in Consumer Price Index, by Main Items2015
-5
0
5
10
15
20
2004
2005
2006
2007
2008
2009
2010
2011
2012
2013
2014
2015
Per
cent
age
of c
hang
ein
ann
ual a
vera
ge
Percentage of Change in Prices of Dwellings, Compared to Previous Year
0.00
1
2
3
4
5
6
7
2004
2005
2006
2007
2008
2009
2010
2011
2012
2013
2014
2015
Per
cent
age
of c
hang
e (D
ecem
ber c
ompa
red
to
Dec
embe
r of p
revi
ous
year
)
Percentage of Change in Index of Inputin Residential Building
20
PRICES
מחירים
-1
0
1
2
3
4
2004
2005
2006
2007
2008
2009
2010
2011
2012
2013
2014
2015
Per
cent
age
of c
hang
e (D
ecem
ber c
ompa
red
to
Dec
embe
r of p
revi
ous
year
)
Percentage of Change in Consumer Price Index
-0.1
0.1
-10
-5
0
5
10
15
Food Fruitsand
vegetables
Housing House-hold
mainte-nance
Furnitureand house-
holdequipment
Clothingand
footwear
Health Education,culture
and enter-tainment
Transportand
commu-nications
Miscel-laneous
Per
cent
age
of c
hang
e (D
ecem
ber
com
pare
d to
Dec
embe
r of p
revi
ous
year
)
Percentage of Change in Consumer Price Index, by Main Items2015
-5
0
5
10
15
20
2004
2005
2006
2007
2008
2009
2010
2011
2012
2013
2014
2015
Per
cent
age
of c
hang
ein
ann
ual a
vera
ge
Percentage of Change in Prices of Dwellings, Compared to Previous Year
0.00
1
2
3
4
5
6
7
2004
2005
2006
2007
2008
2009
2010
2011
2012
2013
2014
2015
Per
cent
age
of c
hang
e (D
ecem
ber c
ompa
red
to
Dec
embe
r of p
revi
ous
year
)
Percentage of Change in Index of Inputin Residential Building
20
מחירים
-1
0
1
2
3
4
2004
2005
2006
2007
2008
2009
2010
2011
2012
2013
2014
2015
Per
cent
age
of c
hang
e (D
ecem
ber c
ompa
red
to
Dec
embe
r of p
revi
ous
year
)
Percentage of Change in Consumer Price Index
-0.1
0.1
-10
-5
0
5
10
15
Food Fruitsand
vegetables
Housing House-hold
mainte-nance
Furnitureand house-
holdequipment
Clothingand
footwear
Health Education,culture
and enter-tainment
Transportand
commu-nications
Miscel-laneous
Per
cent
age
of c
hang
e (D
ecem
ber
com
pare
d to
Dec
embe
r of p
revi
ous
year
)
Percentage of Change in Consumer Price Index, by Main Items2015
-5
0
5
10
15
2020
04
2005
2006
2007
2008
2009
2010
2011
2012
2013
2014
2015
Per
cent
age
of c
hang
ein
ann
ual a
vera
ge
Percentage of Change in Prices of Dwellings, Compared to Previous Year
0.00
1
2
3
4
5
6
7
2004
2005
2006
2007
2008
2009
2010
2011
2012
2013
2014
2015
Per
cent
age
of c
hang
e (D
ecem
ber c
ompa
red
to
Dec
embe
r of p
revi
ous
year
)
Percentage of Change in Index of Inputin Residential Building
20
מחירים
-1
0
1
2
3
4
2004
2005
2006
2007
2008
2009
2010
2011
2012
2013
2014
2015
Perc
enta
ge o
f cha
nge
(Dec
embe
r com
pare
d to
D
ecem
ber o
f pre
viou
s ye
ar)
Percentage of Change in Consumer Price Index
-0.1
0.1
-10
-5
0
5
10
15
Food Fruitsand
vegetables
Housing House-hold
mainte-nance
Furnitureand house-
holdequipment
Clothingand
footwear
Health Education,culture
and enter-tainment
Transportand
commu-nications
Miscel-laneous
Perc
enta
ge o
f cha
nge
(Dec
embe
r co
mpa
red
to D
ecem
ber o
f pre
viou
s ye
ar)
Percentage of Change in Consumer Price Index, by Main Items2015
-5
0
5
10
15
20
2004
2005
2006
2007
2008
2009
2010
2011
2012
2013
2014
2015
Perc
enta
ge o
f cha
nge
in a
nnua
l ave
rage
Percentage of Change in Prices of Dwellings, Compared to Previous Year
0.00
1
2
3
4
5
6
7
2004
2005
2006
2007
2008
2009
2010
2011
2012
2013
2014
2015
Perc
enta
ge o
f cha
nge
(Dec
embe
r com
pare
d to
D
ecem
ber o
f pre
viou
s ye
ar)
Percentage of Change in Index of Inputin Residential Building
20
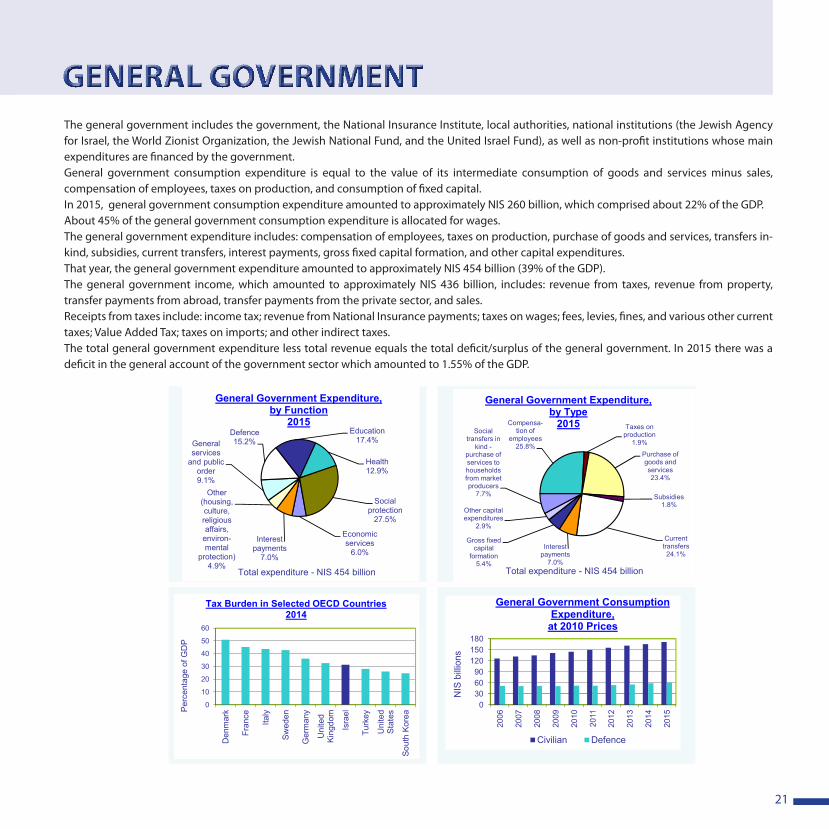
21
The general government includes the government, the National Insurance Institute, local authorities, national institutions (the Jewish Agency for Israel, the World Zionist Organization, the Jewish National Fund, and the United Israel Fund), as well as non-profit institutions whose main expenditures are financed by the government.General government consumption expenditure is equal to the value of its intermediate consumption of goods and services minus sales, compensation of employees, taxes on production, and consumption of fixed capital.In 2015, general government consumption expenditure amounted to approximately NIS 260 billion, which comprised about 22% of the GDP.About 45% of the general government consumption expenditure is allocated for wages. The general government expenditure includes: compensation of employees, taxes on production, purchase of goods and services, transfers in-kind, subsidies, current transfers, interest payments, gross fixed capital formation, and other capital expenditures.That year, the general government expenditure amounted to approximately NIS 454 billion (39% of the GDP). The general government income, which amounted to approximately NIS 436 billion, includes: revenue from taxes, revenue from property, transfer payments from abroad, transfer payments from the private sector, and sales. Receipts from taxes include: income tax; revenue from National Insurance payments; taxes on wages; fees, levies, fines, and various other current taxes; Value Added Tax; taxes on imports; and other indirect taxes.The total general government expenditure less total revenue equals the total deficit/surplus of the general government. In 2015 there was a deficit in the general account of the government sector which amounted to 1.55% of the GDP.
GENERAL GOVERNMENT
מגזר ממשלתי
0306090
120150180
2006
2007
2008
2009
2010
2011
2012
2013
2014
2015
NIS
bill
ions
General Government Consumption Expenditure,
at 2010 Prices
Civilian Defence
Compensa-tion of
employees25.8%
Taxes on production
1.9%
Purchase of goods and services23.4%
Subsidies1.8%
Current transfers24.1%
Interest payments
7.0%
Gross fixed capital
formation5.4%
Other capital expenditures
2.9%
Social transfers in
kind -purchase of services to households from market producers
7.7%
General Government Expenditure,by Type
2015
Total expenditure - NIS 454 billion
0
10
20
30
40
50
60
Den
mar
k
Fran
ce
Italy
Swed
en
Ger
man
y
Uni
ted
King
dom
Isra
el
Turk
ey
Uni
ted
Stat
es
Sout
h Ko
reaP
erce
ntag
e of
GD
P
Tax Burden in Selected OECD Countries2014
Economic services
6.0%
Interest payments
7.0%
Other (housing, culture, religious affairs,
environ-mental
protection)4.9%
General services
and public order9.1%
Defence15.2%
Education17.4%
Health12.9%
Social protection
27.5%
General Government Expenditure,by Function
2015
Total expenditure - NIS 454 billion
21
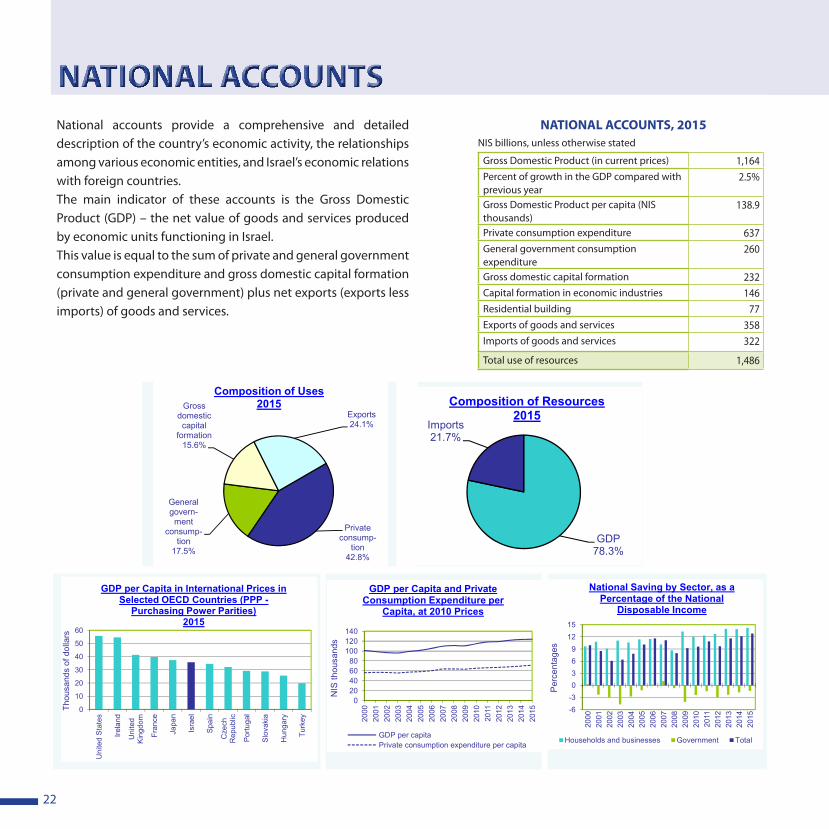
22
National accounts provide a comprehensive and detailed description of the country’s economic activity, the relationships among various economic entities, and Israel’s economic relations with foreign countries.The main indicator of these accounts is the Gross Domestic Product (GDP) – the net value of goods and services produced by economic units functioning in Israel.This value is equal to the sum of private and general government consumption expenditure and gross domestic capital formation (private and general government) plus net exports (exports less imports) of goods and services.
NATIONAL ACCOUNTSNATIONAL ACCOUNTS, 2015
NIS billions, unless otherwise stated
Gross Domestic Product (in current prices) 1,164 Percent of growth in the GDP compared with previous year
2.5%
Gross Domestic Product per capita (NIS thousands)
138.9
Private consumption expenditure 637General government consumption expenditure
260
Gross domestic capital formation 232Capital formation in economic industries 146Residential building 77Exports of goods and services 358Imports of goods and services 322
Total use of resources 1,486
חשבונות לאומיים
GDP78.3%
Imports21.7%
Composition of Resources2015
Private consump-
tion42.8%
General govern-
ment consump-
tion17.5%
Gross domestic capital
formation15.6%
Exports24.1%
Composition of Uses2015
020406080
100120140
2000
2001
2002
2003
2004
2005
2006
2007
2008
2009
2010
2011
2012
2013
2014
2015
NIS
thou
sand
s
GDP per Capita and Private Consumption Expenditure per
Capita, at 2010 Prices
GDP per capitaPrivate consumption expenditure per capita
0
10
20
30
40
50
60
Uni
ted
Sta
tes
Irela
nd
Uni
ted
Kin
gdom
Fran
ce
Japa
n
Isra
el
Spa
in
Cze
chR
epub
lic
Por
tuga
l
Slo
vaki
a
Hun
gary
Turk
ey
Thou
sand
s of
dol
lars
GDP per Capita in International Prices in Selected OECD Countries (PPP -
Purchasing Power Parities)2015
22
חשבונות לאומיים
-6-30369
1215
2000
2001
2002
2003
2004
2005
2006
2007
2008
2009
2010
2011
2012
2013
2014
2015
Per
cent
ages
National Saving by Sector, as a Percentage of the National
Disposable Income
Households and businesses Government Total
22
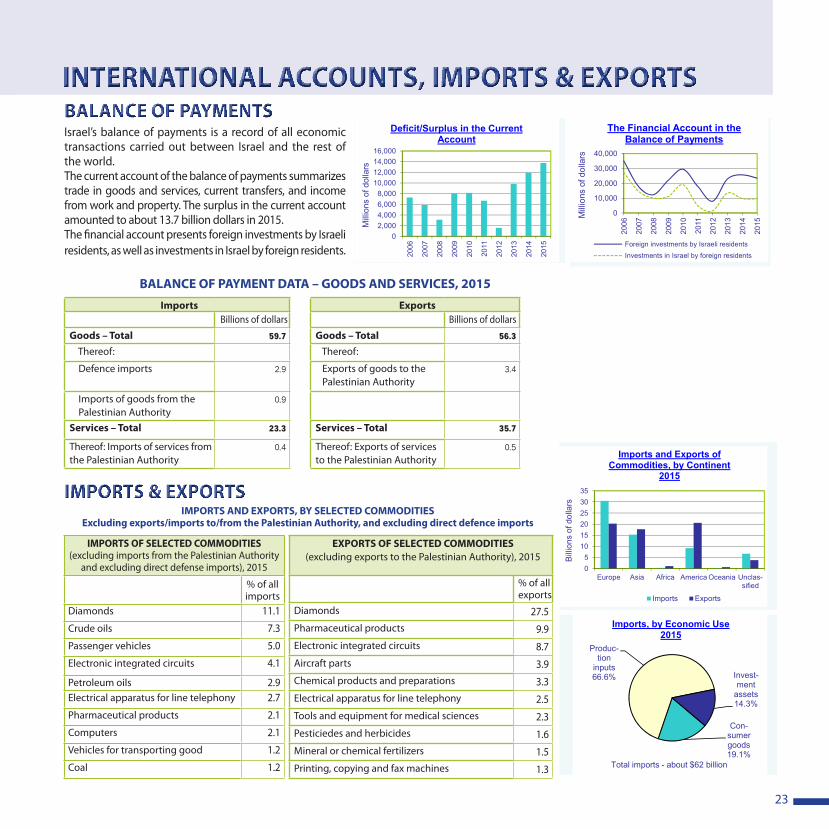
23
Israel’s balance of payments is a record of all economic transactions carried out between Israel and the rest of the world.The current account of the balance of payments summarizes trade in goods and services, current transfers, and income from work and property. The surplus in the current account amounted to about 13.7 billion dollars in 2015. The financial account presents foreign investments by Israeli residents, as well as investments in Israel by foreign residents.
INTERNATIONAL ACCOUNTS, IMPORTS & EXPORTSBALANCE OF PAYMENTS
IMPORTS & EXPORTS
BALANCE OF PAYMENT DATA – GOODS AND SERVICES, 2015
Imports ExportsBillions of dollars Billions of dollars
Goods – Total 59.7 Goods – Total 56.3
Thereof: Thereof:
Defence imports 2.9 Exports of goods to the Palestinian Authority
3.4
Imports of goods from the Palestinian Authority
0.9
Services – Total 23.3 Services – Total 35.7
Thereof: Imports of services from the Palestinian Authority
0.4 Thereof: Exports of services to the Palestinian Authority
0.5
EXPORTS OF SELECTED COMMODITIES (excluding exports to the Palestinian Authority), 2015
% of all exports
Diamonds 27.5Pharmaceutical products 9.9Electronic integrated circuits 8.7Aircraft parts 3.9Chemical products and preparations 3.3Electrical apparatus for line telephony 2.5Tools and equipment for medical sciences 2.3Pesticiedes and herbicides 1.6Mineral or chemical fertilizers 1.5Printing, copying and fax machines 1.3
IMPORTS OF SELECTED COMMODITIES (excluding imports from the Palestinian Authority
and excluding direct defense imports), 2015
% of all imports
Diamonds 11.1
Crude oils 7.3
Passenger vehicles 5.0
Electronic integrated circuits 4.1
Petroleum oils 2.9Electrical apparatus for line telephony 2.7
Pharmaceutical products 2.1
Computers 2.1
Vehicles for transporting good 1.2
Coal 1.2
IMPORTS AND EXPORTS, BY SELECTED COMMODITIESExcluding exports/imports to/from the Palestinian Authority, and excluding direct defence imports
חשבונות בין-לאומיים ויבוא יצוא
05
101520253035
Europe Asia Africa America Oceania Unclas-sified
Bill
ions
of d
olla
rs
Imports and Exports of Commodities, by Continent
2015
Imports Exports
0
10,000
20,000
30,000
40,000
2006
2007
2008
2009
2010
2011
2012
2013
2014
2015
Mill
ions
of d
olla
rs
The Financial Account in the Balance of Payments
Foreign investments by Israeli residentsInvestments in Israel by foreign residents
02,0004,0006,0008,000
10,00012,00014,00016,000
2006
2007
2008
2009
2010
2011
2012
2013
2014
2015
Mill
ions
of d
olla
rs
Deficit/Surplus in the Current Account
Con-sumer goods19.1%
Produc-tion
inputs66.6% Invest-
ment assets14.3%
Imports, by Economic Use2015
Total imports - about $62 billion
23
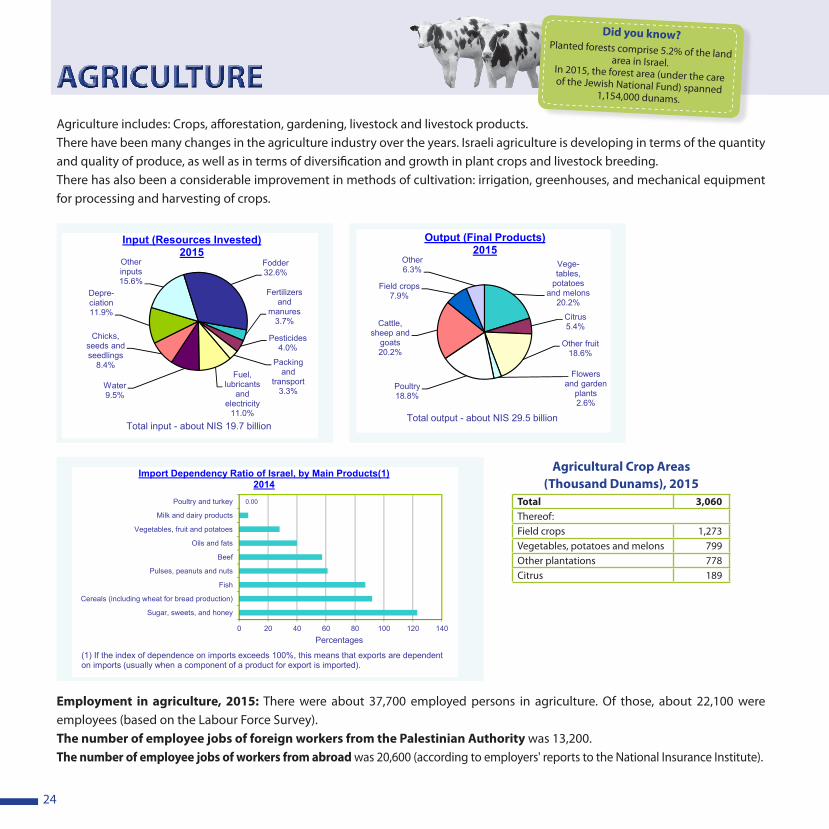
24
Agriculture includes: Crops, afforestation, gardening, livestock and livestock products.There have been many changes in the agriculture industry over the years. Israeli agriculture is developing in terms of the quantity and quality of produce, as well as in terms of diversification and growth in plant crops and livestock breeding.There has also been a considerable improvement in methods of cultivation: irrigation, greenhouses, and mechanical equipment for processing and harvesting of crops.
Employment in agriculture, 2015: There were about 37,700 employed persons in agriculture. Of those, about 22,100 were employees (based on the Labour Force Survey). The number of employee jobs of foreign workers from the Palestinian Authority was 13,200. The number of employee jobs of workers from abroad was 20,600 (according to employers' reports to the National Insurance Institute).
AGRICULTURE
Did you know?Planted forests comprise 5.2% of the land area in Israel. In 2015, the forest area (under the care of the Jewish National Fund) spanned 1,154,000 dunams.
Agricultural Crop Areas (Thousand Dunams), 2015
Total 3,060Thereof:Field crops 1,273Vegetables, potatoes and melons 799Other plantations 778Citrus 189
חקלאות
Vege-tables,
potatoes and melons
20.2%
Citrus5.4%
Other fruit18.6%
Flowers and garden
plants2.6%
Poultry18.8%
Cattle, sheep and
goats20.2%
Field crops7.9%
Other6.3%
Output (Final Products)2015
Total output - about NIS 29.5 billion
Fertilizers and
manures3.7%
Pesticides4.0%
Packing and
transport3.3%
Fuel, lubricants
and electricity
11.0%
Water9.5%
Chicks, seeds and seedlings
8.4%
Depre-ciation11.9%
Other inputs15.6%
Fodder32.6%
Input (Resources Invested)2015
Total input - about NIS 19.7 billion
0.00
0 20 40 60 80 100 120 140
Sugar, sweets, and honey
Cereals (including wheat for bread production)
Fish
Pulses, peanuts and nuts
Beef
Oils and fats
Vegetables, fruit and potatoes
Milk and dairy products
Poultry and turkey
Percentages
Import Dependency Ratio of Israel, by Main Products(1)2014
(1) If the index of dependence on imports exceeds 100%, this means that exports are dependent on imports (usually when a component of a product for export is imported).
24
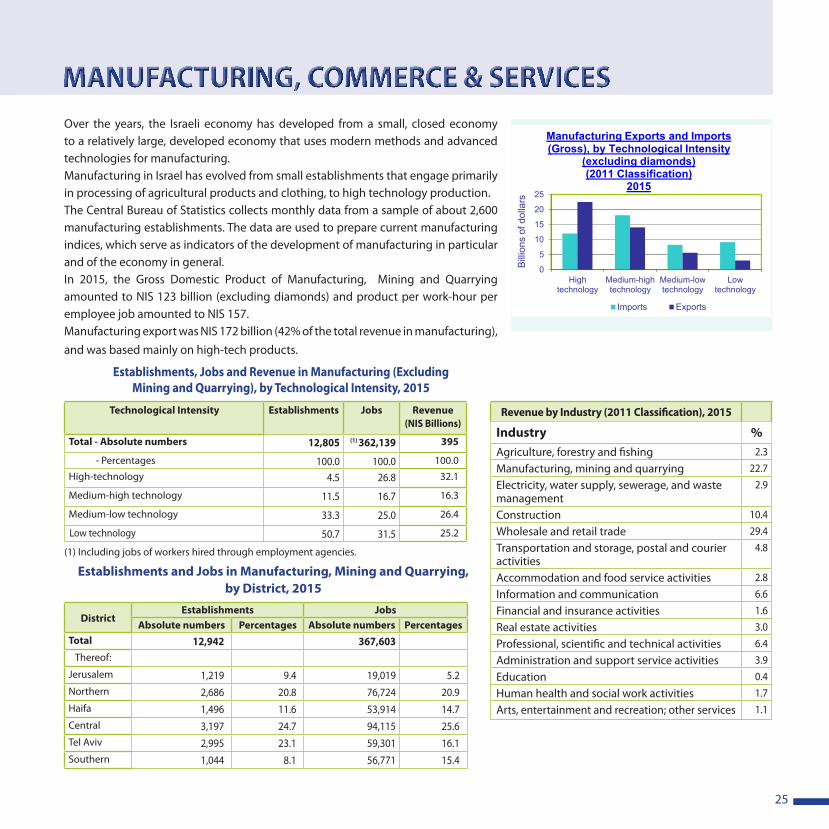
25
Over the years, the Israeli economy has developed from a small, closed economy to a relatively large, developed economy that uses modern methods and advanced technologies for manufacturing.Manufacturing in Israel has evolved from small establishments that engage primarily in processing of agricultural products and clothing, to high technology production.The Central Bureau of Statistics collects monthly data from a sample of about 2,600 manufacturing establishments. The data are used to prepare current manufacturing indices, which serve as indicators of the development of manufacturing in particular and of the economy in general.In 2015, the Gross Domestic Product of Manufacturing, Mining and Quarrying amounted to NIS 123 billion (excluding diamonds) and product per work-hour per employee job amounted to NIS 157.Manufacturing export was NIS 172 billion (42% of the total revenue in manufacturing), and was based mainly on high-tech products.
MANUFACTURING, COMMERCE & SERVICES
Establishments, Jobs and Revenue in Manufacturing (Excluding Mining and Quarrying), by Technological Intensity, 2015
Technological Intensity Establishments Jobs Revenue (NIS Billions)
Total - Absolute numbers 12,805 (1) 362,139 395
- Percentages 100.0 100.0 100.0
High-technology 4.5 26.8 32.1
Medium-high technology 11.5 16.7 16.3
Medium-low technology 33.3 25.0 26.4
Low technology 50.7 31.5 25.2
(1) Including jobs of workers hired through employment agencies.
Establishments and Jobs in Manufacturing, Mining and Quarrying, by District, 2015
DistrictEstablishments Jobs
Absolute numbers Percentages Absolute numbers PercentagesTotal 12,942 367,603 Thereof:
Jerusalem 1,219 9.4 19,019 5.2Northern 2,686 20.8 76,724 20.9Haifa 1,496 11.6 53,914 14.7Central 3,197 24.7 94,115 25.6Tel Aviv 2,995 23.1 59,301 16.1Southern 1,044 8.1 56,771 15.4
Revenue by Industry (2011 Classification), 2015
Industry %Agriculture, forestry and fishing 2.3
Manufacturing, mining and quarrying 22.7
Electricity, water supply, sewerage, and waste management
2.9
Construction 10.4
Wholesale and retail trade 29.4
Transportation and storage, postal and courier activities
4.8
Accommodation and food service activities 2.8
Information and communication 6.6
Financial and insurance activities 1.6
Real estate activities 3.0
Professional, scientific and technical activities 6.4
Administration and support service activities 3.9
Education 0.4
Human health and social work activities 1.7
Arts, entertainment and recreation; other services 1.1
תעשייה, מסחר ושירותים
0
5
10
15
20
25
Hightechnology
Medium-hightechnology
Medium-lowtechnology
Lowtechnology
Bill
ions
of d
olla
rs
Manufacturing Exports and Imports (Gross), by Technological Intensity
(excluding diamonds)(2011 Classification)
2015
Imports Exports
25
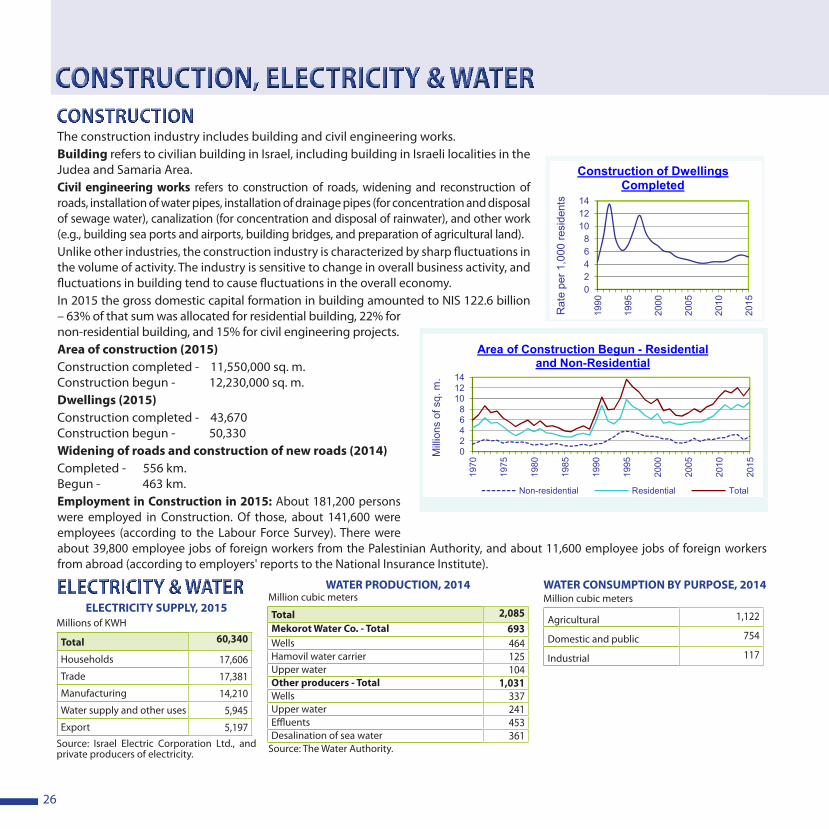
26
The construction industry includes building and civil engineering works. Building refers to civilian building in Israel, including building in Israeli localities in the Judea and Samaria Area.Civil engineering works refers to construction of roads, widening and reconstruction of roads, installation of water pipes, installation of drainage pipes (for concentration and disposal of sewage water), canalization (for concentration and disposal of rainwater), and other work (e.g., building sea ports and airports, building bridges, and preparation of agricultural land). Unlike other industries, the construction industry is characterized by sharp fluctuations in the volume of activity. The industry is sensitive to change in overall business activity, and fluctuations in building tend to cause fluctuations in the overall economy.In 2015 the gross domestic capital formation in building amounted to NIS 122.6 billion – 63% of that sum was allocated for residential building, 22% for non-residential building, and 15% for civil engineering projects.Area of construction (2015)Construction completed - 11,550,000 sq. m.Construction begun - 12,230,000 sq. m.Dwellings (2015)Construction completed - 43,670Construction begun - 50,330 Widening of roads and construction of new roads (2014)Completed - 556 km.Begun - 463 km. Employment in Construction in 2015: About 181,200 persons were employed in Construction. Of those, about 141,600 were employees (according to the Labour Force Survey). There were about 39,800 employee jobs of foreign workers from the Palestinian Authority, and about 11,600 employee jobs of foreign workers from abroad (according to employers' reports to the National Insurance Institute).
CONSTRUCTION, ELECTRICITY & WATERCONSTRUCTION
ELECTRICITY & WATERELECTRICITY SUPPLY, 2015
Millions of KWH
Total 60,340
Households 17,606 Trade 17,381 Manufacturing 14,210 Water supply and other uses 5,945 Export 5,197
Source: Israel Electric Corporation Ltd., and private producers of electricity.
WATER CONSUMPTION BY PURPOSE, 2014Million cubic meters
Agricultural 1,122
Domestic and public 754
Industrial 117
בינוי, חשמל ומים
02468
101214
1990
1995
2000
2005
2010
2015
Rat
e pe
r 1,0
00 re
side
nts
Construction of Dwellings Completed
02468
101214
1970
1975
1980
1985
1990
1995
2000
2005
2010
2015
Mill
ions
of s
q. m
.
Area of Construction Begun - Residentialand Non-Residential
Non-residential Residential Total
26
WATER PRODUCTION, 2014Million cubic meters
Total 2,085Mekorot Water Co. - Total 693Wells 464Hamovil water carrier 125Upper water 104Other producers - Total 1,031Wells 337Upper water 241Effluents 453Desalination of sea water 361
Source: The Water Authority.
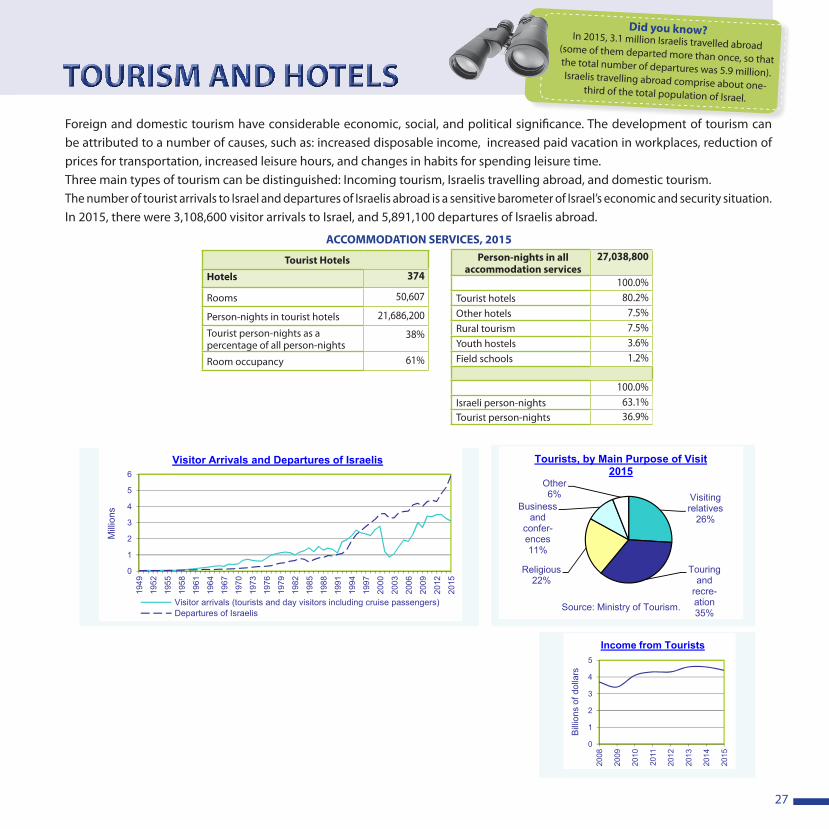
27
Foreign and domestic tourism have considerable economic, social, and political significance. The development of tourism can be attributed to a number of causes, such as: increased disposable income, increased paid vacation in workplaces, reduction of prices for transportation, increased leisure hours, and changes in habits for spending leisure time.Three main types of tourism can be distinguished: Incoming tourism, Israelis travelling abroad, and domestic tourism.The number of tourist arrivals to Israel and departures of Israelis abroad is a sensitive barometer of Israel’s economic and security situation. In 2015, there were 3,108,600 visitor arrivals to Israel, and 5,891,100 departures of Israelis abroad.
TOURISM AND HOTELS
Did you know?In 2015, 3.1 million Israelis travelled abroad (some of them departed more than once, so that the total number of departures was 5.9 million).Israelis travelling abroad comprise about one-third of the total population of Israel.
ACCOMMODATION SERVICES, 2015Person-nights in all
accommodation services 27,038,800
100.0%Tourist hotels 80.2%Other hotels 7.5%Rural tourism 7.5%Youth hostels 3.6%Field schools 1.2%
100.0%Israeli person-nights 63.1%Tourist person-nights 36.9%
Tourist HotelsHotels 374
Rooms 50,607
Person-nights in tourist hotels 21,686,200
Tourist person-nights as a percentage of all person-nights
38%
Room occupancy 61%
תיירות ושירותי הארחה
0
1
2
3
4
5
6
1949
1952
1955
1958
1961
1964
1967
1970
1973
1976
1979
1982
1985
1988
1991
1994
1997
2000
2003
2006
2009
2012
2015
Mill
ions
Visitor Arrivals and Departures of Israelis
Visitor arrivals (tourists and day visitors including cruise passengers)Departures of Israelis
Visiting relatives
26%
Touring and
recre-ation35%
Religious22%
Business and
confer-ences11%
Other6%
Tourists, by Main Purpose of Visit2015
Source: Ministry of Tourism.
0
1
2
3
4
5
2008
2009
2010
2011
2012
2013
2014
2015
Bill
ions
of d
olla
rs
Income from Tourists
27
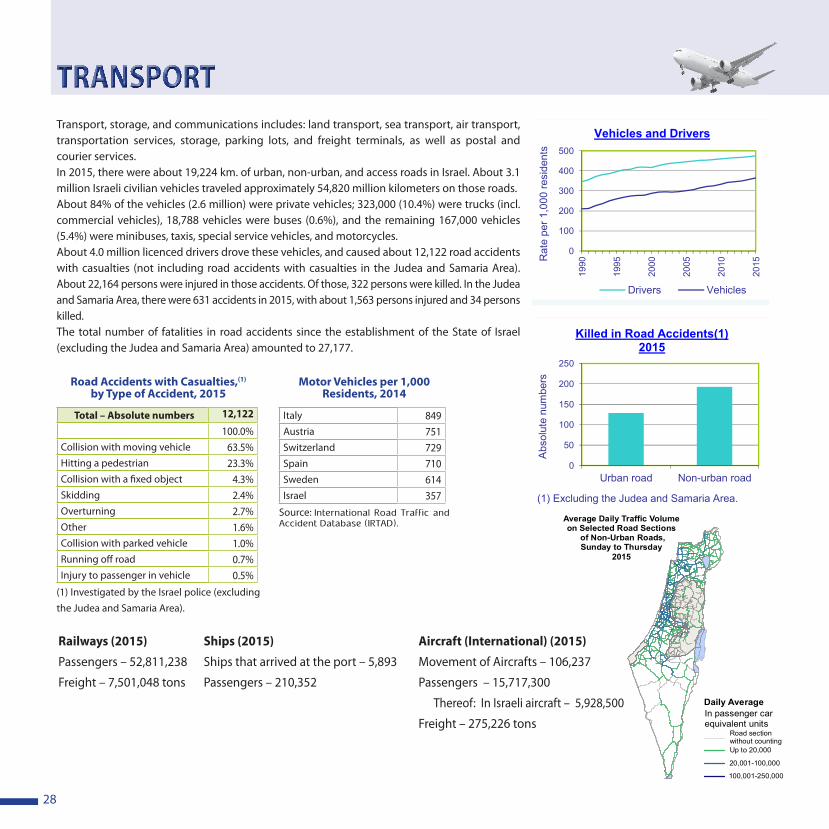
28
Transport, storage, and communications includes: land transport, sea transport, air transport, transportation services, storage, parking lots, and freight terminals, as well as postal and courier services.In 2015, there were about 19,224 km. of urban, non-urban, and access roads in Israel. About 3.1 million Israeli civilian vehicles traveled approximately 54,820 million kilometers on those roads. About 84% of the vehicles (2.6 million) were private vehicles; 323,000 (10.4%) were trucks (incl. commercial vehicles), 18,788 vehicles were buses (0.6%), and the remaining 167,000 vehicles (5.4%) were minibuses, taxis, special service vehicles, and motorcycles.About 4.0 million licenced drivers drove these vehicles, and caused about 12,122 road accidents with casualties (not including road accidents with casualties in the Judea and Samaria Area). About 22,164 persons were injured in those accidents. Of those, 322 persons were killed. In the Judea and Samaria Area, there were 631 accidents in 2015, with about 1,563 persons injured and 34 persons killed.The total number of fatalities in road accidents since the establishment of the State of Israel (excluding the Judea and Samaria Area) amounted to 27,177.
TRANSPORT
Road Accidents with Casualties,(1) by Type of Accident, 2015
Total – Absolute numbers 12,122
100.0%Collision with moving vehicle 63.5%Hitting a pedestrian 23.3%Collision with a fixed object 4.3%Skidding 2.4%Overturning 2.7%Other 1.6%Collision with parked vehicle 1.0%Running off road 0.7%Injury to passenger in vehicle 0.5%
(1) Investigated by the Israel police (excluding the Judea and Samaria Area).
Motor Vehicles per 1,000 Residents, 2014
Italy 849Austria 751Switzerland 729Spain 710Sweden 614Israel 357
Source: International Road Traffic and Accident Database (IRTAD).
Aircraft (International) (2015)Ships (2015)Railways (2015)
Movement of Aircrafts – 106,237Ships that arrived at the port – 5,893Passengers – 52,811,238
Passengers – 15,717,300Passengers – 210,352Freight – 7,501,048 tons
Thereof: In Israeli aircraft – 5,928,500
Freight – 275,226 tons
תחבורה
0
50
100
150
200
250
Urban road Non-urban road
Abs
olut
e nu
mbe
rs
Killed in Road Accidents(1)2015
(1) Excluding the Judea and Samaria Area.
0
100
200
300
400
500
1990
1995
2000
2005
2010
2015R
ate
per 1
,000
resi
dent
s
Vehicles and Drivers
Drivers Vehicles
28
Up to 20,000
Average Daily Traffic Volumeon Selected Road Sections
of Non-Urban Roads,Sunday to Thursday
2015
20,001-100,000
100,001-250,000
Daily AverageIn passenger carequivalent units
Road sectionwithout counting
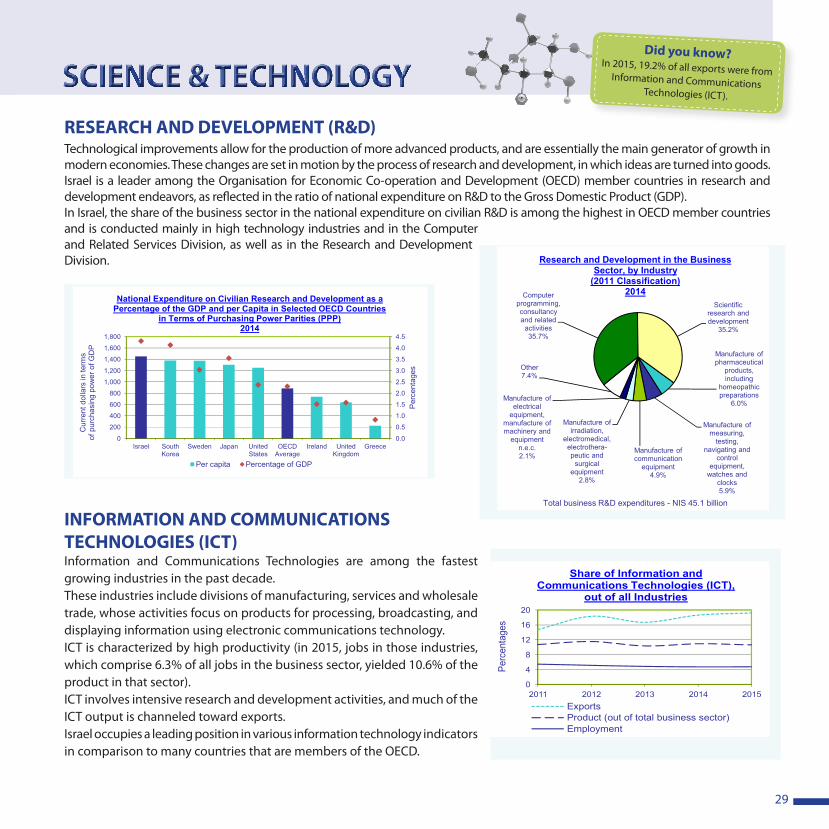
29
RESEARCH AND DEVELOPMENT (R&D)Technological improvements allow for the production of more advanced products, and are essentially the main generator of growth in modern economies. These changes are set in motion by the process of research and development, in which ideas are turned into goods.Israel is a leader among the Organisation for Economic Co-operation and Development (OECD) member countries in research and development endeavors, as reflected in the ratio of national expenditure on R&D to the Gross Domestic Product (GDP). In Israel, the share of the business sector in the national expenditure on civilian R&D is among the highest in OECD member countries and is conducted mainly in high technology industries and in the Computer and Related Services Division, as well as in the Research and Development Division.
INFORMATION AND COMMUNICATIONS TECHNOLOGIES (ICT)Information and Communications Technologies are among the fastest growing industries in the past decade. These industries include divisions of manufacturing, services and wholesale trade, whose activities focus on products for processing, broadcasting, and displaying information using electronic communications technology. ICT is characterized by high productivity (in 2015, jobs in those industries, which comprise 6.3% of all jobs in the business sector, yielded 10.6% of the product in that sector). ICT involves intensive research and development activities, and much of the ICT output is channeled toward exports.Israel occupies a leading position in various information technology indicators in comparison to many countries that are members of the OECD.
SCIENCE & TECHNOLOGYDid you know?
In 2015, 19.2% of all exports were from Information and Communications Technologies (ICT).
מדע וטכנולוגיה
0
4
8
12
16
20
2011 2012 2013 2014 2015
Per
cent
ages
Share of Information and Communications Technologies (ICT),
out of all Industries
ExportsProduct (out of total business sector)Employment
Manufacture of pharmaceutical
products, including
homeopathic preparations
6.0%
Manufacture of measuring,
testing, navigating and
control equipment,
watches and clocks5.9%
Manufacture of communication
equipment4.9%
Manufacture of irradiation,
electromedical, electrothera-peutic and
surgical equipment
2.8%
Manufacture of electrical
equipment, manufacture of machinery and
equipment n.e.c.2.1%
Other7.4%
Computer programming, consultancy and related
activities35.7%
Scientific research and development
35.2%
Research and Development in the Business Sector, by Industry
(2011 Classification)2014
Total business R&D expenditures - NIS 45.1 billion
0.0
0.5
1.0
1.5
2.0
2.5
3.0
3.5
4.0
4.5
0
200
400
600
800
1,000
1,200
1,400
1,600
1,800
Israel SouthKorea
Sweden Japan UnitedStates
OECDAverage
Ireland UnitedKingdom
Greece
Per
cent
ages
Cur
rent
dol
lars
in te
rms
of p
urch
asin
g po
wer
of G
DP
National Expenditure on Civilian Research and Development as a Percentage of the GDP and per Capita in Selected OECD Countries
in Terms of Purchasing Power Parities (PPP)2014
Per capita Percentage of GDP
29
מדע וטכנולוגיה
0
4
8
12
16
20
2011 2012 2013 2014 2015
Perc
enta
ges
Share of Information and Communications Technologies (ICT),
out of all Industries
ExportsProduct (out of total business sector)Employment
Manufacture of pharmaceutical
products, including
homeopathic preparations
6.0%
Manufacture of measuring,
testing, navigating and
control equipment,
watches and clocks5.9%
Manufacture of communication
equipment4.9%
Manufacture of irradiation,
electromedical, electrothera-peutic and
surgical equipment
2.8%
Manufacture of electrical
equipment, manufacture of machinery and
equipment n.e.c.2.1%
Other7.4%
Computer programming, consultancy and related
activities35.7%
Scientific research and development
35.2%
Research and Development in the Business Sector, by Industry
(2011 Classification)2014
Total business R&D expenditures - NIS 45.1 billion
0.0
0.5
1.0
1.5
2.0
2.5
3.0
3.5
4.0
4.5
0
200
400
600
800
1,000
1,200
1,400
1,600
1,800
Israel SouthKorea
Sweden Japan UnitedStates
OECDAverage
Ireland UnitedKingdom
Greece
Perc
enta
ges
Curre
nt d
olla
rs in
term
sof
pur
chas
ing
powe
r of G
DPNational Expenditure on Civilian Research and Development as a
Percentage of the GDP and per Capita in Selected OECD Countries in Terms of Purchasing Power Parities (PPP)
2014
Per capita Percentage of GDP
29
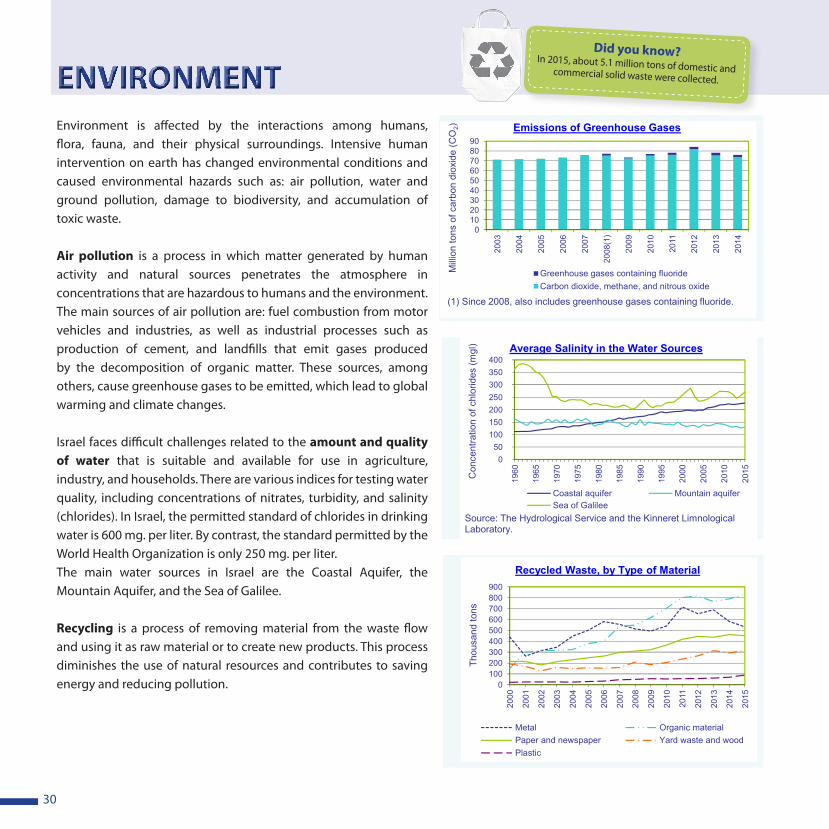
30
Environment is affected by the interactions among humans, flora, fauna, and their physical surroundings. Intensive human intervention on earth has changed environmental conditions and caused environmental hazards such as: air pollution, water and ground pollution, damage to biodiversity, and accumulation of toxic waste.
Air pollution is a process in which matter generated by human activity and natural sources penetrates the atmosphere in concentrations that are hazardous to humans and the environment. The main sources of air pollution are: fuel combustion from motor vehicles and industries, as well as industrial processes such as production of cement, and landfills that emit gases produced by the decomposition of organic matter. These sources, among others, cause greenhouse gases to be emitted, which lead to global warming and climate changes.
Israel faces difficult challenges related to the amount and quality of water that is suitable and available for use in agriculture, industry, and households. There are various indices for testing water quality, including concentrations of nitrates, turbidity, and salinity (chlorides). In Israel, the permitted standard of chlorides in drinking water is 600 mg. per liter. By contrast, the standard permitted by the World Health Organization is only 250 mg. per liter. The main water sources in Israel are the Coastal Aquifer, the Mountain Aquifer, and the Sea of Galilee.
Recycling is a process of removing material from the waste flow and using it as raw material or to create new products. This process diminishes the use of natural resources and contributes to saving energy and reducing pollution.
ENVIRONMENTDid you know?In 2015, about 5.1 million tons of domestic and commercial solid waste were collected.
סביבה
0102030405060708090
2003
2004
2005
2006
2007
)1(20
08 2009
2010
2011
2012
2013
2014
Milli
on to
ns o
f car
bon
diox
ide
(CO
2) Emissions of Greenhouse Gases
Greenhouse gases containing fluorideCarbon dioxide, methane, and nitrous oxide
(1) Since 2008, also includes greenhouse gases containing fluoride.
050
100150200250300350400
1960
1965
1970
1975
1980
1985
1990
1995
2000
2005
2010
2015Con
cent
ratio
n of
chl
orid
es (m
gl) Average Salinity in the Water Sources
Coastal aquifer Mountain aquiferSea of Galilee
Source: The Hydrological Service and the Kinneret Limnological Laboratory.
0100200300400500600700800900
2000
2001
2002
2003
2004
2005
2006
2007
2008
2009
2010
2011
2012
2013
2014
2015
Thou
sand
tons
Recycled Waste, by Type of Material
Metal Organic materialPaper and newspaper Yard waste and woodPlastic
30
Information Units
Jerusalem: 66 Kanfe Nesharim St., Corner Bachi St. P.O.B. 34525, Jerusalem 9134401 Tel.: 02-659-2666, Fax: 02-652-1340
Tel Aviv-Yafo: 86 Menachem Begin Rd. (Bet Leo Goldberg) 3rd Floor P.O.B. 57207, Tel Aviv 6157101 Tel.: 03-568-1933, Fax: 03-568-1946
Library/Research Rooms
The Central Bureau of Statistics library in Jerusalem is open to the public:Sunday–Thursday from 9:00 to 15:00, Tel. 02-659-2555.The research rooms at the CBS offices in Jerusalem, Tel Aviv-Yafo, and Haifa are available to researchers in accordance with the regulations. Visits are by appointment only.
Contact Information for Persons in CBS Survey Samples
E-mail: [email protected]
Telephone: 1-800-232-233 from 8:00 to 16:00
1-800-210-290 from 8:00 to 21:00 (in the Jerusalem area)
CBS website: www.cbs.gov.il
E-mail: [email protected]
Editing: Keren Yaffe
With the participation of (in alphabetical order):Roi Abudi, Michal Abouganem, Miri Alon, Yosef Andreas, Dvorit Angel-Ze'evi, Yonatan Bar-On, Boaz Ben Aharon, Miri Ben Tulila, Dudi Ben-Naim, Tuly Berlyanchik, Galina Braverman, Nava Brenner, Helen Brusilovsky, Revital Cohen, Nurit Dobrin, Lior Dopaz, Michal Eliav, Carole Feldmann, Batsheva Fishman, Gilat Galimidi, Tania Glaz, Vered Granit, Tova Humphris, Tilda Khait, Evyatar Kirchberg, Tehila Klein, Gershon Kun, Shlomo Nahir, Yael Nuriel, Liat Rachavi-Italiano, Naama Rotem, Chani Shamir, Marina Sheppes, Roman Zilberschlag, Orit Yalon-Shuqrun, Dr. Moshe Yanai, Gil Yasur, Galia Yohay, Nava Ziv-Shaul.
Members of the Statistical Abstract Steering Committee:
Arie Aharon, Yosef Gidanian, Dalit Goldfus, Mirit Hochman-Cohen, Mark Feldman, Dr. Ahmad Hleihel, Avigail Levi, Sigalit Mazeh, Esther Negari, Ari Paltiel, Sari Paz, Eran Ropalidis, Oz Shimony, Tali Tal, Keren Yaffe, Amit Yagur-Kroll.
Translation: Miriam Schneiderman
Diagrams: Emanuel Blanco
Maps: Oren Raz
Graphic Design: Shahar-Shoshana Studio, Scorpio 88 Group
January 2017
OBTAINING STATISTICAL INFORMATION AND PURCHASING PUBLICATIONS
Statistical information, publications, and tailor-made statistical analyses can be obtained by phone, fax or e-mail from the Statistical Information Center (Information Units), Sunday–Thursday from 9:00 to 16:00.The offices are open to the public from 9:00 to 13:00.